lifecycle analysis of chinese food take-out containers ... · there are 36,000 chinese restaurants...
TRANSCRIPT

Lifecycle Analysis of Chinese Food Take-Out Containers
Engs 171 Industrial Ecology
May 24, 2007
Sandy Beauregard
Richard Bi
Hillary Price
Mike Zargham

1
Background
There are 36,000 Chinese restaurants in the U.S.1 Four main types of containers:
paperboard, plastic soup, plastic entrée, and plastic / aluminum entrée, are used to
transport food to customers’ homes. Each year approximately 936 million paperboard
containers, 187 million soup containers, 374 million plastic entrée containers, and 374
million plastic / aluminum entrée containers are used.2 These numbers correlate to
paperboard containers making up 50% of the market, soup containers comprising 10% of
the market, and plastic and plastic / aluminum containers each making up 20% of the
market.
Methodology
A cradle to grave analysis was performed for each of the four container types.
The analysis included the amount of resources consumed for each container’s production,
production impacts, global warming potential, energy consumption, transportation
impacts, and disposal impacts. Production impacts included air emissions (not including
greenhouse gases), water pollution, and solid waste production. Global warming
potential consisted of the CO2 equivalent of the amount of greenhouse gases produced
during each container’s entire lifecycle. Energy consumption included the energy needed
to extract raw materials and produce each container, since no energy is required to use the
container. Transportation impacts were added to global warming potential. For disposal
it was assumed each container was recycled at a rate of 10%3, and the remaining 90%
was landfilled.
Aluminum / Polystyrene Analysis
The bottom of this container is made of aluminum and weighs 14.19 grams. The
polystyrene lid weighs 7.03 grams. The total container weight is 21.22 grams, and it
holds 32 ounces. The aluminum lifecycle consists of bauxite mining, alumina
1 Luo, Michael 2 Numbers extrapolated from data provided by Martin Wai, a Chinese restaurant owner. Numbers may be low estimates due to the restaurant’s location in rural Maine. 3 Each material is recycled at an average rate of 10-20%. It was assumed these materials are recycled at a rate lower than average due to the nature of their use; people are less likely to clean out dirty containers if they have food left in them.

2
production, anode production, aluminum smelting, aluminum ingot casting, distribution
to Chinese restaurants, consumer use, and disposal (either recycling or land-filling). The
polystyrene lifecycle consists of crude oil extraction and production then petroleum
refining, as well as natural gas production and processing. After petroleum refining and
natural gas processing, material processing occurs, followed by polystyrene resin
manufacturing, distribution to Chinese restaurants, consumer use, and disposal (either
recycling or land-filling). See tables 1-4 below for details of the aluminum / polystyrene
container impact analysis.
Table 1: Aluminum Impact Summary Air emissions lb/1000lb Water Pollution lb/1000lb
Carbon monoxide 67.8 Acid 0.12 Chlorine 1.76E-02 Ammonium (NH4+) 0.001 COS 1.12E+00 BOD 0.057
Fluorides 1.92E-02 Calcium ion 0.011 HCN 3.68E-02 Chlorine ion 0.031 Hydrogen fluoride (HF) 6.45E-01 COD 0.46
Lead 9.37E-06 Cyanide (CN-) 2.10E-04 Mercury 4.00E-05 Detergents 6.10E-04 Metals 1.45E-05 Dissolved chlorine 2.10E-01
Nonmethane hydrocarbons 1.11E+00 Dissolved organics 1.40E-02 Organics 1.11E-02 Dissolved solids 2.80E-01 PAH 1.51E-01 Fluorides 6.10E-02 Particulate matter (unspecified) 1.75E+01 Hydrocarbons 1.40E-05 PFC 3.82E-01 Iron 3.30E-03
Sulfur oxides (SOx) 1.85E+01 Lead 7.80E-06
SUM 107.2927639 Magnesium ion (Mg++) 2.10E-03
SUM (kg/kg) 0.107292764 Mercury 1.60E-06
Metals 1.50E-01
Nitrate (NO3) 9.60E-04
Solid Waste lb/1000lb Oil & Grease 3.90E-02
Solid waste 2885 Other Nitrogen 1.30E-05 SUM (kg/kg) 2.885 Phenol 1.80E-04
Phosphates 1.10E-05
Sodium ion (Na+) 3.79E+00
Sulfate (SO4-) 1.00E-02
Sulfur 5.70E-04
Suspended solids 4.00E-01
SUM 5.6419774
SUM (kg/kg) 0.005641977
Global Warming lb/1000lb kg/kg CO2 Equivalent

3
Carbon dioxide 1.70E+03 1.698 1.698 CFC/HCFC 1.21E-01 0.000121 0.8591
Methane 6.22E-02 0.0000622 0.0006842 Nitrogen Dioxide (N2O) 1.96E-03 0.00000196 0.0005292
SUM (CO2 eq) 2.5583134
Resources kg/kg Bauxite-rich soil 5274 lb/1000lb 5.274 Caustic soda 143 lb/1000lb 0.143 Lime 88.2 lb/1000lb 0.0882 Crude oil 507 lb/1000lb 0.507
Coal 16.6 lb/1000lb 0.0166 Coke 0.0026 lb/1000lb 0.0000026 Distillate Oil 10.04 kg/1000lb 0.022134039
Gasoline 0.545 kg/1000lb 0.001201499 Natural Gas 195 kg/1000lb 0.42989418 Propane/LPG 1.569 kg/1000lb 0.003458995
Residual Oil 90.28 kg/1000lb 0.199029982
2.994313106 SUM (kg/kg) 6.684521295
Energy kWh/1000lb kJ/kg Electricity (bauxite production) 0.83 6587.301587 Electricity (alumina production) 95.5 757936.5079 Electricity (anode production) 53.9 427777.7778 Electricity (aluminum smelting) 6992 55492063.49
Electricity (ingot formation) 95.8 760317.4603
SUM (kJ/kg) 57444.682 Table 2: Polystyrene Impact Summary Air Emissions lb/1000lb lb/1000lb
1,3 Butadiene 1.05014E-06 Fluorides 6.41412E-06
2,4-Dinitrotoluene 1.02427E-11 Furans (unspecified) 3.42652E-10
2-Chloroacetophenone 2.56067E-10 HCFC/HFCs 0.001000555
5-methyl Chrysene 1.6552E-09 HCl 0.095389114
Acenaphthene 3.83705E-08 Hexane 2.45092E-09
Acenaphthylene 1.88091E-08 HF 0.011283902
Acetophenone 5.48714E-10 Hydrocarbons (unspecified) 1.777499142
acrolein 4.42215E-05 Hydrogen 0.000846845
Aldehydes (Acetaldehyde) 3.57361E-05 Indeno(1,2,3-cd)pyrene 4.58942E-09
Aldehydes (Formaldehyde) 0.001362412 Isophorone 2.12169E-08
Aldehydes (Propionaldehyde) 1.39008E-08 Kerosene 0.000104177
Aldehydes (unspecified) 0.004219544 Lead 4.8447E-05
Ammonia 0.016642782 Magnesium 0.0008276
Ammonia Chloride 5.79961E-05 Manganese 6.82373E-05
Anthracene 1.57996E-08 Mercaptan 7.43276E-06
Antimony 1.38977E-06 Mercury 1.02187E-05

4
Arsenic 4.20871E-05 Metals (unspecified) 0.000192278
Benzene 0.05075409 Methyl Bromide 5.85295E-09
Benzo(a)anthracene 6.01891E-09 Methyl Chloride 1.93879E-08
Benzo(a)pyrene 2.85898E-09 Methyl Ethyl Ketone 0.000260014
Benzo(b,j,k)fluroanthene 8.276E-09 Methyl Hydrazine 6.21876E-09
Benzo(g,h,i) perylene 2.03138E-09 Methyl Methacrylate 7.31619E-10
Benzyl Chloride 2.56067E-08 Methyle Tert Butyl Ether (MTBE) 1.28033E-09
Beryllium 2.20954E-06 Methylene Chloride 5.82892E-05
Biphenyl 1.27902E-07 Naphthalene 1.49343E-05 Bis(2-ethylhexyl) Phthalate (DEHP) 2.67041E-09 Naphthanlene 9.78073E-07
Bromoform 1.42666E-09 Nickel 0.000590052
Cadmium 1.88866E-05 Organics (unspecified) 0.029563614
Carbon Disulfide 4.75552E-09 Other Organics 0.01055475
Carbon Monoxide 12.36501671 Particulates (PM10) 0.199375384
Carbon Tetrachloride 2.03454E-07 Particulates (PM2.5) 0.008141081
Carbon Tetrachloride 8.31563E-09 Particulates (unspecified) 0.494803786
Chlorobenzene 8.04781E-10 Perchloroethylene 3.75133E-06
Chloroform 2.15828E-09 Phenanthrene 2.03138E-07
Chorine 0.000137248 Phenols 2.74125E-05
Chromium 4.08813E-05 Polyaromatic Hydrocarbons (total) 6.20098E-06
Chromium (VI) 5.94367E-06 Propylene 6.95192E-05
Chrysene 7.52364E-09 Pyrene 2.4828E-08
Cobalt 4.73313E-05 Radionuclides (unspecified) 0.005876995
Copper 6.25795E-07 Selenium 0.000104057
Cumene 1.93879E-10 Styrene 9.14524E-10
Cyanide 9.14524E-08 Sulfur Dioxide 14.97118097
Dimethyl Sulfate 1.75589E-09 Sulfur Oxides 14.85758707
Dioxins (unspecified) 7.66858E-09 TNMOC (unspecified) 0.008153988
Ethyl Chloride 1.5364E-09 Toluene 0.078105181
Ethylbenzene 0.006045341 Trichloroethane 7.75405E-08
Ethylene Dibromide 4.38971E-11 Vinyl Acetate 2.78015E-10
Ethylene Dichloride 1.46324E-09 VOC(unspecified) 0.974225954
Fluoranthene 5.34178E-08 Xylenes 0.045568623
Fluorene 6.84651E-08 Zinc 4.17197E-07
SUM 46.01603496
SUM (kg/kg) 0.046016035 Water Pollution lb/1000lb lb/1000lb
1-methylfluorene 8.44513E-07 Lithium 4.845041894
2,4 dimethylphenol 0.000207851 Magnesium 4.661616452
2-Hexanone 4.84518E-05 Manganese 0.008498884
2-methyl naphthalene 0.000117546 Mercury 3.76051E-06
4-methyl 2-pentanone 3.11852E-05 Metal (unspecified) 35.9350009
Acetone 7.42044E-05 Methyl Ethyl Ketone (MEK) 5.97338E-07
Acid (benzoic) 0.007527587 Molybdenum 0.000170581

5
Acid (hexanoic) 0.001558885 Naphthalene 0.00013494
Acid (unspecified) 0.002835002 n-Decane 0.000138239
Alkylated Benzenes 0.000187377 n-Docosane 5.07479E-06
Alkylated Fluorenes 1.08592E-05 n-Dodecane 0.000262288
Alkylated Naphthalenes 3.07053E-06 n-Eicosane 7.2215E-05 Alkylated Phenanthrenes 1.27315E-06 n-Hexacosane 3.16598E-06
Aluminum 0.34445657 n-Hexadecane 0.000286287
Ammonia 0.117031117 Nickel 0.001599361
Ammonium 4.65071E-05 Nitrates 0.000115777
Antimony 0.000213744 Nitrogen (ammonia) 4.05111E-05
Arsenic 0.001803418 n-Octadecane 7.07275E-05
Barium 4.856381768 n-Tetradecane 0.000114951
Benzene 0.012454703 Oil 0.163765135
Beryllium 9.03415E-05 Organic Carbon 0.012031945
BOD 1.632438037 Pentamethyl benzene 0.000138439
Boron 0.023289607 Phenanthrene 5.47493E-06
Bromide 1.590083113 Phenol/Phenolic Compounds 0.003554915
Cadmium 0.000264727 Phosphates 0.001
Calcium 23.84574999 Radionuclides (unspecified) 8.23549E-08
Chlorides (methyl chloride) 2.98669E-07 Selenium 5.79125E-05
Chlorides (unspecified) 268.0391992 Silver 0.015564147
Chromium (hexavalent) 2.58661E-05 Sodium 75.5889916
Chromium (unspecified) 0.009709506 Strontium 0.404532817
Cobalt 0.000164399 Styrene 0.000999055
COD 2.781400733 Sulfates 0.619036269
Copper 0.001488079 Sulfides 0.000932278
Cresols 0.000439679 Sulfur 0.019660016
Cyanide 1.53554E-06 Surfactants 0.006918851
Cymene 7.41523E-07 Suspended Solids 10.90586198
Dibenzofuran 1.41095E-06 Thallium 4.50732E-05
Dibenzothiophene 1.14318E-06 Tin 0.001150875
Dissolved Solids 331.6893876 Titanium 0.003283541
Ethylbenzene 0.001702432 Toluene 0.01179281
Fluorine/Fluorides 0.00075897 Total Alkalinity 0.592394577
Hardness 73.4501478 Total Biphenyls 1.21323E-05
Hydrocarbons 0.000538969 Total Dibenzo-thiophenes 3.74455E-08
Hydrocarbons 0.00001 Vanadium 0.0002015
Iron 0.781583491 Xylenes 0.006300044
Lead 0.003156547 Yttrium 5.00071E-05
Lead 210 4.92759E-13 Zinc 0.008274519
SUM 843.0163588 SUM (kg/kg) 0.843016359
Global Warming lb/1000lb kg/kg CO2 Equivalent
CO2 (fossil) 2343.323611 2.343323611 2.343323611

6
CO2 (non-fossil) 0.876645645 0.000876646 0.000876646
Methane 17.9983887 0.017998389 0.197982276
Nitrogen Oxides 5.653254631 0.005653255 1.52637875
Nitrous Oxide 0.038776605 3.87766E-05 0.010469683
CFC12 9.45E-08 9.45375E-11 6.71216E-07
SUM (C02 eq) 4.079031637
Resources Btu/1000lb kJ/kg kg/kg
Natural gas 21683124.52 50474.45145 1.173824452
Petroleum 15611386.8 36340.5276 0.845128549
SUM (kg/kg) 2.018953001
Energy kJ/kg
TOTAL 114000
Solid Waste lb/1000lb
Solid wastes, landfilled 104.4248776
Solid wastes, burned 3.340186103
Solid wastes, waste-to-energy 1.548042474
SUM 109.3131062
SUM (kg/kg) 0.109313106
Table 3: Transportation Impact Summary for Entire Container
diesel truck lb/1000gal kg/kg CO2 Equivalent
CO2 24485 0.036511684 0.036511684
methane 0.395 5.89018E-07 6.4792E-06 Nox 163.611 0.000243974 0.065873087 SUM (CO2 eq) 0.10239125
Table 4: Aluminum / Polystyrene Container Impact Summary
Resource Use
(kg/kg)
Air Emissions
(kg/kg)
Water Pollution (kg/kg)
Global Warming Potential
(kgCO2/kg)
Energy Use (kJ/kg)
Solid Waste (kg/kg)
Landfill (kg/kg)
Polystyrene 2.019 0.046 0.843 4.079 114000 0.109 0.900 Aluminum 6.684 0.107 0.006 2.558 57444.682 2.885 0.900 TOTAL 33% PS 67% AL
5.144
0.087
0.282
3.162
76107.937
1.969
0.900
7
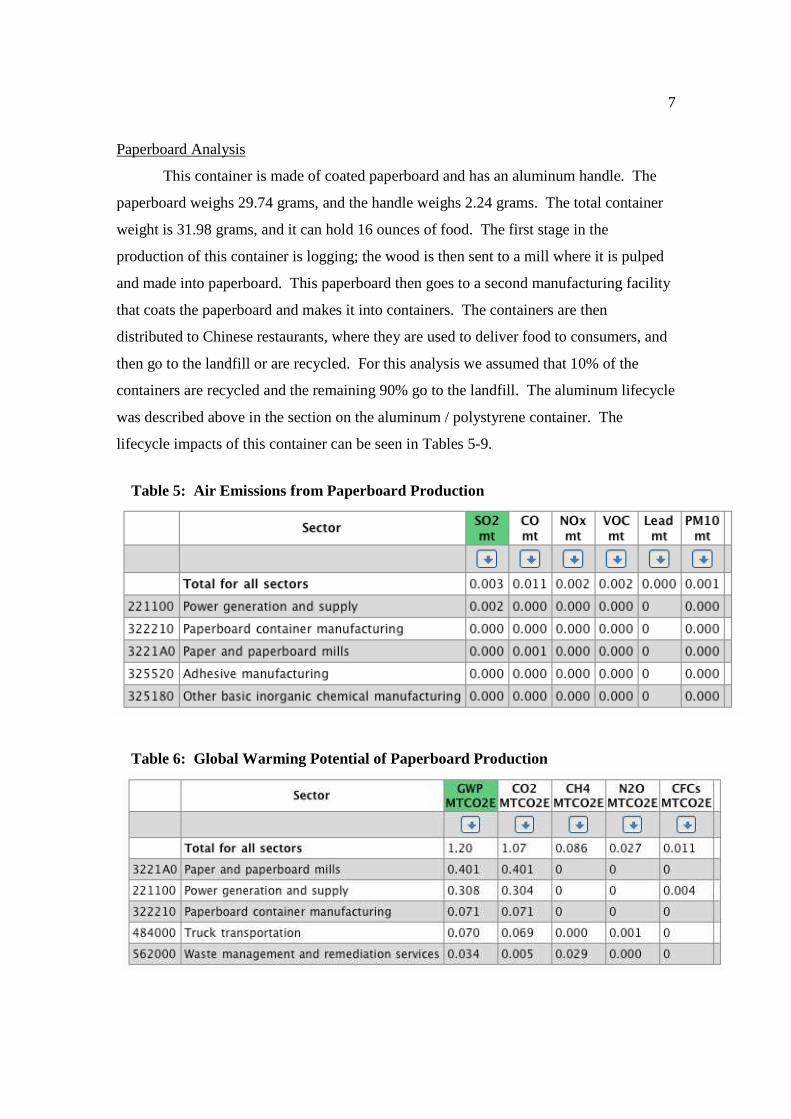
Table 5: Air Emissions from Paperboard Production
Table 6: Global Warming Potential of Paperboard Production
Paperboard Analysis
This container is made of coated paperboard and has an aluminum handle. The
paperboard weighs 29.74 grams, and the handle weighs 2.24 grams. The total container
weight is 31.98 grams, and it can hold 16 ounces of food. The first stage in the
production of this container is logging; the wood is then sent to a mill where it is pulped
and made into paperboard. This paperboard then goes to a second manufacturing facility
that coats the paperboard and makes it into containers. The containers are then
distributed to Chinese restaurants, where they are used to deliver food to consumers, and
then go to the landfill or are recycled. For this analysis we assumed that 10% of the
containers are recycled and the remaining 90% go to the landfill. The aluminum lifecycle
was described above in the section on the aluminum / polystyrene container. The
lifecycle impacts of this container can be seen in Tables 5-9.

8
Table 7: Energy Consumption from Paperboard Production
Table 8: Toxic Releases During the Paperboard Lifecycle
Table 9: Paperboard Container Impact
Resource Use
(kg/kg)
Air Emissions
(kg/kg)
Water Pollution (kg/kg)
Global Warming Potential
(kgCO2/kg)
Energy Use
(kJ/kg)
Solid Waste (kg/kg)
Landfill (kg/kg)
Paperboard 1.720 0.039 0.00018 2.664 35508.210 - 0.900 Aluminum 6.684 0.107 0.006 2.558 57444.682 2.885 .900
TOTAL 93% Paper
7% Al 2.070 0.044 5.9 x 10⁻⁴ 2.661* 37043.570 0.202 0.900
Plastic Containers Analyses
Two different plastic containers were analyzed for this project. The first is a
cylindrical-shaped 32-ounce container, typically used by Chinese take-out restaurants to

9
carry soup. This container is made of two types of plastics: the lid is made of low-density
polyethylene, whereas the body is made of polypropylene. The container weights 50.86
grams, with the lid and body accounting for 9.76 grams and 41.10 grams, respectively.
The other plastic container is a rectangular-shaped, 32-ounce container, used
primarily for larger items such as entrees. Both the lid and the body of this container are
made of polypropylene, weighing 48.23 grams total. The lifecycles of these two types of
plastics and similar to the process described previously for polystyrene. Below are
analyses of the two plastic materials, as well as the environmental impact of the two
containers.
Table 10: Low-Density Polyethylene Impact Summary Air emissions lb/1000lb Water Pollution lb/1000lb Aldehydes (Formaldehyde) 1.08E-03 Acid (benzoic) 7.05E-03
Aldehydes (unspecified) 1.18E-03 Acid (hexanoic) 1.46E-03
Ammonia 6.30E-03 Acid (unspecified) 2.24E-03
Benzene 4.01E-02 Aluminum 2.07E-01
Carbon Monoxide 5.08E+00 Ammonia 9.79E-02
Ethylbenzene 4.79E-03 Arsenic 1.60E-03
HCl 6.74E-02 Barium 3.02E+00
HF 8.23E-03 Benzene 1.17E-02 Hydrocarbons (unspecified) 1.53E+00 BOD 1.22E+00
Hydrogen 1.11E-03 Boron 2.18E-02
Nitrous Oxide 2.96E-02 Bromide 1.49E+00
Organics (unspecified) 1.18E-02 Calcium 2.23E+01
Other Organics 5.10E-02 Chlorides (unspecified) 2.51E+02
Particulates (PM10) 1.75E-01 Chromium (unspecified) 5.77E-03
Particulates (PM2.5) 6.51E-03 COD 2.15E+00
Particulates (unspecified) 3.07E-01 Copper 1.15E-03 Radionuclides (unspecified) 4.28E-03 Dissolved Solids 3.10E+02
Sulfur Dioxide 1.17E+01 Hardness 6.88E+01
Sulfur Oxides 2.31E+01 Iron 5.37E-01
TNMOC (unspecified) 5.94E-03 Lead 2.51E-03
Toluene 6.18E-02 Lithium 6.28E+00
VOC(unspecified) 1.11E+00 Magnesium 4.37E+00
Xylenes 3.60E-02 Manganese 7.78E-03
SUM 4.33E+01 Metal (unspecified) 2.84E+01
SUM (kg/kg) 4.33E-02 Nickel 1.33E-03
Oil 1.39E-01
Organic Carbon 1.03E-02
Solid Waste lb/1000lb Phenol/Phenolic Compounds 3.28E-03
Solid waste 84.131 Silver 1.46E-02
SUM (kg/kg) 0.084 Sodium 7.08E+01

10
Strontium 3.79E-01
Sulfates 5.66E-01
Resources kg/kg Sulfur 1.84E-02
Natural gas 1.535 Surfactants 6.75E-03
Petroleum 0.289 Suspended Solids 6.77E+00
SUM (kg/kg) 1.824 Titanium 1.96E-03
Toluene 1.11E-02
Total Alkalinity 5.58E-01
Energy kJ/kg Xylenes 5.91E-03
Used in production 74300 Zinc 5.19E-03
SUM 7.79E+02
SUM (kg/kg) 7.79E-01
Global Warming lb/1000lb kg/kg CO2 Equivalent
Carbon dioxide 1.44E+03 1.44E+00 1.44E+00
CFC/HCFC 1.00E-03 1.00E-06 7.11E-03
Methane 2.03E+01 2.03E-02 2.23E-01
Nitrogen Oxide 2.58E+00 2.58E-03 6.96E-01
SUM (CO2 eq) 2.369888477
Table 11: Polypropylene Impact Summary Air emissions lb/1000lb Water Pollution lb/1000lb
Aldehydes (unspecified) 1.47E-03 Acid (benzoic) 6.24E-03
Ammonia 8.26E-03 Acid (hexanoic) 1.29E-03
Benzene 2.26E-02 Acid (unspecified) 1.26E-03
Carbon Monoxide 6.13E+00 Aluminum 2.16E-01
Ethylbenzene 2.69E-03 Ammonia 8.82E-02
HCl 6.71E-02 Arsenic 1.44E-03
HF 8.14E-03 Barium 3.11E+00 Hydrocarbons (unspecified) 9.97E-01 Benzene 1.03E-02
Hydrogen 1.58E-03 BOD 1.07E+00
Nitrogen Oxides 2.54E+00 Boron 1.93E-02
Nitrous Oxide 2.43E-02 Bromide 1.32E+00
Organics (unspecified) 0.015399012 Calcium 1.98E+01
Other Organics 1.10E-02 Chlorides (unspecified) 2.22E+02
Particulates (PM10) 8.98E-02 Chromium (unspecified) 6.06E-03
Particulates (unspecified) 3.11E-01 COD 1.84E+00 Radionuclides (unspecified) 4.23E-03 Copper 1.09E-03
Sulfur Dioxide 7.26E+00 Dissolved Solids 2.74E+02
Sulfur Oxides 2.14E+01 Hardness 6.09E+01
TNMOC (unspecified) 5.88E-03 Iron 5.32E-01
Toluene 3.47E-02 Lead 2.35E-03
VOC(unspecified) 8.99E-01 Lithium 5.05E+00
Xylenes 2.02E-02 Magnesium 3.86E+00
SUM 3.99E+01 Manganese 6.95E-03
SUM (kg/kg) 3.99E-02 Metal (unspecified) 1.60E+01

11
Nickel 1.22E-03
Oil 1.24E-01
Organic Carbon 5.30E-03
Phenol/Phenolic Compounds 2.94E-03
Silver 1.29E-02
Solid Waste lb/1000lb Sodium 6.27E+01
Solid waste 83.700 Strontium 3.35E-01
SUM (kg/kg) 0.084 Sulfates 5.06E-01
Sulfur 1.63E-02
Surfactants 5.89E-03
Resources kg/kg Suspended Solids 7.00E+00
Natural gas 1.212 Titanium 2.06E-03
Petroleum 0.374 Toluene 9.85E-03
SUM (kg/kg) 1.586 Total Alkalinity 4.93E-01
Xylenes 5.23E-03
Zinc 5.33E-03
Energy kJ/kg SUM 7.65E+02
Used in production 98000 SUM (kg/kg) 7.65E-01
Global Warming lb/1000lb kg/kg CO2
Equivalent
Carbon dioxide 9.91E+02 9.91E-01 9.91E-01
CFC/HCFC 4.69E-08 4.69E-11 4.69E-08
Methane 1.70E+01 1.70E-02 1.87E-01
Nitrogen Oxide 2.43E-02 2.43E-05 2.43E-02
SUM (CO2 eq) 1.202
Table 12: Plastic Containers Impact Summary Resource
Use (kg/kg)
Air Emissions
(kg/kg)
Water Pollution (kg/kg)
Global Warming Potential
(kgCO2/kg)
Energy Use
(kJ/kg)
Solid Waste (kg/kg)
Landfill (kg/kg)
PP 1.5856 0.0399 0.7649 1.2022 98000 0.0837 0.9 LDPE 1.8242 0.0458 0.7793 2.3699 74300 0.0841 0.9 Soup
Container (80.8% PP,
19.2% LDPE)
1.6314 0.0410 0.7676 1.5288 93450 0.0838 0.9
Entrée Container (100% PP)
1.5856 0.0399 0.7649 1.3046 98000 0.0837 0.9

12
Total Impact Summary
The following table compares the impact per container of each container type.
The paperboard with an aluminum handle container has the lowest impact in four of the
seven analyzed categories.
Table 13: Impact per Container Resource
Use (kg)
Air Emissions
(kg)
Water Pollution
(kg)
Global Warming Potential (kgCO2)
Energy Use (kJ)
Solid Waste (kg)
Landfill (kg)
Polystyrene/ Aluminum
0.109 0.002 0.006 0.067 1615.010 0.042 0.019
Paperboard/ Aluminum
0.066 0.001 1.8x10⁻⁵ 0.085 1185.390 0.006 0.029
Plastic Entrée
0.076
0.002 0.037 0.063 4276.540 0.004 0.043
Plastic Soup
0.083 0.002 0.039 0.078 4752.968 0.004 0.045
When looking at each container’s impact across the entire market (see Table 14
below), however, the plastic soup containers have the lowest impact in four of the seven
categories. This is the case because the soup containers are the least used container type
(10% of the market), and the paperboard containers are the most used container (50% of
the market).
Table 14: Annual Market Impact Resource
Use (kg)
Air Emissions
(kg)
Water Pollution
(kg)
Global Warming Potential (kgCO2)
Energy Use (kJ)
Solid Waste (kg)
Landfill (kg)
Polystyrene/ Aluminum
4.08x10⁷ 7.48x10⁵ 2.24x10⁶ 2.51x10⁷ 6.04x10¹¹ 1.57x10⁷ 7.11x10⁶
Paperboard/ Aluminum
6.18x10⁷ 9.36x10⁵ 1.68x10⁴ 7.96x10⁷ 1.11x10¹² 5.62x10⁶ 2.71x10⁷
Plastic Entrée
2.84x10⁷ 7.48x10⁵ 1.38x10⁷ 2.36x10⁷ 1.60x10¹² 1.50x10⁶ 1.61x10⁷
Plastic Soup
1.55x10⁷ 3.74x10⁵ 7.30x10⁶ 2.28x10⁶ 8.90x10¹¹ 7.49x10⁵ 8.42x10⁶
It is also useful to compare the impact of each container per amount of food it can
hold (see Table 15). Paperboard now only has the lowest impact in one of the seven
categories. In this comparison, the polystyrene / aluminum and plastic entrée containers
have the lowest impact in the most categories.

13
Table 15: Impact per Ounce Resource
Use (kg)
Air Emissions
(kg)
Water Pollution
(kg)
Global Warming Potential (kgCO2)
Energy Use (kJ)
Solid Waste (kg)
Landfill (kg)
Polystyrene/ Aluminum
3.23x10⁻³ 5.46x10⁻⁵ 1.77x10⁻⁴ 1.98x10⁻³ 47.725 1.24x10⁻³ 5.64x10⁻⁴
Paperboard/ Aluminum
4.13x10⁻³ 6.25x10⁻⁵ 1.13x10⁻⁶ 5.31x10⁻³ 74.087 .001 1.81x10⁻³
Plastic Entrée
2.37x10⁻³ 6.25x10⁻⁵ 1.16x10⁻³ 1.97x10⁻³ 133.642 1.25x10⁻⁴ 1.34x10⁻³
Plastic Soup
2.59x10⁻³ 6.25x10⁻⁵ 1.22x10⁻³ 2.44x10⁻³ 148.530 1.25x10⁻⁴ 1.41x10⁻³
Solution Requirements
The incentives that determine what type of take-out container is used for Chinese
food restaurants in the United States are almost entirely economic. The majority of such
restaurants are small businesses that wish to buy take-out containers in large quantities.
Price is by far the most important factor. In order to be functional, a container must be
structurally sound and able to retain heat. Factors that might make containers more
attractive include collapsibility or stackability and microwavability. In addition, some
restaurant owners may wish for containers to be transparent to display the food in an
attractive manner.
These incentives can be characterized as belonging to two stakeholders: the
customers and the company. These are shared incentives because the customers want a
good product, and the company wants a product the customers will pay for. The other
key stakeholder is the environment. In general, environmental concerns do not create
strong incentives in this market. Small restaurants rarely have the luxury of worrying
about environmental concerns. A sustainable Chinese food take-out container would
have to satisfy all three of these stakeholders -- the triple bottom line must be met.
There are a wide variety of potential solutions to the take-out container problem.
The most basic solution, on the order of deep ecology, is to say “Why do we need take-
out? Growing, cooking, and eating our own food is best for the environment.” Another
possible solution is to eliminate disposable containers. A restaurant could require that
you bring some sort of container to the restaurant to collect your food. An alternate
approach to this solution is to offer a dish exchange or lease program. The customer pays

14
a deposit, and the restaurant delivers food in reusable containers. Next time you order
you can return your containers from the previous order. However, these are social rather
than technical changes, so they are not really engineering solutions.
An engineer’s solution might be to redesign the containers so that each order
could be put in one compartmentalized container. Such a container would require less
material for the same job. Another engineering approach is to consider materials more
carefully. Our analysis is aimed at determining the full lifecycle environmental impact of
current take-out containers. However, it is possible that switching to a corn based
biodegradable plastic might be considerably better. Or more simply, we could use paper
cartons and leave out the aluminum wire handle. On the other hand, it has been
suggested that we use entirely aluminum containers and require recycling.
Stakeholder-Incentive Analysis
An evaluation of these alternatives in terms of current market incentives shows
that the standard technology is strongly in place. None of the alternatives score better
than the standard containers (see Appendix A). One thing that seems possible is
removing the wire handle from the paper carton. This is shallow redesign which has
minimal improvement associated with it. To get a more sustainable alternative into the
market, there needs to be a change in the incentives to reflect the environment as a
stakeholder. This can be accomplished through government regulation. One such
regulation would be a waste tax like those beginning to appear in Europe4. Businesses
are penalized economically for generating waste. Under these incentives, a second
evaluation of the standard containers shows they are not good solutions. A new analysis
of the alternatives reveals that using biodegradable plastics or reusable containers are
better solutions (see Appendix B for analysis of incentives in a regulated market).
Using this stakeholder and incentive analysis, we have concluded that using
biodegradable plastics or reusable containers are the best potential long-term solutions
and in the meantime removing the wires from paper cartons would be good for the
environment. Up until this point, we have assumed that these alternatives are better for
4 Jacobsen and Kristoffersen

15
the environment. Now we will consider lifecycle analyses of our chosen alternatives to
verify our assumptions and to pinpoint the best alternative.
Biodegradable Plastic
This analysis is for polyhydroxyalkanoates (PHAs), a type of biodegradable
plastic. PHA, still in the early stages of development, has similar properties to
conventional plastics made from petrochemicals and is made from vegetable starch, a
renewable resource. At this point, biodegradable plastic is 2-10 times more expensive to
produce than conventional plastic5, which makes it less desirable in the application as a
container for Chinese food. PHA plastic is made from glucose from vegetable starch in a
fermentation process and is completely biodegradable.
The production process of biodegradable plastic begins with growing and
harvesting a vegetable (e.g., corn or potatoes), then processing the vegetable to yield
glucose from its starch, sterilizing the glucose and fermenting it to convert it to PHA,
washing recovered biomass by centrifugation, releasing the polymer from within cell
walls, washing the polymer by centrifugation, drying the polymer slurry and forming a
container. The lifecycle of PHA plastic consists of the aforementioned production
processes, consumer use, then disposal, during which the plastic biodegrades. See Tables
16 to 20 for details of the impact analysis of this type of container. This analysis assumes
the same amount of PHA plastic is used for the container it is replacing. See Tables 21 to
23 for the impact of replacing each type of conventional container with PHA plastic.
Table 16: PHAs Material Use6
5 “Making Packaging Greener – Biodegradable Plastics” 6 Gerngross

16
Table 17: Energy Use During Production of PHAs6
Table 18: Energy Use for Raw Material Production for PHAs6
Table 19: Total Energy Use for PHAs Production6
Table 20: Impact Summary for PHA
Resource Use (kg/kg) 2.39 Energy Use (kJ/kg) 57,807.61
Landfill (kg/kg) 0

17
Tables 21 and 22 below show the impact of replacing the plastic soup container,
plastic and aluminum entrée containers, and paperboard container with PHA plastic.
Replacing both the soup container and entrée containers with biodegradable plastic
lowers the overall impact of the container. However, replacing the paperboard container
with biodegradable plastic would not reduce the impact of that type of container.
Table 21: Impact Summary per Ounce of Food Plastic Soup Container PHA-equivalent Resource Use (kg) 2.59x10⁻³ 3.80x10⁻³ Energy Use (kJ) 148.53 91.88 Landfill (kg) 1.41x10⁻³ 0 Table 22: Impact Summary per Ounce of Food Aluminum Entrée
Container Plastic Entrée
Container PHA-equivalent
Resource Use (kg) 3.23x10⁻³ 2.37x10⁻³ 1.58x10⁻³ Energy Use (kJ) 47.73 133.64 38.33 Landfill (kg) 5.64x10⁻⁴ 1.34x10⁻³ 0 Table 23: Impact Summary per Ounce of Food Paperboard Container PHA-equivalent Resource Use (kg) 4.13x10⁻³ 4.78x10⁻³ Energy Use (kJ) 74.09 115.54 Landfill (kg) 1.81x10⁻³ 0
Paperboard Container without Aluminum Handle
The paperboard container can serve its purpose just as well without the aluminum
handle. When the handle is removed the new weight of the container is 29.74 g. The
impact of this 100% paperboard container can be seen in Tables 24 through 26. Some
interesting things to note are that the Global Warming Potential actually increases when
using only paper and the Water Pollution is reduced by nearly 70%. Table 24 shows how
this container compares to the container with an aluminum handle on a per ounce of food
basis. You can see that removing the handle results in an improvement in 5 of the 7
categories.

18
Table 24: Paperboard Container Impact (Aluminum Handle Removed)
Resource Use
(kg/kg)
Air Emissions
(kg/kg)
Water Pollution (kg/kg)
Global Warming Potential
(kgCO2/kg)
Energy Use
(kJ/kg)
Solid Waste (kg/kg)
Landfill (kg/kg)
Paperboard 1.720 0.039 0.00018 2.664 35508.210 - 0.900 % Reduced 16.9 11.4 69.5 + 0.1 4.1 100 0
TOTAL 100% Paper 1.720 .039 1.8 x 10⁻⁴ 2.664 35508.210 - 0.900
Table 15: Paperboard Impact per Container
Resource Use (kg)
Air Emissions
(kg)
Water Pollution
(kg)
Global Warming Potential (kgCO2)
Energy Use (kJ)
Solid Waste (kg)
Landfill (kg)
Paperboard 0.051 1.16 x 10⁻³ 5.35 x 10⁻⁶ 0.079 1056.01 - 0.027
Table 26: Paperboard Container Impact per Ounce of Food
Resource Use (kg)
Air Emissions
(kg)
Water Pollution
(kg)
Global Warming Potential (kgCO2)
Energy Use (kJ)
Solid Waste (kg)
Landfill (kg)
Paperboard (NEW)
3.19 x 10⁻³ 7.25 x 10⁻⁵ 3.34 x 10⁻⁶ 4.94 x 10 -3 66.00 - 1.69 x 10⁻³
Paperboard (OLD)
4.13x10⁻³ 6.25x10⁻⁵ 1.13x10⁻⁶ 5.31x10⁻³ 74.087 .001 1.81*10 -3
Using own Container
Another alternative is to have consumers bring their own container from home to
pick up food rather than having delivery with disposable containers. The impacts of this
can be seen in Tables 27 and 28. In this analysis, we made the following assumptions:
• Customer already owns containers
• The container is cleaned at home in an Energy Star dishwasher
• Soap is negligible because the consumer uses biodegradable dish soap
• The dishwasher uses 15 gallons of water per use and 341 kWh per year
• The dishwasher capacity is 40 dishes
• Chinese food accounts for 2 dishes per week.
• Each dish holds 32 ounces of food

19
Table 27: Reusable Container Impact per Container
Water Consumption (gal)
Energy Use (kJ)
Own container 0.094 36.9
Table 28: Reusable Container: Impact per Ounce of Food
Water Consumption (gal)
Energy Use (kJ)
Own container 2.93 x 10⁻³ 1.15
Compartmentalized Biodegradable Plastic Container
Another potential solution is to use a single, compartmentalized container made of
biodegradable plastic instead of multiple containers made from different materials. It is
assumed such a container holds 50 ounces of food and weighs 75 grams (assuming PHA
plastic has a similar density to conventional plastic). Table 29 below shows the impacts
of a compartmentalized, biodegradable plastic container.
Table 29: Compartmentalized Container: Impact per Ounce of Food Resource Use (kg) 3.58x10⁻³ Energy Use (kJ) 86.71 Landfill (kg) 0 Comparison of Potential Solutions
Four potential solutions were evaluated: removing the aluminum wire from the
paperboard container, substituting current containers with biodegradable plastic, using a
single compartmentalized biodegradable plastic container, and using the customer’s own
dishes from home. Unfortunately, there is no easy way to compare these alternatives
directly; each alternative has advantages and disadvantages.
Bio-plastics seem like an optimal solution because they are an improvement over
standard plastics at the end of their life, but the production of bio-plastics is energy
intensive. This does not eliminate them as a good solution. This technology is still in its
infancy, and there are a great number of stages where improvements can be made. For
example, the amount of plastic material created per hectare of land and the amount of
resources needed per hectare could be improved. Also, the plastic itself could be
improved so that products require less material.

20
Bio-plastics are currently an improvement over standard petroleum-based plastics,
and they have the advantage of looking the same, allowing for an easy transition. With
advances they could offer a good long-term solution.
Creating a compartmentalized container is better than using individual containers
made of the same material. This alternative introduces an economy of scale. However,
this effect is moderate, as it can only be used when an order requires enough food to use
this container. In fact, it could be counterproductive if restaurants serve food in a
compartmentalized container without filling all of the compartments. In that case, more
material is used than needed. Used correctly, these containers would have a net
environmental benefit, but they do come at some social cost. They are less convenient to
microwave, and they make it harder for people to share an order.
Removing the metal wire from a paperboard carton is a great idea. Simply put, it
completely removes a high impact material, makes the entire product recyclable without
needing to be taken apart, and does not take away from the function of the product.
However, this is a very shallow redesign. One might think of this as doing the wrong
thing the right way. As noted, this makes it a good short-term fix but not a good long-
term solution. Furthermore, recycling of paper, while worth doing, is not an impact free
process. While this is certainly worth doing for the time being, it should not be treated as
a long-term solution.
Using your own container has the least environmental impact of any of the
alternatives considered. The impact is completely embodied by the washing process
because we assumed that customers already own the containers. Impact is mostly in the
form of energy for heating the water and the consumption of the water itself. Another
similar option is to use reusable containers supplied by the restaurant, which you would
return later. These would be washed in an industrial dishwasher with higher efficiency.
In either case, reusable containers are preferable. The biggest challenge is that this
requires a considerable change in customer behavior. Therefore, we cannot expect the
switch overnight. A good way to start would be to offer discounts to people who use
their own containers. In the framework defined by the waste tax regulation discussed
earlier, the restaurant could pass the cost on to the customer, giving them a strong
incentive to use their own reusable containers.
21
Conclusions
We conclude that the best alternative is to use reusable take-out containers. Since
this type of change cannot occur overnight, we also support the use of paperboard cartons
without wire and bio-plastic, compartmentalized containers. It would be inappropriate to
favor one of these secondary options over the other because neither is better for the
environment in all of the areas considered. Additionally, a waste tax or other regulations
may be investigated as a way of altering incentives and making sustainable options more
economically competitive with current standard containers.

22
Appendix A: Qualitative Analysis under Current Incentives A simple score based qualitative analysis of the important properties tells us that in
general the better we expect a solution to be for the environment the poorer it scores. (The
notable exception being the recycled aluminum which we think would be too energy intensive to
be worthwhile.) Nonetheless, we know that in order to get a green container to take over this
market it needs to score better than the ideas we have offered so far.
Standard Price (x5)
Structure (x3)
Heat Ret. (x3)
Micro-wave (x1)
Stacking (x1)
Behavior change
(x4)
Technical change
(x3)
Total
Plastic 1 1 1 1 0 1 1 19 Aluminum+Plastic 1 1 0 -1 1 1 1 15
Paper w/ wire 1 0 1 1 1 1 1 17
Green Price
(x5) Structure
(x3) Heat Ret. (x3)
Micro-wave (x1)
Stacking (x1)
Behavior change
(x4)
Technical change
(x3)
Total
Bring Plastic-ware 0 1 1 1 -1 -1 1 5 Paper w/o wire 1 0 1 1 1 1 1 17
Bio-plastic -1 1 1 1 0 1 -1 3 Large Container 0 1 1 0 -1 0 0 5
Recycled Al. -1 0 0 -1 1 1 0 -1 Container Exch. 0 1 1 1 -1 -1 1 5
A score of 1 represents a property that makes a product more desirable. A score of -1 represents
a property that makes the product seem less desirable and a score of 0 means that it can be
viewed as neither a pro nor a con.

23
Appendix B: Qualitative Analysis under Government Regulations
One way to change improve the outcome is to consider the same incentives under the
constraint of waste responsibility regulations. This makes wasteful options less cost effective. It
would make it much easier to get a green product on the market.
Green
w/ Regulation Price (x5)
Structure (x3)
Heat Ret. (x3)
Micro-wave (x1)
Stacking (x1)
Behavior change
(x4)
Technical change
(x3)
Total
Bring Plastic-ware 1 1 1 1 -1 -1 1 10 Paper (w/o wire) -1 0 0 1 1 1 1 4
Bio-plastic 1 1 1 1 0 1 -1 13 Large Container -1 1 1 0 -1 0 0 0
Recycled Al. 0 0 0 -1 1 1 0 4 Container Exch. 1 1 1 1 -1 0 0 12
Standard
w/ Regulation Price (x5)
Structure (x3)
Heat Ret. (x3)
Micro-wave (x1)
Stacking (x1)
Behavior change
(x4)
Technical change
(x3)
Total
Plastic -1 1 1 1 0 1 1 9 Aluminum+Plastic -1 1 0 -1 1 1 1 5
Paper w/ wire -1 0 1 1 1 1 1 7
This analysis tells us firstly that it will be very challenging to get a greener technology
adopted. In order to really make a difference we may need to wait for government regulations.
The good news is that the idea of waste responsibility is currently growing in Europe. Work to
develop bio-plastics should be continued. Regulation would be the best way to expedite the
move to greener products. However, as petroleum becomes more rare and bio-plastic technology
is improved, it is possible they may simply transition into commonplace. In the meantime we are
working on improving the standard take-out containers. Plastic containers are being reused in
homes for extended periods of time and, in some cases, recycled. We have also noted that in the
meantime, it would be feasible to phase out the wire handles on paper cartons.
24
Sources
Carnegie Mellon University Green Design Institute. (2007) Economic Input-Output Life
Cycle Assessment (EIO-LCA) model [Internet], Available from:
<http://www.eiolca.net> [Accessed 2 May, 2007]
Cushman-Roisin, Benoit. Useful Numbers. [Lecture material from Engs 171].
<http://ublib.buffalo.edu/libraries/projects/cases/footprint/calculations%20goods.html>
Gerngross, Tillman U. “Can Biotechnology Move Us Toward A Sustainable Society?” Nature Biotechnology. Vol 17. June 1999.
Jacobsen, Henrik, and Merete Kristoffersen. “Case Studies on Waste Minimization
Practices in Europe.” European Environmental Agency. Copenhagen, 2002.
Luo, Michael. “As All-American as Egg Foo Young.” The New York Times. September
22, 2004. <http://www.nytimes.com/2004/09/22/dining/22CHIN.html?ex=
1253592000&en=504b97869bd54227&ei=5090&partner=rssuserland>
[Accessed 2 May, 2007].
“Making Packaging Greener – Biodegradable Plastics.” Australian Academy of Science. February 2002. [Accessed 18 May, 2007] <http://www.science.org.au/nova/061/061key.htm>
National Renewable Energy Laboratory, U.S. Life-Cycle Inventory Database.
<http://www.nrel.gov/lci/assessments.html> [Accessed 30 April, 2007].
Wai, Martin. Owner of Mayflower (Chinese restaurant) in South Paris, ME. [Interview,
2 May, 2007].