lifetime hoan corporation - library.corporate...
TRANSCRIPT
LIFETIME HOAN CORPORATIONA N N U A L R E P O R T 2 0 0 4
0
50,000
100,000
150,000
$200,000
'00'01'02'03'04
NET SALES(in thousands)
0
10,000
20,000
30,000
40,000
$50,000
'00'01'02'03'04
WORKING CAPITAL(in thousands)
0.00
0.10
0.20
0.30
0.40
0.50
0.60
0.70
$0.80
'00'01'02'03'04
DILUTEDEARNINGS PER COMMONSHARE FROMCONTINUINGOPERATIONS
0
2,000
4,000
6,000
8,000
$10,000
'00'01'02'03'04
INCOME FROMCONTINUINGOPERATIONS(in thousands)
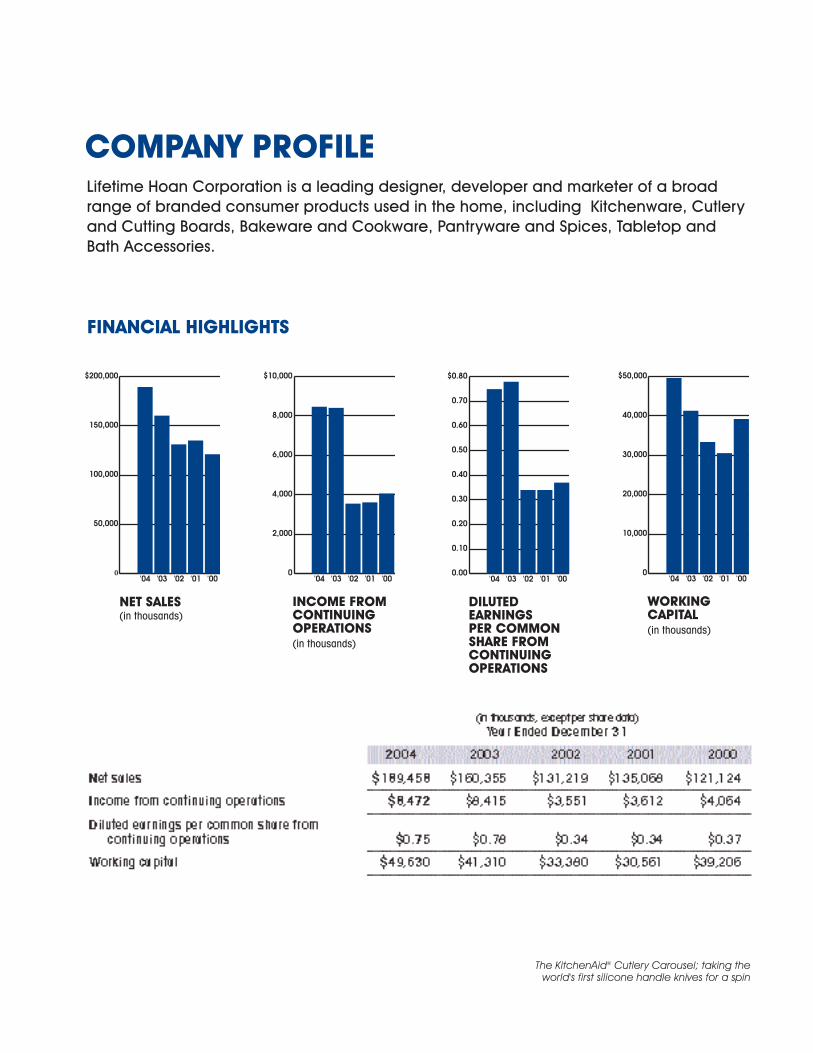
FINANCIAL HIGHLIGHTS
Lifetime Hoan Corporation is a leading designer, developer and marketer of a broadrange of branded consumer products used in the home, including Kitchenware, Cutleryand Cutting Boards, Bakeware and Cookware, Pantryware and Spices, Tabletop andBath Accessories.
COMPANY PROFILE
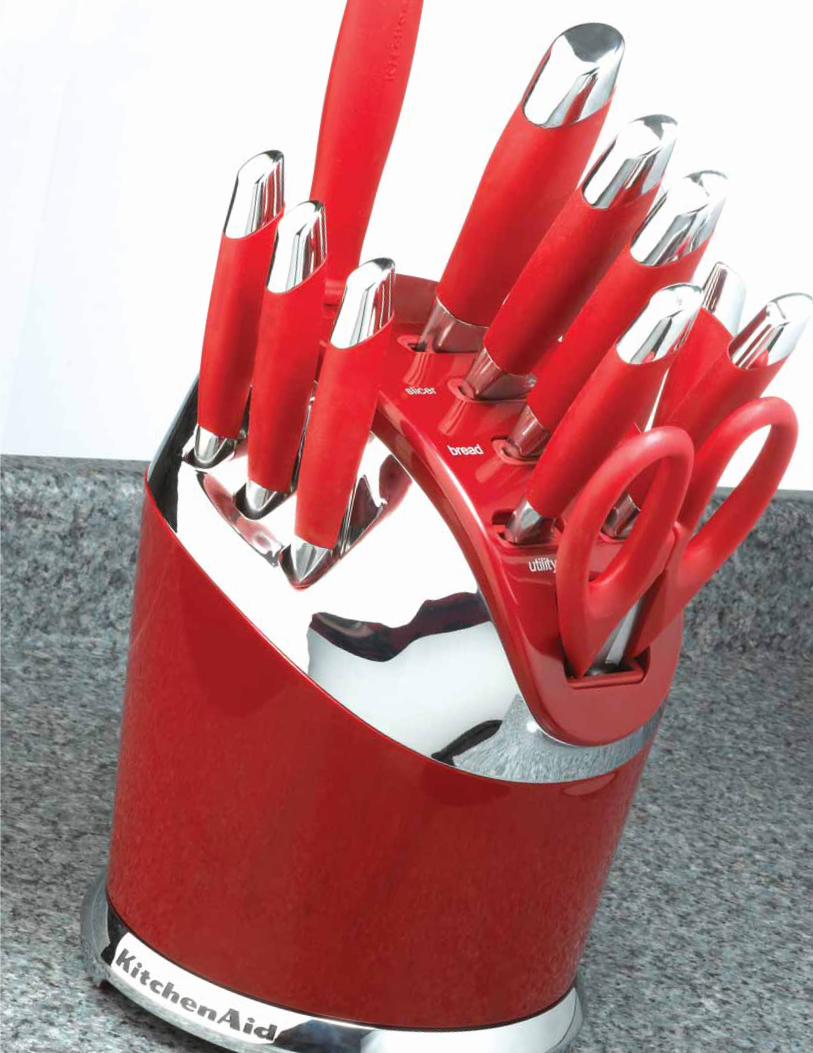
The KitchenAid® Cutlery Carousel; taking theworld's first silicone handle knives for a spin
During 2004, we took a number of steps to build on the strengths of our proven business model and toposition our Company for future growth. Over the years, the three essential ingredients we have used toforge our leadership position in the housewares industry are:
• An expanding portfolio of powerful brands
• A proven track record of innovation and design excellence
• Superior sourcing capabilities
Our consistent focus on each of these areas has enabled Lifetime to grow and prosper, and, we believe,will continue to provide a solid foundation for our future success.
An Expanding Portfolio of Powerful BrandsLifetime owns or licenses some of the most powerful brands in housewares, enabling us to differentiate ourproduct lines in the eyes of both our retail customers and consumers. Our two top-selling brands areKitchenAid® and Farberware®, which also rank as the #1 and #2 brands in kitchen gadgets and cutlery,according to the HFN 2003 Brand survey.
In 2004, we acquired the business and certain assets of Excel Importing Corp. This acquisition expandedour brand portfolio and, as well, added an important new product category – Tabletop. Among thebrands we acquired was Sabatier®, a highly respected, upper-end brand that we expect will be a keygrowth driver for Lifetime in the years to come.
Proven Track Record of Innovation and Design ExcellenceAt the heart of our Company is a strong culture of new product development and design excellence. Ourunique in-house Product Development and Design Team, consisting of 35 professional designers andengineers, is responsible for creating new products and packaging and merchandising concepts. ThisTeam utilizes state-of-the-art equipment that enables us to shorten product development time, expeditethe production process and “value-engineer” our products.
Lifetime has an impressive record of developing exciting new products. In 2004, we introduced over 600individual products. In addition, we applied for more than 30 utility and design patents over the past two years.
Superior Sourcing CapabilitiesWe have successfully sourced products overseas for more than 40 years. Moreover, we use our productdesign capabilities to help our suppliers to reduce their production costs and to take advantage of lower-cost raw materials. In 2004, we opened a second office in China and hired a Senior Vice President ofSourcing, based in Shanghai.
2004 Financial ResultsIn 2004, Lifetime’s net sales totaled a record $189.5 million, an increase of $29.1 million or 18% over 2003.For the year, we reported net income of $8.5 million, compared to $8.4 million for 2003. Earnings perdiluted share for 2004 came to $0.75, compared to $0.78 for 2003.
Net sales in 2004 for the three businesses we acquired over the past 18 months, :USE®, Gemco® and Excel,amounted to $14.3 million. The Company’s organic growth was driven primarily by strong sales across allclassifications of products sold under the KitchenAid® brand.
In 2004, we implemented plans to strengthen our infrastructure. In particular, we bolstered our product
2
DEAR FELLOW SHAREHOLDERS:
2004
32004
LIFETIME HOAN CORPORATION
Jeffrey Siegel
Chairman of the Board, President and Chief Executive Officer

4
Jeffrey Siegel (Chairman, President and CEO) and
Ronald Shiftan (Vice Chairman)
2004
development and design, overseas sourcing and sales and marketing teams. We also added keyexecutives in each of our growing business classifications. Although the increased cost of this infrastructuredid affect the Company’s year-over-year earnings comparison, we believe these additional resources willhave a very positive impact on Lifetime’s long-term growth. In addition, it should be noted that we incurredover $900,000 in expenses related to Sarbanes-Oxley compliance work in 2004, the equivalent of $0.05 in earnings.
As of December 31, 2004, stockholders’ equity was $92.9 million, the equivalent of $8.41 in book value per share.
In summary, 2004 was a successful year for Lifetime during which we implemented many initiatives toexpand our presence in the housewares industry and accelerate our future growth. We broadened ourportfolio of licensed and owned brands, added several new classifications, developed exciting newproducts and pioneered new ways to use materials in our products.
2005 In 2005, we expect our results to reflect the benefits of the initiatives we put into place in 2004.
The goal of broadening our portfolio of powerful brands, continuing to invest in enhancing our ProductDevelopment and Design capabilities, strengthening our overseas sourcing organization and building ourinfrastructure is to be able to create, source and distribute unique products targeted to consumers atdifferent price points in every major level of trade.
For example, in our cutlery and cutting board businesses, the ability to offer products under theKitchenAid®, Cuisinart®, Sabatier®, Farberware®, Hoffritz®, DBK™-Daniel Boulud Kitchen and Laguiole™brands enables us to offer new, innovative higher-value products to which consumers can trade up, as wellas to provide better value and greater selection to consumers at more moderate price points.
We expect that a substantial portion of our growth in 2005 will come from the expansion of our shelf spacein a number of major retailers. At the beginning of the year, for example, we more than doubled our spacewith one of our leading customers for KitchenAid® products. We estimate that the increased space at thisone customer alone should produce over $10 million in additional sales for Lifetime in 2005.
Our results for 2005 should also benefit from the new categories we added in 2004. For example, theTabletop and Cookware categories that we acquired from Excel should contribute significantly in 2005. Wehave redesigned many Excel’s Tabletop lines to bring them in line with our high standards for product andpackaging quality and style.
In closing, we are proposing to change the name of our Company from Lifetime Hoan Corporation toLifetime Brands, Inc., reflecting the crucial role that well-known and well-respected brands play in ourbusiness model. We believe this new name more accurately expresses one of Lifetime’s most importantattributes and key competitive strengths. We look forward to communicating with our shareholders,customers and employees in the future using this new name to reinforce our most fundamental business strategy.
Thank you for your continued support.
Sincerely,
Jeffrey Siegel
Chairman of the Board, President and Chief Executive Officer5
2004
LIFETIME HOAN CORPORATION
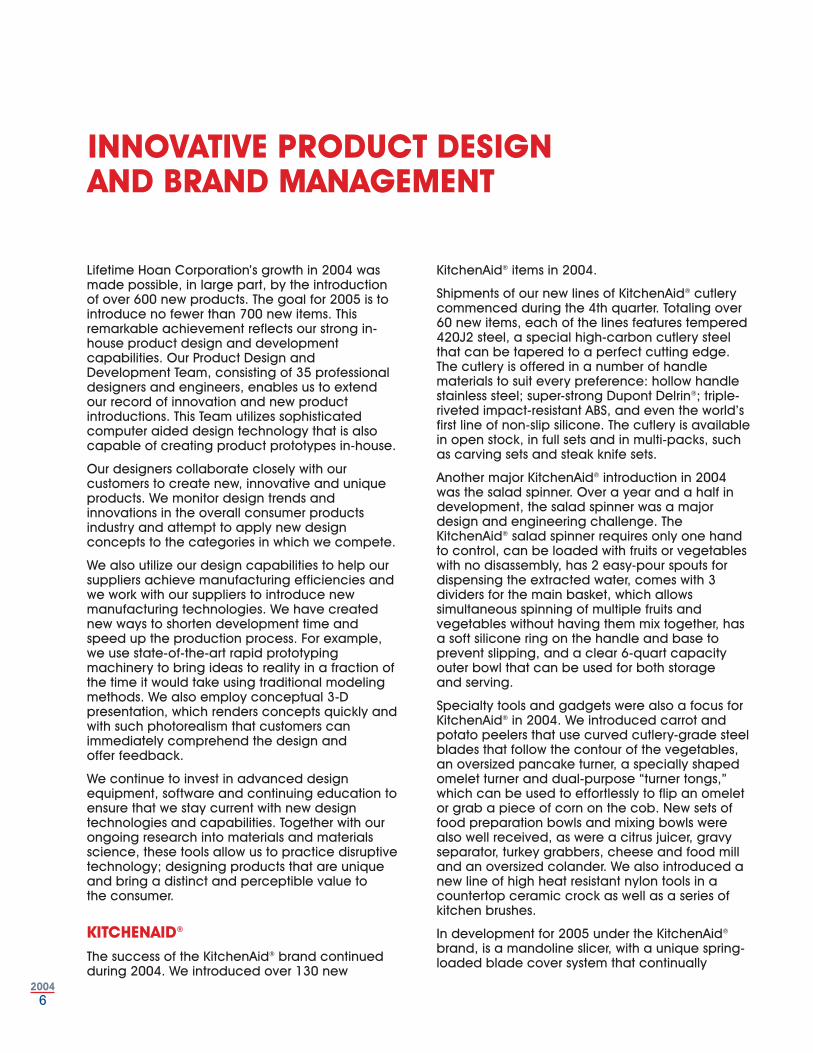
Lifetime Hoan Corporation’s growth in 2004 wasmade possible, in large part, by the introductionof over 600 new products. The goal for 2005 is tointroduce no fewer than 700 new items. Thisremarkable achievement reflects our strong in-house product design and developmentcapabilities. Our Product Design andDevelopment Team, consisting of 35 professionaldesigners and engineers, enables us to extendour record of innovation and new productintroductions. This Team utilizes sophisticatedcomputer aided design technology that is alsocapable of creating product prototypes in-house.
Our designers collaborate closely with ourcustomers to create new, innovative and uniqueproducts. We monitor design trends andinnovations in the overall consumer productsindustry and attempt to apply new designconcepts to the categories in which we compete.
We also utilize our design capabilities to help oursuppliers achieve manufacturing efficiencies andwe work with our suppliers to introduce newmanufacturing technologies. We have creatednew ways to shorten development time andspeed up the production process. For example,we use state-of-the-art rapid prototypingmachinery to bring ideas to reality in a fraction ofthe time it would take using traditional modelingmethods. We also employ conceptual 3-Dpresentation, which renders concepts quickly andwith such photorealism that customers canimmediately comprehend the design and offer feedback.
We continue to invest in advanced designequipment, software and continuing education toensure that we stay current with new designtechnologies and capabilities. Together with ourongoing research into materials and materialsscience, these tools allow us to practice disruptivetechnology; designing products that are uniqueand bring a distinct and perceptible value to the consumer.
KITCHENAID®
The success of the KitchenAid® brand continuedduring 2004. We introduced over 130 new
KitchenAid® items in 2004.
Shipments of our new lines of KitchenAid® cutlerycommenced during the 4th quarter. Totaling over60 new items, each of the lines features tempered420J2 steel, a special high-carbon cutlery steelthat can be tapered to a perfect cutting edge.The cutlery is offered in a number of handlematerials to suit every preference: hollow handlestainless steel; super-strong Dupont Delrin®; triple-riveted impact-resistant ABS, and even the world’sfirst line of non-slip silicone. The cutlery is availablein open stock, in full sets and in multi-packs, suchas carving sets and steak knife sets.
Another major KitchenAid® introduction in 2004was the salad spinner. Over a year and a half indevelopment, the salad spinner was a majordesign and engineering challenge. TheKitchenAid® salad spinner requires only one handto control, can be loaded with fruits or vegetableswith no disassembly, has 2 easy-pour spouts fordispensing the extracted water, comes with 3dividers for the main basket, which allowssimultaneous spinning of multiple fruits andvegetables without having them mix together, hasa soft silicone ring on the handle and base toprevent slipping, and a clear 6-quart capacityouter bowl that can be used for both storage and serving.
Specialty tools and gadgets were also a focus forKitchenAid® in 2004. We introduced carrot andpotato peelers that use curved cutlery-grade steelblades that follow the contour of the vegetables,an oversized pancake turner, a specially shapedomelet turner and dual-purpose “turner tongs,”which can be used to effortlessly to flip an omeletor grab a piece of corn on the cob. New sets offood preparation bowls and mixing bowls werealso well received, as were a citrus juicer, gravyseparator, turkey grabbers, cheese and food milland an oversized colander. We also introduced anew line of high heat resistant nylon tools in acountertop ceramic crock as well as a series ofkitchen brushes.
In development for 2005 under the KitchenAid®
brand, is a mandoline slicer, with a unique spring-loaded blade cover system that continually
INNOVATIVE PRODUCT DESIGN AND BRAND MANAGEMENT
62004
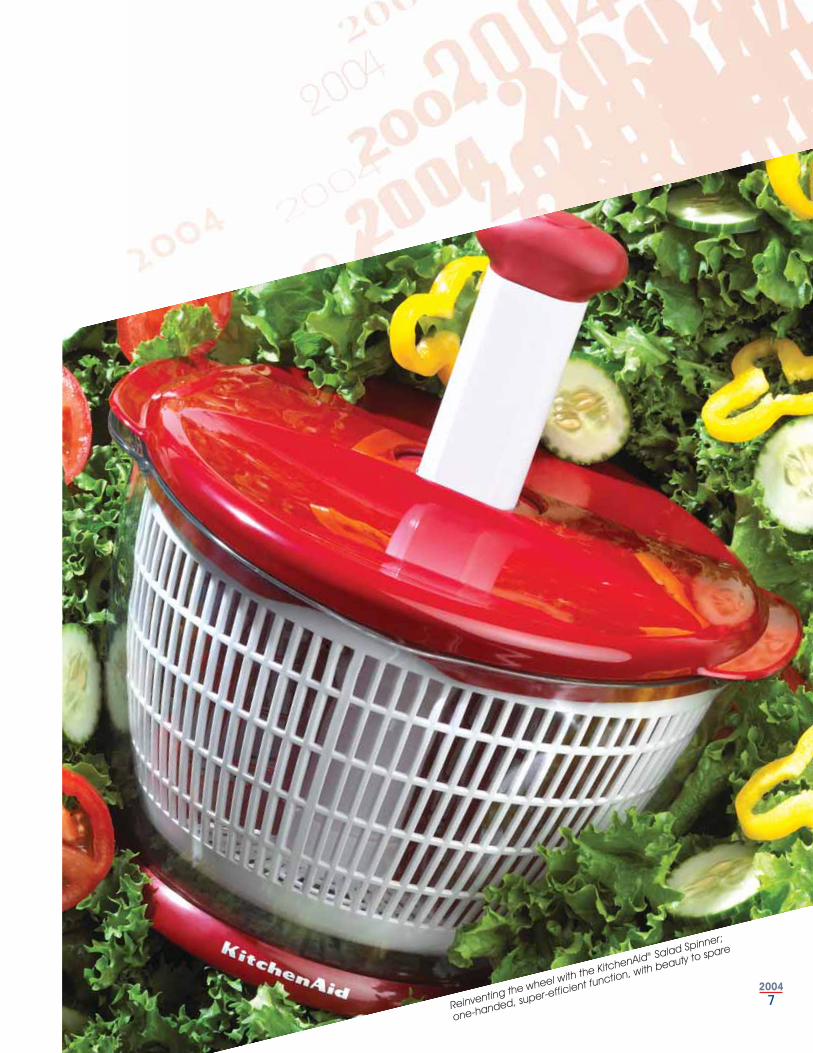
Reinventing the wheel with the KitchenAid® Salad Spinner;
one-handed, super-efficient function, with beauty to spare
72004

8
guards the user’s hand from the slicing blade.Other kitchenware items for 2005 will be new all-stainless steel kitchen and serving tools, tools andgadgets featuring brushed stainless steel handlesand a line of copper handle kitchenware withsatin nickel accents. Other innovative products willinclude a fruit slicer with soft grip handles and acookie gun with 16 discs that conveniently storeinside the body of the cookie maker. We are alsoplanning to launch a complete line of KitchenAid®
sink accessories.
Silicone continues to grow as a significant materialin housewares. We introduced the world’s first fullline of silicone tools under the KitchenAid® brand
in 2001. In 2004, we expanded our selection toinclude a unique over-molded silicone trivet,pastry and basting brushes with easy-to-cleanheat resistant silicone bristles, an oversizedsilicone spoon rest and a non-stick coated rollingpin, featuring weighted silicone handles thatautomatically return to the horizontal position. Indevelopment for introduction in early 2005 aretwo lines of silicone handle tools and gadgets,stainless steel and nylon tongs, each featuringsilicone grips and a new series of silicone handlebarbecue equipment featuring heavy-duty zincalloy castings and stainless steel.
In addition to the world-class design, innovation2004
A garden of earthly delights; KitchenAid® rose and sunflower silicone bakeware molds
92004
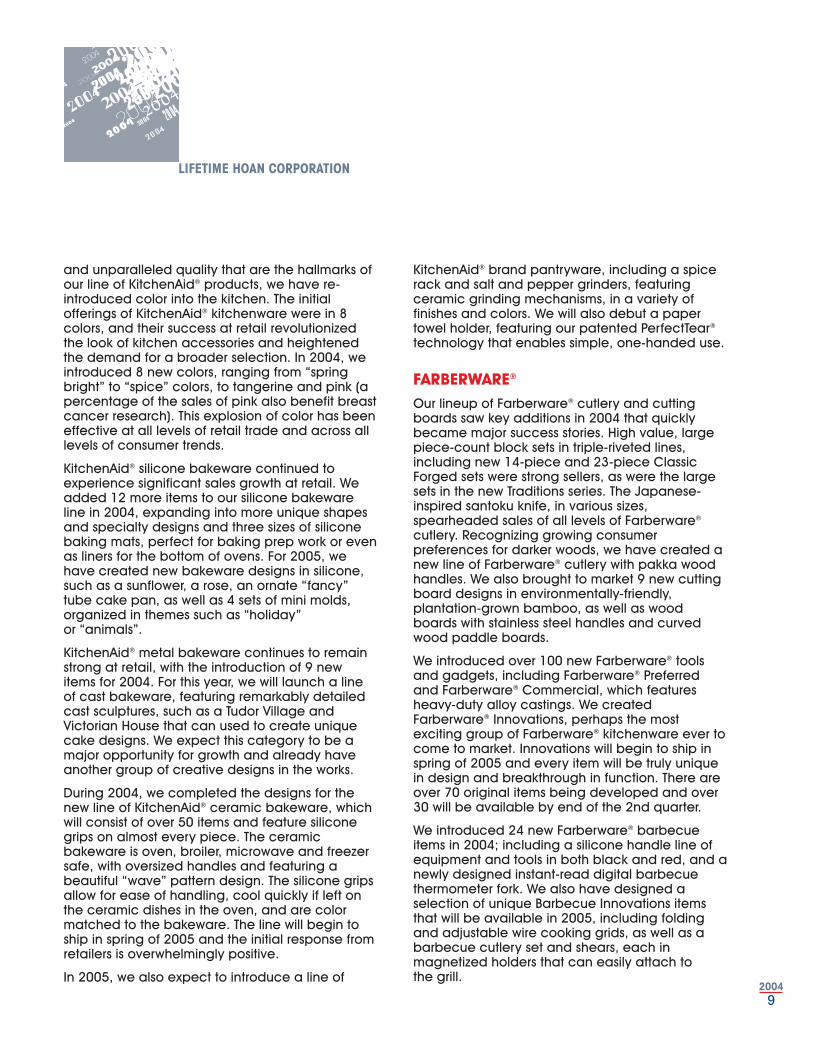
and unparalleled quality that are the hallmarks ofour line of KitchenAid® products, we have re-introduced color into the kitchen. The initialofferings of KitchenAid® kitchenware were in 8colors, and their success at retail revolutionizedthe look of kitchen accessories and heightenedthe demand for a broader selection. In 2004, weintroduced 8 new colors, ranging from “springbright” to “spice” colors, to tangerine and pink (apercentage of the sales of pink also benefit breastcancer research). This explosion of color has beeneffective at all levels of retail trade and across alllevels of consumer trends.
KitchenAid® silicone bakeware continued toexperience significant sales growth at retail. Weadded 12 more items to our silicone bakewareline in 2004, expanding into more unique shapesand specialty designs and three sizes of siliconebaking mats, perfect for baking prep work or evenas liners for the bottom of ovens. For 2005, wehave created new bakeware designs in silicone,such as a sunflower, a rose, an ornate “fancy”tube cake pan, as well as 4 sets of mini molds,organized in themes such as “holiday” or “animals”.
KitchenAid® metal bakeware continues to remainstrong at retail, with the introduction of 9 newitems for 2004. For this year, we will launch a lineof cast bakeware, featuring remarkably detailedcast sculptures, such as a Tudor Village andVictorian House that can used to create uniquecake designs. We expect this category to be amajor opportunity for growth and already haveanother group of creative designs in the works.
During 2004, we completed the designs for thenew line of KitchenAid® ceramic bakeware, whichwill consist of over 50 items and feature siliconegrips on almost every piece. The ceramicbakeware is oven, broiler, microwave and freezersafe, with oversized handles and featuring abeautiful “wave” pattern design. The silicone gripsallow for ease of handling, cool quickly if left onthe ceramic dishes in the oven, and are colormatched to the bakeware. The line will begin toship in spring of 2005 and the initial response fromretailers is overwhelmingly positive.
In 2005, we also expect to introduce a line of
KitchenAid® brand pantryware, including a spicerack and salt and pepper grinders, featuringceramic grinding mechanisms, in a variety offinishes and colors. We will also debut a papertowel holder, featuring our patented PerfectTear®
technology that enables simple, one-handed use.
FARBERWARE®
Our lineup of Farberware® cutlery and cuttingboards saw key additions in 2004 that quicklybecame major success stories. High value, largepiece-count block sets in triple-riveted lines,including new 14-piece and 23-piece ClassicForged sets were strong sellers, as were the largesets in the new Traditions series. The Japanese-inspired santoku knife, in various sizes,spearheaded sales of all levels of Farberware®
cutlery. Recognizing growing consumerpreferences for darker woods, we have created anew line of Farberware® cutlery with pakka woodhandles. We also brought to market 9 new cuttingboard designs in environmentally-friendly,plantation-grown bamboo, as well as woodboards with stainless steel handles and curvedwood paddle boards.
We introduced over 100 new Farberware® toolsand gadgets, including Farberware® Preferredand Farberware® Commercial, which featuresheavy-duty alloy castings. We createdFarberware® Innovations, perhaps the mostexciting group of Farberware® kitchenware ever tocome to market. Innovations will begin to ship inspring of 2005 and every item will be truly uniquein design and breakthrough in function. There areover 70 original items being developed and over30 will be available by end of the 2nd quarter.
We introduced 24 new Farberware® barbecueitems in 2004; including a silicone handle line ofequipment and tools in both black and red, and anewly designed instant-read digital barbecuethermometer fork. We also have designed aselection of unique Barbecue Innovations itemsthat will be available in 2005, including foldingand adjustable wire cooking grids, as well as abarbecue cutlery set and shears, each inmagnetized holders that can easily attach to the grill.
LIFETIME HOAN CORPORATION
CUISINART®
Cuisinart® cutlery remains the standard-bearer forquality, performance and design. In addition tothe Continental and Ultra Edge lines, we added aTriple-Riveted series in 2004, featuring extra-widebolsters for safety and balance. We also launchedan engineering first, the patented Knife Vault™.The exterior of the Knife Vault™ is designed tocoordinate with the popular Cuisinart® countertopelectrics. The interior houses a complete 15-piececollection of Continental series cutlery. The KnifeVault™ utilizes a revolutionary locking mechanismthat makes it secure to leave on the countertopfor families with children. The Company will beintroducing a second version of the Knife Vault™ in 2005.
KAMENSTEIN®
With the release of over 150 new items, theKamenstein® brand had a number of majorsuccess stories in 2004, including the patentedPerfectTear® paper towel holder. The Companyreleased 10 versions of this unique product, whichuses an internal gearing system that allows forsimple one-handed use. By mid-2005 there will beover 35 versions available in all key basic andtrend colors, as well as the special electroplatedmetal finishes and material combinations found intoday’s kitchens; satin nickel, polished copper,burnished copper, chrome, burnished bronze,distressed black, gum metal, ceramic with wood,and wire in either black or chrome. ThePerfectTear® has transformed the countertoppaper towel holder from a kitchen basic into afunctional and decorative kitchen necessity.
In 2004, Kamenstein® also unveiled the Can-Do™line of colorful and stylish storage products, whichcombine magnetic bulletin boards in 3 sizes, witha variety of round, square, and rectangularcontainers with see-through tops that can be usedto easily sort and store a variety of items, fromspices to desk accessories. There are alsocylindrical-shaped holders, holders for paper,pens and pencils, 3 sizes of magnetic pictureframes, magnetic clips and sets of “reminder”magnets for important events or activities likebirthday parties or doctor’s appointments. For
102004
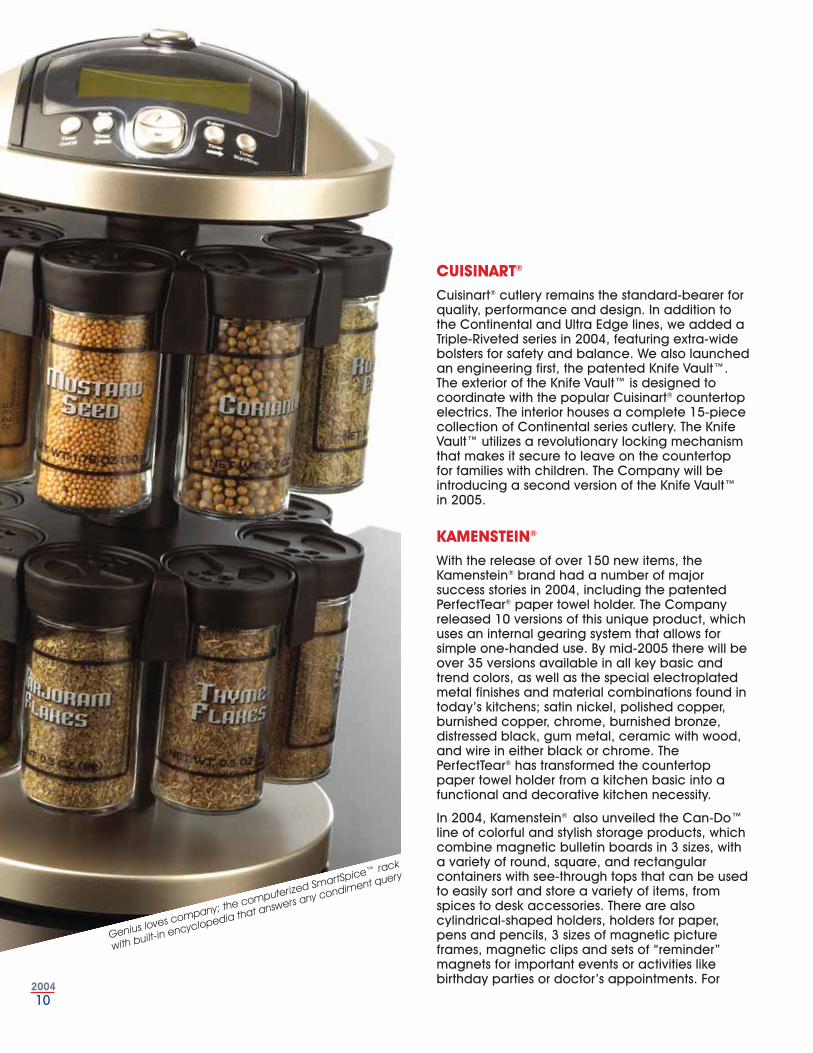
Genius loves company; the computerized SmartSpice™ rack
with built-in encyclopedia that answers any condiment query
2005, the Company will be offering countertopdisplay units that hold large numbers of theseimpulse-driven items, as well as sets of containers,and magnetic easels that can hold up to 12assorted containers.
Kamenstein® has also developed 12-, 16-, and 18-tin revolving spice racks utilizing magnetic roundtins. Also available are magnetic, rectangular,brushed stainless steel “strips” that can be hungvertically, horizontally, or at an angle to suit anydecorating need, in 3-, 5-, 6-, 9-, and 12-tin spice sets.
Other innovative new products to be sold underthe Kamenstein® brand are wipe dispensercontainers and clean-up kits, which combine aPerfectTear® paper towel holder and a wipedispenser container within a durable plasticcarrying case.
The popularity of the new Twist spice racks for2004 is reflected by the development of 15 newdesigns, mirroring many of the color and materialchoices being utilized in the next generation ofPerfectTear® paper towel holders. Other spiceracks of note are: the 15-jar, 18-jar, and 21-jarTower racks in assorted colors and finishes; a 16-jar and 20-jar stainless steel version of the Tower;Photo Frame spice racks; the nostalgic and novelFerris Wheel spice rack, and a 16-jar multi-stripedbamboo spice rack. Other exciting concepts thatwill be brought to market in the beginning of 2005are a 20-jar flat wire rack in the Chromeworkscollection, a sequel to the unusual Circa spicerack, and the fun Spice Train. Also in 2005, theCompany will begin shipping SmartSpice™, acombination spice rack and cookbook, with over200 recipes all contained in a computerized,portable, digital control module. The rack comeswith 16 premium spices in jars with easy to use siftand pour lids. Kamenstein® bottles all of its spicesin the United States in its own FDA-approvedbottling facility in Massachusetts.
For home organization and back-to-college,Kamenstein® has developed a stainless steelmessage board with a dry erase section, as wellas the Dorm Safe, a unique, compact, lockablesafe for personal items and valuables. These itemswill be available in time for the busy back-to-
school season in the 2nd and 3rd quarters of 2005.
ROSHCO®
Roshco® became a major brand in siliconebakeware in 2004, with a broad assortment of 14items in key colors, highlighted by the exclusivewire carrying “sled” that simplifies the handling ofthe larger silicone items. We will expand theassortment into specialty cake pans, mini bakingand chocolate molds, and set of mini noveltymolds in trend colors for 2005. The Company hasalso designed numerous fondues, multi-functionversions of the S’mores Maker™, a novel icecream serving set that can also be used forvarious desserts and a unique, easy-to-use cookie press.
The Roshco® division had a huge hit in 2004 withdesigns using famous Hershey’s® icons. There weretwo versions of the S’mores Maker™, each using aceramic marshmallow-shaped S’mores burner ona ceramic tray designed to resemble the famousHershey’s® Milk Chocolate bar. There was also aHershey’s® fondue in the shape of the Hershey’s®
Chocolate Kiss. For 2005, the Company will beshipping specialty silicone bakeware items suchas a 6-in-one Hershey’s® Kiss mold, a 6-in-oneHershey’s® Reese’s® Peanut Butter Cup mold, anda 4-in-one Hershey’s® Milk Chocolate Bar mold.There is also an 8-piece Kid’s Baking Set, withsilicone molds, cookie cutters and a mini rolling pin.
CASAMODA™CasaModa™ is as our primary brand for homeentertainment items. This brand features acollection of home entertaining items, such as theS’mores Maker™, the Smokeless Tabletop Griller™and ceramic serveware with candle warmers anddecorative wire stands. We are expanding theCasaModa™ barware collection to include abeautiful leather-covered grouping, a metallicgold and silver series and a unique “light up” lineof products using LED technology.
LIFETIME HOAN CORPORATION
112004

122004
Pièce de résistance; Sabatier® cutlery and kitchenware for the
finest in timeless French design and quality
132004
SABATIER®
In 2004, we acquired a license to distributeproducts under the well-known Sabatier® brand.Known for its heritage of classic French cutlery, wehave expanded the Sabatier® brand to includeFrench-inspired designs in dinnerware, flatware,cutting boards, kitchen tools and gadgets.
A key addition for 2005 will be a full line extensionof the Laguiole™ line, previously available only insteak knives known for their remarkable sharpness,distinctive shape and the famous “bee” insignia.The tremendous success of the contemporaryProSteel, a hollow handle stainless knife, hasproven that the brand has widespread appeal.We have added two new cutlery lines under theProSteel umbrella; one uses soft grip Santoprene®
and the other features never needs sharpeningblades. To compliment the line extension, theCompany will also be introducing both wood andpolypropylene cutting boards with the ProSteelhandle, as well as a full line of over 30 tools,gadgets and barbecue equipment.
We will also be expanding the traditional woodhandle Loire line to include a new cherry woodseries, and will add a full line of Loire tools andgadgets, bringing a French-inspired, updatedlook to wood tools and cutlery for the kitchen.
We are also introducing new patterns of Sabatier®
dinnerware and flatware. Sabatier® has proven tobe a brand with wide appeal. While respected forits classic heritage, retailers and consumers alikefully appreciate the updated and contemporarydesigns of Sabatier® in many categories of housewares.
:USE® - TOOLS FOR CIVILIZATION®
Originated by the renowned designer RobertSonneman, :USE® is an upscale line ofcontemporary bath and lighting products. Manyof the lines are carried by the finest bath anddecorative accessory retailers in America, andare respected for their breakthrough design andunparalleled quality. We acquired :USE® in late2003, and have taken a two-level approach toproduct development for the brand. Whilecontinuing to expand the assortment of product in
the premier lines, we have also developed threegreat collections of exciting, moderately priced,bath, closet, and bedroom storage accessories.We have received very positive feedback from allchannels of distribution for these storageaccessories, with particular interest from thoseaccounts that target the ever-expanding back-to-dorm business.
For 2005, we have introduced WetNets™, acollection of popularly priced, brightly coloredbath and shower accessories, made ofwaterproof nylon netting held within colorfulpolypropylene frames. Oversized and extra-strongsuction cups hold the WetNets™ to any smoothsurface and make installation simple and safe.WetNets™ will be available in many sizes, in sets,as wall-corner units, and in over-the-shower rod models.
JOSEPH ABBOUD ENVIRONMENTS™Joseph Abboud Environments™ takes the samecasual, understated approach to elegant fashionas Joseph Abboud does in his clothing designs. Hiskeen understanding of style, fabric, texture, andcolor, all combine into an updated classic stylethat is as flexible in its approach to dressing atable as it is when outfitting a wardrobe. For 2004,we offered over 50 items in the Abboudcollections of flatware, glassware, placemats,stainless tabletop accessories, candles anddinnerware. Both the South Beach and Ventanacollections were major successes at such upscaleretailers as Bloomingdale’s and Macy’s, and areperfect expressions of the Abboud philosophy. Byutilizing unique combinations of shapes, textures,and materials featuring a metallic “reactiveglaze” on the dinnerware that imparts aremarkable visual depth to the product, theAbboud collections create a fluid approach thatis effective for the entire range of casual to formal entertaining.
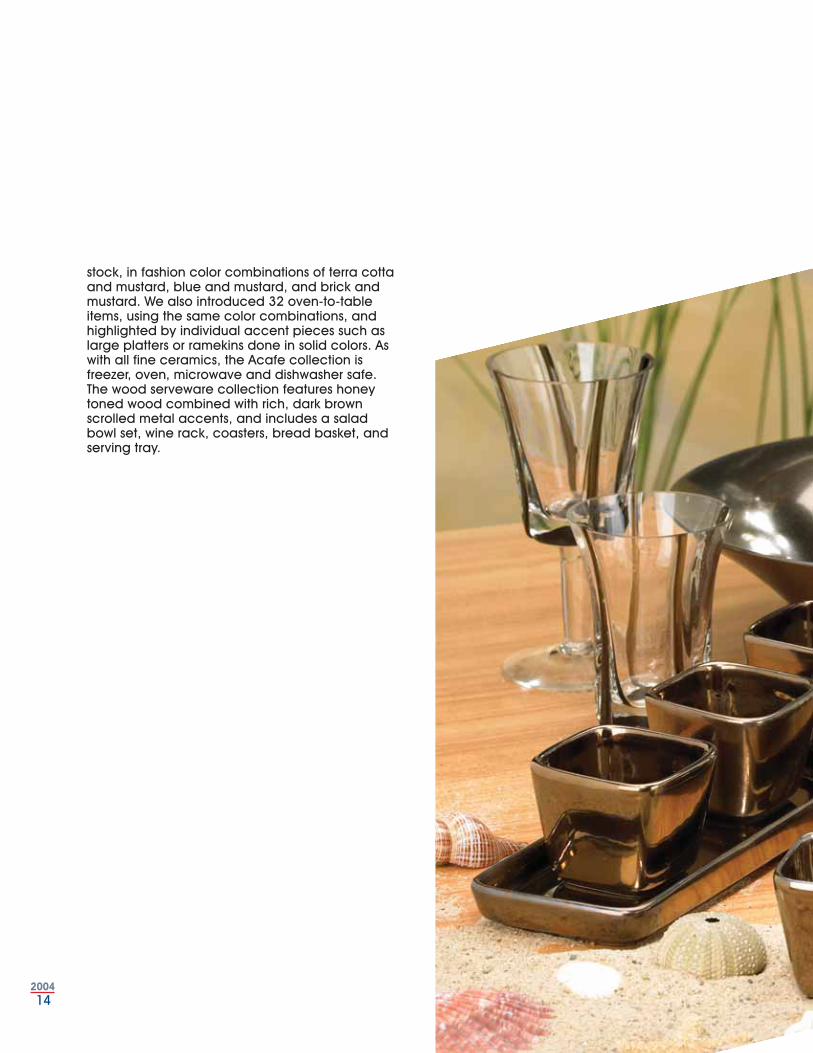
We also design and distribute the Kathy IrelandHome® Acafe collections of dinnerware, oven totable ceramics, and wooden serveware. Thedesigns and colors reflect elegant, updated tasteat affordable prices. In 2004, we launched 18items in dinnerware, both in full sets and open
LIFETIME HOAN CORPORATION
142004
stock, in fashion color combinations of terra cottaand mustard, blue and mustard, and brick andmustard. We also introduced 32 oven-to-tableitems, using the same color combinations, andhighlighted by individual accent pieces such aslarge platters or ramekins done in solid colors. Aswith all fine ceramics, the Acafe collection isfreezer, oven, microwave and dishwasher safe.The wood serveware collection features honeytoned wood combined with rich, dark brownscrolled metal accents, and includes a saladbowl set, wine rack, coasters, bread basket, andserving tray.

LIFETIME HOAN CORPORATION
152004
Alternative energy source; Joseph Abboud
Environments™ collection lights up any room
172004
162004
SELECTED FINANCIAL DATA
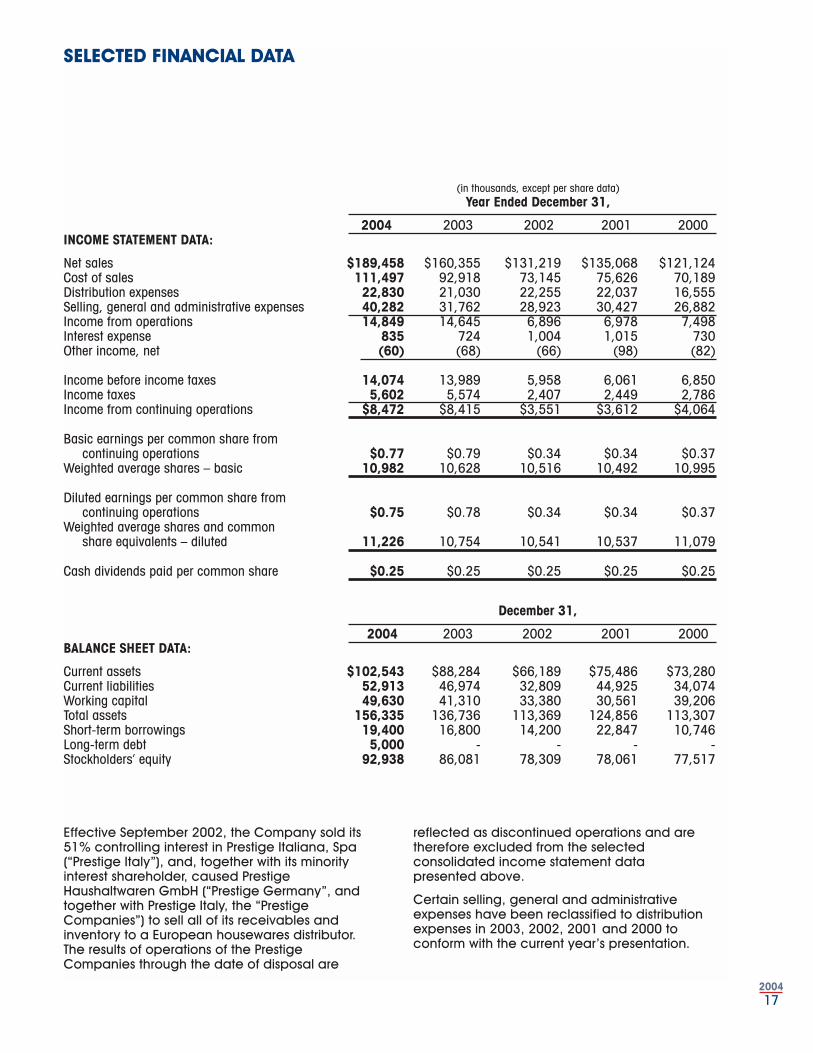
(in thousands, except per share data)Year Ended December 31,
2004 2003 2002 2001 2000 INCOME STATEMENT DATA:
Net sales $189,458 $160,355 $131,219 $135,068 $121,124 Cost of sales 111,497 92,918 73,145 75,626 70,189Distribution expenses 22,830 21,030 22,255 22,037 16,555Selling, general and administrative expenses 40,282 31,762 28,923 30,427 26,882Income from operations 14,849 14,645 6,896 6,978 7,498 Interest expense 835 724 1,004 1,015 730 Other income, net (60) (68) (66) (98) (82)
Income before income taxes 14,074 13,989 5,958 6,061 6,850 Income taxes 5,602 5,574 2,407 2,449 2,786 Income from continuing operations $8,472 $8,415 $3,551 $3,612 $4,064
Basic earnings per common share from continuing operations $0.77 $0.79 $0.34 $0.34 $0.37
Weighted average shares – basic 10,982 10,628 10,516 10,492 10,995
Diluted earnings per common share from continuing operations $0.75 $0.78 $0.34 $0.34 $0.37
Weighted average shares and common share equivalents – diluted 11,226 10,754 10,541 10,537 11,079
Cash dividends paid per common share $0.25 $0.25 $0.25 $0.25 $0.25
December 31,
2004 2003 2002 2001 2000 BALANCE SHEET DATA:
Current assets $102,543 $88,284 $66,189 $75,486 $73,280 Current liabilities 52,913 46,974 32,809 44,925 34,074 Working capital 49,630 41,310 33,380 30,561 39,206 Total assets 156,335 136,736 113,369 124,856 113,307 Short-term borrowings 19,400 16,800 14,200 22,847 10,746Long-term debt 5,000 - - - - Stockholders’ equity 92,938 86,081 78,309 78,061 77,517
Effective September 2002, the Company sold its51% controlling interest in Prestige Italiana, Spa(“Prestige Italy”), and, together with its minorityinterest shareholder, caused PrestigeHaushaltwaren GmbH (“Prestige Germany”, andtogether with Prestige Italy, the “PrestigeCompanies”) to sell all of its receivables andinventory to a European housewares distributor.The results of operations of the PrestigeCompanies through the date of disposal are
reflected as discontinued operations and aretherefore excluded from the selectedconsolidated income statement data presented above.
Certain selling, general and administrativeexpenses have been reclassified to distributionexpenses in 2003, 2002, 2001 and 2000 toconform with the current year’s presentation.
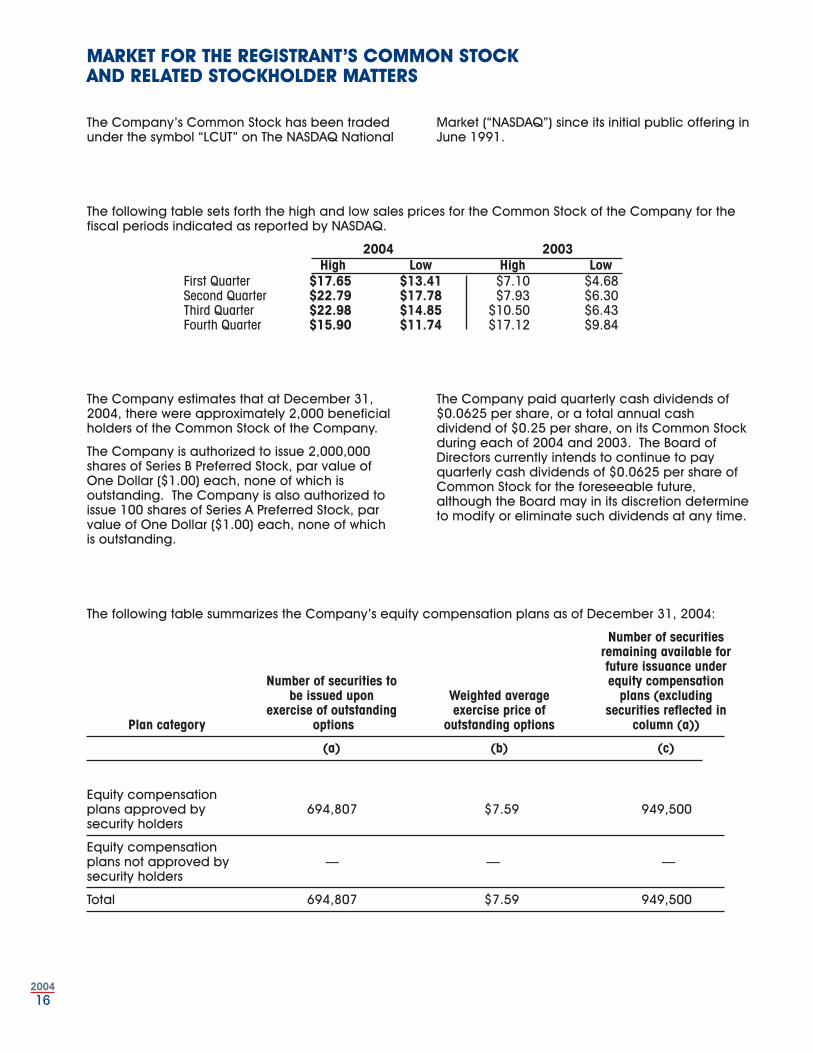
The Company’s Common Stock has been tradedunder the symbol “LCUT” on The NASDAQ National
Market (“NASDAQ”) since its initial public offering inJune 1991.
The following table summarizes the Company’s equity compensation plans as of December 31, 2004:
Number of securitiesremaining available forfuture issuance under
Number of securities to equity compensationbe issued upon Weighted average plans (excluding
exercise of outstanding exercise price of securities reflected inPlan category options outstanding options column (a))
(a) (b) (c)
Equity compensationplans approved by 694,807 $7.59 949,500 security holders
Equity compensationplans not approved by — — — security holders
Total 694,807 $7.59 949,500
The following table sets forth the high and low sales prices for the Common Stock of the Company for thefiscal periods indicated as reported by NASDAQ.
2004 2003 High Low High Low
First Quarter $17.65 $13.41 $7.10 $4.68 Second Quarter $22.79 $17.78 $7.93 $6.30 Third Quarter $22.98 $14.85 $10.50 $6.43 Fourth Quarter $15.90 $11.74 $17.12 $9.84
MARKET FOR THE REGISTRANT’S COMMON STOCK AND RELATED STOCKHOLDER MATTERS
The Company estimates that at December 31,2004, there were approximately 2,000 beneficialholders of the Common Stock of the Company.
The Company is authorized to issue 2,000,000shares of Series B Preferred Stock, par value ofOne Dollar ($1.00) each, none of which isoutstanding. The Company is also authorized toissue 100 shares of Series A Preferred Stock, parvalue of One Dollar ($1.00) each, none of which is outstanding.
The Company paid quarterly cash dividends of$0.0625 per share, or a total annual cashdividend of $0.25 per share, on its Common Stockduring each of 2004 and 2003. The Board ofDirectors currently intends to continue to payquarterly cash dividends of $0.0625 per share ofCommon Stock for the foreseeable future,although the Board may in its discretion determineto modify or eliminate such dividends at any time.
172004
162004
SELECTED FINANCIAL DATA
(in thousands, except per share data)Year Ended December 31,
2004 2003 2002 2001 2000 INCOME STATEMENT DATA:
Net sales $189,458 $160,355 $131,219 $135,068 $121,124 Cost of sales 111,497 92,918 73,145 75,626 70,189Distribution expenses 22,830 21,030 22,255 22,037 16,555Selling, general and administrative expenses 40,282 31,762 28,923 30,427 26,882Income from operations 14,849 14,645 6,896 6,978 7,498 Interest expense 835 724 1,004 1,015 730 Other income, net (60) (68) (66) (98) (82)
Income before income taxes 14,074 13,989 5,958 6,061 6,850 Income taxes 5,602 5,574 2,407 2,449 2,786 Income from continuing operations $8,472 $8,415 $3,551 $3,612 $4,064
Basic earnings per common share from continuing operations $0.77 $0.79 $0.34 $0.34 $0.37
Weighted average shares – basic 10,982 10,628 10,516 10,492 10,995
Diluted earnings per common share from continuing operations $0.75 $0.78 $0.34 $0.34 $0.37
Weighted average shares and common share equivalents – diluted 11,226 10,754 10,541 10,537 11,079
Cash dividends paid per common share $0.25 $0.25 $0.25 $0.25 $0.25
December 31,
2004 2003 2002 2001 2000 BALANCE SHEET DATA:
Current assets $102,543 $88,284 $66,189 $75,486 $73,280 Current liabilities 52,913 46,974 32,809 44,925 34,074 Working capital 49,630 41,310 33,380 30,561 39,206 Total assets 156,335 136,736 113,369 124,856 113,307 Short-term borrowings 19,400 16,800 14,200 22,847 10,746Long-term debt 5,000 - - - - Stockholders’ equity 92,938 86,081 78,309 78,061 77,517
Effective September 2002, the Company sold its51% controlling interest in Prestige Italiana, Spa(“Prestige Italy”), and, together with its minorityinterest shareholder, caused PrestigeHaushaltwaren GmbH (“Prestige Germany”, andtogether with Prestige Italy, the “PrestigeCompanies”) to sell all of its receivables andinventory to a European housewares distributor.The results of operations of the PrestigeCompanies through the date of disposal are
reflected as discontinued operations and aretherefore excluded from the selectedconsolidated income statement data presented above.
Certain selling, general and administrativeexpenses have been reclassified to distributionexpenses in 2003, 2002, 2001 and 2000 toconform with the current year’s presentation.
The Company’s Common Stock has been tradedunder the symbol “LCUT” on The NASDAQ National
Market (“NASDAQ”) since its initial public offering inJune 1991.
The following table summarizes the Company’s equity compensation plans as of December 31, 2004:
Number of securitiesremaining available forfuture issuance under
Number of securities to equity compensationbe issued upon Weighted average plans (excluding
exercise of outstanding exercise price of securities reflected inPlan category options outstanding options column (a))
(a) (b) (c)
Equity compensationplans approved by 694,807 $7.59 949,500 security holders
Equity compensationplans not approved by — — — security holders
Total 694,807 $7.59 949,500
The following table sets forth the high and low sales prices for the Common Stock of the Company for thefiscal periods indicated as reported by NASDAQ.
2004 2003 High Low High Low
First Quarter $17.65 $13.41 $7.10 $4.68 Second Quarter $22.79 $17.78 $7.93 $6.30 Third Quarter $22.98 $14.85 $10.50 $6.43 Fourth Quarter $15.90 $11.74 $17.12 $9.84
MARKET FOR THE REGISTRANT’S COMMON STOCK AND RELATED STOCKHOLDER MATTERS
The Company estimates that at December 31,2004, there were approximately 2,000 beneficialholders of the Common Stock of the Company.
The Company is authorized to issue 2,000,000shares of Series B Preferred Stock, par value ofOne Dollar ($1.00) each, none of which isoutstanding. The Company is also authorized toissue 100 shares of Series A Preferred Stock, parvalue of One Dollar ($1.00) each, none of which is outstanding.
The Company paid quarterly cash dividends of$0.0625 per share, or a total annual cashdividend of $0.25 per share, on its Common Stockduring each of 2004 and 2003. The Board ofDirectors currently intends to continue to payquarterly cash dividends of $0.0625 per share ofCommon Stock for the foreseeable future,although the Board may in its discretion determineto modify or eliminate such dividends at any time.
192004
182004
reported amounts of revenues and expensesduring the reporting period. On an on-goingbasis, management evaluates its estimates andjudgments, including those related to inventories.Management bases its estimates and judgmentson historical experience and on various otherfactors that are believed to be reasonable underthe circumstances, the results of which form thebasis for making judgments about the carryingvalues of assets and liabilities that are not readilyapparent from other sources. Actual results maydiffer from these estimates under differentassumptions or conditions. The Company’saccounting policies are more fully described inNote A of the consolidated financial statements.The Company believes that the followingdiscussion addresses the Company’s most criticalaccounting policies, which are those that aremost important to the portrayal of the Company’sconsolidated financial condition and results ofoperations and require management’s mostdifficult, subjective and complex judgments.
Merchandise inventories, consisting principally offinished goods, are priced under the lower-of-cost(first-in, first-out basis) or market method. Reservesfor excess or obsolete inventory reflected in theCompany’s consolidated balance sheets atDecember 31, 2004 and 2003 are determined tobe adequate by the Company’s management;however, there can be no assurance that thesereserves will prove to be adequate over time toprovide for ultimate losses in connection with theCompany’s inventory. The Company’smanagement periodically reviews and analyzesinventory reserves based on a number of factorsincluding, but not limited to, future productdemand of items and estimated profitability of merchandise.
The Company is required to estimate thecollectibility of its accounts receivable. A
considerable amount of judgment is required inassessing the ultimate realization of thesereceivables including the current credit-worthinessof each customer. The Company maintainsallowances for doubtful accounts for estimatedlosses resulting from the inability of its customers tomake required payments. If the financialconditions of the Company’s customers were todeteriorate, resulting in an impairment of theirability to make payments, additional allowancesmay be required.
Effective January 1, 2002, the Company adoptedStatement of Financial Accounting Standard(“SFAS”) No. 141, “Business Combinations” andSFAS No. 142, “Goodwill and Other IntangibleAssets”. SFAS No. 141 requires all businesscombinations initiated after June 30, 2001 to beaccounted for using the purchase method. UnderSFAS No. 142, goodwill and intangible assets withindefinite lives are no longer amortized but arereviewed at least annually for impairment.Accordingly, the Company ceased amortizinggoodwill effective January 1, 2002. For each ofthe years ended December 31, 2004 andDecember 31, 2003, the Company completed itsassessment. Based upon such reviews, noimpairment to the carrying value of goodwill was identified.
Effective January 1, 2002, the Company adoptedSFAS 144, “Accounting for Impairment or Disposalof Long-Lived Assets”. SFAS 144 requires that along-lived asset shall be tested for impairmentwhenever events or changes in circumstancesindicate that its carrying amount may not berecoverable. For each of the years endedDecember 31, 2004 and December 31, 2003, theCompany completed its assessment. Based uponsuch reviews, no impairment to the carrying valueof any long-lived asset was identified.
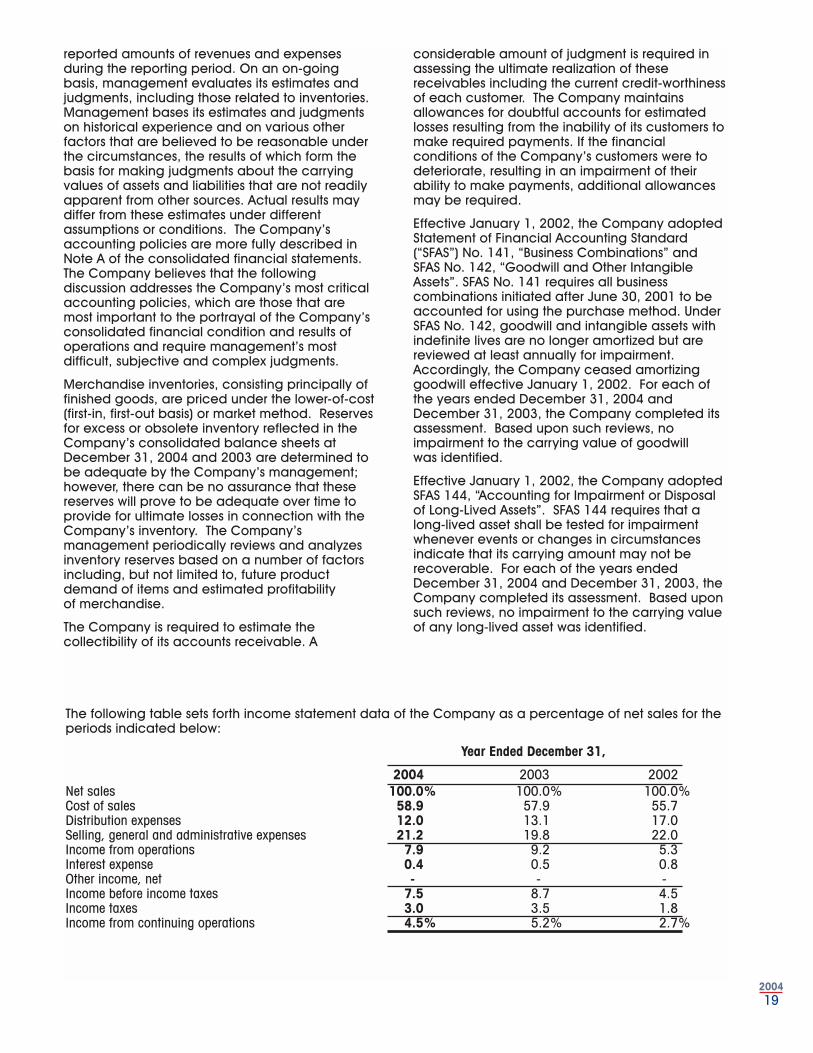
The following table sets forth income statement data of the Company as a percentage of net sales for theperiods indicated below:
Year Ended December 31,
2004 2003 2002 Net sales 100.0% 100.0% 100.0% Cost of sales 58.9 57.9 55.7 Distribution expenses 12.0 13.1 17.0Selling, general and administrative expenses 21.2 19.8 22.0 Income from operations 7.9 9.2 5.3 Interest expense 0.4 0.5 0.8 Other income, net - - -Income before income taxes 7.5 8.7 4.5 Income taxes 3.0 3.5 1.8 Income from continuing operations 4.5% 5.2% 2.7%
RESULTS OF OPERATIONS
General
The following discussion should be read inconjunction with the consolidated financialstatements for the Company and notes theretoincluded elsewhere herein.
OVERVIEWThe Company is a leading designer, developerand marketer of a broad range of brandedconsumer products used in the home, includingKitchenware, Cutlery and Cutting Boards,Bakeware and Cookware, Pantryware and Spices,Tabletop and Bath Accessories. Products aremarketed under brand names includingFarberware®, KitchenAid®, Cuisinart®, Hoffritz®,Sabatier®, DBK™-Daniel Boulud Kitchen, JosephAbboud Environments™, Roshco®, Baker’sAdvantage®, Kamenstein®, CasaModa™, Hoan®,Gemco® and :USE®. The Company uses theFarberware® brand name for kitchenware, cutleryand cutting boards and bakeware pursuant to a200-year royalty-free license. The Companylicenses the KitchenAid®, Cuisinart®, Farberware®
(for flatware and dinnerware), Sabatier®, DBK™-Daniel Boulud Kitchen and Joseph AbboudEnvironments™ trade names pursuant to licensesgranted by the owners of those brands. All otherbrand names listed above are owned. Severalproduct lines are marketed within each of theCompany’s product categories and under brandsprimarily targeting moderate to medium pricepoints, through every major level of trade.
Over the last several years, sales growth has comefrom: (i) expanding product offerings within currentcategories, (ii) developing and acquiring productcategories and (iii) entering new channels ofdistribution, primarily in the United States. Keyfactors in the Company’s growth strategy havebeen, and will continue to be, the selective useand management of strong brands and the abilityto provide a steady stream of new products and designs.
For the year ended December 31, 2004, net saleswere $189.5 million, which represented an 18.1%growth over the previous year. The combined netsales in 2004 for the Gemco®, :USE® and Excelbusinesses that had been acquired during thepast 15 months, were approximately $14.3 millioncompared to $0.6 million in 2003. Excluding theimpact of these acquisitions, net sales for 2004were approximately $175.2 million, a 9.6% growthover 2003. The 9.6% increase in sales wasprimarily attributable to the continuing growth indemand for KitchenAid® branded products andhigher Outlet Store sales, offset by lower sales in
2004 of the Company’s S’mores Maker™. Netsales for the Outlet Stores in 2004 were $15.9million compared to $11.0 million in 2003. Thesales growth for the Outlet Stores was principallyattributable to the Company assumingresponsibility for an additional 20% of the floorspace in each store, effective October 1, 2003.
The Company’s gross profit margin is subject tofluctuation due primarily to product mix and, insome instances, customer mix. In 2004, our grossprofit margin declined as a substantial portion ofour sales growth came from sales of KitchenAid®
branded products, which generate lower marginsdue to the added cost of royalties, and increasedsales of other product lines, including Gemco®
functional glassware and Excel products, thatgenerate lower gross profit margins.
Our operating profit margin declined in 2004 dueto three factors: (i) the $14.3 million in sales for therecently acquired Gemco®, :USE® and Excelbusinesses generated a small operating loss in2004, (ii) the distribution of the Company’sproducts through its outlet stores generated highersales and a larger operating loss in 2004compared to 2003 and (iii)added personnel costsincurred in 2004 to expand the product designgroup, the overseas sourcing department and oursales and marketing departments toaccommodate future growth. In addition, theCompany incurred in excess of $900,000 of directexpenses in 2004 related to Sarbanes-Oxleycompliance work.
The Company’s business and working capitalneeds are highly seasonal, with a significantmajority of sales occurring in the third and fourthquarters. In 2004, 2003 and 2002, net sales for thethird and fourth quarters combined accounted for63%, 66% and 61% of total annual net sales,respectively, and operating profit earned in thethird and fourth quarters combined accounted for92%, 97% and 100% of total annual operatingprofits, respectively. Inventory levels increaseprimarily in the June through October time periodin anticipation of the pre-holiday shipping season.
Critical Accounting Policies and Estimates
Management’s Discussion and Analysis ofFinancial Condition and Results of Operationsdiscusses the Company’s consolidated financialstatements, which have been prepared inaccordance with accounting principles generallyaccepted in the United States. The preparation ofthese financial statements requires managementto make estimates and assumptions that affect thereported amounts of assets and liabilities and thedisclosure of contingent assets and liabilities atthe date of the financial statements and the
MANAGEMENT’S DISCUSSION AND ANALYSIS OF FINANCIAL CONDITIONAND RESULTS OF OPERATIONS
192004
182004
reported amounts of revenues and expensesduring the reporting period. On an on-goingbasis, management evaluates its estimates andjudgments, including those related to inventories.Management bases its estimates and judgmentson historical experience and on various otherfactors that are believed to be reasonable underthe circumstances, the results of which form thebasis for making judgments about the carryingvalues of assets and liabilities that are not readilyapparent from other sources. Actual results maydiffer from these estimates under differentassumptions or conditions. The Company’saccounting policies are more fully described inNote A of the consolidated financial statements.The Company believes that the followingdiscussion addresses the Company’s most criticalaccounting policies, which are those that aremost important to the portrayal of the Company’sconsolidated financial condition and results ofoperations and require management’s mostdifficult, subjective and complex judgments.
Merchandise inventories, consisting principally offinished goods, are priced under the lower-of-cost(first-in, first-out basis) or market method. Reservesfor excess or obsolete inventory reflected in theCompany’s consolidated balance sheets atDecember 31, 2004 and 2003 are determined tobe adequate by the Company’s management;however, there can be no assurance that thesereserves will prove to be adequate over time toprovide for ultimate losses in connection with theCompany’s inventory. The Company’smanagement periodically reviews and analyzesinventory reserves based on a number of factorsincluding, but not limited to, future productdemand of items and estimated profitability of merchandise.
The Company is required to estimate thecollectibility of its accounts receivable. A
considerable amount of judgment is required inassessing the ultimate realization of thesereceivables including the current credit-worthinessof each customer. The Company maintainsallowances for doubtful accounts for estimatedlosses resulting from the inability of its customers tomake required payments. If the financialconditions of the Company’s customers were todeteriorate, resulting in an impairment of theirability to make payments, additional allowancesmay be required.
Effective January 1, 2002, the Company adoptedStatement of Financial Accounting Standard(“SFAS”) No. 141, “Business Combinations” andSFAS No. 142, “Goodwill and Other IntangibleAssets”. SFAS No. 141 requires all businesscombinations initiated after June 30, 2001 to beaccounted for using the purchase method. UnderSFAS No. 142, goodwill and intangible assets withindefinite lives are no longer amortized but arereviewed at least annually for impairment.Accordingly, the Company ceased amortizinggoodwill effective January 1, 2002. For each ofthe years ended December 31, 2004 andDecember 31, 2003, the Company completed itsassessment. Based upon such reviews, noimpairment to the carrying value of goodwill was identified.
Effective January 1, 2002, the Company adoptedSFAS 144, “Accounting for Impairment or Disposalof Long-Lived Assets”. SFAS 144 requires that along-lived asset shall be tested for impairmentwhenever events or changes in circumstancesindicate that its carrying amount may not berecoverable. For each of the years endedDecember 31, 2004 and December 31, 2003, theCompany completed its assessment. Based uponsuch reviews, no impairment to the carrying valueof any long-lived asset was identified.
The following table sets forth income statement data of the Company as a percentage of net sales for theperiods indicated below:
Year Ended December 31,
2004 2003 2002 Net sales 100.0% 100.0% 100.0% Cost of sales 58.9 57.9 55.7 Distribution expenses 12.0 13.1 17.0Selling, general and administrative expenses 21.2 19.8 22.0 Income from operations 7.9 9.2 5.3 Interest expense 0.4 0.5 0.8 Other income, net - - -Income before income taxes 7.5 8.7 4.5 Income taxes 3.0 3.5 1.8 Income from continuing operations 4.5% 5.2% 2.7%
RESULTS OF OPERATIONS
General
The following discussion should be read inconjunction with the consolidated financialstatements for the Company and notes theretoincluded elsewhere herein.
OVERVIEWThe Company is a leading designer, developerand marketer of a broad range of brandedconsumer products used in the home, includingKitchenware, Cutlery and Cutting Boards,Bakeware and Cookware, Pantryware and Spices,Tabletop and Bath Accessories. Products aremarketed under brand names includingFarberware®, KitchenAid®, Cuisinart®, Hoffritz®,Sabatier®, DBK™-Daniel Boulud Kitchen, JosephAbboud Environments™, Roshco®, Baker’sAdvantage®, Kamenstein®, CasaModa™, Hoan®,Gemco® and :USE®. The Company uses theFarberware® brand name for kitchenware, cutleryand cutting boards and bakeware pursuant to a200-year royalty-free license. The Companylicenses the KitchenAid®, Cuisinart®, Farberware®
(for flatware and dinnerware), Sabatier®, DBK™-Daniel Boulud Kitchen and Joseph AbboudEnvironments™ trade names pursuant to licensesgranted by the owners of those brands. All otherbrand names listed above are owned. Severalproduct lines are marketed within each of theCompany’s product categories and under brandsprimarily targeting moderate to medium pricepoints, through every major level of trade.
Over the last several years, sales growth has comefrom: (i) expanding product offerings within currentcategories, (ii) developing and acquiring productcategories and (iii) entering new channels ofdistribution, primarily in the United States. Keyfactors in the Company’s growth strategy havebeen, and will continue to be, the selective useand management of strong brands and the abilityto provide a steady stream of new products and designs.
For the year ended December 31, 2004, net saleswere $189.5 million, which represented an 18.1%growth over the previous year. The combined netsales in 2004 for the Gemco®, :USE® and Excelbusinesses that had been acquired during thepast 15 months, were approximately $14.3 millioncompared to $0.6 million in 2003. Excluding theimpact of these acquisitions, net sales for 2004were approximately $175.2 million, a 9.6% growthover 2003. The 9.6% increase in sales wasprimarily attributable to the continuing growth indemand for KitchenAid® branded products andhigher Outlet Store sales, offset by lower sales in
2004 of the Company’s S’mores Maker™. Netsales for the Outlet Stores in 2004 were $15.9million compared to $11.0 million in 2003. Thesales growth for the Outlet Stores was principallyattributable to the Company assumingresponsibility for an additional 20% of the floorspace in each store, effective October 1, 2003.
The Company’s gross profit margin is subject tofluctuation due primarily to product mix and, insome instances, customer mix. In 2004, our grossprofit margin declined as a substantial portion ofour sales growth came from sales of KitchenAid®
branded products, which generate lower marginsdue to the added cost of royalties, and increasedsales of other product lines, including Gemco®
functional glassware and Excel products, thatgenerate lower gross profit margins.
Our operating profit margin declined in 2004 dueto three factors: (i) the $14.3 million in sales for therecently acquired Gemco®, :USE® and Excelbusinesses generated a small operating loss in2004, (ii) the distribution of the Company’sproducts through its outlet stores generated highersales and a larger operating loss in 2004compared to 2003 and (iii)added personnel costsincurred in 2004 to expand the product designgroup, the overseas sourcing department and oursales and marketing departments toaccommodate future growth. In addition, theCompany incurred in excess of $900,000 of directexpenses in 2004 related to Sarbanes-Oxleycompliance work.
The Company’s business and working capitalneeds are highly seasonal, with a significantmajority of sales occurring in the third and fourthquarters. In 2004, 2003 and 2002, net sales for thethird and fourth quarters combined accounted for63%, 66% and 61% of total annual net sales,respectively, and operating profit earned in thethird and fourth quarters combined accounted for92%, 97% and 100% of total annual operatingprofits, respectively. Inventory levels increaseprimarily in the June through October time periodin anticipation of the pre-holiday shipping season.
Critical Accounting Policies and Estimates
Management’s Discussion and Analysis ofFinancial Condition and Results of Operationsdiscusses the Company’s consolidated financialstatements, which have been prepared inaccordance with accounting principles generallyaccepted in the United States. The preparation ofthese financial statements requires managementto make estimates and assumptions that affect thereported amounts of assets and liabilities and thedisclosure of contingent assets and liabilities atthe date of the financial statements and the
MANAGEMENT’S DISCUSSION AND ANALYSIS OF FINANCIAL CONDITIONAND RESULTS OF OPERATIONS
212004
202004
increase of approximately $19.8 million, or 27.0%more than 2002. Cost of sales as a percentage ofnet sales increased to 57.9% in 2003 from 55.7%in 2002, due primarily to higher sales of licensedbranded products which generate lower marginsdue to the added costs of royalties and a highercost of sales-to-net sales relationship forKamenstein® products in 2003. In addition, theamount of direct import sales increased in 2003.These sales relate to products shipped directlyfrom contract manufacturers to the Company’sretail customers and therefore carry lower grossprofit margins as the pricing of such salesrecognizes that the Company does not incur anywarehousing or distribution costs.
Distribution Expenses
Distribution expenses, which primarily consist ofwarehousing expenses, handling costs of productssold and freight-out expenses, were $21.0 millionfor 2003 as compared to $22.2 million for 2002.These expenses included relocation charges,duplicate rent and other costs associated with theCompany’s move into its Robbinsville, New Jerseydistribution facility amounting to $0.7 million in2003 and $2.2 million in 2002. Excluding thesemoving related costs, distribution expenses were1.2% higher in 2003 as compared to 2002 due tohigher depreciation expense related to capitalexpenditures for the new automated warehousedistribution system and related equipment, offsetby lower payroll costs. As a percentage of netsales, distribution expenses, excluding theaforementioned relocation charges, were 12.7%in 2003 as compared to 15.3% in 2002. Thisimproved relationship reflects the benefits of laborsavings generated by the new systems in ourRobbinsville, New Jersey distribution facility.
Selling, General and Administrative Expenses
Selling, general and administrative expenses for2003 were $31.8 million, an increase of $2.8million, or 9.8%, from 2002. The increase inselling, general and administrative expenses wasprimarily attributable to increased personnelcosts, including planned personnel additions inthe sales and product design departments,increased commission expense related to thehigher sales volume and higher consulting fees.
Interest Expense
Interest expense for 2003 was $0.7 million, adecrease of $0.3 million, or 27.9%, from 2002.The decrease is attributable to a decrease in theaverage level of borrowings outstanding during2003 under the Company’s secured, revolvingcredit facility.
Income Taxes
Income taxes for 2003 were $5.6 million, an
increase of $3.2 million or 131.6%, from 2002. Theincrease in income taxes is directly related to theincrease in income before taxes from 2002 to2003. Income taxes as a percentage of incomebefore taxes remained consistent from year-to-year at approximately 40%.
LIQUIDITY AND CAPITAL RESOURCESThe Company’s principal sources of cash to fundliquidity needs are: (i) cash provided by operatingactivities and (ii) borrowings available under itscredit facility. Its primary uses of funds consist ofcapital expenditures, acquisitions, funding forworking capital increases, payments of principaland interest on its debt and payment of cash dividends.
At December 31, 2004, the Company had cashand cash equivalents of $1.7 million, compared to$1.2 million at December 31, 2003; workingcapital was $49.6 million, compared to $41.3million at December 31, 2003; the current ratiowas 1.94 to 1 compared to 1.88 to 1 at December31, 2003; and borrowings increased to $24.4million at December 31, 2004 compared to $16.8million at December 31, 2003. The increase inworking capital primarily resulted from anincrease in merchandise inventories offset in partby an increase in accounts payable and tradeacceptances and accrued expenses.
Cash provided by operating activities wasapproximately $4.4 million, primarily resulting fromnet income before depreciation, amortization,provisions for losses on accounts receivable andother non-cash charges and increased incometaxes payable offset by increased merchandiseinventories, decreased accounts payable andtrade acceptances and accrued expenses. Cashused in investing activities was approximately $9.9million, which consisted of purchases of propertyand equipment and the cash paid in connectionwith the Excel acquisition. Net cash provided byfinancing activities was approximately $6.0million, primarily as a result of an increase in shortand long-term borrowings and the proceeds fromthe exercise of stock options, offset by cashdividends paid.
Capital expenditures were $2.9 million in 2004and $2.2 million in 2003. Total planned capitalexpenditures for 2005 are estimated at $5.0million. These expenditures are expected to befunded from current operations, cash and cashequivalents and, if necessary, from borrowingsunder the Company’s secured credit facility.
On July 28, 2004, the Company entered into a$50 million five-year, secured credit facility (the“Credit Facility”) with a group of banks and, inconjunction therewith, canceled its $35 millionsecured, reducing revolving credit facility whichwas due to mature in November 2004. Borrowingsunder the Credit Facility are secured by all of the
2004 COMPARED TO 2003
Net Sales
Net sales in 2004 were $189.5 million, an increaseof approximately $29.1 million, or 18.1% higherthan 2003. The combined net sales in 2004 forthe Gemco® and :USE® businesses acquired in thefourth quarter of 2003 and the Excel business thatwas acquired in July 2004, totaled approximately$14.3 million compared to $0.6 million in 2003.The Outlet Stores sales were $15.9 million in 2004compared to $11.0 million in 2003. Excluding thenet sales attributable to the Gemco®, :USE®, andExcel businesses and the Outlet Stores, net salestotaled approximately $159.2 million, a 7.0%increase over 2003’s sales of $148.7 million. Theincrease in sales was primarily attributable toincreased sales of KitchenAid® branded productsin the Company’s kitchenware, bakeware andcutlery product lines and, to a lesser extent,higher sales of its pantryware products. Thesesales increases in 2004 were offset primarily bylower sales of the Company’s S’mores Maker™.Sales of Farberware® and Cuisinart® brandedcutlery and Roshco® branded bakeware alsodeclined in 2004.
The Outlet Stores sales increased to $15.9 millioncompared to $11.0 million in 2003. The OutletStores sales growth was principally attributable tothe Company assuming responsibility for 70% ofthe space in each store, effective October 1,2003, compared to 50% of the space in priorperiods. The Outlet Stores had an operating lossof $1.3 million in 2004, compared to an operatingloss of $1.0 million in 2003.
Cost of Sales
Cost of sales for 2004 was $111.5 million, anincrease of approximately $18.6 million, or 20.0%more than 2003. Cost of sales as a percentage ofnet sales increased to 58.9% in 2004 from 57.9%in 2003, primarily as a result of higher sales ofKitchenAid® branded products which generatelower margins due to the added costs of royaltiesand an increase in sales of other products thatcarry lower gross profit margins, includingGemco® functional glassware products and Excel products.
Distribution Expenses
Distribution expenses, which primarily consist ofwarehousing expenses, handling costs of productssold and freight-out expenses, were $22.8 millionfor 2004 as compared to $21.0 million for 2003.In 2003 these expenses included relocationcharges, duplicate rent and other costsassociated with the Company’s move into itsRobbinsville, New Jersey distribution facilityamounting to $0.7 million. No such expenseswere incurred in 2004. Excluding these movingrelated costs, distribution expenses were 12.3%higher in 2004 as compared to 2003. However, as
a percentage of net sales, distribution expenses,excluding the aforementioned relocationcharges, were 12.0% in 2004 as compared to12.7% in 2003. This improved relationship reflectsprimarily the benefits of labor savings andefficiencies generated by our main distributioncenter in Robbinsville, New Jersey.
Selling, General and Administrative Expenses
Selling, general and administrative expenses for2004 were $40.3 million, an increase of $8.5million, or 26.8%, from 2003. The increase inselling, general and administrative expenses wasprimarily attributable to the following: increasedOutlet Store operating expenses, resulting from theCompany being responsible for 70% of the spaceand expenses of each store for the last threemonths of 2003 and all of 2004 compared to 50%of the space and expenses of each store for thefirst nine months of 2003; additional operatingexpenses of the :USE®, Gemco® and Excelbusinesses recently acquired; the higherpersonnel costs associated with plannedpersonnel increases in the product design group,the overseas sourcing department and sales andmarketing departments and expenses related toSarbanes-Oxley compliance work.
Interest Expense
Interest expense for 2004 was $0.8 million, anincrease of $0.1 million or 15.3%, from 2003.
Income Taxes
Income taxes for each of 2004 and 2003 were$5.6 million. Income taxes as a percentage ofincome before taxes remained consistent fromyear-to-year at approximately 40%.
2003 COMPARED TO 2002
Net Sales
Net sales in 2003 were $160.4 million, an increaseof approximately $29.1 million, or 22.2% higherthan 2002. The increase in sales volume wasattributable primarily to increased shipments ofKitchenAid® branded kitchen tools and gadgetsand bakeware, the Company’s newly designedS’mores Maker™ and Kamenstein®
pantryware products.
The Outlet Stores sales increased to $11.0 millioncompared to $10.3 million in 2002. The OutletStores became responsible for 70% of the spaceand expenses in each store, effective October 1,2003, compared to 50% of the space andexpenses in prior periods. The Outlet Stores hadan operating loss of $1.0 million in 2003,compared to an operating loss of $0.1 million in 2002.
Cost of Sales
Cost of sales for 2003 was $92.9 million, an
232004
222004
FINANCIAL STATEMENTS AND SUPPLEMENTARY DATA
The following is a summary of the unaudited quarterly results of operations for the years ended December31, 2004 and 2003.
(in thousands, except per share data)Three Months Ended
3/31 6/30 9/30 12/31
2004
Net sales $37,129 $33,029 $51,241 $68,059Cost of sales 21,689 19,154 30,553 40,100Net income 345 203 2,584 5,340Basic earnings per common share $0.03 $0.02 $0.23 $0.48Diluted earnings per common share $0.03 $0.02 $0.23 $0.47
2003
Net sales $24,284 $29,950 $44,068 $62,053Cost of sales 13,426 17,003 25,552 36,936Net (loss) income (602) 724 2,887 5,408Basic (loss) earnings per common share ($0.06) $0.07 $0.27 $0.50 Diluted (Ioss) earnings per common share ($0.06) $0.07 $0.27 $0.49
The quarterly results of operations for the periods ended September 30, 2004 and December 31, 2004include the operations of Excel acquired in July 2004.
CHANGES IN AND DISAGREEMENTS WITH ACCOUNTANTS ON ACCOUNTINGAND FINANCIAL DISCLOSURE
None.
assets of the Company. Under the terms of theCredit Facility, the Company is required to satisfycertain financial covenants, including limitationson indebtedness and sale of assets; a minimumfixed charge ratio; a maximum leverage ratio andmaintenance of a minimum net worth. Borrowingsunder the credit facility have different interest rateoptions that are based on an alternate base rate,the LIBOR rate and the lender’s cost of funds rate,plus in each case a margin based on a leverageratio. As of December 31, 2004, the Companyhad outstanding $0.4 million of letters of creditand trade acceptances, $19.4 million of short-term borrowings and a $5.0 million term loanunder its Credit Facility and, as a result, theavailability under the Credit Facility was $25.2million. The $5.0 million long-term loan is non-amortizing, bears interest at 5.07% and matures inAugust 2009. Interest rates on short-termborrowings at December 31, 2004 ranged from3.3125% to 5.25%.
Products are sold to retailers primarily on 30-day
credit terms, and to distributors primarily on 60-day credit terms.
The Company believes that its cash and cashequivalents plus internally generated funds and itscredit arrangements will be sufficient to finance itsoperations for the next twelve months.
The results of operations of the Company for theperiods discussed have not been significantlyaffected by inflation or foreign currencyfluctuations. The Company negotiates all of itspurchase orders with its foreign manufacturers inUnited States dollars. Thus, notwithstanding anyfluctuations in foreign currencies, the Company’scost for a purchase order is generally not subjectto change after the time the order is placed.However, the weakening of the United States dollaragainst local currencies could lead certainmanufacturers to increase their United Statesdollar prices for products. The Company believesit would be able to compensate for any suchprice increase.
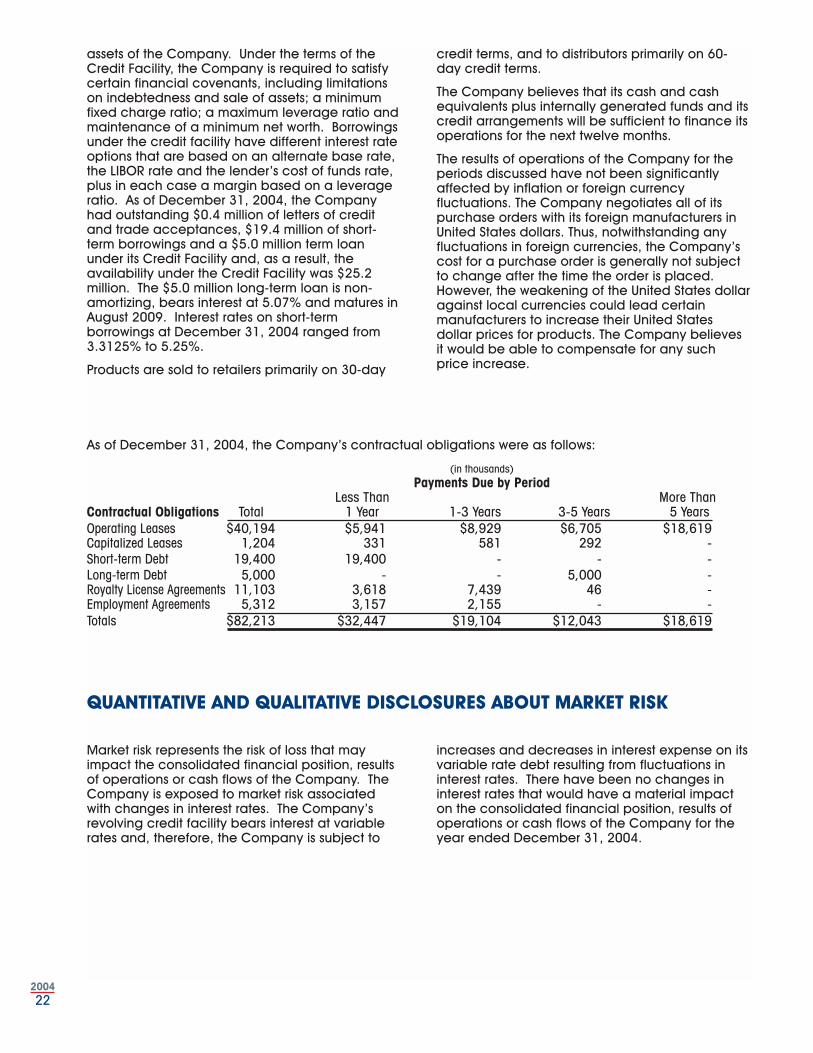
As of December 31, 2004, the Company’s contractual obligations were as follows:
(in thousands)Payments Due by Period
Less Than More ThanContractual Obligations Total 1 Year 1-3 Years 3-5 Years 5 Years Operating Leases $40,194 $5,941 $8,929 $6,705 $18,619 Capitalized Leases 1,204 331 581 292 - Short-term Debt 19,400 19,400 - - - Long-term Debt 5,000 - - 5,000 - Royalty License Agreements 11,103 3,618 7,439 46 - Employment Agreements 5,312 3,157 2,155 - - Totals $82,213 $32,447 $19,104 $12,043 $18,619
QUANTITATIVE AND QUALITATIVE DISCLOSURES ABOUT MARKET RISK
Market risk represents the risk of loss that mayimpact the consolidated financial position, resultsof operations or cash flows of the Company. TheCompany is exposed to market risk associatedwith changes in interest rates. The Company’srevolving credit facility bears interest at variablerates and, therefore, the Company is subject to
increases and decreases in interest expense on itsvariable rate debt resulting from fluctuations ininterest rates. There have been no changes ininterest rates that would have a material impacton the consolidated financial position, results ofoperations or cash flows of the Company for theyear ended December 31, 2004.
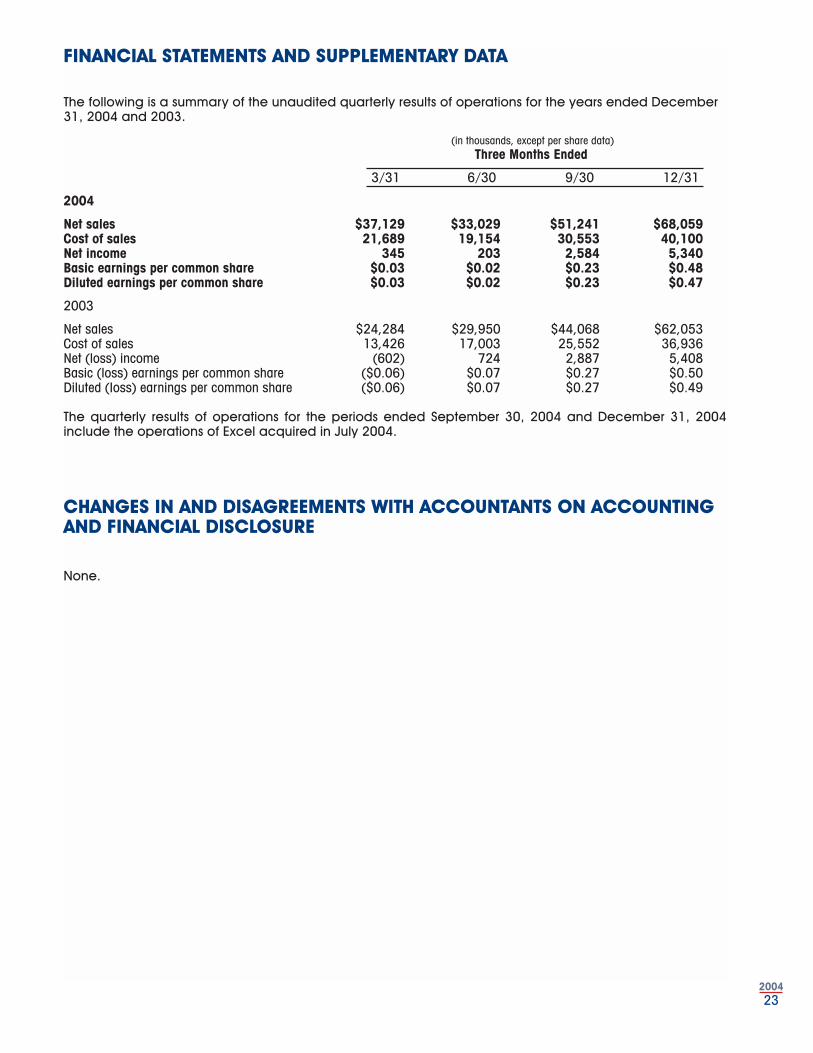
232004
222004
FINANCIAL STATEMENTS AND SUPPLEMENTARY DATA
The following is a summary of the unaudited quarterly results of operations for the years ended December31, 2004 and 2003.
(in thousands, except per share data)Three Months Ended
3/31 6/30 9/30 12/31
2004
Net sales $37,129 $33,029 $51,241 $68,059Cost of sales 21,689 19,154 30,553 40,100Net income 345 203 2,584 5,340Basic earnings per common share $0.03 $0.02 $0.23 $0.48Diluted earnings per common share $0.03 $0.02 $0.23 $0.47
2003
Net sales $24,284 $29,950 $44,068 $62,053Cost of sales 13,426 17,003 25,552 36,936Net (loss) income (602) 724 2,887 5,408Basic (loss) earnings per common share ($0.06) $0.07 $0.27 $0.50 Diluted (Ioss) earnings per common share ($0.06) $0.07 $0.27 $0.49
The quarterly results of operations for the periods ended September 30, 2004 and December 31, 2004include the operations of Excel acquired in July 2004.
CHANGES IN AND DISAGREEMENTS WITH ACCOUNTANTS ON ACCOUNTINGAND FINANCIAL DISCLOSURE
None.
assets of the Company. Under the terms of theCredit Facility, the Company is required to satisfycertain financial covenants, including limitationson indebtedness and sale of assets; a minimumfixed charge ratio; a maximum leverage ratio andmaintenance of a minimum net worth. Borrowingsunder the credit facility have different interest rateoptions that are based on an alternate base rate,the LIBOR rate and the lender’s cost of funds rate,plus in each case a margin based on a leverageratio. As of December 31, 2004, the Companyhad outstanding $0.4 million of letters of creditand trade acceptances, $19.4 million of short-term borrowings and a $5.0 million term loanunder its Credit Facility and, as a result, theavailability under the Credit Facility was $25.2million. The $5.0 million long-term loan is non-amortizing, bears interest at 5.07% and matures inAugust 2009. Interest rates on short-termborrowings at December 31, 2004 ranged from3.3125% to 5.25%.
Products are sold to retailers primarily on 30-day
credit terms, and to distributors primarily on 60-day credit terms.
The Company believes that its cash and cashequivalents plus internally generated funds and itscredit arrangements will be sufficient to finance itsoperations for the next twelve months.
The results of operations of the Company for theperiods discussed have not been significantlyaffected by inflation or foreign currencyfluctuations. The Company negotiates all of itspurchase orders with its foreign manufacturers inUnited States dollars. Thus, notwithstanding anyfluctuations in foreign currencies, the Company’scost for a purchase order is generally not subjectto change after the time the order is placed.However, the weakening of the United States dollaragainst local currencies could lead certainmanufacturers to increase their United Statesdollar prices for products. The Company believesit would be able to compensate for any suchprice increase.
As of December 31, 2004, the Company’s contractual obligations were as follows:
(in thousands)Payments Due by Period
Less Than More ThanContractual Obligations Total 1 Year 1-3 Years 3-5 Years 5 Years Operating Leases $40,194 $5,941 $8,929 $6,705 $18,619 Capitalized Leases 1,204 331 581 292 - Short-term Debt 19,400 19,400 - - - Long-term Debt 5,000 - - 5,000 - Royalty License Agreements 11,103 3,618 7,439 46 - Employment Agreements 5,312 3,157 2,155 - - Totals $82,213 $32,447 $19,104 $12,043 $18,619
QUANTITATIVE AND QUALITATIVE DISCLOSURES ABOUT MARKET RISK
Market risk represents the risk of loss that mayimpact the consolidated financial position, resultsof operations or cash flows of the Company. TheCompany is exposed to market risk associatedwith changes in interest rates. The Company’srevolving credit facility bears interest at variablerates and, therefore, the Company is subject to
increases and decreases in interest expense on itsvariable rate debt resulting from fluctuations ininterest rates. There have been no changes ininterest rates that would have a material impacton the consolidated financial position, results ofoperations or cash flows of the Company for theyear ended December 31, 2004.
252004
242004
REPORT OF INDEPENDENT REGISTERED PUBLIC ACCOUNTING FIRM
To the Board of Directors and Stockholders of Lifetime Hoan Corporation
We have audited the accompanying consolidated balance sheets of Lifetime Hoan Corporation andsubsidiaries (the “Company”) as of December 31, 2004 and 2003 and the related consolidated statementsof income, stockholders’ equity, and cash flows for each of the three years in the period ended December31, 2004. These consolidated financial statements are the responsibility of the Company’s management.Our responsibility is to express an opinion on these consolidated financial statements based on our audits.
We conducted our audits in accordance with the standards of the Public Company Accounting OversightBoard (United States). Those standards require that we plan and perform the audit to obtain reasonableassurance about whether the financial statements are free of material misstatement. An audit includesexamining, on a test basis, evidence supporting the amounts and disclosures in the financial statements.An audit also includes assessing the accounting principles used and significant estimates made bymanagement, as well as evaluating the overall financial statement presentation. We believe that ouraudits provide a reasonable basis for our opinion.
In our opinion, the financial statements referred to above present fairly, in all material respects, theconsolidated financial position of Lifetime Hoan Corporation at December 31, 2004 and 2003, and theconsolidated results of its operations and its cash flows for each of the three years in the period endedDecember 31, 2004, in conformity with accounting principles generally accepted in the United States.
We have also audited, in accordance with the standards of the Public Company Accounting OversightBoard (United States), the effectiveness of the Company’s internal control over financial reporting as ofDecember 31, 2004, based on the criteria established in Internal Control—Integrated Framework issued bythe Committee of Sponsoring Organizations of the Treadway Commission and our report dated March 11,2005, expressed an unqualified opinion thereon.
Melville, New York
March 11, 2005
Management’s Evaluation of Disclosure Controls and ProceduresThe term disclosure controls and procedures is defined in the Securities Exchange Act of 1934, asamended (the “Exchange Act”) or Rules 13a-15(e) and 15d-15(e) of the Securities Exchange Act of 1934,or the Exchange Act. This term refers to the controls and procedures of a company that are designed toensure that information required to be disclosed by the company in the reports that it files under theExchange Act is recorded, processed, summarized and reported within the time periods specified by theSecurities and Exchange Commission. An evaluation was performed under the supervision and with theparticipation of the Company’s management, including its Chief Executive Officer (“CEO”) and ChiefFinancial Officer (“CFO”), of the effectiveness of the Company’s disclosure controls and procedures as ofDecember 31, 2004. Based on that evaluation, the Company’s management, including the CEO andCFO, concluded that the Company’s disclosure controls and procedures were effective as of December31, 2004. During the quarter ended on December 31, 2004, there was no change in the Company’sinternal control over financial reporting that has materially affected, or is reasonably likely to materiallyaffect, the Company’s internal control over financial reporting.
Management’s Report on Internal Control over Financial ReportingManagement of the Company is responsible for establishing and maintaining effective internal controlover financial reporting as defined in Rule 13a-15(f) under the Securities Exchange Act of 1934. TheCompany’s internal control over financial reporting is designed to provide reasonable assuranceregarding the reliability of financial reporting and the preparation of financial statements for externalpurposes in accordance with accounting principles generally accepted in the United States of America.
Because of inherent limitations, internal control over financial reporting may not prevent or detectmisstatements. Therefore, even those systems determined to be effective can provide only reasonableassurance with respect to financial statement preparation and presentation.
As required by Section 404 of the Sarbanes-Oxley Act of 2002, management assessed the effectiveness ofthe Company’s internal control over financial reporting as of December 31, 2004 using the criteria set forthin Internal Control - Integrated Framework issued by the Committee of Sponsoring Organizations of theTreadway Commission (“COSO”). Based on this assessment, management believes that, as of December31, 2004, the Company’s internal control over financial reporting was effective based on those criteria.
During this process the Company identified control opportunities, none of which constituted a materialweakness, and implemented a process to investigate and, as appropriate, remediate such matters. TheCompany is continuing to review, evaluate, document and test our internal control and procedures andmay identify areas where disclosure and additional corrective measures are advisable or required. TheCompany will also look for methods to improve its overall system of controls.
Management’s assessment of the effectiveness of the Company’s internal control over financial reportingas of December 31, 2004, has been audited by Ernst & Young LLP, the independent registered publicaccounting firm who also audited the Company’s consolidated financial statements. Ernst & Young LLP’sattestation report on management’s assessment of the Company’s internal control over financial reportingappears on page 26.
CONTROLS AND PROCEDURES
272004
REPORT OF INDEPENDENT REGISTERED PUBLIC ACCOUNTING FIRM ONINTERNAL CONTROL OVER FINANCIAL REPORTING
To the Board of Directors and Stockholders of Lifetime Hoan Corporation
We have audited management’s assessment, included in the accompanying Report by Management onInternal Control over Financial Reporting, that Lifetime Hoan Corporation maintained effective internalcontrol over financial reporting as of December 31, 2004, based on criteria established in InternalControl—Integrated Framework issued by the Committee of Sponsoring Organizations of the TreadwayCommission (the COSO criteria). Lifetime Hoan Corporation’s management is responsible for maintainingeffective internal control over financial reporting and for its assessment of the effectiveness of internalcontrol over financial reporting. Our responsibility is to express an opinion on management’s assessmentand an opinion on the effectiveness of the company’s internal control over financial reporting based onour audit.
We conducted our audit in accordance with the standards of the Public Company Accounting OversightBoard (United States). Those standards require that we plan and perform the audit to obtain reasonableassurance about whether effective internal control over financial reporting was maintained in all materialrespects. Our audit included obtaining an understanding of internal control over financial reporting,evaluating management’s assessment, testing and evaluating the design and operating effectiveness ofinternal control, and performing such other procedures as we considered necessary in the circumstances.We believe that our audit provides a reasonable basis for our opinion.
A company’s internal control over financial reporting is a process designed to provide reasonableassurance regarding the reliability of financial reporting and the preparation of financial statements forexternal purposes in accordance with generally accepted accounting principles. A company’s internalcontrol over financial reporting includes those policies and procedures that (1) pertain to the maintenanceof records that, in reasonable detail, accurately and fairly reflect the transactions and dispositions of theassets of the company; (2) provide reasonable assurance that transactions are recorded as necessary topermit preparation of financial statements in accordance with generally accepted accounting principles,and that receipts and expenditures of the company are being made only in accordance withauthorizations of management and directors of the company; and (3) provide reasonable assuranceregarding prevention or timely detection of unauthorized acquisition, use, or disposition of the company’sassets that could have a material effect on the financial statements.
Because of its inherent limitations, internal control over financial reporting may not prevent or detectmisstatements. Also, projections of any evaluation of effectiveness to future periods are subject to the riskthat controls may become inadequate because of changes in conditions, or that the degree ofcompliance with the policies or procedures may deteriorate.
In our opinion, management’s assessment that Lifetime Hoan Corporation maintained effective internalcontrol over financial reporting as of December 31, 2004, is fairly stated, in all material respects, based onthe COSO criteria. Also, in our opinion, Lifetime Hoan Corporation maintained, in all material respects,effective internal control over financial reporting as of December 31, 2004, based on the COSO criteria.
We also have audited, in accordance with the standards of the Public Company Accounting OversightBoard (United States), the consolidated balance sheets of Lifetime Hoan Corporation and subsidiaries as ofDecember 31, 2004 and 2003 and the related consolidated statements of income, stockholders’ equity,and cash flows for each of the three years in the period ended December 31, 2004 and our report datedMarch 11, 2005 expressed an unqualified opinion thereon.
Melville, New York
March 11, 2005
262004
CONSOLIDATED BALANCE SHEETS
(in thousands, except share data)December 31,
ASSETS 2004 2003
CURRENT ASSETS
Cash and cash equivalents $1,741 $1,175Accounts receivable, less allowances of $3,477 in 2004
and $3,349 in 2003 34,083 31,977Merchandise inventories 58,934 49,294Prepaid expenses 1,998 2,129Other current assets 5,787 3,709
TOTAL CURRENT ASSETS 102,543 88,284
PROPERTY AND EQUIPMENT, net 20,003 20,563GOODWILL 16,200 16,145OTHER INTANGIBLES, net 15,284 9,530OTHER ASSETS 2,305 2,214
TOTAL ASSETS $156,335 $136,736
LIABILITIES AND STOCKHOLDERS’ EQUITY
CURRENT LIABILITIES
Short-term borrowings $19,400 $16,800Accounts payable and trade acceptances 7,892 8,405Accrued expenses 20,145 17,156Income taxes payable 5,476 4,613
TOTAL CURRENT LIABILITIES 52,913 46,974
DEFERRED RENT & OTHER LONG-TERM LIABILITIES 2,072 1,593DEFERRED INCOME TAX LIABILITIES 3,412 2,088LONG-TERM DEBT 5,000 -
STOCKHOLDERS’ EQUITY
Common stock, $.01 par value, shares authorized: 25,000,000; sharesissued and outstanding: 11,050,349 in 2004 and 10,842,540 in 2003 111 109
Paid-in capital 65,229 63,409Retained earnings 28,077 23,042Notes receivable for shares issued to stockholders (479) (479)
TOTAL STOCKHOLDERS’ EQUITY 92,938 86,081
TOTAL LIABILITIES AND STOCKHOLDERS’ EQUITY $156,335 $136,736
See notes to consolidated financial statements.
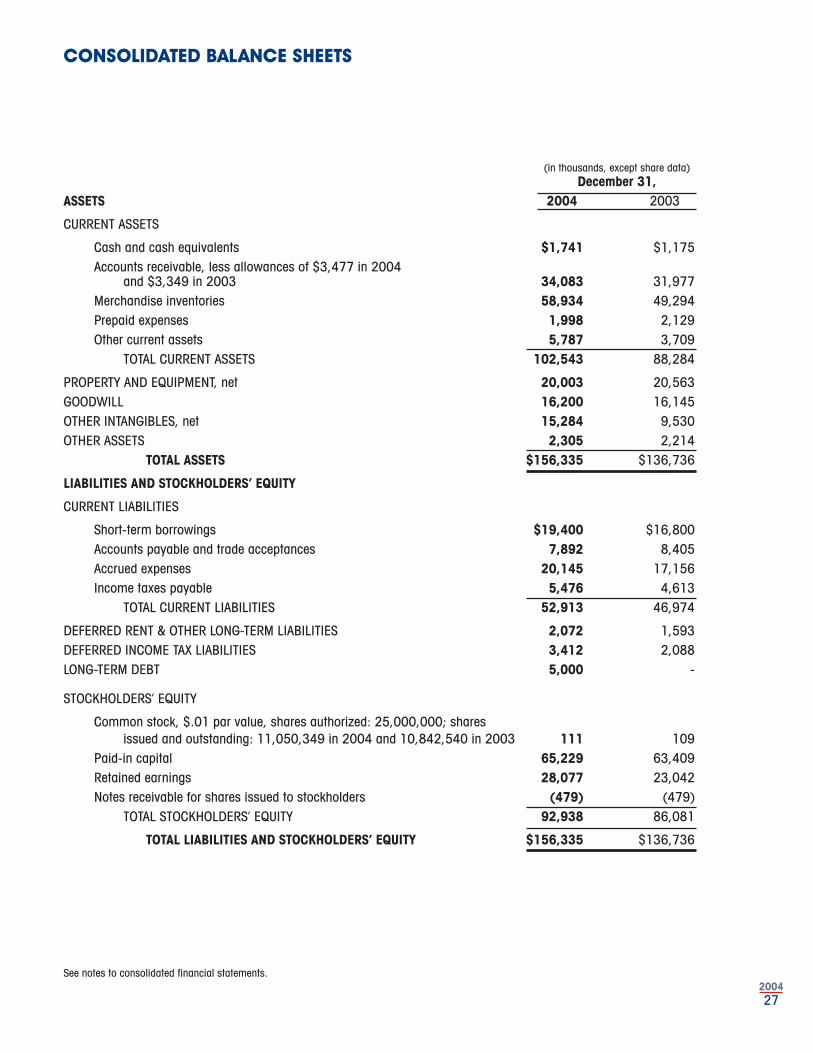
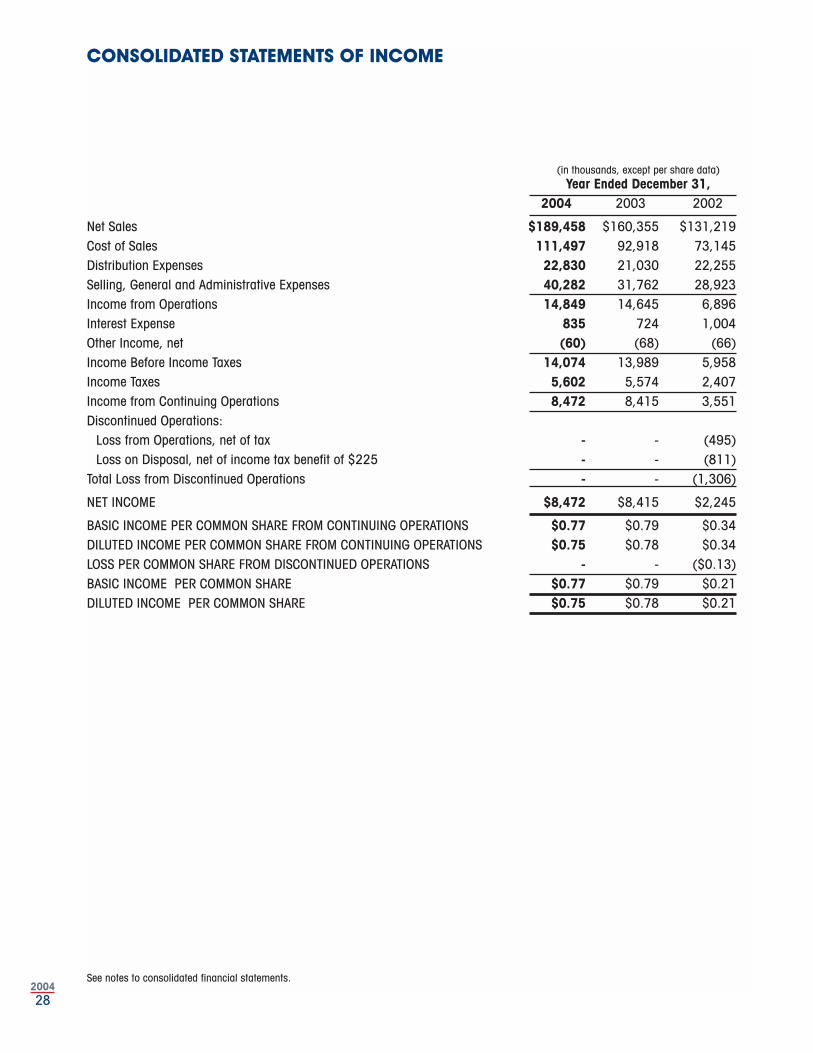
292004
282004
CONSOLIDATED STATEMENTS OF STOCKHOLDERS’ EQUITY
Notes AccumulatedReceivable Other
Common Stock Paid-in Retained From Comprehensive Comprehensive(in thousands) Shares Amount Capital Earnings Stockholders Income (Loss) Total Income
Balance at December 31, 2001 10,491 $105 $61,087 $17,660 ($486) ($305) $78,061
Net income for 2002 2,245 2,245 $2,245Exercise of stock options 70 1 318 319Repayment of notes receivable 7 7Foreign currency translation
adjustment 305 305 305Comprehensive income $2,550 Cash dividends (2,628) (2,628)Balance at December 31, 2002 10,561 106 61,405 17,277 (479) - 78,309
Net income for 2003 8,415 8,415Tax Benefit on Exercise of Stock
Options 302 302Exercise of stock options 282 3 1,702 1,705Cash dividends (2,650) (2,650)Balance at December 31, 2003 10,843 109 63,409 23,042 (479) - 86,081
Net income for 2004 8,472 8,472Tax Benefit on Exercise of
Stock Options 449 449Exercise of stock options 207 2 1,371 1,373Dividends declared (691) (691)Cash dividends (2,746) (2,746) Balance at December 31, 2004 11,050 $111 $65,229 $28,077 ($479) - $92,938
See notes to consolidated financial statements.
CONSOLIDATED STATEMENTS OF INCOME
(in thousands, except per share data)Year Ended December 31,
2004 2003 2002
Net Sales $189,458 $160,355 $131,219Cost of Sales 111,497 92,918 73,145Distribution Expenses 22,830 21,030 22,255Selling, General and Administrative Expenses 40,282 31,762 28,923Income from Operations 14,849 14,645 6,896Interest Expense 835 724 1,004Other Income, net (60) (68) (66)Income Before Income Taxes 14,074 13,989 5,958Income Taxes 5,602 5,574 2,407 Income from Continuing Operations 8,472 8,415 3,551Discontinued Operations:
Loss from Operations, net of tax - - (495)Loss on Disposal, net of income tax benefit of $225 - - (811)
Total Loss from Discontinued Operations - - (1,306)
NET INCOME $8,472 $8,415 $2,245
BASIC INCOME PER COMMON SHARE FROM CONTINUING OPERATIONS $0.77 $0.79 $0.34 DILUTED INCOME PER COMMON SHARE FROM CONTINUING OPERATIONS $0.75 $0.78 $0.34LOSS PER COMMON SHARE FROM DISCONTINUED OPERATIONS - - ($0.13) BASIC INCOME PER COMMON SHARE $0.77 $0.79 $0.21 DILUTED INCOME PER COMMON SHARE $0.75 $0.78 $0.21
See notes to consolidated financial statements.
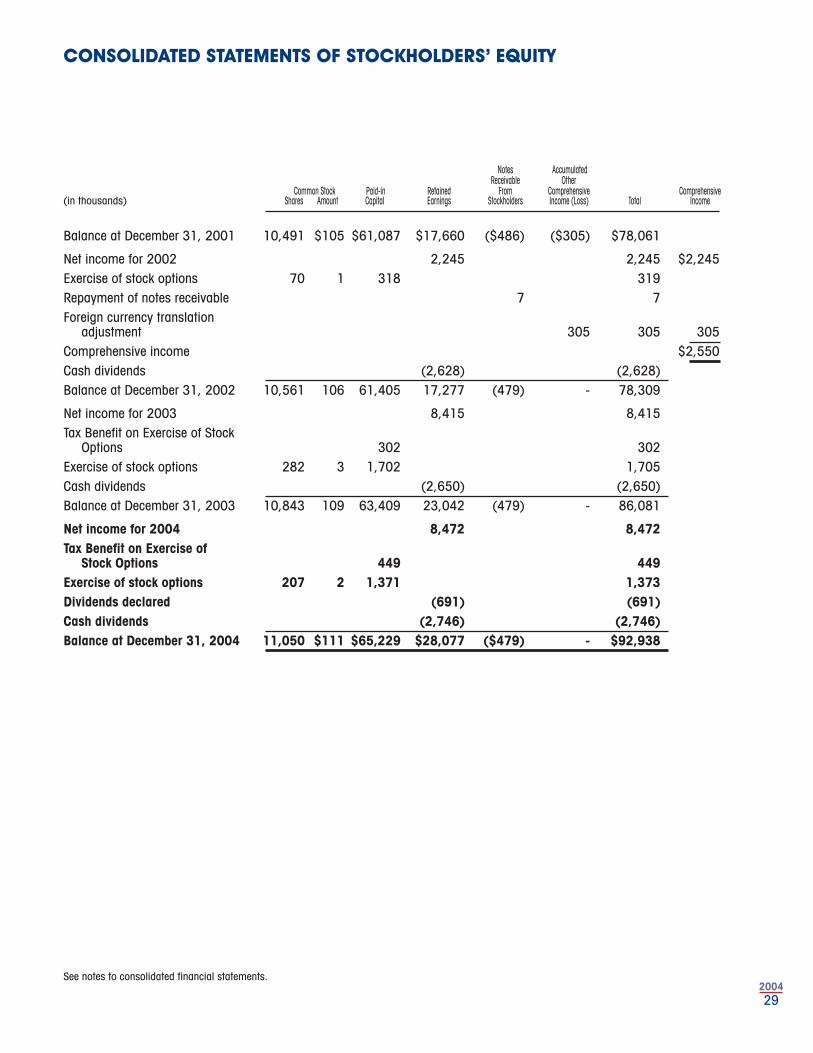

312004
302004
DECEMBER 31, 2004
NOTE A — SIGNIFICANT ACCOUNTINGPOLICIESOrganization and Business: The accompanyingconsolidated financial statements include theaccounts of Lifetime Hoan Corporation (“Lifetime”)and its wholly-owned subsidiaries (collectively the“Company”), Outlet Retail Stores, Inc. (“Outlets”),Roshco®, Inc. (“Roshco®”) and M. Kamenstein®
Corp. (“Kamenstein®”), collectively, the“Company”. Effective September 27, 2002, theCompany sold its 51% owned and controlledsubsidiaries, Prestige Italiana, Spa (“Prestige Italy”)and Prestige Haushaltswaren GmbH (“PrestigeGermany” and, together with Prestige Italy, the“Prestige Companies”). Accordingly, theCompany has classified the Prestige Companiesbusiness as discontinued operations. Significantintercompany accounts and transactions havebeen eliminated in consolidation.
The Company is engaged in the design,marketing and distribution of a broad range ofconsumer products used in the home, includingkitchenware, cutlery and cutting boards,bakeware and cookware, pantryware and spices,tabletop and decorative bath accessories andmarkets its products under a number of tradenames, some of which are licensed. TheCompany sells its products primarily to retailersthroughout the United States.
The Company also operates approximately 60retail outlet stores in 31 states under theFarberware® name. Under an agreement with theMeyer Corporation, Meyer Corporation assumedresponsibility for merchandising and for stockingFarberware® cookware products in the stores,receives all revenue from sales of Farberware®
cookware and since October 31, 2003, occupies30% of the space in each store and reimbursesthe Company for 30% of the operating expensesof the stores. For the periods prior to October 1,2003, Meyer was responsible for 50% of the spacein each store and 50% of the operating expensesof the stores.
The significant accounting policies used in thepreparation of the consolidated financialstatements of the Company are as follows:
Revenue Recognition: Revenue is recognizedwhen goods are shipped and title of ownershiptransfers to the customer. Related freight-out costsare included in distribution expenses andamounted to $3.3 million, $2.7 million and $2.7million for 2004, 2003 and 2002, respectively.
Distribution Expenses: Distribution expensesprimarily consist of warehousing expenses,
handling costs of products sold and freight-out.These expenses include relocation charges,duplicate rent and other costs associated with theCompany’s move into it’s Robbinsville, New Jerseydistribution facility, amounting to $0.7 million and$2.2 million in 2003 and 2002, respectively. Nosuch expenses were incurred in 2004.
Inventories: Merchandise inventories, consistingprincipally of finished goods, are priced at thelower-of-cost (first-in, first-out basis) or marketmethod. Reserves for excess or obsolete inventoryreflected in the Company’s consolidated balancesheets at December 31, 2004 and 2003 areconsidered adequate by the Company’smanagement; however, there can be noassurance that these reserves will prove to beadequate over time to provide for ultimate lossesin connection with the Company’s inventory.
Accounts Receivable: The Company is requiredto estimate the collectibility of its accountsreceivable. A considerable amount of judgment isrequired in assessing the ultimate realization ofthese receivables including the current credit-worthiness of each customer. The Companymaintains allowances for doubtful accounts forestimated losses resulting from the inability of itscustomers to make required payments. If thefinancial conditions of the Company’s customerswere to deteriorate, resulting in an impairment oftheir ability to make payments, additionalallowances may be required.
Property and Equipment: Property andequipment is stated at cost. Property andequipment other than leasehold improvements isbeing depreciated under the straight-line methodover the estimated useful lives of the assets.Buildings and improvements are beingdepreciated over 30 years and machinery,furniture, and equipment over 3 to 10 years.Leasehold improvements are depreciated overthe term of the lease or their estimated useful lives,whichever is shorter.
Cash Equivalents: The Company considers highlyliquid instruments with a maturity of three monthsor less when purchased to be cash equivalents.
Use of Estimates: The preparation of financialstatements in conformity with accountingprinciples generally accepted in the United Statesrequires management to make estimates andassumptions that affect the amounts reported inthe financial statements and accompanyingnotes. Actual results could differ from thoseestimates.
Fair Value of Financial Instruments: The carryingamounts of the Company’s financial instruments,including cash and cash equivalents, accountsreceivable, accounts payable and trade
NOTES TO CONSOLIDATED FINANCIAL STATEMENTSCONSOLIDATED STATEMENTS OF CASH FLOWS
(in thousands)
Year Ended December 31,
2004 2003 2002
OPERATING ACTIVITIES Net income $8,472 $8,415 $2,245Adjustments to reconcile net income to net cash provided by
operating activities: Loss on sale of discontinued operations - - 811Depreciation and amortization 4,074 3,673 3,457Deferred income taxes (100) 105 133Deferred rent and other long-term liabilities 479 539 468Provision for losses on accounts receivable (68) 8 386Reserve for sales returns and allowances 9,942 9,297 7,453Minority interest - - (476)
Changes in operating assets and liabilities, excluding the effects of the sale of the Prestige companies and the acquisitions of Excel, :USE® and Gemco®:
Accounts receivable (10,658) (21,008) (6,880)Merchandise inventories (4,944) (6,960) 1,022Prepaid expenses, other current assets and other assets (595) 177 1,853Accounts payable, trade acceptances and accrued
expenses (3,485) 8,987 (6,122)Income taxes 1,312 2,452 2,463
NET CASH PROVIDED BY OPERATING ACTIVITIES 4,429 5,685 6,813
INVESTING ACTIVITIESPurchases of property and equipment, net (2,911) (2,213) (1,807)Proceeds from disposition of Prestige Companies - - 985Acquisition of Excel (7,000) - - Acquisitions of :USE® and Gemco® - (3,964) -
NET CASH USED IN INVESTING ACTIVITIES (9,911) (6,177) (822)
FINANCING ACTIVITIESProceeds from (payments of) short term borrowings, net 2,600 2,600 (8,647) Proceeds from long-term debt 5,000 - - Proceeds from the exercise of stock options 1,373 1,705 318Repayment of Note Receivable - - 7 Payment of capital lease obligations (179) (50) -Cash dividends paid (2,746) (2,650) (2,628)
NET CASH PROVIDED BY (USED IN) FINANCING ACTIVITIES 6,048 1,605 (10,950)
INCREASE (DECREASE) IN CASH AND CASH EQUIVALENTS 566 1,113 (4,959)Cash and cash equivalents at beginning of year 1,175 62 5,021
CASH AND CASH EQUIVALENTS AT END OF YEAR $1,741 $1,175 $62
See notes to consolidated financial statements.
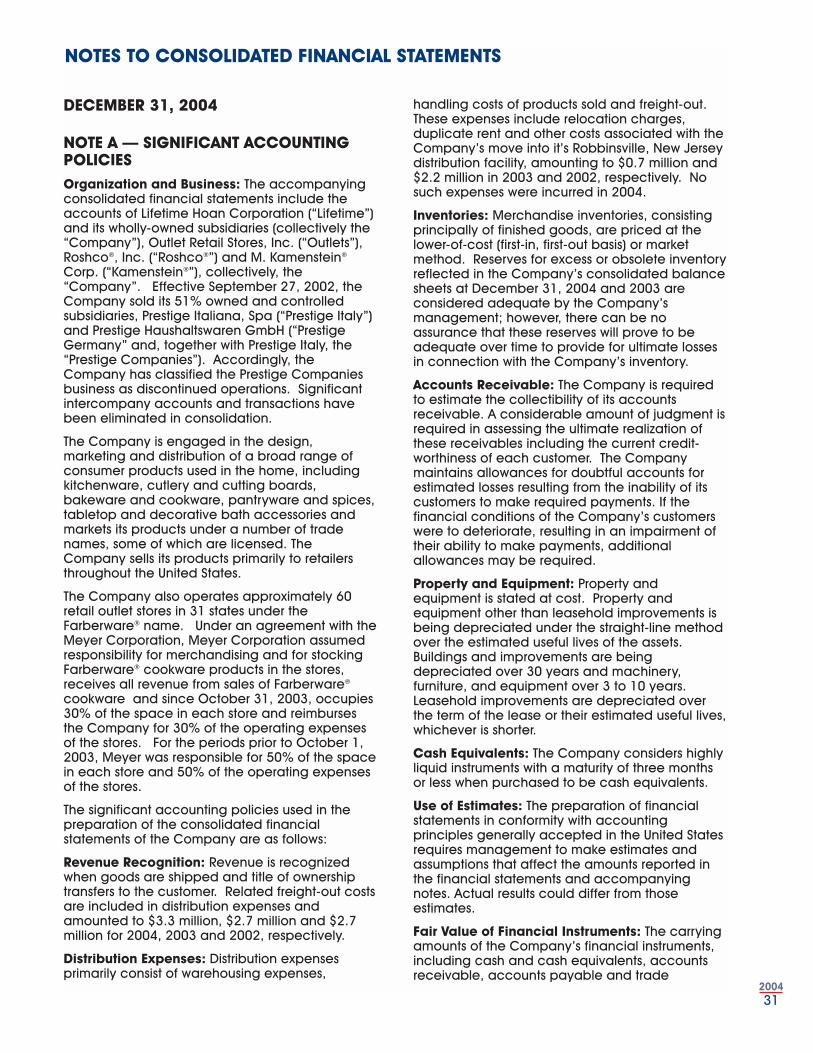
312004
302004
DECEMBER 31, 2004
NOTE A — SIGNIFICANT ACCOUNTINGPOLICIESOrganization and Business: The accompanyingconsolidated financial statements include theaccounts of Lifetime Hoan Corporation (“Lifetime”)and its wholly-owned subsidiaries (collectively the“Company”), Outlet Retail Stores, Inc. (“Outlets”),Roshco®, Inc. (“Roshco®”) and M. Kamenstein®
Corp. (“Kamenstein®”), collectively, the“Company”. Effective September 27, 2002, theCompany sold its 51% owned and controlledsubsidiaries, Prestige Italiana, Spa (“Prestige Italy”)and Prestige Haushaltswaren GmbH (“PrestigeGermany” and, together with Prestige Italy, the“Prestige Companies”). Accordingly, theCompany has classified the Prestige Companiesbusiness as discontinued operations. Significantintercompany accounts and transactions havebeen eliminated in consolidation.
The Company is engaged in the design,marketing and distribution of a broad range ofconsumer products used in the home, includingkitchenware, cutlery and cutting boards,bakeware and cookware, pantryware and spices,tabletop and decorative bath accessories andmarkets its products under a number of tradenames, some of which are licensed. TheCompany sells its products primarily to retailersthroughout the United States.
The Company also operates approximately 60retail outlet stores in 31 states under theFarberware® name. Under an agreement with theMeyer Corporation, Meyer Corporation assumedresponsibility for merchandising and for stockingFarberware® cookware products in the stores,receives all revenue from sales of Farberware®
cookware and since October 31, 2003, occupies30% of the space in each store and reimbursesthe Company for 30% of the operating expensesof the stores. For the periods prior to October 1,2003, Meyer was responsible for 50% of the spacein each store and 50% of the operating expensesof the stores.
The significant accounting policies used in thepreparation of the consolidated financialstatements of the Company are as follows:
Revenue Recognition: Revenue is recognizedwhen goods are shipped and title of ownershiptransfers to the customer. Related freight-out costsare included in distribution expenses andamounted to $3.3 million, $2.7 million and $2.7million for 2004, 2003 and 2002, respectively.
Distribution Expenses: Distribution expensesprimarily consist of warehousing expenses,
handling costs of products sold and freight-out.These expenses include relocation charges,duplicate rent and other costs associated with theCompany’s move into it’s Robbinsville, New Jerseydistribution facility, amounting to $0.7 million and$2.2 million in 2003 and 2002, respectively. Nosuch expenses were incurred in 2004.
Inventories: Merchandise inventories, consistingprincipally of finished goods, are priced at thelower-of-cost (first-in, first-out basis) or marketmethod. Reserves for excess or obsolete inventoryreflected in the Company’s consolidated balancesheets at December 31, 2004 and 2003 areconsidered adequate by the Company’smanagement; however, there can be noassurance that these reserves will prove to beadequate over time to provide for ultimate lossesin connection with the Company’s inventory.
Accounts Receivable: The Company is requiredto estimate the collectibility of its accountsreceivable. A considerable amount of judgment isrequired in assessing the ultimate realization ofthese receivables including the current credit-worthiness of each customer. The Companymaintains allowances for doubtful accounts forestimated losses resulting from the inability of itscustomers to make required payments. If thefinancial conditions of the Company’s customerswere to deteriorate, resulting in an impairment oftheir ability to make payments, additionalallowances may be required.
Property and Equipment: Property andequipment is stated at cost. Property andequipment other than leasehold improvements isbeing depreciated under the straight-line methodover the estimated useful lives of the assets.Buildings and improvements are beingdepreciated over 30 years and machinery,furniture, and equipment over 3 to 10 years.Leasehold improvements are depreciated overthe term of the lease or their estimated useful lives,whichever is shorter.
Cash Equivalents: The Company considers highlyliquid instruments with a maturity of three monthsor less when purchased to be cash equivalents.
Use of Estimates: The preparation of financialstatements in conformity with accountingprinciples generally accepted in the United Statesrequires management to make estimates andassumptions that affect the amounts reported inthe financial statements and accompanyingnotes. Actual results could differ from thoseestimates.
Fair Value of Financial Instruments: The carryingamounts of the Company’s financial instruments,including cash and cash equivalents, accountsreceivable, accounts payable and trade
NOTES TO CONSOLIDATED FINANCIAL STATEMENTSCONSOLIDATED STATEMENTS OF CASH FLOWS
(in thousands)
Year Ended December 31,
2004 2003 2002
OPERATING ACTIVITIES Net income $8,472 $8,415 $2,245Adjustments to reconcile net income to net cash provided by
operating activities: Loss on sale of discontinued operations - - 811Depreciation and amortization 4,074 3,673 3,457Deferred income taxes (100) 105 133Deferred rent and other long-term liabilities 479 539 468Provision for losses on accounts receivable (68) 8 386Reserve for sales returns and allowances 9,942 9,297 7,453Minority interest - - (476)
Changes in operating assets and liabilities, excluding the effects of the sale of the Prestige companies and the acquisitions of Excel, :USE® and Gemco®:
Accounts receivable (10,658) (21,008) (6,880)Merchandise inventories (4,944) (6,960) 1,022Prepaid expenses, other current assets and other assets (595) 177 1,853Accounts payable, trade acceptances and accrued
expenses (3,485) 8,987 (6,122)Income taxes 1,312 2,452 2,463
NET CASH PROVIDED BY OPERATING ACTIVITIES 4,429 5,685 6,813
INVESTING ACTIVITIESPurchases of property and equipment, net (2,911) (2,213) (1,807)Proceeds from disposition of Prestige Companies - - 985Acquisition of Excel (7,000) - - Acquisitions of :USE® and Gemco® - (3,964) -
NET CASH USED IN INVESTING ACTIVITIES (9,911) (6,177) (822)
FINANCING ACTIVITIESProceeds from (payments of) short term borrowings, net 2,600 2,600 (8,647) Proceeds from long-term debt 5,000 - - Proceeds from the exercise of stock options 1,373 1,705 318Repayment of Note Receivable - - 7 Payment of capital lease obligations (179) (50) -Cash dividends paid (2,746) (2,650) (2,628)
NET CASH PROVIDED BY (USED IN) FINANCING ACTIVITIES 6,048 1,605 (10,950)
INCREASE (DECREASE) IN CASH AND CASH EQUIVALENTS 566 1,113 (4,959)Cash and cash equivalents at beginning of year 1,175 62 5,021
CASH AND CASH EQUIVALENTS AT END OF YEAR $1,741 $1,175 $62
See notes to consolidated financial statements.
332004
322004
The weighted average fair values of optionsgranted during the years ended December 31,2004, 2003 and 2002 were $5.90, $2.57 and$0.16, respectively. The fair values for theseoptions was estimated at the date of grant using aBlack-Scholes option pricing model with thefollowing weighted-average assumptions: risk-freeinterest rates of 3.73%, 3.37% and 3.47% for 2004,2003 and 2002, respectively; 1.55% dividendyield in 2004, 2.53% dividend yield in 2003 and4.33% dividend yield in 2002; volatility factor ofthe expected market price of the Company’scommon stock of 0.37 in 2004, 0.41 in 2003 and0.06 in 2002; and a weighted-average expectedlife of the options of 6.0, 6.0 and 6.0 years in2004, 2003 and 2002, respectively.
The Black-Scholes option valuation model wasdeveloped for use in estimating the fair value oftraded options, which have no vesting restrictionsand are fully transferable. In addition, optionvaluation models require the input of highlysubjective assumptions including the expectedstock price volatility. Because the Company’semployee stock options have characteristicssignificantly different from those of traded options,and because changes in the subjective inputassumptions can materially affect the fair valueestimates, in management’s opinion, the existingmodels do not necessarily provide a reliablesingle measure of the fair values of its employeestock options.
New Accounting Pronouncements: In December2004, the FASB issued Statement of Financial
Accounting Standards No. 123R, Share-BasedPayment, an amendment of FASB Statement No.123 (“SFAS No. 123R”). SFAS No. 123R addressesthe accounting for transactions in which anenterprise exchanges its valuable equityinstruments for employee services. It alsoaddresses transactions in which an enterpriseincurs liabilities that are based on the fair valuesof the enterprise’s equity instruments or that maybe settled by the issuance of those equityinstruments in exchange for employee services.For public entities, the cost of employee servicesreceived in exchange for equity instruments,including employee stock options, would bemeasured based on the grant-date fair value ofthose instruments. That cost would be recognizedas compensation expense over the requisiteservice period (often the vesting period).Generally, no compensation cost would berecognized for equity instruments that do not vest.
SFAS No. 123R is effective for periods beginningafter June 15, 2005. SFAS No. 123R will apply toawards granted, modified, or settled in cash on orafter that date. Companies may choose from oneof three methods when transitioning to the newstandard, which may include restatement of priorannual and interim periods. The impact on EPS ofexpensing stock options will be dependent uponthe method to be used for valuation of stockoptions and the transition method determined bythe Company. The total impact on an annualizedbasis could range from approximately $0.01 to$0.02 per share-diluted, assuming option grantscontinue at the same level as in 2004.
The following table illustrates the effect on net income and earnings per share if the Company hadapplied the fair value recognition provisions of Statement of Financial Accounting Standards (“SFAS”) No.123, ”Accounting for Stock-Based Compensation” to stock-based employee compensation.
Year ended December 31, (in thousands, except per share data)
2004 2003 2002
Net income, as reported $8,472 $8,415 $2,245
Deduct: Total stock option employee compensation expense determined under fair value based method for all awards, net of related tax effects (179) (196) (156)
Pro forma net income $8,293 $8,219 $2,089
Earnings per share:
Basic – as reported $0.77 $0.79 $0.21
Basic – pro forma $0.76 $0.77 $0.20
Diluted – as reported $0.75 $0.78 $0.21
Diluted – pro forma $0.74 $0.76 $0.20
acceptances approximate their fair valuesbecause of the short-term nature of these items.The carrying value of short-term borrowingsoutstanding under the Company’s revolving creditfacility approximate fair value as such borrowingsbear interest at variable market rates. Thecarrying value of long-term debt outstandingunder the Company’s revolving credit facilityapproximates fair value of such debt and bearsinterest at the current market rate of 5.07%.
Goodwill and Other Intangible Assets: EffectiveJanuary 1, 2002, the Company adoptedStatement of Financial Accounting Standard(“SFAS”) No. 141, “Business Combinations” andSFAS No. 142, “Goodwill and Other IntangibleAssets”. SFAS No. 141 requires all businesscombinations initiated after June 30, 2001 to beaccounted for using the purchase method. UnderSFAS No. 142, goodwill and intangible assets withindefinite lives are no longer amortized but arereviewed at least annually for impairment. TheCompany ceased amortizing goodwill effectiveJanuary 1, 2002. The Company completed itsannual assessment of goodwill impairment in thefourth quarters of 2004 and 2003. Based uponsuch reviews, no impairment to the carrying valueof goodwill was identified in either period.
Other intangibles consist of licenses, trademarks /trade names, customer relationships and productdesigns acquired pursuant to four acquisitionsand are being amortized by the straight-linemethod over periods ranging from 4 to 40 years.The remaining weighted-average amortizationperiod for such intangibles is approximately 28years. Accumulated amortization at December31, 2004 and 2003 was $3.7 million and $3.1million, respectively. Amortization expense withrespect to these intangible assets for each of fivesucceeding fiscal years is estimated to be asfollows: 2005 - $677,000; 2006 - $677,000; 2007 -$677,000; 2008 - $665,000; 2009 - $615,000.
Amortization expense for the years endedDecember 31, 2004, December 31, 2003 andDecember 31, 2002 was $602,000, $410,000 and$390,000, respectively.
Long-Lived Assets: The Company periodicallyreviews the carrying value of intangibles and
other long-lived assets for recoverability orwhenever events or changes in circumstancesindicate that such amounts have been impaired.Impairment indicators include, among otherconditions, cash flow deficits, an historic oranticipated decline in revenue or operating profitand a material decrease in the fair value of someor all of the Company’s long-lived assets. Whenindicators are present, the Company comparesthe carrying value of the asset to the estimatedundiscounted future cash flows expected to begenerated from the use of the asset. If theseestimated future cash flows are less than thecarrying value of the asset, the Companyrecognizes impairment to the extent the carryingvalue of the asset exceeds its fair value. Such areview has been performed by management anddoes not indicate an impairment of such assets.
Income Taxes: Income taxes have been providedusing the liability method. Deferred income taxeshave been provided to reflect the net tax effectsof temporary differences between the carryingamount of assets and liabilities for financialreporting purposes and the amounts used forincome tax purposes.
Earnings Per Share: Basic earnings per sharehave been computed by dividing net income bythe weighted average number of common sharesoutstanding of 10,982,000 in 2004, 10,628,000 in2003 and 10,516,000 in 2002. Diluted earningsper share have been computed by dividing netincome by the weighted average number ofcommon shares outstanding, including the dilutiveeffects of stock options, of 11,226,000 in 2004,10,754,000 in 2003 and 10,541,000 in 2002.
Accounting for Stock Option Plan: At December31, 2004, the Company had a stock option plan,which is more fully described in Note D. TheCompany accounts for the plan under therecognition and measurement principles of APBOpinion No. 25, “Accounting for Stock Issued toEmployees”, and related Interpretations. Nostock-based employee compensation cost isreflected in net income, as all options grantedunder those plans had an exercise price equal tothe market values of the underlying commonstock on the date of grant.
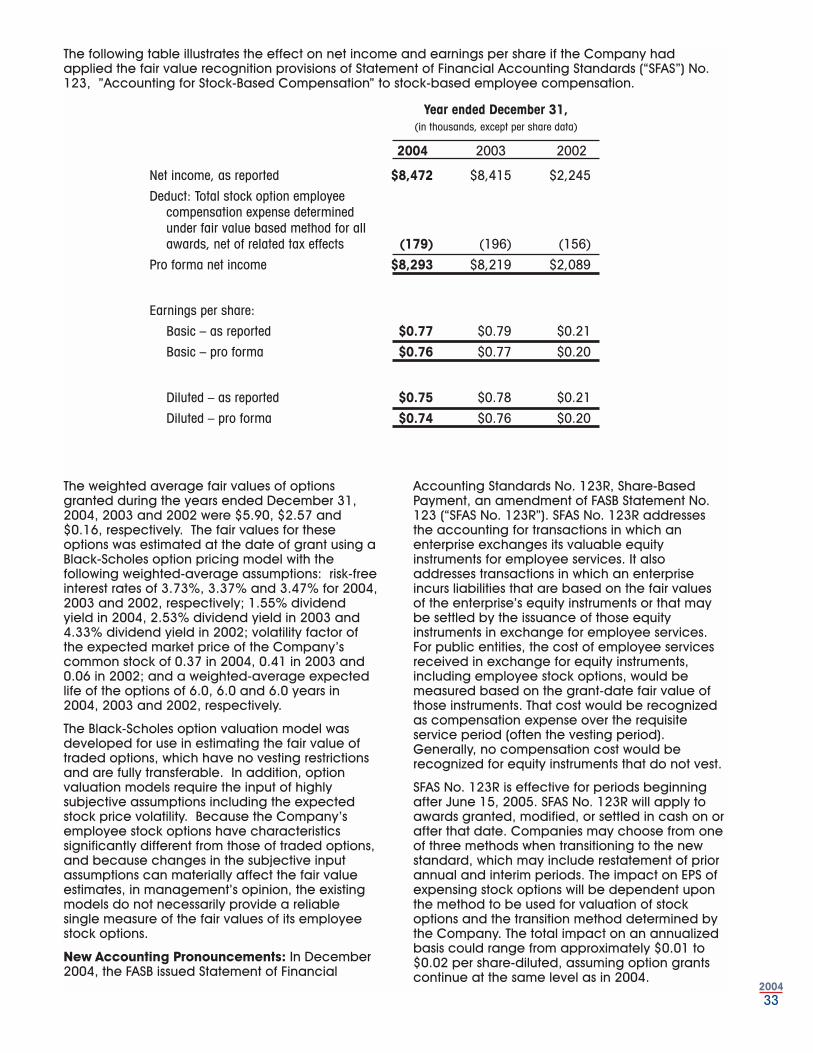
352004
342004
KitchenAid® License Agreement: On September24, 2000, the Company entered into a licenseagreement with Whirlpool Corporation. Thisagreement allows the Company to design,manufacture and market an extensive range ofkitchen utensils, barbecue items and pantrywareproducts under the KitchenAid® brand name. OnJanuary 1, 2002, the license agreement wasamended, expanding the covered products toinclude bakeware and baking related products ascovered products. A second amendment to thelicense agreement was entered into effectiveAugust 1, 2003, which extended the term of thelicense through December 31, 2007 and furtherexpanded the covered products to includekitchen cutlery. Shipments of products by theCompany under the agreement KitchenAid®
name began in the second quarter of 2001.
Cuisinart® License Agreement: On March 19,2002, the Company entered into a licenseagreement with Conair Corporation. Thisagreement allows the Company to design,manufacture and market a wide variety of cutleryproducts under the Cuisinart® brand name.Shipments of products under the Cuisinart® namebegan in the fourth quarter of 2002. On April 8,2004, the license agreement was amended,expanding the covered products to includecutting boards.
NOTE C —CREDIT FACILITIESOn July 28, 2004, the Company entered into a$50 million five-year, secured credit facility (the“Credit Facility”) with a group of banks and, inconjunction therewith, canceled its $35 millionsecured, reducing revolving credit facility whichwas due to mature in November 2004. Borrowingsunder the Credit Facility are secured by all of theassets of the Company. Under the terms of theCredit Facility, the Company is required to satisfycertain financial covenants, including limitationson indebtedness and sale of assets; a minimumfixed charge ratio; a maximum leverage ratio;and maintenance of a minimum net worth.Borrowings under the credit facility have differentinterest rate options that are based on analternate base rate, the LIBOR rate and thelender’s cost of funds rate, plus in each case amargin based on a leverage ratio. As ofDecember 31, 2004, the Company hadoutstanding $0.4 million of letters of credit andtrade acceptances, $19.4 million of short-termborrowings and a $5.0 million term loan under itsCredit Facility and, as a result, the availabilityunder the Credit Facility was $25.2 million. The$5.0 million long-term loan is non-amortizing,bears interest at 5.07% and matures in August2009. Interest rates on short-term borrowings atDecember 31, 2004 ranged from 3.3125% to5.25%. The weighted-average interest rate onshort-term borrowings was 3.857% and 3.502% atDecember 31, 2004 and December 31, 2003,respectively.
The Company paid interest of approximately $0.8million, $0.7 million and $1.0 million during theyears ended December 31, 2004, 2003 and 2002,respectively.
NOTE D — CAPITAL STOCKCash Dividends: The Company paid regularquarterly cash dividends of $0.0625 per share onits Common Stock, or a total annual cashdividend of $0.25 per share, in each of 2004,2003 and 2002. The Board of Directors currentlyintends to maintain a quarterly cash dividend of$0.0625 per share of Common Stock for theforeseeable future, although the Board may in itsdiscretion determine to modify or eliminate suchdividend at any time.
Common Stock Repurchase and Retirement:During the years ended December 31, 1999 and2000, the Board of Directors of the Companyauthorized the repurchase of up to 3,000,000shares of the outstanding Common Stock in theopen market. Through December 31, 2004,2,128,000 shares had been repurchased forapproximately $15.2 million (none wererepurchased in 2004, 2003 and 2002).
Preferred Stock: The Company is authorized toissue 2,000,000 shares of Series B Preferred Stock,par value of One Dollar ($1.00) each, none ofwhich is outstanding. The Company is alsoauthorized to issue 100 shares of Series A PreferredStock, par value of One Dollar ($1.00) each, noneof which is outstanding.
Stock Option Plans: In June 2000, thestockholders of the Company approved the 2000Long-Term Incentive Plan (the “Plan”), whichreplaced all other Company stock option plans,whereby options to purchase up to 1,750,000shares of Common Stock may be granted in theform of stock options or other equity-basedawards to directors, officers, employees,consultants and service providers to the Companyand its affiliates. The Plan authorizes the Board ofDirectors of the Company to issue incentive stockoptions as defined in Section 422 of the InternalRevenue Code, stock options that do not conformto the requirements of that Section of the Codeand other stock based awards. Options that havebeen granted under the plan expire over a rangeof ten years from the date of the grant and vestover a range of up to five years, from the date ofgrant.
As of December 31, 2004, approximately 949,500shares were available for grant under the Planand all options granted through December 31,2004 under the Plan have exercise prices equal tothe market value of the Company’s stock on thedate of grant.
Reclassifications: Certain selling, general andadministrative expenses have been reclassified todistribution expenses in 2003 and 2002 to conformwith the current presentation.
NOTE B — ACQUISITIONS, DISPOSALSAND LICENSESPrestige Acquisition and Disposition: InSeptember 1999, the Company acquired 51% ofthe capital stock and controlling interest in eachof Prestige Italiana, Spa (“Prestige Italy”) andPrestige Haushaltswaren GmbH (“PrestigeGermany” and, together with Prestige Italy, the“Prestige Companies”). The Company paidapproximately $1.3 million for its majority interestsin the Prestige Companies. This acquisition wasaccounted for using the purchase method andthe Company recorded goodwill of $586,000.Effective September 27, 2002, the Company soldits 51% controlling interest in Prestige Italy and,together with its minority interest shareholder,caused Prestige Germany to sell all of itsreceivables and inventory to a Europeanhousewares distributor. As a result the Companyreceived approximately $1.0 million in cash onOctober 21, 2002. The sale resulted in a net lossof approximately $811,000 that includes the write-off of goodwill of approximately $540,000.Accordingly, the Company has classified thePrestige Companies business as discontinuedoperations.
Gemco® Acquisition: In November 2003, theCompany acquired the assets of Gemco® Ware,Inc. (“Gemco®”), a distributor of functionalglassware products for storing and dispensingfood and condiments. The results of operations ofGemco® are included in the Company’sconsolidated statements of income from the dateof acquisition. This acquisition enabled theCompany to broaden its kitchenware productlines to include functional glassware.
:USE® Acquisition: In October 2003, the Companyacquired the business and certain assets of the:USE® – Tools for Civilization Division of DX DesignExpress, Inc., which was a company focused oncreating contemporary lifestyle products for thehome, including decorative hardware, mirrors andlighting for the bath, as well as decorative windowaccessories. This acquisition enabled theCompany to expand its product offering toinclude bath accessories. The results ofoperations of :USE® are included in the Company’sconsolidated statements of income from the dateof acquisition.
In connection with the Gemco® and :USE®
acquisitions, the total of the purchase prices paidin cash, including associated expenses,amounted to approximately $4.0 million. Inconnection with the :USE® acquisition theCompany is also required to pay minimum
contingent consideration of $300,000 ($100,000in each of the years 2004 – 2006) based upon apercentage of net sales of the :USE® product lineup to a maximum of $1,500,000 ($500,000 ineach of the years 2004 – 2006). The acquisitionswere accounted for under the purchase methodand, accordingly, acquired assets and liabilitiesare recorded at their fair values. The allocations ofthe purchase prices of the acquired businessesresulted in the following condensed balance ofassets being acquired (in thousands):
Purchase PriceAllocation
Accounts receivable $1,131Merchandise Inventories 944Other intangibles 940Goodwill 1,248Total assets acquired $4,263
In July 2004, the Company acquired the businessand certain assets of Excel Importing Corp.,(“Excel”), a wholly-owned subsidiary ofMickelberry Communications Incorporated. Excelmarketed and distributed a diversified line of highquality cutlery, tabletop, cookware and barwareproducts under well-recognized premium brandnames, including Sabatier®, Farberware®,Retroneu® Design Studio®, Joseph AbboudEnvironments™, DBK™-Daniel Boulud Kitchen andLegnoart®. The Excel acquisition provided qualitybrand names that the Company can use tomarket many of its existing product lines andadded tabletop product categories to theCompany’s current product lines. The purchaseprice, subject to post closing adjustments, wasapproximately $8.5 million, of which $7.0 millionwas paid in cash at the closing. The Companyhas not paid the balance of $1.5 million since itbelieves the total estimated post closing inventoryadjustments and certain indemnification claimsare in excess of that amount.
The Company has not yet determined either theamount or the allocation of the purchase price forthe Excel acquisition since the calculation of postclosing adjustments has not yet been finalized.The acquisition was accounted for under thepurchase method and, accordingly, acquiredassets and liabilities are recorded at their fairvalues. Preliminary the $7.0 million of thepurchase price paid at closing has beenallocated based on management’s estimates asfollows (in thousands):
PreliminaryPurchase Price
AllocationAccounts receivable $1,300Merchandise Inventories 4,800Current Liabilities (5,400)License Intangibles 6,300Total assets acquired $7,000
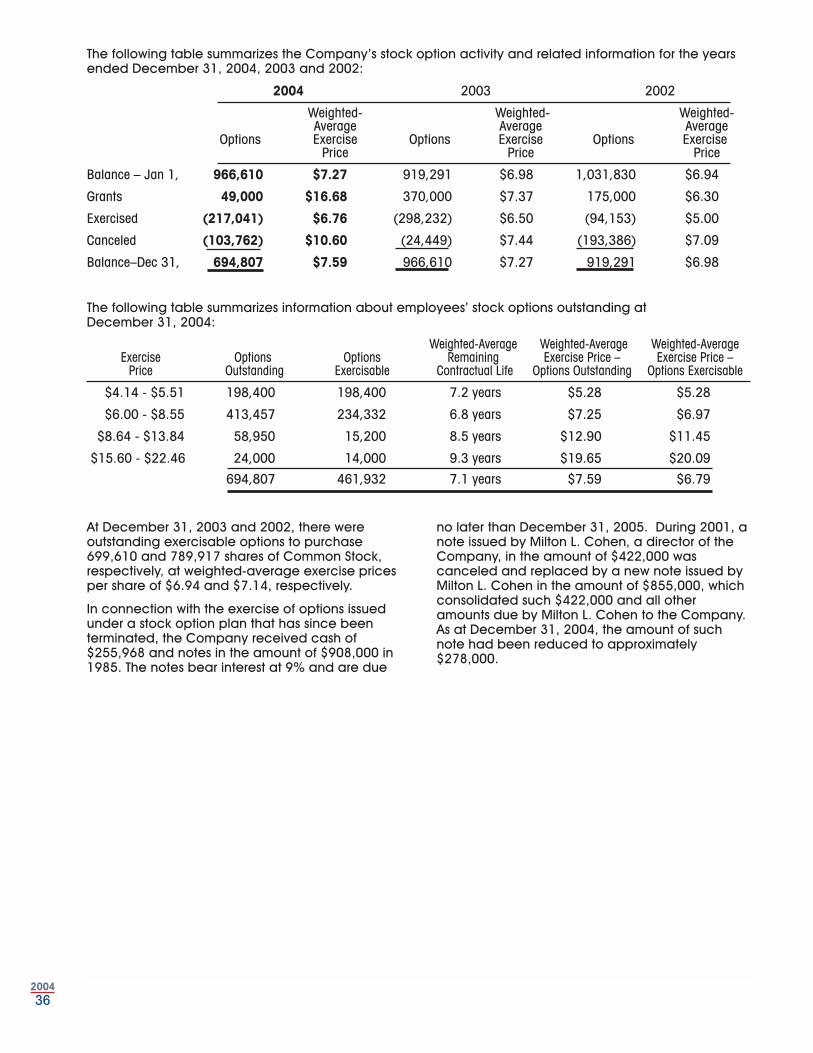
372004
362004
NOTE E — INCOME TAXES
Pre-tax income from continuing operations for theyears ended December 31, 2004, 2003 and 2002
was $14.1 million, $14.0 million and $6.0 million,respectively.
The Company paid income taxes ofapproximately $4.2 million and $3.1 million duringthe years ended 2004 and 2003, respectively.The Company received income tax refunds (net ofpayments) of approximately $328,000 during theyear ended December 2002.
The Company and its subsidiaries’ income taxreturns are routinely examined by various taxauthorities. In management’s opinion, adequateprovision for income taxes has been made for allopen years in accordance with SFAS No. 5,“Accounting for Contingencies”.
The provision for income taxes consists of the following (in thousands):
Year Ended December 31, 2004 2003 2002
Current:
Federal $4,861 $4,451 $2,035
State and local 841 1,018 239
Deferred (100) 105 133Income tax provision $5,602 $5,574 $2,407
Deferred income taxes reflect the net tax effectsof temporary differences between the carryingamount of assets and liabilities for financial
reporting purposes and the amounts used forincome tax purposes.
The provisions for income taxes differs from the amounts computed by applying the applicable federalstatutory rates as follows (in thousands):
Year Ended December 31, 2004 2003 2002
Provision for Federal income taxes at the statutory rate $4,926 $4,896 $2,026
Increases (decreases):
State and local income taxes,net of Federal income tax benefit 547 662 158
Other 129 16 223
Provision for income taxes $5,602 $5,574 $2,407
Significant components of the Company’s net deferred tax assets (liabilities) are as follows (in thousands):
December 31, 2004 2003
Merchandise inventories $1,174 $1,122
Accounts receivable allowances 964 876
Depreciation and amortization (3,412) (2,088)
Inventory reserve 889 -
Accrued bonuses 395 -
Net deferred tax (liabilities) assets $10 ($90)
2004 2003 2002
Weighted- Weighted- Weighted-Average Average Average
Options Exercise Options Exercise Options Exercise Price Price Price
Balance – Jan 1, 966,610 $7.27 919,291 $6.98 1,031,830 $6.94
Grants 49,000 $16.68 370,000 $7.37 175,000 $6.30
Exercised (217,041) $6.76 (298,232) $6.50 (94,153) $5.00
Canceled (103,762) $10.60 (24,449) $7.44 (193,386) $7.09
Balance–Dec 31, 694,807 $7.59 966,610 $7.27 919,291 $6.98
The following table summarizes information about employees’ stock options outstanding at December 31, 2004:
Weighted-Average Weighted-Average Weighted-AverageExercise Options Options Remaining Exercise Price – Exercise Price –
Price Outstanding Exercisable Contractual Life Options Outstanding Options Exercisable
$4.14 - $5.51 198,400 198,400 7.2 years $5.28 $5.28
$6.00 - $8.55 413,457 234,332 6.8 years $7.25 $6.97
$8.64 - $13.84 58,950 15,200 8.5 years $12.90 $11.45
$15.60 - $22.46 24,000 14,000 9.3 years $19.65 $20.09
694,807 461,932 7.1 years $7.59 $6.79
At December 31, 2003 and 2002, there wereoutstanding exercisable options to purchase699,610 and 789,917 shares of Common Stock,respectively, at weighted-average exercise pricesper share of $6.94 and $7.14, respectively.
In connection with the exercise of options issuedunder a stock option plan that has since beenterminated, the Company received cash of$255,968 and notes in the amount of $908,000 in1985. The notes bear interest at 9% and are due
no later than December 31, 2005. During 2001, anote issued by Milton L. Cohen, a director of theCompany, in the amount of $422,000 wascanceled and replaced by a new note issued byMilton L. Cohen in the amount of $855,000, whichconsolidated such $422,000 and all otheramounts due by Milton L. Cohen to the Company.As at December 31, 2004, the amount of suchnote had been reduced to approximately$278,000.
The following table summarizes the Company’s stock option activity and related information for the yearsended December 31, 2004, 2003 and 2002:
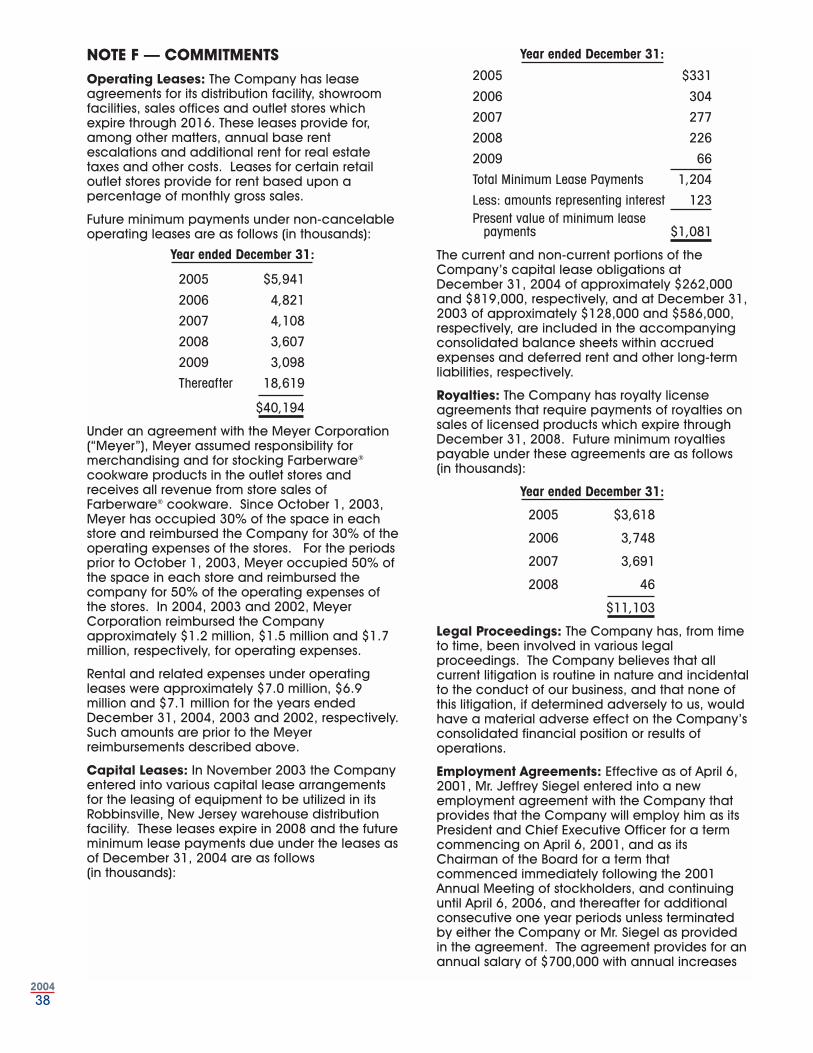
392004
382004
based on changes in the Consumer Price Indexand for the payment each year of a bonus in anamount equal to 3.5% of the Company’s pre-taxincome for such fiscal year, adjusted to includeamounts payable during such year to Mr. Siegelunder the employment agreement and to MiltonL. Cohen in his capacity as a consultant to theCompany and all significant non-recurringcharges deducted in determining such pre-taxincome. During the years ended December 31,2004, 2003 and 2002, the Company recordedannual compensation expense of approximately$555,000, $576,000 and $323,000, respectively,to the bonus plan. In addition, under the terms ofthe employment agreement, Mr. Siegel is entitledto $350,000 payable at the earlier of April 5, 2006or the occurrence of certain termination events.The agreement also provides for, among otherthings, certain standard fringe benefits, such asdisability benefits, medical insurance, lifeinsurance and an accountable expenseallowance. The agreement further provides that ifthe Company is merged or otherwiseconsolidated with any other organization orsubstantially all of the assets of the Company aresold or control of the Company has changed (thetransfer of 50% or more of the outstanding stock ofthe Company) and such event is followed by: (i)the termination of his employment, other than forcause; (ii) the diminution of his duties or change inhis executive position; (iii) the diminution of hiscompensation (other than as part of a generalreduction in the compensation of all employees);or (iv) the relocation of his principal place ofemployment to other than the New YorkMetropolitan Area, the Company would beobligated to pay to Mr. Siegel or his estate thebase salary required pursuant to the employmentagreement for the balance of the term. Theemployment agreement also contains restrictivecovenants preventing Mr. Siegel from competingwith the Company for a period of five years fromthe earlier of the termination of Mr. Siegel’semployment (other than a termination by theCompany without cause) or the expiration of hisemployment agreement.
During 2004 and 2003, several members of seniormanagement entered into employmentagreements with the Company. The employmentagreements termination dates range from June30, 2006 through June 30, 2007. The agreementsprovide for annual salaries and bonuses, andcertain standard fringe benefits, such as disabilitybenefits, medical insurance, life insurance andauto allowances.
In March 2002, the Company awarded Mr. JeffreySiegel a special bonus of $129,600.
NOTE G — RELATED PARTY TRANSACTIONSEffective April 6, 2001, Milton L. Cohen, then adirector of the Company, and the Companyentered into a 5-year consulting agreement
pursuant to which the Company is paying Milton L.Cohen an annual consulting fee of $440,800.
As of December 31, 2004 and December 31,2003, Milton L. Cohen owed the Companyapproximately $278,000 and $453,000,respectively. Milton L. Cohen remits $48,404quarterly in payment of interest and principal. Theloan, which matures on March 31, 2006, isincluded within other current and non-currentassets in the accompanying consolidatedbalance sheets.
As of December 31, 2004 and December 31,2003, Jeffrey Siegel, Chairman of the Board,President and Chief Executive Officer of theCompany, owed the Company approximately$344,000 for with respect to an outstanding loanrelated to the exercise of stock options under astock option plan which has since been terminated.
As of December 31, 2004 and December 31,2003, Craig Phillips, a vice president of theCompany, owed the Company approximately$135,000 for with respect to an outstanding loanrelated to the exercise of stock options under astock option plan which has since beenterminated.
The above referenced notes receivables due fromJeffrey Siegel and Craig Phillips totaling $479,000are included within total stockholders’ equity inthe accompanying balance sheets at December31, 2004 and 2003, respectively.
On October 1, 2002 the Company entered into aconsulting agreement with Ronald Shiftan, adirector of the Company. The agreement wasterminated effective November 1, 2004 when Mr.Shiftan became Vice Chairman of the Company.Mr. Shiftan was paid compensation under theconsulting agreement at a rate of $30,000 per month.
NOTE H — RETIREMENT PLANThe Company maintains a defined contributionretirement plan for eligible employees underSection 401(k) of the Internal Revenue Code.Participants can make voluntary contributions upto a maximum of 15% of their respective salaries.The Company made matching contributions tothe plan of approximately $257,000, $206,000and $220,000 in 2004, 2003 and 2002,respectively.
NOTE I — CONCENTRATION OF CREDIT RISKThe Company maintains cash and cashequivalents with various financial institutions.
Concentrations of credit risk with respect to tradeaccounts receivable are limited due to the largenumber of entities comprising the Company’s
NOTE F — COMMITMENTSOperating Leases: The Company has leaseagreements for its distribution facility, showroomfacilities, sales offices and outlet stores whichexpire through 2016. These leases provide for,among other matters, annual base rentescalations and additional rent for real estatetaxes and other costs. Leases for certain retailoutlet stores provide for rent based upon apercentage of monthly gross sales.
Future minimum payments under non-cancelableoperating leases are as follows (in thousands):
Year ended December 31:
2005 $5,941
2006 4,821
2007 4,108
2008 3,607
2009 3,098
Thereafter 18,619
$40,194
Under an agreement with the Meyer Corporation(“Meyer”), Meyer assumed responsibility formerchandising and for stocking Farberware®
cookware products in the outlet stores andreceives all revenue from store sales ofFarberware® cookware. Since October 1, 2003,Meyer has occupied 30% of the space in eachstore and reimbursed the Company for 30% of theoperating expenses of the stores. For the periodsprior to October 1, 2003, Meyer occupied 50% ofthe space in each store and reimbursed thecompany for 50% of the operating expenses ofthe stores. In 2004, 2003 and 2002, MeyerCorporation reimbursed the Companyapproximately $1.2 million, $1.5 million and $1.7million, respectively, for operating expenses.
Rental and related expenses under operatingleases were approximately $7.0 million, $6.9million and $7.1 million for the years endedDecember 31, 2004, 2003 and 2002, respectively.Such amounts are prior to the Meyerreimbursements described above.
Capital Leases: In November 2003 the Companyentered into various capital lease arrangementsfor the leasing of equipment to be utilized in itsRobbinsville, New Jersey warehouse distributionfacility. These leases expire in 2008 and the futureminimum lease payments due under the leases asof December 31, 2004 are as follows (in thousands):
Year ended December 31:
2005 $331
2006 304
2007 277
2008 226
2009 66
Total Minimum Lease Payments 1,204
Less: amounts representing interest 123Present value of minimum lease
payments $1,081
The current and non-current portions of theCompany’s capital lease obligations atDecember 31, 2004 of approximately $262,000and $819,000, respectively, and at December 31,2003 of approximately $128,000 and $586,000,respectively, are included in the accompanyingconsolidated balance sheets within accruedexpenses and deferred rent and other long-termliabilities, respectively.
Royalties: The Company has royalty licenseagreements that require payments of royalties onsales of licensed products which expire throughDecember 31, 2008. Future minimum royaltiespayable under these agreements are as follows(in thousands):
Year ended December 31:
2005 $3,618
2006 3,748
2007 3,691
2008 46
$11,103
Legal Proceedings: The Company has, from timeto time, been involved in various legalproceedings. The Company believes that allcurrent litigation is routine in nature and incidentalto the conduct of our business, and that none ofthis litigation, if determined adversely to us, wouldhave a material adverse effect on the Company’sconsolidated financial position or results ofoperations.
Employment Agreements: Effective as of April 6,2001, Mr. Jeffrey Siegel entered into a newemployment agreement with the Company thatprovides that the Company will employ him as itsPresident and Chief Executive Officer for a termcommencing on April 6, 2001, and as itsChairman of the Board for a term thatcommenced immediately following the 2001Annual Meeting of stockholders, and continuinguntil April 6, 2006, and thereafter for additionalconsecutive one year periods unless terminatedby either the Company or Mr. Siegel as providedin the agreement. The agreement provides for anannual salary of $700,000 with annual increases
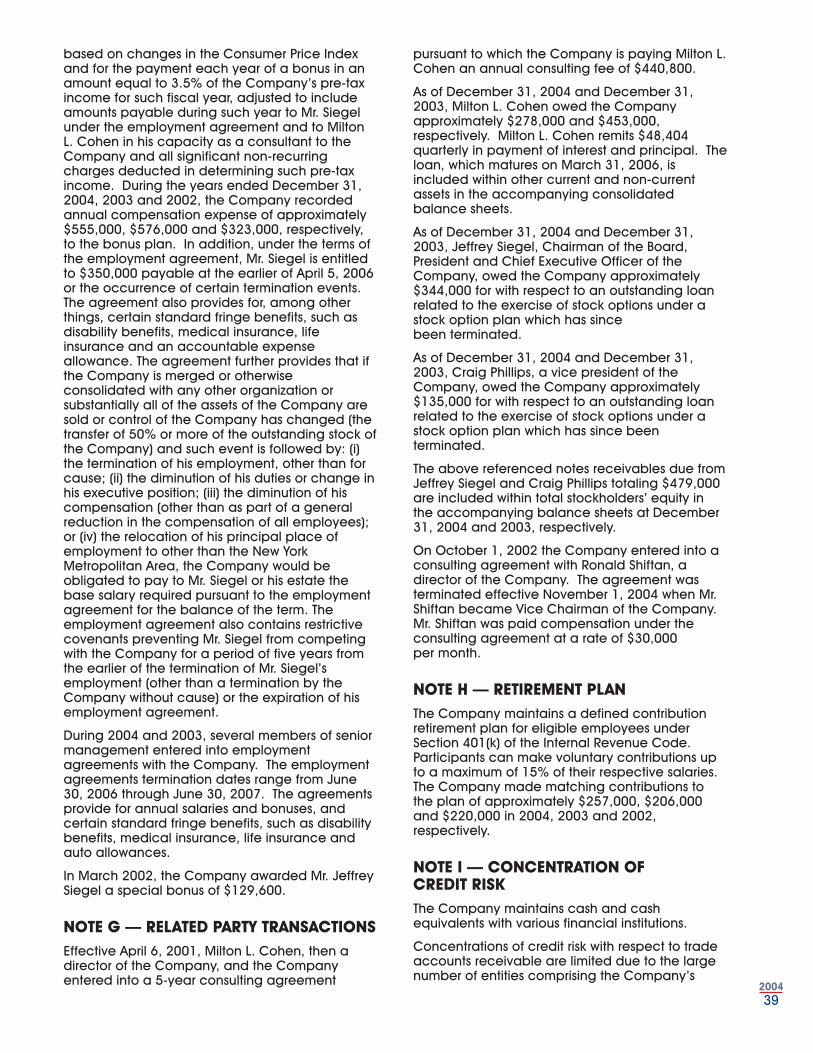
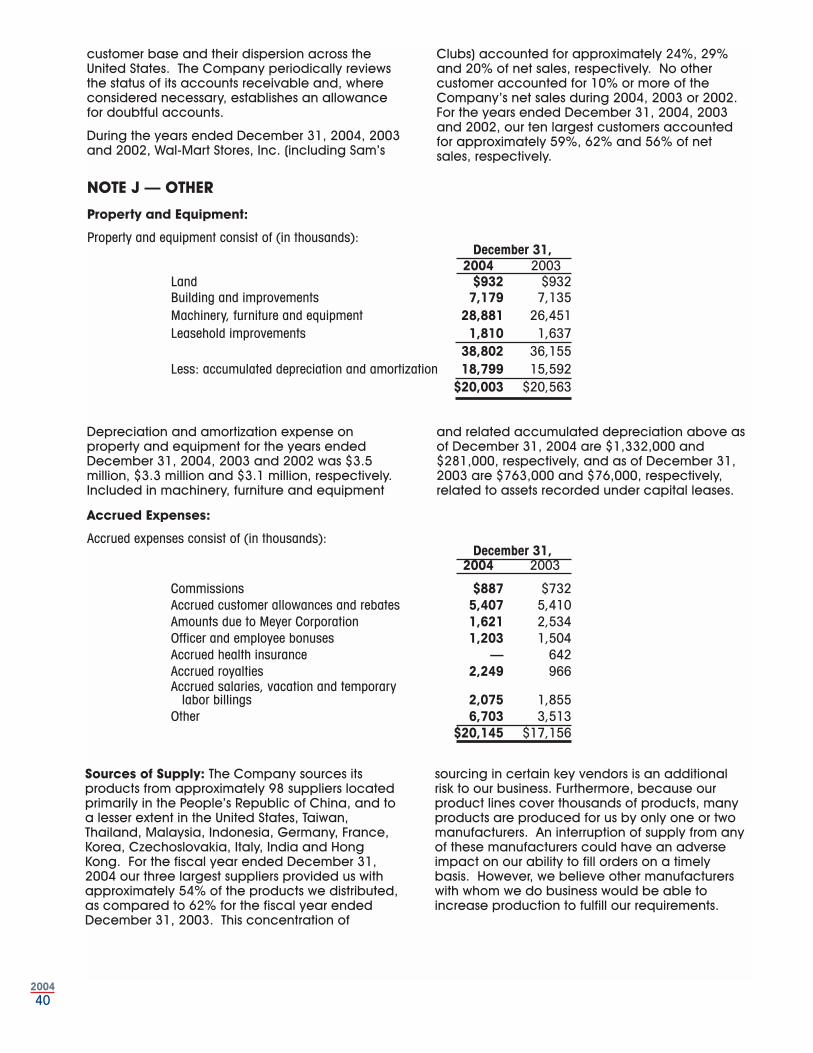
412004
402004
OFFICERS AND DIRECTORS
Jeffrey SiegelChairman of the Board, President and Chief Executive Officer
Ronald ShiftanVice Chairman and a Director
Bruce CohenExecutive Vice President,President-Farberware® Outlet Storesand a Director
Craig PhillipsVice President-Distribution, Secretary and a Director
Robert McNallyVice President-Finance,Treasurer and Chief Financial Officer
Evan MillerExecutive Vice President andPresident-Sales Division
Robert ReichenbachExecutive Vice President andPresident-Cutlery, Bakeware andAt Home Entertaining Divisions
Larry SklutePresident-Kitchenware Division
Howard BernsteinDirector
Leonard FlorenceDirector
Sheldon Misher
Director
Cherrie Nanninga
Director
William Westerfield
Director
OFFICES
Corporate HeadquartersOne Merrick AvenueWestbury, NY 11590(516)683-6000
Distribution Centers12 Applegate DriveRobbinsville, NJ 08691(609)208-1500
363 River StreetWinchendon, MA 01475(978)297-4010
CORPORATE INFORMATION
Corporate CounselSamuel B. Fortenbaugh IIINew York, NY
Independent Registered Public Accounting FirmErnst & Young LLPMelville, NY
Transfer Agent & RegistrarThe Bank of New York101 Barclay StreetNew York, NY 10286
Form 10-KStockholders may obtain, without charge, a copy of the Company’s annual report on Form 10-K for the year ended December 31, 2004, as filed with the Securities and Exchange Commission. Request should be sent to:
Investor RelationsLifetime Hoan CorporationOne Merrick AvenueWestbury, NY 11590
Annual MeetingThe Annual Meeting of Shareholders will be held at 10:30AM, Tuesday, June 7, 2005, at the Corporate Headquarters.
customer base and their dispersion across theUnited States. The Company periodically reviewsthe status of its accounts receivable and, whereconsidered necessary, establishes an allowancefor doubtful accounts.
During the years ended December 31, 2004, 2003and 2002, Wal-Mart Stores, Inc. (including Sam’s
Clubs) accounted for approximately 24%, 29%and 20% of net sales, respectively. No othercustomer accounted for 10% or more of theCompany’s net sales during 2004, 2003 or 2002.For the years ended December 31, 2004, 2003and 2002, our ten largest customers accountedfor approximately 59%, 62% and 56% of net sales, respectively.
NOTE J — OTHER
Property and Equipment:
Property and equipment consist of (in thousands):December 31,
2004 2003Land $932 $932Building and improvements 7,179 7,135Machinery, furniture and equipment 28,881 26,451Leasehold improvements 1,810 1,637
38,802 36,155Less: accumulated depreciation and amortization 18,799 15,592
$20,003 $20,563
Accrued Expenses:
Accrued expenses consist of (in thousands):December 31,
2004 2003
Commissions $887 $732Accrued customer allowances and rebates 5,407 5,410Amounts due to Meyer Corporation 1,621 2,534 Officer and employee bonuses 1,203 1,504Accrued health insurance — 642Accrued royalties 2,249 966Accrued salaries, vacation and temporary
labor billings 2,075 1,855Other 6,703 3,513
$20,145 $17,156
Sources of Supply: The Company sources itsproducts from approximately 98 suppliers locatedprimarily in the People’s Republic of China, and toa lesser extent in the United States, Taiwan,Thailand, Malaysia, Indonesia, Germany, France,Korea, Czechoslovakia, Italy, India and HongKong. For the fiscal year ended December 31,2004 our three largest suppliers provided us withapproximately 54% of the products we distributed,as compared to 62% for the fiscal year endedDecember 31, 2003. This concentration of
sourcing in certain key vendors is an additionalrisk to our business. Furthermore, because ourproduct lines cover thousands of products, manyproducts are produced for us by only one or twomanufacturers. An interruption of supply from anyof these manufacturers could have an adverseimpact on our ability to fill orders on a timelybasis. However, we believe other manufacturerswith whom we do business would be able toincrease production to fulfill our requirements.
Depreciation and amortization expense onproperty and equipment for the years endedDecember 31, 2004, 2003 and 2002 was $3.5million, $3.3 million and $3.1 million, respectively.Included in machinery, furniture and equipment
and related accumulated depreciation above asof December 31, 2004 are $1,332,000 and$281,000, respectively, and as of December 31,2003 are $763,000 and $76,000, respectively,related to assets recorded under capital leases.
Joseph Abboud Environments™ is a trademark of JA Apparel Corp.Cuisinart® is a registered trademark of Conair CorporationDBK™— Daniel Boulud Kitchen is a trademark of Dinex Licensing LLCFarberware® is a registered trademark of Farberware, Inc.Hershey’s® and Reese’s® are registered trademarks of Hershey Foods CorporationKathy Ireland Home® is a registered trademark of Kathy Ireland World Wide LLCKitchenAid® is a registered trademark of Whirlpool CorporationSabatier® is a registered trademark of Rousselon Frères et Cie.

O n e M e r r i c k A v e n u e , W e s t b u r y , N e w Y o r k 1 1 5 9 0