lifting how cutting coal saves lives europe… · lifting europe’s dark cloud 3 “coal is the...
TRANSCRIPT

LIFTING EUROPE’SDARK CLOUD
HOW CUTTING COAL SAVES LIVES

2 LIFTING EUROPE’S DARK CLOUD
LIFTING EUROPE’SDARK CLOUD
HOW CUTTING COAL SAVES LIVES
This programme is implemented with the support of the European Union. The contents of this publication are the soleresponsibility of the above-mentioned authors and can in no way be taken to reflect the views of the European Union.
The content of this report was researched and written by Christian Schaible and Anton Lazarus of the European EnvironmentalBureau (EEB), Dave Jones from Sandbag, Joanna Flisowska from Climate Action Network (CAN) Europe, Julia Gogolewska fromHealth and Environment Alliance (HEAL) and Darek Urbaniak from WWF European Policy Office.
The modelling used in this report was developed by Lauri Myllyvirta and Rosa Gierens from Greenpeace. The health impact methodologyis based on that of the earlier report ‘Europe’s Dark Cloud: How coal-burning countries are making their neighbours sick’ published inJune 2016 by WWF European Policy Office, Sandbag, CAN Europe and HEAL in Brussels, Belgium. This methodology was guided byrecommendations from the World Health Organization Europe’s ‘Health risks of air pollution in Europe’ (HRAPIE) project on health impactassessments for air pollution. It includes atmospheric modelling with the European Monitoring and Evaluation ProgrammeMeteorological Synthesizing Centre - West (EMEP MSC-W) computer model, which is also used by the European Environment Agencyfor assessments of health impacts from air pollution in Europe. The methodology of the first report has been peer reviewed by Dr MikeHolland, Ecometrics Research and Consulting. The estimates are based on publicly available, relevant data known of by the authors; thisdata may not be exhaustive and there may exist further or updated information they were not aware of at the time of writing.
Graphic design: OneHemisphere.Edited by EEB.
Published in October 2016 by EEB, HEAL, CAN Europe, WWF European Policy Office, and Sandbag in Brussels, Belgium. Any reproduction in full or in parts must mention the title and credit the above-mentioned publishers as the copyright owners.
© Text October 2016. EEB, HEAL, CAN Europe, WWF European Policy Office, Sandbag. All rights reserved. Printed on 100% postconsumer waste with vegetable based inks. Cover image: © W. Khamfu.
The authors would like to thank Lauri Myllyvirta and Rosa Gierens from Greenpeace for their support with the modelling used inthis report.
The authors gratefully acknowledge the support of the European Climate Foundation (ECF) and the Environment Agency Austria(Umweltbundesamt) for the production of this publication.
This report is dedicated to Lesley James (Friends of the Earth England, Wales and Northern Ireland) for her tireless dedication toraising the ambition level of environmental performance standards for Large Combustion Plants in Europe.
LIFTING EUROPE’S DARK CLOUD 3
“COAL IS THESINGLE GREATESTTHREAT TOCIVILISATION AND ALL LIFE ON OUR PLANET” Climate scientist James Hansen
CONTACTS
EUROPEAN ENVIRONMENTAL BUREAU (EEB)
Christian Schaible, Policy Manager Email: [email protected]: www.eeb.orgTwitter: @Green_Europe
Anton Lazarus, Communications Officer Email: [email protected]
SANDBAG
Dave Jones, Coal AnalystEmail: [email protected]: www.sandbag.org.ukTwitter: @sandbagorguk
CLIMATE ACTION NETWORK (CAN) EUROPE
Joanna Flisowska, Coal Policy CoordinatorEmail: [email protected]: www.caneurope.orgTwitter: @CANEurope
HEALTH AND ENVIRONMENT ALLIANCE (HEAL)
Julia Huscher, Senior Policy OfficerEmail: [email protected]: www.env-health.orgTwitter: @HealthandEnv
WWF EUROPEAN POLICY OFFICE
Darek Urbaniak, Energy Policy OfficerEmail: [email protected]: www.wwf.euTwitter: @WWFEU

4 LIFTING EUROPE’S DARK CLOUD
TABLE OF CONTENTS
PREFACE 5
EXECUTIVE SUMMARY 6
CHAPTER 1. KNOW YOUR LIMITS – AN INTRODUCTION TO EUROPEAN LAW ON COAL POLLUTION 10
CHAPTER 2. A BREATH OF FRESH AIR? – THE HEALTH BENEFITS OF CUTTING COAL 16
CHAPTER 3. DEADLY DEROGATIONS – COAL’S PERMISSION TO POLLUTE 23
CHAPTER 4. CONCLUSIONS – LIFTING EUROPE’S DARK CLOUD 29
A. EU ACTIONS 30
B. NATIONAL ACTIONS 32
ANNEX I HEALTH IMPACTS OF NEW LIMITS 34
ANNEX II PLANTS WITH DEROGATIONS 39

LIFTING EUROPE’S DARK CLOUD 5
PREFACE
Air pollution kills. Worldwide, it is now the top environmental cause of premature mortality, as shown by the GlobalBurden of Disease, Injuries, and Risk Factor Study. In 2012 alone, the World Health Organization (WHO) reported that7 million people died as a result of exposure to air pollution.
Despite improvements in air quality in the EU, air pollution remains an important health risk factor responsible forover 400,000 premature deaths in 2011.
Looking at specific sources of exposure, the evidence is also there. Published in July 2016, “Europe’s Dark Cloud: Howcoal-burning countries are making their neighbours sick” exposed the substantial health impacts of Europe’s coal-fired power stations. It found that European coal plants are responsible for around 23,000 premature deaths per year.This new report, “Lifting Europe’s Dark Cloud” shows how specific policy choices can impact positively on our health.
The European Respiratory Society is committed to promoting lung health. We are proud to work together with otherorganisations on this vital issue and we congratulate EEB, HEAL, CAN Europe, WWF European Policy Office andSandbag on this new report. Policymakers and the public are aware that air pollution damages people’s health andwe hope that “Lifting Europe’s Dark Cloud,” will serve as the stimulus needed to secure an achievable aim for thehealth of Europeans.
Improving the EU’s poor air quality will require stricter regulation and significant investment. But the long termhealth benefits easily outweigh the necessary financial investments. As a medical society, we notice over and overagain the disconnect between an acknowledgement of the dangers of air pollution and the willingness ofpolicymakers to take concrete steps to reduce emissions and clean up our air.
Introducing and fully enforcing Best Available Techniques standards through the EU’s Industrial Emissions Directiveoffers a clear means of protecting our health and reducing the level of harmful pollutants and gases in theatmosphere. Applying these standards will also contribute to reducing greenhouse gas emissions responsible forclimate change.
The time for action is now. The longer we wait, the bigger the challenge will become.
Professor Bert BrunekreefThe European Respiratory SocietyEnvironment and Health Committee Chair
The European Respiratory Society (ERS) is an international organisation that brings together physicians, healthcareprofessionals, scientists and other experts working in respiratory medicine. We are one of the leading medical organisationsin the respiratory field, with a growing membership representing over 140 countries worldwide. Our mission is to promotelung health in order to alleviate suffering from disease and drive standards for respiratory medicine globally. Science,education and advocacy are at the core of everything we do.

EXECUTIVE SUMMARY
This study, ‘Lifting Europe’s Dark Cloud’, sets out how improved environmental performance standards andstricter limits for pollution from coal power plants could help to tackle dangerous and costly air pollution.It also reveals how more than half of European coal power plants have been granted special ‘permission topollute’ beyond the levels set in laws designed to control emissions.
6 LIFTING EUROPE’S DARK CLOUD
New proposed standards, to be voted on later this year,have the potential to significantly reduce the burden ofcoal on European citizens.
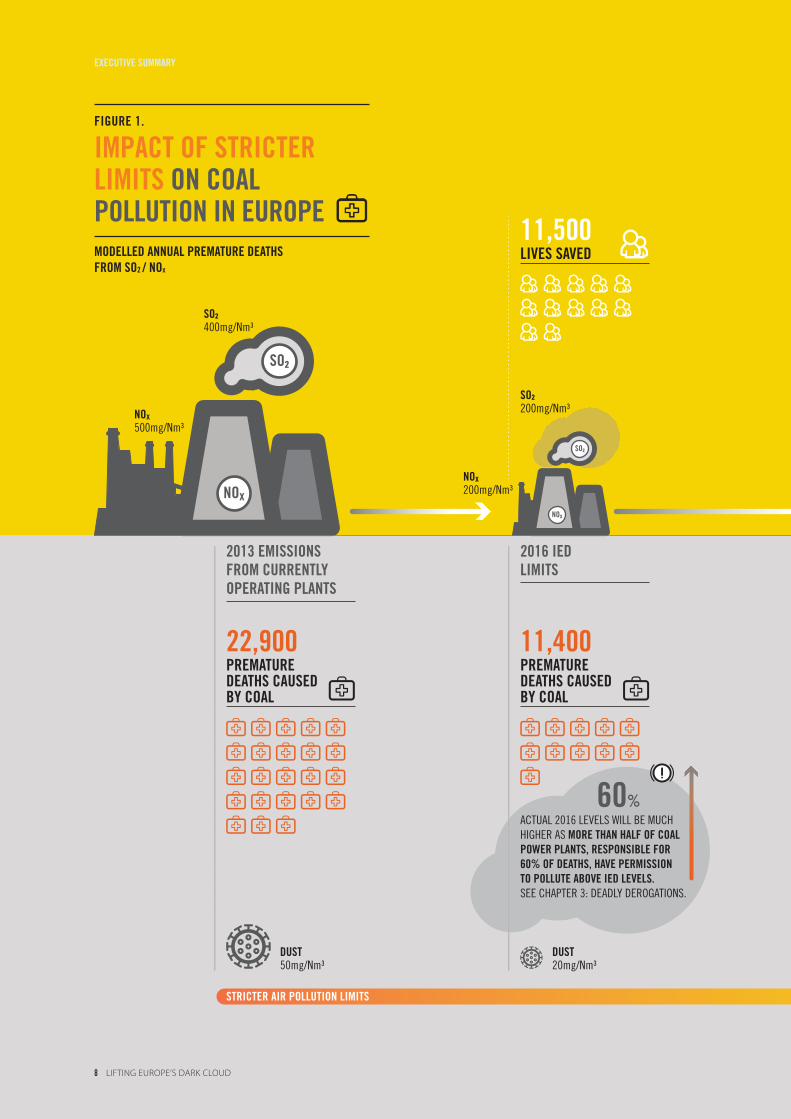
A revision of the EU’s ‘LCP BREF’, a technical documentoutlining best practices for industry, would lead totougher new pollution limits and has the potential toreduce the number of premature deaths caused by coalpower plants from 22,900 to 2,600 deaths per year. The‘Best Available Techniques’ (BAT) outlined in thisdocument are all tried-and-tested methods, already inuse in European coal plants. Emissions produced usingthese techniques are in many cases higher than thelimits demanded by authorities in the USA, Japan andeven coal-hungry China.1
While new limits are necessary to protect public health, thisreport also finds that crucial European legislation alreadyin place is failing to ensure that coal plants meet ‘safety net’limits. The Industrial Emissions Directive (IED) imposedminimum binding limits for three pollutants: nitrogenoxides (NOx), sulphur dioxide (SO2) and dust, which had tobe met for existing plants by 1 January 2016. However, thewidespread use of so-called ‘derogations’ allows more thanhalf of European coal power plants, responsible for 13,600deaths in 2013, to exceed these limits.
Emissions from burning coal are carried through the airand breathed in by people all over Europe and beyond.‘Lifting Europe’s Dark Cloud’ models emissions scenariosbased on different pollution levels and compares themto the results of a previous report: ‘Europe’s Dark Cloud:How Coal-burning countries are making their neighbourssick’.2 This earlier report revealed the cross-border impactsof coal pollution and found that in 2013 European coalplants, which are still operating today, were responsiblefor around 22,900 premature deaths, 11,800 new casesof chronic bronchitis in adults, 538,300 days of children
1 Smoke and Mirrors: How Europe’s biggest polluters became their own regulators,Greenpeace, 2015: http://www.greenpeace.org/eu-unit/en/Publications/2015/Smoke-and-Mirrors-How-Europes-biggest-polluters-became-their-own-regulators
2 Europe’s Dark Cloud: How Coal-Burning Countries are Making their Neighbours Sick’,HEAL, CAN, WWF EU, Sandbag, 2016, https://wwf.fi/mediabank/8633.pdf.
3 This figure is based on 2013 emissions data, adjusted to reflect plants still operational in2016. See: ‘Europe’s Dark Cloud: How Coal-Burning Countries are Making theirNeighbours Sick’, HEAL, CAN, WWF EU, Sandbag, 2016,https://wwf.fi/mediabank/8633.pdf.
4 Calculations are based on the 2013 emissions situation. At the date of the launch of thisreport 44,515 premature deaths and a health bill of between 64.9 and 123.2 billioneuros could have been avoided. Figures correct on 10 October 2016:http://www.eeb.org/index.cfm/death-ticker/ For further information see the report ‘Health andeconomic implications of alternative emission limits for coal-fired power plants in the EU’, EEB andGreenpeace, 2015: http://www.eeb.org/index.cfm/library/eu-health-impacts-technical-report/
suffering from asthma symptoms and 6.6 million lostworking days. Burning coal was shown to have an annualtotal health bill of between 33.3 and 63.2 billion euros.3
This new report introduces the law that governs industrialpollution in the EU – the Industrial Emissions Directive(Chapter 1). It assesses the impact of reduced emissionsbased on three scenarios (Chapter 2) and demonstrateshow ‘derogations’ provide loopholes in current laws thatallow existing limits to be ignored (Chapter 3).
The report concludes by presenting concrete actionsthat can be taken at both the EU and national levels inorder to reduce the terrible impact of coal on the healthof people across the continent and to finally begin ‘liftingEurope’s dark cloud’ (Chapter 4).
However, while less pollution means fewer deaths, notechniques exist which completely eliminate emissionsof any of the major pollutants from coal power plants.Furthermore, in addition to the damage caused tohuman health, coal power plants produce 18 percent ofall of Europe’s greenhouse gases, contributing to climatechange with potentially devastating worldwide effects.
Truly lifting Europe’s Dark Cloud will require thecomplete phase-out of coal power in favour ofsustainable renewable energy sources and reducedenergy consumption.

LIFTING EUROPE’S DARK CLOUD 7
KEY FINDINGS • Cutting coal saves lives. Currently proposed emissions limits, in the revised ‘LCP BREF’ document, would
reduce the number of premature deaths caused by coal from 22,900 to 8,900 deaths per year by mid-2021 (see Chapter 2). This would also mean 7,300 fewer new cases of chronic bronchitis, 336,500 fewerdays of children suffering from asthma symptoms, more than 4 million fewer working days lost throughsickness and an overall reduction in Europe’s annual health bill from 63.2 billion to 24.3 billion euros.
• Coal power’s ‘permission to pollute’ is harming human health. More than half of Europe’s coal powerplants currently enjoy exemptions, or ‘derogations’, that allow them to pollute over the agreed ‘safety net’limits set out in the Industrial Emissions Directive (see Chapter 3). These plants were responsible for 13,700deaths in 2013, which was 60 percent of all coal-related deaths in Europe.
• Deadly delays are costing lives across Europe. New BREF limits should have been adopted in August 2014. Theyhave already been delayed by more than two years. The modelling in this report shows proposed BREF limits shouldsave 2,500 lives each year compared to existing 2016 IED limits. Instead, delays have already caused 5,600 unnecessarydeaths - equivalent to seven lives each day - and led to a total health bill of more than 15.6 billion euros.
• Stronger limits will save even more lives. If all EU were to set limits based on what proven Best AvailableTechniques (BAT) can achieve, the total number of premature deaths could be reduced further from 8,900 to 2,600deaths, new cases of chronic bronchitis from 4,500 to 1,200, days of children suffering from asthma symptomsfrom 201,800 to 54,900, an additional 1.9 million lost working days saved and annual health costs slashed from24.3 billion to 7.1 billion euros (see Chapter 2). The EEB’s ‘Death Ticker 2.0’ shows how many lives would have beensaved had countries already introduced these ‘BAT levels’ in 2014, when they were first due to be published.4
DEMANDS (SEE CHAPTER 4)EU DEMANDS:
1. Close loopholes in the new proposed standards. Simple changes to the latest draft of the ‘LCP BREF’(see Chapter 1), like removing footnote exceptions and providing a fairer definition of “new” plants, wouldreduce dangerous pollution across Europe.
2. Publish the revised standards without delay. A new LCP BREF must be adopted this year. Every day ofdelay costs lives.
3. Strengthen the Industrial Emissions Directive (IED). The ‘IED safety net’ should be updated, the‘desulphurisation rate derogation’ scrapped and BAT benchmarks on energy efficiency made obligatory.Emissions limits and monitoring requirements should reflect what is now technically possible to ensureEuropean legislation serves as a driver towards improved environmental performance across the EU.
NATIONAL DEMANDS:
1. Set emissions levels in line with what Best Available Techniques can already achieve. In the interestsof the health of their citizens, Governments should set more stringent limits than the minimum standardsset at the EU level. No derogations should be granted.
2. Implement new pollution limits now. Governments should pre-empt deadlines to improve the healthof their citizens and save costs to their health services faster. Investment in pollution-reducing techniquesshould lead to significant drops in net emissions and not be used as justification to extend plant life.
3. Commit to a 100% coal phase-out and a speedy transition to renewable sources of energy. Finland andthe United Kingdom have pledged to phase out coal completely. Belgium became coal-free this year and Austriawill be by 2025 or earlier. Almost half of US coal is committed to close. Other countries must now catch up.
1/05 HDC KHLHSR
1/02 DLHRRHNMR EQNL BTQQDMSKX NODQ@SHMF OK@MSR
RN¨
RN¨3//lf.Ml≠
MNw4//lf.Ml≠
RN¨1//lf.Ml≠
R
MNw1//lf.Ml≠
M
MNw
RN¨
MNw
RSQHBSDQ @HQ ONKKTSHNM KHLHSR
CTRS4/lf.Ml≠
CTRS1/lf.Ml≠
00+4//KHUDR R@UDC
11+8//OQDL@STQD CD@SGR B@TRDC AX BN@K
@BST@K 1/05 KDUDKR VHKK AD LTBG GHFGDQ @R LNQD SG@M G@KE NE BN@K ONVDQ OK@MSR+ QDRONMRHAKD ENQ 5/$ NE CD@SGR+ G@UD ODQLHRRHNM SN ONKKTSD @ANUD HDC KDUDKR- RDD BG@OSDQ 29 CD@CKX CDQNF@SHNMR-
5/$
00+3//OQDL@STQD CD@SGR B@TRDC AX BN@K
FIGURE 1.
IMPACT OF STRICTERLIMITS ON COALPOLLUTION IN EUROPEMODELLED ANNUAL PREMATURE DEATHS FROM SO2 / NOx
8 LIFTING EUROPE’S DARK CLOUD
EXECUTIVE SUMMARY

RN¨02/lf.Ml≠
RN¨0/lf.Ml≠
M MNw04/lf.Ml≠
MNw;74 'KHFMHSD(54 'G@QC BN@K( lf.Ml≠
CTRS7lf.Ml≠
CTRS1lf.Ml≠
OQNONRDC AQDE KHLHSR
1/+2//KHUDR R@UDC
11+8// KHUDR R@UDC
03+///KHUDR R@UDC
ADRS @U@HK@AKD SDBGMHPTDR 'A@S(
ONRRHAKD SN HLOKDLDMS DUDM SHFGSDQ KHLHSR
1+5//OQDL@STQD CD@SGR B@TRDC AX BN@K
CTRS/lf.Ml≠
/OQDL@STQD CD@SGR B@TRDC AX BN@K
7+8//OQDL@STQD CD@SGR B@TRDC AX BN@K
QDMDV@AKD DMDQFX
RN¨
MNw
RN¨
MNw
LIFTING EUROPE’S DARK CLOUD 9
INTRODUCTION
The Industrial Emissions Directive (IED) is a crucial Europeanlaw that regulates pollution caused by industry across the28 Member States of the EU, including all coal powerstations. It set minimum binding limits for three pollutants:nitrogen oxides (NOx), sulphur dioxide (SO2) and dust,which had to be met for existing plants by 1 January 2016.
Installations covered by the IED are required to holdpermits issued by national or local responsible authorities.The directive provides guidelines to permit-issuingauthorities based on agreed Best Available Techniques(BAT) and contained in a reference document, called a‘BREF’ (see infobox ‘LCP BREF’), which must be consultedwhenever a permit is issued or renewed.
10 LIFTING EUROPE’S DARK CLOUD
1.CHAPTER 1.
THE ‘LCP BREF’The IED sets environmental performance standards for European Large Combustion Plants (LCPs) in adocument detailing the Best Available Techniques (BAT) for managing and reducing emissions. Thisdocument is referred to as a ‘Best Available Techniques Reference Document’ (or ‘BREF’). The first BREF forLCPs was adopted in July 2006 and a revised version will be presented on 20 October 2016 ahead of a voteby Member States planned for later in the year.
The final ‘LCP BREF’ will set emissions ranges that can be achieved through the use of Best AvailableTechniques (BAT). The range is expressed as a concentration of pollutants in flue gas volume as emitted atthe stack, for example ‘<85-175mg/Nm3 for NOx’. The higher number of this range is referred to as the “upperrange” and forms the basis of the ‘proposed BREF limits’ scenario in Chapter 2; the lower number is referredto as the “lower range” and is used to calculate the ‘BAT scenario’ in Chapter 2. The permit-issuing authoritymay choose to set an emissions limit within this range.
Following publication in the Official Journal of the European Union, permit-issuing authorities and plant operatorswill have up to four years to implement, meaning the revised BREF standards should be complied with by mid-2021. However, Member States retain considerable flexibility in setting the emissions limits when updatingpermits and may choose to go beyond the European minimum standards by insisting on stricter national limits.
The revised LCP BREF therefore has significant potential to assist environmental authorities across Europe insetting limits for pollution from coal-fired power plants, thereby providing protection for human health andthe environment and helping to begin to lift ‘Europe’s Dark Cloud’.
KNOW YOURLIMITSAN INTRODUCTION TO EUROPEAN LAW ON COAL POLLUTION

LIFTING EUROPE’S DARK CLOUD 11
WHY FOCUS ON COAL-BURNING POWER PLANTS?
The IED covers the activities of about 55,000 industrialinstallations. The LCP BREF will regulate 2,841 of thesefacilities. However, this report focuses exclusively on theimpact of the coal-burning power plants.
Despite accounting for just 0.5 percent of IED-regulatedinstallations, in 2013 Europe’s coal power plants wereresponsible for 52 percent of all reported SO2 emissions,40 percent of all reported NOx and 37 percent of all reporteddust emissions from industry in the EU,5 see Figure 2.
OTHER
OIL & GAS
CHEMICALS
CEMENT
IRON & STEEL
OTHER ELECTRICITY
COAL POWER STATIONS0
10
20
30
40
50
60
70
80
90
100
%
SO2 NOX DUST MERCURY
LEGEND
FIGURE 2.
COAL AND OTHER INDUSTRIAL EMISSIONSE-PRTR 2013
SOURCE E-PRTR 2013.
5 As well as 43% of mercury and 42% of all CO2 emissions.
12 LIFTING EUROPE’S DARK CLOUD
BREFS AND BAT-BASED LIMITS:
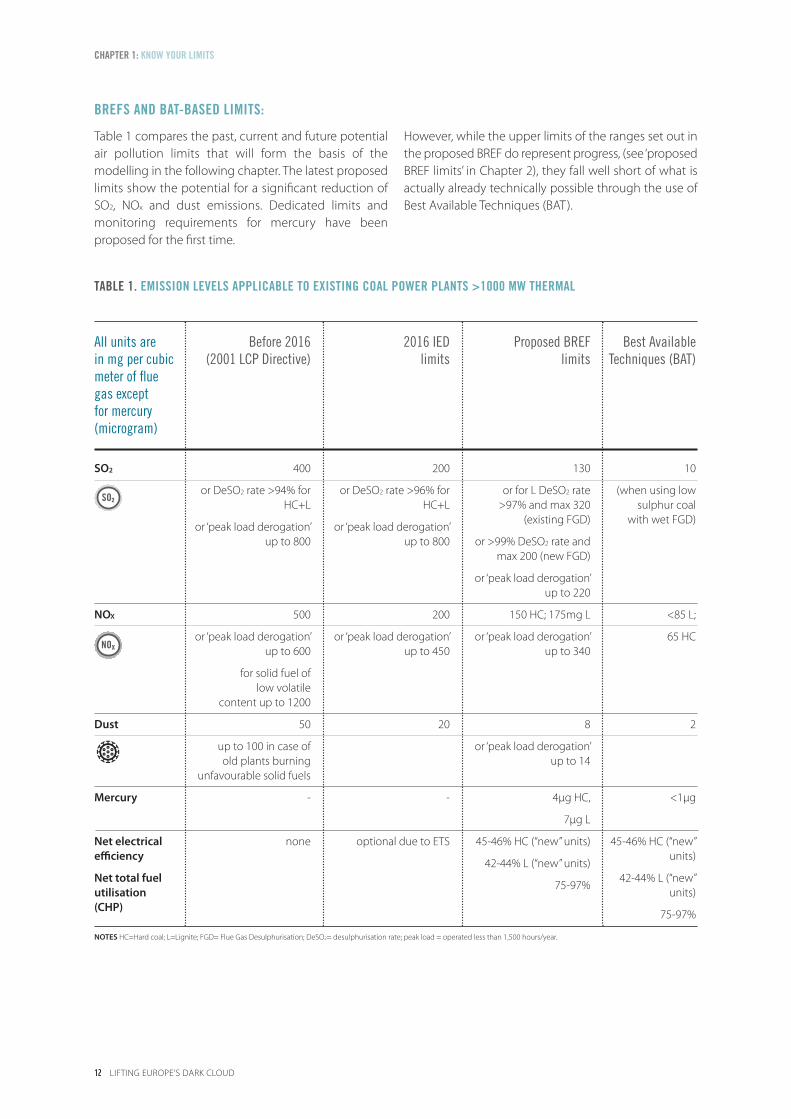
Table 1 compares the past, current and future potentialair pollution limits that will form the basis of themodelling in the following chapter. The latest proposedlimits show the potential for a significant reduction ofSO2, NOx and dust emissions. Dedicated limits andmonitoring requirements for mercury have beenproposed for the first time.
However, while the upper limits of the ranges set out inthe proposed BREF do represent progress, (see ‘proposedBREF limits’ in Chapter 2), they fall well short of what isactually already technically possible through the use ofBest Available Techniques (BAT).
CHAPTER 1: KNOW YOUR LIMITS
TABLE 1. EMISSION LEVELS APPLICABLE TO EXISTING COAL POWER PLANTS >1000 MW THERMAL
All units are in mg per cubicmeter of flue gas except for mercury(microgram)
SO2
NOX
Dust
Mercury
Net electricalefficiency
Net total fuelutilisation (CHP)
NOTES HC=Hard coal; L=Lignite; FGD= Flue Gas Desulphurisation; DeSO2= desulphurisation rate; peak load = operated less than 1,500 hours/year.
Before 2016 (2001 LCP Directive)
400
or DeSO2 rate >94% forHC+L
or ‘peak load derogation’up to 800
500
or ‘peak load derogation’up to 600
for solid fuel of low volatile
content up to 1200
50
up to 100 in case of old plants burning
unfavourable solid fuels
-
none
2016 IEDlimits
200
or DeSO2 rate >96% forHC+L
or ‘peak load derogation’up to 800
200
or ‘peak load derogation’up to 450
20
-
optional due to ETS
Proposed BREFlimits
130
or for L DeSO2 rate >97% and max 320
(existing FGD)
or >99% DeSO2 rate andmax 200 (new FGD)
or ‘peak load derogation’up to 220
150 HC; 175mg L
or ‘peak load derogation’up to 340
8
or ‘peak load derogation’up to 14
4µg HC,
7µg L
45-46% HC (“new” units)
42-44% L (“new” units)
75-97%
Best AvailableTechniques (BAT)
10
(when using lowsulphur coal
with wet FGD)
<85 L;
65 HC
2
<1µg
45-46% HC (“new”units)
42-44% L (“new”units)
75-97%
RN¨
MNw

LIFTING EUROPE’S DARK CLOUD 13
RATCLIFFE-ON-SOAR A MASSIVE COAL POWERED POWER STATION IN NOTTINGHAMSHIRE UK.© Global Warming Images / WWF-Canon
INDUSTRIAL EMISSIONS DIRECTIVE ADOPTED
(IED)
201024 NOVEMBER
IED
FIRST LCP BREF ADOPTED
(“2006 LCP BREF”)
2006JULY
BREF REVISION OF LCP BREF STARTED
2011OCTOBER
BREFCOMPLIANCE DEADLINE 2006 LCP BREF
(under IPPC Directive)
2007 30 OCTOBER
BREF
REVISED LCP BREF SHOULD HAVE BEEN PUBLISHED
(maximum 26 months after review / 8 years after previous version)
2014014JULY
BREF
IED LIMITS COME INTO FORCE
(existing plants)
20161 JANUARY
IED
IED DEROGATIONS BEGIN
20161 JANUARY
D
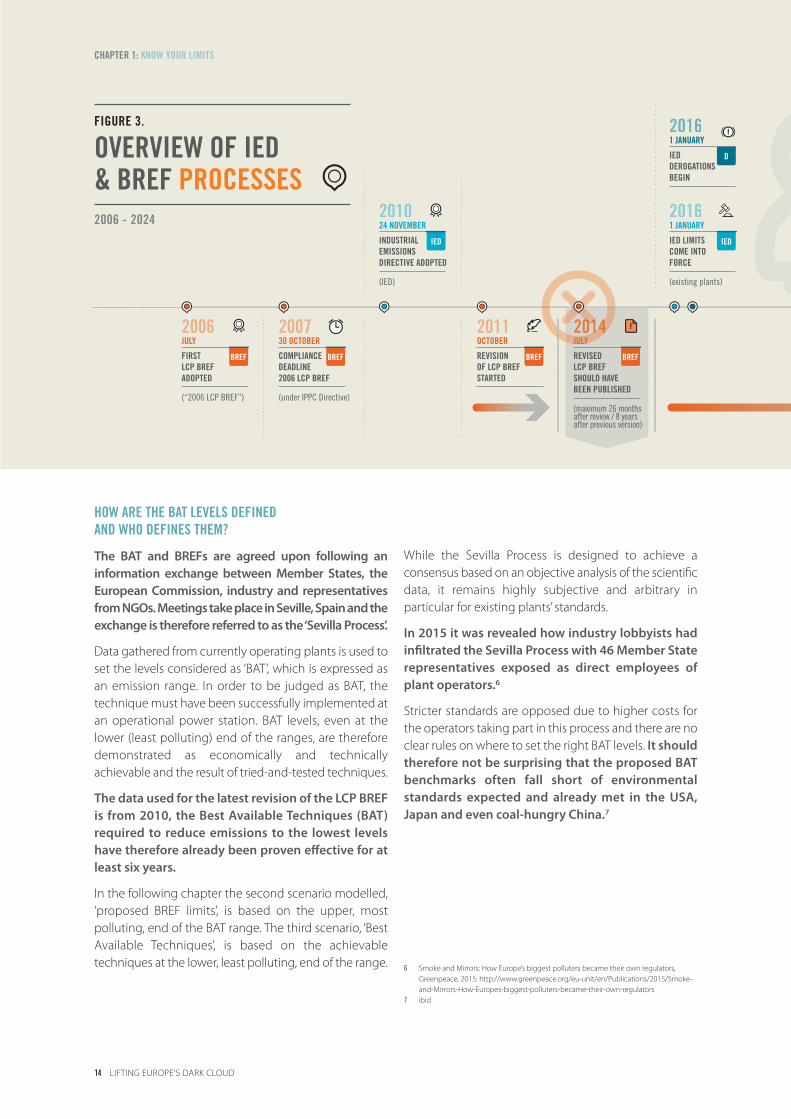
FIGURE 3.
OVERVIEW OF IED & BREF PROCESSES2006 - 2024
14 LIFTING EUROPE’S DARK CLOUD
CHAPTER 1: KNOW YOUR LIMITS
6 Smoke and Mirrors: How Europe’s biggest polluters became their own regulators,Greenpeace, 2015: http://www.greenpeace.org/eu-unit/en/Publications/2015/Smoke-and-Mirrors-How-Europes-biggest-polluters-became-their-own-regulators
7 ibid
HOW ARE THE BAT LEVELS DEFINED AND WHO DEFINES THEM?
The BAT and BREFs are agreed upon following aninformation exchange between Member States, theEuropean Commission, industry and representativesfrom NGOs. Meetings take place in Seville, Spain and theexchange is therefore referred to as the ‘Sevilla Process’.
Data gathered from currently operating plants is used toset the levels considered as ‘BAT’, which is expressed asan emission range. In order to be judged as BAT, thetechnique must have been successfully implemented atan operational power station. BAT levels, even at thelower (least polluting) end of the ranges, are thereforedemonstrated as economically and technicallyachievable and the result of tried-and-tested techniques.
The data used for the latest revision of the LCP BREFis from 2010, the Best Available Techniques (BAT)required to reduce emissions to the lowest levelshave therefore already been proven effective for atleast six years.
In the following chapter the second scenario modelled,‘proposed BREF limits’, is based on the upper, mostpolluting, end of the BAT range. The third scenario, ‘BestAvailable Techniques’, is based on the achievabletechniques at the lower, least polluting, end of the range.
While the Sevilla Process is designed to achieve aconsensus based on an objective analysis of the scientificdata, it remains highly subjective and arbitrary inparticular for existing plants’ standards.
In 2015 it was revealed how industry lobbyists hadinfiltrated the Sevilla Process with 46 Member Staterepresentatives exposed as direct employees ofplant operators.6
Stricter standards are opposed due to higher costs forthe operators taking part in this process and there are noclear rules on where to set the right BAT levels. It shouldtherefore not be surprising that the proposed BATbenchmarks often fall short of environmentalstandards expected and already met in the USA,Japan and even coal-hungry China.7

REVISED LCP BREF FINAL DRAFT RELEASED
2016JUNE
BREF REVISED LCP BREF PUBLISHED
2017SPRING
BREF REVISED LCP BREF MUST BE COMPLIED WITH
2021 SUMMER
BREF
REVISED LCP BREF SHOULD HAVE COME INTO FORCE
20181801AUGUST
BREFFINAL LCP BREF DRAFT TEXT TO BE DISCUSSED
2016OCTOBER
BREF
VOTE BY MINISTERS
201620 6LATE
VOTE
TRANSITIONAL NATIONAL PLAN DEROGATIONS EXPIRE
2020JULY
D DISTRICT HEATING DEROGATION EXPIRES
2023JANUARY
D LIMITED LIFETIME DEROGATIONS (LLD) EXPIRES
2024JANUARY
D
LIFTING EUROPE’S DARK CLOUD 15
TIMELINE
BREFs were originally introduced as part of theIntegrated Pollution Prevention and Control (IPPC)Directive in 2001. The first LCP BREF was adopted in July2006 but was not considered as legally binding withinthe IPPC framework by the majority of Member States.As a result, the environmental standards contained in the2006 LCP BREF were only fully implemented by a fewMember States (Austria, Belgium, Denmark, Germany,Italy, the Netherlands and Sweden).
The IED combined the IPPC and various other directivesinto a single piece of legislation. Within this new legalframework the BREFs became legally binding.
According to the IED, the European Commission shouldupdate BREFs at least every eight years. The process torevise the 2006 LCP BREF should have been finalised inAugust 2014 so that revised standards would need to bemet by summer 2018.
Due to various delays being pushed by both industryand Member States seeking to resist tougher standards,the revised LCP BREF is still awaiting approval. The reviewstarted in October 2011, the most recent draft waspublished in June 2016 and the next major decision isexpected on 20 October 2016, when Member States willexpress their opinions ahead of a final vote. Even ifapproved this year, it seems unlikely that the revised LCPBREF will be published before the first quarter of 2017meaning that new BREF standards will not have to bemet until mid-2021, 15 years after the original LCPBREF was adopted, and three years after the originalschedule in the IED.

GATHER 2013 ACTUAL SO2/NOX TONNES EMITTED
1
CONVERT TO ESTIMATED RELEASE RATES FOR EACH SO2/NOX
2
CALCULATE HOW FAR THE ESTIMATED RELEASE RATE IS OVER THE PROPOSED BREF RELEASE RATE LIMIT REPORTED IN CHAPTER 1
3
PRO RATA DOWN 2013 ACTUAL SO2/NOX EMISSIONS ACCORDINGLY
4
METHODOLOGY
The original ‘Europe’s Dark Cloud’ report documented thebasic methodology for calculating health impactscaused by coal power stations. It took SO2 and NOx
emissions in 2013 for each EU coal power plant from theEuropean Pollutant Release and Transfer Registry (E-PRTR) and ran these emissions through a model usingweather data and population density to estimate healthimpacts across the continent.8
The health impacts of the various emissions levels arecalculated and expressed as premature deaths, new casesof chronic bronchitis, days of children suffering from asthmasymptoms, lost working days, and overall health bill in euros.
As in the previous report, coal plants no longeroperational were removed.
For this report, an additional step was required in orderto calculate what the 2013 emission rates were for eachcoal power plant.9 The modelling process to calculate theemissions for each coal power plant for each scenario isshown in Figure 4.
16 LIFTING EUROPE’S DARK CLOUD
8 See ‘Europe’s Dark Cloud: How Coal-Burning Countries are Making their Neighbours Sick’for more information on the original methodology: https://wwf.fi/mediabank/8633.pdf
9 To estimate the 2013 release rates, CO2 emissions are used as a proxy for flue gasemissions using the formula: [NOx/SO2 emissions in tonnes] / ([CO2 emissions in tonnes]* 3563.4) x 1,000,000,000. This formula has been tested against actual reported
emissions and shown to be effective. The same emission factors are used by theEuropean Environmental Agency and this ratio is applied to both lignite and hard coal.
10 A similar approach was used in the report: 'Health and Economic Implications ofAlternative Emission Limits for coal-fired power plants in the EU', EEB and Greenpeace EEB,May 2015: http://www.eeb.org/index.cfm/library/eu-health-impacts-technical-report/
A BREATH OF FRESH AIR? 2.THE HEALTH BENEFITS OF CUTTING COAL
CHAPTER 2.
FIGURE 4.
METHODOLOGY

LIFTING EUROPE’S DARK CLOUD 17
SCENARIOS
This methodology has been used to produce emissionsmodels for sulphur dioxide (SO2), nitrogen oxides (NOx) andprimary particulate matter (PM10) in the following scenarios:
• The ‘2016 IED limits’ scenario is based on maximumemissions limits for the three air pollutants (SO2, NOx
and PM) under the Industrial Emissions Directive (IED)that came into force on 1 January 2016 - the so-called‘EU safety net’.
• The ‘Proposed BREF limits’ scenario is based on theupper limit of the emission range that will apply fromfour years after publications of the revised ‘BestAvailable Techniques Reference Document’ (BREF) forLCP plants (the ‘LCP BREF’).
• The ‘Best Available Techniques (BAT)’ scenario showswhat could be achieved if the most effective techniquesdescribed in the revised LCP BREF, which will bestandard for any “new” plants, were applied to existinginstallations. This corresponds to the lower level of theemission range set for existing plants in the ‘LCP BREF’.
The methodology takes the lowest emissions rate,ignoring higher limits for coal power plants under theDesulphurisation Rate Derogation for SO2 and ‘peak load’derogations, and therefore it probably over-forecasts theupcoming reduction in pollution as a result of the 2016IED limits. It also takes no account of the considerabletransitional loopholes that are applied to allow forpollution over IED limits until 2024 (see Chapter 3).10
RESULTS
The proposed BREF limits would lead to a reduction ofemissions, compared to the 2016 IED limits. In total, SO2 emissions should be cut by 28 percent and NOx
emissions by 16 percent.
However, these reductions are still a long way off whatcould be achieved by implementing pollution limitsbased on the established, tried-and-tested Best AvailableTechniques set out in the stricter BAT range.
ADRS @U@HK@AKD SDBGMHPTDR 'A@S(
OQNONRDC AQDE KHLHSR
P
CTRS -38% (-8,623 tonnes)RN¨ -28% (-133,845 tonnes)MNw -16% (-85,851 tonnes)
,70$
,05$
,17$
,5/$
,8/$
,27$
CTRS -90% (-421,272 tonnes) RN¨ -60% (-323,336 tonnes)MNw -81% (-18,159 tonnes)
RN¨
MNw
RN¨
MNw
FIGURE 5. TOTAL POTENTIALEMISSIONS REDUCTIONSCOMPARED TO 2016 IED LIMITS
TABLE 2. ANNUAL HEALTH IMPACTS OF COAL BURNING POWER PLANTS
Annual damage caused(EU21) (See Annex I)
Premature deaths
New cases ofchronic bronchitis in adults
Days of childrensuffering fromasthma symptoms
Lost working days
Total associatedhealth costs (VSL, median/ highvalue, 2013 prices)
2013 emissions(operational coal
plants only)
22,900
11,800
538,300
6,575,800
€ 33.3 bn / € 63.2 bn
2016 IEDlimits
11,400
5,800
261,800
3,306,400
€ 16.5 bn / € 31.4 bn
Proposed BREFlimits
8,900
4,500
201,800
2,542,700
€ 12.8 bn / € 24.3 bn
100% coal phaseout, replaced by
clean energy
0
0
0
0
€ 0
Best AvailableTechniques
(BAT)
2,600
1,200
54,900
600,300
€ 3.7 bn / € 7.1 bn
18 LIFTING EUROPE’S DARK CLOUD
CHAPTER 2: A BREATH OF FRESH AIR?
11 For more information about the cross-border impact of coal pollution see the originalreport: ‘Europe’s Dark Cloud: How coal-burning countries are making their neighbourssick’. https://wwf.fi/mediabank/8633.pdf
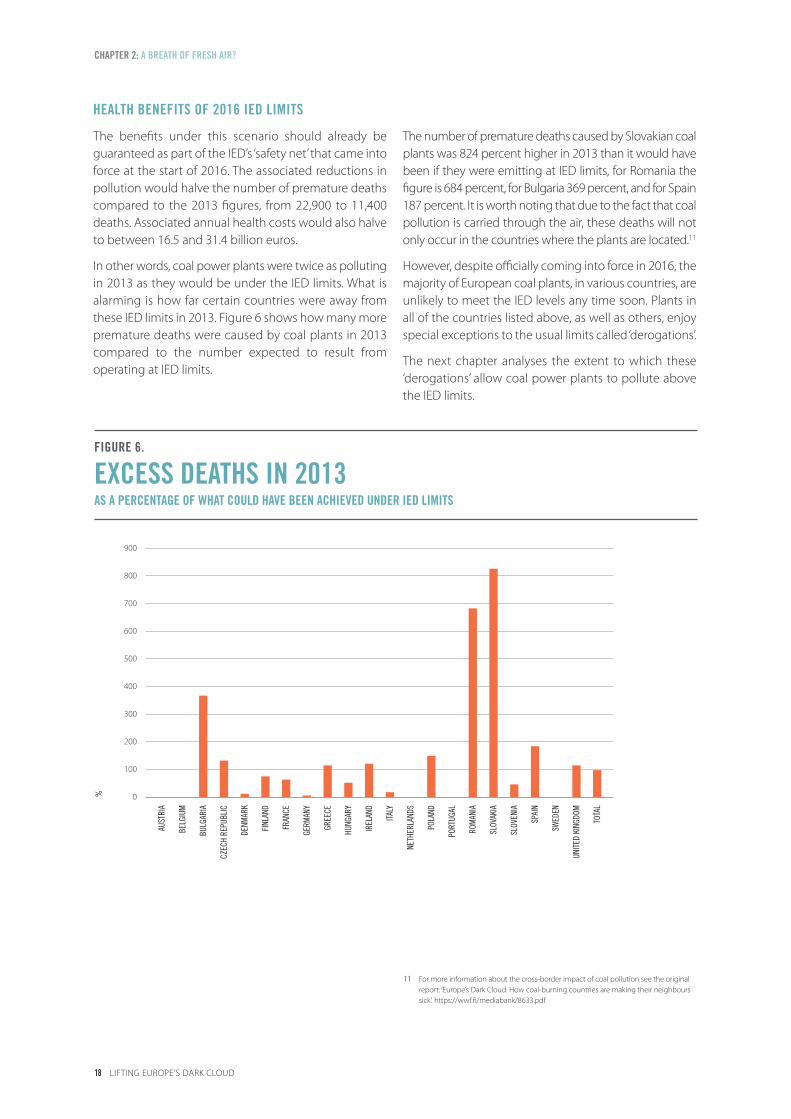
HEALTH BENEFITS OF 2016 IED LIMITS
The benefits under this scenario should already beguaranteed as part of the IED’s ‘safety net’ that came intoforce at the start of 2016. The associated reductions inpollution would halve the number of premature deathscompared to the 2013 figures, from 22,900 to 11,400deaths. Associated annual health costs would also halveto between 16.5 and 31.4 billion euros.
In other words, coal power plants were twice as pollutingin 2013 as they would be under the IED limits. What isalarming is how far certain countries were away fromthese IED limits in 2013. Figure 6 shows how many morepremature deaths were caused by coal plants in 2013compared to the number expected to result fromoperating at IED limits.
The number of premature deaths caused by Slovakian coalplants was 824 percent higher in 2013 than it would havebeen if they were emitting at IED limits, for Romania thefigure is 684 percent, for Bulgaria 369 percent, and for Spain187 percent. It is worth noting that due to the fact that coalpollution is carried through the air, these deaths will notonly occur in the countries where the plants are located.11
However, despite officially coming into force in 2016, themajority of European coal plants, in various countries, areunlikely to meet the IED levels any time soon. Plants inall of the countries listed above, as well as others, enjoyspecial exceptions to the usual limits called ‘derogations’.
The next chapter analyses the extent to which these‘derogations’ allow coal power plants to pollute abovethe IED limits.
0
100
200
300
400
500
600
700
800
900
%
POLA
ND
GERM
ANY
UNIT
ED K
INGD
OM
TOTA
L
ROM
ANIA
BULG
ARIA
SPAI
N
CZEC
H RE
PUBL
IC
ITALY
GREE
CE
SLOV
AKIA
FRAN
CE
NETH
ERLA
NDS
HUNG
ARY
SLOV
ENIA
PORT
UGAL
FINL
AND
IREL
AND
DENM
ARK
BELG
IUM
AUST
RIA
SWED
EN
FIGURE 6.
EXCESS DEATHS IN 2013 AS A PERCENTAGE OF WHAT COULD HAVE BEEN ACHIEVED UNDER IED LIMITS

LIFTING EUROPE’S DARK CLOUD 19
HEALTH BENEFITS OF PROPOSED BREF LIMITS
The proposed BREF limits could further reduce annualEurope-wide premature deaths from 11,400 to 8,900deaths compared to the 2016 IED limits. Achieving theselevels across Europe would yield annual health-costrelated savings of between 3.7 and 7.1 billion euros.
This saving of 22 percent fewer premature deaths is quiteevenly spread across all countries, see Figure 7. This isbecause by the time the IED limits are implementedproperly, the high emitters of today will have got backinto line. The lowest benefit is in countries wherenational legislation already exists with lower limits.
In 2013, coal plants in Austria, Belgium, Denmark, theNetherlands and Sweden were already near BREF levels.
Interestingly, implementing the proposed BREF limitsacross Europe significantly narrows the gap between allcountries, changing the percentage of the totalEuropean coal pollution for which each country isresponsible, see Figure 9. Countries which were onceleaders in keeping emissions rates low, now begin tostand out. Germany was responsible for 19 percent of allpremature deaths in 2013, but once all coal plants areBREF compliant, that will rise to 39 percent.
0
5
10
15
20
25
30
35
%
POLA
ND
GERM
ANY
UNIT
ED K
INGD
OM
TOTA
L
ROM
ANIA
BULG
ARIA
SPAI
N
CZEC
H RE
PUBL
IC
ITALY
GREE
CE
SLOV
AKIA
FRAN
CE
NETH
ERLA
NDS
HUNG
ARY
SLOV
ENIA
PORT
UGAL
FINL
AND
IREL
AND
DENM
ARK
BELG
IUM
AUST
RIA
SWED
EN
FIGURE 7
SAVINGS OF PREMATURE DEATHS FROM PROPOSED BREF LIMITS, AS COMPARED TO IED LIMITS
HEALTH BENEFITS OF BEST AVAILABLE TECHNIQUES (BAT)
The strictest scenario, modelled on Member Statessetting limits based on the lower end of the BATemissions range, demonstrates genuinely significantpotential for reductions in health costs and prematuredeaths. Under this scenario the annual premature deathrate could be reduced by 71 percent, compared to theproposed BREF limits, from 8,900 to 2,600 deaths.
The BAT emission levels are already achieved by someexisting coal power plants in the EU under economically andtechnically viable conditions. Achieving these reductions
would therefore only require the rolling out of existingtechniques to further plants and operating abatementperformance to BAT levels. One of the biggest savings isachieved by installing Selective Catalytic Reduction (SCR)on lignite coal plants, see infobox on page 22.
The enormous public health savings and huge economicimpact of lost working days must lead responsibleauthorities to demonstrate a commitment to protect thepublic interest first when they set permit limits.

20 LIFTING EUROPE’S DARK CLOUD
CHAPTER 2: A BREATH OF FRESH AIR?
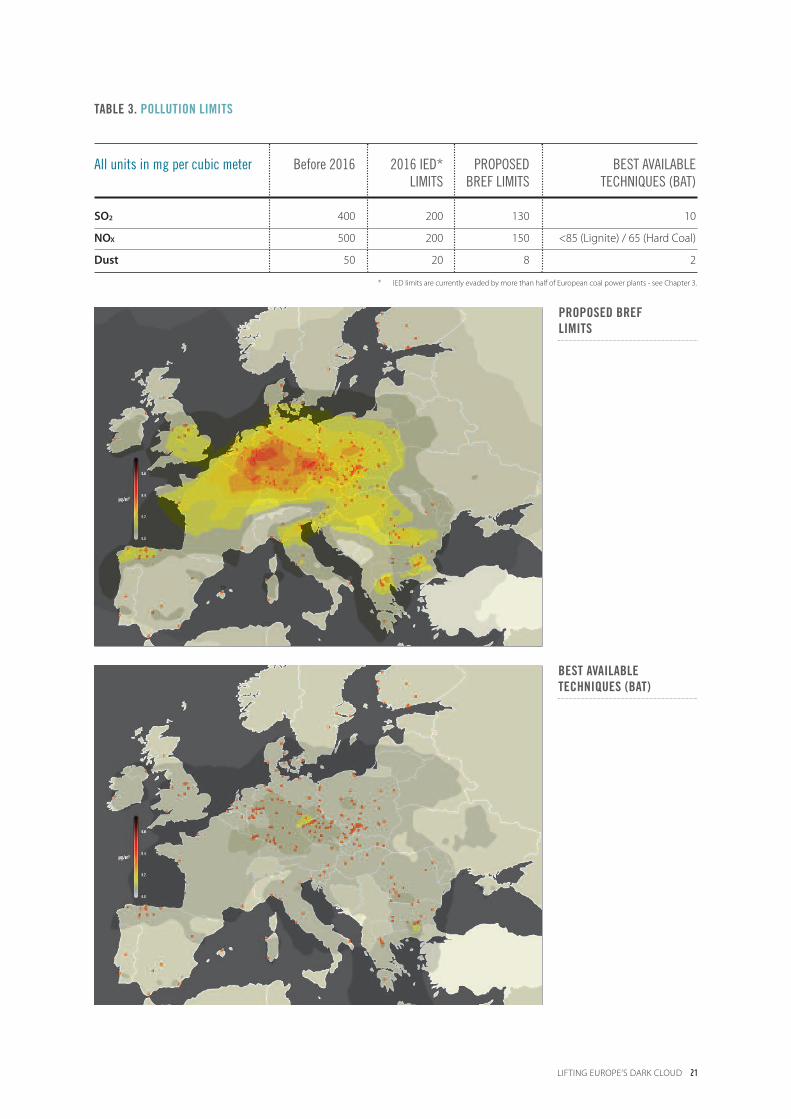
FIGURE 8A-D.
PM2.5 POLLUTION FROM EUCOAL POWER PLANTS
2013 EMISSIONS FROM CURRENTLY OPERATING PLANTS
2016 IED LIMITS
LIFTING EUROPE’S DARK CLOUD 21
All units in mg per cubic meter
SO2
NOX
Dust
Before 2016
400
500
50
2016 IED*LIMITS
200
200
20
PROPOSEDBREF LIMITS
130
150
8
BEST AVAILABLE TECHNIQUES (BAT)
10
<85 (Lignite) / 65 (Hard Coal)
2
* IED limits are currently evaded by more than half of European coal power plants - see Chapter 3.
TABLE 3. POLLUTION LIMITS
PROPOSED BREF LIMITS
BEST AVAILABLE TECHNIQUES (BAT)

22 LIFTING EUROPE’S DARK CLOUD
CHAPTER 2: A BREATH OF FRESH AIR?
SELECTIVE CATALYTIC REDUCTION FOR LIGNITE PLANTSLignite, or ‘brown coal’, is one of the worst-polluting fuels currently in use. Meeting the stricter NOx limits atthe lower level of the BAT range would require lignite plants to implement a technique called SelectiveCatalytic Reduction (SCR).
SCR enables dangerous NOx pollution to be cut by a further 85-95 percent beyond reductions alreadyachieved through boiler tuning. It is a standard technique for EU hard coal plants and has been successfullyimplemented for lignite at Oak Grove in Texas, USA. The technology is also widely used in heavy duty trucksin order to meet EURO VI NOx pollution standards.
The currently proposed BREF limit for NOx for lignite is 175mg/Nm³, with a lower BAT range of <85mg/Nm³.In fact, SCR can reduce NOx emissions even further to 40mg/Nm³, which is less than an eighth of the currentEU average of 330mg/Nm³.
Only one lignite plant in the EU, Sostanj 6 in Slovenia, currently has SCR operational. However, all existinghard coal plants in Austria, Germany, Italy, the Netherlands, and France already have SCR in place that couldreduce NOx emissions to less than 60mg/Nm³ if operators were obliged to operate it to its full potential.
National decision makers can demonstrate a commitment to the health of their citizens by ensuring thatemissions levels are set in line with BAT.
OTHER
SPAIN
BULGARIA
ROMANIA
UNITED KINGDOM
GERMANY
POLAND0
10
20
30
40
50
60
70
80
90
100
%
2013 EMISSIONS FROM CURRENTLY OPERATING PLANTS
2016 IEDLIMITS
PROPOSED BREF LIMITS
LEGEND
FIGURE 9.
WHICH COUNTRY’S PLANTS ARE RESPONSIBLE FOR THE PREMATURE DEATHS?AS A PERCENTAGE WITHIN EUROPE

HOW COAL PLANTS ARE CURRENTLY EVADING IED LIMITS
The model results from the previous chapter show thatthe IED limits, which came into force from January 2016,should have already yielded huge health benefits acrossEurope. However, this report finds that with morethan half of European coal power plants enjoyingpermission to pollute above IED limits, the exceptionhas become the rule for coal power.
IED binding emissions limits on the three main airpollutants NOx, SO2 and dust were based on the upperrange (more polluting) limits set in the first LCP BREFpublished in 2006. The IED legislation adopted in 2010ensured that the limits would apply for existing plants asfrom 1 January 2016.12
However, while the IED was being negotiated manyMember States, in particular eastern European countriesand Greece, Finland and the UK, lobbied to createloopholes for their plants.13 As a result the directivecontains numerous ‘derogations’, built-in exceptions tothe usual rules that include relaxations and timeextensions allowing existing plant operators to avoid theIED limits until as late as 2024.14
Derogations have significantly undermined efforts toreduce harmful emissions across Europe, granting coalpower plants permission to exceed limits for up to eightyears. By 2024, many plants will have spent 18 yearspolluting at levels above those agreed as technically andeconomically feasible in the 2006 LCP BREF.
This study highlights seven derogations which Europeancoal power plants are currently using in order to evade IEDlimits. EU and national lists were compared to identifywhich coal plants are taking advantage of each derogation.
The grounds for granting these derogations is extensiveand includes plants that intend to close within eightyears, that are operating for a limited number of hours,that are in EU accession countries, that provide heatingto the local area, that burn indigenous fuel or that arelocated on small islands. A full list of these derogationscan be found in Table 4.
The results are startling. At the time of writing inOctober 2016, 56 percent of all European coal plantsdo not have to comply with the 2016 IED limits. Thesecoal plants were responsible for 60 percent of the 22,900premature deaths caused by coal power plants andexposed in the original Europe’s Dark Cloud report.
This is a huge wake up call for decision makers abouthow derogations are currently impacting the healthof European citizens and undermining efforts tostrengthen emissions limits. A review of ongoingderogations should be conducted and no furtherderogations should be granted.
12 The emission limit values referred to in Annex V of the IED, the so-called ‘EU Safety net’:http://eur-lex.europa.eu/legal-content/EN/TXT/PDF/?uri=CELEX:32010L0075&from=EN
13 See political agreement 10998/09 LIMITE of 15 June 2009 obtained by the EEB:http://www.eeb.org/EEB/assets/File/10998-09%20LIMITE.pdf. BG, EE, EL, CY, PL, PT, RO,SI, UK were responsible for watering down on all counts. IT, LT also supported the othersto extend the TNP up to 2023. ES and IE wanted to introduce a different reference
period in order to calculate higher emissions ceilings. EL fought for 32,000 hours LLDversion. PL and SK wanted weaker district heating derogation; ES, PL, RO, SK, UK wantedto have even more relaxation for indigenous solid fuels derogation.
14 See the EEB briefing for more information on the main changes brought by the IED andderogations: http://www.eeb.org/?LinkServID=290B7936-ADF0-4AD8-D16350AB49EE7DFC&showMeta=0&aa
DEADLYDEROGATIONS 3.COAL’S PERMISSION TO POLLUTE
CHAPTER 3.
LIFTING EUROPE’S DARK CLOUD 23

24 LIFTING EUROPE’S DARK CLOUD
CHAPTER 3: DEADLY DEROGATIONS
15 Sources: Derogations on LLD, CHP and Small isolated systems based on list fromEuropean Commission obtained by the EEB. TNP: CIRCA-B website and Official Journalof the EU. Accession Treaty, Burning of indigenous solid fuels: Own assumptions. OfficialData: Andorra and Lippendorf.
TABLE 4. DEROGATIONS TO IED LIMITS
Name of derogation(see annex ii)
What does itmean?
Postpones full compliance with IED limits by 4.5 years from Jan-2016 to Jul-2020
Operators can trade pollutionallowances and limit values
do not apply at the plant level.
The pollution bubble decreasesfrom 2016-2020.
IED limits do not apply for coal plants operating up to
17,500 hours until 2024 when they must either be closed or
reopened as a “new” plant.
Less strict IED limits if the coal plant runs less than
1,500hours/year. (450mg/Nm³ NOx
and 800mg/Nm³ SO2 instead of 200mg/Nm³)
This derogation is not set to expireand can be used indefinitely until
new rules are imposed.
Postpones full IED compliance until 2018.
IED limits do not apply for coal-burning district heating
power plants for 7 years to 2023.
More generous IED levels for SO2 for plants burning
indigenous coal.
IED limits do not apply for coalplants on small islands until 2020.
Who getsit?
National governmentshad to make an
application to the EU on behalf of their plants.
Any plants meeting the criteria.
National governmentsinformed EU.
Any coal plant declaringit will limit running
to 1,500 hours.
Some coal plants inPoland and Romania.
Coal plants with district heating
(<200MWth, >50% ofwaste heat used).
Some lignite plants, such as
Lippendorf in Germany. Andorra in Spain,
Brikel & Maritsa 3 in Bulgaria.
Alcudia II (Spain), BoisRouge (France).
Number of coal plants
identified withderogation15
99
30
n/a
24
19
at least 4
2
143 out of 257 (56%)
2013 prematuredeaths from the
coal plantsidentified
9,170
3,380
n/a
3,940
420
660
83
13,560 out of22,900 (60%)
Transitional NationalPlan (TNP)
Limited Lifetime Derogation (LLD)
Peak load
Accession Treaty
District Heating (CHP)
Burning of indigenous solid fuels(‘DesulphurisationRate Derogation’)
Small isolatedsystems
TOTAL (note: is not a straight sum of each derogation, because some coal plants have more than one derogation)
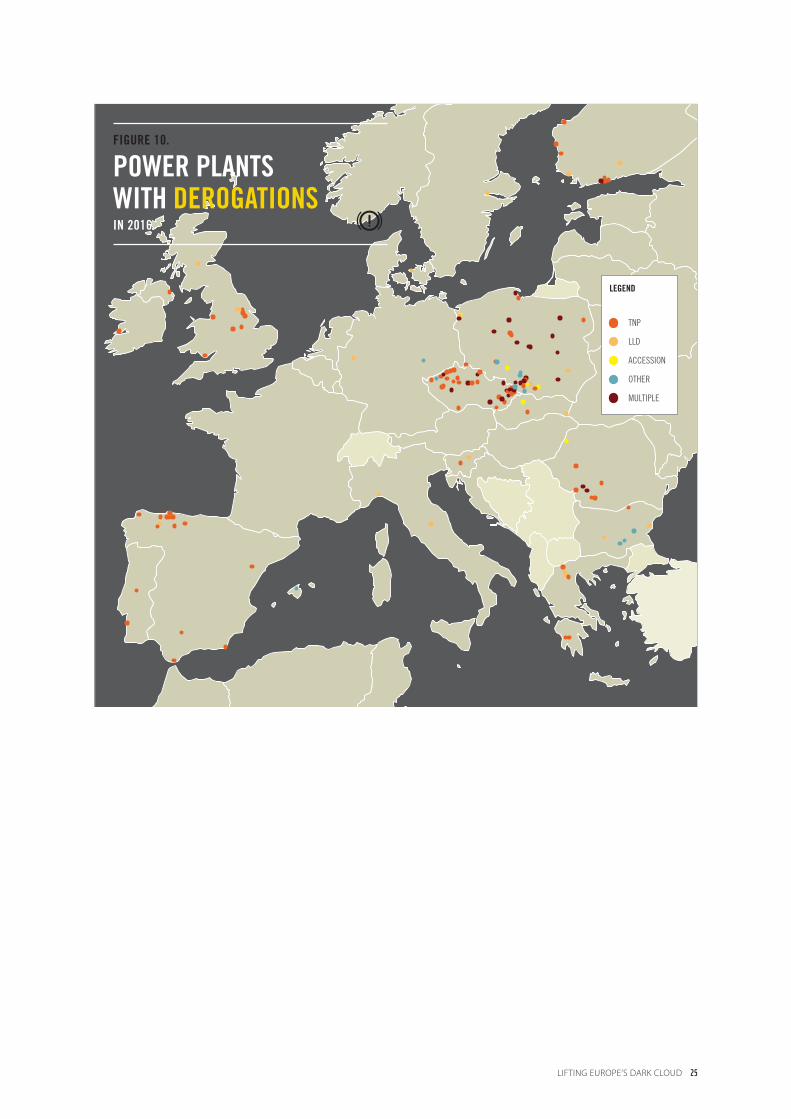
LIFTING EUROPE’S DARK CLOUD 25
TNP
LLD
ACCESSION
OTHER
MULTIPLE
LEGEND
FIGURE 10.
POWER PLANTS WITH DEROGATIONSIN 2016

26 LIFTING EUROPE’S DARK CLOUD
CHAPTER 3: DEADLY DEROGATIONS
UK COAL: ABERTHAW HIT FOR SIX TIMES THE LEGAL LIMITSWhile the UK government’s pledge to phase out coal is to be welcomed, its decision to allow UK operatorsto use the TNP derogation will mean many coal plants are actually allowed to increase their emissions in theyears before they close.
For a single plant, RWE Aberthaw in Wales, an emissions ceiling was set for NOx at an incredible 27,843 tonnes.This figure was based on emissions of 1,200mg/Nm³ - six times the 200mg/Nm³ limit set in the IED.
Just weeks before this report was published, and following advice from the EEB and its member Friends ofthe Earth England, Wales and Northern Ireland, the European Court of Justice ruled16 that the emissionsceiling granted to Aberthaw was illegal under European law. Yet in the first half of 2016 the plant had alreadyemitted 11,003 tonnes of NOx, almost four times the 4,800 tonnes permitted under IED limits. In light of theruling, Aberthaw should be removed from the TNP and moved to the peak load derogation until closure.
But Aberthaw is not an exception. Across the UK the TNP derogation has led to 2016 emissions ceilings foreight plants being set significantly higher than their actual reported emissions for 2013. For SO2 this was 25 percent higher (104Kt versus 83Kt) and for dust 300 percent higher (13Kt versus 3Kt). For NOx, althoughthe total 2016 allowance was less than the 2013 reported emissions, it was still significantly more than theeight TNP plants would emit. Actual emissions for the first six months of 2016 for these plants were 28Kt,just over a third of the 75Kt annual ceiling, demonstrating the significant over-allocation in the TNP scheme.
Sky-high emissions ceilings well beyond what is actually being emitted are clearly not an effective means toreduce pollution and benefit the health of people breathing in coal’s ‘dark cloud’.
16 Judgment of the Court of 21 September 2016 in Case C-304/15http://curia.europa.eu/juris/document/document.jsf?text=&docid=183607&pageIndex=0&doclang=EN&mode=req&dir=&occ=first&part=1&cid=1023588
17 For more information on what the TNP is about, please check the EEB Briefinghttp://www.eeb.org/EEB/?LinkServID=8520E4D5-A967-566A-8BC46FC1EEDDD956
ABERTHAW POWER STATION, WALES, UK.© cliff hellis

LIFTING EUROPE’S DARK CLOUD 27
DEROGATIONS TO IED LIMITS
The Transitional National Plan (TNP) is the most deadlyderogation by far. The TNP delays the full impact of IED byfour and a half years to July 2020. Thirteen nationalgovernments applied for and obtained the TNP derogationfor their coal plants: Bulgaria, the Czech Republic, Finland,Greece, Hungary Ireland, Poland, Portugal, Romania,Slovakia, Slovenia, Spain and the United Kingdom.
Although the TNP ‘phases-in’ IED limits, it uses a tradableemissions bubble system, which means in practice coal powerplants can pollute at much higher levels. The TNP’s ‘allowancebubbles’ are based on the the generous maximum emissionlevels set in the 2001 Large Combustion Plants Directive, evenif real emissions are lower. Less-polluting plants can trade theirallowances with other operators participating in the TNPderogation. The trading system means that the highest levelsof pollution are reached at the national level.17
In general it is national authorities that unilaterally decidedto grant the optional TNP derogations without any publicparticipation. The EEB, in collaboration with HEAL, initiatedchallenges against the European Commission for grantingthe TNP without proper public participation. However,these challenges were dismissed because of the EU’sincomplete implementation of the Aarhus Convention.18
Further legal challenges initiated by EEB members (e.g.Frank Bold Society in the Czech Republic, IIDMA in Spain)are ongoing in order to prevent certain plants from beinggranted extra pollution rights under the TNP.
This study found that 99 out of 257 coal power plants areusing the TNP derogation. The 99 plants were responsiblefor 40 percent of all premature deaths caused by thereported 2013 emissions (9,170 of the 22,900 deaths).19
Although the TNP derogation will end in July 2020, it islikely many of the coal plants using it will then swap intothe ‘peak load’ derogation, where they can continueavoiding the full IED limits indefinitely.
The next two most-used derogations are:
• The Limited Lifetime derogation (LLD), whichmeans coal plants due for closure can ignore IED limitsfor a further 8 years, until 2024.
• The Accession Treaty derogation, where 24 verypolluting coal power plants in Poland and Romaniaare still able to evade lower IED NOx and SO2 limits.
The countries with the most derogations in total aremostly those which also applied for TNP derogations for their plants – see Figure 11. Six countries have 100 percent of their coal fleet under derogation. This means there are no coal power plants in Finland,Ireland, Portugal, Slovenia, Spain or the UK whichare currently required to meet the IED limits.
0
10
20
30
40
50
60
70
NUM
BER
OF C
OAL
POW
ER P
LANT
S
POLA
ND
GERM
ANY
UNIT
ED K
INGD
OM
ROM
ANIA
BULG
ARIA
SPAI
N
CZEC
H RE
PUBL
IC
ITALY
GREE
CE
SLOV
AKIA
FRAN
CE
NETH
ERLA
NDS
HUNG
ARY
SLOV
ENIA
PORT
UGAL
FINL
AND
IREL
AND
DENM
ARK
BELG
IUM
AUST
RIA
SWED
EN
NO DEROGATION
HAS DEROGATION0
LEGEND
FIGURE 11.
COAL POWER PLANTS WITH IED DEROGATIONSSEPTEMBER 2016
18 Requests for internal reviews are available here: http://ec.europa.eu/environment/aarhus/requests.htm19 Based on an analysis of all 257 coal power plants operating in October 2015, for which
2013 emission data was available.20 For Poland see: http://eur-lex.europa.eu/legal-content/EN/TXT/?uri=CELEX:12003TN12/13/D
28 LIFTING EUROPE’S DARK CLOUD
START-UP / SHUT-DOWN EXCEPTION
It is also worth highlighting a further derogation: no coalpower plants need to comply with full IED limits whilestarting up or shutting down. In fact, while pollutionpermits should contain measures relating to start-up andshut-down, such as the use of cleaner fuels, the commonnational practice is to simply discard measurementsobtained during these phases when assessing compliance.
Coal power plants emit much higher levels during start-up periods, and therefore even coal plants which havenot been granted a derogation are still not required tocomply with the IED limits all of the time.22 The impactof this exception is not modelled in this report.
BREF DEROGATION - IED ARTICLE 15(4)
The IED provides one final derogation that can be usedto give permission to pollute beyond the levels set in theBREF. This exception can be found in Article 15(4). of theIED and, unlike other derogations, will never expireunless the law is changed.
While the IED was being drafted many Member Statesopposed moves to make it more difficult to achieve thisderogation.23 Even so, plant operators prefer to avoidresorting to this loophole because it requires a publicconsultation to be held before being granted.
It must also be shown that implementing the BREF levelswould lead to “disproportionately higher costs comparedto the environmental benefits”.
However, no criteria have been issued on how to judgewhether costs are disproportionate and as a resultdecisions are likely to be highly subjective.
The damage caused by existing loopholes in the IED andexposed in this chapter should warn against opening thedoor to any future derogations from the BREF standardsand Member States should refuse to grant any Article15(4) derogations.
To make up for unduly high levels of pollution caused bythe delay in the BREF revision and extensive derogationsto IED limits, BAT emissions levels should be imposedmuch earlier than 2021 and consistently for all coal plants.
Polluters, with the support of some Member States, havelobbied for new loopholes in the revised BREF, whichshould be removed before the document is adopted(see recommendations in Chapter 4).
CHAPTER 3: DEADLY DEROGATIONS
21 ‘Europe’s Dark Cloud: How Coal-Burning Countries are Making their Neighbours Sick’,HEAL, CAN, WWF EU, Sandbag, 2016, https://wwf.fi/mediabank/8633.pdf.
22 Due to lobbying by certain Member States, especially the UK and Poland, start-up and shut-down periods are not even counted towards the 17,500 hours when a plant is using the LLD.
23 These were BG, IT, LT, LV, MT, PL, and the usual suspect: UK. France also did not supportthe stronger text by European Parliament.
DEROGATIONS: POLAND’S POLLUTION PICK AND MIXCertain Member States combine several derogations to permit coal plants to pollute at astonishing levels.In Poland derogations to the emissions limits set in the 2001 LCP Directive negotiated in the AccessionTreaty20 are combined with the 17,500 hours LLD or the TNP.
All five boilers of the Adamow plant (each 351MWth) are allowed to apply an emission limit of996/500/100mg/Nm³ for SO2, NOx and dust until 2024, whilst the outdated 2001 LCP Directive limitsapplicable from 2016 would apply 400/200/50mg/Nm³. Under the IED, each of those boilers would have tocomply with limits of 200/200/20mg/Nm³. The Adamow plant is ranked 5th among the Polish and 19th outof EU plants that caused the most premature deaths in 2013.21

Decision makers must put the public interest aheadof short-sighted industry demands and act to cutemissions at their source. When limits are set theymust demonstrate a real commitment to protectinghuman health and not amount to permissions topollute for Europe’s dirtiest fuel.
The enormous benefits of cutting pollution from coal-fired plants was demonstrated in Chapter 2. This chapterlays out some of the concrete steps that must be takenin order to ensure the greatest possible health benefitsfor European citizens, and to reduce the external coststo society from air pollution.
In the run up to, and following, the adoption of therevised LCP BREF in late 2016, specific measures shouldbe taken at both the European and national levels.
CONCLUSIONS 4.LIFTING EUROPE’S DARK CLOUD
CHAPTER 4.
LIFTING EUROPE’S DARK CLOUD 29
BEŁCHATÓW POWER STATION, POLAND.© Jacek

30 LIFTING EUROPE’S DARK CLOUD
REMOVE LOOPHOLES IN THE LCP BREF (BAT CONCLUSIONS)
There is still time to remove loopholes from the latest draftof the revised LCP BREF. The following measures wouldlead to a significantly more effective final document:24
a. A fair definition of what constitutes a “new” plant
Emissions range levels depend on whether plants areclassified as “new” or “existing”. The distinction is madebased on the permit issue date and whether or not theplant’s boiler has been completely replaced. Many plantsthat could be fairly considered “new”, either because theyalready performed relatively well, or because they havebeen significantly retrofitted, including with the latestpollution control equipment, would nevertheless beconsidered as “existing plants”, and therefore subject tomore lenient pollution limts.
b. Delete footnote exceptions for “plants put intooperation no later than 7 January 2014”
A number of footnotes in the current draft explicitly providefor higher levels of pollution for “plants put into operationno later than 7 January 2014”. This exception, based on anarbitrary date and without a technical basis, would relax thedaily upper emission level for 98 percent of coal and ligniteLCPs in Europe and should therefore be removed. Theserelaxations would effectively align new daily averagedpollution levels with the already binding levels in the IED,thereby failing to achieve any improvement or movetowards the reduced pollution limits possible with BAT.
c. Remove explicit relaxations for pre-1987 ‘peak load’ plants
Special exceptions have been made for the oldest plantsoperating below a certain number of hours each year.25
These plants are used on occasion to meet peak demandand are often particularly polluting. The ‘Article 15(4)’derogation already exists to allow these plants to operate.26
However, by offering an explicit relaxation here the needfor public consultation and approval by authorities iscircumvented. Because this exception has been extendedto lignite and fluidized bed coal LCPs, it could effectively
double the concentrations of NOx emitted from theseplants in Bulgaria, Czech Republic, Poland, Romania,Slovenia and Slovakia27 and, as these plants are often usedto meet winter demand, exacerbate air quality when it isalready at its worse due to smog formation.
d. Delete or amend the derogation for high-sulphur lignite combustion
Burning high-sulphur lignite leads to very high levels ofSOx emissions. Yet a derogation currently in the text willallow a handful of badly-performing plants to emit almostthree times more than the upper BAT range level.28
e. Provide clarity about average emissions periods
At present it is not clear whether emission levels will haveto be met based on annual or daily averages, or whetherboth will apply. Dangerous daily peaks should not beable to be disguised in acceptable annual averages.
SPEED UP THE ADOPTION AND PUBLICATION OF THE REVISED LCP BREF
Despite the many loopholes and derogations containedin the current draft of the document, it is essential that arevised LCP BREF be adopted this year.
The current LCP BREF review process started at the endof October 2011 and should have been completed byAugust 2014. As of October 2016 that has yet tohappen.29 Industry interventions have successfullydelayed the process by more than two years, with seriousconsequences for human health.
At the time of publication (10 October 2016) 44,515premature deaths and a health bill of between 64.9and 123.2 billion euros could have been avoided ifcoal operators had been required to meetdemonstrated BAT since the time the revised BREF hadbeen due to be published in August 2014.30
CHAPTER 4: CONCLUSIONS
24 For more information on these recommendations, see EEB input provided to MemberStates’ experts:http://www.eeb.org/EEB/assets/File/EEB%20Comments%20Forum_LCP%20BREFD1.pdf
25 The main one being a derogation allowing NOx emissions up to 340mg/Nm³ instead of150mg/Nm3, which has been pushed for by the UK to prevent expensive retrofits forNOx pollution control (SCR) to their pulverised hard coal boilers. The EuropeanCommission has now even extended this relaxation to other type of existing hard coalboilers and to lignite plants.
26 See Chapter 3
27 Calculated from 2015 EU -ETS emissions data this could benefit to about 11GWel of low load(<40%) lignite plants which currently exceed the IED minimum binding 200mg/NOx limit
28 These are most likely the following plants: 5 Bulgarian Maristsa East 2 (BG-8), East 3 (BG-9), Marisa 3(BG-3), Bobov Dol (BG-4) and Brikel (BG-14); 2 in Czech Republic Prunerov(CZ-12) and Opatovice (CZ-33); 2 Greek Megapoli A (EL-7) and B (EL-8), the SpanishTeruel/Andorra (ES-6), the Slovakian Novaky (SK- 14) and the German Lippendorf (DE-28) totalling 2,750 premature deaths
29 The IED says every 8 years, the current LCP BREF was adopted in July 2006 30 EEB ‘death ticker’ data as of 10 October 2016: http://www.eeb.org/index.cfm/death-ticker/
EU ACTIONS

LIFTING EUROPE’S DARK CLOUD 31
It should not be forgotten that these BAT levels were seton the basis of 2010 emissions data from plantsoperating under economically and technically viableconditions at that time. BAT levels have therefore beendemonstrated by certain plants for at least six years.
In the face of this evidence further delays are clearly nolonger acceptable. The final revised LCP BREF must beagreed and voted on in late 2016 and publishedearly in 2017 to ensure the minimum standards aremet by 2021.
IMPROVE THE IED
a. Review the ‘IED 2016 limits’ (IED minimumbinding limits) to reflect the updated levels setin the revised LCP BREF
The European Commission should revise the outdatedminimum binding emission limit requirements on NOx,SO2 and dust, which were set in 2010 when the IED wasadopted.31 These should be updated to match the bestperforming BAT levels recognised in the revised BREF.
Article 73 of the IED requires the European Commission toreview the ‘EU safety net’ if there is a need for Union actionto prevent or reduce the impact of large combustion plantson the environment or in order to ensure consistentimplementation of Best Available Techniques.
This report shows there are significant impacts andpotential gains from stricter limits. A compliance deadlinefor the new limits should be set for 2024 at the latest. Thiswould not only promote a level playing field for industry(currently demonstrated as uneven by the large numberof derogations implemented by various Member States)but also deliver the significant benefits to public healthand environmental protection demonstrated in Chapter2, thus reducing existing health inequalities linked to theuneven levels of pollution across Europe.
Current limits for mercury emissions should also beincluded32 and further pollutants should be added, includingfluorides and hydrochloric acid. New pollution levels shouldbe continuously monitored in order to ensure compliance.
Further, emissions limits in line with BAT shall alsoapply during start-up or shut-down periods whichcan last many hours. These periods are likely to occurmore often in future as coal is increasingly used as abackup energy source to meet peak demands, meaningplants are brought on and off line more frequently.
While renewables are flexible and clean, coal powerplants are currently allowed to operate under specialconditions and pollute more when responding tochanges in energy demand. This is not acceptable. Asemissions are very high during start-up, operators shouldbe required to use cleaner gaseous fuels at this time andto make sure associated emissions are abated.
b. Scrap the desulphurisation rate derogation
A review of the desulphurisation rate derogation is duebefore 2020. The Commission should act sooner to scrapit entirely. This exception has no technical basis andconstitutes an indirect subsidy for burning the worstlignite fuels. The derogation currently allows operatorsto reduce desulphurisation unit operation costs. Becausehigh-sulphur lignite is so polluting, even after havingremoved 97 percent of the sulphur, burning the fuelunder this derogation still results in higher levels ofpollution (in particular SOx, dust and mercury) comparedto the standard BREF level.
c. Make BAT benchmarks on energy efficiency obligatory
In order to fully implement the potential energyefficiency improvements set under the revised LCP BREF,the IED provision should be amended in order to requirethose BAT benchmarks to be obligatory.33
d. Publish emissions monitoring data online
Raw data of Continuous Emissions Monitoring (CEM)devices should be made publicly available for all facilities,this could be considered as a requirement for a futurereview of the European Pollutants Release and TransferRegister (E-PRTR).
31 These are the minimum binding limits that came into effect on 1 January 2016 andwere used to create the ‘2016 IED limits’ scenario in Chapter 2.
32 The European Commission and Member States should support proposals of the EuropeanParliament under the Minamata Convention implementation on mercury emissions limitsin line with the lower end of the BAT range as well as maximum mercury content in fuels.
33 With the European Emissions Trading Scheme (EU-ETS), it is left to the discretion ofMember States on whether they want to impose energy efficiency performancerequirements set in BAT on their operators.
32 LIFTING EUROPE’S DARK CLOUD
CHAPTER 4: CONCLUSIONS
QUICKER AND STRICTER NATIONAL IMPLEMENTATION (BAT STANDARDS)
EU legislation on environmental protection setsminimum standards and maximum deadlines.Considering the major health benefits demonstrated inthis report, Member States should take advantage of theopportunity to do more than European minimumstandards in the interests of protecting their citizens.
The responsible authorities in each Member Stateshould set pollution limits based on BAT andimplement them well in advance of the four yeardeadline. Investments in pollution reduction techniquesshould never be used to justify extending plant life.
Responsible authorities should take note of the potentialto reduce premature deaths and total health costs laidout in this report. They should act quickly to implementpollution limits based on the established, tried-and-testedBest Available Techniques set out in the stricter BAT rangeof the BREF. They can do so by revising national lawswhere they exist34 and by updating operating permits.
Member States should refuse to grant any Article15.4 derogations.
100% COAL PHASE OUT
A commitment to phase out coal entirely and speed-up the transition to renewable sources of energy andreduced energy consumption must be made bygovernments to demonstrate their commitment to thewell-being of citizens and the environment. Finland andthe United Kingdom have pledged to phase out coalcompletely. Belgium became coal-free this year and Austriawill by 2025 or earlier. Other countries must now catch up.
NATIONAL ACTIONS
36 A full assessment on the role of coal emissions and the new NEC-Directive will be madein an upcoming EEB publication later in 2016.
34 So-called ‘General Binding Rules’ which shall be updated to take into accountdevelopments in BAT (Article 17 of the IED).
35 New Directive on the reduction of national emissions of certain atmospheric pollutantsand amending Directive 2003/35/EC, not yet published.
CUTTING COAL TO MEET NATIONAL EMISSIONS CEILINGSBy 2019 Member States will have to have set out how they plan on meeting new annual national emissionsceilings set in the National Emissions Ceilings Directive (NEC-D)35 to be achieved by 2030 for five pollutantsincluding SO2, NOx and PM2.5. From a preliminary analysis,36 applying the ‘BAT scenario’ would mean that 14 out of21 coal-burning countries would immediately meet their SO2 NEC commitments, a further four (Austria, Denmark,France and Poland) could bring the SO2 levels to less of 7 percent of the total country allowance for 2030.
Applying the ‘BAT scenario’ for NOx emissions would mean that five countries (Belgium, Bulgaria, CzechRepublic, Greece and Poland) would immediately be able to bring the share of their coal NOx emissions ofthe total country NOx allowance to below 10 percent of the total country NOx allowance.
Belgium, Finland, Ireland, the Netherlands, Portugal, Romania, Sweden, Slovakia, Slovenia and Spain couldall meet their 2030 NEC Directive SO2 commitments entirely and immediately, if they choose to phase outcoal. For Bulgaria and the Czech Republic, a total coal phase-out would be enough to meet their total NECcommitments for both SO2 and NOx.
LIFTING EUROPE’S DARK CLOUD 33
POTENTIAL BENEFITS OF QUICKERAND STRICTER NATIONAL IMPLEMENTATIONThe benefits of implementing the lower, stricter limits are particularly clear for NOx emissions from lignite powerplants. If the stricter BAT range set at <85mg/Nm³ were implemented. Retrofits of secondary NOx abatementwith catalysts (SCR) can reduce NOx emissions by 85-95 percent down to 40 mg/Nm³, compared to the 2013EU average of 330mg/Nm³. The IED limit is 200mg/Nm³ and the proposed BREF upper limit 175mg/Nm³.
Implementing the stricter BAT level would cut the death toll from the EU’s 83 lignite plants from 4,100 to1,400 with the associated health bill reduced from 11.2 to 3.9 billion euros. This represents an annual savingof 7.3 billion euros.
In Germany, the emissions limit for NOx on lignite plants was set at 200mg/Nm³, already matching the 2016IED limits (under national law 13. BImSchV of 20 July 2004). This has led to average emissions of around 170-195mg/Nm³ for NOx at German lignite plants. Proposed BREF scenario limits would only lead to marginalimprovements and, more importantly, would enable operators to circumvent applying the more effectiveNOx abatement (SCR).
For plants that went into operation after 2014 the maximum level in German law (13. BImSchV of 2 Mai 2013)is set at 100mg/Nm³, which normally requires SCR for lignite plants as well. The German authorities will needto decide whether their revised law will truly reflect BAT performance for existing plants or side with polluterswhich are concerned about cost implications and profit margins, whilst ignoring the wider externalisedpublic costs of operating at sub-standards.
The 16 German lignite plants currently operating within the IED limit are responsible for 2,400 prematuredeaths and externalised economic costs of 6.4 billion euros evey year. By implementing BAT limits almost2,000 premature deaths could be prevented and public health savings of 4.5 billion euro achieved each yearin Germany alone.

34 LIFTING EUROPE’S DARK CLOUD
ANNEX IHEALTH IMPACTS OF NEW LIMITS
ANNEX I TABLE 1. DEATHS BY COUNTRY
Country
Austria
Belgium
Bulgaria
Czech Republic
Denmark
Finland
France
Germany
Greece
Hungary
Ireland
Italy
Netherlands
Poland
Portugal
Romania
Slovakia
Slovenia
Spain
Sweden
United Kingdom
TOTAL
2013
20
40
1,570
1,410
50
100
390
4,350
550
200
110
620
290
5,820
110
2,160
530
200
1,530
0
2,860
22,900
2016 IED limits
20
40
340
600
40
50
230
4,070
250
130
50
510
290
2,330
110
280
60
140
530
0
1,340
11,400
Proposed BREF limits
20
40
250
440
40
40
160
3,440
200
100
30
420
280
1,660
90
200
40
100
360
0
930
8,900
Best Available Techniques(BAT)
10
10
160
190
20
10
40
1,050
70
30
10
120
90
430
10
60
10
30
60
0
210
2,590
ANNEX I: HEALTH IMPACTS OF NEW LIMITS
LIFTING EUROPE’S DARK CLOUD 35
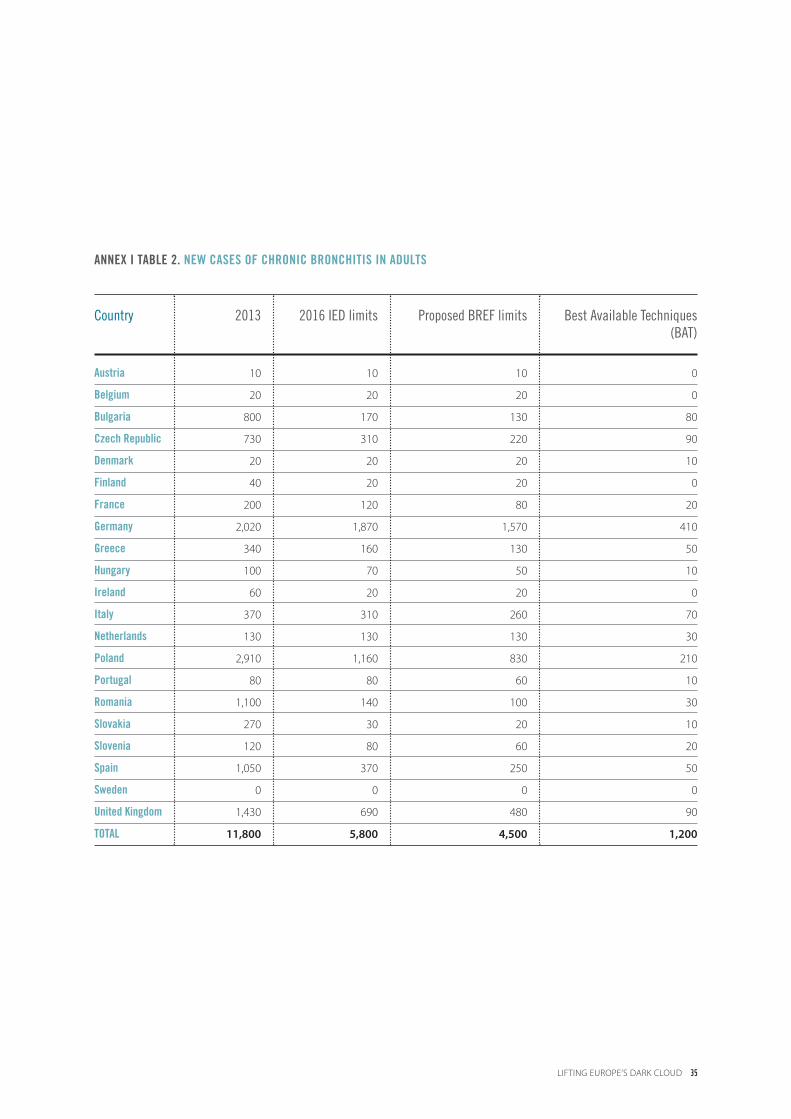
ANNEX I TABLE 2. NEW CASES OF CHRONIC BRONCHITIS IN ADULTS
Country
Austria
Belgium
Bulgaria
Czech Republic
Denmark
Finland
France
Germany
Greece
Hungary
Ireland
Italy
Netherlands
Poland
Portugal
Romania
Slovakia
Slovenia
Spain
Sweden
United Kingdom
TOTAL
2013
10
20
800
730
20
40
200
2,020
340
100
60
370
130
2,910
80
1,100
270
120
1,050
0
1,430
11,800
2016 IED limits
10
20
170
310
20
20
120
1,870
160
70
20
310
130
1,160
80
140
30
80
370
0
690
5,800
Proposed BREF limits
10
20
130
220
20
20
80
1,570
130
50
20
260
130
830
60
100
20
60
250
0
480
4,500
Best Available Techniques(BAT)
0
0
80
90
10
0
20
410
50
10
0
70
30
210
10
30
10
20
50
0
90
1,200

36 LIFTING EUROPE’S DARK CLOUD
ANNEX I TABLE 3. DAYS OF CHILDREN SUFFERING FROM ASTHMA SYMPTOMS
Country
Austria
Belgium
Bulgaria
Czech Republic
Denmark
Finland
France
Germany
Greece
Hungary
Ireland
Italy
Netherlands
Poland
Portugal
Romania
Slovakia
Slovenia
Spain
Sweden
United Kingdom
TOTAL
2013
390
740
39,160
30,700
1,020
1,630
9,300
87,650
18,820
4,530
2,790
16,580
5,940
127,580
3,560
53,720
11,190
5,130
48,430
40
69,370
538,300
2016 IED limits
390
740
8,150
12,860
920
920
5,570
81,410
9,420
2,960
1,200
13,810
5,940
51,720
3,550
6,670
1,290
3,570
16,940
40
33,700
261,800
Proposed BREF limits
380
710
6,080
9,440
890
670
3,770
68,410
7670
2,210
810
11,630
5,890
37,190
2,840
4,860
970
2,630
11,640
40
23,110
201,800
Best Available Techniques(BAT)
140
140
3,800
3,960
390
140
730
17,820
2,730
640
150
3,260
1,360
10,050
540
1,370
280
650
2,350
20
4,350
54,880
ANNEX I: HEALTH IMPACTS OF NEW LIMITS

LIFTING EUROPE’S DARK CLOUD 37
ANNEX I TABLE 4. LOST WORKING DAYS
Country
Austria
Belgium
Bulgaria
Czech Republic
Denmark
Finland
France
Germany
Greece
Hungary
Ireland
Italy
Netherlands
Poland
Portugal
Romania
Slovakia
Slovenia
Spain
Sweden
United Kingdom
TOTAL
2013
4,470
11,240
410,960
469,110
14,690
23,780
115,650
1,337,490
149,020
56,060
29,150
190,660
92,450
1,671,530
37,540
553,510
157,450
60,230
532,570
440
657,770
6,575,790
2016 IED limits
4,470
11,240
78,320
190,100
13,450
13,650
68,340
1,232,840
70,790
37,110
11,850
156,040
92,450
654,320
37,500
62,460
16,210
43,860
180,560
440
330,350
3,306,400
Proposed BREF limits
4,400
10,910
56,950
138,580
13,110
9,950
45,780
1,026,510
55,660
26,980
7,880
128,970
91,620
462,730
29,940
45,040
11,830
31,610
120,070
430
223,800
2,542,700
Best Available Techniques(BAT)
1,540
1,890
36,980
58,190
5,200
1,830
7,170
235,580
16,140
6,890
1,080
30,900
17,610
108,770
3,600
10,960
3,010
6,790
14,970
240
31,010
600,340

38 LIFTING EUROPE’S DARK CLOUD
ANNEX I TABLE 5. TOTAL HEALTH COSTS (BILLION EUROS)
Country
Austria
Belgium
Bulgaria
Czech Republic
Denmark
Finland
France
Germany
Greece
Hungary
Ireland
Italy
Netherlands
Poland
Portugal
Romania
Slovakia
Slovenia
Spain
Sweden
United Kingdom
TOTAL
2013
50
100
4,380
3,880
130
260
1,080
11,860
1,560
560
290
1,720
780
16,030
310
6,030
1,470
560
4,330
10
7,770
63,200
2016 IED limits
50
100
930
1,650
110
150
640
11,090
720
370
130
1,420
780
6,420
310
770
160
390
1,510
10
3,660
31,400
Proposed BREF limits
50
100
700
1,220
110
110
440
9,370
570
270
90
1,190
770
4,580
250
560
120
290
1,020
10
2,540
24,300
Best Available Techniques(BAT)High High High High
20
20
430
510
50
20
100
2,830
190
70
20
340
230
1,170
40
160
30
70
180
0
570
7,060
30
50
2,330
2,050
70
140
570
6,190
840
290
150
920
410
8,440
170
3,210
780
300
2,330
0
4,050
33,300
30
50
500
870
60
80
340
5,790
390
190
70
760
410
3,380
170
410
80
210
810
0
1,920
16,500
20
50
370
640
60
60
230
4,890
310
140
50
630
400
2,410
130
300
60
150
550
0
1,330
12,800
Low Low Low Low
10
10
230
270
30
10
50
1,460
100
40
10
180
120
620
20
90
20
40
100
0
290
3,680
ANNEX I: HEALTH IMPACTS OF NEW LIMITS

LIFTING EUROPE’S DARK CLOUD 39
ANNEX IIPLANTS WITH DEROGATIONS
ANNEX II TABLE 6. DEROGATIONS OVERVIEW
COUNTRY /Plant name
BULGARIA
Ruse Iztok
Brikel
Plovdiv North
Sliven
Deven
Maritsa 3
CZECH REPUBLIC
Melnik II / III
Prunerov
Ceskoslovenske Armady (CSA)
Karvina
Kladno
Kolin
Ledvice
Olomouc
Trebovice
Vitkovice
Opatovice
Plzen
Pocerady
Brno Spitalka
Chomutov
Malesice
Prerov
Pribram
Tisova
Budejovice
Coal type
Hard coal
Lignite
Lignite
Lignite
Hard coal
Lignite
Lignite
Lignite
Hard coal
Hard coal
Lignite
Lignite
Lignite
Hard coal
Hard coal
Hard coal
Lignite
Lignite
Lignite
Lignite
Lignite
Hard coal
Hard coal
Lignite
Lignite
Lignite
MWel
2013
368
184
46
28
791
100
662
1,371
24
28
406
15
405
38
155
73
334
128
920
63
24
101
56
41
253
49
18
17
1
17
48
19
98
145
14
18
50
17
109
13
77
17
101
52
158
1
13
4
27
15
63
27
IED
8
14
1
3
24
10
35
74
3
6
25
3
26
6
21
5
34
15
82
1
2
2
7
3
23
5
BREF
6
11
1
2
16
8
25
53
2
4
18
2
19
4
15
3
24
11
59
1
2
1
5
2
16
4
BAT
Derogation
TNP
DR
LLD
DH
LLD
DR
TNP
TNP
DH / TNP
TNP
TNP
DH / TNP
TNP
TNP
DH / TNP
TNP
TNP
TNP
TNP
LLD / TNP
DH / TNP
TNP
DH / TNP
DH / TNP
TNP
TNP
PREMATURE DEATHS
1
9
0
1
4
6
6
41
1
1
5
0
5
1
3
1
19
3
15
1
0
0
1
1
4
1
AT Accession TreatyDH District HeatingDR Desulphurisation Rate LLD Limited LifetimeSIS Small isolated systemsTNP Transitional National Plan
2013 Currently operating plantsIED 2016 IED limitsBREF Proposed BREF limitsBAT Best Available Techniques

40 EUROPE’S DARK CLOUD
ANNEX II TABLE 6. DEROGATIONS OVERVIEW - CONTINUED
COUNTRY /Plant name
Usti nad Labem
Porici II
Dvur Kralove
Zlin
Chvaletice
Plzenska
Frydek-Mistek
Koprivnice
Krnov
Detmarovice
Ostrov
Privoz
Trmice
Hodonin
Melnik I
GERMANY
Marl
Lippendorf
DENMARK
Asnaes
GREECE
Agios Dimitrios
Amintaio
Melitis (Florina)
Kardia
Megalopoli A
Megalopoli B
SPAIN
Litoral
Abono
Puente Nuevo
Lada
Coal type
Lignite
Lignite
Lignite
Lignite
Lignite
Lignite
Lignite
Lignite
Hard coal
Hard coal
Lignite
Hard coal
Lignite
Lignite
Lignite
Hard coal
Lignite
Hard coal
Lignite
Lignite
Lignite
Lignite
Lignite
Lignite
Hard coal
Hard coal
Hard coal
Hard coal
MWel
2013
23
152
17
61
736
83
88
165
43
736
32
14
231
92
324
175
1,750
1,015
1,456
546
289
1,110
481
256
1,012
848
298
472
8
17
5
9
59
20
4
3
5
51
5
8
30
14
45
44
223
10
270
78
7
94
10
16
177
140
16
32
IED
2
9
5
4
46
5
2
1
2
36
5
3
8
6
29
41
174
5
106
34
7
55
10
16
71
92
8
18
BREF
1
7
5
3
33
3
2
1
1
25
5
2
6
5
21
36
131
4
77
25
7
50
10
16
47
61
5
12
BAT
Derogation
TNP
TNP
DH / TNP
TNP
TNP
TNP
TNP
TNP
DH / TNP
TNP
DH
DH / TNP
TNP
TNP
TNP
LLD
DR
LLD
TNP
LLD
TNP
LLD
TNP
TNP
TNP
TNP
TNP
TNP
PREMATURE DEATHS
0
2
5
1
8
1
0
0
0
6
5
0
1
1
5
8
100
2
18
6
2
12
11
13
8
10
1
2
ANNEX II: PLANTS WITH DEROGATIONS

LIFTING EUROPE’S DARK CLOUD 41
COUNTRY /Plant name
La Robla
Los Barrios
Meirama
Soto de Ribera
Anllares
Compostilla II
Alcudia II
Narcea
Velilla
Andorra
As Pontes
FINLAND
Kristiina
Kymijarvi
Naantali-1
Suomenoja
Meri-Pori
Tahkoluoto (Pori)
Vaskiluoto
Martinlaakso
Hanasaari B
Salmissari
FRANCE
Bois-Rouge
IRELAND
Moneypoint
ITALY
Bastardo
Genova
Coal type
Hard coal
Hard coal
Lignite
Hard coal
Hard coal
Hard coal
Hard coal
Hard coal
Hard coal
Lignite
Lignite
Hard coal
Hard coal
Hard coal
Hard coal
Hard coal
Hard coal
Hard coal
Hard coal
Hard coal
Hard coal
Hard coal
Hard coal
Hard coal
Hard coal
MWel
2013
570
570
509
628
336
1,098
469
547
458
966
1,403
244
127
345
147
515
232
219
74
210
156
92
842
138
271
57
51
90
46
110
131
83
27
38
398
134
5
12
15
16
8
3
8
9
12
9
0
106
15
22
IED
21
34
34
14
11
32
34
12
13
49
89
4
4
9
6
8
2
6
5
6
5
0
47
10
15
BREF
14
23
24
10
7
22
23
8
9
34
61
4
3
6
4
6
2
5
3
4
3
0
33
7
10
BAT
Derogation
TNP
TNP
TNP
TNP
LLD
TNP
SIS
TNP
TNP
TNP / DR
TNP
TNP
LLD
LLD
DH / TNP
TNP
TNP
TNP
TNP
TNP
TNP
SIS
TNP
LLD
LLD
PREMATURE DEATHS
2
4
5
2
1
4
4
1
1
6
12
1
1
1
1
1
1
1
1
1
1
0
7
2
2
AT Accession TreatyDH District HeatingDR Desulphurisation Rate LLD Limited LifetimeSIS Small isolated systemsTNP Transitional National Plan
2013 Currently operating plantsIED 2016 IED limitsBREF Proposed BREF limitsBAT Best Available Techniques
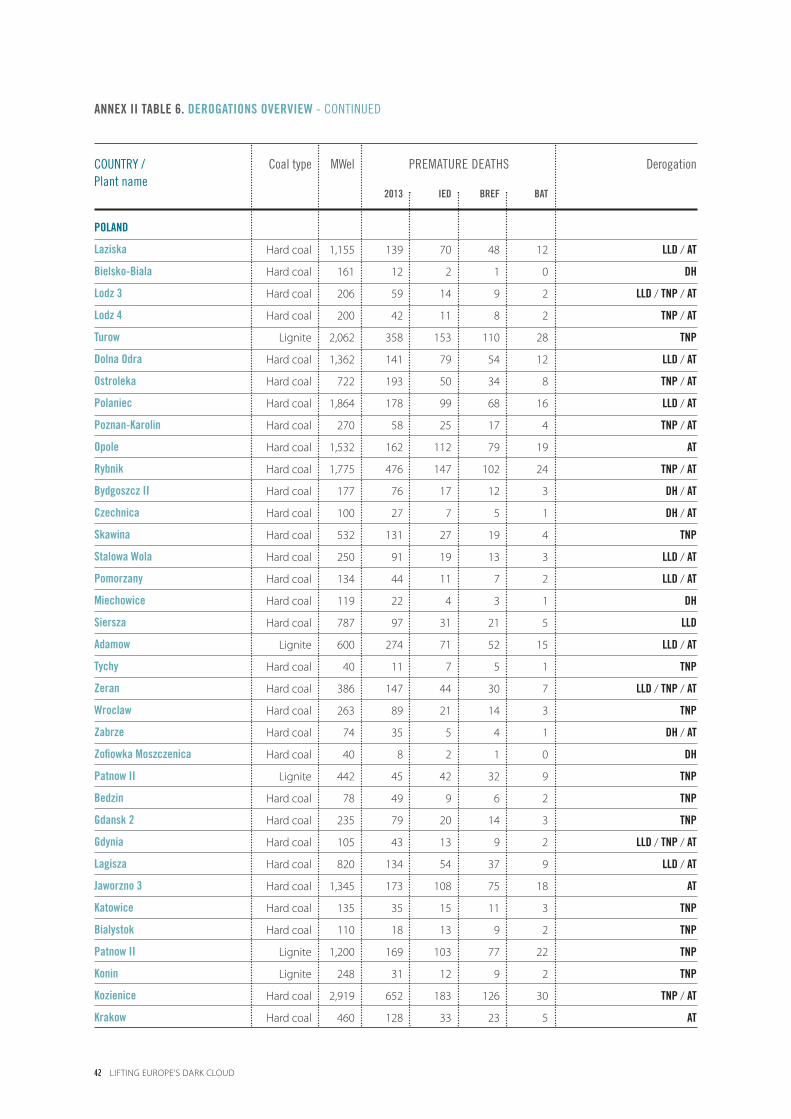
42 LIFTING EUROPE’S DARK CLOUD
ANNEX II TABLE 6. DEROGATIONS OVERVIEW - CONTINUED
COUNTRY /Plant name
POLAND
Laziska
Bielsko-Biala
Lodz 3
Lodz 4
Turow
Dolna Odra
Ostroleka
Polaniec
Poznan-Karolin
Opole
Rybnik
Bydgoszcz II
Czechnica
Skawina
Stalowa Wola
Pomorzany
Miechowice
Siersza
Adamow
Tychy
Zeran
Wroclaw
Zabrze
Zofiowka Moszczenica
Patnow II
Bedzin
Gdansk 2
Gdynia
Lagisza
Jaworzno 3
Katowice
Bialystok
Patnow II
Konin
Kozienice
Krakow
Coal type
Hard coal
Hard coal
Hard coal
Hard coal
Lignite
Hard coal
Hard coal
Hard coal
Hard coal
Hard coal
Hard coal
Hard coal
Hard coal
Hard coal
Hard coal
Hard coal
Hard coal
Hard coal
Lignite
Hard coal
Hard coal
Hard coal
Hard coal
Hard coal
Lignite
Hard coal
Hard coal
Hard coal
Hard coal
Hard coal
Hard coal
Hard coal
Lignite
Lignite
Hard coal
Hard coal
MWel
2013
1,155
161
206
200
2,062
1,362
722
1,864
270
1,532
1,775
177
100
532
250
134
119
787
600
40
386
263
74
40
442
78
235
105
820
1,345
135
110
1,200
248
2,919
460
139
12
59
42
358
141
193
178
58
162
476
76
27
131
91
44
22
97
274
11
147
89
35
8
45
49
79
43
134
173
35
18
169
31
652
128
IED
70
2
14
11
153
79
50
99
25
112
147
17
7
27
19
11
4
31
71
7
44
21
5
2
42
9
20
13
54
108
15
13
103
12
183
33
BREF
48
1
9
8
110
54
34
68
17
79
102
12
5
19
13
7
3
21
52
5
30
14
4
1
32
6
14
9
37
75
11
9
77
9
126
23
BAT
Derogation
LLD / AT
DH
LLD / TNP / AT
TNP / AT
TNP
LLD / AT
TNP / AT
LLD / AT
TNP / AT
AT
TNP / AT
DH / AT
DH / AT
TNP
LLD / AT
LLD / AT
DH
LLD
LLD / AT
TNP
LLD / TNP / AT
TNP
DH / AT
DH
TNP
TNP
TNP
LLD / TNP / AT
LLD / AT
AT
TNP
TNP
TNP
TNP
TNP / AT
AT
PREMATURE DEATHS
12
0
2
2
28
12
8
16
4
19
24
3
1
4
3
2
1
5
15
1
7
3
1
0
9
2
3
2
9
18
3
2
22
2
30
5

LIFTING EUROPE’S DARK CLOUD 43
COUNTRY /Plant name
PORTUGAL
Pego
Sines
ROMANIA
Isalnita
Mintia
Oradea II
Govora
Rovinari
Turceni
Craiova II
Drobeta
SWEDEN
Vaesteras
SLOVENIA
Te-Tol
Sostanj
SLOKAVIA
Vojany I
Zvolenska
Martinska
UNITED KINGDOM
Cottam
Fiddler’s Ferry
Eggborough
Ferrybridge
Ratcliffe
West Burton
Aberthaw
Rugeley
Drax
Kilroot
Longannet
Coal type
Hard coal
Hard coal
Lignite
Hard coal
Lignite
Lignite
Lignite
Lignite
Lignite
Lignite
Hard coal
Hard coal
Lignite
Hard coal
Lignite
Lignite
Hard coal
Hard coal
Hard coal
Hard coal
Hard coal
Hard coal
Hard coal
Hard coal
Hard coal
Hard coal
Hard coal
MWel
2013
628
1,192
572
1,123
134
174
1,166
2,083
244
262
138
114
1,122
607
28
39
2,008
1,961
1,960
1,960
2,000
2,012
1,586
1,006
2,580
520
2,260
31
78
85
337
241
234
245
178
171
430
1
23
179
7
21
9
217
213
335
256
231
207
269
109
591
52
383
IED
31
78
20
29
15
17
66
64
17
27
1
18
121
5
2
2
128
111
144
103
132
131
103
58
281
31
117
BREF
24
63
15
20
11
12
49
48
13
20
1
14
89
4
1
2
86
77
97
70
91
91
73
50
195
21
80
BAT
Derogation
TNP
TNP
TNP
TNP
AT
TNP
TNP / AT
TNP / AT
TNP
LLD
LLD
TNP
LLD
LLD
TNP
DH
TNP
TNP
LLD
LLD
TNP
TNP
TNP
TNP
TNP
TNP
LLD
PREMATURE DEATHS
4
10
5
5
3
4
14
14
4
6
1
3
23
1
0
0
20
18
22
16
21
21
17
12
45
5
18
AT Accession TreatyDH District HeatingDR Desulphurisation Rate LLD Limited LifetimeSIS Small isolated systemsTNP Transitional National Plan
2013 Currently operating plantsIED 2016 IED limitsBREF Proposed BREF limitsBAT Best Available Techniques

“THE DANGEROUS IMPACTS OF COAL ON HEALTH FROM EXPOSURE TO AIR POLLUTION… AND THE MAJOR
CONTRIBUTION THAT BURNING COAL AND THE RELEASE OF GREENHOUSE GASES HAS IN CHANGING THE
LONG-TERM CLIMATE ALMOST CERTAINLY UNDERMINES THE USE OF COAL AS A LONG-TERM FUEL.”
2015 Lancet Commission on Health and Climate Change
WWF
WWF is one of the world’slargest and mostexperienced independentconservation organisations,with over 5 millionsupporters and a globalnetwork active in morethan 100 countries. WWF’smission is to stop thedegradation of the planet’snatural environment andto build a future in whichhumans live in harmonywith nature, by conservingthe world’s biologicaldiversity, ensuring that theuse of renewable naturalresources is sustainable,and promoting thereduction of pollution andwasteful consumption.
THE WWF EUROPEANPOLICY OFFICE
The European Policy Officecontributes to theachievement of WWF’sglobal mission by leadingthe WWF network to shapeEU policies impacting on the European andglobal environment.
CLIMATE ACTIONNETWORK (CAN) EUROPE
The Climate ActionNetwork Europe isEurope’s largest coalitionworking on climate andenergy issues. With over120 member organisationsin more than 30 Europeancountries – representingover 44 million citizens –CAN Europe works toprevent dangerousclimate change andpromote sustainableclimate and energy policyin Europe. CAN Europe is a regional node of theClimate Action NetworkInternational, a worldwidenetwork of over 900 Non-GovernmentalOrganisations.
HEALTH AND ENVIRONMENTALLIANCE (HEAL)
The Health andEnvironment Alliance is aleading European not-for-profit organisationaddressing how theenvironment affectshealth in the EuropeanUnion. We demonstratehow policy changes canhelp protect health andenhance people’s qualityof life. Our broad allianceof more than 70 memberorganisations representshealth professionals, not-for-profit health insurers,cancer and asthmagroups, citizens, women’sgroups, youth groups,environmental NGOs,scientists and publichealth research institutes.Members includeinternational and Europewide organisations, as well as national andlocal groups.
SANDBAG
Sandbag is an evidence-based non-profitorganisation to helpEuropean decarbonisation.We focus on phasing outcoal generation acrossEurope, getting a highercarbon price throughEUETS reform, andworking on long termways to decarboniseenergy intensive industries.
EUROPEAN ENVIRONMENTALBUREAU (EEB)
The EuropeanEnvironmental Bureau isthe largest federation ofenvironmental citizens’organisations in Europe. It currently consists of over150 member organisationsin more than 30 countries(virtually all EU MemberStates plus someaccession andneighbouring countries),including a growingnumber of Europeannetworks, andrepresenting some 15 million individualmembers and supporters.The EEB stand forenvironmental justice,sustainable developmentand participatorydemocracy. Our aim is toensure the EU secures ahealthy environment andrich biodiversity for all.