light, medium or strong? - hsbc global asset … medium or strong? different solutions for different...
TRANSCRIPT

Light,
medium
or strong?
Different solutions for different needs
HSBC Managed Solutions (An open ended Fund of Funds Scheme)
New Fund Offer: 09 April to 23 April 2014
A need-based investment solution that helps you meet your financial goals

Why invest?
3
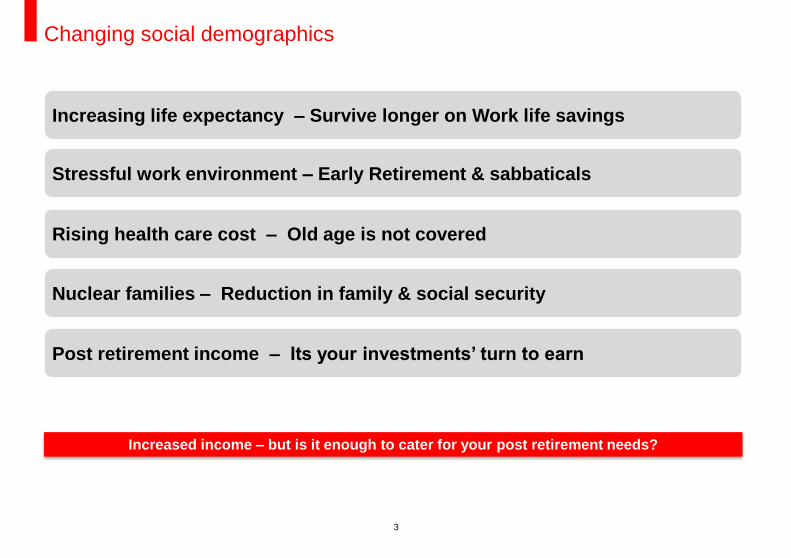
Changing social demographics
Increasing life expectancy – Survive longer on Work life savings
Post retirement income – Its your investments’ turn to earn
Stressful work environment – Early Retirement & sabbaticals
Rising health care cost – Old age is not covered
Nuclear families – Reduction in family & social security
Increased income – but is it enough to cater for your post retirement needs?

4
Source: HSBC Global Asset Management
Greater demand to spend
Birth and
Education
0 25 60 Earning Life 75 + Retired
Life
Marriage
House
Children’s
Education
Children’s
Marriage
Retirement
Age
Do you want to compromise on
your living standard after your
retirement?
Emergencies?
Car
Children
Savings / Investing
Support old
parents

5
Source : Reserve Bank of India, Currency - INR
Expected average savings for 12th Five Year Plan (2012-17)
High focus towards perceived “safe” investment avenues
Asset Class Performance* Asset Class Distribution : Individual Wealth
Period : 1989 – 2012, Source : CLSA, Currency – INR
*Real Estate data not available

6
If you manage your monthly expenses with INR
100,000 today, and if inflation grows @ 8% or
@10%, what will you need in future?
Source : BSE, RBI , EPFO website, Currency - INR
Just saving is not enough: You also have to beat inflation!
How Inflation erodes our money value?
INR 100,000 in last 34 years (since inception of
S&P BSE Sensex):
If left idle (cash)= ~INR 7,661
If invested in Fixed Deposits = ~INR 146,273
If invested in EPF = ~INR 209,775
If invested in Sensex = ~INR 1,428,287
Sensex has historically provided higher
returns
Is your money working hard enough to sustain you?

7
Inflation : A real threat
Prepare for retirement while we earn and more importantly while we can
Enhance our purchasing power instead of protecting current value
Why invest - Takeaways

Where to invest?

9
Gold: Allocate in moderation
Can be volatile
Real Estate
Project delays
Title issues
Liquidity concerns
Commodities: Regulations still evolving
Not fully understood by retail investors
Alternative Investments: Means to diversify
So how do we go about investing?

10
It is “ too risky”
“Led by Foreign Institutional Investors (FII) and speculators”
“We have lost money in equities”
“We have not seen the markets provide positive returns over last 5 years”
Equities are a “game changer”
“It is an asset class for the long term”
“Historically, equities have provided 15.4% compounded annualised returns – better than other asset classes” (Source: CLSA: 1989-2012, Currency - INR)
Equities – Different perspectives
Both are right!

11
Over the longer term growth in equities track the corporate earnings growth
EPS : Earnings Per Share – The portion of a company's profit allocated to each outstanding share of common stock. Earnings per share serves as an indicator of a company's profitability.
The unconventional truth
Source: BSE Website, Currency - INR
Gro
wth
va
lue
s , R
eb
ase
d a
t 1
00
Equities track corporate earnings
- 1,000 2,000 3,000 4,000
Mar-
89
Mar-
90
Mar-
91
Mar-
92
Mar-
93
Mar-
94
Mar-
95
Mar-
96
Mar-
97
Mar-
98
Mar-
99
Mar-
00
Mar-
01
Mar-
02
Mar-
03
Mar-
04
Mar-
05
Mar-
06
Mar-
07
Mar-
08
Mar-
09
Mar-
10
Mar-
11
Mar-
12
Mar-
13
BSE Sensex - Profit growth versus Index growth
EPS Growth Sensex Growth

12
Likelihood of loss versus duration of investment
You need to give it time
Time in market more important than timing the market
0%
Analysis based on Sensex data since March 1979, as on March 2013, Currency - INR
Source: BSE, HSBC Global Asset Management, India

13
Investor returns depend more on Investor behaviour and risk profile rather than the
market behaviour
Performance chasing syndrome?
Buy the “best performing” asset class
The “best performing” stock
The “best performing” fund
Where is the disconnect?
14
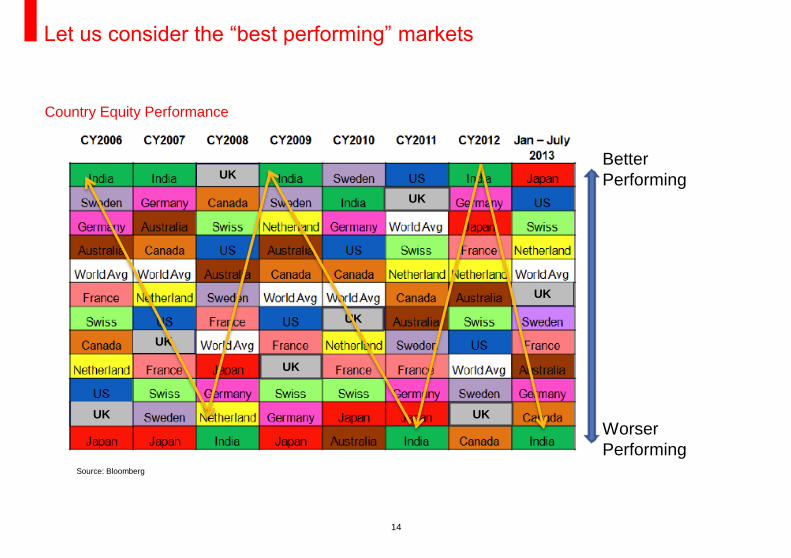
Let us consider the “best performing” markets
Country Equity Performance
Source: Bloomberg
UK
UK
UK
UK
UK
UK
UK
UK
Better
Performing
Worser
Performing

15
Source: Bloomberg, Currency - INR
Teck indicates Technology Index, FMCG indicates Fast Moving Consumer Goods Index, Bankex indicates Banking Index, IT indicates Information technology Index
Or the “best performing” sectors?
Top 2 Equity Indices/Sectors
Calendar YearNSE - NIFTY
50
NSE - CNX
Mid capNo 1 No 2 No 1 No 2
2003 72% 138% Metal - 212% Capital Goods - 168% 7/11 3/11
2004 11% 25% Teck - 33% Bankex - 33% 6/11 8/11
2005 36% 35% Consumer Durables - 115% Capital Goods - 94% 12/12 1/12
2006 40% 29% Capital Goods - 56% Teck - 49% 3/12 10/12
2007 55% 77% Power - 122% Metal - 121% 9/13 12/13
2008 -52% -59% FMCG -14% Health Care -33% 13/13 11/13
2009 76% 99% Metal - 234% Auto - 204% 10/13 2/13
2010 18% 19% Consumer Durables - 68% Auto - 38% 5/13 6/13
2011 -25% -31% FMCG - 10% Health Care -13% 3/13 6/13
2012 28% 39% Bankex - 57% Realty - 53% 7/13 13/13
2013 6.80% -5% IT - 60% Healthcare - 22.6%
Year and Market Cap performance Top 2 Sector Next Year Ranking for Top 2 Sectors
Themes change - Different sectors and segments perform at different times!

16
The hypothesis also holds true for different investment categories
Source: MFIE, CRISIL, Currency - INR
Note: “Large cap” denoted by S&P Nifty, “Midcap” denoted by BSE Midcap, “Long term debt” denoted by Crisil 10 year Gilt Index, “Short term debt” denoted by Crisil 1 year T-bill index and “Ultra Short
term debt” denoted by Crisil 91 day T-bill index; Diversification of portfolio is customer's choice
Do we place enough importance on asset allocation?
Ultra short
term debt
Midcap
equity Midcap
equity Large
cap
equity
Midcap
equity
Long
term debt
Midcap
equity
Ultra short
term debt
Ultra short
term debt
Long
term
debt
The best category changes every year
Retu
rns
The best performing category for the year

Is there a solution that we can consider?

18
Factors that explain variation between portfolio performances
Source: Brinson et al, 1986
Asset allocation: Key determinant of portfolio returns
Most time spent on the 6% viz. security selection, market timing

19
Multi-asset portfolios spread investments both across asset classes and across geographies
Ensures that the portfolio does not become over-reliant on a single asset class or a single country or
sector
Asset classes typically have a low correlation - combining assets with low correlations helps reduce
overall portfolio volatility
Low Correlation between various investment segments (2003-14)
Why should we consider multi-asset portfolios?
Period : 1 April 2003 to 31 January 2014, Source: CRISIL, BSE, Bloomberg
Large Cap denoted by BSE Sensex, Long Term Debt denoted by CRISIL Composite Bond Fund Index, Mid cap denoted by BSE Midcap
Index, Short Term Debt denoted by CRISIL Short Term Bond Fund Index, Offshore Equity denoted by MSCI World Index
Correlation Coefficient Large Cap Long Term Debt Midcap Short Term Debt Offshore Equity Gold
Large Cap 1.00 0.22 0.89 0.17 0.45 -0.01
Long Term Debt 0.22 1.00 0.25 0.89 0.03 -0.02
Midcap 0.89 0.25 1.00 0.17 0.45 0.03
Short Term Debt 0.17 0.89 0.17 1.00 -0.02 0.03
Offshore Equity 0.45 0.03 0.45 -0.02 1.00 0.02
Gold -0.01 -0.02 0.03 0.03 0.02 1.00

20
Combining two asset classes with low correlations could produce a portfolio with reduced overall risk,
while improving risk-adjusted returns over a market cycle
The lower the correlation between two assets, the greater the diversification effect
Source: HSBC Global Asset Management – For illustrative purposes only, Assuming the risk free rate is 0%
Illustration – Asset allocation may help optimise returns and risk
Risk
Asset
A
Asset B
Return
Portfolio 20% Asset A
80% Asset B
Asset Return Volatility Sharpe Ratio
Asset A 12.0% 25.0% 0.48
Asset B 5.0% 10.0% 0.50
Portfolio 6.4% 8.0% 0.80
Sharpe Ratio - A ratio used to measure risk-adjusted performance. The Sharpe ratio is calculated by subtracting the risk-free rate - such as that of the 10-year Treasury bond - from the rate of return
for a portfolio and dividing the result by the standard deviation of the portfolio returns.
Volatility - A statistical measure of the dispersion of returns for a given security or market index. Volatility can either be measured by using the standard deviation or variance between returns from that
same security or market index. Commonly, the higher the volatility, the riskier the security.

21
Rebalancing an investment portfolio endeavours that you sell high and buy low in the process of maintaining the
desired composition of your portfolio at pre-decided periodicities.
For example –
If the preferred asset allocation for an individual is
Debt-Equity-Liquid at 50:35:15
Let us assume that equity markets generate 20% in a particular year, bond markets generate 10% and liquid
investments generate 6%. What happens to investor’s portfolio if he rebalances annually –
Is asset allocation enough? Case for re-balancing
50%
35%
15%
Initial Investment
52.45% 33.65%
13.89%
Change in Asset Allocation after 1 year due to market movement
Equities Debt Liquid
50%
35%
15%
Asset Allocation restored after rebalancing
Assumed
Equities up
20%, Bonds
up 10% and
Liquid up
6%
Remains true to investment objective!

Can we dynamically allocate assets in keeping with the
investment objective?

HSBC Managed Solutions

24
Multi asset (Domestic and Offshore Equity, Fixed Income, Liquid and Gold) portfolios
which are actively managed
Constructed to optimize returns whilst managing risk
Offers transactional efficiency to the investor
A unique investment solution for Indian investors
HSBC Managed Solutions: A wealth imperative

25
An Investment Solution
Designed to meet the needs and preferences of investors
Considers investors' risk profile and deliver solutions to meet investment goals
Uses active asset allocation to achieve optimal mix
Fund of Funds (FOF) feeding into HSBC/Third Party funds*
Merits
Risk Profile based Asset allocation Buckets
Supports long term Goal Based Investment Planning
Risk aware investment experience matched to customer needs
Diversifying across low correlation asset classes
Domestic Equities, Domestic Bonds, Offshore Equities, Alternates (like Gold)
Delivered through open-ended funds in the cost efficient manner, to deliver an efficient investment solution
Regular allocation reviews – Quarterly and event based, annual comprehensive review of design principles
Low Cost Solution
Free switching & Withdrawal benefits
Expenses with customer value proposition intent
* For capabilities where HSBC offerings are not available
HSBC Managed Solutions
Investors can reap the benefits of asset allocation based on risk profile without having to select
funds or personally rebalance the portfolio

26
Seeks to provide long term total return through active asset allocation
Managed Solutions India – Growth
Primarily invests in equities, with diversification in debt, gold and liquid
Managed Solutions India – Moderate
Primarily invests in equities and debt, with diversification in gold and liquid
Managed Solutions India – Conservative
Primarily invests in debt, with diversification in equities, gold and liquid
Managed Solutions - Options

27
Asset allocation bands
Plan Type of Security
Indicative Allocation
(% of net assets) Risk Profile
Minimum Maximum
Managed Solutions
India – Growth
Equity Schemes (Units of Domestic Equity and
Offshore Equity) 55% 90% High
Debt Schemes 10% 30% Low to Medium
Gold and Other Exchange Traded Funds 0% 15% Medium to High
Money Market Schemes/Liquid Funds (including up to
5% in Money Market Instruments) 0% 20% Low
Managed Solutions
India – Moderate
Equity Schemes (Unit of Domestic Equity and
Offshore Equity) 30% 70% High
Debt Schemes 30% 70% Low to Medium
Gold and Other Exchange Traded Funds 0% 15% Medium to High
Money Market Schemes/Liquid Funds (including up to
5% in Money Market Instruments) 0% 25% Low
Managed Solutions
India – Conservative
Equity Schemes (Unit of Domestic Equity) 0% 15% High
Debt Schemes 55% 100% Low to Medium
Gold and Other Exchange Traded Funds 0% 5% Medium to High
Money Market Schemes/Liquid Funds (including upto
5% in Money Market Instruments) 0% 25% Low to Medium

28
Operational Risk: Given that the Fund of Funds structure will involve splitting each subscription and
redemption at Fund of Funds level into multiple subscription and redemptions into the respective funds;
there is enhanced operational risk
Liquidity risk of underlying instruments: There could be liquidity risk on account of illiquid underlying
holdings
Market Risk: The Underlying scheme’s investments are subject to the risks inherent in all investments in
Securities i.e. the value of holdings may fall as well as rise
Currency Risk: As the Underlying scheme could invest in securities which are denominated in foreign
currencies (e.g. US Dollars), fluctuations in the exchange rates of these foreign currencies may have an
impact on the income and value of the Scheme.
Restructuring/Rescheduling Risk: There could be cases of restructuring/rescheduling of particular
debt/money market instruments held in the portfolio which could result in the maturity of these
instruments going beyond the original maturity date of the instrument
Risk factors associated with investing in Gold Exchange Traded Funds
Risk factors associated with Legal, Tax and Regulatory risk
Key risks

Why HSBC Global Asset Management?

30
HSBC Global Asset Management: Credentials
Expertise in managing Indian equity and debt
One of the largest managers/sub-advisors of Indian assets
Equities - ~ USD 3.2 B*
Fixed income ~ USD 13.4 B*
Only foreign asset manager of the largest provident fund mandate in India
Multi-asset: A leading global player
Significant proportion of AUM globally
USD 73.9 billion assets under management in multi assets#
A core global capability
International perspective
Ability to identify and position for global trends
Long term asset prices
Impact of macro economic developments
# Source: HSBC Global Asset Management as at 31 December 2013. Any differences are due to rounding.
*Source: HSBC Global Asset Management; AUM data as on 28 February 2014, USD/INR – 61.755

31
HSBC Global Asset Management: Credentials
We are committed to being:
Fair to our clients
Provide them world class solutions that are:
Sustainable
Fairly priced
We believe this is our competitive advantage

32
HSBC Global Asset Management: Credentials
We were and probably are the only Asset Management Company (AMC) in India to have waived exit
loads from all our mutual fund schemes w.e.f. March 2013
In 2013, we were amongst the fastest growing AMCs in India
(Domestic mutual fund average assets growth in 2013)
Source: AMFI

33
There is a simple, straightforward way to create long term wealth
Understand and embrace risk
Put time on your side and don’t try timing the market
Invest regularly
Follow asset allocation & rebalancing discipline
Make the right choice…
Asset allocation and rebalancing is the key

For further information on HSBC Managed Solutions, please contact your
Investment Advisor

35
Product labeling
Risk categorisations as per regulatory guidelines
Managed Solutions India – Growth Managed Solutions India – Moderate Managed Solutions India – Conservative
This product is suitable for investors who are
seeking*:
To create wealth over the long-term
Investing predominantly in units of equity
mutual funds as well as in a basket of debt
mutual funds, gold & exchange traded
funds, offshore mutual funds and money
market instruments
High risk (BROWN)
This product is suitable for investors who are
seeking*:
To create wealth and provide income over
the long-term
Investments in a basket of debt mutual
funds, equity mutual funds, gold & exchange
traded funds, offshore mutual funds and
money market instruments
Medium risk (YELLOW)
This product is suitable for investors who are
seeking*:
To provide income over the long-term
Investing predominantly in units of debt
mutual funds as well as in a basket of equity
mutual funds, gold & other exchange traded
funds and money market instruments
Medium risk (YELLOW)
* Investors should consult their financial advisers if in doubt about whether the product is suitable for them.
Note: Risk may be represented as:
(BLUE) investors understand that their principal will be at low risk
(YELLOW) investors understand that their principal will be at medium risk
(BROWN) investors understand that their principal will be at high risk

36
Disclaimer
This document has been prepared by HSBC Asset Management (India) Private Limited (HSBC) for information purposes only and
should not be construed as an offer or solicitation of an offer for purchase of any of the funds of HSBC Mutual Fund. All information
contained in this document (including that sourced from third parties), is obtained from sources, which HSBC/ third party, believes to
be reliable but which it has not independently verified by HSBC/ the third party. Further, HSBC/ the third party makes no guarantee,
representation or warranty and accepts no responsibility or liability as to the accuracy or completeness of such information. The
information and opinions contained within the document are based upon publicly available information and rates of taxation
applicable at the time of publication, which are subject to change from time to time. Expressions of opinion are those of HSBC only
and are subject to change without notice. It does not have regard to specific investment objectives, financial situation and the
particular needs of any specific person who may receive this document. Investors should seek financial advice regarding the
appropriateness of investing in any securities or investment strategies that may have been discussed or recommended in this report
and should understand that the views regarding future prospects may or may not be realized. Neither this document nor the units of
HSBC Mutual Fund have been registered in any jurisdiction. The distribution of this document in certain jurisdictions may be
restricted or totally prohibited and accordingly, persons who come into possession of this document are required to inform
themselves about, and to observe, any such restrictions.
© Copyright. HSBC Asset Management (India) Private Limited 2014, ALL RIGHTS RESERVED.
HSBC Asset Management (India) Private Limited, 16, V.N. Road, Fort, Mumbai-400001 Email: [email protected]
Mutual fund investments are subject to market risks, read all scheme related documents carefully.