light rail and tram statistics: 2016/17 · blackpool tramway Ý. 3.9% manchester ... support...
TRANSCRIPT
RESPONSIBLE STATISTICIAN: Julie Sullivan AUTHORS: Alfred Smith and David Mais
FURTHER INFORMATION: Media: 020 7944 3066 Public: 020 7944 3094 [email protected]
In this publication
Passenger journeys
Vehicle mileage
Revenue
Vehicle occupancy
Passenger satisfaction
Background
About this releaseThis statistical release presents the latest annual information on light rail and tram systems in England during the
The release covers light rail use, infrastructure and revenue. This publication covers eight urban systems that are predominantly surface-running (see table 1 for a list of systems covered). Smaller systems, e.g. heritage railway and airport transit systems, are not included. London and Glasgow undergrounds and Edinburgh Trams are also excluded but statistics for these systems are available online.
267.7million passenger journeys
6.2% since 2015/16
57% London
43% England Outside London
Passenger journeys:
21.6million vehicle miles
2.9% since 2015/16
p7
p7
p9
p14
p10
In 2016/17, light rail use in England continued to rise with record numbers of passenger journeys and vehicle miles since comparable records began in 1983.There were 267.7 million passengers
journeys made on the eight light rail
and tram systems in England, a 6.2%
increase compared with the previous
year.
Vehicle mileage increased by 2.9%
to 21.6 million miles mostly due to
developments of the Midland Metro and
Nottingham Express Transit systems.
The Docklands Light Railway and
London Tramlink comprised 57% of all
light rail journeys.
Statistical Release 29 June 2017
Light Rail and Tram Statistics:England 2016/17
p2
p3
p6
Light Rail and Tram Statistics: England 2016/17 - Page 2
Further Statistics on the London
Underground, Glasgow
subway and Edinburgh
Trams are available
in tables LRT9901,
LRT9902 and LRT9903
respectively.
In context
London Tramlink
introduced a new service
which commenced
operation in April 2016.
Nottingham Express
Transit benefitted from a
full year of fully opened
network following the
phase 2 extension in
August 2015. Midland
Metro and Manchester
Metrolink both extended
their lines. A full list of
factors impacting on the
figures shown in table 1
and map 1 can be found
in background information
(p14).
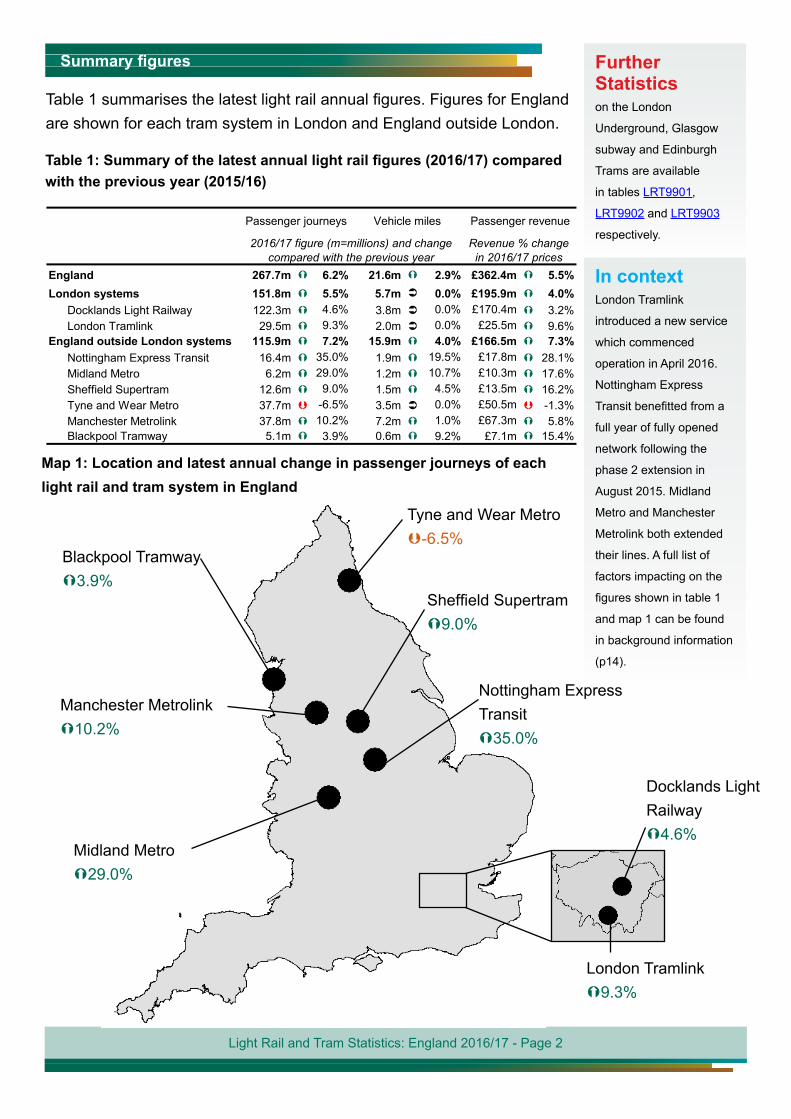
Table 1: Summary of the latest annual light rail figures (2016/17) compared with the previous year (2015/16)
Table 1 summarises the latest light rail annual figures. Figures for England are shown for each tram system in London and England outside London.
Map 1: Location and latest annual change in passenger journeys of each light rail and tram system in England
Summary figures
Tyne and Wear Metro Þ-6.5%
Blackpool Tramway Ý3.9%
Manchester Metrolink Ý10.2%
Sheffield Supertram Ý9.0%
Midland Metro Ý29.0%
Nottingham Express Transit Ý35.0%
London Tramlink Ý9.3%
Docklands Light Railway Ý4.6%
England 267.7m 6.2% 21.6m 2.9% £362.4m 5.5%London systems 151.8m 5.5% 5.7m 0.0% £195.9m 4.0%
Docklands Light Railway 122.3m 4.6% 3.8m 0.0% £170.4m 3.2%London Tramlink 29.5m 9.3% 2.0m 0.0% £25.5m 9.6%
England outside London systems 115.9m 7.2% 15.9m 4.0% £166.5m 7.3%Nottingham Express Transit 16.4m 35.0% 1.9m 19.5% £17.8m 28.1%Midland Metro 6.2m 29.0% 1.2m 10.7% £10.3m 17.6%Sheffield Supertram 12.6m 9.0% 1.5m 4.5% £13.5m 16.2%Tyne and Wear Metro 37.7m -6.5% 3.5m 0.0% £50.5m -1.3%Manchester Metrolink 37.8m 10.2% 7.2m 1.0% £67.3m 5.8%Blackpool Tramway 5.1m 3.9% 0.6m 9.2% £7.1m 15.4%
Passenger journeys Vehicle miles Passenger revenue
2016/17 figure (m=millions) and change compared with the previous year
Revenue % change in 2016/17 prices
Light Rail and Tram Statistics: England 2016/17 - Page 3
Detailed statistics on passenger journeys can be found in table LRT0101.
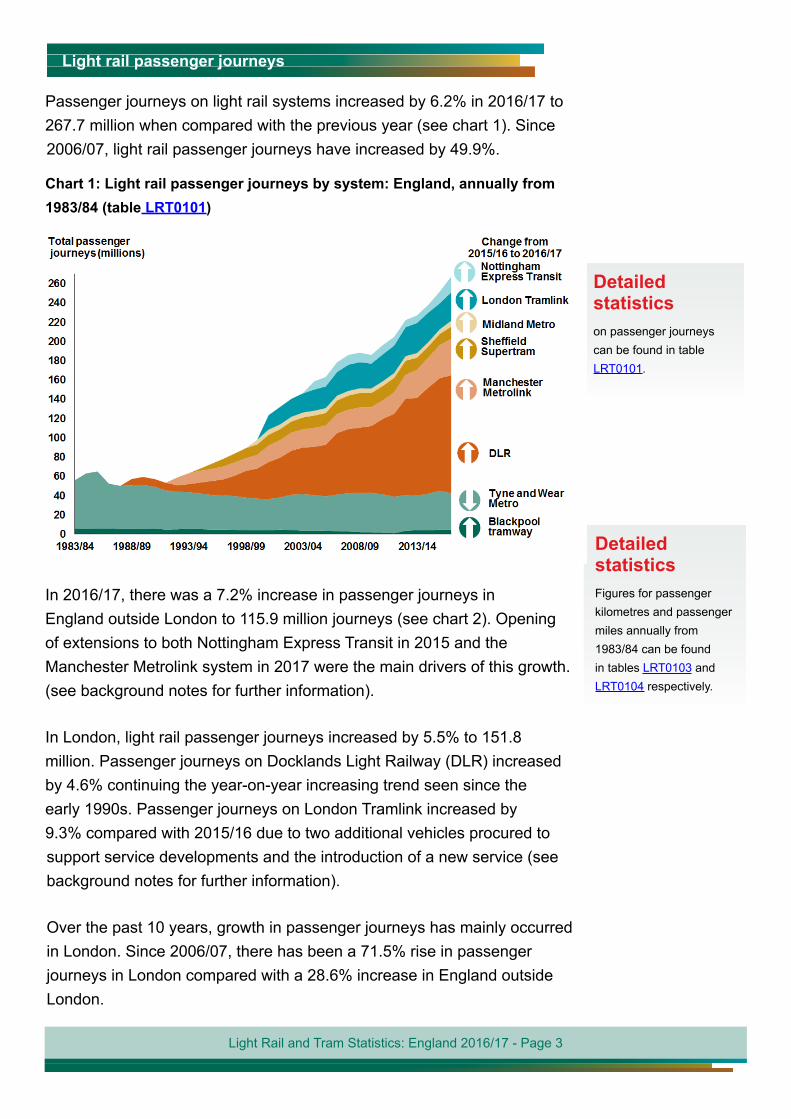
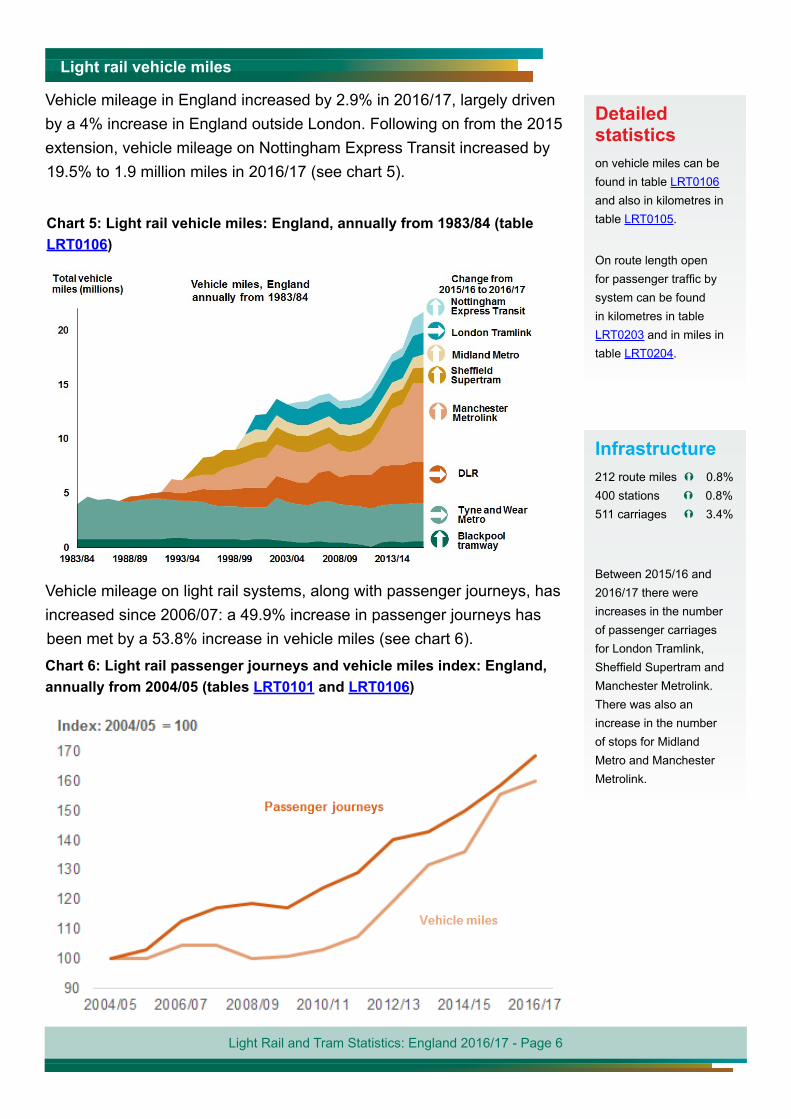
Chart 1: Light rail passenger journeys by system: England, annually from 1983/84 (table LRT0101)
Light rail passenger journeys
Passenger journeys on light rail systems increased by 6.2% in 2016/17 to 267.7 million when compared with the previous year (see chart 1). Since 2006/07, light rail passenger journeys have increased by 49.9%.
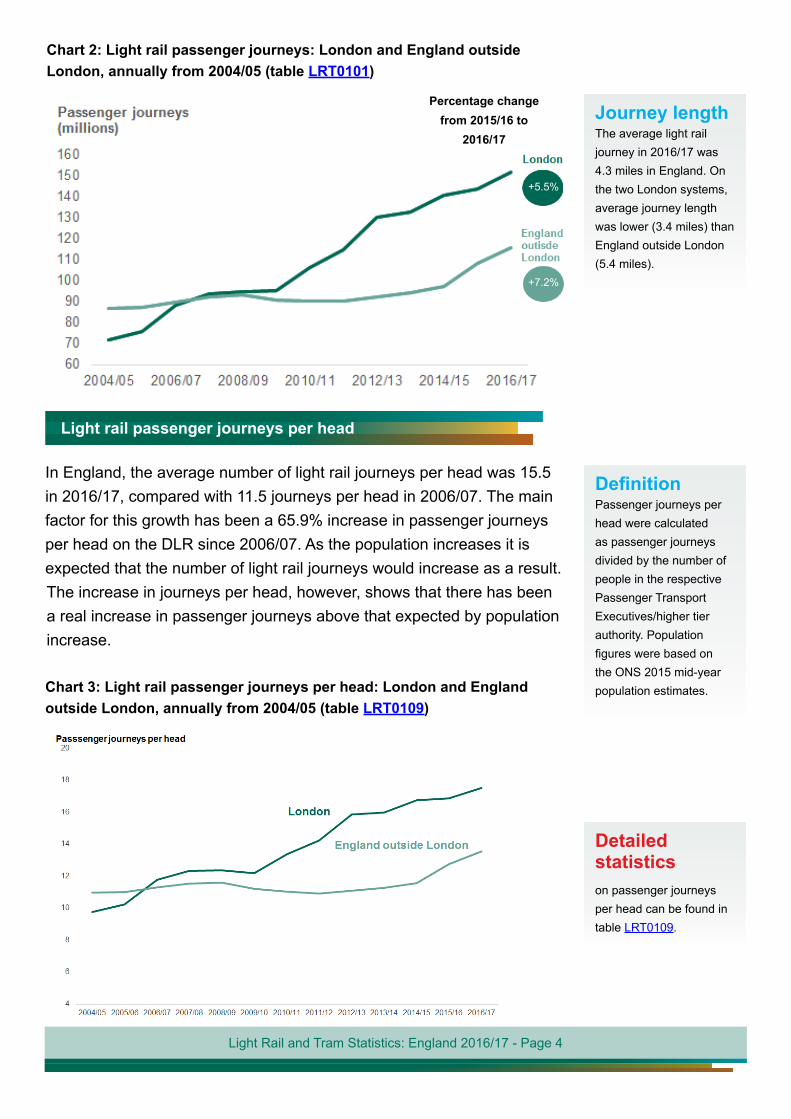
In 2016/17, there was a 7.2% increase in passenger journeys in England outside London to 115.9 million journeys (see chart 2). Opening of extensions to both Nottingham Express Transit in 2015 and the Manchester Metrolink system in 2017 were the main drivers of this growth. (see background notes for further information).
In London, light rail passenger journeys increased by 5.5% to 151.8 million. Passenger journeys on Docklands Light Railway (DLR) increased by 4.6% continuing the year-on-year increasing trend seen since the early 1990s. Passenger journeys on London Tramlink increased by 9.3% compared with 2015/16 due to two additional vehicles procured to support service developments and the introduction of a new service (see background notes for further information).
Over the past 10 years, growth in passenger journeys has mainly occurred in London. Since 2006/07, there has been a 71.5% rise in passenger journeys in London compared with a 28.6% increase in England outside London.
Detailed statistics Figures for passenger kilometres and passenger miles annually from 1983/84 can be found in tables LRT0103 and LRT0104 respectively.
Light Rail and Tram Statistics: England 2016/17 - Page 4
Chart 2: Light rail passenger journeys: London and England outside London, annually from 2004/05 (table LRT0101)
+5.5%
+7.2%
Percentage change from 2015/16 to
2016/17
Detailed statisticson passenger journeys per head can be found in table LRT0109.
Journey length The average light rail journey in 2016/17 was 4.3 miles in England. On the two London systems, average journey length was lower (3.4 miles) than England outside London (5.4 miles).
Light rail passenger journeys per head
In England, the average number of light rail journeys per head was 15.5 in 2016/17, compared with 11.5 journeys per head in 2006/07. The main factor for this growth has been a 65.9% increase in passenger journeys per head on the DLR since 2006/07. As the population increases it is expected that the number of light rail journeys would increase as a result. The increase in journeys per head, however, shows that there has been a real increase in passenger journeys above that expected by population increase.
Definition Passenger journeys per head were calculated as passenger journeys divided by the number of people in the respective Passenger Transport Executives/higher tier authority. Population figures were based on the ONS 2015 mid-year population estimates.Chart 3: Light rail passenger journeys per head: London and England
outside London, annually from 2004/05 (table LRT0109)
Light Rail and Tram Statistics: England 2016/17 - Page 5
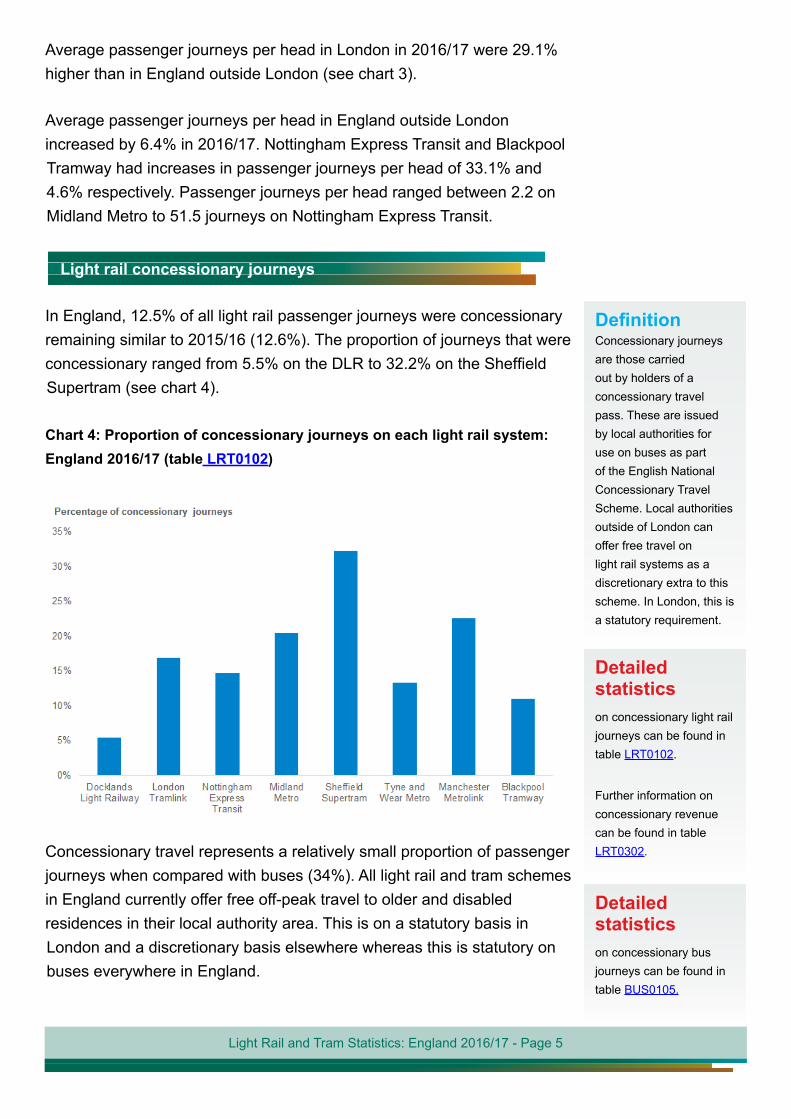
Chart 4: Proportion of concessionary journeys on each light rail system: England 2016/17 (table LRT0102)
Detailed statisticson concessionary bus journeys can be found in table BUS0105.
Concessionary travel represents a relatively small proportion of passenger journeys when compared with buses (34%). All light rail and tram schemes in England currently offer free off-peak travel to older and disabled residences in their local authority area. This is on a statutory basis in London and a discretionary basis elsewhere whereas this is statutory on buses everywhere in England.
In England, 12.5% of all light rail passenger journeys were concessionary remaining similar to 2015/16 (12.6%). The proportion of journeys that were concessionary ranged from 5.5% on the DLR to 32.2% on the Sheffield Supertram (see chart 4).
Light rail concessionary journeys
Average passenger journeys per head in London in 2016/17 were 29.1% higher than in England outside London (see chart 3).
Average passenger journeys per head in England outside London increased by 6.4% in 2016/17. Nottingham Express Transit and Blackpool Tramway had increases in passenger journeys per head of 33.1% and 4.6% respectively. Passenger journeys per head ranged between 2.2 on Midland Metro to 51.5 journeys on Nottingham Express Transit.
Detailed statisticson concessionary light rail journeys can be found in table LRT0102.
Further information on concessionary revenue can be found in table LRT0302.
Definition Concessionary journeys are those carried out by holders of a concessionary travel pass. These are issued by local authorities for use on buses as part of the English National Concessionary Travel Scheme. Local authorities outside of London can offer free travel on light rail systems as a discretionary extra to this scheme. In London, this is a statutory requirement.
Light Rail and Tram Statistics: England 2016/17 - Page 6
Chart 5: Light rail vehicle miles: England, annually from 1983/84 (table LRT0106)
Infrastructure212 route miles Ý 0.8% 400 stations Ý 0.8% 511 carriages Ý 3.4%
Between 2015/16 and 2016/17 there were increases in the number of passenger carriages for London Tramlink, Sheffield Supertram and Manchester Metrolink. There was also an increase in the number of stops for Midland Metro and Manchester Metrolink.
Chart 6: Light rail passenger journeys and vehicle miles index: England, annually from 2004/05 (tables LRT0101 and LRT0106)
Vehicle mileage in England increased by 2.9% in 2016/17, largely driven by a 4% increase in England outside London. Following on from the 2015 extension, vehicle mileage on Nottingham Express Transit increased by 19.5% to 1.9 million miles in 2016/17 (see chart 5).
Light rail vehicle miles
Vehicle mileage on light rail systems, along with passenger journeys, has increased since 2006/07: a 49.9% increase in passenger journeys has been met by a 53.8% increase in vehicle miles (see chart 6).
Detailed statistics on vehicle miles can be found in table LRT0106 and also in kilometres in table LRT0105.
On route length open for passenger traffic by system can be found in kilometres in table LRT0203 and in miles in table LRT0204.
Light Rail and Tram Statistics: England 2016/17 - Page 7
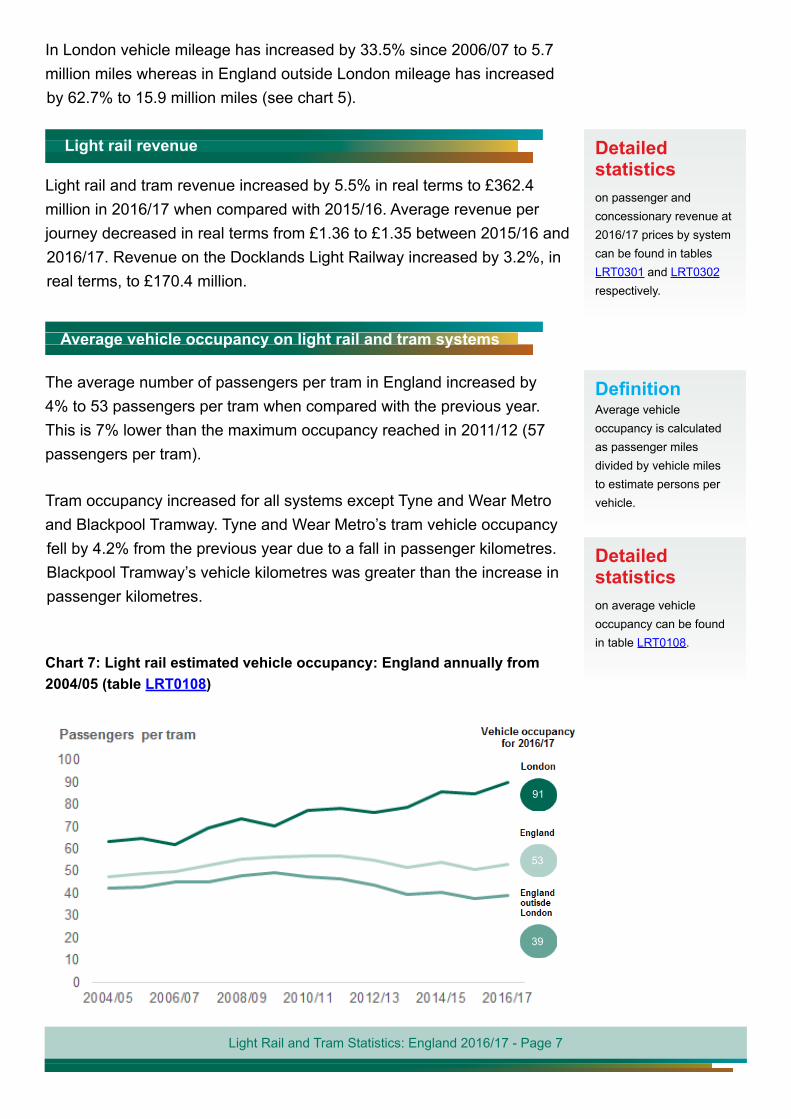
The average number of passengers per tram in England increased by 4% to 53 passengers per tram when compared with the previous year. This is 7% lower than the maximum occupancy reached in 2011/12 (57 passengers per tram).
Tram occupancy increased for all systems except Tyne and Wear Metro and Blackpool Tramway. Tyne and Wear Metro’s tram vehicle occupancy fell by 4.2% from the previous year due to a fall in passenger kilometres. Blackpool Tramway’s vehicle kilometres was greater than the increase in passenger kilometres.
Chart 7: Light rail estimated vehicle occupancy: England annually from 2004/05 (table LRT0108)
Average vehicle occupancy on light rail and tram systems
Light rail revenue
Light rail and tram revenue increased by 5.5% in real terms to £362.4 million in 2016/17 when compared with 2015/16. Average revenue per journey decreased in real terms from £1.36 to £1.35 between 2015/16 and 2016/17. Revenue on the Docklands Light Railway increased by 3.2%, in real terms, to £170.4 million.
In London vehicle mileage has increased by 33.5% since 2006/07 to 5.7 million miles whereas in England outside London mileage has increased by 62.7% to 15.9 million miles (see chart 5).
Detailed statisticson average vehicle occupancy can be found in table LRT0108.
Detailed statisticson passenger and concessionary revenue at 2016/17 prices by system can be found in tables LRT0301 and LRT0302 respectively.
Definition Average vehicle occupancy is calculated as passenger miles divided by vehicle miles to estimate persons per vehicle.
91
53
39
Light Rail and Tram Statistics: England 2016/17 - Page 8
Contextual information
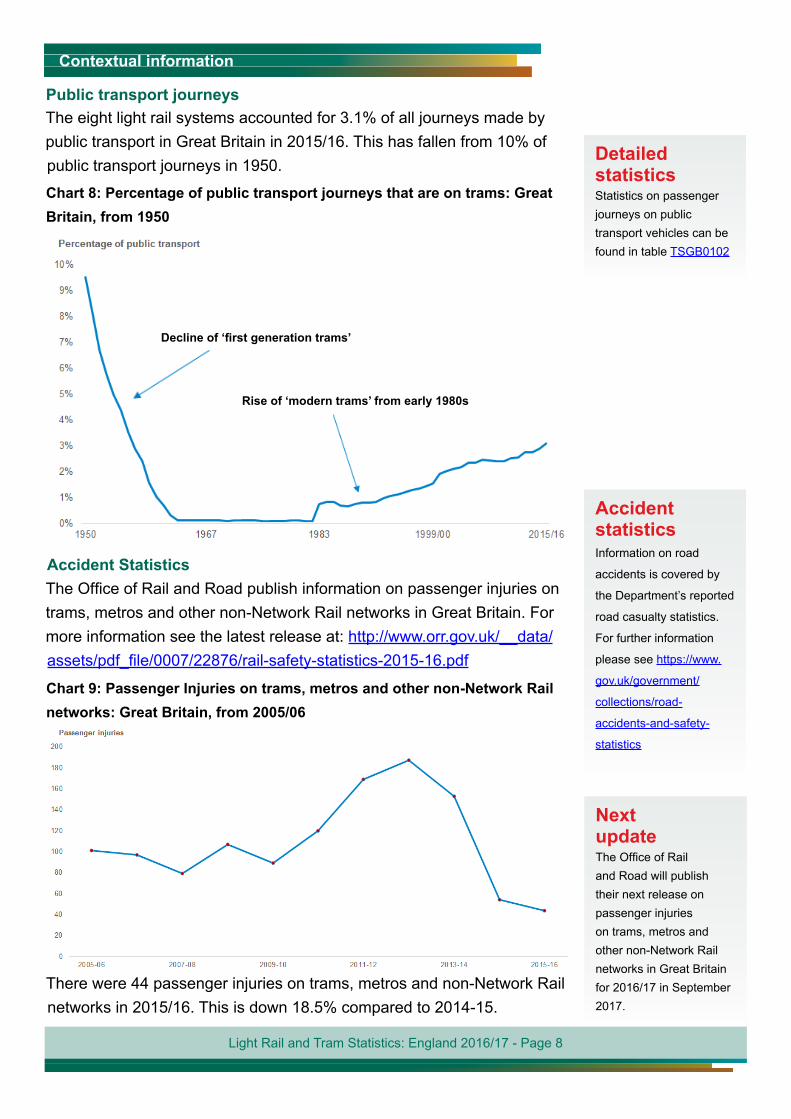
Chart 8: Percentage of public transport journeys that are on trams: Great Britain, from 1950
Accident statistics
Information on road
accidents is covered by
the Department’s reported
road casualty statistics.
For further information
please see https://www.
gov.uk/government/
collections/road-
accidents-and-safety-
statistics
Chart 9: Passenger Injuries on trams, metros and other non-Network Rail networks: Great Britain, from 2005/06
The eight light rail systems accounted for 3.1% of all journeys made by public transport in Great Britain in 2015/16. This has fallen from 10% of public transport journeys in 1950.
The Office of Rail and Road publish information on passenger injuries on trams, metros and other non-Network Rail networks in Great Britain. For more information see the latest release at: http://www.orr.gov.uk/__data/assets/pdf_file/0007/22876/rail-safety-statistics-2015-16.pdf
Detailed statistics Statistics on passenger journeys on public transport vehicles can be found in table TSGB0102
There were 44 passenger injuries on trams, metros and non-Network Rail networks in 2015/16. This is down 18.5% compared to 2014-15.
Next update The Office of Rail and Road will publish their next release on passenger injuries on trams, metros and other non-Network Rail networks in Great Britain for 2016/17 in September 2017.
Decline of ‘first generation trams’
Rise of ‘modern trams’ from early 1980s
Public transport journeys
Accident Statistics
Light Rail and Tram Statistics: England 2016/17 - Page 9
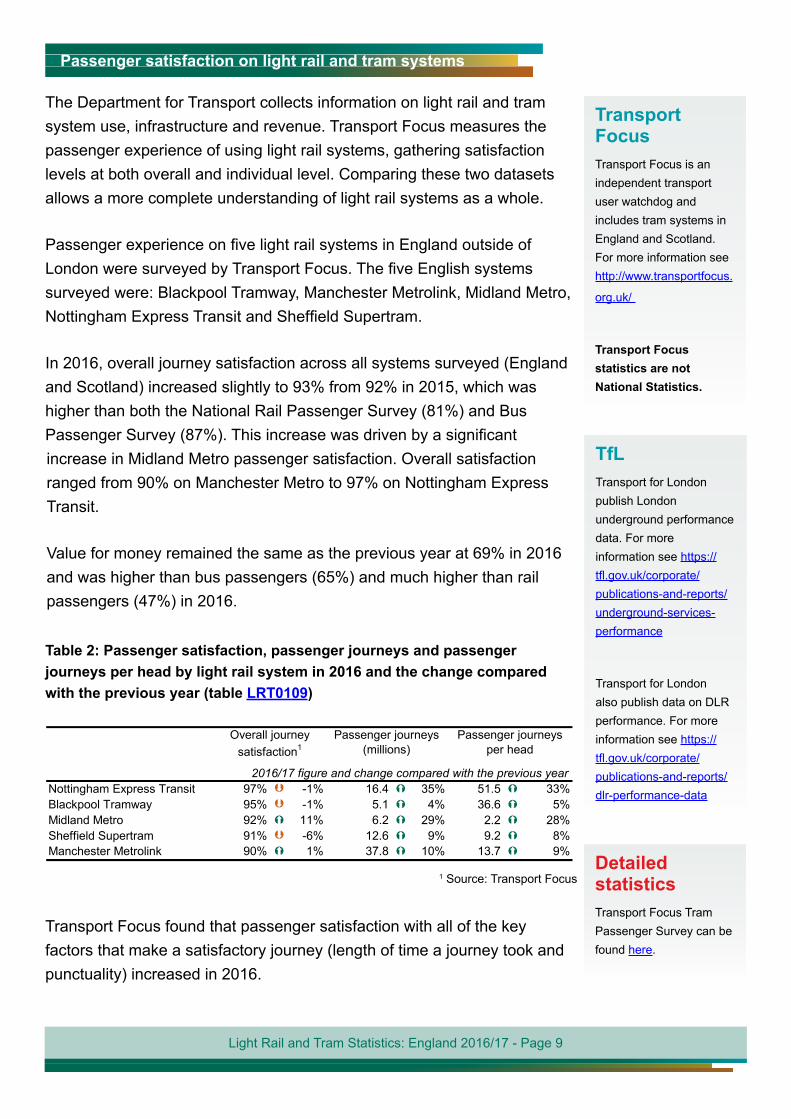
Nottingham Express Transit 97% -1% 16.4 35% 51.5 33%Blackpool Tramway 95% -1% 5.1 4% 36.6 5%Midland Metro 92% 11% 6.2 29% 2.2 28%Sheffield Supertram 91% -6% 12.6 9% 9.2 8%Manchester Metrolink 90% 1% 37.8 10% 13.7 9%
Passenger journeys (millions)
Passenger journeys per head
2016/17 figure and change compared with the previous year
Overall journey satisfaction1
1 Source: Transport Focus
Table 2: Passenger satisfaction, passenger journeys and passenger journeys per head by light rail system in 2016 and the change compared with the previous year (table LRT0109)
Detailed statisticsTransport Focus Tram Passenger Survey can be found here.
Transport FocusTransport Focus is an independent transport user watchdog and includes tram systems in England and Scotland. For more information see http://www.transportfocus.
org.uk/
Transport Focus statistics are not National Statistics.
Passenger satisfaction on light rail and tram systems
The Department for Transport collects information on light rail and tram system use, infrastructure and revenue. Transport Focus measures the passenger experience of using light rail systems, gathering satisfaction levels at both overall and individual level. Comparing these two datasets allows a more complete understanding of light rail systems as a whole.
Passenger experience on five light rail systems in England outside of London were surveyed by Transport Focus. The five English systems surveyed were: Blackpool Tramway, Manchester Metrolink, Midland Metro, Nottingham Express Transit and Sheffield Supertram.
In 2016, overall journey satisfaction across all systems surveyed (England and Scotland) increased slightly to 93% from 92% in 2015, which was higher than both the National Rail Passenger Survey (81%) and Bus Passenger Survey (87%). This increase was driven by a significant increase in Midland Metro passenger satisfaction. Overall satisfaction ranged from 90% on Manchester Metro to 97% on Nottingham Express Transit.
Value for money remained the same as the previous year at 69% in 2016 and was higher than bus passengers (65%) and much higher than rail passengers (47%) in 2016.
Transport Focus found that passenger satisfaction with all of the key factors that make a satisfactory journey (length of time a journey took and punctuality) increased in 2016.
TfLTransport for London publish London underground performance data. For more information see https://tfl.gov.uk/corporate/publications-and-reports/underground-services-performance
Transport for London also publish data on DLR performance. For more information see https://tfl.gov.uk/corporate/publications-and-reports/dlr-performance-data
Light Rail and Tram Statistics: England 2016/17 - Page 10
National Travel SurveyThe National Travel Survey is a household survey carried out on over 16,000 individuals in England every year. For more information see https://www.gov.uk/government/collections/national-travel-survey-statistics
User profiles (National Travel Survey data)
Overall journey satisfaction in 2016 tended to increase with decreasing total passenger journeys i.e. the highest overall journey satisfaction was associated with fewer people travelling. Also, overall journey satisfaction increased with increased passenger journeys per head i.e. passenger satisfaction increased as each passenger undertook more journeys. Furthermore, high value for money satisfaction tended to be associated with higher passenger journeys per head and lower total passenger journeys.
Definition In the National Travel Survey light rail includes the Tyne & Wear Metro, Docklands Light Railway, Manchester Metrolink, Glasgow Subway, Sheffield Supertram, Blackpool Tramway, London Tramlink, Nottingham Express Transit (NET) and Midland Metro. It has been possible to distinguish these modes since 1998, but the number of cases is small so eight years worth of data were combined to achieve a large enough sample size (2008 to 2015).
All modes includes walks, car, rail, light rail, local bus, bicycle and other. See here for more information.
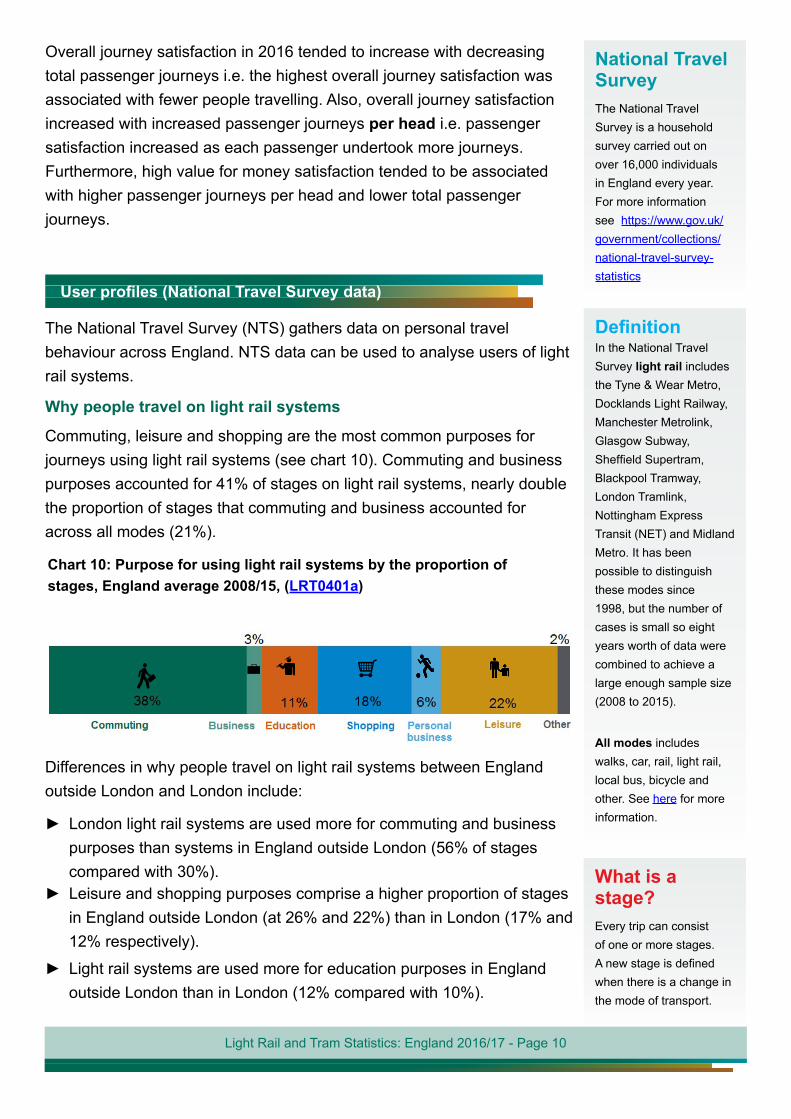
Why people travel on light rail systems
Commuting, leisure and shopping are the most common purposes for journeys using light rail systems (see chart 10). Commuting and business purposes accounted for 41% of stages on light rail systems, nearly double the proportion of stages that commuting and business accounted for across all modes (21%).
► London light rail systems are used more for commuting and business purposes than systems in England outside London (56% of stages compared with 30%).
► Leisure and shopping purposes comprise a higher proportion of stages in England outside London (at 26% and 22%) than in London (17% and 12% respectively).
► Light rail systems are used more for education purposes in England outside London than in London (12% compared with 10%).
Differences in why people travel on light rail systems between England outside London and London include:
Chart 10: Purpose for using light rail systems by the proportion of stages, England average 2008/15, (LRT0401a)
The National Travel Survey (NTS) gathers data on personal travel behaviour across England. NTS data can be used to analyse users of light rail systems.
What is a stage?Every trip can consist of one or more stages. A new stage is defined when there is a change in the mode of transport.
Light Rail and Tram Statistics: England 2016/17 - Page 11
Detailed methodologyStages on each light rail and tram systems could be distinguished by using trip origin and destination data.
For all light rail systems, men and women on average carry out the same number of stages per person per year (4.1). There is a larger difference between genders on London systems with men making 3.9 stages per person per year compared with 3.2 for women. For all modes, women travel more than men in terms of the number of stages per person per year.
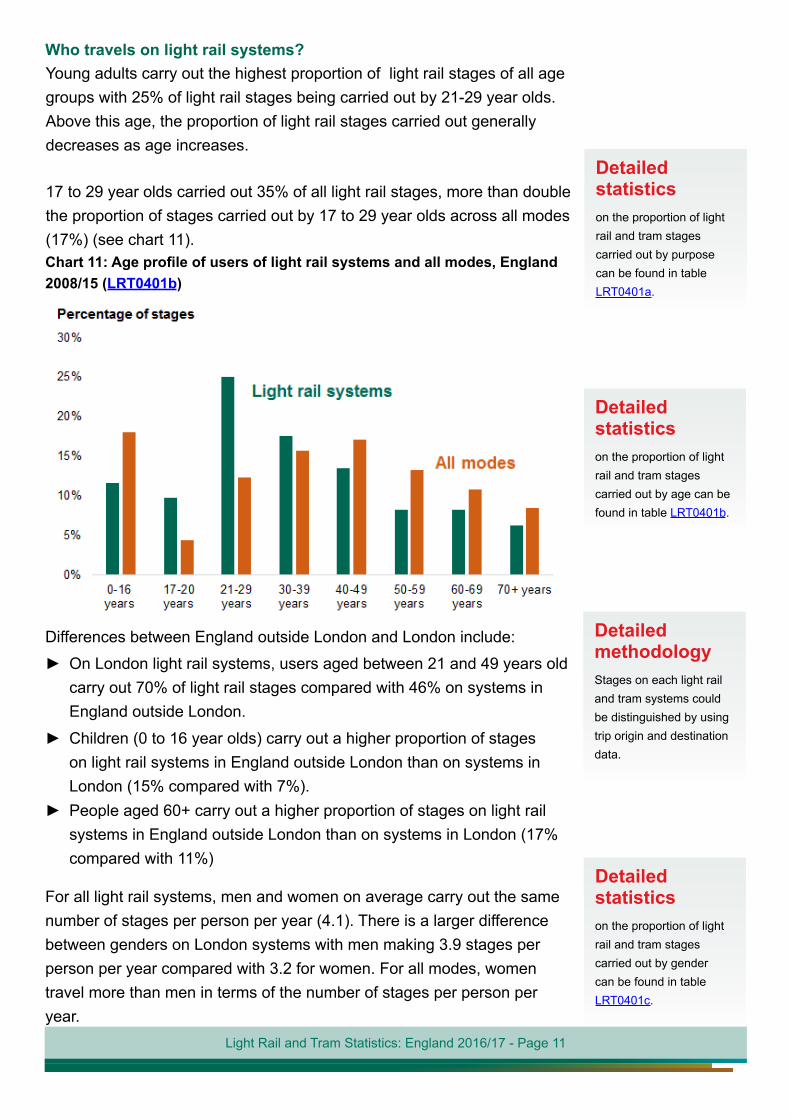
Differences between England outside London and London include: ► On London light rail systems, users aged between 21 and 49 years old carry out 70% of light rail stages compared with 46% on systems in England outside London.
► Children (0 to 16 year olds) carry out a higher proportion of stages on light rail systems in England outside London than on systems in London (15% compared with 7%).
Chart 11: Age profile of users of light rail systems and all modes, England 2008/15 (LRT0401b)
Detailed statisticson the proportion of light rail and tram stages carried out by gender can be found in table LRT0401c.
Who travels on light rail systems?Young adults carry out the highest proportion of light rail stages of all age groups with 25% of light rail stages being carried out by 21-29 year olds. Above this age, the proportion of light rail stages carried out generally decreases as age increases.
17 to 29 year olds carried out 35% of all light rail stages, more than double the proportion of stages carried out by 17 to 29 year olds across all modes (17%) (see chart 11).
► People aged 60+ carry out a higher proportion of stages on light rail systems in England outside London than on systems in London (17% compared with 11%)
Detailed statisticson the proportion of light rail and tram stages carried out by age can be found in table LRT0401b.
Detailed statisticson the proportion of light rail and tram stages carried out by purpose can be found in table LRT0401a.
Light Rail and Tram Statistics: England 2016/17 - Page 12
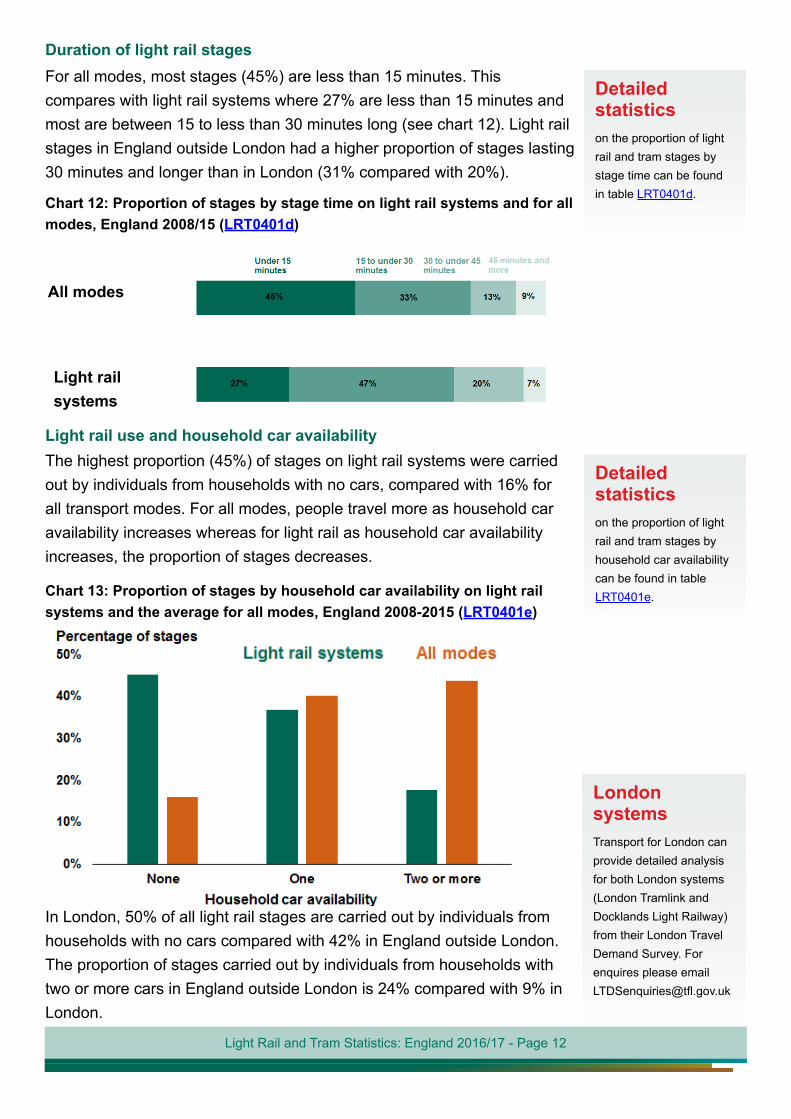
The highest proportion (45%) of stages on light rail systems were carried out by individuals from households with no cars, compared with 16% for all transport modes. For all modes, people travel more as household car availability increases whereas for light rail as household car availability increases, the proportion of stages decreases.
Light rail use and household car availability
In London, 50% of all light rail stages are carried out by individuals from households with no cars compared with 42% in England outside London. The proportion of stages carried out by individuals from households with two or more cars in England outside London is 24% compared with 9% in London.
Chart 13: Proportion of stages by household car availability on light rail systems and the average for all modes, England 2008-2015 (LRT0401e)
Detailed statisticson the proportion of light rail and tram stages by household car availability can be found in table LRT0401e.
Duration of light rail stagesFor all modes, most stages (45%) are less than 15 minutes. This compares with light rail systems where 27% are less than 15 minutes and most are between 15 to less than 30 minutes long (see chart 12). Light rail stages in England outside London had a higher proportion of stages lasting 30 minutes and longer than in London (31% compared with 20%).
Light rail systems
All modes
Chart 12: Proportion of stages by stage time on light rail systems and for all modes, England 2008/15 (LRT0401d)
Detailed statisticson the proportion of light rail and tram stages by stage time can be found in table LRT0401d.
London systemsTransport for London can provide detailed analysis for both London systems (London Tramlink and Docklands Light Railway) from their London Travel Demand Survey. For enquires please email [email protected]
Light Rail and Tram Statistics: England 2016/17 - Page 13
There are a number of definitional differences between the NTS data on users of light rail systems in the LRT0401 tables and the data on passenger journeys, vehicle kilometres etc sourced directly from operators of light rail and tram systems. These include:
• The LRT0401 tables give stages per person per year, as the NTS captures travel information of people, and the journeys that they make. The data from operators of light rail and tram systems counts passenger journeys and not the number of individuals. We know from this data that 267.7 million passenger journeys were undertaken on the eight light rail and tram systems in England in 2016/17, but we don’t know the number of individuals that made these journeys (some individuals will have made more than one journey over 2016/17).
• In the NTS, a boarding is when someone changes from one tram to another tram, using the same ticket. If a new ticket is required this would be counted as a new stage of the trip. Therefore, a person who uses one ticket and changes tram once (uses two trams) would be recorded as one stage in the NTS and two boardings. However, in some of the data provided by operators of light rail and tram systems this would be counted as two passenger journeys e.g. London Tramlink which counts a boarding using automatic door counts when passengers go in and out of a tram.
• In the NTS, journeys in the course of work are excluded. So while journeys for commuting are counted, journeys made by the tram driver, for example, are excluded. No information on whether these kind of journeys are included in the data provided by operators of light rail and tram systems is provided so it is possible that a small number may be included.
• The NTS tables only include stages carried out by people living in areas with light rail systems i.e. Blackpool, London, Greater Manchester, West Midlands, South Yorkshire, Nottinghamshire and Tyne and Wear. Therefore, stages undertaken by people living outside these areas and using the light rail system will not be included. The reason the analysis is limited in this way is to give a more realistic estimate of journeys per person per year (rather than basing the analysis on the whole population, many of whom would not have easy access to a tram or light rail system).
• In contrast to the NTS figures, the passenger journey figures sourced from operators of light rail and tram systems will include all journeys regardless of where the individual undertaking the journey lives, including tourists from outside England.
NTS data background informationNational Travel SurveyTechnical report on the National Travel Survey can be found at: https://www.gov.uk/government/statistics/national-travel-survey-2015
Light Rail and Tram Statistics: England 2016/17 - Page 14
Background information
Factors impacting on annual light rail figures:
• Tyne and Wear Metro was affected by ongoing modernisation with lines closed for longer periods, affecting overall patronage and leisure travel in particular.
• London Tramlink, a new Elmers End - Wimbledon service commenced operation in April 2016 utilising new additional platform at Wimbledon and 4 additional trams. Two further new trams entered service late 2016. There has been no significant impact on passenger patronage recorded since the Sandilands, Croydon tram crash incident in November 2016.
• The Midland Metro tram line extension through Birmingham City Centre to New Street Station became fully operational from 30th May 2016.
• Nottingham Express Transit this year (2016/17) benefitted from a full year of fully opened network following the phase 2 extension on 23 August 2015, which added 10.9 miles and 27 new stops to the network.
• In 2016, the Sheffield Supertram had taken delivery of seven Stadler Citylink trams which are currently under test/mileage accumulation.
• Blackpool Tramway increased the level of service throughout the year to meet demand. This reflects the fact that there has been a modal shift to the tram from buses, as one of the main bridges in the town for road traffic had been closed for the winter period.
• Manchester Metrolink’s Second City Crossing (2CC) was opened in February 2017. Incorporating some additional tracks and a new stop ‘Exchange Square.’
Manchester Metrolink mileage figures represent total mileage of each tram ‘set’ and when one train is formed of two sets, the kilometres travelled will be counted twice. Therefore, figures for the years after 2011/12 are not directly comparable with earlier ones (or with other systems) as the proportion of double sets has increased in recent years.
Further information on the methods used to compile these statistics and background information about the systems covered can be found here: www.gov.uk/government/publications/light-rail-and-tram-statistics-guidance
Light Rail and Tram Statistics: England 2016/17 - Page 15
Users and uses of these statistics
These statistics are collected to provide information on light rail systems within England to monitor trends in passenger journeys, service provision and revenue. They help to provide a comprehensive picture of public transport use in Great Britain.
Within DfT they are used as background information in the development
Outside DfT, known users include researchers, academics and Parliamentary groups with the main known use as context for reports related to light rail.
with these statistics. However, we welcome feedback on the content, format or timing of the statistics by email to [email protected] or on 020 7944 3094.
Strengths and weaknesses of the data
derived from different sources (most commonly ticket machine data), vehicle mileage is based on scheduled timetables less known lost mileage,
A complete response has been received for many years. Data requested should be readily available to operators, or easy for them to extract. Returns are validated by comparison with previous years and seeking explanation where differences are large or unexpected. This means that
therefore we consider them appropriate for the uses outlined above.
in the methods used to count journeys or to estimate passenger or vehicle kilometres, which may affect comparisons between different systems.
materially affect comparisons. On occasions operators may revise their methodology which could impact on the trends shown. As a result year-on-year changes should be treated with caution, though the effect on broad patterns is likely to be minimal.
National statistics
National Statistics are produced to high professional standards set out in the National Statistics Code of Practice. They undergo regular quality assurance reviews to ensure they meet customer needs: www.statisticsauthority.gov.uk/assessment/code-of-practice/index.html
For details of ministers
pre-release access to these statistics up to 24 hours before release: www.gov.uk/government/publications/light-rail-and-tram-statistics-guidance
Next update The next Light Rail and Tram Statistics release is due to be published in summer 2018.
To hear more about DfT statistics publications as they are released please follow us on Twitter via our @DfTstats account: http://www.twitter.com/DfTstats. TWITTER, TWEET, RETWEET and the Twitter logo are trademarks of Twitter, Inc.