lightning in western patagonia - wwlln.net · lightning in western patagonia ... 2012 when a major...
TRANSCRIPT

Lightning in Western PatagoniaRené D. Garreaud1, M. Gabriela Nicora2, Rodrigo E. Bürgesser3, and Eldo E. Ávila3
1Department of Geophysics, Universidad de Chile and Center for Climate and Resilience Research, Santiago, Chile,2CEILAP, UNIDEF (MINDEF-CONICET), Buenos Aires, Argentina, 3FaMAF, Universidad Nacional de Córdoba, IFEG-CONICET,Córdoba, Argentina
Abstract On the basis of 8 years (2005–2012) of stroke data from the World Wide Lightning LocationNetwork we describe the spatial distribution and temporal variability of lightning activity over WesternPatagonia. This region extends from ~40°S to 55°S along the west coast of South America, is limited to theeast by the austral Andes, and features a hyper-humid, maritime climate. Stroke density exhibits a sharpmaximum along the coast of southern Chile. Although precipitation there is largely produced by coldnimbostratus, days with more than one stroke occur up to a third of the time somewhere along the coastalstrip. Disperse strokes are also observed off southern Chile. In contrast, strokes are virtually nonexistentover the austral Andes—where precipitation is maximum—and farther east over the dry lowlands ofArgentina. Atmospheric reanalysis and satellite imagery are used to characterize the synoptic environmentof lightning-producing storms, exemplified by a case study and generalized by a compositing analysis.Lightning activity tends to occur when Western Patagonia is immersed in a pool of cold air behind a frontthat has reached the coast at ~40°S. Under these circumstances, midlevel cooling occurs before and ismore prominent than near-surface cooling, leading to a weakly unstable postfrontal condition. Forceduplift of the strong westerlies impinging on the coastal mountains can trigger convection and producessignificant lightning activity in this zone. Farther offshore, large-scale ascent near the cyclone’s center maylift near-surface air parcels, fostering shallow convection and dispersing lightning activity.
1. Introduction
Frontal cyclones drifting eastward along the oceanic storm tracks are responsible for most of the precipitationand day-to-day weather variations in the extratropics. These storms are dominated by clouds and precipitationof stratiform nature [e.g.,Houze, 1993, chapter 9] with rather weak vertical air velocities (≤ 2ms�1). Consistently,they exhibit modest lightning activity relative to deep convective systems over warm land masses. Indeed,global lightning climatologies constructed on the basis of satellite data [e.g., Christian et al., 2003] andground-based networks [Virts et al., 2013] reveal that the mean lightning density over the oceans polewardof 40° is 50 to 500 times smaller than the lightning density over tropical/subtropical land masses. Thelightning density over extratropical oceans is somewhat larger to the east of North and South America,Japan, and South Africa during their respective winter seasons [e.g., Virts et al., 2013, Figure 4], where warmwaters prevail and cyclogenesis is frequent [Hoskins and Hodges, 2002].
Analyses of specific events over the North Pacific [Pessi et al., 2009; Pessi and Businger, 2009a] and NorthAtlantic [Demetriades and Holle, 2005] reveal that lightning activity is concentrated along the cold front ofmidlatitude storms, probably in connection with a line of forced convection known as the narrow cold-frontalrainband [e.g., Browning, 1986], as well as near the cyclone’s center during its developing stage. Pessi andBusinger [2009a] also show a consistent logarithmic increase in convective rainfall rates and other stormmetrics with increasing lightning rates, opening the possibility of lightning data assimilation to improvenumerical weather forecasts over remote ocean regions [Pessi and Businger, 2009b]. Lightning has also beenreported during cold-season storms over high-latitude, continental regions [Mäkelä et al., 2011]. Recently,Mäkelä et al. [2013] studied two winter thunderstorms in southern Finland that had adverse effects onaviation. These unseasonable events occurred within the occluded sector of a front, over ice-free sea andwith near-zero convective available energy. Thunder during snow storms (the so-called thundersnow events)are infrequent but they have been documented over North America [Schultz, 1999; Market et al., 2002].
Although winter snow clouds are sometimes as low as 6 km, they can produce lightning and their chargeevolution is similar to that on summer thunderstorms [Takahashi et al., 1999]. Observations suggest that graupel
GARREAUD ET AL. ©2014. American Geophysical Union. All Rights Reserved. 1
PUBLICATIONSJournal of Geophysical Research: Atmospheres
RESEARCH ARTICLE10.1002/2013JD021160
Key Points:• Significant lightning activity occurs inWestern Patagonia
• Lightning storms develop under a cold,weakly unstable postfrontal condition
• Topography and ocean conditionsfavor lightning activity inWestern Patagonia
Correspondence to:R. D. Garreaud,[email protected]
Citation:Garreaud, R. D., M. Gabriela Nicora, R. E.Bürgesser, and E. E. Ávila (2014),Lightning in Western Patagonia,J. Geophys. Res. Atmos., 119,doi:10.1002/2013JD021160.
Received 7 NOV 2013Accepted 15 MAR 2014Accepted article online 21 MAR 2014

and ice crystals are the major charge carriers and that noninductive mechanism acts as the main chargeseparation process in these cold systems. Ávila et al. [2013] studied in the laboratory the performance of thenoninductivemechanism undermicrophysical conditions similar to some of those which occur in winter storms.Their results indicate that this mechanism of charge separationmay contribute to the electrification processes inthe winter thunderstorms, provided that the residence time of the graupel in the cloud is of sufficient duration.
Lightning activity is markedly low (sparse satellite coverage and fewer ground-based receivers to the southof 40°S may exacerbate this condition) along the Southern Hemisphere storm track (Figure 1) that iscollocated with the westerly wind belt between 45° and 55°S [e.g., Hoskins and Hodges, 2005]. Annual meanrainfall across much of the Southern Oceans is about 1000–1500mm, but this value changes dramaticallyas the storm track intercepts Patagonia in the southern tip of South America [e.g., Garreaud et al., 2013].This region extends southward from about 40°S and is divided by the austral Andes (i.e., the southernextent of this mountain range); sea surface temperatures (SSTs) over the adjacent Pacific Ocean do notsurpass 10°C. Orographic enhancement upstream of the mountains results in copious precipitation overWestern Patagonia (Chilean side). The actual precipitation distribution is poorly constrained, because of theminimum rain gauge network in this extremely inaccessible region, but the annual mean accumulationranges between 5.000 and 10.000mm/yr (Figure 2) supporting extensive rainforests, major rivers, and theNorthern and Southern Patagonia Ice Fields. Mean precipitation decreases to less than 300mm/yr just afew tens of kilometers downstream of the continental divide, leading to one of the most dramaticprecipitation gradients on Earth [Smith and Evans, 2007].
Based on the previous background, conventional wisdom suggests little—if any—lightning activity over the cool,hyper-humidWestern Patagonia. Two lines of evidence, however, suggest that lightning in that region does occurrather frequently. First, paleoenvironmental reconstructions based on tree samples and lake sediments havedocumented significant, albeit variable, wildfire activity over Western Patagonia during the Holocene (see Holzand Veblen [2011a] for a review). Before the Euro-Chilean colonization (~ 200years ago), forest fires in thisremote area have been attributed to lightning ignition [Markgraf and Anderson, 1994;Whitlock et al., 2007]during extended periods of relatively dry and warm conditions [Holz and Veblen, 2011b]. Second, the WorldWide Lightning Location Network (WWLLN), a ground-based network described in detail in section 2,allows a global, real-time monitoring of lightning activity for ~1700 volcanoes to detect ash cloud lightningsignaling an ongoing volcanic eruption (http://wwlln.net/volcanoMonitor.html). The southern Andes hostsmore than 33 active volcanoes, but their eruption is rare (e.g., three major events in the last decade(Servicio Nacional de Geologia y Mineria, unpublished report, http://www.sernageomin.cl/volcanes.php).
Figure 1. Annualmean frequency of lightning (flashes per km2/yr) from (a) LIS/OTD and (b)WWLLN. Also shown is annualmeanprecipitation (grey contours every 300mm/yr from Climate Prediction Center (CPC) Merged Analysis Precipitation, CMAP) and850hPa wind speed in excess of 12m/s (bounded by white contours, from NCEP-National Center for Atmospheric Researchreanalysis) indicative of the SH westerly wind belt and storm track. Vertical perspective (globe view from finite distance).
Journal of Geophysical Research: Atmospheres 10.1002/2013JD021160
GARREAUD ET AL. ©2014. American Geophysical Union. All Rights Reserved. 2

In contrast, we noted WWLLN volcanic warnings 4–5 times per month over southern South America thatwere subsequently interpreted as weather-related events.
In this work we precisely study lightning activity over Western Patagonia, with emphasis in their distributionand attending meteorological conditions. Our study relies on 8 year data from the WWLLN along with othersources of meteorological information described in section 2. The spatial distribution and temporal behavior ofthe lightning activity is documented in section 3. Section 4 provides a synoptic analysis for the first week of May2012 when a major lightning event took place over Western Patagonia. A compositing analysis ofmeteorological conditions is then performed in section 5 to generalize the findings in the case study, alongwitha consideration of local factors controlling the occurrence of lightning storms. Concluding remarks arepresented in section 6, including a conceptual model of Western Patagonia lightning storms.
2. Data
The World Wide Lightning Location Network (WWLLN, http://wwlln.net) started in 2003 with 11 ground-basedsensors, and it is currently composed by 70 sensors over all the continents and a few islands [Hutchins et al.,2012; Virts et al., 2013]. The sensors detect very low frequency radio waves (sferics) that are emitted by lightningand travel through the Earth ionosphere waveguide. At least five WWLLN sensors are required to locate alightning stroke in space and time to within ~5km and<10μs, respectively, favoring the detection of the mostenergetic cloud-to-ground strokes [Abarca et al., 2010].
In this work we have used WWLLN data from January 2005 to December 2012, with emphasis on theoccurrence of lightning over the Western Patagonia and the adjacent Pacific to the south of ~40°S. TheWWLLN detection efficiency (DE) in this region is unknown, and it changed over time (there is no in situlightning detection network, and the data from the Lightning Imaging Sensor on board of the TropicalRainfall Measuring Mission satellite are limited to ±38° of latitude), but it is likely between 5 and 10%, the
Figure 2. Annual mean precipitation from a regional model simulation (contoured at levels indicated in the color scale) andstation data (colored circles, scale at right). The model simulation is PRECIS forced by ERA-40 from 1979 to 2001 (see detailsin Garreaud et al. [2013]). Terrain elevation (gray scale) is from the Shuttle Radar Topography Mission.
Journal of Geophysical Research: Atmospheres 10.1002/2013JD021160
GARREAUD ET AL. ©2014. American Geophysical Union. All Rights Reserved. 3

global efficiency estimated elsewhere [Lay et al., 2004; Abarca et al., 2010; Rudlosky and Shea, 2013]. Basedon the energy statistics of the detected strokes, Hutchins et al. [2012] further analyzed the relative DE of theWWLLN and their change on time. Using their DE model, Hutchins et al. [2012] were able to correct theglobal stroke density for a particular year (2011) leading to major changes over Africa (>50%) but seeminglyminor changes over southern South America (<10%) [Hutchins et al., 2012, Figure 16].
For our case study (30 April to 3 May 2012) we also used stroke locations derived from the Sferics Timingand Ranging Network (STARNET, see details at http://www.zeus.iag.usp.br/). This network is currentlycomposed by eight ground-based sensors located in Brazil and the adjacent Atlantic (all of them to thenorth of 25°S) to monitor lightning over the tropical regions. To our knowledge, however, the detectionefficiency for STARNET is not available. We have also used historical records of thunderstorm days on ahandful of stations in Patagonia compiled by the World Meteorological Organization (WMO) [1953].
The atmospheric circulation and thermodynamic conditions during lightning-producing storms werecharacterized using the Climate Forecast System Reanalysis (CFSR) elaborated by the National Centers forEnvironmental Prediction (NCEP). In this reanalysis, satellite retrievals, surface, and upper air observationsare assimilated upon a state-of-the-art numerical model to produce the best estimate of the three-dimensional state of the atmosphere/ocean system. The first version of the reanalysis (CFSRv1) [Saha et al.,2010] covers the period 1979–2011, and its second version (CFSRv2) [Saha et al., 2014] covers the periodfrom January 2011 until now. A major advantage of CFSR is its much higher spatial resolution relative toother reanalyses; here we used pressure level and surface data available every 6 h on a global 0.5° × 0.5°latitude-longitude grid. The high resolution of CFSR is particularly useful when examining specific stormsover Western Patagonia, in conjunction with WWLLN data and visible (channel 1) and thermal infrared(channel 4) satellite images from GOES 13 archived in the NOAA Comprehensive Large Array-dataStewardship System (http://www.class.ncdc.noaa.gov/).
To provide context to our lightning climatology we describe the annual mean precipitation field obtainedfrom several sources. Over land we used the long-term (at least 30 years of data) average values from raingauges operated by the Chilean weather service and water authority. Because this network has a low densityover Western Patagonia, we also employed the results from a 20-yearlong regional climate simulation oversouthern South America and the adjacent oceans using the PRECIS model [see details and validation inGarreaud et al., 2013]. Farther offshore, we used the long-term mean values from the NOAA NCEP ClimatePrediction Center Merged Analysis of Precipitation (CMAP) [Xie and Arkin, 1997].
3. Spatial and Temporal Distribution
Let us begin our analysis by displaying the lightning density (ρL) and the number of days with lightning (Nd)(Figures 3a and 3b). The lightning density is defined here as the count of strokes in nonoverlapping0.1°× 0.1° latitude-longitude grid boxes considering the whole record (January 2005 to December 2012)divided by 8 years, so it has units of strokes per ~100 km2/yr. The number of days with lightning is the countof days with a least one stroke in 0.25° × 0.25° latitude-longitude grid boxes considering the whole recorddivided by 8 years, so it has units of d/yr. The grid box sizes are somewhat arbitrary and do not necessarilycoincide with other work’s definitions, but they allow us to detect the detailed structure of ρL and Nd as wellas regional differences.
The ρL and Ndmaps have a similar, well-defined structure, with a sharp maximum along the Chilean coast from42° to 52°S (Figure 3). This coastal band of maximum in ρL and Nd is collocated with the maximum inprecipitation and number of rainy days derived from high-resolution, satellite-based products (the SpecialSensor Microwave Imager rain rate estimates) [Falvey and Garreaud, 2007, Figure 2] and a local maximum inCFSR convective rainfall rate (not shown). Lightning activity is virtually nonexistent over the austral Andes,including the massive Northern and Southern Patagonia Ice Fields. Very low lightning activity is found overthe dry lowlands to the east of the austral Andes, but ρL and Nd increase equatorward reaching valuescomparable to those in Western Patagonia to the north of 38°S. Low stroke density is also observed offsouthern Chile, but lightning does occur there as shown in Figure 4 by the stroke location for the year 2011.The band of scattered lightning activity over the South Pacific is centered about 3° equatorward of the axisof precipitation maxima, a feature also seen in other storm track regions [Virts et al., 2013].
Journal of Geophysical Research: Atmospheres 10.1002/2013JD021160
GARREAUD ET AL. ©2014. American Geophysical Union. All Rights Reserved. 4

Figure 3. (a) Lightning density contoured every 1.2 stroke in 0.1° × 0.1° latitude-longitude grid boxes per year. (b) Numberof lightning days (at least one stroke in 0.25° × 0.25° latitude-longitude grid boxes per year) contoured every 2 d/yr. Datafrom WWLLN, January 2005 to December 2012. Symbols in Figure 3b are the annual mean number of thunderstorm daysfrom WMO [1953]. See text for details. Terrain elevation (gray scale) is from the Shuttle Radar Topography Mission. Alsoindicated is the Western Patagonia box (yellow rectangle), a zonal transect used in Figure 5, the locations of the Northernand Southern Patagonia Ice Fields, and a few other geographical features. Equirectangular projection is shown.
Journal of Geophysical Research: Atmospheres 10.1002/2013JD021160
GARREAUD ET AL. ©2014. American Geophysical Union. All Rights Reserved. 5

Granted, the unknown and variable detection efficiency of WWLLN over this region prevents fromassigning too much confidence on the numerical values of the lightning density (ρL) displayed inFigure 3a and our subsequent analyses (Figures 5 and 6). In this exploratory work we have refrained fromapplying a detection efficiency model to correct the stroke density over Western Patagonia as in Hutchinset al. [2012]. Nonetheless, the yearly (2005, 2006,…, 2012) maps of the number of strokes per boxnormalized by the total number of strokes in Western Patagonia (see below) are very similar and theyhave a pattern correlation coefficient ≥0.6 for any pair of years, lending confidence to the spatial patternof ρL. Moreover, because of its own definition, the values and patterns of Nd are much less affected byany temporal change that may have affected the stroke detection efficiency of the WWLLN [e.g., Rudloskyand Shea, 2013].
Further support for the lightning distributions in Figure 3 comes from the survey of thunderstorm days (a daywhen at least one thunder is heard) presented in WMO [1953] on the basis of several years of record.Typically, a thunder is heard by a human observer when it occurs within 20 km from its base station.The annual mean number of thunderstorm days for the available stations is superimposed on the Nd field(Figure 3b), and we note an excellent agreement between these two data sets considering their differentnature and temporal coverage.
The lightning maximum along the Chilean coast is nothing but remarkable considering the complexgeography of this area, filled with small islands, fiords, embayment, and channels. A closer inspection ofFigure 3a shows localized maxima over the seafront of major geographical features, including the islands of
Figure 4. Lightning locations during 2011 (yellow circles) superimposed on the terrain elevation. Data from WWLLN. Toavoid excessive overlapping among the circles, the full lightning data over this region were sorted in time and only one everythree strokes is plotted (i.e., we are only showing a third of the complete lightning locations). The dashed lines indicate the bandof maximum precipitation offshore (from CMAP and PRECIS data, see text). Equirectangular projection is shown.
Journal of Geophysical Research: Atmospheres 10.1002/2013JD021160
GARREAUD ET AL. ©2014. American Geophysical Union. All Rights Reserved. 6

Madre de Dios (50°S) and Wellington (49°S), the Taitao Peninsula (46.5°S), and the coast of Golfo de Penas(47.5°S), the local maxima for lightning flash density. A zonal transection at 49°S (Figure 5) confirms thelightning’s preference for the coastal plains (0–100m above sea level (asl)) well exposed to the NW winds.Precipitation in these sectors is unknown, but likely around 5000mm/year, well below the estimated
Figure 5. West-east transection at 49°S of the lightning density (yellow line, fromWWLLN), annual mean precipitation (blueline, from PRECIS), and terrain elevation (gray area, from Shuttle Radar Topography Mission). Scales for lightning densityand precipitation at left and scale for terrain elevation at right.
Figure 6. (a) Time series of the number of WWLLN strokes and CFSR total precipitation in the Western Patagonia box(42–54°S/76–70°W, see Figure 3) during year 2012. (b) Black bars: monthly mean (over the 8 year record) number ofdays with at least one stroke over Western Patagonia box; gray bars: as before but for the monthly mean number ofdays with at least 10 strokes. Data from WWLLN, January 2005 to December 2012.
Journal of Geophysical Research: Atmospheres 10.1002/2013JD021160
GARREAUD ET AL. ©2014. American Geophysical Union. All Rights Reserved. 7

accumulation over the Patagonia Ice Fields located 50–100 km inland that reach more than 1.5 km asl. Aspatial offset between the maximum in lightning activity and the higher terrain maximum has also beenfound to the west of the Albertine Rift Mountain in central Africa [Bürgesser et al., 2013], although it is not asmarked as in Western Patagonia.
The temporal behavior of the lighting activity in southern Chile is illustrated by the time series of the dailynumber of strokes in Western Patagonia box (42–54°S/76–70°W, see Figure 3) for year 2011 (Figure 6a).Recall the dependence of the number of strokes on the WWLLN detection efficiency. Because the strokesare highly clustered on a few spots along the coast, our results are not sensitive to the box definition.During 2011 there were 125 lightning days in Western Patagonia; other years show a similar behavior (notshown), and the yearly number of lightning days in the Western Patagonia box varies from 107 in 2008 to151 in 2012, possibly as a consequence of changes in the detection efficiency and natural variability.Lightning activity concentrates in events of 1–4 day duration recurring a few times per month. Figure 6aalso includes CFSR total precipitation over the Western Patagonia box which is highly recurrent there(nearly 70% of the time); lightning days are accompanied by precipitation all the time but there are manyprecipitation days with no lightning.
Using the 8 year record, the monthly average number of lightning days (as well as days with more than 10strokes) in the Western Patagonia box is shown in Figure 6b. Consistent with a small thermal forcing at highlatitudes, the lightning activity in Western Patagonia exhibits a weak annual cycle. Lightning activity,however, tends to be more frequent from summer in the Southern Hemisphere (SH) (December, January, andFebruary) to late fall, peaking in March to April, and somewhat lower in late winter and spring (see alsoFigure 6a). Likewise, the number of station-based thunderstorm days in Western Patagonia is slightly larger insummer and fall [WMO, 1953]. We also verified that the lightning density pattern in every month and seasonis very similar to the annual map (Figure 3), with a sharp maximum in lightning activity along the WesternPatagonia coast where strokes occur in nearly a third of days.
4. A Case Study
Nearly 500 strokes were detected within the Western Patagonia box on 30 April 2012 (most of them afternoon), the maximum daily count on record. Significant lightning activity continued until 3 May (Figure 7a)with a total of 900 strokes during this event. Figure 8 shows the location of the lightning (from bothWWLLNand STARNET) during 30 April. The lightning distribution for that day followed the climatological pattern
Figure 9. Weather map valid at 1800 UTC 30 April 2012, including SLP (contoured every 5 hPa), 925 hPa air temperature(shading) and 300 hPa geopotential height (5600 and 5500 mgp, white contours). Also indicated is the major cold frontrooted in the cyclone (L) over the South Pacific. Data from CFSR.
Journal of Geophysical Research: Atmospheres 10.1002/2013JD021160
GARREAUD ET AL. ©2014. American Geophysical Union. All Rights Reserved. 8
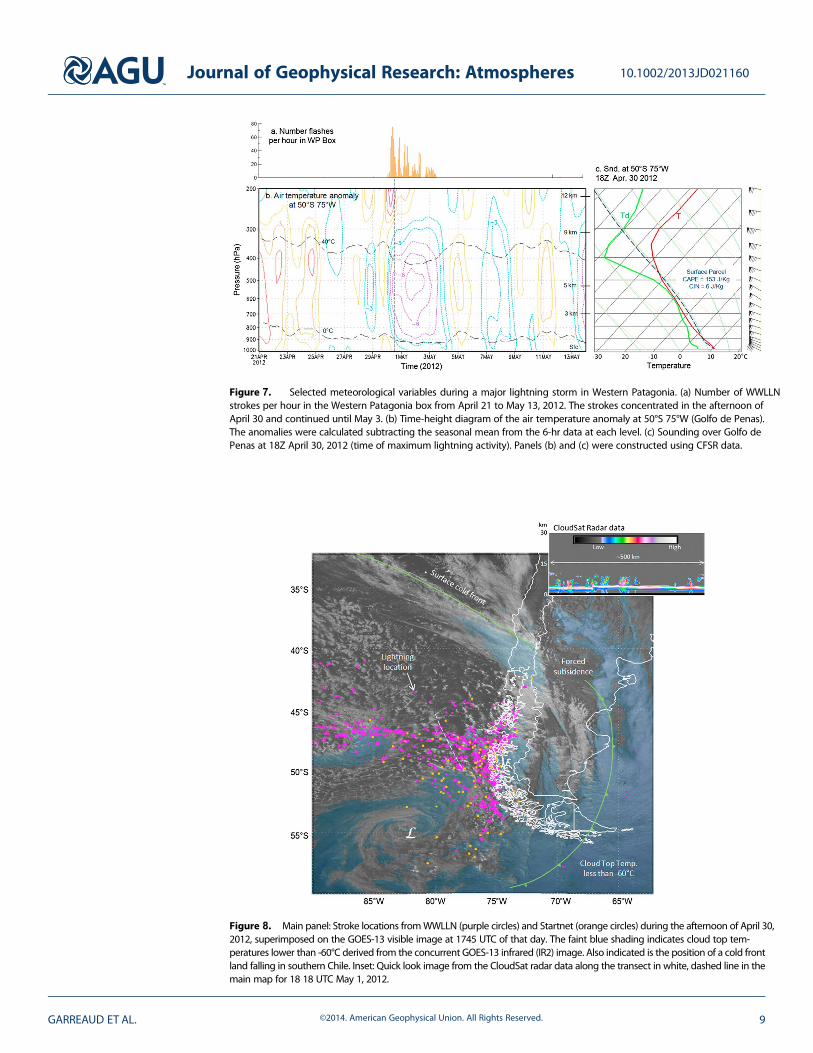
Figure 8. Main panel: Stroke locations fromWWLLN (purple circles) and Startnet (orange circles) during the afternoon of April 30,2012, superimposed on the GOES-13 visible image at 1745 UTC of that day. The faint blue shading indicates cloud top tem-peratures lower than -60°C derived from the concurrent GOES-13 infrared (IR2) image. Also indicated is the position of a cold frontland falling in southern Chile. Inset: Quick look image from the CloudSat radar data along the transect in white, dashed line in themain map for 18 18 UTC May 1, 2012.
Figure 7. Selected meteorological variables during a major lightning storm in Western Patagonia. (a) Number of WWLLNstrokes per hour in the Western Patagonia box from April 21 to May 13, 2012. The strokes concentrated in the afternoon ofApril 30 and continued until May 3. (b) Time-height diagram of the air temperature anomaly at 50°S 75°W (Golfo de Penas).The anomalies were calculated subtracting the seasonal mean from the 6-hr data at each level. (c) Sounding over Golfo dePenas at 18Z April 30, 2012 (time of maximum lightning activity). Panels (b) and (c) were constructed using CFSR data.
Journal of Geophysical Research: Atmospheres 10.1002/2013JD021160
GARREAUD ET AL. ©2014. American Geophysical Union. All Rights Reserved. 9

(cf. Figures 8 and 3) with most strokes clustered along the coast of southern Chile, disperse strokes offshore,and no strokes over the austral Andes or farther east. We also note a general agreement in the strokelocations between both data sets, although WWLLN detected 5 times more strokes than STARNET.
Important meteorological features of this event are revealed by the composited GOES image (1745 UTC of 30April, Figure 8) together with the concurrent weather map (Figure 9). A key ingredient is a deep cyclone(central pressure< 955 hPa) to the west of the tip of the continent, driving strong low-level westerly flow overthe South Pacific (Figure 10a; see also the wind profile in Figure 7c). A closed low is also seen in the 500 hPageopotential height right above the surface cyclone (Figure 9), indicative of the mature stage of this system.The attending cold temperatures in the middle troposphere moved eastward from the central Pacific on 27April to reach the west coast on 30 April and remained stationary there for the next 4 days (not shown).
Cold air advection maintained a cold front over the South Pacific, evident in the temperature analysis andsatellite imagery, intercepting the Chilean coast at about 38°. The front is interrupted to the east of the Andesbut reformed near the Atlantic sea border spiraling toward the cyclone center. The total precipitation(stable + convective, Figure 10c) maximized in the sector where the cold front land fell (up to 25mm in 6 h)
Figure 10. Selected CFSR meteorological fields for 30 April 2012, at 1800 UTC, superimposed on the GOES 13 visible imageand WWLLN stroke locations (purple circles) during the afternoon of that day. (a) 700 hPa wind vectors. The longest arrowsare 20m/s. (b) Surface CAPE contoured every 50 J/kg. (c) Total precipitation accumulated during the last 6 h (scale at bottom).(d) Convective precipitation accumulated during the last 6 h (scale at bottom). In each panel the letter L indicates the cyclone’scenter. Equirectangular projection is shown.
Journal of Geophysical Research: Atmospheres 10.1002/2013JD021160
GARREAUD ET AL. ©2014. American Geophysical Union. All Rights Reserved. 10
and was also large over the mountains down to 45°S because of the marked orographic enhancement.Notably, lightning activity did not occur along the cold front, but it was found within the cold, postfrontalair mass that had reached Western Patagonia. Open cell clouds are evident in the satellite image withinthe postfrontal sector off Western Patagonia, and there is a hint of a developing polar low farther west(47°S–87°W) accompanied by some lightning activity as well. The raw echo return power from a CloudSatquick look image (inset in Figure 8) further reveals the shallow nature of the postfrontal convection withcloud tops below ~7 km asl. Also note that convective precipitation was a minor contribution over thefrontal sector and the austral Andes, but it dominates over the postfrontal sector (~5mm in 6 h, Figure 10d)where lightning occurred.
The time-pressure diagram of the air temperature anomalies (Figure 7b) shows the differential cooling at lowand midlevels off Western Patagonia during the development of this event. In the middle troposphere therewas a rapid cooling right at the beginning of the event (30 April) in connection with the arrival of the postfrontalair mass. The cooling continued until 2 May, when 500hPa air temperatures were 10°C cooler than the seasonalaverage. The cooling below 900hPa was weaker (less than 3°C) and took place more gradually than aloftbecause of the sensible heat flux (~80Wm�2) at the sea surface. Thus, the most unstable condition off WesternPatagonia occurred on 30 April, 12–24h after the passage of the cold front. Indeed, convective available
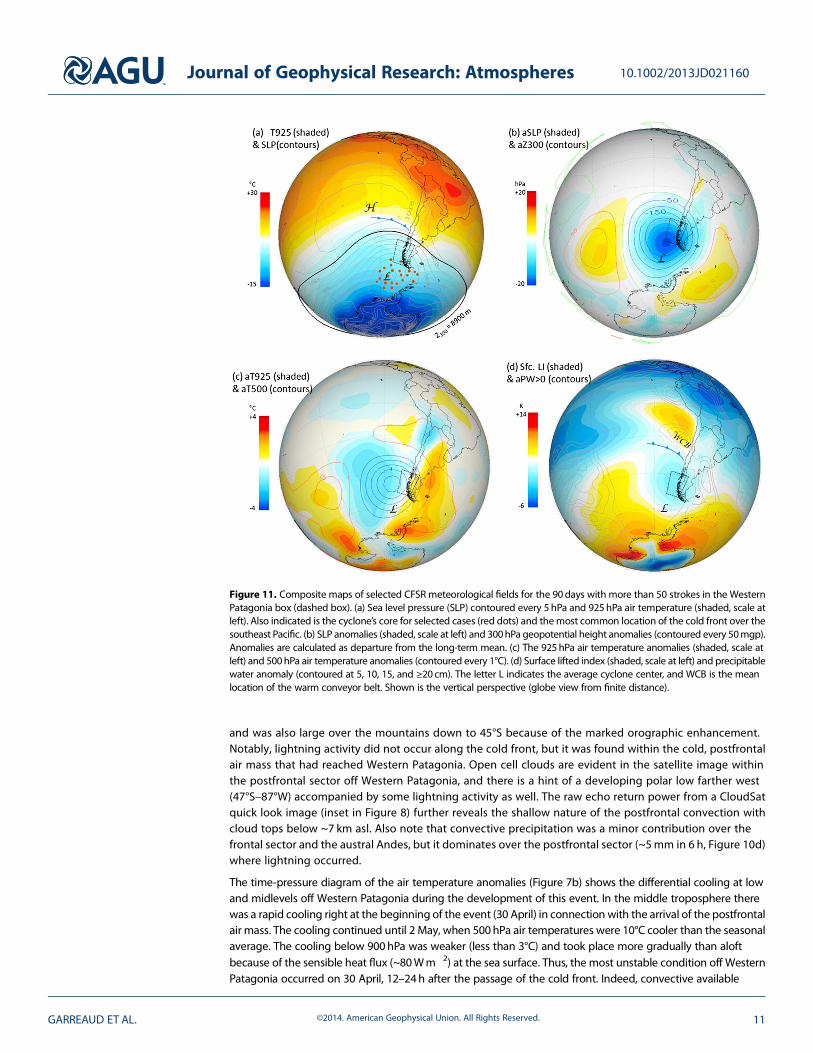
Figure 11. Composite maps of selected CFSR meteorological fields for the 90days with more than 50 strokes in the WesternPatagonia box (dashed box). (a) Sea level pressure (SLP) contoured every 5 hPa and 925hPa air temperature (shaded, scale atleft). Also indicated is the cyclone’s core for selected cases (red dots) and themost common location of the cold front over thesoutheast Pacific. (b) SLP anomalies (shaded, scale at left) and 300hPa geopotential height anomalies (contoured every 50mgp).Anomalies are calculated as departure from the long-term mean. (c) The 925hPa air temperature anomalies (shaded, scale atleft) and 500hPa air temperature anomalies (contoured every 1°C). (d) Surface lifted index (shaded, scale at left) and precipitablewater anomaly (contoured at 5, 10, 15, and ≥20cm). The letter L indicates the average cyclone center, and WCB is the meanlocation of the warm conveyor belt. Shown is the vertical perspective (globe view from finite distance).
Journal of Geophysical Research: Atmospheres 10.1002/2013JD021160
GARREAUD ET AL. ©2014. American Geophysical Union. All Rights Reserved. 11

potential energy (CAPE) values ofabout 150 J/kg and negative liftedindex (LI) are seen across much ofthe postfrontal sector during theperiod of intense lightningactivity (Figure 10d).
A sounding (from CFSR data) atGolfo de Penas (50°S, 75°W) for thetime of maximum strokeoccurrence further illustrates thethermal structure of the postfrontalair mass (Figure 7c). Near-surfaceair temperature was about 10°C,the freezing level was at ~1300masl, and the �40°C isotherm was at~6500m asl. Saturation wasobserved in the lower tropospherecapped by a layer of dry air above500 hPa. More importantly, an airparcel lifted from the surfacereaches its level of free convectionat only 1000m asl and its level ofneutral buoyancy at 5500m asl, sothere was a very small value ofConvective Inhibition (< 10 J/kg), amodest value of CAPE (156 J/kg)and slightly negative values of theLI (�0.2°C).
5. Climatological Analysis5.1. Large-Scale Composites
A cursory inspection of the weather maps and satellite imagery for several cases of significant lightningactivity in Western Patagonia reveals a synoptic environment similar to that documented in our case study.These conditions are synthesized here using a compositing analysis of selected meteorological fields for the90days on record with more than 50 strokes in the Western Patagonia box. The lightning distribution for thissubsample of days follows the full-sample spatial pattern (not shown).
The composite maps of sea level pressure (SLP) and 925 hPa air temperature (Figure 11a) show a low-pressurecenter west of the Drake Passage and the incursion of cold air over the southeast Pacific extending along theChilean coast up to ~40°S. The location of the composite low-pressure area (very close to the cyclone positionin the case study) reflects that nearly all the lightning-producing storms in Western Patagonia wereassociated with a deep low over the southeast Pacific (also note the cyclone’s central position for selectedcases). Likewise, a cold front making landfall to the north of Western Patagonia was a highly common featureof these storms, evidenced in our composite analysis by a baroclinic zone in the low-level air temperature(Figure 11a) and a tongue of moist air ahead of the front in the map of precipitable water anomalies(Figure 11d). Thus, significant lightning activity in Western Patagonia most often occurs as the postfrontal airmass has reached this region. Figure 11b shows the composite anomalies of SLP and the 300 hPageopotential height. Negative anomalies are collocated just west of the tip of the continent, indicative of thebarotropic structure, mature stage of the midlatitude cyclone that drifted slowly eastward.
Negative temperature anomalies in the middle and lower troposphere (Figure 11c) are also located offWestern Patagonia. Along the coast of southern Chile the composite 500 hPa cooling is much larger (~4°C)than the cooling at low levels (<1°C), leading to the development of a broad area of convective instability inthe postfrontal air mass that encompasses Patagonia and the adjacent Pacific. To illustrate such unstable
Figure 12. Joint distribution of the daily mean surface lifted index (LI, horizontalaxis) and 850hPa zonal wind (U850, vertical axis) over theWestern Patagonia box(see Figure 3) considering all days from January 2005 to December 2012. Theisolines of frequency are drawn every 2%, and the full-sample average is indi-cated by a black cross. The gray circles are the daily values of LI-U850 for thosedays with more than 10mm in the Western Patagonia box; the subsample meanis indicated by a green cross. The color circles are the daily values of LI-U850 forthose days with more than oneWWLLN strokes over Western Patagonia box; thesubsample mean is indicated by a red cross. The color of these circles indicatesthe number of strokes: warm colors indicate more strokes and cold colors indi-cate less strokes.
Journal of Geophysical Research: Atmospheres 10.1002/2013JD021160
GARREAUD ET AL. ©2014. American Geophysical Union. All Rights Reserved. 12

conditions Figure 11d shows thecomposite map of the surface liftedindex (LI) with near-zero values overWestern Patagonia and offshore. Wechoose the lifted index given itsnormal distribution, more suitablefor the compositing analysis, butother stability indices show a similarpattern (e.g., CAPE; not shown). It iswithin this weakly unstable regionwhere most lightning occur.
5.2. Local Control
Our case study and compositinganalysis suggest that both weakinstability in the lower troposphere(e.g., nonzero CAPE near-zero liftedindex) and strong low-level westerlyflow characterize the localenvironment during lightning stormsin Western Patagonia. To generalizethese results, let us examine the jointdistribution of the daily lifted index(LI) and the 850hPa zonal windspeed (U850) averaged over theWestern Patagonia box (Figure 12).When considering the full sample(every day from 2005 to 2012) thejoint distribution (shown by isolinesof frequency) is approximatelybinormal, although positivelyskewed for both LI and U850, withcentral values (mean± standarddeviation) of 5.0± 3.2°C and11.2± 3.2m s�1, respectively.
The subsample of days with morethan 10mm of precipitation (rainydays) tends to occur with strongerthan average zonal flow(16.2 ± 2m s�1) consistent with[Garreaud et al., 2013, their Figure 5]that documented a strongcorrelation between rainfall andzonal wind aloft, upstream of theextratropical Andes. In contrast,rainy days occur under the full rangeof LI, and the subsample average(3.7 ± 2.6°C) is just slightly lowerthan the full-sample average.
The subsample of lightning days(more than one lightning inWestern Patagonia) is concentratedin the upper left quadrant of the
Figure 14. NCEP optimally interpolated annual mean sea surface temperatureover the eastern Pacific. Note how the zonal symmetry over open ocean breaksdown along the Chilean coast, especially off Western Patagonia. Verticalperspective (globe view from finite distance).
Figure 13. Annual mean frequency of the surface lifted index (LI) of less than0.5°C over southern South America. Note the high frequency (over 30% of thetime) with weakly unstable convective conditions off Western Patagonia.Data from CFSR (2005–2012). Equirectangular projection is shown.
Journal of Geophysical Research: Atmospheres 10.1002/2013JD021160
GARREAUD ET AL. ©2014. American Geophysical Union. All Rights Reserved. 13

LI-U850 frequency distribution: lightning days tend to occur under stronger than average low-levelwesterlies (16.5 ± 2m s�1) and much lower than average LI (0.7 ± 1.3°C). The stability control on lightningactivity is tighter than the zonal flow control: about 15% of the lightning days occur with rather weak flow(less than 13m/s), but almost no lightning days occur when LI is larger than 5°C. There is also a positive,albeit weak, logarithmic relationship between stability and the number of lightning at daily time scalesover Western Patagonia, consistent with the findings by Pessi and Businger [2009a] over the North Pacific.
The control that stability exerts on lightning activity also occurs spatially. Figure 13 displays the frequencyof days with LI ≤ 0.5°C (roughly equivalent to CAPE≥50 J/kg) over southern South America, a modest valuefor convection but low enough to trigger lightning over Western Patagonia. The largest frequencies (about30%) in the extratropics are found along the coast of southern Chile, decaying gradually offshore andsharply inland, matching perfectly with the region of high lightning activity in Western Patagonia (cf.Figures 3 and 13). Recall that unstable conditions in this region are associated with a transient cooling thatincreases upward under the synoptic conditions identified before. The coastal area of Western Patagoniaalso exhibits a local maximum in precipitation (as detected by microwave satellite estimates) [Falvey andGarreaud, 2007] and convective rainfall rates from CFSR (not shown).
The coastal confinement of the area of frequent near-zero LI observed in Figure 13 is rather puzzling. Theoccurrence of intense cold anomalies at midlevels should be as frequent in the coastal area as offshore, sothat near-surface conditions must play a key role. As noted before, cold SSTs are found along the west coastof South America. Nevertheless, the west wind drift—a surface current across much of the Pacific—interceptsthe continent at about 48°S leading to a poleward current and coastal downwelling off Western Patagonia[Neshyba and Fonseca, 1980]. Consequently, SSTs in the near-shore region are 3–4°C warmer than offshore(Figure 14), producing the most favorable conditions for instability buildup than anywhere else in thesoutheast Pacific.
6. Conceptual Model and Concluding Remarks
Eight years of global stroke detection from the WWLLN has allowed to identify a maximum of lightning activityover Western Patagonia (42°–52°S), a cool, hyper-humid region located just downstream of the South Pacificstorm track and bounded to the east by the austral Andes. Cloud electrification is not expected in this regiongiven the predominance of stable, deep stratiform precipitation there, but days with at least one stroke occurup to a third of the time along the coast, being slightly more frequent during late summer and fall.
Lightning-producing storms last 1–3days and develop under a recurrent synoptic environment identified in acase study and generalized by a compositing analysis of 90 events. A key ingredient is a deep surface cyclone overthe South Pacific, Drake Passage, often below a closed upper level low pressure, indicative of the mature stage ofthe disturbance. By the day of significant lightning activity the attending cold front has reached the coast ofsouthern Chile at about 40°S so thatWestern Patagonia is immersed in the postfrontal sector of the system. Duringthese subantarctic air incursions, the cooling above 700hPa occurs before and is more pronounced than thecooling at lower levels, leading to a weakly unstable environment off the coast of southern Chile (CAPE~100 J/kg;LI ~0°C). Most of the strokes are located right along the coast, and some strokes occur offshore where shallow,open cell clouds are readily identifiable and convective rainfall dominates. In contrast, few (or no) strokes areobserved along the cold front or the austral Andes where the precipitation maximizes.
We interpret this conspicuous spatial structure as follows. Under the weakly unstable conditions that prevailin the postfrontal air mass, large-scale ascent near the cyclone’s center may lift near-surface air parcels overopen ocean fostering shallow convection and disperse lightning activity. Near the coast a second ingredientcomes into play. The moderate to strong westerly flow impinges over the coastal mountains that rise sharplyto 300–700m asl, forcing a rapid uplift of the marine air that trigger convection and produces significantlightning activity. Forced accent continues farther inland but the cold, ice-covered surface precludes thedevelopment of convection. Clearly, in situ measurements (e.g., coastal radiosondes) are much necessary tovalidate this conceptual model. Furthermore, the numerical values of lightning density in this region aredependent on theWWLLN detection efficiency, which is variable and unknown over this region due to lack ofindependent measurements. By the contrary, the spatial pattern of the lightning density as well as thenumber of days with lightning appears more robust.
Journal of Geophysical Research: Atmospheres 10.1002/2013JD021160
GARREAUD ET AL. ©2014. American Geophysical Union. All Rights Reserved. 14

In addition to the prominent coastal topography, the confinement of significant lightning activity off WesternPatagonia seems also associated with the surface boundary conditions over the adjacent Pacific. Althoughcold SST (<10°C) prevails year round, these offshore waters are up to 3°C warmer than those over open oceanproducing the most favorable conditions for instability buildup than anywhere else in the southeast Pacificwhen an midlevel cold anomaly passes over. The relatively warm coastal waters are due to the coastaldownwelling and poleward flow generated by the West Wind Drift. Therefore, seasonal, interannual, andlonger time fluctuations in the intensity and position of this current may modulate changes in the lightningactivity in Western Patagonia.
ReferencesAbarca, S. F., K. L. Corbosiero, and T. J. Galarneau Jr. (2010), An evaluation of the Worldwide Lightning Location Network (WWLLN) using the
National Lightning Detection Network (NLDN) as ground truth, J. Geophys. Res., 115, D18206, doi:10.1029/2009JD013411.Ávila, E. E., R. A. Lighezzolo, N. E. Castellano, R. G. Pereyra, and R. E. Bürgesser (2013), Laboratory measurements of charge separation in low
liquid water content conditions and low impact velocity, J. Geophys. Res. Atmos., 118, 6680–6687, doi:10.1002/jgrd.50555.Browning, K. A. (1986), Conceptual models of precipitation systems, Weather Forecasting, 1, 23–41.Bürgesser, R. E., M. G. Nicora, and E. E. Ávila (2013), Spatial and time distribution of the flash rate over tropical Africa, J. Atmos. Sol. Terr. Phys.,
94, 41–48.Christian, H. J., R. J. Blakeslee, D. J. Boccippio, W. L. Boeck, D. E. Buechler, K. T. Driscoll, S. J. Goodman, J. M. Hall, W. J. Koshak, and D. M. Mach
(2003), Global frequency and distribution of lightning as observed from space by the Optical Transient Detector, J. Geophys. Res., 108(D1),4005, doi:10.1029/2002JD002347.
Demetriades, N. W., and R. L. Holle (2005), Lightning produced by cold season extratropical cyclones: Observations related to nowcasting stormdevelopment, intensity and precipitation amounts, Conference on Meteorological Applications of Lightning Data; AMS; Tucson, Ariz.
Falvey, M., and R. Garreaud (2007), Wintertime precipitation episodes in central Chile: Associated meteorological conditions and orographicinfluences, J. Hydrometeorol., 8, 171–193.
Garreaud, R., P. Lopez, M. Minvielle, and M. Rojas (2013), Large-scale control on the Patagonian climate, J. Clim., 26, 215–230.Holz, A., and T. T. Veblen (2011a), The amplifying effects of humans on fire regimes in temperate rainforests in Western Patagonia,
Palaeogeogr. Palaeoclimatol. Palaeoecol., 311, 82–92.Holz, A., and T. T. Veblen (2011b), Variability in the southern annular mode determines wildfire activity in Patagonia, Geophys. Res. Lett., 38,
L14710, doi:10.1029/2011GL047674.Hoskins, B. J., and K. I. Hodges (2002), New perspectives on the Northern Hemisphere winter storm tracks, J. Atmos. Sci., 59, 1041–1061.Hoskins, B. J., and K. I. Hodges (2005), A new perspective on Southern Hemisphere storm tracks, J. Clim., 18, 4108–4129.Houze, R. A., Jr. (1993), Cloud Dynamics, vol. 53, 523 pp., Elsevier, San Diego, Calif.Hutchins, M., R. Holzworth, J. Brundell, and C. Rodger (2012), Relative detection efficiency of the world wide lightning location network, Radio
Sci., 47, RS6005, doi:10.1029/2012RS005049.Lay, E. H., R. H. Holzworth, C. J. Rodger, J. N. Thomas, O. Pinto Jr., and R. L. Dowden (2004), WWLLN global lightning detection system: Regional
validation study in Brazil, Geophys. Res. Lett., 31, L03102, doi:10.1029/2003GL018882.Mäkelä, A., P. Rossi, and D. M. Schultz (2011), The daily cloud-to-ground lightning flash density in the contiguous United States and Finland,
Mon. Weather Rev., 139, 1323–1337.Mäkelä, A., E. Saltikoff, J. Julkunen, I. Juga, E. Gregow, and S. Niemelä (2013), Cold-season thunderstorms in Finland and their effect on
aviation safety, Bull. Am. Meteorol. Soc., 94, 847–858.Market, P. S., C. E. Halcomb, and R. L. Ebert (2002), A climatology of thundersnow events over the contiguous United States,Weather Forecasting,
17, 1290–1295.Markgraf, V., and L. Anderson (1994), Fire history of Patagonia: Climate versus human cause, Rev. Inst. Geol., 15, 35–47.Neshyba, S., and T. R. Fonseca (1980), Evidence for counterflow to the west wind drift off South America, J. Geophys. Res., 85(C9), 4888–4892.Pessi, A. T., and S. Businger (2009a), Relationships among lightning, precipitation, and hydrometeor characteristics over the North Pacific
Ocean, J. Appl. Meteorol. Climatol., 48, 833–848.Pessi, A. T., and S. Businger (2009b), The impact of lightning data assimilation on a winter storm simulation over the North Pacific Ocean,
Mon. Weather Rev., 137, 3177–3195.Pessi, A. T., S. Businger, K. Cummins, N. Demetriades, M. Murphy, and B. Pifer (2009), Development of a long-range lightning detection
network for the Pacific: Construction, calibration, and performance, J. Atmos. Oceanic Technol., 26, 145–166.Rudlosky, S. D., and D. T. Shea (2013), Evaluating WWLLN performance relative to TRMM/LIS, Geophys. Res. Lett., 40, 2344–2348, doi:10.1002/
grl.50428.Saha, S., S. Moorthi, H.-L. Pan, X. Wu, J. Wang, S. Nadiga, P. Tripp, R. Kistler, J. Woollen, and D. Behringer (2010), The NCEP climate forecast
system reanalysis, Bull. Am. Meteorol. Soc., 91, 1015–1057.Saha, S., S. Moorthi, X. Wu, J. Wang, S. Nadiga, P. Tripp, H.-L. Pan, D. Behringer, Y.-T. Hou, and H.-Y. Chuang (2014), The NCEP climate forecast
system version 2, J. Clim., 27, 2185–2208, doi:10.1175/JCLI-D-12-00823.1.Schultz, D. M. (1999), Lake-effect snowstorms in northern Utah and Western New York with and without lightning, Weather Forecasting, 14,
1023–1031.Smith, R., and J. Evans (2007), Orographic precipitation and water vapor fractionation over the southern Andes, J. Hydrometeorol., 8, 3–19.Takahashi, T., T. Tajiri, and Y. Sonoi (1999), Charges on graupel and snow crystals and the electrical structure of winter thunderstorms,
J. Atmos. Sci., 56, 1561–1578.Virts, K. S., J. M. Wallace, M. L. Hutchins, and R. H. Holzworth (2013), Highlights of a new ground-based, hourly global lightning climatology,
Bull. Am. Meteorol. Soc., 94, 1381–1391, doi:10.1175/BAMS-D-12-00082.1.Whitlock, C., P. I. Moreno, and P. Bartlein (2007), Climatic controls of Holocene fire patterns in southern South America, Quat. Res., 68, 28–36.World Meteorological Organization (1953), World distribution of thunderstorm days. Part I: Tables. Geneve, 213 pp.Xie, P., and P. A. Arkin (1997), Global precipitation: A 17-year monthly analysis based on gauge observations, satellite estimates, and
numerical model outputs, Bull. Am. Meteorol. Soc., 78, 2539–2558.
Journal of Geophysical Research: Atmospheres 10.1002/2013JD021160
GARREAUD ET AL. ©2014. American Geophysical Union. All Rights Reserved. 15
AcknowledgmentsThe authors wish to thank the WorldWide Lightning Location Network (http://wwlln.net), collaboration among over 60universities and institutions, for provid-ing the lightning location data used inthis paper. Themanuscript was improvedconsiderably through the comments andsuggestions by three anonymousreviewers. R.G. was supported byFONDECYT-Chile (grant 1110169) andFONDAP/CONICYT Chile (grant15110009-CR2). This work was supportedby SECYT-UNC, CONICET and FONCYT,and PIDDEF 14/12, MINDEF Argentina.