limitations and accuracies of time and frequency …€¦ · limitations and accuracies of time and...
TRANSCRIPT
Accuracies of Time & Freq Domain PHY Meas 1
Limitations And Accuracies Of Time And Frequency Domain Analysis Of Physical Layer
Devices
Page 2
Outline
• Short Overview• Fundamental Differences between TDR & VNA Instruments• Calibration & Normalization• Measurement Accuracies• Measurement Comparisons

Accuracies of Time & Freq Domain PHY Meas 2
Page 3
TDR and VNA
86100 DCA and 54754A TDR Modules E8364B PNA with 2-port Testset
N1930B Physical Layer Test Software
Page 4
TDR Set-up (Configuration Showing 1=>3, 2=>4)
Channel 1
Channel 2
Channel 3
Channel 4
Thru Adapters
BTL Board

Accuracies of Time & Freq Domain PHY Meas 3
Page 5
Appreciating the Complexity of it all
InstrumentArchitectures
ReciprocityRepeatability
Calibration
Normalization
Risetime
DynamicRange
Noise Floor
RcvrBW
SourceError
Source Drift SourceStability
Voltage &Temp Drift
SOLT
Time Base
IFBW
Averaging
Numberof Points
Signal-to-NoiseRatio
FilterRoll-off
Time Step
DeviceLength
Device Complexity
Accuracy
FrequencyRange
Fundamental Differences between
TDR & VNA Instruments
• Measurement Domains
• Sources
• Receivers
• Architectures and Sources of Errors
• Calibration and Measurement
• Summary of how TDR and VNA Measurements Differ

Accuracies of Time & Freq Domain PHY Meas 4
Page 7
Time and Frequency DomainsAll frequencies make up each time point
Device Under Test
tm tm= phase offsetVNA – Frequency Domain
Device Under Test
t0 t1=delayTDR – Time Domain
Δφ=2πf*time delay Group delay = dφ/df = time delayPhase
Group DelayFrequency
deg nsec
Page 8
Jitter in Time Domain is Phase Error in the Frequency Domainphase(radians) =2*pi*f*delay

Accuracies of Time & Freq Domain PHY Meas 5
Page 9
TDR and VNA Measurement Techniques
DUTIncident wave
Reflected wave
Transmitted wave
S11
S21
Incident wave
Reflected wave
Transmitted wave
TDR
TDTt
t
DUT
CH1 S11
log MAG 10 dB/ REF 0 dB
START 0.099 751 243 GHz STOP 20.049 999 843 GHz
C2
MARKER 1
1.452378096 GHz
1
1 _:-2.145 dB
1.452 378 096 GHz
CH 2 S21
log MA G RE F 0 d B10 dB /
S TAR T 0. 099 75 1 243 GH z STO P 2 0. 049 99 9 8 43 GH z
M AR KE R 1
1.017462619 GHz
1
1 _: -3 .08 9 dB
1 .01 7 462 61 9 GHz
Page 10
TDR Block Diagram
DUT
Clock Trigger
Front Panel
Step Generators
Device Reference Planes
ADCChannel 1
Samplers& ADCs
ADCChannel 2
2 Sources (Step Generators), 2 Samplers, and 2 ADCsTrigger TriggerTrigger
TDR TDT

Accuracies of Time & Freq Domain PHY Meas 6
Page 11
Network Analyzer Block Diagram
Reflected SignalS11 = b0/a0
Transmitted SignalS21 = b3/a0
Page 12
TDR and VNA Sources
TDR
VNA
Power decreases across frequency band – causes loss of accuracy at higher
frequencies
Power constant across entire frequency band –no loss in accuracy at
higher frequencies

Accuracies of Time & Freq Domain PHY Meas 7
Page 13
TDR and VNA Receiver Bandwidths
Agilent TDR has 4 Wide-Band Receivers
with 2 choices for cut-off Frequency
VNA has 4 Narrow Band Receivers
(definable by setting IF BW)that are swept across the
frequency range of interest
Loss of gain inthe high region
with TDRNo Loss of gain
with VNA
Noise Floor
IF Bandwidth
Page 14
Sources of Error in TDR Instruments- All significantly reduced with Normalization• Oscilloscope
• Finite bandwidth restricts it to a limited measurable risetime• Small errors due to trigger coupling into the channels & channel
crosstalk• Clock stability causes trigger jitter in the measurement
• Step Generator• Shape of Step stimulus (risetime of the edge, aberrations on the
step, overshoot, non-flatness)• Cables & Connectors
• Introduce loss and reflections into the measurement system
System_Risetime = sqrt[ScopeRisetime^2+StepRisetime^2+TestSetupRisetime^2]

Accuracies of Time & Freq Domain PHY Meas 8
Page 15
Sources of Error in VNA Instruments (2 Port)• Random Errors: Instrument Noise, Switch Repeatability, and
connector repeatability• Systematic Sources of Error
• Directivity & Crosstalk errors relating to signal leakage• Source & Load Impedance mismatches relating to reflections• Frequency Response errors caused by reflection & transmission
tracking issues within receivers
DUT
a0 b0
Directivity
Crosstalkb3
SourceMatch
LoadMatchReflection Tracking (b0 / a0)
Transmission Tracking (b3/ a0)
6 Forward & 6 Reverse Error Terms12 Terms total for 2 Port Device &48 Terms for a 4 port Device
Page 16
Loss of Source Power Affects Accuracy of TDR as Compared to the VNA
VNATDR Norm@20pSError: VNA/TDR
• The higher the frequency band the less accurate the TDR measurement
• Measured with normalization and additional correction
~1 dB diff ~2 dB diff ~4-6 dB diff

Accuracies of Time & Freq Domain PHY Meas 9
Page 17
VNA & TDR Rough Comparison of Dynamic Range
VNADynamicRange
Approx.TDR
DynamicRange
• Dynamic Range = MaxSignal-Noise Floor
• VNA with wider Dynamic Range allows measuring signals that are 40-80dB down
TDR Noise Floor
VNA Noise Floor
Page 18
VNA & TDR Attributes at a Glance
10MHz-20GHz55-110dB90dB-5 dBm0.2-1%Depends on calibration
VNA
0 -12.4GHzor 0 -18GHz
30-40dB45dB200mV0.5-5%Depends on calibration & freq range
TDR
Receiver Bandwidth
Noise FloorDynamic Range
Source Power
Accuracy
Disclaimer: Values appearing in this table are estimates and do not inferor imply any guarantee by Agilent Technologies as to actual results

Accuracies of Time & Freq Domain PHY Meas 10
Calibration & Normalization
• Overview of TDR & VNA Calibration• Calibration File & Data Storage Differences• Levels of Calibration with TDR• TDR Normalization vs. VNA Calibration• Risetime Effects on Accuracy • The Normalization Process• Advantages of Normalization
Page 20
MostAccurate
Easiest
S-Parameter De-embedding
Port ExtensionTime Domain Gating
NormalizationReference Plane Calibration
Thru-Reflect-Line (TRL)Line-Reflect-Match (LRM)
Short-Open-Load-Thru (SOLT)
Fixture Error Correction Techniques
= Pre-measurement error correction= Post-measurement error correction
Accuracies of Time & Freq Domain PHY Meas 11
Page 21
Levels of Calibration with TDR• NONE: No calibration is performed
• Hardware Service Calibration assumed
• MIN: Module Calibration & RPC (Reference Plane Calibration)• Module Calibration calibrates the gains and offsets of the data
acquisition channel.• RPC removes the delay of the cables and de-skews edges for the Diff &
Common Mode launches.
• MAX: Normalization – (Agilent only)• Normalizes to standards placed at the Reference plane. Takes out delay
and the loss associated with the cables, the reflections due to mismatch of the source, and improves the pulse edge and flatness. Allows for maximum accuracy and is heavily risetime dependent.
Page 22
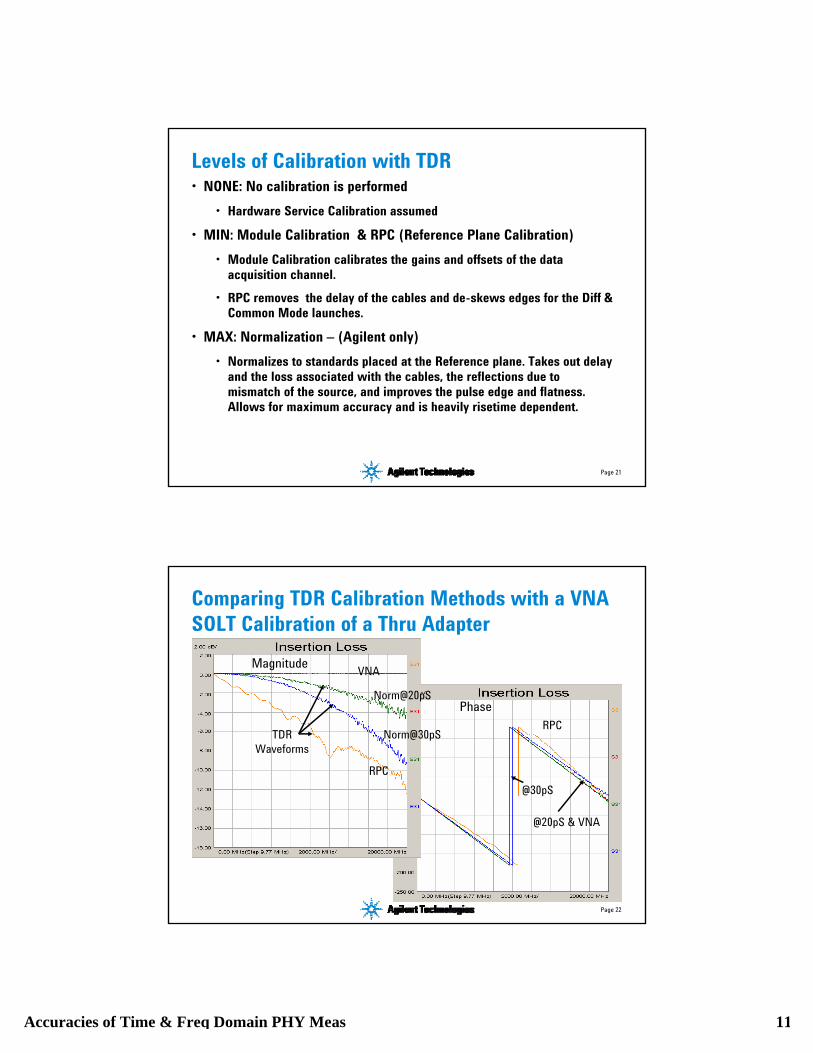
Comparing TDR Calibration Methods with a VNA SOLT Calibration of a Thru Adapter
VNA
Norm@20pS
Norm@30pS
RPC
RPC
@30pS
@20pS & VNA
Magnitude
Phase
TDRWaveforms
Accuracies of Time & Freq Domain PHY Meas 12
Page 23
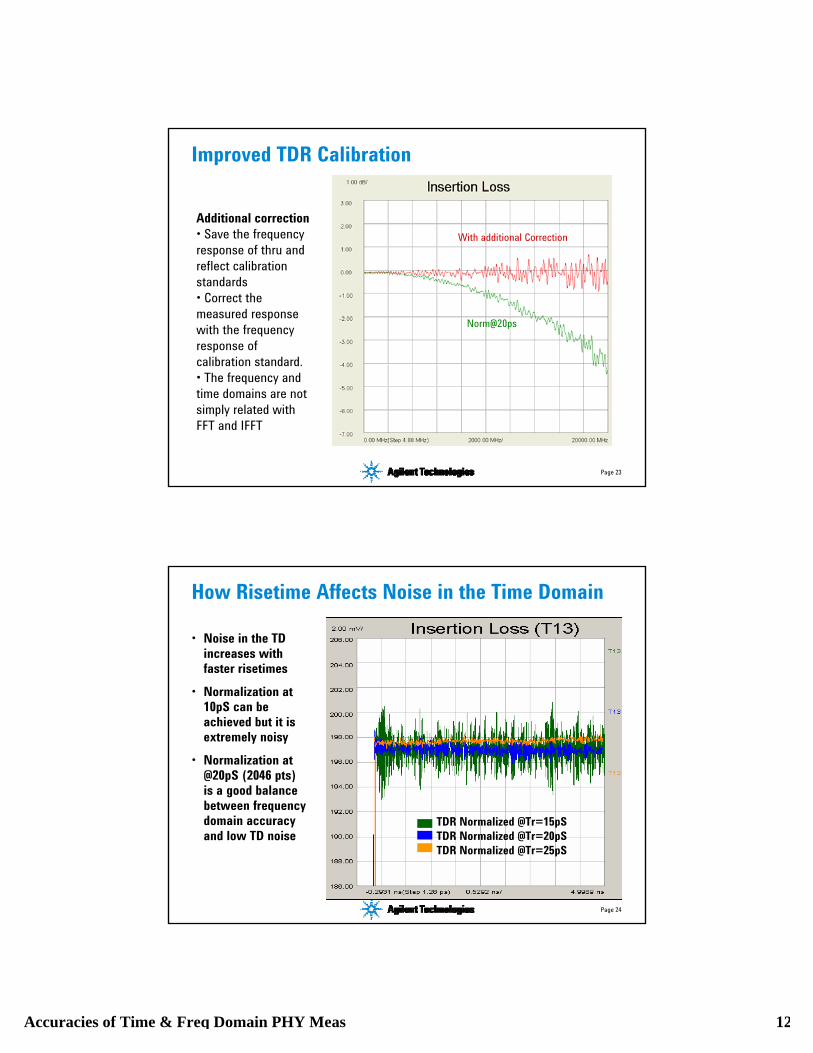
Improved TDR Calibration
Norm@20ps
With additional CorrectionAdditional correction• Save the frequency response of thru and reflect calibration standards• Correct the measured response with the frequency response of calibration standard.• The frequency and time domains are not simply related with FFT and IFFT
Page 24
How Risetime Affects Noise in the Time Domain
• Noise in the TD increases with faster risetimes
• Normalization at 10pS can be achieved but it is extremely noisy
• Normalization at @20pS (2046 pts) is a good balance between frequency domain accuracy and low TD noise
TDR Normalized @Tr=15pSTDR Normalized @Tr=20pSTDR Normalized @Tr=25pS
Accuracies of Time & Freq Domain PHY Meas 13
Page 25
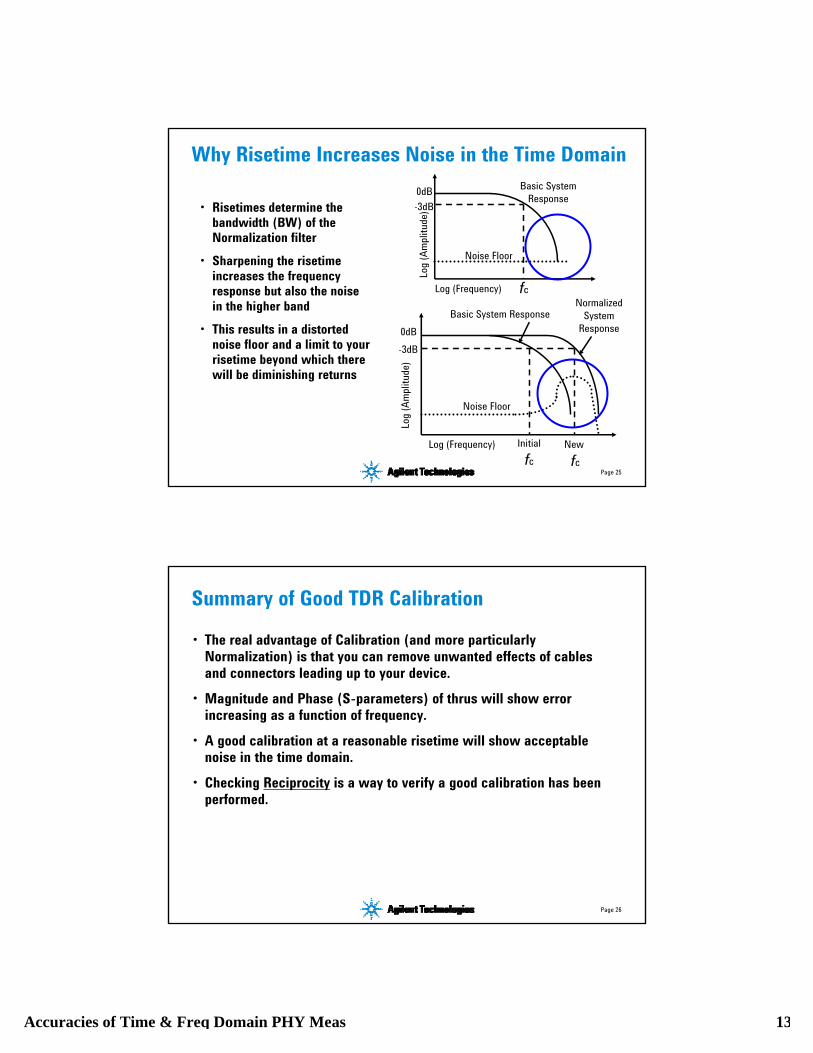
Why Risetime Increases Noise in the Time Domain
• Risetimes determine the bandwidth (BW) of the Normalization filter
• Sharpening the risetime increases the frequency response but also the noise in the higher band
• This results in a distorted noise floor and a limit to your risetime beyond which there will be diminishing returns
fc
0dB-3dB
Log
(Am
plitu
de)
Log (Frequency)
Basic SystemResponse
Noise Floor
0dB-3dB
Log
(Am
plitu
de)
Log (Frequency) Initialfc
Noise Floor
New fc
Basic System ResponseNormalized
SystemResponse
Page 26
Summary of Good TDR Calibration
• The real advantage of Calibration (and more particularly Normalization) is that you can remove unwanted effects of cablesand connectors leading up to your device.
• Magnitude and Phase (S-parameters) of thrus will show error increasing as a function of frequency.
• A good calibration at a reasonable risetime will show acceptablenoise in the time domain.
• Checking Reciprocity is a way to verify a good calibration has been performed.

Accuracies of Time & Freq Domain PHY Meas 14
Measurement Accuracies: Reciprocity, Repeatability, Drift
•Using Reciprocity to Check Measurement Credibility •Reciprocity with a TDR & VNA•Repeatability with a TDR & VNA•Drift with a TDR & VNA •Summary of Calibration & Measurement Accuracy
Page 28
Using Reciprocity to Assure Good Calibration• Reciprocity is the constraint that for passive devices S12=S21.• In VNA measurements S12 virtually overlays S21 when a Thru path is
measured. For TDR measurements the alignment is not as good. • Be aware when exporting data that some tools may require a certain
level of reciprocity (eg. HSPICE).
to Port 1
to Port 2
to Port 3
to Port 4S13(Mag) = S31(Mag); S13(Phase) = S31(Phase)
S24(Mag) = S42(Mag); S24(Phase) = S42(Phase)
Reciprocity on a Thru Adapter SE Measurement

Accuracies of Time & Freq Domain PHY Meas 15
Page 29
TDR Reciprocity of BTL Board (Normalized @20pS)
SDD12/SDD21
TDR Reciprocity:+/- 25 degrees Phase+/- 4 dB Magnitude
SDD12/SDD21
Page 30
VNA Reciprocity of BTL board
SDD12/SDD21
VNA Reciprocity:+/- 2 deg Phase
+/- 0.25 dB Magnitude
SDD12/SDD21

Accuracies of Time & Freq Domain PHY Meas 16
Page 31
Repeatability with Normalized TDR measurements
2 measurementsNormalized at 20pS
(with new calibration) 5 days apart
Excellent Good
Cumulative Error
Magnitude Repeatability
Phase Repeatability
Difference
Difference
TDR Repeatability:+/- 60 degrees Phase+/- 4 dB Magnitude
Page 32
Repeatability with VNA with SOLT cal
2 VNA measurementsalso 5 days apart
Magnitude Repeatability
Phase Repeatability
Excellent across entire range
Difference
Excellent across entire range
VNA Repeatability:+/- 2 deg Phase
+/- 0.5 dB Magnitude

Accuracies of Time & Freq Domain PHY Meas 17
Page 33
TDR Source Drift Over the Course of a Day
12pm
13pS of drift corresponds to95degs phase difference(drift is always bounded)
Thru adapterover a 12 hr period at
4 hr intervals withthe same calibration
8am
8am
12pm
4pm
8pm
8pm
4pm
12
3
Sequence
Range of Drift
Page 34
VNA & TDR Attributes at a Glance
+/- 0.5dB for Magnitude+/- 2 degrees
3-6dB dependent on calibration+/- 60 degrees
Repeatability
Magnitude within noise of instrument< 5 degrees
Magnitude within noise of instrument210deg @ 20GHz
Drift
0.25dB Magnitude+/- 2 degrees
VNA
2-4dB dependent on calibration+/- 25 degrees
TDR*
Reciprocity
Disclaimer: Values appearing in this table are estimates and do not inferor imply any guarantee by Agilent Technologies as to actual results.
* TDR values may seem larger than expected. It should be noted that these values are at the high end of the frequency range
Accuracies of Time & Freq Domain PHY Meas 18
Measurement Comparisons
• Single Ended Comparisons of TDR & VNA Measurements
• Balanced (Differential) Comparisons of TDR & VNA Measurements
Page 36
25 Ohm Mismatch Airline (3.5 mm connectors)
Device Characteristics:
• Device that is traceable to NIST
• Insertion Loss – Low loss with known variations
• Return Loss – Known resonance pattern over wide dynamic range
Accuracies of Time & Freq Domain PHY Meas 19
Page 37
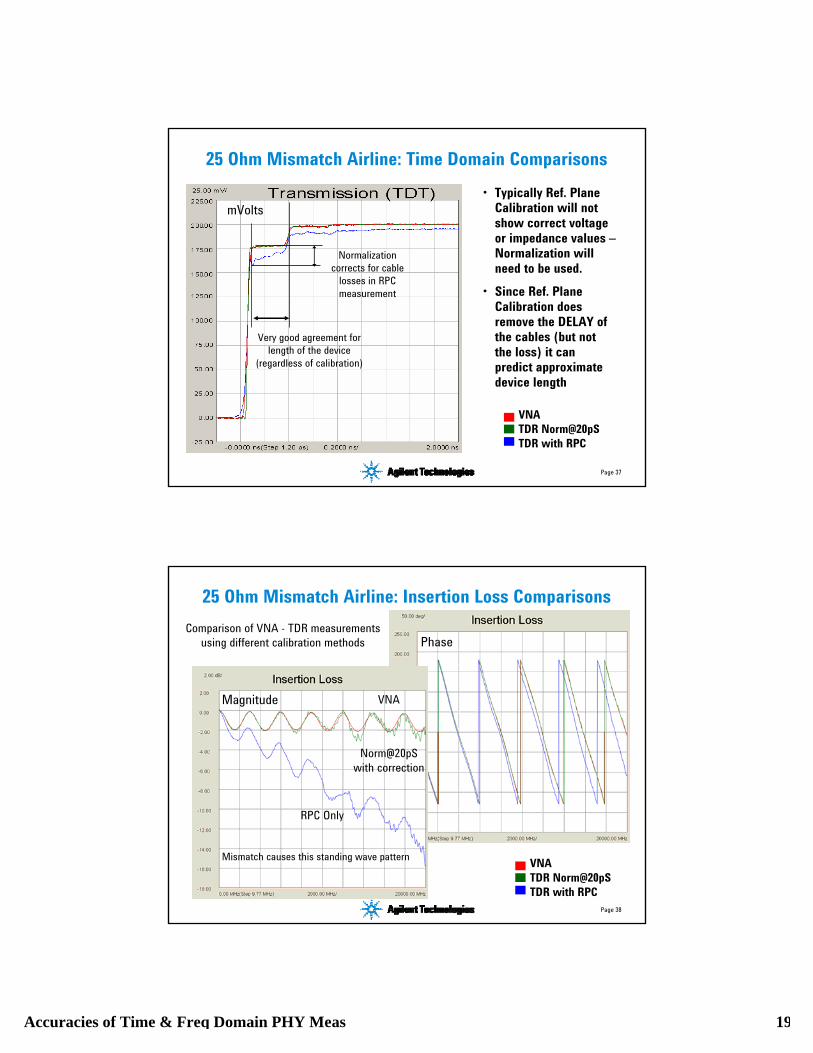
25 Ohm Mismatch Airline: Time Domain Comparisons
VNATDR Norm@20pSTDR with RPC
mVolts
Very good agreement forlength of the device
(regardless of calibration)
Normalization corrects for cable
losses in RPC measurement
• Typically Ref. Plane Calibration will not show correct voltage or impedance values –Normalization will need to be used.
• Since Ref. Plane Calibration does remove the DELAY of the cables (but not the loss) it can predict approximate device length
Page 38
25 Ohm Mismatch Airline: Insertion Loss Comparisons
VNATDR Norm@20pSTDR with RPC
Magnitude
Phase
VNA
Norm@20pSwith correction
RPC Only
Mismatch causes this standing wave pattern
Comparison of VNA - TDR measurementsusing different calibration methods
Accuracies of Time & Freq Domain PHY Meas 20
Page 39
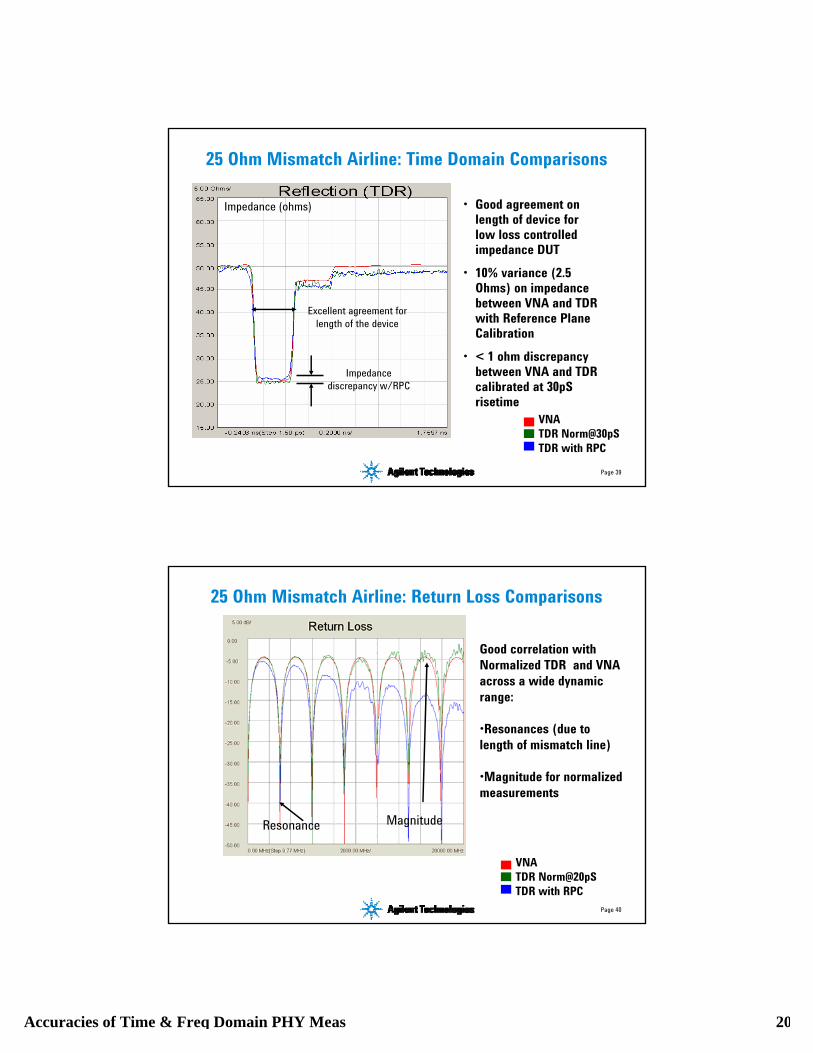
25 Ohm Mismatch Airline: Time Domain Comparisons
VNATDR Norm@30pSTDR with RPC
Excellent agreement forlength of the device
• Good agreement on length of device for low loss controlled impedance DUT
• 10% variance (2.5 Ohms) on impedance between VNA and TDR with Reference Plane Calibration
• < 1 ohm discrepancy between VNA and TDR calibrated at 30pS risetime
Impedance (ohms)
Impedance discrepancy w/RPC
Page 40
25 Ohm Mismatch Airline: Return Loss Comparisons
VNATDR Norm@20pSTDR with RPC
Magnitude
Good correlation with Normalized TDR and VNA across a wide dynamic range:
•Resonances (due to length of mismatch line)
•Magnitude for normalized measurements
Resonance

Accuracies of Time & Freq Domain PHY Meas 21
Page 41
Single Ended Summary
• With Normalization and correction the TDR can be an effective strategy for measuring impedance and obtaining frequency domain characteristics of moderate loss devices at frequencies below 10GHz.
• Reference Plane Calibration without correction should only be used for estimating the length of a device and getting and idea of the response of the device.
Page 42
BTL Example: Differential Return Loss Details
~ 1 dB diff2-6 dB diff
~ 2 dB diff
VNANorm@20pS correctedDifference
• First 3 divisions -look very good• Mid 4 divisions -errors increase• Top 3 divisions -getting worse

Accuracies of Time & Freq Domain PHY Meas 22
Page 43
BTL Example: Differential Insertion Loss Comparisons
VNA
Norm Tr=20pS
Norm Tr=30pS
RPC weakmidband
Start at 10GHz
Highband is poor for TDR
Without additional correction
Page 44
BTL Example: Differential Insertion Loss Details
~1 dB diff ~2 dB diff ~4-6 dB diff
VNANorm@20pS correctedDifference
• First 3 divisions -look very good• Mid 4 divisions -errors increase• Top 3 divisions -getting worse

Accuracies of Time & Freq Domain PHY Meas 23
Page 45
Overall Summary• The simplicity of the TDR is useful for lower data rates and for
obtaining an intuitive understanding of signal integrity effects• The Vector Network Analyzer provides more accuracy and
repeatability than the Time Domain Reflectometer• TDR normalization provides data closer to a VNA than that derived
from a TDR utilizing only RPC calibration• Frequency domain data derived from TDR data is less accurate at
higher frequencies• This inaccuracy leads to error that can be interpreted as pessimistic
insertion loss data and optimistic return loss data for frequencies greater then 10-12 GHz.
• The accuracy provided by VNA data will be required for data rates above 6.25 GB
Page 46
Resources Websites
•www.agilent.com/find/plts•www.agilent.com/find/eesof-eda•www.agilent.com/find/si•www.agilent.com/find/sigint
Software•Physical Layer Test System (PLTS)•Advanced Design Software (ADS)
Hardware •N5230-245 Vector Network Analyzer•86100C Time Domain Reflectometer
PLTS Studio - Analysis Only Software • N1930B-1NP networked license• N1930B-1FP fixed license• N1930B-1TP USB key license
Physical Layer Test System (PLTS) Configurations