limitations in the use of achievement tests as measures of...
TRANSCRIPT
Running head: Limitations in the Use of Tests
Limitations in the Use of Achievement Tests as Measures of Educators’ Productivity
Daniel Koretz RAND Education
Center for Research on Evaluation, Standards, and Student Testing
Earlier version presented in: Devising Incentives to Promote Human Capital
National Academy of Sciences Conference E. A. Hanushek, J. J. Heckman, and D. Neal (organizers)
Beckman Center Irvine, California
December 18, 1999
This version submitted to The Journal of Human Resources, July 2000
May, 2000

Running head: Limitations in the Use of Tests
1
Scores on tests of students’ academic achievement are currently widely used in
educational accountability systems. This use typically rests on two assumptions: that students’
scores are a reasonable measure of educational output, and therefore that holding teachers
accountable for them will provide appropriate incentives to improve the performance of teachers
and the functioning of schools.
This paper explains why neither of this commonsensical assumptions is warranted and
argues that over-reliance on achievement tests in accountability systems produces perverse
incentives. Better incentives may require that test scores be used along with numerous other
measures, many of which are more subjective than test scores are.
After brief comments on current directions in test-based educational accountability, the
paper describes the logic and construction of educational tests. It discusses three issues that arise
in trying to infer the performance of educators from the performance of their students:
limitations of the measures employed; difficulties inherent in drawing inferences about the
causes of gains in student performance; and perverse incentives created by test-based
accountability systems. It end with suggestions about possible directions for improving the
incentives faced by teachers.
CURRENT CONTEXT
Standardized testing—that is, testing with uniform questions, administration, and
scoring—has a long history in the United States. Such tests date back at least to 1840, and their
use in schools burgeoned in the 1930s and after (Haney, 1981; Koretz, 1992; Resnick, 1982).
Monitoring the performance of educational systems and holding educators accountable were
among the motivations for the early use of standardized tests. Nonetheless, for the first several
decades after World War II, tests were used primarily to assess individual students and, to a
lesser degree, to evaluate curricula, and their use for monitoring and accountability was limited

Running head: Limitations in the Use of Tests
2
(Goslin, 1963; Goslin, Epstein, and Hallock, 1965). The consequences of test scores were minor
for most teachers and students, except in the case of college-admissions tests and tests used to
determine placement in special education.
The uses of achievement tests have changed dramatically over the past three decades,
however. Tests have become increasingly important as a tool—arguably, now the central tool—
for holding educators and systems accountable. Some observers trace this evolution to the
establishment in 1965 of the federal Title I compensatory education program (e.g., Airasian,
1987; Roeber, 1988). The law required that Title I be monitored, and standardized achievement
tests became a primary means of doing so. A further, large step in the evolution of
accountability-oriented testing was the rapid spread of state-mandated minimum-competency
testing during the 1970s (Jaeger, 1982). Minimum competency tests were most often relatively
easy multiple choice tests used as a requirement for high school graduation.
A wave of concern about the nation’s educational system in the 1980s, exemplified by
A Nation at Risk (National Commission on Excellence in Education, 1983), gave another boost
to the use of tests as an accountability tool in the 1980s. The growing use of standardized tests
for accountability was arguably the core component of the “educational reform movement” of
that decade. As one observer noted at the time, “Nearly every large education reform effort of
the past few years has either mandated a new form of testing or expanded uses of existing
testing” (Pipho, 1985). New state-mandated tests were implemented, some tests were made
more difficult, and the consequences of scores for students, educators, and administrators were
often increased.
Support for the testing of the 1980s waned at the end of the decade because of a growing
awareness that coaching for these tests inflated scores and degraded instruction (Cannell, 1987;

Running head: Limitations in the Use of Tests
3
Koretz, 1988; Koretz, Linn, Dunbar, and Shepard, 1991; Linn, Graue, and Sanders, 1990;
Shepard, 1988a, 1988b; Shepard and Dougherty, 1991). Enthusiasm for test-based
accountability remained undiminished, however. Many states turned to new forms of testing,
convinced that these assessments would be less susceptible to inflated scores and would improve
instruction. These new forms of assessment are often lumped together under the rubric
“performance assessment” but are actually diverse. They include on-demand open-response
tasks (such as solving a mathematics problem and explaining the solution), portfolios, hands-on
performance tasks (such as conducting an experiment with scientific apparatus), and hybrid tasks
that involve both group and individual activities.
In the last few years, the consequences attached to performance on tests have again
grown markedly. Financial rewards to schools for increases in test scores are no longer rare, and
sanctions for poor performance are becoming more common. Roughly half of the states have or
are planning to make high school graduation contingent on passing one or more tests that are
considerably harder than the accountability tests of earlier decades. “Promotional gates” testing
– requiring that students, often as young as the elementary grades, must reach a set score on a
test to be promoted from grade to grade – has been implemented in some of the nation’s largest
districts (e.g., Chicago and New York City).
Several consistent themes characterize these diverse testing policies of the past thirty
years. They all rely on indirect measurement of teacher performance; that is, the quality of
teachers’ performance is inferred from students’ scores. They rely on high stakes as an incentive
for positive changes in practice. They rest on the assumption that the measures employed are
sufficient and that estimates of improvement are meaningful. All of these notions are
problematic.

Running head: Limitations in the Use of Tests
4
TESTS AS SAMPLES OF ACHIEVEMENT DOMAINS
Users of test scores often assume that scores are direct and unambiguous measures of
student achievement, much as the price of a commodity is unambiguous. An increase in test
scores, for example, is typically taken as clear evidence that students are learning more.
Scores on most achievement tests, however, are only limited measures of the latent
construct of interest, which is some aspect of student proficiency. As measures of these
constructs, test scores are generally incomplete, and they are fallible in two senses: in the
traditional statistical sense that they include measurement error, and in the sense that they are
vulnerable to corruption or inflation.
Therefore, scores on most achievement tests are not inherently meaningful or useful.
They become meaningful only to the extent that one is justified in generalizing from the score to
the latent construct of interest. Many of the difficulties inherent in using student achievement as
a measure of the performance of educational systems stem from this principle of measurement.
The incomplete measurement of achievement is manifested in the process of sampling
used to construct an achievement test. This process is often conceptualized as having four
stages, each of which entails a narrowing of the focus of the test (see, for example, Koretz,
Bertental, and Green, 1999). First, one must define the “domain” about which one wishes to
draw inferences. For example, should “eighth-grade mathematics” include only material
currently taught in many schools, or should it also include material that people think should be
taught by the eighth grade? Should it include rudimentary statistics? The defined domain will
generally be narrower than the range of possible domains. The second stage of sampling, which
entails a further narrowing of the domain, is the definition of a framework that delineates the
specific content and skills to be measured. The National Assessment of Educational Progress
(NAEP) framework, for example, specifies that conceptual understanding, procedural

Running head: Limitations in the Use of Tests
5
knowledge, and problem solving should all be tested. The framework is then further narrowed in
developing test specifications, which detail, for example, the mix of item types (such as multiple-
choice and short open-ended), the mix of content areas (for example, what percentage of the
score should reflect simple arithmetic operations), whether calculators are allowable for parts of
the assessment, and so on. The final stage of sampling entails selecting specific items to match
the test specifications. These are all decisions about which reasonable people can and often do
disagree.
The severity of sampling required to construct a test depends on the breadth or
complexity of the domain it is intended to represent. A test of the mechanics of punctuation can
represent the domain quite well, whereas a test of the cumulative learning of mathematics by
grade 11 must sample severely. Current debate about education tends to focus on simple but
very broad inferences (e.g., Koretz and Deibert, 1996), and the most large-scale assessments are
designed to support broad inferences. For present purposes, then, we can assume substantial
sampling.
Thus, the adequacy of a test—specifically, the adequacy with which it supports intended
inferences about mastery of a given domain—depends in part on the adequacy of the sample
comprising the test. The sample must be representative of the domain, and it must be large
enough to provide reliable estimates. Although there are many other factors that influence the
quality of a test, such as appropriate difficulty and lack of bias, the representativeness of the
sample is particularly relevant here because it can be undermined when tests are used for
accountability.
The sampling required to build a test is influenced by practical constraints as well as
decisions about the most important components of the domain. Some aspects of a domain are
Running head: Limitations in the Use of Tests
6
more difficult to assess than others or may require prohibitive amounts of resources (such as
student testing time or development costs). Factual information, for example, and knowledge of
simple mathematical procedures are easier to test than problem-solving ability, creativity in
approaching problems, or deep understanding. These constraints lessen the quality of a test’s
representation of its domain.
Not only are tests samples of their domains; the domains selected for testing taken
together leave many important goals of education unmeasured. State and district testing
programs often exclude entire subject areas, and the content of specific courses within subject
areas (for example, higher-level courses taken by college-bound students) are often given little if
any coverage. Achievement tests also do not measure some of the other attributes that many of
us want schools to foster, such as an interest in and respect for learning, motivation to tackle
cognitively difficult tasks, and intellectual curiosity.
LIMITATIONS OF TEST DATA
One consequence of these considerations is that results can differ markedly across tests
that purport to measure the same domains. For example, in the 1980s, simply changing the
relative weight of algebra and geometry in NAEP altered the gap between black and white
students. Although some of the differences in sampling may seem minor, current tests differ
enough that even statistical linkage is often insufficient to justify using scores on one test to
predict performance on another, particularly when scores are needed for individual students
(Feuer, et al., 1999).
Commonly reported error statistics – the standard error of measurement of an individual
score and the standard errors of aggregate scores – do not take into account variations among
alternative tests. The former represents the precision of a single test estimated in various ways,
such as the internal consistency of the instrument or the correlation across alternative forms of

Running head: Limitations in the Use of Tests
7
the same instrument. Modern measurement theory has a framework, generalizability theory, for
considering many threats to robustness at the same time (Cronbach, et al., 1972; Shavelson and
Webb, 1991). This could be but is not used to analyze the robustness of inferences across tests.
Variations among tests can have profound implications for test-based accountability. The
choice among alternative measures will change some students’ status from passing to failing, or
vice-versa. For example, if two tests, X and Y, correlate .8, which is within the range one would
expect for correlations between uncorrupted, similar tests of the same domain, roughly 30
percent of students who would pass on test X but fail on test Y. With cut scores at the mean,
which is perhaps a more reasonable illustration given current policies, somewhat over 20 percent
of those who would pass on test X would fail on test Y.
Differences in results among tests can stem from a variety of factors in addition to the
sampling required to construct them. Even jurisdictions using the same test may obtain non-
comparable scores because of differences in test administration, date of administration, or other
factors (e.g., Koretz, Bertental, and Green, 1999).
Aggregation (say, to the level of school or district means) does not necessarily make
scores from different tests—or even different administrations of the same test—comparable.
Aggregation helps when the sources of error are factors that vary at the level of individuals, but
not when they are factors that vary systematically among aggregate units. Choice of tests,
timing, rates of exclusion of students with special need, rules for testing out-of-grade or transient
students, and rules for the use of accommodations for students with disabilities or limited
proficiency in English all vary systematically among aggregates and therefore can produce
serious non-comparability in the results of testing programs.

Running head: Limitations in the Use of Tests
8
The sampling required to construct tests leads to an additional limitation that is
particularly acute when tests are used for accountability: the susceptibility of scores to inflation
or corruption. If instruction focuses on the specific sample comprising the test rather than the
domain from which it samples and that it is intended to represent, then performance on the
sample will no longer be a good indicator of performance on the latent construct. This is
discussed in detail below.
PROBLEMS OF INFERENCE ABOUT GAINS
Inferences about the performance of teachers in test-based accountability systems raise
two basic questions:
• Are scores meaningful; and
• If so, are they attributable to the behavior of teachers?
Are scores meaningful?
In lay parlance, people often speak of a test as “valid” or “invalid.” Tests, however, are
not inherently valid. A score on a given test may justify one desired inference but not another.
Validity is therefore a characteristic of an inference—that is, the degree to which evidence from
a test justifies the inference. In the case of current accountability systems, two inferences are
most important: the conclusion that a given student has sufficiently mastered a domain of
interest, and the inference that mastery of a domain has improved. Because inferences about
gains are central to current efforts to judge teachers, I will focus on the latter inference in
discussing validity, but much the same argument could be applied to cross-sectional score data.
The key to validating scores as an indicator of improvement is the notion that tests are
small samples of domains. When scores increase, students clearly have improved their mastery
of the sample included in the test. This is of no interest, however, unless that improvement

Running head: Limitations in the Use of Tests
9
justifies the inference that students have attained greater mastery of the domain the test is
intended to represent.
Thus, if gains are meaningful, they should generalize from the specific test to other
indicators of mastery of the domain in question. Because an exhaustive measure of most
domains is impractical, one cannot test the degree of generalization from operational tests to the
ideal, complete test. One can, however, examine the degree to which gains on a specific test
generalize to other tests and to non-test measures of performance in the domain in question.
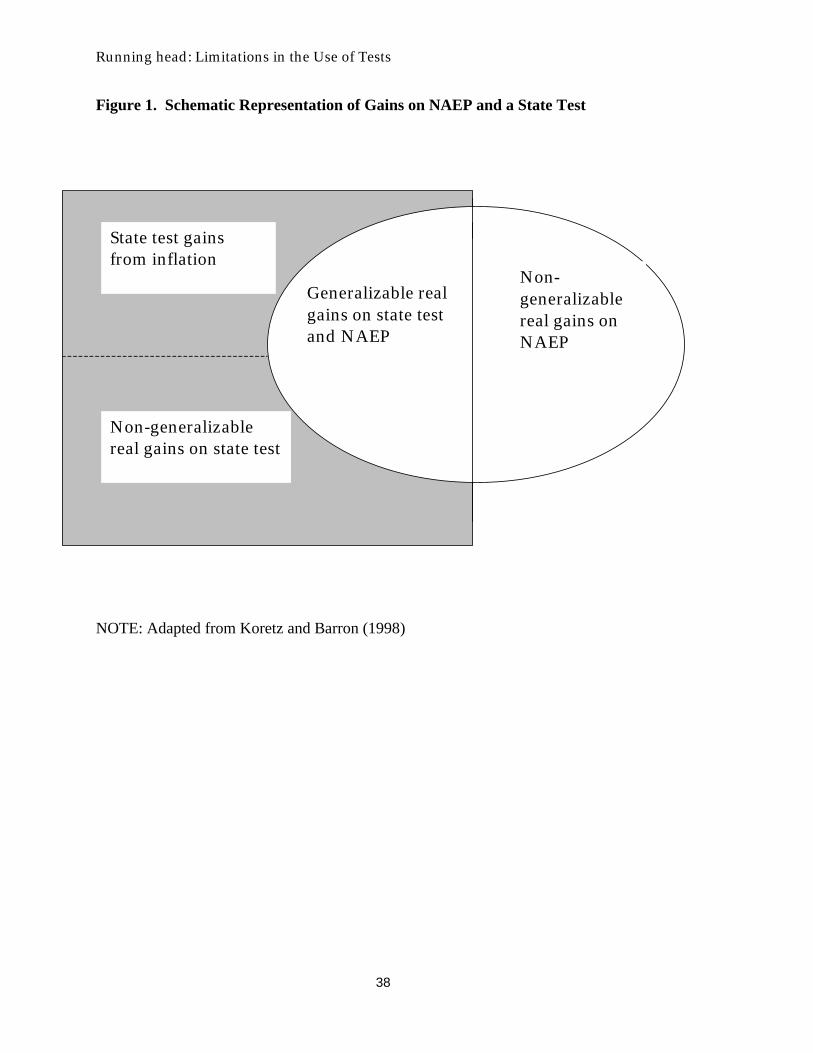
To interpret the generalizability of gains in scores, it is helpful to break scores into
several components, illustrated here by a hypothetical high-stakes state test and NAEP. Total
gains for this hypothetical state on a NAEP assessment are represented by the ellipse in Figure 1,
while total gains on the state’s own test are represented by the overlapping rectangle. The
relative sizes of all of the areas in Figure 1 are arbitrary.
The area of overlap represents gains that are both meaningful and generalizable, in the
sense that gains on one of the tests will appear on the other as well. The second area in the
rectangle represents gains that are meaningful—that is, they represent actual gains in mastery of
the intended domain—but do not generalize to NAEP. This could arise if the state’s assessment
entails a somewhat different delineation of the domain than does NAEP or if its design samples
from the domain differently.
The third area within the rectangle, labeled “state test gains from inflation,” represents
increases in scores on the state test that neither generalize to a second test nor represent
meaningful increases in mastery of the domain. These gains could stem from cheating, but more
importantly, they could arise if teachers use forms of coaching that focus too closely on the

Running head: Limitations in the Use of Tests
10
content of the test. This sort of coaching inflates scores by making the sample included in the
test unrepresentative of the domain as a whole.
The ellipse representing gains on NAEP is divided into two areas rather than three. It
includes both generalizable gains and real gains that are not generalizable to the state test. The
ellipse does not include a region representing score inflation on the assumption that teachers do
not—yet—engage in inappropriate coaching for NAEP.
The distinction between generalizable and non-generalizable real gains implies that even
if test-based accountability works well, gains on a test used for accountability are not likely to be
fully reflected in data from other tests. Because of differences in domain specification and
sampling, it is reasonable to expect modest discrepancies in the trends shown by tests used for
accountability and other tests. Large discrepancies, however, are reason to suspect inflation of
scores.
How severe a problem is score inflation?
If instruction is sufficiently narrow, apparent mastery will often fail to transfer to
different types of problems or even different formats of test items. The extent of this failure of
generalization is sometimes startling. Shepard provided a particularly striking example, drawn
from a New Jersey state assessment in the 1970s:
When students were asked to add decimals in vertical format, the state percent
passing was 86%. In horizontal format for identically difficult decimals, the
percent passing was 46%. For subtraction of decimals in the two formats the
passing rates were 78% and 30%, respectively (Shepard, 1988a; drawing on date
from New Jersey Department of Education, 1976).

Running head: Limitations in the Use of Tests
11
Relatively few studies, however, provide strong empirical evidence pertaining to inflation
of entire scores on tests used for accountability. Policy makers have little incentive to facilitate
such studies, and they can be difficult to carry out.
One indication of possible score inflation was the well-publicized “Lake Wobegon” study
of the late 1980s. A physician, John Jacob Cannell, published a report asserting that most states
and an implausibly large number of large local districts reported “above average” scores
(Cannell, 1987). Although Cannell’s study was incorrect in some details, his basic conclusion
that an implausible percentage of jurisdictions were “above average” was confirmed (Linn, et al.,
1990). While Linn et al. (1990) concluded that technical problems (out-of-date norms that did
not reflect recent increases in achievement) contributed to this problem, there was also evidence
of inappropriate teaching to the test (Shepard, 1990).
At about the same time, another study showed that trends on NAEP were less positive
than were changes in scores on many state and local assessments (Linn and Dunbar, 1990). A
possible explanation is coaching that would inflate scores on the state and local assessments.
Only a few studies have directly tested the generalizability of gains in scores on
accountability-oriented tests. The first examined two testing programs in the 1980s that used
commercially published multiple-choice tests (Koretz, Linn, Dunbar, and Shepard, 1991). These
testing programs would be considered “moderate stakes” by today’s standards: they used
publicity and other forms of pressure but did not apply concrete rewards or sanctions to either
students or teachers.
The study entailed administering several different tests in mathematics, reading, and
vocabulary to randomly selected classrooms in two elementary grades. Among those
administered were a competing commercial multiple-choice test and a parallel form of the high

Running head: Limitations in the Use of Tests
12
stakes test—that is, a form built by the publisher to be as comparable as possible.1 The parallel
form was administered to test for motivational differences that might bias comparisons between
the districts’ tests and the investigators’, while the competing multiple-choice tests were
administered to test the generalizability of gains.
The study revealed sizable inflation of test scores in most, but not all, instances. A
particularly clear instance (although not the most severe) was found in third-grade mathematics
in one of the districts. For a period ending four years before the study, the district administered
one test, called Test C in the study. For the next four years, the district administered a competing
test, Test B, which to the untrained eye would look quite similar.
In the fourth year in which the district administered Test B, Koretz, et al., administered
Test C, the identical test that the district had last used four years earlier. Third-grade scores on
the parallel form of Test B were very similar to published Test B results, indicating that scores
on the tests administered for the study were unlikely to have been depressed by motivational or
other artifacts.
This design provides two tests of generalizability: the comparison between Test C in
1986 and Test B the year after; and the comparison between scores on Test C in 1986 (the last
year it was administered by the district) and in 1990 (when administered by Koretz, et al.). The
first of these contrasts could be confounded by a number of extraneous factors, including more
recent and harder norms for the newer test, differences in scaling, and differences in the quality
of national samples used to obtain norms. The second contrast is free of these potential
confounds but could be distorted by changes in the cohorts tested.
1 Parallel forms are constructed to the same specifications and are designed to have the same means and variances. In classical test theory, parallel forms have identical true scores and differ only in terms of the measurement error in each form.
Running head: Limitations in the Use of Tests
13
Both of these comparisons showed that scores on the test with high stakes were roughly
half a year higher than those on a test that was unfamiliar to students. When the district first
switched from Test C to Test B, the median score in the district (the median of school medians)
fell from a grade-equivalent (GE) of 4.3 to 3.7 (Figure 2). The grade equivalent is the median
score obtained nationwide for students in a given month of a given grade. Thus a GE of 3.7 is
the median score nationwide for students in the seventh month (out of 10 academic months) in
third grade, or about average for the spring date on which this district administered its tests.
Scores then rose on the new test (Test B), reaching after four years the about same level (a GE of
roughly 4.3) that had been attained on Test C the last year it had been used. The median score on
Test C administered by Koretz et al. in the same year was a GE of about 3.7 — the score
obtained on Test B the first year it was administered, before anyone had a chance to coach
students for it.
By the beginning of the 1990s, many policymakers and reformers conceded that
accountability could inflate scores on multiple choice tests but argued that these problems would
not arise if states used new tests that are “worth teaching to.” For this reason, Koretz and Barron
(1998) investigated the generalizability of gains on the Kentucky Instructional Results
Information System (KIRIS) testing program. KIRIS was arguably the most prominent effort
nationally during the first half of the 1990s to use performance on one of these new assessments
as a basis for holding educators accountable.
In the KIRIS system, schools were evaluated in terms of an accountability index
consisting of both test scores and other data (such as dropout rates), but test scores were given far
more weight than other data. The KIRIS assessment was complex and changed often, but it
included at various times open-response on-demand tasks, multiple choice items, portfolios, and

Running head: Limitations in the Use of Tests
14
complex “performance events.” As is now common, students’ scores were reduced to a four-
point ordinal scale representing the state’s three performance standards. The four ranges created
in this fashion were labeled Novice (representing failure to reach the lowest standard),
Apprentice, Proficient, and Distinguished. These ranges were assigned arbitrary numerical
values (0, 40, 100, and 140). All schools, regardless of their starting points, were expected to
reach an index of 100, corresponding to having all students at the Proficient level, within 20
years. The performance target assigned to each school for each two-year accountability cycle
was one-tenth of the distance between its starting point and an index of 100.
Schools that exceeded their biennial targets by a sufficient amount received financial
rewards that they could use as the staff chose. These reward were sizable, amounting to tens of
millions of dollars over the first two accountability cycles. Schools that fell sufficiently far
below their improvement goals could be sanctioned.
These performance targets required enormous improvement. The typical school needed
to raise scores by roughly 2 standard deviations over the 20 years merely to meet its target.
Obtaining rewards required gains roughly 10 to 20 percent larger. Schools with initially low
performance would need to make substantially greater improvements. To put the magnitude of
these expected gains in perspective, the mean difference in eighth grade mathematics
performance between the US and Japan in the Third International Mathematics Study (TIMSS)
was about 1.1 standard deviations, and the gap between blacks and non-Hispanic whites on
achievement tests is often around .8 to 1.0 standard deviation (e.g., Hedges and Nowell, 1998).
The size of these expectations for improvement may have increased the inflation of scores
Koretz and Barron (1998) observed.

Running head: Limitations in the Use of Tests
15
Koretz and Barron (1998) used both generalizability of performance gains to other
assessments and patterns internal to the KIRIS data in an effort to evaluate gains, but only the
former are discussed here. One comparison was between gains on KIRIS and gains on NAEP.
This comparison was particularly important because KIRIS was designed to reflect to a
substantial degree NAEP’s framework in mathematics and reading and because the state’s NAEP
data reflect a representative sample of students. It was limited, however, to the few grades and
subjects tested by NAEP in state-representative samples: fourth grade reading for the first and
third years of the KIRIS assessment, and fourth and eighth grade mathematics for the first and
fifth years. The second comparison contrasted KIRIS trends in mathematics, reading, and
science to those on the ACT (the dominant college-admissions test in Kentucky). To address the
self-selection of the students who took the ACT, this latter comparison was limited to students
who took both assessments and who attended schools in which at least 10 students did so.2
Gains on KIRIS were large—sometimes extremely large—during the initial years of the
program but showed only limited generalization to NAEP. Between 1992 (the first year in which
KIRIS was administered) and 1994, fourth grade reading scores on KIRIS increased by about
three-fourths of a standard deviation—a gain large enough to be suspect without any further
evidence. Scores on the NAEP reading assessment, by contrast, remained essentially unchanged
(Hambleton, et al., 1995). Between 1992 and 1996, KIRIS scores in fourth-grade mathematics
increased by about .6 standard deviation (Table 1). NAEP scores in the state increased as well,
by .17 standard deviation. The increase in NAEP scores was not much more than one-fourth as
large as the gains on KIRIS. Much the same pattern appeared in eighth grade mathematics, but
2 Trends on KIRIS in this sample were quite similar to those in the state as a whole.

Running head: Limitations in the Use of Tests
16
the contrast was slightly starker: KIRIS scores increased 4.1 times as much as NAEP scores
(Table 2).
----------------------------------
Insert Table 1 about here
----------------------------------
----------------------------------
Insert Table 2 about here
----------------------------------
A gain of .13 to .17 standard deviation is appreciable for a period of four years, and some
might argue that the apparently sizable inflation of scores on KIRIS is a reasonable price to pay
for a real improvement of this magnitude. A comparison of Kentucky to other states that
participated in NAEP, however, casts doubt on the notion that Kentucky’s gains on NAEP were
an effect of KIRIS. Kentucky’s gain on NAEP was roughly the same as the national increase
and was statistically indistinguishable from gains in most other states, making it less plausible
that it was (Koretz and Barron, 1998).
KIRIS gains also showed limited generalizability to the ACT. The most striking
divergence in trends was in mathematics, which showed a gain on KIRIS of over two-thirds of a
standard deviation in a mere three years but a trivial decline on the ACT (Figure 3). In reading,
KIRIS gains were smaller than in mathematics but did not generalize at all to the ACT. In
science, students showed a gain on both tests, but the gain on the ACT was one-fourth as large as
that on KIRIS (Koretz and Barron, 1998).
At least two studies have found that teachers themselves lack confidence in the
meaningfulness of the score gains in their own schools. In a survey of representative samples of

Running head: Limitations in the Use of Tests
17
educators in Kentucky, Koretz et al. (1996a) asked respondents how much each of seven factors
had contributed to score gains in their own schools. Just over half of the teachers said that
“increased familiarity with KIRIS” and “work with practice tests and preparation materials” had
contributed a great deal. In contrast, only 16 percent reported that “broad improvements in
knowledge and skills” had contributed a great deal. Only 24 percent said that “improvements in
knowledge and skills emphasized in KIRIS” (a reference to real gains that might not generalize
to other tests) had contributed a great deal. Similar responses were found in a parallel study of
the Maryland School Performance Assessment Program (MSPAP), which is perceived as high-
stakes but has fewer important consequences (Koretz, Mitchell, Barron, and Keith, 1996b).
The special problem of initial gains
Interpretation of gains in scores during the first years of any testing program is clouded
by the large gains that typically accompany introduction of the new test. For many years,
psychometricians have noted that the introduction of a new test, even in the absence of high
stakes, is typically accompanied by an initial drop in scores followed by a rapid increase. (See,
for example, Figure 4, which aggregates trends from numerous states in the 1980s).
These rapid increases stem from teachers and students growing familiar with the new test,
and they may or may not represent meaningful gains in achievement. Teachers may begin
teaching a part of the domain that was previously not included in the curriculum, thus creating
real gains in performance. They may simply shift time among parts of the domain to reflect the
different emphases of the new test. They may find ways to coach inappropriately, and some may
cheat. Absent additional information, one cannot tell from aggregate data what mix of these
responses occurred, and one therefore cannot judge how meaningful the gains are. The simple
ubiquity of this pattern, however, is reason enough for caution in interpreting initial gains.

Running head: Limitations in the Use of Tests
18
Can gains be attributed to teachers?
Even when test scores provide meaningful information about student achievement, their
use to evaluate teachers requires that one ascertain what share of the performance, or of gains in
performance, is attributable to their efforts. This is a classic problem of inference from quasi-
experimental designs, and the general methodological issues that arise are not discussed here. It
is important, however, to note a few factors that are specific to the use of test scores to evaluate
of teachers.
Unless a test is very narrow in scope, the behavior of a specific teacher will typically
control a very modest share of test score variance. There are two reasons for this. One is that
much of the variance in test scores is controlled by factors outside of the direct control of
schools, such as ethnicity, parental education, and income. The second is that while learning in
many subject areas is cumulative, students are generally assigned to a given teacher for at most a
single year, and often less.
Controlling for the effects of factors other than the behavior of the target teacher would
be difficult even with good data, but it is daunting when the evaluator is constrained to use the
data most states and localities can provide. Most educational databases include extremely
limited information on non-educational factors known to exert strong influences in performance.
Most school systems, for example, lack data on parental education, and the available data on
income are typically limited to a weak dichotomous proxy, eligibility for free or reduced-price
lunch. In addition, most jurisdictions test infrequently. Many states, for example, test in a given
subject only once per three or four grades. Some states lack data systems that would allow
evaluators to track students over time or to link their records to teachers.
Numerous states and localities (e.g., the Kentucky system noted above) have adopted an
approach in which improvement across repeated cross-sections is used to evaluate schools.
Running head: Limitations in the Use of Tests
19
These models require generally unverified assumptions about reasonable rates of change. For
example, should low-achieving schools be expected to show larger gains, as they were in
Kentucky, because of an assumption that they are on average less effective or simply because
they have farther to go? Or should one assume that students in high-scoring schools, coming on
average from more advantaged backgrounds, will be better able to take advantage of improved or
toughened curricula? At what point should one assume that further progress is either impractical
— or undesirable because attaining it would unduly divert resources from other important goals?
In addition, estimates of annual change from small aggregates are unreliable. Differences in the
characteristics of successive cohorts over time can bias trends, as can variations in in student
transience.
As typically implemented, these models also pose problems of test construction.
Typically, states use a single test to gauge the gains of all schools, regardless of their levels of
achievement or curricular emphasis. To be useful as an indicator of school effectiveness, this
test must be sensitive to change at all levels of achievement and be able to provide reliable
estimates at all levels of school mean achievement, which requires that the test include
substantial amount of material at the appropriate level of difficulty and appropriate to each
school’s instruction. To meet these criteria for the range of schools found in many districts
would require a very long test, with able students wasting time on questions of basic skills and
less able students demoralized by numerous questions that are beyond their capability and even
understanding. Techniques such as computer-adaptive testing (which adjusts the difficulty of a
test as items are administered to students) and two-stage adaptive testing (in which a short
screening test is used to assign forms of varying difficulty to students at different levels of
Running head: Limitations in the Use of Tests
20
difficulty) can substantially lessen this problem, but they are not widely used in large-scale
accountability assessments.
Despite these difficulties, the approach of using change across successive cohorts is
likely to remain popular because it is in some respects undemanding. It can be used without
testing in every grade. It does not require that tests administered in different grades be placed on
the same scale or even have overlapping content. It does not require tracking students over time
or dealing with concomitant problems of attrition and accretion.
Several researchers have argued that only a value-added model using longitudinal data
can provide an adequate basis for judging the effectiveness of schools and teachers, and a few
large districts and states (e.g., Tennessee) have implemented value-added systems. This
approach too faces substantial hurdles. It requires at least annual testing using assessments with
content that overlaps substantially from grade to grade. If testing is not more frequent than
annual, this approach is useful only when the curriculum is cumulative across grades. For
example, it could be useful in reading and probably in elementary school mathematics, but its
applicability to secondary school science is arguable. Moreover, annual testing (in contrast to
fall-spring testing) could lead to biased estimates of teacher effectiveness because of group
differences in the achievement trends students show over the summer months, when not in
school. Finally, as generally implemented, value-added models also confront the challenge of
providing both sensitivity to change and reliability at a wide range of performance levels within
a reasonable amount of testing time. Because of the frequency of required testing and the need
for reliable estimates of growth, value-added testing may lead educators to focus on relatively
narrow domains and to use tests that are inexpensive and require relatively little testing time.

Running head: Limitations in the Use of Tests
21
PERVERSE INCENTIVES
The logic of using achievement tests as an accountability mechanism is simple: we want
teachers to produce student achievement, and if we hold them accountable for doing so, they will
produce more of it. Unfortunately, the evidence to date suggests that test-based accountability
does not necessarily work well.
One reason why test-based accountability does not reliably work well is that it creates
incentives to raise scores, not to improve achievement per se. Because tests are limited measures
of latent constructs, these incentives are not the same.
There is evidence that some test-based accountability systems have in fact generated
changes desired by their proponents, even if they also generate inappropriate behaviors and
misleading gains in scores. For example, Koretz, Stecher, Klein, and McCaffrey (1994) found
that in response to the Vermont portfolio assessment system, teachers reported making numerous
changes in instruction consonant with the goals of the assessment program, such as having
students spend more time applying math to real situation, devoting more class time to the use of
graphs and charts, and having students spend more time writing about mathematics. Similarly,
Koretz, Barron, Mitchell, and Stecher (1996a) found that teachers reported responding to
Kentucky’s KIRIS assessment by increasing writing for a variety of purposes, placing more
emphasis on mathematical communication, and spending more time on mathematical problem-
solving “using meaningful tasks” (p. 26). In some instances, test-based accountability may have
spurred some teachers to work harder, to work more effectively, or to transfer instructional time
and other resources from less important activities to more important ones.
Nonetheless, the evidence noted above showing inflated score gains is accompanied by
evidence showing teacher behaviors that could cause such inflation. These behaviors are of
several types. Some are often labeled “teaching to the test,” but that phrase is inherently

Running head: Limitations in the Use of Tests
22
ambiguous, in that it can subsume desirable as well as undesirable behaviors. It is more useful to
group the behaviors that can inflate scores into three categories: (1) transferring achievement;
(2) cheating; and (3) coaching.
Transferring achievement
Scores can be inflated if teachers transfer instructional resources from important material
that is untested or little emphasized by the test to material that is emphasized by the test.
Numerous studies have found that teachers report doing this (e.g., Darling-Hammond and Wise,
1985; Koretz, et al., 1996 a, 1996b; Salmon-Cox, 1982, 1984; Shepard, 1988b; Shepard and
Dougherty, 1991). Teachers may de-emphasize either material from the same subject area or a
different one, although secondary school teachers are often constrained to do the former.
A recent study by Stecher and Barron (1999) examined yet another form of transferring
instructional resources: reallocation across grades in response to “milepost testing,” the frequent
practice of administering accountability tests in a given subject only in a few grades. Stecher
and Barron examined teachers’ responses to the Kentucky accountability program and found that
instructional time was allocated differently across grades to match the demands of the testing
program. For example, teachers in the fourth grade, the grade in which science was tested,
reported spending an average of 5.2 hours/week on science, compared to 3.5 hours/week by
teachers in the fifth grade. Conversely, teachers in the fifth grade, the grade in which
mathematics was tested, reported spending an average of 6.4 hours/week teaching mathematics,
compared to 4.9 hours/week in the fourth grade. The investigators found that even instructional
strategies, such as the use of open-response questions with multiple correct answers, were
allocated differentially across grades to match the testing program.
When instructional resources are transferred in this way, achievement is as well. The
gains that appear on tested material may be real, in the sense that students do in fact know more

Running head: Limitations in the Use of Tests
23
about that specific part of the domain. These gains are misleading, however, if they are taken to
indicate increased mastery of the domain as a whole or of the set of domains considered
important.
Cheating
Enough incidents of cheating have come to light to show that it is not rare. In a recent
case, investigators in New York City charged that dozens of educators had cheated over a period
of five years by giving students answers to the mathematics and reading tests that are used both
as promotional gates and to rank schools. Educators told students which answers to change, had
them put their initial answers on scrap paper and then correct them before transferring them to
the answer sheet, and gave them practice tests containing questions from the operational test
(Goodnough, 1999).
Data on the incidence of cheating is scarce, but high stakes testing can be expected to
increase it. In the study of Kentucky educators noted earlier, Koretz et al. (1996a) found that 36
percent of teachers reported seeing test questions rephrased during testing time either
occasionally or frequently. Twenty one percent reported seeing questions about content
answered during testing time, and the same percentage reported seeing revisions recommended
either during or after testing. Seventeen percent reported observing hints provided on correct
answers. The corresponding percentages were somewhat lower in a parallel study of the lower-
stakes Maryland assessment program (Koretz, et al., 1996b).
Coaching
“Coaching” is used here to refer to the residual category of teacher behaviors that can
inflate scores but that are examples of neither cheating nor transferring real achievement. This
category is both diverse and poorly delineated, as it blends into both appropriate instruction and
Running head: Limitations in the Use of Tests
24
cheating. Moreover, while there are numerous anecdotal reports of various types of coaching,
little systematic research describes the range of coaching strategies and their effects.
A primary form of coaching is tailoring instruction too closely to the demands of tasks
used in the test, without actually teaching the specific tasks in the test. Some education
reformers will argue that there is nothing wrong with doing this as long as the tasks are “worth
teaching to,” by which they mean that students will learn something of value by practicing them.
For present purposes, however, it is not sufficient for tasks to be “worth teaching to” in this
respect. It is also essential that gains on the test generalize to the domain of interest. If teaching
is so tightly aligned with the specifics of the test that generalization is substantially limited, the
result will be inflated gains even if the tasks are “worth teaching to.” This form of coaching can
shade into the transference of achievement described above.
Stecher and Mitchell (1995) found an interesting variant of coaching: instruction focused
on scoring rubrics. To some extent, attention to rubrics is desirable; it can make it clear to
students what aspects of performance are expected. If carried to an extreme, however, it
becomes another technique for improving performance on the specific tasks in the test rather
than mastery of the domain. For example, it can lead teachers to ignore tasks not well suited to
the rubrics and de-emphasize skills not addressed by them. The authors labeled this form of
coaching “rubric-driven instruction,” a play on the phrase “measurement-driven instruction”
used in the 1980s by many advocates of test-based accountability (e.g., Popham, et al. 1985).
DISCUSSION
Clearly, increases in scores on accountability-oriented tests are not sufficient evidence
that education has really improved, and imposing these tests is insufficient as a means of
encouraging improvement. Incentives to raise scores are not always the same as those to

Running head: Limitations in the Use of Tests
25
improve achievement, and focusing only on scores on these tests leaves too many good and bad
practices unrecognized.
Given that, what types of accountability systems might be more effective, and what role
might achievement tests play in them? Unfortunately, there is little basis in research for
answering this question. The simple test-based accountability systems that have been in vogue
for the past two decades have appeared so commonsensical to some policymakers that they have
had little incentive to permit the evaluation of alternatives. Nonetheless, the research provides
some basis for speculation.
Improve the design and use of accountability-oriented tests
At this time, it does not appear likely that the problems of perverse incentives and
corrupted scores can be solved by improvements in assessment systems, but some steps hold the
potential for ameliorating these problems.
Tie assessments to clear curricula. In order to teach to the intended domains rather than
to the specific test, teachers need to know what the intended domains are. Many current reforms
lead with an assessment that is tied only to vaguely worded standards. This increases the
incentive to focus instruction on the assessment alone rather than on the domains it is intended to
represent; even many teachers who want to teach the whole domain will perforce use the test for
guidance in allocating instructional resources.
Design tests for use in accountability systems. If sufficient resources were committed to
the task, testing programs could be designed to lessen the severity of score inflation. For
example, reuse of test items could be strictly controlled, and systems to monitor for inflation
could be built into the assessment system as a disincentive to coach inappropriately.
In theory, if a curriculum were specified clearly, rules could be established for sampling
from it to maximize coverage of the domain over the moderate term, thus lessening the incentive

Running head: Limitations in the Use of Tests
26
to coach inappropriately. Teachers could be told that regardless of what happened to be sampled
in the assessment for one year, anything in the curriculum could be sampled for the assessment
in the next year, following the specified rules. The incentive to focus instruction narrowly, based
on the previous assessments, would thus be reduced. This approach would pose substantial
technical difficulties, however, because lessening score inflation might require that that
successive forms of the test be substantially non-equivalent. While it would be feasible to adjust
for differences in average difficulty over time, it would be difficult to equate properly – that is,
to make it a matter of indifference to individual examinees which form they are administered. It
is never feasible to equate perfectly, but in a system of this type, the percentage of students who
fail using one form and would pass had they taken a form from a different year may be higher
than is common in some current testing systems.
Set realistic goals for the improvement of performance. The amount and speed of
performance improvements are constrained by factors beyond the control of education
policymakers and educators. Requiring faster changes than teachers can effect by appropriate
means may exacerbate the problem of inflated scores. Because teachers can improve students’
mastery of tested material more rapidly than they can improve mastery of the much larger
domains it is intended to represent, excessively high goals will increase the incentive to narrow
instruction inappropriately. To be realistic, targets for improvement should be based on
information about the distribution of student performance and about the capacities of schools to
change.
Limit interpretation of initial gains. The interpretation of initial gains on a new
assessment is clouded by the likelihood of inflation from familiarization. One way to address
this problem would be to limit interpretations of initial gains, particularly when high stakes raise
Running head: Limitations in the Use of Tests
27
the risk of inflation. Sponsors could warn the public and other stakeholders that initial gains are
likely to be exaggerated by familiarization and that only longer-term gains are likely to be
grounds for confident inferences about meaningful improvement in student learning.
Widen the range of student outcomes used for accountability
Even with improvements to assessment systems, some unintended negative incentives
and concomitant inflated gains are likely to remain, and some valued outcomes of education are
likely to remain poorly tested or untested entirely. The larger question posed by inflated scores
is therefore the role that test scores and other variables should play in an accountability system.
Several states, including Kentucky, have recognized the importance of considering
factors other than test scores in accountability systems. Kentucky incorporated into its
accountability index measures such as a dropout rate, an attendance rate, the rate of retention in
grade, and a rate of successful transition to postsecondary education or work. Some of these
indicators, however, show limited variance and little room for improvement, so their impact on
the Kentucky index was minor (Koretz and Barron, 1998). Moreover, some of these are largely
outside the control of educators, so their use provides little incentive to change practice.
Research provides sparse guidance about how to broaden the range of measured
outcomes to provide a better mix of incentives and lessen score inflation. Several possible
directions, however, warrant further exploration:
Use multiple distal measures of achievement. The term “distal” is used here to denote
measures that are infrequent and are thus distant from daily decisions made by teachers. It is an
axiom of measurement that any single measure of cognitive performance provides only limited
information about the construct(s) of interest and that multiple measures are therefore preferable.
Administering diverse assessments of achievement would lessen incentives to narrow

Running head: Limitations in the Use of Tests
28
instruction, but this approach is limited by the financial costs, time demands, and disruption of
instruction caused by testing.
Use distal non-cognitive measures. Despite the limitations noted earlier of many distal
non-cognitive measures, there are strong arguments for including some measures of this type in
accountability systems. Including non-cognitive measures may help identify certain types of
behavior that could distort the interpretation of scores. For example, Haney (1999) has argued
that the narrowing of racial/ethnic disparities in scores on the high-stakes Texas test, TAAS, has
been accompanied by a dramatic drop in the high school graduation rates of Hispanic and
African American students.
Use measures of proximal outcomes. The phrase “proximal outcomes” is used here to
refer to the short- and moderate-term changes in student motivation, behavior, knowledge, and
skills that rightly occupy much of the attention of excellent teachers. Only some of a good
teachers’ success in producing these proximal outcomes will be reflected in distal achievement
measures. Worse, excessive pressure to change performance on distal measures may divert
better teachers from efforts to meet important proximal goals. Many of the demoralizing
anecdotes about the impact of high-stakes testing refer to this.
Whether it is feasible to incorporate measures of proximal outcomes into centralized
accountability systems, however, remains to be demonstrated. It is possible that this can only be
done via direct measures of teachers’ practice, discussed below.
Use measures of ongoing student work. Just as accountability for scores on distal tests
may distort the incentives facing teachers on a daily basis, it may lead students to downplay the
importance of their ongoing academic work. Some students will simply ask what is on the test
and give short shrift to work that is not, even if that work is important.
Running head: Limitations in the Use of Tests
29
Because the value of teacher-assigned grades is undermined by inconsistencies in grading
standards, many reformers have suggested using portfolio assessment systems, in which an
accumulation of student work is evaluated, as a more credible means of giving students and
teachers incentives to focus on the quality of ongoing work. There is some evidence that
portfolio assessment programs can indeed provide incentives to improve ongoing practice,
although its effects are inconsistent, and it is burdensome (e.g., Koretz, et al, 1994; Stecher,
1998). However, portfolio assessment is by its very nature somewhat unstandardized.
Standardized tests entail uniform tasks, uniform administration, and uniform scoring. Portfolio
assessments can be subject to uniform scoring rules, but the tasks assigned are generally not
standardized, and the conditions under which the tasks are performed often vary dramatically
from classroom to classroom. These characteristics undermine the ability of portfolio
assessments to provide the accuracy and comparability of data required by high-stakes
centralized accountability systems (Koretz, et al., 1994; Koretz, 1998), although it remains
possible that with additional development, portfolios could be made a useful component of an
accountability system—e.g., as a measure of teaching rather than of student performance.
Use direct measures of teachers’ practice
The limitations of standardized distal measures of achievement as incentives and the lack
of ready methods for measuring proximal outcomes and the quality of ongoing student work
suggests that accountability systems should include direct measures of teachers’ practice as well
as measures of student outcomes.
The arguments against direct measures of practice are numerous. There is disagreement
about the types of practice that foster achievement. (In part, this stems from disagreements about
the types of learning that are most valued, however, so this problem affects outcome-based
accountability as well.) In many instances, a range of methods are appropriate, and individual

Running head: Limitations in the Use of Tests
30
teachers may find different ones effective. Measures of practice are sometimes “fakable;”
teachers have been known to have a specially lesson prepared for the day when an observer
appears without warning. Measuring practice is expensive and, if not mechanistic, somewhat
subjective. Evaluations of teachers that depend on expert judgment require that individuals with
expertise spend their time evaluating peers rather than teaching students.
The arguments in favor of direct measurement of teachers’ practice, however, are also
strong. Given the limitations of distal achievement tests for this purpose and the undeveloped
state of measures of proximal outcomes and ongoing work, it may not be possible to provide
teachers with the appropriate mix of incentives without some degree of reliance on direct
measures of their practice. Further research is needed, however, to ascertain the utility of direct
measures of practice in centralized accountability systems.
A hybrid model: using scores to trigger additional investigation
It might be feasible to obtain some benefits of test-based accountability while
ameliorating its drawbacks by using scores on tests as a criterion for targeting more intensive
investigations of school quality. For example, persistently low scores or a failure to raise them
could trigger an evaluation designed to identify both educational and extraneous factors that are
influencing scores and to clarify whether the trends in scores really should be taken as a sign of
program effectiveness. Similarly, this approach could be extended to schools that show
suspiciously rapid improvements in scores.
A hybrid model of this sort might save money and burden, focus evaluative efforts where
they have a particularly good chance of mattering, and avoid some erroneous sanctioning of
schools. Ideally, it would lessen the incentives to inflate scores. Depending on the evaluative
model chosen, however, this method could inappropriately exempt many schools from further
examination.

Running head: Limitations in the Use of Tests
31
The effectiveness of this hybrid approach, however, remains unclear. Large-scale use of
approaches of this sort have been limited in recent years to exceptional cases. For example,
Kentucky used audits to address bias in the scores many teachers assigned to the writing
portfolios of their own students (see, e.g., Hambleton, et al., 1995) but did not use it to explore
the apparent inflation of score gains in the assessment as a whole.
Develop a research and development agenda for educational accountability
The drive for greater educational accountability continues to gain momentum, and
student testing continues to gain importance. The consequences attached to performance on tests
continues to grow. Yet we have accumulating evidence that test-based accountability policies
are not working as intended, and we have no adequate research-based alternative to offer to the
policy community. In this situation, the role of researchers is like that of the proverbial
custodian walking behind the elephant with a broom. The policies are implemented, and after
the fact a few researchers are allowed to examine the effects and offer yet more bad news.
What is needed is an active program of research focused on both the development and the
evaluation of alternative methods of holding educators accountable. This research should
examine directly the mix of incentives provided to teachers as well as the ultimate effects on
student learning.
Running head: Limitations in the Use of Tests
32
REFERENCES
Airasian, P. (1987). State mandated testing and educational reform: Context and consequences.
American Journal of Education, 95, 393-412.
Cannell, J. J. (1987). Nationally Normed Elementary Achievement Testing in America’s Public
Schools: How All Fifty States are Above the National Average. Daniels, W.V.: Friends
for Education.
Cronbach, L. J., Gleser, G. C., Nanda, H. M., and Rajaratnam, N. (1972). The Dependability of
Behavioral Measurements: The Generalizability of Scores and Profiles. New York:
Wiley.
Darling-Hammond, L., and Wise. A. E. (1985). Beyond standardization: State Standards and
School Improvement. The Elementary School Journal, January, 315-336.
Feuer, M. J., Holland, P. W., Green, B. F., Bertenthal, M. W., and Hemphill, F. C. ,Editors
(1999); Committee on Equivalency and Linkage of Educational Tests, National
Research. Uncommon Measures: Equivalence and Linkage Among Educational Tests.
Washington, DC: National Academy Press.
Goodnough, A. (1999). Answers allegedly supplied in effort to raise test scores. The New York
Times, December 8.
Goslin, D. A. (1963). The Search for Ability: Standardized Testing in Social Perspective. NY:
Russell Sage.
Goslin, D., Epstein, R. R., and Hallock, B. A. (1965). The Use of Standardized Tests in
Elementary Schools. NY: Russell Sage.

Running head: Limitations in the Use of Tests
33
Hambleton, R. K., Jaeger, R. M., Koretz, D., Linn, R. L., Millman, J., and Phillips, S. E. (1995).
Review of the Measurement Quality of the Kentucky Instructional Results Information
System, 1991-1994. Frankfort: Office of Education Accountability, Kentucky General
Assembly, June.
Haney, W. (1981). Validity, Vaudeville, and Values: A short history of social concerns over
standardized testing. American Psychologist, 36 (10), 1021-1034.
Haney, W. (2000). The myth of the Texas miracle in education reform. In L. McNeil (Chair),
The New Discrimination: Creating and Recreating Discrimination in Public Schools.
Symposium presented at the annual meeting of the American Educational Research
Association, New Orleans, April 27.
Hedges and Nowell (1998). “Black-white test score convergence since 1965.” In C. Jencks and
M Phillips, The Black-White Test Score Gap, Brookings 1998, pp 149-181.
Jaeger, R. M. (1982). The final hurdle: Minimum competency achievement testing. In G. R.
Austin and H. Garber (Eds.), The Rise and Fall of National Test Scores. New York:
Academic Press.
Kentucky Department of Education (1997). KIRIS Accountability Cycle 2 Technical Manual.
Frankfort, KY: author.
Koretz, D. (1988). Arriving in Lake Wobegon: Are standardized tests exaggerating
achievement and distorting instruction? American Educator, Summer, 12 (2), pp. 8-15,
46-52.
Koretz, D. (1992). State and National Assessment. In M. C. Alkin (ed.) Encyclopedia of
Educational Research, Sixth Edition, Washington, D.C.: American Educational
Research Association, pp. 1262-1267.
Running head: Limitations in the Use of Tests
34
Koretz, D. (1998). Large-scale portfolio assessments in the US: Evidence pertaining to the
quality of measurement. In D. Koretz, A. Wolf, and P. Broadfoot (Eds.), Records of
Achievement. Special issue of Assessment In Education, 5(3), 309-334.
Koretz, D., and Barron, S. I. (1998). The Validity of Gains on the Kentucky Instructional Results
Information System (KIRIS). Santa Monica: RAND.
Koretz, D., Barron, S., Mitchell, K., and Stecher, B. (1996a). The Perceived Effects of the
Kentucky Instructional Results Information System (KIRIS). MR-792-PCT/FF, Santa
Monica: RAND.
Koretz, D., Mitchell, K., Barron, S., and Keith, S. (1996b). The Perceived Effects of the
Maryland School Performance Assessment Program. CSE Technical Report No. 409.
Los Angeles: Center for the Study of Evaluation, University of California.
Koretz, D., Stecher, B., Klein, S., and McCaffrey, D. (1994). The Vermont Portfolio Assessment
Program: Findings and Implications. Educational Measurement: Issues and Practice,
13 (3), 5-16.
Koretz, D. M., Bertenthal, M. W., and Green, B. F., Editors; Committee on Embedding Common
Test Items in State and District Assessments, National Research Council. Embedding
Questions: The Pursuit of a Common Measure in Uncommon Tests. Washington, D. C.:
National Academies Press.
Koretz, D., and Deibert, E. (1996). Setting standards and interpreting achievement: A
cautionary tale from the National Assessment of Educational Progress. Educational
Assessment, 3(1), 53-81.
Koretz, D., Linn, R. L., Dunbar, S. B., and Shepard, L. A. (1991). The Effects of High-Stakes
Testing: Preliminary Evidence About Generalization Across Tests, in R.L. Linn (chair),
Running head: Limitations in the Use of Tests
35
The Effects of High Stakes Testing, symposium presented at the annual meetings of the
American Educational Research Association and the National Council on Measurement
in Education, Chicago, April.
Linn, R. L. (1999). Assessment and accountability systems. Invited address to the national
conference of the American Association of School Administrators, New Orleans,
February 21.
Linn, R. L, and Dunbar, S. B. (1990). The Nation’s report card goes home: Good news and bad
about trends in achievement. Phi Delta Kappan, 72 (2), October, 127-133.
Linn, R. L., Graue, M. E., and Sanders, N. M. (1990). Comparing state and district test results to
national norms: The validity of the claims that "everyone is above average." Educational
Measurement: Issues and Practice, 9 (3), 5-14.
New Jersey Department of Education. (1976). Educational Assessment Program: State Report
1975-76. Trenton, NJ: Author
Pipho, C. (1985). Tracking the reforms, part 5: Testing--can it measure the success of the reform
movement? Education Week, 4 (35), 19.
Popham, W. J., Cruse, K. L., Rankin, S. C., Sandifer, P. D., and Williams, P. L. (1985).
Measurement-driven Instruction: It’s on the road. Phi Delta Kappan, 66 (May), 628-634.
Resnick, D. (1982). History of educational testing. In A. K. Wigdor and W. R. Garner (Eds.),
Ability testing: Uses, consequences, and controversies, Part II. Washington, D. C.:
National Academy Press, pp. 173-194.
National Commission on Excellence in Education (1983). A Nation at Risk. Washington, D. C:
U. S. Department of Education.

Running head: Limitations in the Use of Tests
36
Roeber, E. (1988). A history of large-scale testing activities at the state level. Paper presented at
the Indiana Governor’s Symposium on ISTEP, Madison, Indiana, February 10.
Salmon-Cox, L. (1982). MAP Math: End of Year One Report. Learning Research and
Development Center, University of Pittsburgh, unpublished.
Salmon-Cox, L. (1984). MAP reading end-of-year report. Learning Research and Development
Center, unpublished, September.
Shavelson, R. J., and Webb, N. M. (1991). Generalizability Theory: A Primer. Newbury Park:
Sage.
Shepard, L. A. (1988a). Should instruction be measurement-driven?: A debate. Paper
presented at the annual meeting of the American Educational Research Association, New
Orleans, April.
Shepard, L. A. (1988b). The harm of measurement-driven instruction. Paper presented at the
annual meeting of the American Educational Research Association, Washington, D.C.
(April).
Shepard, L. A. (1990). Inflated test score gains: Is the problem old norms or teaching the test?
Educational Measurement: Issues and Practice, 9(3), 15-22.
Shepard, L. A., & Dougherty, K. C. (1991). Effects of high-stakes testing on instruction. In R.
L. Linn (Chair), The effects of high stakes testing, symposium presented at the annual
meetings of the American Educational Research Association and the National Council on
Measurement in Education, Chicago, IL, April.
Stecher, B. M. (1998.) The local benefits and burdens of large-scale portfolio assessment. In D.
Koretz, A. Wolf, and P. Broadfoot (Eds.), Records of Achievement. Special issue of
Assessment in Education, 5(3), 335-351.

Running head: Limitations in the Use of Tests
37
Stecher, B. M, and Barron, S. I. (1999). Quadrennial Milepost Accountability Testing in
Kentucky. CSE Technical Report No. 505. Los Angeles: Center for the Study of
Evaluation, University of California.
Stecher, B. M., and Mitchell, K. J. (1995). Portfolio-Driven Reform: Vermont Teachers’
Understanding of Mathematical Problem Solving and Related Changes in Classroom
Practice. CSE Technical Report No. 400. Los Angeles: Center for the Study of
Evaluation, University of California.
Running head: Limitations in the Use of Tests
38
Figure 1. Schematic Representation of Gains on NAEP and a State Test
NOTE: Adapted from Koretz and Barron (1998)
Non-generalizablereal gains onNAEP
Generalizable realgains on state testand NAEP
Non-generalizablereal gains on state test
State test gainsfrom inflation

Running head: Limitations in the Use of Tests
39
Figure 2. Performance on Coached and Uncoached Tests, Third-Grade Mathematics
SOURCE: Adapted from Koretz, Linn, Dunbar, and Shepard (1991).
3.0
3.2
3.4
3.6
3.8
4.0
4.2
4.4
1985 1986 1987 1988 1989 1990 1991
Year
Gra
de
Eq
uiv
alen
ts
Test C Test B
District tests
Koretz, et al., test

Running head: Limitations in the Use of Tests
40
Figure 3. Standardized Change on KIRIS and ACT Mathematics Tests, Kentucky
-0.1
0
0.1
0.2
0.3
0.4
0.5
0.6
0.7
Year
Sta
nd
ard
Dev
iati
on
KIRIS
ACT
1992 199519941993
SOURCE: Koretz and Barron (1998)

Running head: Limitations in the Use of Tests
41
Figure 4: Trends in Scores (Percentile Ranks) When a New Test Form is Introduced
30
40
50
60
70
1 2 3 4 5 6 7 8 9 10 11 12
YEAR
PR
MathematicsReading
New FormOld Form
SOURCE: Linn, 1999

Running head: Limitations in the Use of Tests
42
Table 1. Kentucky’s Gains in Fourth-Grade Mathematics,
KIRIS and NAEP, 1992-96
KIRIS NAEP
Raw Gain 22.9 5
Standardized Gain 0.61 0.17
Ratio, KIRIS to NAEP 3.6
SOURCE: Koretz and Barron (1998)
Table 2. Kentucky’s Gains in Eighth-Grade Mathematics,
KIRIS and NAEP, 1992-96
KIRIS NAEP
Raw Gain 23.7 4
Standardized Gain 0.52 0.13
Ratio, KIRIS to NAEP 4.1
SOURCE: Koretz and Barron (1998)