limiting partition coefficient in progressive freeze ...mwat/websuzuki/images/lab/89.lab.pdf · and...
TRANSCRIPT

E546 JOURNAL OF FOOD SCIENCE—Vol. 70, Nr. 9, 2005Published on Web 11/21/2005
© 2005 Institute of Food TechnologistsFurther reproduction without permission is prohibited
E: Food Engineering & Physical Properties
JFS E: Food Engineering and Physical Properties
Limiting Partition Coefficient inProgressive Freeze-concentrationX. GX. GX. GX. GX. GUUUUU, , , , , TTTTT. S. S. S. S. SUZUKIUZUKIUZUKIUZUKIUZUKI, , , , , ANDANDANDANDAND O O O O OSASASASASATTTTTOOOOO M M M M MIYIYIYIYIYAAAAAWWWWWAKIAKIAKIAKIAKI
ABSTRAABSTRAABSTRAABSTRAABSTRACTCTCTCTCT: I: I: I: I: In the prn the prn the prn the prn the progrogrogrogrogressivessivessivessivessive fre fre fre fre freeeeeeeeeezzzzze-concentre-concentre-concentre-concentre-concentration, limiting paration, limiting paration, limiting paration, limiting paration, limiting partition coefficient, tition coefficient, tition coefficient, tition coefficient, tition coefficient, KKKKK00000, is a v, is a v, is a v, is a v, is a vererererery impory impory impory impory important prtant prtant prtant prtant processocessocessocessocessparparparparparameterameterameterameterameter, which corr, which corr, which corr, which corr, which corresponds to the paresponds to the paresponds to the paresponds to the paresponds to the partition coefficient of a solute betwtition coefficient of a solute betwtition coefficient of a solute betwtition coefficient of a solute betwtition coefficient of a solute between the ice and liquid phase assuming theeen the ice and liquid phase assuming theeen the ice and liquid phase assuming theeen the ice and liquid phase assuming theeen the ice and liquid phase assuming theinfinitesimal ice growth rate and/or the infinite mass-transfer rate at the ice-liquid interface. infinitesimal ice growth rate and/or the infinite mass-transfer rate at the ice-liquid interface. infinitesimal ice growth rate and/or the infinite mass-transfer rate at the ice-liquid interface. infinitesimal ice growth rate and/or the infinite mass-transfer rate at the ice-liquid interface. infinitesimal ice growth rate and/or the infinite mass-transfer rate at the ice-liquid interface. KKKKK00000 was determined for was determined for was determined for was determined for was determined forglucose and various electrolytes in the single-component and multi-component systems. glucose and various electrolytes in the single-component and multi-component systems. glucose and various electrolytes in the single-component and multi-component systems. glucose and various electrolytes in the single-component and multi-component systems. glucose and various electrolytes in the single-component and multi-component systems. KKKKK00000 was dependent both on was dependent both on was dependent both on was dependent both on was dependent both onthe concentration and the type of solute. In the single-component system, osmotic pressure was proved to be thethe concentration and the type of solute. In the single-component system, osmotic pressure was proved to be thethe concentration and the type of solute. In the single-component system, osmotic pressure was proved to be thethe concentration and the type of solute. In the single-component system, osmotic pressure was proved to be thethe concentration and the type of solute. In the single-component system, osmotic pressure was proved to be themajor determinant of major determinant of major determinant of major determinant of major determinant of KKKKK00000. In the multi-component system, . In the multi-component system, . In the multi-component system, . In the multi-component system, . In the multi-component system, KKKKK00000 for a solute was affected by the coexisting solute for a solute was affected by the coexisting solute for a solute was affected by the coexisting solute for a solute was affected by the coexisting solute for a solute was affected by the coexisting solutethrough the osmotic pressure of the total system. through the osmotic pressure of the total system. through the osmotic pressure of the total system. through the osmotic pressure of the total system. through the osmotic pressure of the total system. KKKKK00000 was also dependent on viscosity when the change in the osmotic was also dependent on viscosity when the change in the osmotic was also dependent on viscosity when the change in the osmotic was also dependent on viscosity when the change in the osmotic was also dependent on viscosity when the change in the osmoticpressure was limited but the change in the viscosity was considerable because of the coexisting solute.pressure was limited but the change in the viscosity was considerable because of the coexisting solute.pressure was limited but the change in the viscosity was considerable because of the coexisting solute.pressure was limited but the change in the viscosity was considerable because of the coexisting solute.pressure was limited but the change in the viscosity was considerable because of the coexisting solute.
KKKKKeyworeyworeyworeyworeywords: prds: prds: prds: prds: progrogrogrogrogressivessivessivessivessive fre fre fre fre freeeeeeeeeezzzzze-concentre-concentre-concentre-concentre-concentration, limiting paration, limiting paration, limiting paration, limiting paration, limiting partition coefficient, osmotic prtition coefficient, osmotic prtition coefficient, osmotic prtition coefficient, osmotic prtition coefficient, osmotic pressuressuressuressuressureeeee, viscosity, viscosity, viscosity, viscosity, viscosity, concen-, concen-, concen-, concen-, concen-tration polarizationtration polarizationtration polarizationtration polarizationtration polarization
Introduction
There are 3 methods for the concentration of liquid food: evap-oration, reverse osmosis, and freeze-concentration. Among
these, freeze-concentration is known to give the best quality (Desh-pande and others 1982). Freeze-concentration has been applied forthe concentration of fruit juices (Omran and King 1974; Deshpandeand others 1982; Bayindirli and others 1993) and dairy products(Hartel and Chung 1993; Hartel and Espinel 1993). Freeze-concen-tration is also proposed to be applicable to waste water treatments(Muller and Sekoulov 1992; Shirai and others 1999; Rodriguez andothers 2000; Lemmer and others 2001; Wakisaka and others 2001).
The conventional method of freeze-concentration is based onsuspension crystallization (Huige and Thijssen 1972), in whichmany small ice crystals are formed and are grown large by spend-ing a long time through the Ostwald ripening mechanism in thesystem. In spite of this, the size of ice crystals is still limited so thatthe freeze-concentration based on this method needs a very com-plicated system composed of a surface-scraper heat-exchanger forthe generation of seed ice, a recrystallization vessel for ice crystalgrowth, and a washing tower for separation of ice crystals from theconcentrated mother solution. This complex system requires veryhigh initial investment for the process.
On the contrary, progressive freeze-concentration has been pro-posed (Matthews and Coggeshall 1959; Bae and others 1994;Miyawaki and others 1998), in which a single ice crystal is formed inthe system so that the process is expected to be much simpler, caus-ing much lower initial investment compared with the suspensioncrystallization method. By using a tubular ice system, scale-up ofthe progressive freeze-concentration is easily done (Shirai and oth-ers 1999; Wakisaka and others 2001; Miyawaki and others 2005).
In the progressive freeze-concentration, a solute in the mothersolution is separated at the ice-liquid interface so that the effective
partition coefficient of the solute between the ice and liquid phaseis very important. This partition phenomena has been theoreticallyanalyzed by the concentration polarization model (Miyawaki andothers 1998). In this model, the limiting partition coefficient is a keyprocess parameter, which could be obtained by the effective parti-tion coefficient under the various operating conditions of icegrowth rate and the mass-transfer rate at the ice-liquid interface(Pradistsuwana and others 2003).
In this article, the limiting partition coefficient in the progressivefreeze-concentration is obtained for various systems containingvarious solutes for single- and multi-component systems to clarifythe major determinant for the partition phenomena at the ice-liq-uid interface.
Theoretical considerationsTheoretical considerationsTheoretical considerationsTheoretical considerationsTheoretical considerationsIn the progressive freeze-concentration, the effective partition
coefficient of solute between the ice and liquid phase at the ice-liq-uid interface is defined as follows (Liu and others 1997):
K = CS/CL (1)
where, CS and CL are the solute concentrations in the ice and solu-tion phases, respectively. At the moment when the solution volumeis VL in the process of freeze-concentration, the following equationis obtained from the mass balance of the solute.
CLVL = –CSdVL + (CL + dCL)(VL + dVL) (2)
From Eq. 1 and 2,
(3)
When the effective partition coefficient, K, is constant during theconcentration process, Eq. 3 can be integrated to be:
(1–K) ln (VL/V0) = ln(C0/CL) (4)
MS 20050252 Submitted 5/2/05, Revised 6/28/05, Accepted 8/11/05. AuthorsGu and Suzuki are with Dept. of Food Science and Technology, Tokyo Univ.of Marine Science and Technology, Tokyo, Japan. Author Miyawaki is withDept. of Food Science, Ishikawa Prefectural Univ., 1-308 Suematsu, Nonoichi,Ishikawa 921-8836, Japan. Direct inquiries to author Miyawaki (E-mail:[email protected]).
Vol. 70, Nr. 9, 2005—JOURNAL OF FOOD SCIENCE E547URLs and E-mail addresses are active links at www.ift.org
E: Fo
od En
ginee
ring &
Phys
ical P
rope
rties
Limiting partition coefficient . . .
According to the concentration polarization model, the followingequation is obtained from the mass balance equation of solute inthe boundary layer near the ice-liquid interface in the solutionphase (Burton and others 1953; Miyawaki and others 1998):
–D(dC/dx) + uC = uCS (5)
where D is the diffusion coefficient of solute, C is the solute concen-tration in the boundary layer, and u is the advance rate of ice front(ice growth rate).
The limiting partition coefficient of solute between ice and liq-uid phase at the ice-liquid interface is defined by:
K0 = CS/Ci (6)
where, Ci is the solute concentration in the solution phase at thevery interface between ice and liquid. Then, the effective partitioncoefficient (K) could be expressed as a function of the advance rateof the ice front and the mass transfer coefficient, k (= D/�; � = thick-ness of boundary layer), at the ice-liquid interface as follows:
K = K0/[K0 + (1 – K0)exp(–u/k)] (7)
where k has been correlated with the stirring rate, N, by the follow-ing equation (Miyawaki and others 1998):
k = aN0.2 (8)
From Eq. 7 and 8, the following equation is obtained:
ln(1/K – 1) = ln(1/K0 – 1) – (1/a)(u/N0.2) (9)
This means that a linear dependence of ln (1/K – 1) is expected tothe combined parameter of u/N0.2 and the limiting partition coeffi-cient, K0, is obtained from the extrapolation of the linear plot to u/N0.2→0, which corresponds to the infinitesimal ice growth rate and/or the infinite stirring rate at the ice-liquid interface.
Materials and Methods
MaterialsMaterialsMaterialsMaterialsMaterialsD-(+)-Glucose was purchased from Nacalai Tesque (Kyoto, Ja-
pan). Blue Dextran was obtained from Sigma Chemical (St. Louis,Mo., U.S.A.). Sodium chloride, potassium chloride, potassium ni-trate, potassium fluoride, lithium chloride, and cesium chloridewere purchased from Kanto Chemical (Tokyo, Japan). DextranT2000 was from Pharmacia Biotech (Tokyo, Japan).
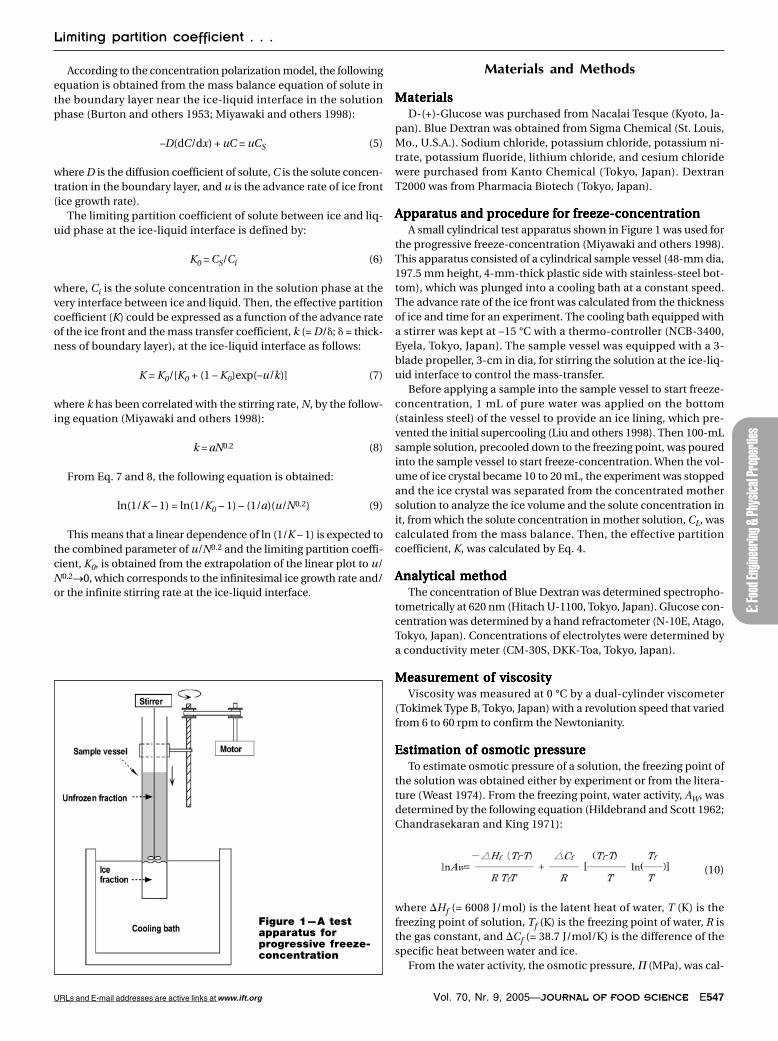
Apparatus and procedure for freeze-concentrationApparatus and procedure for freeze-concentrationApparatus and procedure for freeze-concentrationApparatus and procedure for freeze-concentrationApparatus and procedure for freeze-concentrationA small cylindrical test apparatus shown in Figure 1 was used for
the progressive freeze-concentration (Miyawaki and others 1998).This apparatus consisted of a cylindrical sample vessel (48-mm dia,197.5 mm height, 4-mm-thick plastic side with stainless-steel bot-tom), which was plunged into a cooling bath at a constant speed.The advance rate of the ice front was calculated from the thicknessof ice and time for an experiment. The cooling bath equipped witha stirrer was kept at –15 °C with a thermo-controller (NCB-3400,Eyela, Tokyo, Japan). The sample vessel was equipped with a 3-blade propeller, 3-cm in dia, for stirring the solution at the ice-liq-uid interface to control the mass-transfer.
Before applying a sample into the sample vessel to start freeze-concentration, 1 mL of pure water was applied on the bottom(stainless steel) of the vessel to provide an ice lining, which pre-vented the initial supercooling (Liu and others 1998). Then 100-mLsample solution, precooled down to the freezing point, was pouredinto the sample vessel to start freeze-concentration. When the vol-ume of ice crystal became 10 to 20 mL, the experiment was stoppedand the ice crystal was separated from the concentrated mothersolution to analyze the ice volume and the solute concentration init, from which the solute concentration in mother solution, CL, wascalculated from the mass balance. Then, the effective partitioncoefficient, K, was calculated by Eq. 4.
Analytical methodAnalytical methodAnalytical methodAnalytical methodAnalytical methodThe concentration of Blue Dextran was determined spectropho-
tometrically at 620 nm (Hitach U-1100, Tokyo, Japan). Glucose con-centration was determined by a hand refractometer (N-10E, Atago,Tokyo, Japan). Concentrations of electrolytes were determined bya conductivity meter (CM-30S, DKK-Toa, Tokyo, Japan).
Measurement of viscosityMeasurement of viscosityMeasurement of viscosityMeasurement of viscosityMeasurement of viscosityViscosity was measured at 0 °C by a dual-cylinder viscometer
(Tokimek Type B, Tokyo, Japan) with a revolution speed that variedfrom 6 to 60 rpm to confirm the Newtonianity.
Estimation of osmotic pressureEstimation of osmotic pressureEstimation of osmotic pressureEstimation of osmotic pressureEstimation of osmotic pressureTo estimate osmotic pressure of a solution, the freezing point of
the solution was obtained either by experiment or from the litera-ture (Weast 1974). From the freezing point, water activity, AW, wasdetermined by the following equation (Hildebrand and Scott 1962;Chandrasekaran and King 1971):
(10)
where �Hf (= 6008 J/mol) is the latent heat of water, T (K) is thefreezing point of solution, Tf (K) is the freezing point of water, R isthe gas constant, and �Cf (= 38.7 J/mol/K) is the difference of thespecific heat between water and ice.
From the water activity, the osmotic pressure, � (MPa), was cal-
Figure 1—A testapparatus forprogressive freeze-concentration
E548 JOURNAL OF FOOD SCIENCE—Vol. 70, Nr. 9, 2005 URLs and E-mail addresses are active links at www.ift.org
E: Food Engineering & Physical Properties
Limiting partition coefficient . . .
culated by the following equation:
(11)
where vW (= 18.018 cm3/mol) is the molar volume of water.
Results and Discussion
Limiting partition coefficient for glucoseLimiting partition coefficient for glucoseLimiting partition coefficient for glucoseLimiting partition coefficient for glucoseLimiting partition coefficient for glucosein the single-component systemin the single-component systemin the single-component systemin the single-component systemin the single-component system
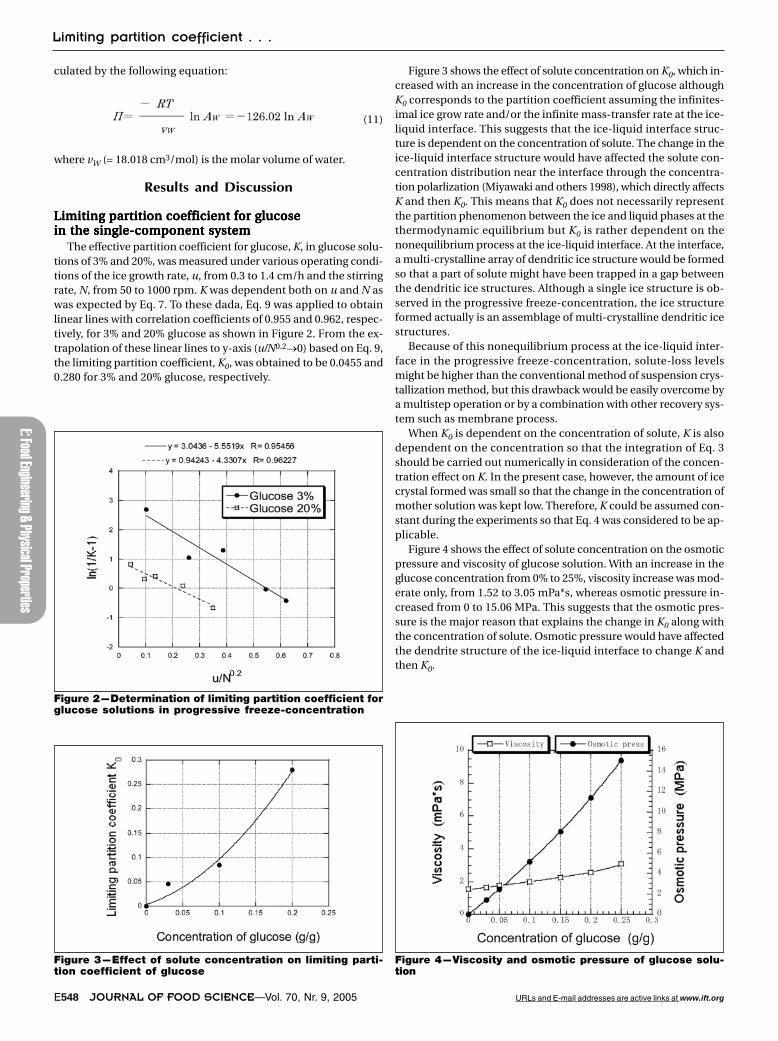
The effective partition coefficient for glucose, K, in glucose solu-tions of 3% and 20%, was measured under various operating condi-tions of the ice growth rate, u, from 0.3 to 1.4 cm/h and the stirringrate, N, from 50 to 1000 rpm. K was dependent both on u and N aswas expected by Eq. 7. To these dada, Eq. 9 was applied to obtainlinear lines with correlation coefficients of 0.955 and 0.962, respec-tively, for 3% and 20% glucose as shown in Figure 2. From the ex-trapolation of these linear lines to y-axis (u/N0.2→0) based on Eq. 9,the limiting partition coefficient, K0, was obtained to be 0.0455 and0.280 for 3% and 20% glucose, respectively.
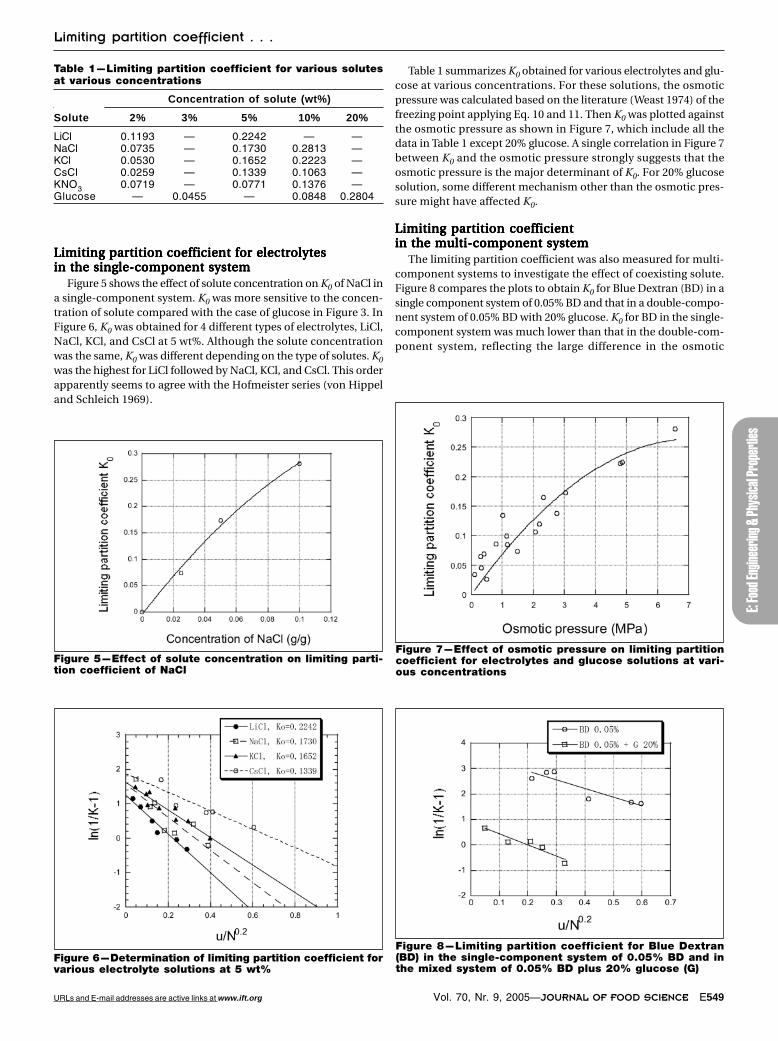
Figure 3 shows the effect of solute concentration on K0, which in-creased with an increase in the concentration of glucose althoughK0 corresponds to the partition coefficient assuming the infinites-imal ice grow rate and/or the infinite mass-transfer rate at the ice-liquid interface. This suggests that the ice-liquid interface struc-ture is dependent on the concentration of solute. The change in theice-liquid interface structure would have affected the solute con-centration distribution near the interface through the concentra-tion polarlization (Miyawaki and others 1998), which directly affectsK and then K0. This means that K0 does not necessarily representthe partition phenomenon between the ice and liquid phases at thethermodynamic equilibrium but K0 is rather dependent on thenonequilibrium process at the ice-liquid interface. At the interface,a multi-crystalline array of dendritic ice structure would be formedso that a part of solute might have been trapped in a gap betweenthe dendritic ice structures. Although a single ice structure is ob-served in the progressive freeze-concentration, the ice structureformed actually is an assemblage of multi-crystalline dendritic icestructures.
Because of this nonequilibrium process at the ice-liquid inter-face in the progressive freeze-concentration, solute-loss levelsmight be higher than the conventional method of suspension crys-tallization method, but this drawback would be easily overcome bya multistep operation or by a combination with other recovery sys-tem such as membrane process.
When K0 is dependent on the concentration of solute, K is alsodependent on the concentration so that the integration of Eq. 3should be carried out numerically in consideration of the concen-tration effect on K. In the present case, however, the amount of icecrystal formed was small so that the change in the concentration ofmother solution was kept low. Therefore, K could be assumed con-stant during the experiments so that Eq. 4 was considered to be ap-plicable.
Figure 4 shows the effect of solute concentration on the osmoticpressure and viscosity of glucose solution. With an increase in theglucose concentration from 0% to 25%, viscosity increase was mod-erate only, from 1.52 to 3.05 mPa*s, whereas osmotic pressure in-creased from 0 to 15.06 MPa. This suggests that the osmotic pres-sure is the major reason that explains the change in K0 along withthe concentration of solute. Osmotic pressure would have affectedthe dendrite structure of the ice-liquid interface to change K andthen K0.
Figure 2—Determination of limiting partition coefficient forglucose solutions in progressive freeze-concentration
Figure 3—Effect of solute concentration on limiting parti-tion coefficient of glucose
Figure 4—Viscosity and osmotic pressure of glucose solu-tion
Vol. 70, Nr. 9, 2005—JOURNAL OF FOOD SCIENCE E549URLs and E-mail addresses are active links at www.ift.org
E: Fo
od En
ginee
ring &
Phys
ical P
rope
rties
Limiting partition coefficient . . .
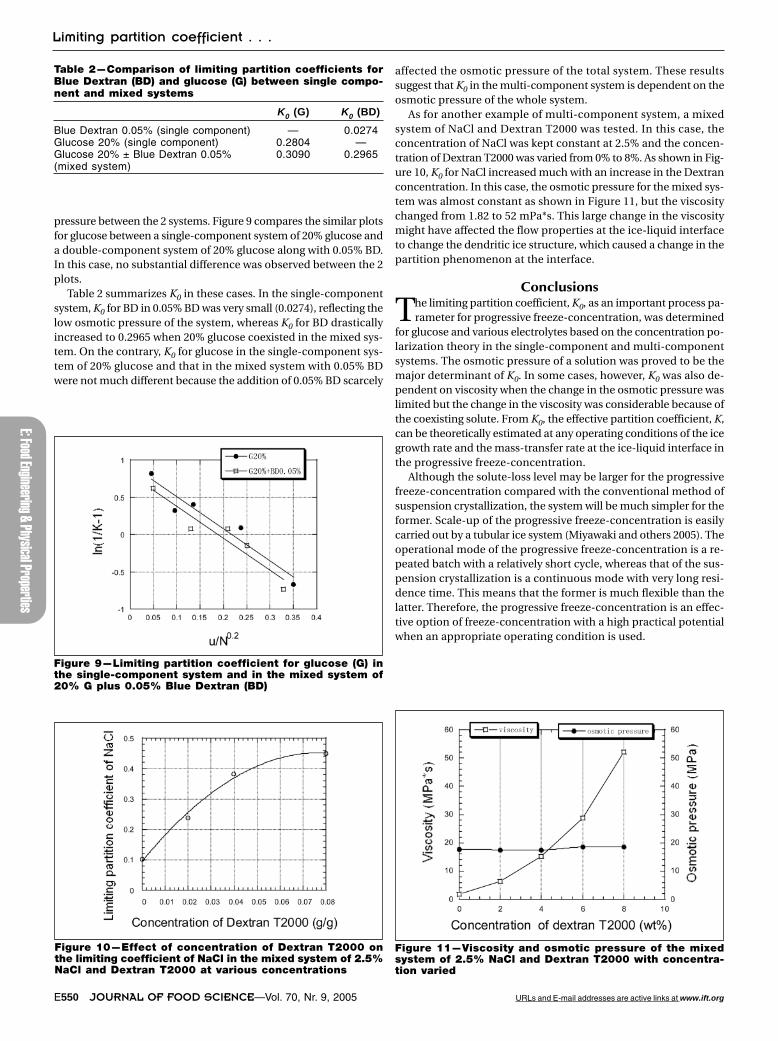
Limiting partition coefficient for electrolytesLimiting partition coefficient for electrolytesLimiting partition coefficient for electrolytesLimiting partition coefficient for electrolytesLimiting partition coefficient for electrolytesin the single-component systemin the single-component systemin the single-component systemin the single-component systemin the single-component system
Figure 5 shows the effect of solute concentration on K0 of NaCl ina single-component system. K0 was more sensitive to the concen-tration of solute compared with the case of glucose in Figure 3. InFigure 6, K0 was obtained for 4 different types of electrolytes, LiCl,NaCl, KCl, and CsCl at 5 wt%. Although the solute concentrationwas the same, K0 was different depending on the type of solutes. K0
was the highest for LiCl followed by NaCl, KCl, and CsCl. This orderapparently seems to agree with the Hofmeister series (von Hippeland Schleich 1969).
Table 1 summarizes K0 obtained for various electrolytes and glu-cose at various concentrations. For these solutions, the osmoticpressure was calculated based on the literature (Weast 1974) of thefreezing point applying Eq. 10 and 11. Then K0 was plotted againstthe osmotic pressure as shown in Figure 7, which include all thedata in Table 1 except 20% glucose. A single correlation in Figure 7between K0 and the osmotic pressure strongly suggests that theosmotic pressure is the major determinant of K0. For 20% glucosesolution, some different mechanism other than the osmotic pres-sure might have affected K0.
Limiting partition coefficientLimiting partition coefficientLimiting partition coefficientLimiting partition coefficientLimiting partition coefficientin the multi-component systemin the multi-component systemin the multi-component systemin the multi-component systemin the multi-component system
The limiting partition coefficient was also measured for multi-component systems to investigate the effect of coexisting solute.Figure 8 compares the plots to obtain K0 for Blue Dextran (BD) in asingle component system of 0.05% BD and that in a double-compo-nent system of 0.05% BD with 20% glucose. K0 for BD in the single-component system was much lower than that in the double-com-ponent system, reflecting the large difference in the osmotic
Figure 5—Effect of solute concentration on limiting parti-tion coefficient of NaCl
Figure 6—Determination of limiting partition coefficient forvarious electrolyte solutions at 5 wt%
Figure 7—Effect of osmotic pressure on limiting partitioncoefficient for electrolytes and glucose solutions at vari-ous concentrations
Figure 8—Limiting partition coefficient for Blue Dextran(BD) in the single-component system of 0.05% BD and inthe mixed system of 0.05% BD plus 20% glucose (G)
Table 1—Limiting partition coefficient for various solutesat various concentrations
Concentration of solute (wt%)
Solute 2% 3% 5% 10% 20%
LiCl 0.1193 — 0.2242 — —NaCl 0.0735 — 0.1730 0.2813 —KCl 0.0530 — 0.1652 0.2223 —CsCl 0.0259 — 0.1339 0.1063 —KNO3 0.0719 — 0.0771 0.1376 —Glucose — 0.0455 — 0.0848 0.2804
E550 JOURNAL OF FOOD SCIENCE—Vol. 70, Nr. 9, 2005 URLs and E-mail addresses are active links at www.ift.org
E: Food Engineering & Physical Properties
Limiting partition coefficient . . .
pressure between the 2 systems. Figure 9 compares the similar plotsfor glucose between a single-component system of 20% glucose anda double-component system of 20% glucose along with 0.05% BD.In this case, no substantial difference was observed between the 2plots.
Table 2 summarizes K0 in these cases. In the single-componentsystem, K0 for BD in 0.05% BD was very small (0.0274), reflecting thelow osmotic pressure of the system, whereas K0 for BD drasticallyincreased to 0.2965 when 20% glucose coexisted in the mixed sys-tem. On the contrary, K0 for glucose in the single-component sys-tem of 20% glucose and that in the mixed system with 0.05% BDwere not much different because the addition of 0.05% BD scarcely
affected the osmotic pressure of the total system. These resultssuggest that K0 in the multi-component system is dependent on theosmotic pressure of the whole system.
As for another example of multi-component system, a mixedsystem of NaCl and Dextran T2000 was tested. In this case, theconcentration of NaCl was kept constant at 2.5% and the concen-tration of Dextran T2000 was varied from 0% to 8%. As shown in Fig-ure 10, K0 for NaCl increased much with an increase in the Dextranconcentration. In this case, the osmotic pressure for the mixed sys-tem was almost constant as shown in Figure 11, but the viscositychanged from 1.82 to 52 mPa*s. This large change in the viscositymight have affected the flow properties at the ice-liquid interfaceto change the dendritic ice structure, which caused a change in thepartition phenomenon at the interface.
Conclusions
The limiting partition coefficient, K0, as an important process pa-rameter for progressive freeze-concentration, was determined
for glucose and various electrolytes based on the concentration po-larization theory in the single-component and multi-componentsystems. The osmotic pressure of a solution was proved to be themajor determinant of K0. In some cases, however, K0 was also de-pendent on viscosity when the change in the osmotic pressure waslimited but the change in the viscosity was considerable because ofthe coexisting solute. From K0, the effective partition coefficient, K,can be theoretically estimated at any operating conditions of the icegrowth rate and the mass-transfer rate at the ice-liquid interface inthe progressive freeze-concentration.
Although the solute-loss level may be larger for the progressivefreeze-concentration compared with the conventional method ofsuspension crystallization, the system will be much simpler for theformer. Scale-up of the progressive freeze-concentration is easilycarried out by a tubular ice system (Miyawaki and others 2005). Theoperational mode of the progressive freeze-concentration is a re-peated batch with a relatively short cycle, whereas that of the sus-pension crystallization is a continuous mode with very long resi-dence time. This means that the former is much flexible than thelatter. Therefore, the progressive freeze-concentration is an effec-tive option of freeze-concentration with a high practical potentialwhen an appropriate operating condition is used.
Figure 9—Limiting partition coefficient for glucose (G) inthe single-component system and in the mixed system of20% G plus 0.05% Blue Dextran (BD)
Table 2—Comparison of limiting partition coefficients forBlue Dextran (BD) and glucose (G) between single compo-nent and mixed systems
K0 (G) K0 (BD)
Blue Dextran 0.05% (single component) — 0.0274Glucose 20% (single component) 0.2804 —Glucose 20% ± Blue Dextran 0.05% 0.3090 0.2965(mixed system)
Figure 10—Effect of concentration of Dextran T2000 onthe limiting coefficient of NaCl in the mixed system of 2.5%NaCl and Dextran T2000 at various concentrations
Figure 11—Viscosity and osmotic pressure of the mixedsystem of 2.5% NaCl and Dextran T2000 with concentra-tion varied
Vol. 70, Nr. 9, 2005—JOURNAL OF FOOD SCIENCE E551URLs and E-mail addresses are active links at www.ift.org
E: Fo
od En
ginee
ring &
Phys
ical P
rope
rties
Limiting partition coefficient . . .
ReferencesBae SK, Miyawaki O, Arai S. 1994. Control of freezing front structure and its
effect on the concentration-efficiency in the progressive freeze-concentra-tion. Cryobiol Cryotechnol 40:29–32.
Burton JA, Prim RC, Slichter WP. 1953. The distribution of solute in crystals grownfrom the melt. Part I. Theoretical. J Chem Phys 21:1987–91.
Chandrasekaran SK, King CJ. 1971. Solid-liquid phase equilibria in multicom-ponent aqueous sugar solutions. J Food Sci 36:699–704.
Deshpande SS, Bolin HR, Salunkhe DK. 1982. Freeze concentration of fruit juic-es. Food Technol (May):68–82.
Hartel W, Chung MS. 1993. Contact nucleation of ice in fluid dairy products. J FoodEng 18:281–96.
Hildebrand JH, Scott RL. 1962. Regular solutions. Engelwood Cliffs, N.J.: PrenticeHall. p 20.
Huige NJJ, Thijssen HAC. 1972. Production of Large crystals by continuous rip-ening in a stirred tank. J Crystal Growth 13–14:483–7.
Lemmer S, Klomp R, Ruemekorf R, Scolz R. 2001. Preconcentration of wastewaterthrough the Niro freeze concentration process. Chem Eng Technol 24:485–8.
Liu L, Fujii T, Hayakawa K, Miyawaki O. 1998. Prevention of initial supercoolingin progressive freeze-concentration. Biosci Biotechnol Biochem 62(12):2467–9.
Liu L, Miyawaki O, Hayakawa K. 1999. Progressive freeze-concentration of to-mato juice. Food Sci Technol Res 5(1):108–12.
Matthews JS, Coggeshall ND. 1959. Concentration of impurities from organiccompounds by progressive freezing. Anal Chem 31:1124–5.
Miyawaki O, Liu L, Nakamura K. 1998. Effective partition constant of solute be-
tween ice and liquid phases in progressive freeze-concentration. J Food Sci63(5):756–8.
Miyawaki O, Liu L, Shirai Y, Sakashita S, Kagitani K. 2005. Tubular ice system forscale-up of progressive freeze-concentration. J Food Eng 69:107–13.
Muller M, Sekoulov I. 1992. Waste water reuse by freeze concentration with afalling film reactor. Wat Sci Technol 26:1475–82.
Omran AM, King CJ. 1974. Kinetics of ice crystallization in sugar solution andfruit juices. AIChE J 20:795–803.
Pradistsuwana C, Theprugsa P, Miyawaki O. 2003. Measurement of limiting par-tition coefficient in progressive freeze-concentration. Food Sci Technol Res9(2):190–2.
Ramteke RS, Singh NI, Rekha MN, Eipeson WE. 1993. Methods for concentrationof fruit juices: a critical evaluation. J Food Sci Technol 30:391–402.
Rodriguez M, Luque S, Alvarez JR, Coca J. 2000. A comparative study of reverseosmosis and freeze concentration for the removal of valeric acid from waste-waters. Desalination 127:1–11.
Shirai Y, Wakisaka M, Miyawaki O, Sakashita S. 1999. Effect of seed ice on forma-tion of tube ice with high purity for a freeze wastewater treatment system witha bubble-flow circulator. Wat Res 33:1325–9.
von Hippel PH, Schleich T. 1969. Ion effects on the solution. Acc Chem Res 2:257–65.Wakisaka M, Sirai Y, Sakashita S. 2001. Ice crystallization in a pilot-scale waste-
water treatment system. Chem Eng Process 40:201–8.Weast RC, editor. 1974. Handbook of chemistry and physics. Cleveland, Ohio:
CRC Press. p 218–67.