limits on the optical brightness of the eridani...
TRANSCRIPT

LIMITS ON THE OPTICAL BRIGHTNESS OF THE � ERIDANI DUST RING1
Charles R. Proffitt2
Science Programs, Computer Sciences Corporation, 3700 San Martin Drive, Baltimore, MD 21218; [email protected]
Kailash Sahu, Mario Livio, John Krist, Daniela Calzetti, and Ron Gilliland
Space Telescope Science Institute, Baltimore, MD 21218
Carol Grady3
NOAO/STIS, Code 681, NASA Goddard Space Flight Center, Greenbelt, MD 20771
Don Lindler
Sigma Research and Engineering, Lanham, MD 20706
Bruce Woodgate,4Sara Heap,
4Mark Clampin, and Theodore R. Gull
4
Laboratory for Astronomy and Solar Physics, Code 681, NASA Goddard Space Flight Center, Greenbelt, MD 20771
and
Casey M. Lisse
Department of Astronomy, University of Maryland, College Park, MD 20742
Receivved 2004 March 2; accepted 2004 May 13
ABSTRACT
The STIS CCD camera on the Hubble Space Telescope (HST ) was used to take deep optical images near theK2 V main-sequence star � Eridani in an attempt to find an optical counterpart of the dust ring previously imagedby submillimeter observations. Upper limits for the optical brightness of the dust ring are determined anddiscussed in the context of the scattered starlight expected from plausible dust models. We find that even if thedust is smoothly distributed in symmetrical rings, the optical surface brightness of the dust, as measured with theHST STIS CCD clear aperture at 55 AU from the star, cannot be brighter than about 25 STMAG arcsec�2. Thisupper limit excludes some solid-grain models for the dust ring that can fit the IR and submillimeter data.Magnitudes and positions for �59 discrete objects between 12B5 and 5800 from � Eri are reported. Most if not allof these objects are likely to be background stars and galaxies.
Subject headinggs: circumstellar matter — stars: individual (� Eridani)
1. INTRODUCTION
A substantial fraction (�15%) of main-sequence stars showevidence of excess IR or submillimeter flux due to thermalemission from dust located at distances of 30 AU or more fromthe stars; i.e., locations comparable to that of the Kuiper Belt inour own solar system. This was first discovered using IRASobservations (e.g., Aumann et al. 1984; Aumann 1985; Gillett& Aumann 1983), and subsequent observations with the JamesClarke Maxwell Telescope’s Submillimeter Common-UserBolometer Array (JCMT SCUBA) have directly imaged thedust distribution in a few of these systems (Holland et al.1998), including � Eri (Greaves et al. 1998).
� Eridani is a K2 V main-sequence star at a distance ofabout 3.2 pc. It is believed to be a relatively young system(<1 Gyr; Song et al. 2000; Soderblom & Dappen 1989), witha mass slightly less than our own Sun. From radial velocitymeasurements, Hatzes et al. (2000) have reported evidence for
a planet in this system with a semimajor axis of 3.4 AU andm sin i ¼ 0:86MJ.
The 850 �m observations of Greaves et al. (1998) show aringlike structure around � Eri. The maximum surface bright-ness of this ring is located at a radius of�1700 (55 AU) from thestar, with some flux extending out as far as 3600 (115 AU). Theobserved 850 �m flux shows the ring to be asymmetrical, withseveral bright clumps. It has been suggested that structures ofthis kind can be caused by resonant interactions of dust withplanets in or near the ring (Liou & Zook 1999; Ozernoy et al.2000; Quillen & Thorndike 2002).
In an attempt to detect an optical counterpart of this ring, weundertook observations with the Hubble Space Telescope’sSpace Telescope Imaging Spectrograph (HST STIS) of � Eri,using this instrument’s CCD camera, as part of HST GOprogram 9037 (PI: Mario Livio). A full description of theSTIS instrument can be found in Kim Quijano et al. (2003).
While this camera can be used with a number of corona-graphic wedges, saturation of the detector by the wings of thestellar point-spread function (PSF) near the edges of the wedgewould severely limit the exposure time achievable in a singleimage. Therefore, we instead used the 5200 ; 5200 clear CCDaperture and placed the star�500 off the edge of the detector. TheK0 IV star � Eri was also observed as a PSF comparison star.
1.1. Details of Prevvious Observvations
Gillett (1986) reconsidered the IRAS observations of � Eriand concluded that the intrinsic FWHM of the source flux at
1 Based on observations made with the NASA/ESA Hubble Space Tele-scope, obtained at the Space Telescope Science Institute, which is operated bythe Association of Universities for Research in Astronomy, Inc., under NASAcontract NAS 5-26555. These observations are associated with proposalGO-09037.
2 Also at: Space Telescope Science Institute, and Institute for Astrophysicsand Computational Science at the Catholic University of America.
3 Also at: Eureka Scientific, 2452 Delmer Street, Suite 100, Oakland, CA94602-3017.
4 Member of Space Telescope Imaging Spectrograph Investigation Defi-nition Team.
481
The Astrophysical Journal, 612:481–495, 2004 September 1
# 2004. The American Astronomical Society. All rights reserved. Printed in U.S.A.

60 �m was less than 1700 in the IRAS scan direction and lessthan 1100 in the perpendicular direction. If this suggestion iscorrect, it would imply that the bulk of the IRAS emissioncomes from a region inside of the ring detected by Greaveset al. (1998). However, both the submillimeter ring and theIRAS size limits suggested by Gillett are significantly smallerthan the nominal IRAS 60 �m resolution at of about 10
(Beichman et al. 1985), and therefore Gillett’s conclusionsshould be treated cautiously.
Greaves et al. (1998) observed the system with SCUBA atboth 850 and 450 �m. The 850 �m observations used a beamof 1500 FWHM, and Greaves et al. published smoothed ver-sions of the images produced by these observations. The S/Nof the 450 �m observations is too low to give any usefulspatial information (no image was published), but it doessupply a useful measure of the total flux.
Schutz et al. (2004) obtained 1200 �m measurements usinga 2500 beam, which are consistent with Greave et al.’s mea-surements. Several previous submillimeter observations (Chiniet al. 1990, 1991; Zuckerman & Becklin 1993) at variouswavelengths (800–1300 �m) had used single pointings withbeam sizes and background chopping too small to properlymeasure the structure detected by Greaves et al. (see alsoWeintraub & Stern 1994). While these observations may pro-vide some useful constraints, they cannot be used as directmeasures of the flux and are not further considered here.
We summarize the IRAS, Greaves et al. (1998), and Schutzet al. (2004) data in Table 1. In this table we adopt Greaveset al’s color corrections, as well as their corrections for thestellar contribution to the total flux, and present only the fluxattributed to the dust alone.
At 55 AU, the IRAS and SCUBA data imply grain temper-atures of about 30 K, close to the equilibrium blackbodytemperature. The very flat 450 �m to 850 �m flux ratio (4:6�2:6) requires the presence of large grains (>100 �m), which canemit efficiently at submillimeter wavelengths. At this distance,the timescale for the orbital decay of 100 �m grains due to the
Poynting-Robertson effect is about 7 ; 108 yr, a timescale thatis comparable to the inferred age of the system. This wouldseem to argue against a substantial population of smaller grainsin the outer parts of the system. However, recent works onvarious debris disk systems (e.g., Wyatt et al. 1999; Li et al.2003) have shown that this kind of interpretation is overlysimplistic. The submillimeter emissivity of grains drops rap-idly enough with decreasing grain size that a substantial pop-ulation of smaller grains has little effect on the submillimeterflux ratios, and the collision and fragmentation rate of the largegrains required by the submillimeter data is still high enough toreplenish the smaller grains faster than the Poynting-Robertsoneffect can remove them. We will see that the nature and abun-dance of these smaller grains has dramatic effects on the opticaldetectability of the dust in the � Eri system.
2. DESCRIPTION OF THE OBSERVATIONS
The HST observations in this program were made on 2002January 26, using six adjacent single-orbit visits (see Table 2).In each visit, after taking an ACQ exposure to determine theposition of the targeted star, 15 offset exposures of 109 s eachwere taken using the unfiltered STIS CCD in imaging mode.During these offset exposures the bright star was located about500 off the detector (near CCD pixel coordinates x ¼ 1127, y ¼514). The first and last orbits were used to observe the PSFof the comparison star, � Eri, at two different orientationsdiffering by 30
�. The four intermediate orbits were used to
observe the primary target at four different orientations sepa-rated by 10� intervals. In each of these latter exposures, theposition of the brightest submillimeter clump observed byGreaves et al. (1998) was imaged on the 1024 ; 1024 pixeldetector.The clear aperture used with the STIS CCD is designated as
the ‘‘50CCD’’ aperture in STIS documentation. It has a fieldof view of almost 5200 ; 5200, and has a very broad bandpass,with significant throughput from about 2000 to 10200 8.Prior to the installation of the Advanced Camera for Surveys
TABLE 1
IR and Submillimeter Measurements of Dust around � Eri
Wavelength
(�m)
Dust Flux
(mJy) Source Comments
1200............................. 21.4� 5.1 Schutz et al. (2004)
850............................... 40� 3 Greaves et al. (1998)
450............................... 185� 103 Greaves et al. (1998)
100............................... 1780 IRAS Photospheric Cflux subtracted
60................................. 1340 IRAS Photospheric Cflux subtracted
25................................. 270 IRAS Photospheric Cflux subtracted
TABLE 2
Deep Offset 50CCD Observations
Target Data Set R.A. Decl.
y-axis Orientation
(deg. E of N)
Expected Clump
Location
(pixels)
� Eri OFF1.............. o6eo01020 03 43 16.95 �09 45 52.09 10.0544 . . .� Eri OFF1 .............. o6eo02020 03 32 57.75 �09 27 35.20 10.0546 735, 446
� Eri OFF2 .............. o6eo03020 03 32 57.66 �09 27 40.42 20.0547 729, 515
� Eri OFF3 .............. o6eo04020 03 32 57.50 �09 27 45.31 30.0548 734, 584
� Eri OFF4 .............. o6eo05020 03 32 57.29 �09 27 49.74 40.0550 752, 651
� Eri OFF4.............. o6eo06020 03 43 16.49 �09 46 06.64 40.0548 . . .
PROFFITT ET AL.482 Vol. 612

(ACS), STIS 50CCD observations provided the most sensi-tive HST mode for deep imaging. We will, for the most part,give our observed STIS magnitudes in STMAG units, wherethe magnitude is defined as �2:5 log (Fk)� 21:10, with Fk inergs s�1 cm�2 8�1. For STIS 50CCD imaging, the conversionto a magnitude system that uses Vega as the zero point isVEGAMAG(50CCD) ¼ STMAG(50CCD)� 0:36. In addition,at the beginning of each orbit a very short observation wastaken of each star using the STIS CCD with the F25ND3 filter(Table 3).
3. DATA ANALYSIS
3.1. Basic Analysis
The standard STIS pipeline software was used to producebias- and dark-subtracted and flat-fielded images of individ-ual subexposures (flt files). Comparison with median filteredimages was done to identify and correct hot pixels that werenot handled properly in the standard analysis; about 0.5% ofpixels were corrected in this way.
Each of the 15 subexposure flt files was rearranged into fiveseparate files, each containing three adjacent subexposures,and these files were input into the STSDAS STIS routineocrreject to produce five separate cosmic-ray-rejected (crj)files for each of the six visits: 30 crj files in total.
In each of these crj files, the two diffraction spikes from thestar (� Eri or � Eri) located 500 off the edge of the detector arethe brightest features visible. These were used to register theimages. As we are primarily interested in the relative offsetsbetween the images, any small systematic offset from the reallocation of the star relative to the detector is unimportant. Eachof the 30 crj files was then shifted so as to put the intersectionof the diffraction spikes at the mean location measured forall visits. The shifts applied were up to �0.7 pixels in x and�0.3 pixels in y. Because we wanted to distort the high S/Npattern of the PSF as little as possible, we shifted the imagesusing a seven-point sinc interpolation function with the IRAFimshift routine. The shifted crj files for each visit were thencombined by again using the STIS ocrreject routine, producinga single aligned crj file for each visit.
We investigated whether there was any advantage in shift-ing each individual subexposure, rather than combining themfirst by groups of three before shifting and coadding, but thisdoes not appear to significantly improve the final co-addedimage.
3.2. PSF Subtraction
Subtraction of the PSF from the wings of the a bright star isvery sensitive to small mismatches in the target and PSF star’sspectral energy distribution, as well as to small changes intelescope focus and breathing (i.e., changes in image quality
caused by flexure of HST and STIS optical elements). Weuse two separate techniques to subtract � Eri’s PSF. Roll-deconvolution techniques use the target as its own PSF star,by taking back-to-back observations at different orientations.Direct subtraction of the � Eri and � Eri observations is alsodone. A comparison of different PSF subtraction techniques forSTIS coronagraphic observations was done by Grady et al.(2003), and much of their discussion is also relevant here.
3.2.1. Roll Deconvvolution of � Eri
The goal of the roll deconvolution is to use images taken atdifferent orientations to separate the real sky image from thePSF of the bright nearby star. This technique eliminates anyproblem with mismatches in the shape of the PSF due todifferences in the spectral energy distributions, but it has thedisadvantage that any circularly symmetric features or arclikestructures larger than the change in roll angle will be includedwith the PSF rather than as part of the sky image. Unfortu-nately, these are exactly the type of structures most likely in acircumstellar debris disk.
To obtain a first approximation to the PSF of � Eri, wecombined the four aligned and co-added � Eri crj images,rejecting points that were high or low by more than 3 � fromthe median value for that pixel location by using the IRAFimcombine routine with the ccdclip algorithm. As the imageswere not yet rotated to align them on the sky, this clips out realobjects as if they were cosmic rays. This trial PSF was thensubtracted from each of the original images. These subtractedimages were each rotated about the position of � Eri to align thepositions on the sky and then combined by taking a straightaverage of the values at each pixel, but with locations near themain diffraction spikes or the obstructed edges of the 50CCDaperture masked out of the average. We found that masking outa rather wide strip (about 3B4 in the diagonal direction) aroundthe main diffraction spikes gave the best results.
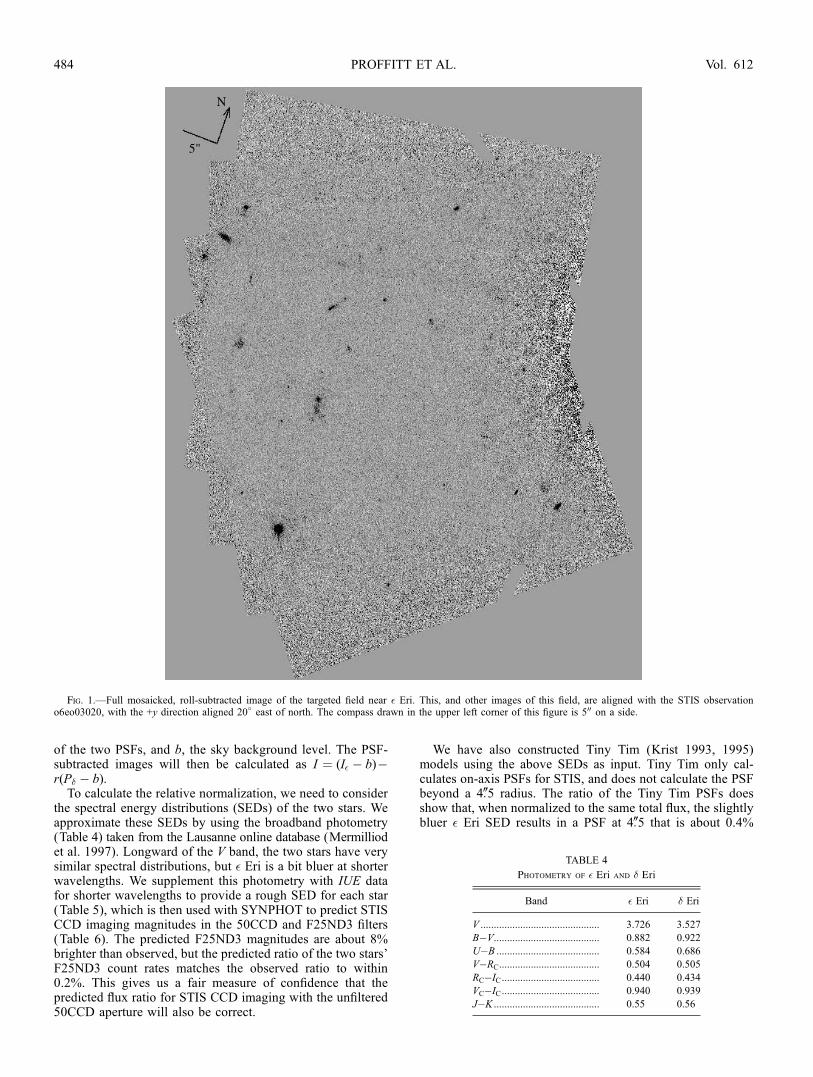
A number of faint objects are clearly visible in the field ofview (see Fig.1). A mask was created for each unrotated imagethat identifies pixels that are affected by real objects on thesky. A final PSF for � Eri was then made in the same way asthe initial PSF image, but with these sky objects masked outbefore taking the average. The new PSF was then subtractedfrom the shifted crj images, and the subtracted files were againrotated into alignment and averaged after masking out thediffraction spikes and aperture edges.
To summarize, we masked out the sky objects when aver-aging the unrotated and unsubtracted images to create the PSF,and then masked out the diffraction spikes and aperture edgeswhen averaging the rotated and PSF-subtracted images tocreate the image of the sky. In principle, this procedure couldbe iterated to refine the separation between the sky and PSFimages, but we simply use the second version of the sky andPSF images produced by this procedure.
3.2.2. Direct Subtraction of � and � Eri PSFs
3.2.2.1. � Eri PSF
The procedure used to produce the � Eri PSF was similar tothat used to produce the � Eri PSF. It was necessary to maskout a generous region around the brightest background star ineach of the two � Eri images to avoid introducing obviousartifacts in the subtraction.
3.2.2.2. Relative Normalization of the Two Stars
Before subtracting the � Eri PSF from the observations of� Eri, it is necessary to know both r, the relative normalization
TABLE 3
F25ND3 Observations
Target Data Set
Exposure Time
(s)
� Eri............................ o6eo01010 0.4
� Eri............................ o6eo02010 0.6
� Eri............................ o6eo03010 0.6
� Eri............................ o6eo04010 0.4
� Eri............................ o6eo05010 0.4
� Eri............................ o6eo06010 0.6
LIMITS ON BRIGHTNESS OF � ERI DUST RING 483No. 1, 2004
of the two PSFs, and b, the sky background level. The PSF-subtracted images will then be calculated as I ¼ (I� � b)�r(P� � b).
To calculate the relative normalization, we need to considerthe spectral energy distributions (SEDs) of the two stars. Weapproximate these SEDs by using the broadband photometry(Table 4) taken from the Lausanne online database (Mermilliodet al. 1997). Longward of the V band, the two stars have verysimilar spectral distributions, but � Eri is a bit bluer at shorterwavelengths. We supplement this photometry with IUE datafor shorter wavelengths to provide a rough SED for each star(Table 5), which is then used with SYNPHOT to predict STISCCD imaging magnitudes in the 50CCD and F25ND3 filters(Table 6). The predicted F25ND3 magnitudes are about 8%brighter than observed, but the predicted ratio of the two stars’F25ND3 count rates matches the observed ratio to within0.2%. This gives us a fair measure of confidence that thepredicted flux ratio for STIS CCD imaging with the unfiltered50CCD aperture will also be correct.
We have also constructed Tiny Tim (Krist 1993, 1995)models using the above SEDs as input. Tiny Tim only cal-culates on-axis PSFs for STIS, and does not calculate the PSFbeyond a 4B5 radius. The ratio of the Tiny Tim PSFs doesshow that, when normalized to the same total flux, the slightlybluer � Eri SED results in a PSF at 4B5 that is about 0.4%
Fig. 1.—Full mosaicked, roll-subtracted image of the targeted field near � Eri. This, and other images of this field, are aligned with the STIS observationo6eo03020, with the +y direction aligned 20� east of north. The compass drawn in the upper left corner of this figure is 500 on a side.
TABLE 4
Photometry of � Eri and � Eri
Band � Eri � Eri
V ............................................. 3.726 3.527
B�V........................................ 0.882 0.922
U�B ....................................... 0.584 0.686
V�RC...................................... 0.504 0.505
RC�IC..................................... 0.440 0.434
VC�IC..................................... 0.940 0.939
J�K ........................................ 0.55 0.56
PROFFITT ET AL.484 Vol. 612

lower than that of � Eri. Taking the predicted 50CCD ratio of0.837, and then assuming the same difference between thepredicted and observed ratios as was found for the directF25ND3 images (0:837� 0:845), would give an expectedratio of 0.839. Extrapolating the radial color difference foundin the Tiny Tim models, we estimate an additional correctionof about �0.005 near 1700, which yields an estimated nor-malization ratio of 0.834. If this ratio is adopted, it is alsonecessary to assume a mean sky background of �0.077 e�
pixel�1 s�1 if the farthest parts of the two PSFs are to match.This is comparable to the expected sky brightness.
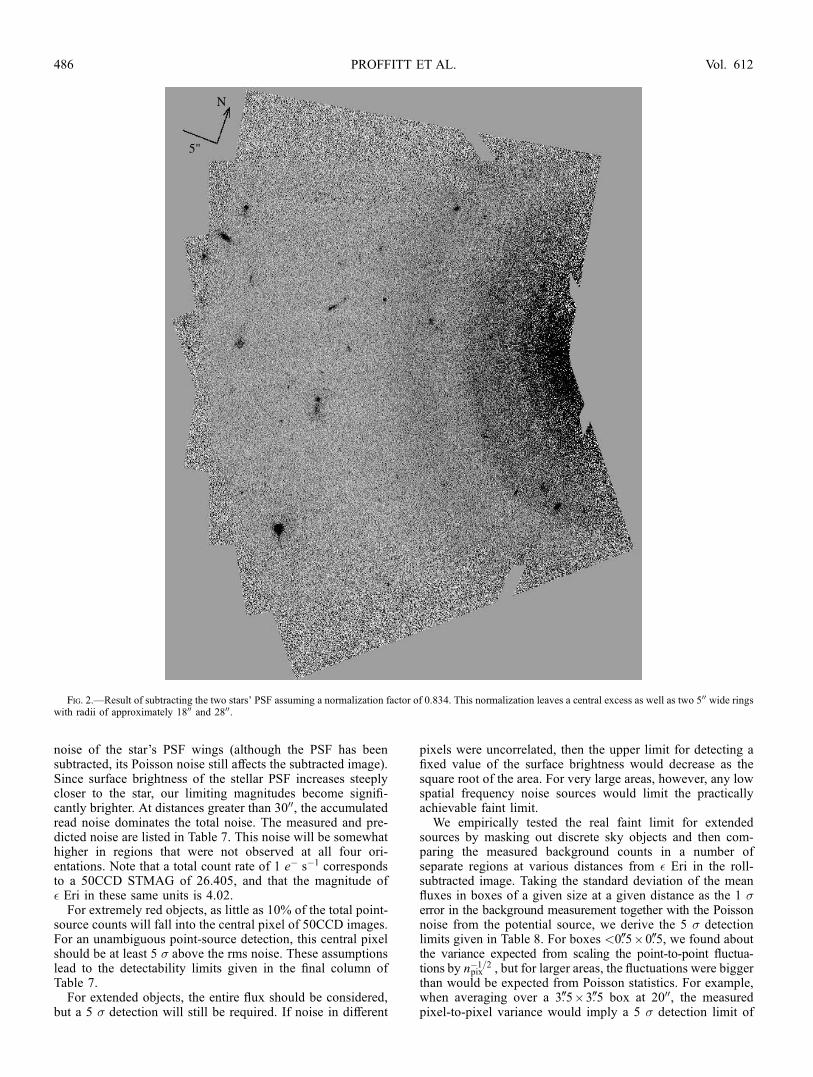
The results of this subtraction are shown in Figure 2. Thereappears to be substantial excess light near � Eri, amounting toabout 1% of the unsubtracted PSF at the same radius, and anumber of concentric rings are visible. To illustrate this diffusestructure, we took the difference between the � and � Eri PSFs(with the sky objects removed), and measured the mean sur-face brightness as a function of radius (Figs. 3 and 4). We canminimize the central halo around � Eri by increasing thenormalization constant to about 0.842 (see Fig. 5), but theconcentric rings remain, with a mean surface brightness of25.5 to 25 STMAG arcsec�2. If we assume that the ringsextend all the way around the star, this flatter normalizationcorresponds to a total integrated STMAG of 17.4 for the rings.
This structure seems suspiciously symmetrical to be con-sistent with the observed clumpiness in the submillimeterobservations, but the radial distribution of the flux, with abroad hump between 15 and 3000, is roughly consistent with theradial dependence of the 850 �m flux as shown in Figure 2 ofGreaves et al. (1998). The rings are broader than PSF sub-traction artifacts previously seen in STIS coronagraphic im-aging (Grady et al. 2003); however, few images expose the farPSF wings this deeply. One example of ACS coronagraphicobservations of Arcturus did show that breathing-inducedchanges between visits can lead to a ring in the subtractedimage with a radius of 1300 and a surface brightness 20.5 magarcsec�2 fainter than the star (see Fig. 5.12 of Pavlovsky et al.2003). It may be that the rings in our STIS data are a similarartifact. However, we do not completely ignore the possibility
that the rings might be real, and consider whether they could beplausibly modeled by dust in the � Eri system.
4. RESULTS
4.1. Comparison of the STIS Imagges with theSubmillimeter Emission
4.1.1. Comparison with Roll-subtracted Imagges
Figure 6 shows the roll-subtracted data from part ofFigure 1, but at 2 times the scale of that figure and aftersmoothing with a 5 ; 5 boxcar filter to suppress the small-scale noise. Overlaid on this figure is the submillimeter con-tour map of Greaves et al. (1998), positioned assuming thatthe submillimeter emission shares the proper motion of � Eri.The inner contour level of the brightest submillimeter peak isabout 500 in diameter.
There are a substantial number of faint objects detected inthe region of the submillimeter emission, but the density ofsuch objects is not appreciably greater than elsewhere in theimage. There is no apparent correlation between these objectsand the submillimeter flux, and most or all of these objects areprobably background galaxies or stars. Note that the orbitalperiod for material in the dust ring is about 500 yr, and theexpected orbital motion is only about 0B2 yr�1.
Figure 7 shows the same data, but leaves the submillimetercontours where they were actually observed in 1997–1998;i.e., they are not corrected for the �400 that � Eri moved duringthe intervening years. In this figure, the brightest submilli-meter clump is just outside the 200 submillimeter pointinguncertainty of what appears to be a background galaxy withSTMAG 24.7 (this brightness includes all the clumps in thisextended object).
Figure 8 compares the proper-motion–corrected submilli-meter contours with a 5 ; 5 boxcar smoothing of the image thatresults when subtracting the � Eri PSF from the � Eri data. Oneof the bright rings is roughly at the location of the submilli-meter emission, but there is no correlation with the bright knots.
4.2. Detected Objects near � Eri
Nearly 60 distinct objects are visible in the field of view,including about half a dozen within 2000 of � Eri. Most of theseobjects appear to be slightly extended, and many have com-plex morphologies. There is no apparent increase in theirdensity at close distances to � Eri, and most are probablybackground galaxies. Two relatively bright point sources arevisible at distances of 51B5 (STMAG 19.6) and near 5400
(STMAG 22.2). A list of detected objects, their locations, andtheir magnitudes is given in the Appendix (Table 9). Forcomparison, from the magnitudes and colors given by Chabrieret al. (2000) for models of 1 Gyr old brown dwarfs with dustyatmospheres, we estimate that a 0:05 M� brown dwarf in the� Eri system would have a STIS 50CCD STMAG of �19, anda 0:03 M� brown dwarf an STMAG of �27.5.
4.3. Point Source and Surface Brigghtness Detection Limits
We measured the pixel-to-pixel rms variation in apparentlyblank regions of the final composite roll-subtracted image as afunction of radius from � Eri. The point-to-point rms noisevaries smoothly and can be fitted as � � 31=r 3:16 þ 0:011 e�
s�1, where r is the distance in arcseconds from � Eri. Themeasured noise is close to that predicted by a simple noisemodel based on the read noise and the total number of countsin the PSF as a function of radius. Within 3000 of the star, thenoise in the PSF-subtracted image is dominated by the Poisson
TABLE 5
Adopted Flux Distributions for � Eri and � Eri for PSF Calculations
k(8) � Eri � Eri Ratio
2700........................... 3.67 ; 10�12 2.75 ; 10�12 1.335
3000........................... 1.15 ; 10�11 1.11 ; 10�11 1.036
3646.235.................... 3.63 ; 10�11 3.82 ; 10�11 0.950
4433.491.................... 8.74 ; 10�11 1.01 ; 10�10 0.865
5492.883.................... 1.14 ; 10�10 1.37 ; 10�10 0.832
6526.661.................... 1.08 ; 10�10 1.30 ; 10�10 0.831
7891.114.................... 8.92 ; 10�11 1.07 ; 10�10 0.833
12347.43.................... 4.02 ; 10�11 5.02 ; 10�11 0.801
22094.22.................... 8.38 ; 10�12 1.06 ; 10�11 0.791
TABLE 6
STIS CCD Imaging Photometry
Filter � Eri � Eri Flux Ratio (�/� )
50CCD (predicted) ................. 4.023 3.830 0.8371
F25ND3 (predicted)................ 4.038 3.842 0.8345
F25ND3 (observed) ................ 3.956 3.762 0.837
LIMITS ON BRIGHTNESS OF � ERI DUST RING 485No. 1, 2004
noise of the star’s PSF wings (although the PSF has beensubtracted, its Poisson noise still affects the subtracted image).Since surface brightness of the stellar PSF increases steeplycloser to the star, our limiting magnitudes become signifi-cantly brighter. At distances greater than 3000, the accumulatedread noise dominates the total noise. The measured and pre-dicted noise are listed in Table 7. This noise will be somewhathigher in regions that were not observed at all four ori-entations. Note that a total count rate of 1 e� s�1 correspondsto a 50CCD STMAG of 26.405, and that the magnitude of� Eri in these same units is 4.02.
For extremely red objects, as little as 10% of the total point-source counts will fall into the central pixel of 50CCD images.For an unambiguous point-source detection, this central pixelshould be at least 5 � above the rms noise. These assumptionslead to the detectability limits given in the final column ofTable 7.
For extended objects, the entire flux should be considered,but a 5 � detection will still be required. If noise in different
pixels were uncorrelated, then the upper limit for detecting afixed value of the surface brightness would decrease as thesquare root of the area. For very large areas, however, any lowspatial frequency noise sources would limit the practicallyachievable faint limit.We empirically tested the real faint limit for extended
sources by masking out discrete sky objects and then com-paring the measured background counts in a number ofseparate regions at various distances from � Eri in the roll-subtracted image. Taking the standard deviation of the meanfluxes in boxes of a given size at a given distance as the 1 �error in the background measurement together with the Poissonnoise from the potential source, we derive the 5 � detectionlimits given in Table 8. For boxes <0B5 ; 0B5, we found aboutthe variance expected from scaling the point-to-point fluctua-tions by n�1=2
pix , but for larger areas, the fluctuations were biggerthan would be expected from Poisson statistics. For example,when averaging over a 3B5 ; 3B5 box at 2000, the measuredpixel-to-pixel variance would imply a 5 � detection limit of
Fig. 2.—Result of subtracting the two stars’ PSF assuming a normalization factor of 0.834. This normalization leaves a central excess as well as two 500 wide ringswith radii of approximately 1800 and 2800.
PROFFITT ET AL.486 Vol. 612

�27.2 STMAG arcsec�2, about 1 mag fainter than the directlymeasured limit. This difference could be due in part to realsources on the sky, but the lack of a clear correlation of thesefluctuations with the submillimeter map or distance from thestar requires us to treat such fluctuations as noise.
Note that at 2000 from the star, the shift in position from a10� roll change is about 3B5. Circular or arclike structuresmuch larger than the roll separation will tend to be washed outin the roll-subtracted image. Unfortunately, long, narrow arc-like structures oriented in the tangential direction are preciselythe kind of structures that are most likely in circumstellardebris disks. This limits the utility of the roll-subtracted imagefor detecting circumstellar structures much larger than a fewarcseconds in extent.
5. MODELING THE DUST IN THE � ERI SYSTEM
5.1. The Size Distribution of Dust in CircumstellarDebris Disks
Collisional fragmentation in a sufficiently dense debris diskwill lead to a collisional cascade that generates a wide spectrumof particle sizes. Wyatt et al. (1999) discussed extensively theprocesses that influence the resulting size distribution. Theo-retical arguments predict that, when collisions produce similarfragmentation at all size scales, the cascade leads to a distri-bution of particle sizes dn(a) / anda (Dohnanyi 1969; Tanakaet al. 1996), with n ’ �3:5. Such a distribution has most of themass concentrated in the biggest objects, but with most of thesurface area being dominated by particles near the lower end ofthe size distribution. When the emissivity is constant for allsizes, then the observable characteristics will be dominated bythe smallest particles.
The distribution may, however, be considerably flattenedif the orbital evolution of the smaller particles affects themrapidly enough. The lower cutoff to the distribution is seteither by the size at which the timescale for Poynting-Robertson driven orbital decay is smaller than the lifetime ofthese particles against collisional creation, or by when the
smallest grains can be blown out of the system by radiationpressure.
A small particle broken off a large object in a circular orbitwill be on an unbound hyperbolic orbit when the ratio ofradiation to gravitational forces �rad > 0:5. We can calculate�rad using the same Mie calculations and stellar spectrum usedto calculate the dust spectrum (see x 5.2.1).
The time for Poynting-Robertson orbital decay is propor-tional to the ratio of gravitation to radiative forces on a dustgrain. The timescale for Poynting-Robertson drag to change acircular orbit from a radius r1 to r2 is (Burns et al. 1979)
tPR ¼ 400(M�=M�)(r21 � r 22)=�rad yr; ð1Þ
where r1 and r2 are given in AU. For numerical comparisonswe define the time needed for the orbit to decay by 20% of itsinitial radius as the timescale for Poynting-Robertson drag;this is 36% of the time to decay to zero radius. At a distance of60 AU from � Eri, and assuming the age of the system to beabout 0.5–1 Gyr, the Poynting-Robertson effect would beexpected to remove any grains smaller than �100 �m unlessthe disk is dense enough that the small particles are still beinggenerated in collisions.
For the smallest particles in a debris disk, Wyatt et al. (1999)estimated that the collisional timescale is of the order oftorb=4�� , where torb is the orbital period and � is the effectiveface-on optical depth (i.e., the geometric filling factor). Theyalso estimated that particles will only be destroyed in collisionswith particles larger than a factor of 0:03 (M�=M�)(r=r�)½ 1=3times their own size (about 12% at 60 AU from � Eri), so wedefine �d to be a function of the particle size by integrating onlyover the appropriate size range; the timescale in years forfragmenting collisions is then:
td ¼
ffiffiffiffiffiffiffiffiffiffiffiffiffiffiffiffiffiffiffiffiffiffiffiffiffiffiffiffiffiffiffiffiffi(r=r�)
3(M�=M�)
q4��d
’3:7 ; 105r
60r�
� �3=2M�
M�
� ��1=2 �d10�4
� ��1
" #yr: ð2Þ
Fig. 3.—Solid line shows the mean count rate (e� arcsec�2 s�1) as afunction of radius from � Eri, after subtracting the � Eri PSF with a normal-ization factor of 0.834 (see Fig. 2). If we change this normalization factor to0.842 (dashed line), then the overall gradient is minimized, but the ringsremain, as shown in Fig. 5.
Fig. 4.—Same as Fig. 3, but in units of STMAG arcsec�2.
LIMITS ON BRIGHTNESS OF � ERI DUST RING 487No. 1, 2004

For a dust model to be self-consistent, this timescale shouldbe shorter than tPR for even the smallest particles in the model.We show below that this condition is easily satisfied for thedebris disk around � Eri.
5.2. Calculation of Dust Models
5.2.1. Calculatinggthe Spectrum of Optically Thin Circumstellar Dust
Given an assumed grain composition and the associatedwavelength-dependent optical constants, we performed stan-dard Mie theory calculations for spherical particles covering awide range of radii a using the code of Wiscombe (1979, 1980).This gives, among other quantities, the standard scattering andabsorption coefficients Qk; sca and Qk; abs. (The emission coeffi-cient at each wavelength Qk; em ¼ Qk; abs).
For the dust calculations, we adopt the flux from a standardsolar abundance Kurucz model atmosphere with TeA ¼ 5180 Kand log g ¼ 4:75, normalized to a total stellar luminosity of0.35 L�. The dust is assumed to be optically thin, and thetemperature of each dust grain can be determined by the
equilibrium between absorbed stellar radiation and thermalemission. Once the temperature of the grain is determined, thenwe can calculate the total light from a dust grain at eachwavelength as the sum of the scattered starlight and the thermalemission. We assume that the dust grain is small enough thatthe thermal emission is isotropic. The scattered light, however,will be highly anisotropic. The angular phase function f (�) forthis scattering can be easily derived from the Mie calculation,and we normalize this function so that f (�) ¼ 1 for isotropicscattering. Then, when viewed at a scattering angle �, the ap-parent flux of the dust grain will be
Fk; g ¼ �a2Qk; scaFk;d f (�)þ 4�a2�Bk(T )Qk; em: ð3Þ
This result will be used below to calculate the expected opticalspectrum for a given dust distribution.
5.2.2. Dust Composition and Porosity
The observable dust particles in circumstellar debris disksare presumed to be collisionally produced fragments of larger
Fig. 5.—Result of subtracting the two stars’ PSF assuming a normalization factor of 0.842. This normalization minimizes the mismatch in flux close to the star,but the two broad rings remain.
PROFFITT ET AL.488 Vol. 612

objects resembling those in the solar system’s Kuiper Belt.These larger objects were probably formed as very porousagglomerations of interstellar grains early in the history of thesystem.
For the composition and optical properties of these grains,we adopt the model of interstellar and circumstellar dustdeveloped by Li &Greenberg (1997, 1998), which assumes thatthe dust grains are a mixture of silicates, organic refractories,and voids, with some fraction of the voids possibly filled in bywater ice. The Bruggemann mixing rule (Krugel 2003) is usedto calculate the effective optical constants for the resultingmixtures from the optical constants of organic refractories andamorphous silicates given by Li & Greenberg (1997), and thatof vacuum.
Wyatt & Dent (2002) were able to fit the submillimeter andIRAS data for the debris ring around the A3 V star Fomalhautby assuming solid (nonporous) grains consisting of 1/3 silicateand 2/3 organic refractory material by volume, and a grain sizedistribution close to the theoretically expected n�3:5 that ex-tends down to the radiation blowout limit for that star. Whilethey could not completely exclude models with some degreeof porosity in the grains, they argued that the collisional
fragmentation should have resulted in significant compactionof the grains despite the high porosity expected in the pri-mordial parent bodies.
In contrast, Li & Greenberg (1997, 1998) and Li & Lunine(2003a, 2003b) favor models for the debris disks aroundHD 141569A, � Pictoris, and HR 4796A that assume highlyporous grains, with vacuum fractions P � 0:7 to 0.9. In somecases, these require a dust size distribution close to dn /a�3da, significantly flatter than the theoretically expected dn /a�3:5da.
Li et al. (2003) have recently fitted such a model to theavailable data for � Eri. They find that a model assuming highlyporous particles, and a rather flat size distribution, can providean excellent fit to both the IRAS and submillimeter data. Theyassumed that the same dust-size distribution function applies atall distances from the star, and only varied the total numberdensity of grains as a function of radius to match the distri-bution of the observed 850 �m flux. It is not clear whether ornot this is realistic. Moro-Martın’s & Malhotra’s (2002, 2003)dynamical studies of dust produced in our own solar system’sKuiper Belt found that the size distribution function is expectedto change substantially as a function of radius. However, the
Fig. 6.—A 5 ; 5 boxcar-smoothed version of the roll-subtracted data compared with the submillimeter contour map, assuming the submillimeter emission shares� Eri’s proper motion. The white numerals give the value of Greaves et al.’s (1998) 850 �m contour levels in units of mJy per SCUBA beam area.
LIMITS ON BRIGHTNESS OF � ERI DUST RING 489No. 1, 2004

Li et al. (2003) model does give an excellent fit to both thetotal submillimeter and IRAS fluxes observed in the � Erisystem.
This model assumes dn / a�3:1da, lower and upper sizelimits to the distribution a1 ¼ 1 �m and a2 ¼ 1 cm, and aporosity P ¼ 0:9. The solid portion of the grains is assumed toconsist of an organics/silicate mix in a 58:42 ratio by volume.The radial distribution of dust density is modeled as a Gaussiancentered at 55 AU, with a FWHM of 30 AU. We repeated Liet al’s calculations for the flux from such a dust distribution,but also included the contribution of the scattered light, as-suming a scattering angle of 90
�(i.e., a face-on disk, as indi-
cated by the morphology of the 850 �m flux).It is instructive to examine the radiative forces and time-
scales for this model of the dust distribution. Figure 9 shows�rad , the ratio of radiative to gravitational forces, for dust grainsof the modeled composition in the � Eri system (see also Fig. 3of Sheret et al. 2004). At large grain sizes, the low density ofporous grains substantially increases the effects of radiationpressure relative to that on solid grains of the same composi-tion and size. At small sizes, however, the porous grains nolonger effectively scatter radiation, and �rad drops below that of
solid grains, never becoming large enough (�rad > 0:5) forsuch grains to be efficiently blown out of the system. In reality,it is likely that the grains become less porous as they arefragmented to very small sizes. In any case, the timescale forfragmenting collisions expected for the model of Li et al.(2003) is much shorter than tPR at all sizes (Fig. 10), so smallgrains should be abundant, but predicting the detailed distri-bution of grain size and porosities at the lower end of thedistribution will be difficult.Attempts made to fit solid-grain models (P ¼ 0) have not
resulted in as good a fit as the Li et al. (2003) model. How-ever, Sheret et al. (2004) found that a simple model of a thinring at 60 AU with solid silicate/organic grains, a1 ¼ 1:75 �m,a2 ¼ 5 m, and dn / a�3:5da, fits the IR and submillimeterdata with a reduced 2 of 2.8.
5.2.3. Optical Brigghtness of Dust Models Normalized toMean Submillimeter Flux
Near 55 AU from � Eri, the typical 850 �m surface bright-ness observed by Greaves et al. (1998) is �0.02 mJy arcsec�2.After subtracting the mean emission of the ring, the 850 �mflux in the brightest clump totals to �2.6 mJy. If the angular
Fig. 7.—Same as Fig. 6, but without correcting the submillimeter contours for the proper motion of � Eri.
PROFFITT ET AL.490 Vol. 612

extent of the clump is comparable to the SCUBA beam size,this amounts to a surface brightness enhancement of an a ad-ditional 0.015 mJy arcsec�2.
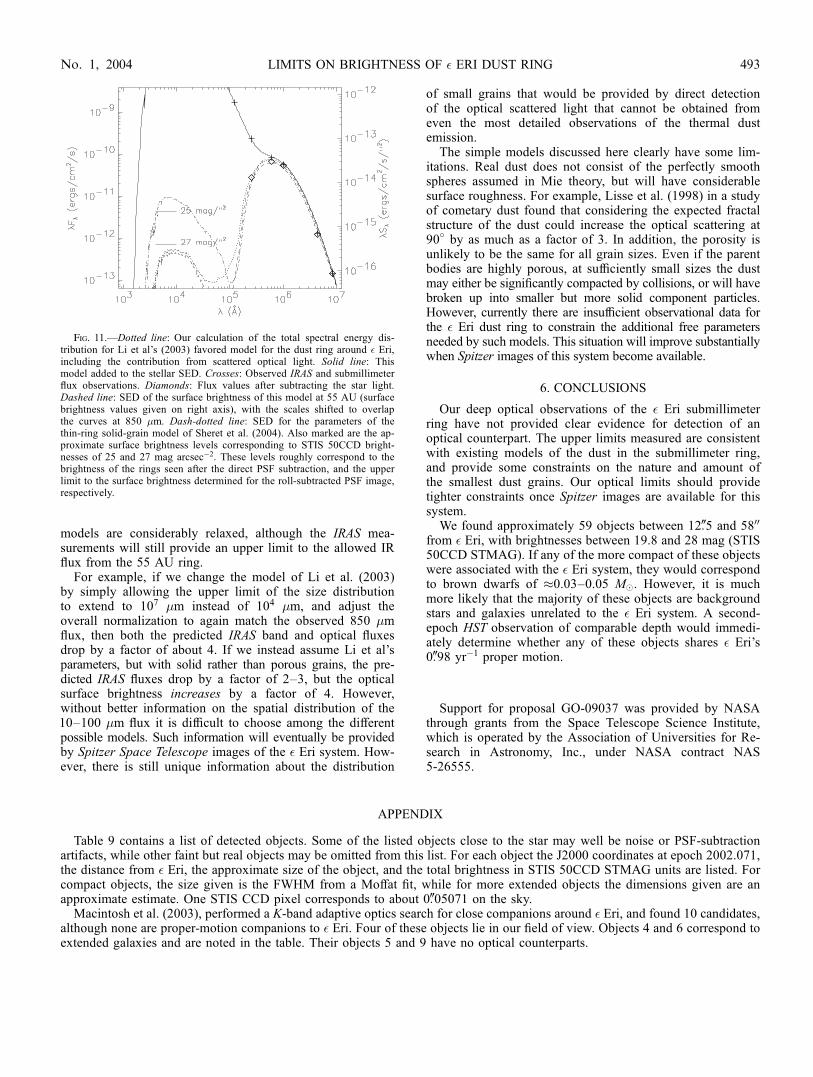
In Figure 11, we show, for a dust model with the parame-ters of Li et al. (2003), the calculated total SED for the wholedust cloud, and also for just the dust at 55 AU. Normalizingthis model to an 850 �m surface brightness at 55 AU of
0.02 mJy arcsec�2 yields a predicted STIS 50CCD surfacebrightness of 27.9 STMAG arcsec�2 (equivalent to 6:5 ;10�4 counts pixel�1 s�1).
If we instead assume the parameters of the Sheret et al.(2004) solid-grain model, we predict an optical 50CCD surfacebrightness of 24.5 STMAG—rather brighter than the rings inthe directly subtracted image.
Fig. 8.—Same as Fig. 6, except that here the contours are compared with the sky image made by subtracting the PSF derived from the � Eri observations (see Fig 5).
TABLE 7
50CCD Point Source Detection Limits in Roll-subtracted Image
Distance
(arcsec)
1 � Measured Noise
(e� pixel�1 s�1)
1 � Predicted Noise
(e� pixel�1 s�1)
5 � Point Source
Limiting Magnitude
7.................................. 0.064 0.052 25.0
8.................................. 0.055 0.043 25.3
9.................................. 0.041 0.037 25.5
10................................ 0.033 0.032 25.7
12................................ 0.023 0.026 26.1
15................................ 0.017 0.021 26.3
20................................ 0.013 0.017 26.6
30+ ............................. 0.012 0.015 26.7
LIMITS ON BRIGHTNESS OF � ERI DUST RING 491No. 1, 2004
In the roll-subtracted image, any tangential feature largerthan the roll change between images will show up in the PSFrather than in the sky image, and so circular rings would beinvisible. The bright clump might be detectable if it were nottoo diffuse or too spread out in the tangential direction. If thedust parameters in the clump are the same as in the rest of thering, we would predict a total 50CCD optical brightness of22.6 STMAG. Spread over a SCUBA beam area, this wouldgive a surface brightness of �28 STMAG arcsec�2, well be-low our most optimistic detection limits of �27 STMAGarcsec�2. The clump would have to be concentrated within anarea of no more than 1/4 of the SCUBA beam size before wewould expect to see it.
This assumes that the dust distribution in the clump is thesame as that of the ring as a whole. If the clump was created byresonant interactions of dust with a Neptune-like planet in the� Eri system, smaller particles, which are strongly perturbed byradiation pressure, may be less likely to collect in the sameresonances. If, for the enhancement in the clump, we changethe lower limit of the size distribution to be 150 �m, and againnormalize to 0.015 mJy arcsec�2 at 850 �m, then the predictedsurface brightness of the clump drops to �29.8 STMAGarcsec�2 (1:5 ; 10�4counts pixel�1 s�1). Such a model alsosubstantially reduces the clump’s contrast against the rest ofthe ring in the thermal IR.
The rings seen in the directly subtracted image (� Eri�� Eri), with a surface brightness of about 25 STMAGarcsec�2, are much brighter than the predictions of Li et al.(2003), but slightly fainter than predicted by the model ofSheret et al. (2004). If the rings are PSF subtraction artifacts,they are bright enough to obscure the expected signal from thedust. If real, they would imply a much larger abundance ofsmall grains that scatter efficiently in the optical than does themodel of Li et al. The lack of obvious counterparts in the opticalring corresponding to the submillimeter clumpiness mightbe explained by the very different dynamical behavior of thesmall grains.Unfortunately, available modeling of the HST STIS PSF at
distances of 2000 is inadequate to provide a clear answer re-garding the reality of the ringlike features seen after the sub-traction of the two stars’ PSFs.
5.2.4. Variations of Models
The models of both Li et al. (2003) and Sheret et al. (2004)assume that all excess IR and submillimeter flux in the � Erisystem is due to a single dust distribution that is well traced bythe 850 �m emission. If a substantial fraction of the IR excessis instead due to an inner zodiacal cloud of particles thatcontributes little at 850 �m, then constraints on possible
TABLE 8
50CCD Extended Source 5 � Surface Brightness Limits in Roll-subtracted Image
5 � Limiting Surface Brightness (STMAG arcsec�2) vs. Box SizeDistance
from Star
(arcsec) 0B5 ; 0B5 100 ; 100 3B5 ; 3B5 500 ; 500
15............................. 24.85 25.34 26.61 27.29
20............................. 25.06 25.60 26.20 26.92
25............................. 25.39 26.00 27.01 27.33
30............................. 25.46 26.28 27.15 27.25
35............................. 25.33 26.04 26.90 26.97
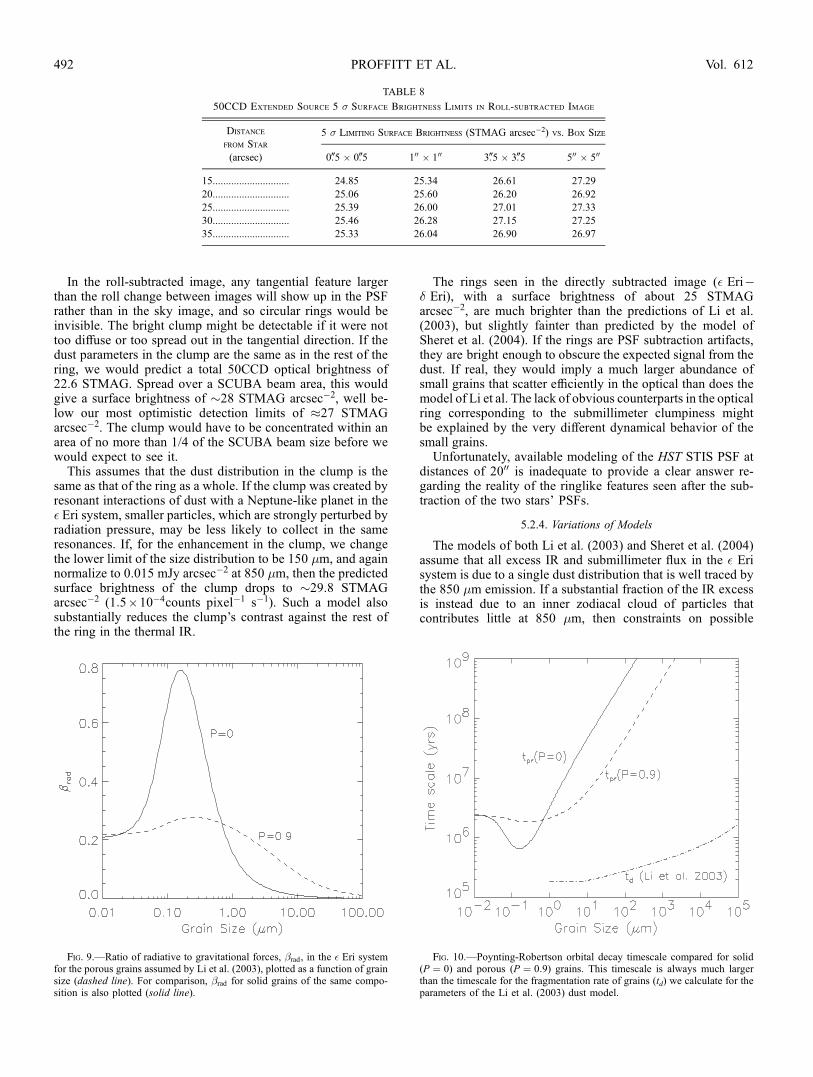
Fig. 9.—Ratio of radiative to gravitational forces, �rad, in the � Eri systemfor the porous grains assumed by Li et al. (2003), plotted as a function of grainsize (dashed line). For comparison, �rad for solid grains of the same compo-sition is also plotted (solid line).
Fig. 10.—Poynting-Robertson orbital decay timescale compared for solid(P ¼ 0) and porous (P ¼ 0:9) grains. This timescale is always much largerthan the timescale for the fragmentation rate of grains (td) we calculate for theparameters of the Li et al. (2003) dust model.
PROFFITT ET AL.492 Vol. 612
models are considerably relaxed, although the IRAS mea-surements will still provide an upper limit to the allowed IRflux from the 55 AU ring.
For example, if we change the model of Li et al. (2003)by simply allowing the upper limit of the size distributionto extend to 107 �m instead of 104 �m, and adjust theoverall normalization to again match the observed 850 �mflux, then both the predicted IRAS band and optical fluxesdrop by a factor of about 4. If we instead assume Li et al’sparameters, but with solid rather than porous grains, the pre-dicted IRAS fluxes drop by a factor of 2–3, but the opticalsurface brightness increases by a factor of 4. However,without better information on the spatial distribution of the10–100 �m flux it is difficult to choose among the differentpossible models. Such information will eventually be providedby Spitzer Space Telescope images of the � Eri system. How-ever, there is still unique information about the distribution
of small grains that would be provided by direct detectionof the optical scattered light that cannot be obtained fromeven the most detailed observations of the thermal dustemission.
The simple models discussed here clearly have some lim-itations. Real dust does not consist of the perfectly smoothspheres assumed in Mie theory, but will have considerablesurface roughness. For example, Lisse et al. (1998) in a studyof cometary dust found that considering the expected fractalstructure of the dust could increase the optical scattering at90� by as much as a factor of 3. In addition, the porosity isunlikely to be the same for all grain sizes. Even if the parentbodies are highly porous, at sufficiently small sizes the dustmay either be significantly compacted by collisions, or will havebroken up into smaller but more solid component particles.However, currently there are insufficient observational data forthe � Eri dust ring to constrain the additional free parametersneeded by such models. This situation will improve substantiallywhen Spitzer images of this system become available.
6. CONCLUSIONS
Our deep optical observations of the � Eri submillimeterring have not provided clear evidence for detection of anoptical counterpart. The upper limits measured are consistentwith existing models of the dust in the submillimeter ring,and provide some constraints on the nature and amount ofthe smallest dust grains. Our optical limits should providetighter constraints once Spitzer images are available for thissystem.
We found approximately 59 objects between 12B5 and 5800
from � Eri, with brightnesses between 19.8 and 28 mag (STIS50CCD STMAG). If any of the more compact of these objectswere associated with the � Eri system, they would correspondto brown dwarfs of �0.03–0.05 M�. However, it is muchmore likely that the majority of these objects are backgroundstars and galaxies unrelated to the � Eri system. A second-epoch HST observation of comparable depth would immedi-ately determine whether any of these objects shares � Eri’s0B98 yr�1 proper motion.
Support for proposal GO-09037 was provided by NASAthrough grants from the Space Telescope Science Institute,which is operated by the Association of Universities for Re-search in Astronomy, Inc., under NASA contract NAS5-26555.
APPENDIX
Table 9 contains a list of detected objects. Some of the listed objects close to the star may well be noise or PSF-subtractionartifacts, while other faint but real objects may be omitted from this list. For each object the J2000 coordinates at epoch 2002.071,the distance from � Eri, the approximate size of the object, and the total brightness in STIS 50CCD STMAG units are listed. Forcompact objects, the size given is the FWHM from a Moffat fit, while for more extended objects the dimensions given are anapproximate estimate. One STIS CCD pixel corresponds to about 0B05071 on the sky.
Macintosh et al. (2003), performed a K-band adaptive optics search for close companions around � Eri, and found 10 candidates,although none are proper-motion companions to � Eri. Four of these objects lie in our field of view. Objects 4 and 6 correspond toextended galaxies and are noted in the table. Their objects 5 and 9 have no optical counterparts.
Fig. 11.—Dotted line: Our calculation of the total spectral energy dis-tribution for Li et al’s (2003) favored model for the dust ring around � Eri,including the contribution from scattered optical light. Solid line: Thismodel added to the stellar SED. Crosses: Observed IRAS and submillimeterflux observations. Diamonds: Flux values after subtracting the star light.Dashed line: SED of the surface brightness of this model at 55 AU (surfacebrightness values given on right axis), with the scales shifted to overlapthe curves at 850 �m. Dash-dotted line: SED for the parameters of thethin-ring solid-grain model of Sheret et al. (2004). Also marked are the ap-proximate surface brightness levels corresponding to STIS 50CCD bright-nesses of 25 and 27 mag arcsec�2. These levels roughly correspond to thebrightness of the rings seen after the direct PSF subtraction, and the upperlimit to the surface brightness determined for the roll-subtracted PSF image,respectively.
LIMITS ON BRIGHTNESS OF � ERI DUST RING 493No. 1, 2004

TABLE 9
Detected Objects near � Eri, Ordered by Distance from the Central Star
R.A.
(J2000; Epoch
2002.07)
Decl.
(J2000; Epoch
2002.07)
Distance
(arcsec)
Size
(pixels)50CCDSTMAG Notes
3 32 56.4185........... �9 27 36.314 12.563 3 ; 6 25.2
3 32 56.5551........... �9 27 34.156 13.517 2.3 26.7
3 32 56.4763........... �9 27 21.908 14.150 3.8 25.4
3 32 56.6711 ........... �9 27 28.703 14.602 7 25.9
3 32 56.8063........... �9 27 33.636 16.962 12 25.7 double object
3 32 56.8713........... �9 27 28.768 17.549 2.0 26.7
3 32 56.8330........... �9 27 22.815 18.370 2.3 26.1
3 32 55.9059........... �9 27 49.906 20.223 26 24.2 fuzzy patch 1B3 diameter
3 32 56.5430........... �9 27 46.244 20.642 3 ; 7 25.9 faint line
3 32 55.4660........... �9 27 50.758 21.065 3.4 25.1
3 32 55.7102........... �9 27 51.351 21.406 8 ; 16 23.0 oval
3 32 56.1177........... �9 27 51.611 22.582 5 ; 9 24.4 oval
3 32 57.1903........... �9 27 25.101 22.740 2.9 26.4
3 32 56.5049........... �9 27 09.433 23.767 3.0 25.6
3 32 57.2179........... �9 27 19.614 24.862 3.2 25.8
3 32 57.3883........... �9 27 34.610 25.586 3.0 25.1 extended Cflux3 32 57.1796........... �9 27 45.611 27.068 3 ; 10 26.9 faint line
3 32 57.4928........... �9 27 19.772 28.554 4 ; 6 23.8 oval galaxya
3 32 56.7705........... �9 27 54.110 28.991 2.3 25.4
3 32 57.6676........... �9 27 29.800 29.281 3.4 26.2
3 32 57.2929........... �9 27 11.811 29.844 3 26.4 on edge of FOV
3 32 57.8475........... �9 27 34.308 32.240 4.4 24.5
3 32 57.2044........... �9 27 55.359 33.897 3.7 26.2
3 32 58.0335........... �9 27 28.253 34.728 6.1 26.1 extended structure mag 24.8
3 32 58.0057........... �9 27 19.861 35.718 3.1 26.6
3 32 58.0150........... �9 27 41.904 36.439 7.6 25.2
3 32 58.1936........... �9 27 30.231 37.056 5 ; 9 25.6 extended structure
3 32 57.2856........... �9 27 58.997 37.445 4 26.1
3 32 58.1967........... �9 27 36.068 37.606 4 26.1
3 32 58.2965........... �9 27 37.911 39.394 4 ; 10 24.1 long oval
3 32 58.3564........... �9 27 31.950 39.514 1.5 25.6 extended structure
3 32 58.1802........... �9 27 46.132 40.259 4.0 26.1
3 32 58.3193........... �9 27 17.338 40.889 4 27.8
3 32 58.0451........... �9 27 51.423 40.946 5 25.5 extended structure
3 32 58.1279........... �9 27 49.574 41.079 3.2 23.2 double irr galaxyb
3 32 58.5861........... �9 27 24.382 43.210 2.0 27.4
3 32 56.9571........... �9 28 08.992 43.308 3.7 25.3
3 32 58.6919........... �9 27 24.300 44.772 3.2 27.1 extended structure mag 25.8
3 32 58.4244........... �9 27 49.437 44.919 3.8 25.7
3 32 58.7317........... �9 27 24.345 45.350 2.5 26.2
3 32 58.7489........... �9 27 25.229 45.504 5 26.1
3 32 58.6853........... �9 27 19.098 45.620 11 25.9 noise?
3 32 58.3840........... �9 27 53.969 46.549 3 25.7
3 32 57.8873........... �9 28 04.667 47.568 2.4 26.0
3 32 58.9032........... �9 27 31.625 47.574 2 26.1
3 32 57.8779........... �9 28 07.866 49.856 5 26.0
3 32 59.0790........... �9 27 37.894 50.771 5.2 25.4
3 32 59.0779........... �9 27 38.375 50.833 3 27.1
3 32 58.9754........... �9 27 46.790 51.449 20 23.7 fuzzy patch �100 diameter
3 32 58.0864........... �9 28 07.301 51.501 1.8 19.8 bright star
3 32 58.8881........... �9 27 52.372 52.366 3.3 26.6
3 32 59.3340........... �9 27 29.536 53.912 1.8 22.2 star
3 32 58.5123........... �9 28 04.604 54.265 3.3 25.7
3 32 59.4291........... �9 27 34.188 55.481 10 ; 30 22.6 oval
3 32 59.3587........... �9 27 16.223 55.970 4 28.3
3 32 59.4461........... �9 27 42.934 57.069 5 ; 10 25.6
3 32 59.5610........... �9 27 30.327 57.267 4 26.0
3 32 59.5556........... �9 27 37.599 57.698 3.5 23.5 oval outer isophote
3 32 59.4106........... �9 27 49.428 58.392 4.2 25.1
a Object 4 from Macintosh et al. (2003), K ¼ 19:4.b Object 6 from Macintosh et al. (2003), K ¼ 20:2.
REFERENCES
Aumann, H. H. 1985, PASP, 97, 885Aumann, H. H., et al. 1984, ApJ, 278, L23Beichman, C. A., Neugebauer, G., Habing, H. J., Clegg, P. E., & Chester, T. J.1985, Infrared Astronomical Satellite (IRAS ) Catalogs and Atlases: Ex-planatory Supplement (NASA STI /Recon Tech. Rep. 85-18898; Pasadena:JPL)
Burns, J. A., Lamy, P. L., & Soter, S. 1979, Icarus, 40, 1Chabrier, G., Baraffe, I., Allard, F., & Hauschildt, P. 2000, ApJ, 542, 464Chini, R., Krugel, E., & Kreysa, E. 1990, A&A, 227, L5Chini, R., Krugel, E., Kreysa, E., Shustov, B., & Tutukov, A. 1991, A&A,252, 220
Dohnanyi, J. S. 1969, J. Geophys. Res., 74, 2431Gillett, F. C. 1986, in Light on Dark Matter: Proc. First IRAS Conf., ed. F. P.Israel (Dordrecht: Reidel), 61
Gillett, F. C., & Aumann, H. H. G. 1983, BAAS, 15, 799Grady, C. A., et al. 2003, PASP, 115, 1036Greaves, J. S., et al. 1998, ApJ, 506, L133Hatzes, A. P., et al. 2000, ApJ, 544, L145Holland, W. S., et al. 1998, Nature, 392, 788Kim Quijano, J., et al. 2003, STIS Instrument Handbook, Version 7.0(Baltimore: STScI), http://www.stsci.edu/hst/stis/documents/handbooks/currentIHB/cover.html
Krist, J. 1993, in ASP Conf. Ser. 52, Astronomical Data Analysis Software andSystems II (San Francisco: ASP), 536
———. 1995, in ASP Conf. Ser. 77, Astronomical Data Analysis Software andSystems IV (San Francisco: ASP), 349
Krugel, E. 2003, The Physics of Interstellar Dust (Bristol: Inst. Physics)Li, A., & Greenberg, J. M. 1997, A&A, 323, 566———. 1998, A&A, 331, 291Li, A., & Lunine, J. I. 2003a, ApJ, 590, 368
Li, A., & Lunine, J. I.———.2003b, ApJ, 594, 987Li, A., Lunine, J. I., & Bendo, G. J. 2003, ApJ, 598, L51Liou, J., & Zook, H. A. 1999, AJ, 118, 580Lisse, C. M., A’Hearn, M. F., Hauser, M. G., Kelsall, T., Lien, D. J., Moseley,S. H., Reach, W. T., & Silverberg, R. F. 1998, ApJ, 496, 971
Macintosh, B. A., Becklin, E. E., Kaisler, D., Konopacky, Q., & Zuckerman, B.2003, ApJ, 594, 538
Mermilliod, J.-C., Mermilliod, M., & Hauck, B. 1997, A&AS, 124, 349Moro-Martın, A., & Malhotra, R. 2002, AJ, 124, 2305———. 2003, AJ, 125, 2255Ozernoy, L. M., Gorkavyi, N. N., Mather, J. C., & Taidakova, T. A. 2000, ApJ,537, L147
Pavlovsky, C., et al. 2003, ACS Instrument Handbook, Version 4.0 (Baltimore:STScI), http://www.stsci.edu/hst/acs/documents/handbooks/cycle13/cover.html
Schutz, O., Nielbock, M., Wolf, S., Henning, T., & Els, S. 2004, A&A, 414, L9Sheret, I., Dent, W. R. F., & Wyatt, M. C. 2004, MNRAS, 348, 1282Soderblom, D. R., & Dappen, W. 1989, ApJ, 342, 945Song, I., Caillault, J.-P., Barrado y Navascues, D., Stauffer, J. R., & Randich, S.2000, ApJ, 533, L41
Tanaka, H., Inaba, S., & Nakazawa, K. 1996, Icarus, 123, 450Quillen, A. C., & Thorndike, S. 2002, ApJ, 578, L149Weintraub, D. A., & Stern, S. A. 1994, AJ, 108, 701Wiscombe, W. J. 1979, MIE Scattering Calculations, Advances in Techniqueand Fast, Vector-shaped Computer Codes (NCAR TN-140+STR; Boulder:NCAR)
———. 1980, Appl. Opt., 19, 1505Wyatt, M. C., & Dent, W. R. F. 2002, MNRAS, 334, 589Wyatt, M. C., Dermott, S. F., Telesco, C. M., Fisher, R. S., Grogan, K., Holmes,E. K., & Pina, R. K. 1999, ApJ, 527, 918
Zuckerman, B., & Becklin, E. E. 1993, ApJ, 414, 793
LIMITS ON BRIGHTNESS OF � ERI DUST RING 495