linear and nonlinear w-cells in c-laminae of the cat's lateral
TRANSCRIPT

JOURNALOF NEUROPHYSIOLOGY Vol. 47, No. 5, May 1982. Printed in U.S.A.
Linear and Nonlinear W-Cells in C-Laminae of the Cat’s Lateral Geniculate Nucleus
MRIGANKA SUR AND S. MURRAY SHERMAN
Department of Neurobiology and Behavior, State University of New York, Stony Brook, New York 11794
SUMMARY AND CONCLUSIONS
1. We used standard, single-cell record- ing techniques to study the response prop- erties of 34 W-cells in the C-laminae of the cat’s lateral geniculate nucleus. By W-cell, we mean a poorly responsive geniculate neu- ron that receives slowly conducting retinal afferents; these are quite distinct from ge- niculate X- and Y-cells. Our measurements included response latency to optic chiasm stimulation, plots of the receptive-field cen- ter, time course of response, and responses to counterphased, sine-wave gratings. This last measurement also involved the deter- mination of contrast sensitivity, which is de- fined as the inverse of the contrast needed to evoke a threshold response at a particular spatial and temporal frequency of the grat- ing. Many of these responses were compared to those of geniculate X- and Y-cells re- corded in the A-laminae.
dally phase dependent, and the nonlinear W- cells’ responses were independent of spatial phase. Linearity of temporal summation was determined by the presence or absence of harmonic distortion in the response relative to the grating’s counterphase rate. Linear W-cells responded chiefly at the grating’s fundamental temporal frequency, whereas much of the nonlinear W-cells’ responses occurred at the second harmonic of the grat- ing’s temporal frequency. Thus, nonlinear W-cells exhibited many of the characteris- tics previously described for Y-cells.
4. Spatial and temporal contrast-sensitiv- ity functions were determined for seven lin- ear and eight nonlinear W-cells. Overall sen- sitivity values of the linear and nonlinear W-cells were comparable, but these groups differed in terms of the nature of the re- sponse component (linear or nonlinear) that was more sensitive.
2. Each of the W-cells responded with a latency of at least 2.0 ms to optic chiasm stimulation, and most (76%) exhibited a la- tency of at least 2,5 ms. However, only 26 of these W-cells responded to visual stimuli, and these responses were weak or “sluggish,” as has been reported previously. Receptive fields of these W-cells tended to be large, compared to those of X- and Y-cells, and included 11 on-center, 13 off-center, and 2 on-off center fields.
5. The linear W-cells in our sample in- cluded both tonic (comparable to the “slug- gish-sustained” type of retinal ganglion cells) and phasic (comparable to “sluggish-tran- sient” ganglion cells) types, while all non- linear W-cells were phasic. Otherwise, no difference between linear and nonlinear W- cells was seen for latency to optic chiasm stimulation, receptive-field size, overall- con- trast sensitivity, responsiveness to visual stimuli, overall spatial resolution, or tem- poral resolution.
3. W-cells exhibited either linear ( 12 6. The best contrast sensitivity exhibited cells) or nonlinear ( 14 cells) spatial and tem- by the W-cells was typically less than one- poral summation, as determined from their fourth as great as the comparable sensitivity responses to counterphased, sine-wave grat- measured for 9 X- and 14 Y-cells with sim- ings. Linearity of spatial summation was ilar receptive-field locations. This relatively determined by measuring contrast sensitivity poor contrast sensitivity for W-cells may re- as a function of the grating’s spatial phase. late to their sluggish responses to visual The linear W-cells’ responses were sinusoi- stimuli.
0022-3077/82/0000-0000$01.25 Copyright 0 1982 The American Physiological Society 869

870 M. SUR AND S. M. SHERMAN
7. There were systematic differences be- tween the spatial contrast-sensitivity func- tions derived for linear W-cells and X-cells and for nonlinear W-cells and Y-cells. Lin- ear W-cells did not exhibit the reduced sensitivity to low spatial frequencies seen in X-cells. At low temporal frequencies, the second-harmonic response component of nonlinear W-cells tended to be more sensi- tive than the fundamental component at all spatial frequencies, whereas for Y-cells the fundamental component was more sensitive than the second-harmonic component at lower spatial frequencies and less sensitive at higher ones. Furthermore, the spatial res- olutions of W-cells were considerably less than those of either X- or Y-cells.
8. By a number of criteria, W-cells can be classified separately from X- and Y-cells. The division of W-cells into linear and non- linear types reflects their responses to sine- wave gratings but does not seem to relate to any other response property tested to date. The significance of this division for either cell classification or visual function is pres- ently unclear. More generally, however, W- cells may be involved in vision related to low spatial frequencies at contrasts well above threshold.
INTRODUCTION
The cat’s retinogeniculocortical system is comprised of at least two parallel, function- ally independent pathways that contain ei- ther X- or Y-cells (see Refs. 24, 29, 33, 34, 39 for recent reviews). The X- and Y-cell classes include both retinal ganglion cells and neurons in the lateral geniculate nu- cleus, and the receptive-field properties of the geniculate X- or Y-cells are much like those of their retinal counterparts (3, 4, 20, 23, 32, 36). Other cell types with quite dif- ferent response properties have been recently discovered among retinal ganglion cells and neurons of the geniculate C-laminae; these were originally termed W-cells (5, 6, 8, 37, 40, 41, 43, 44; see also Refs. 10, 25). X- and Y-cells have been intensively studied since their original description by Enroth-Cugell and Robson (1 l), and consequently we know a great deal about their response properties (e.g., Ref. 2-4, 9, 1 S-23, 32, 35, 36) W- cells, by contrast, were only recently de-
scribed, and much less is known about their response properties (e.g., Refs. 5, 6, 8, 37, 40, 41, 43, 44). The purpose of this paper is to describe certain features of W-cells lo- cated in the C-laminae of the lateral genic- ulate nucleus.
Recent evidence has shown that retinal ganglion W-cells are a heterogeneous group of neurons and that use of the term W-cell may be a misleading oversimplification. In- deed, other terminology has been suggested (29). It is neither clear to what extent W- cells in the C-laminae of the lateral genic- ulate nucleus represent a genuine homoge- neous functional class nor to what extent their response properties reflect those of their retinal afferents. These gaps in our knowl- edge form part of the reason that we initiated the present study. However, rather than adopt new terminology, we have elected to continue use of the term W-cell for these geniculate neurons (cf. Ref. 39). We both recognize and emphasize the shortcomings of such terminology, and we expect to adopt better terminology when these geniculate neurons and their retinal afferents are more completely characterized. This point will be considered more fully in DISCUSSION.
By certain criteria, X-cells show linear spatial and temporal summation within their receptive fields, and Y-cells do not (11, 18, 22, 23, 32). That is, for a visual stimulus consisting of a counterphased, sine-wave grating, a “null position” can be found at which X-cells cease to respond because in- hibitory and excitatory influences of the stimulus linearly sum to zero. Also, X-cell responses to other grating positions occur predominantly at the fundamental temporal frequency of the counterphasing stimulus. No grating null position can be found for the Y-cells, and their responses are distorted temporally by harmonics of the stimulus fre- quency, particularly the second harmonic. Other differences between X- and Y-cells have been noted as well (2-4, 9, 20, 21, 23, 35, 36). Compared to Y-cells, X-cells tend to exhibit 1) slower conducting axons, 2) poorer responses to low spatial frequencies or large shapes, 3) better responses to high spatial frequencies or small targets, 4) smaller receptive-field centers, 5) poorer re- sponses to high temporal frequencies or fast- moving targets of contrast appropriate to

LINEAR AND NONLINEAR W-CELLS IN LGN 871
excite their surrounds, and 6) more tonic responses to appropriate stimuli located in their receptive-field centers.
For the most part, W-cells in the retina and lateral geniculate nucleus can be distin- guished from X- and Y-cells by two poorly defined criteria (e.g., Refs. 5, 6, 8, 40, 4 1, 43, 44). W-cells respond sluggishly to visual stimuli compared to the “brisk” responses of X- and Y-cells, and W-cells have more slowly conducting axons than do X- and Y- cells, although the fastest conducting axons of W-cells overlap with the slowest of X- cells. We sought to clarify some of these differences between W-cells and X- or Y- cells by noting the responses of W-cells to sine-wave gratings. We found that some W- cells exhibit linear spatial and temporal sum- mation (like X-cells), and others appear non- linear (like Y-cells). Also, W-cells have cun- trast sensitivity that is much worse than that of either X- or Y-cells. Preliminary results of this research have been recently reported (42).
MATERIALS AND METHODS
Experiments were performed on 10 adult cats. Methods of the physiological preparation, visual stimulation, electrophysiological recording, and data analysis were similar to those we have de- scribed in detail previously (20, 23). Briefly, cats were anesthetized with halothane for initial sur- gery and maintained thereafter on a 70/30 mix- ture of nitrous oxide/oxygen with continuous in- fusion of gallamine triethiodide (3.6 mg/h) and d-tubocurarine (0.7 mg/h) for paralysis. They were artifically ventilated, and end-tidal carbon dioxide was monitored and kept at 4.0%. Body temperature was maintained at 38OC. Pupils were dilated and nictitating membranes retracted with topical application of atropine sulfate and phen- ylephrine hydrochloride, The corneas were cov- ered with contact lenses that included a 3-mm artificial pupil. Retinoscopy ensured that the ret- inas were conjugate with the visual stimuli deliv- ered on a cathode-ray tube 57 cm away.
Bipolar stimulating electrodes (insulated tung- sten wires with 0.5-mm exposed tips) were placed across the optic chiasm (one pair) and in the white matter underlying the visual cortex (two pairs). Electrical stimuli consisted of brief pulses ((5 mA for 40 ps). Antidromic stimulation of geniculate neurons from visual cortex was determined by a spike-collision test by which an orthodromic spike collides with and blocks the antidromic one. Tran- synaptic activation of geniculate neurons from
cortex was also seen in many cases. Latency of response was measured from the stimulus artifact to the foot of the action potential. Both the latency range and modal latency were measured for each cell, and measurements of the modal latency are indicated in RESULTS.
Visual stimuli consisted of bright or dark hand- held targets moved on a tangent screen or coun- terphased, sine-wave gratings presented on a cath- ode-ray tube. The gratings were vertically ori- ented and had a mean luminance of 36 cd/m*. The spatial freqency, temporal frequency (coun- terphase rate), spatial phase angle,’ and contrast (between 0 and 0.84) of the grating could be con- tinuously varied. For many cells, responses were stored in a computer (PDP 11/34) for subsequent Fourier analysis.
Single-unit recording from geniculate cells was accomplished with glass micropipettes filled with 3 M KC1 or NaCl (lo-30 MQ at 100 Hz). In every penetration in which W-cells were recorded in the C-laminae, receptive fields for X- and Y- cells were noted in laminae A and Al for com- parison. Y-cells, and rarely some X-cells, were also recorded in the dorsal part of the C-laminae (43). X- and Y-cells responded briskly to visual stimuli and were distinguished from one another on the basis of a battery of tests (see INTRU-
DUCTKIN and Refs. 20, 22, 23, 3 1). These tests, in decreasing order of priority, are I) linearity of spatial summation to counterphased, sine-wave gratings; 2) latency of response to optic chiasm stimulation, 3) responsiveness of the surround to fast-moving (>2OO”/s), large targets; 4) size of the receptive-field center; and 5) time course (tonic or phasic) of responses to appropriate standing contrasts. W-cells were found in the C- laminae, but not in the A-laminae, and were dis- tinguished by long-latency responses to optic tract stimulation (22.0 ms) and weak or sluggish re- sponses to visual stimuli (5, 6, 8, 40, 41, 43, 44). As we shall show (see RESULTS), W-cells exhibit markedly poor contrast sensitivity, and this prob- ably relates to their sluggish responsiveness to visual stimuli.
We studied the responses of W-cells to hand- held visual targets and to the counterphased, sine- wave gratings. Hand-held targets (usually small, flashing spots of light) were used to determine the receptive-field borders; whether a cell was on-cen- ter, off-center, or generated responses to both on- set and cessation of the stimulus (on-off center);
I Spatial phase angle refers to the relative position of the grating perpendicular to its orientation (i.e., hori- zontal position). One stimulus cycle of the sine-wave variation in luminosity is 360” of spatial phase angle. A phase shift of 90” is a movement of one-fourth of a stimulus cycle; 1 80”, half a cycle, etc.

872 M. SUR AND S. M. SHERMAN
5 1
Linear W-cells
O- 1 T r I u
co
i W Nonlinear W-cells
Visually unresponsive W-cells
0 I 1 1 I I 1 I 0 1 2 3 4 5 4 7
OX LATENCY (m-c)
FIG. 1. Histogram of response latencies to optic chiasm stimulation (OX latency) for 12 linear W-cells (mean, 2.7 ms), 14 nonlinear W-cells (mean, 3.0 ms), and 8 W-cells that were unresponsive to visual stimu- lation (mean, 3.8 ms).
responsiveness of the neurons to a fast-moving disk (>2OO”/s) of contrast appropriate to excite the surround; and whether the cell responded in a tonic or phasic manner to center stimulation (dark spots were used to test off-center cells). A cell was classified as tonic if it sustained a response above background to a centered spot for at least 10 s, and phasic if not. Phasic cells nearly always returned to background firing rates within 2 s of the stimulus presentation.
RESULTS
We obtained data from 34 W-cells in the C-laminae of the cat’s lateral geniculate nu- cleus, W-cells were found in each of the C- laminae (i.e., laminae C and C2 innervated by the contralateral eye and lamina C1 in- nervated by the ipsilateral eye; see Ref. 43). No obvious differences in response properties were seen for W-cells among these laminae.
General characteristics of W-cells Each of the 34 recorded W-cells re-
sponded to optic chiasm stimulation with a latency > 2.0 ms, and 26 (76%) had response latencies > 2.5 ms. Figure 1 shows the range
and distribution of these latencies. , Eight cells could not be reliably activated bY any visual stimuli used, even though neighboring neurons were the presumed
visua ily responsive, and receptive-field locations
thus were
eight visually un- reliably to optic
known, Nonetheless, these responsive cells responded chiasm stimulation, but they tended to have longer latencies than most visually respon- sive W-cells (see Fig. 1). We have tenta- tively grouped these eight unresponsive cells as W-cells for two reasons: their visual un- responsiveness may be an extreme charac- teristic in a continuum of poor W-cell re- sponsiveness (e.g., Refs. 5, 6, 8, 40, 43, 44; see also below), and the morphological fea- tures of the visually responsive and unre- sponsive W-cells are essentially equivalent to one another (38). The remaining 26 W- cells responded weakly or sluggishly to visual stimuli. Their responses also seemed rela- tively variable compared to those of X- and Y-cells, More detailed receptive-field data are described below for 24 of these 26 W- cells, because the remaining 2 neurons, though visually responsive, were unreliable, weak, and inconsistent in their responses to visual stimulation.
From the cortical electrodes, we were able to activate only five W-cells antidromically (mean latency of 2.4 ms with a range of 2. l- 3.5 ms). The failure to activate more W-cells might reflect the wide distribution of pro- jections from the C-laminae (15, 28) and limited activation region of our cortical elec- trodes.
Of the visually responsive W-cells, 11 had on-center receptive fields, 13 were off-center, and 2 were on-off. Antagonistic surrounds were absent or too weak to detect in all but nine of these cells. One on-off cell had a sup- pressive surround, The receptive-field cen- ters of W-cells were up to 5” across in the central 10” of visual field and were larger than those of all X-cells and nearly all Y- cells at comparable eccentricities. However, due to both the weak responses of most W- cells to spots of light as well as the lack of sharply defined receptive-field borders, we are not very confident of these center size estimates. With this proviso, Fig. 2 shows the distribution of center sizes as a function of receptive-field eccentricity from the area centralis representation. The on-off center

LINEAR AND NONLINEAR W-CELLS IN LGN 873
W-cells responded in a phasic manner to centered stimuli, but the on- or off-center cells were either tonic (5 cells) or phasic ( 19 cells). The tonic and phasic W-cells probably correspond, respectively, to the sluggish-sus- tained and sluggish-transient cells of Cle- land et al. (5, 6, 8).
Contrast sensitivity and response versus contrast measurements
Contrast sensitivity is defined as the in- verse of the minimum stimulus contrast needed to evoke a detectable or reliable neural response above the background level; it was measured by two methods that pro- vided essentially the same result. First, a neuron’s action potentials were displayed on a storage oscilloscope whose sweep was trig- gered by the temporal frequency wave form of the counterphased sine-wave grating. The temporal waveform of the stimulus was also displayed on the same time base. Repeated stimulus/response pairs were superimposed
and stored. From this we could determine for each spatial and temporal frequency the linear and nonlinear response components. The presence of action potentials on only one temporal half-cycle of the stimulus wave- form denotes a fundamental or linear re- sponse component, while clustering of action potentials related to both half-cycles denotes a frequency-doubled response that is the sec- ond-harmonic or nonlinear component. The contrast threshold of each component was measured as the lowest contrast value needed to detect the component reliably. However, this method could overlook harmonic com- ponents in a response that occurred at either half-cycle of the stimulus.
The second method consisted of plotting response (size of either the fundamental or the second-harmonic component of re- sponse) versus contrast (Fig. 3). Such a graph has a portion where response increases in an approximately linear fashion with con- trast and a portion where the response sat-
0 Linear W-Cells
l Nonlinear W-Cells
20 30 40 50
ECCENTRICITY (dw)
FIG. 2. Plot of receptive-field center size versus eccentricity of the field from the area centralis for 11 linear and 13 nonlinear W-cells. The center sizes for one linear and one nonlinear W-cell were not determined due to the unreliable responsiveness of these two cells, and they are excluded from this plot. For cells shown, there is a correlation between center size and receptive-field eccentricity (r = O-6, P < 0.01).

874 M. SUR AND S.
A LINEAR W-CELL
Q 1 0 Z& ----L *_-____________ ------- ______-------.
0 l $ lb I 1 A 1 I 1 1 1 & .2
CdTRAST * .a
FIG, 3. Response versus contrast functions. The dashed line in each graph represents the level of response component (fundamental or second harmonic) found in the spontaneous activity during an equivalent time pe- riod for each of the contrast-response measures (15 s), A: function for a linear W-cell’s fundamental response component. The stimulus was a 0.2 cycle/deg sine-wave grating counterphased at 2 Hz. The grating’s spatial phase angle was placed 90” from the fundamental re- sponse component’s null position (see text and Fig. 4) and was thus at the most sensitive position for this re- ponse. B: function for a nonlinear W-cell’s second-har- monic response component. The stimulus was a 0.1 cy- cle/deg sine-wave grating counterphased at 2 Hz. It was placed at the null position of the fundamental response component for this cell (see text and Fig. 4).
urates, From the linear portion of the graph, two measures of sensitivity could be ob- tained. First, one could choose a criterion
M. SHERMAN
response and obtain the contrast required to yield that response ( 11, 18). For example, the contrast needed to yield a response just higher than the background level could be obtained from the intersection of the linear portion of the contrast-response function with the fundamental component found in spontaneous activity (Fig. 34 B ). Alter- natively, the slope of this linear portion pro- vides a measure of sensitivity (18). For the two cells illustrated in Fig. 34 B, the oscil- loscope method yielded contrast thresholds of 0.09 (sensitivity, which is the inverse of the contrast at threshold, equals 11.1) for the stimulus used in Fig. 3A, and 0.17 (sen- sitivity equals 5.9) for the stimulus used in Fig. 3B. The contrast-response graph yielded contrast threshold values of 0.035 (sensitiv- ity equals 28.6) and 0.13 (sensitivity equals 7.7) from the background response criteria. The slopes of the two graphs yielded sensi- tivity values of 22.1 and 16.0 (in spikes per second/contrast).
Contrast-sensitivity values obtained either by the oscilloscope method or from the con- trast-response graphs were internally consis- tent and provided similarly shaped contrast- sensitivity functions. For this reason, we employed the simpler and faster method of using the oscilloscope to determine contrast sensitivity, although these values were fre- quently verified with computer-generated contrast-response functions.
Linear and nonlinear W-cells
Two tests were used to assess the linearity of spatial and temporal summation of W- cells to visual stimuli. The test for linearity of spatial summation measured the evoked response as a function of spatial phase of a sine-wave grating. A linear response (e.g., from an X-cell) varies sinusoidally as a func- tion of spatial phase between the phase angle of minimal response (i.e., null position) and one of maximal response, whereas a nonlin- ear response (e.g., from a Y-cell) is relatively independent of spatial phase (18, 19, 32). The test for linearity of temporal summation measured the neuronal response dynamics relative to the stimulus temporal frequency. A linear (X-cell) response occurs mostly at the fundamental temporal frequency of the stimulus, whereas a nonlinear (Y-cell) re- sponse contains considerable second- (and higher order) harmonic distortion of the

LINEAR AND NONLINEAR W-CELLS IN LGN 875
stimulus (e.g., a “doubling” response that occurs at twice the stimulus frequency; see Refs. 18, 19). A combination of these non- linearities for Y-cells leads to responses characterized by “phase-independent dou- bling” (18, 19), indicating that the response occurs at twice the temporal frequency of the stimulus and is unchanged with shifts in the spatial phase of the stimulus. Based on these criteria, our sample of W-cells in- cluded both linear (12 neurons) and nonlin- ear ( 14 neurons) types among those that re- sponded to visual stimuli.
SPATIALPHASEDEPENDENCEOFCONTRAST SENSITIVITY. Figure 4 shows the variation of contrast sensitivity (see above) with spa- tial phase for a linear W-cell and a nonlinear W-cell. The stimulus consisted of a sine- wave grating counterphased at 2 Hz. The signs (positive or negative) of the contrast- sensitivity values were derived from the re- lationship between the response and an ar- bitrarily chosen half-cycle of the temporal waveform of the stimulus (see Ref. 18). Fig- ure 4A depicts the phase dependence of the linear W-cell’s response, which occurs at the fundamental temporal frequency of the stimulus. This phase dependence is approx- imately sinusoidal. Figure 48 shows the phase dependence of the nonlinear W-cell’s frequency-doubled response. The sensitivity is now plotted above and below zero, because responses occur at both temporal half-cycles. This response is basically independent of spatial phase. Although not illustrated, it was possible in some nonlinear W-cells to measure the spatial phase dependence of the fundamental response (which was typically much weaker or less sensitive than the sec- ond-harmonic response). Such a fundamen- tal response had a sinusoidal phase depen- dence much like that illustrated in Fig. 4A.
Due to the phase dependence of the fun- damental response component and phase-in- dependent nature of the second-harmonic component, contrast thresholds could be de- termined by the oscilloscope method in the following manner (see above). To determine the sensitivity of the second-harmonic com- ponent, we canceled the fundamental com- ponent by adjusting the grating’s spatial phase to the null position for the fundamen- tal component. The remaining response was thus frequency doubled and independent of
A LINEAR W-CELL
c- 2 ‘1 B NONLINEAR W-CELL
1 -45 0 45 90 13s 180
3 SPATIAL PHASE ANGLE (dw)
5
i
l
t-1 l l
l l l l
l l
7
1 9L
FIG. 4. Plots of contrast sensitivity versus spatial phase angle. A: plot for a linear W-cell showing con- trast sensitivity of the fundamental-response component to a 0.2 cycle/deg sine-wave grating counterphased at 2 Hz. Superimposed on the contrast-sensitivity values is a sinusoidal curve of the form Sm l cos 6, where # is the spatial phase angle of the grating and Sm is the mean of the sensitivities at 0 and 180”. B: plot for a nonlinear W-cell showing contrast sensitivity of ihe sec- ond-harmonic response component to a 0.1 cycle/deg sine-wave grating counterphased at 2 Hz. The sensitivity values are shown as positive and negative because the frequency-doubled responses occurred at both temporal half-cycles of the stimulus (see text).
spatial phase. Contrast was then reduced until the threshold response of this fre- quency-doubled component was obtained. To determine sensitivity of the fundamental response component, the grating was always placed 90” from this component’s null po-

876 M. SUR AND S, M. SHERMAN
LINEAR W-CELL NONLINEAR W-CELL
8-A 0”
Frequency component
B 90”
TIME (se@
FIG. 5. Peristimulus time histograms of responses to counterphased sine-wave gratings with Fourier analysis of responses. A: response of a linear W-cell to a 0.1 cycle/deg grating counterphased at 2 Hz and placed 90” from the cell’s null position. The grating’s contrast was 0.3 and 50 cycles are averaged for this histogram. The inset shows the relative amplitude of the response components. B: response histogram for same cell t,o same stimulus as in A, but phase shifted by 90” to the null position. Twenty stimulus cycles are averaged. Note the decrease in the absolute size of the fundamental-response component from A to B (see insets). C: response histogram for a nonlinear W-cell to a 0.1 cycle/deg grating of 0.53 contrast and 2 Hz temporal frequency. The grating was positioned 90” from the null position to elicit the fundamental response component. Fifty stimulus cycles are averaged. Again, the inset shows the relative amplitudes for the Fourier components of the response, D: response histogram of same cell and to same stimulus as in C, but phase shifted by 90”. Fifty stimulus cycles are averaged. The major change from C to D is a reduction in the magnitude of the fundamental response component (see insets). The inset in B is scaled relative to that in A; and the inset in C is scaled relative to that in I).
sition, and two strategies were used. First, peristimulus histograms of response rate ver- if the fundamental response component was sus time during one counterphase cycle of more sensitive than was the second-har- the stimulus. The stimulus had been shifted monic component at the particular spatial by 90° in spatial phase between histograms and temporal frequency used, contrast was so that Fig. 5A depicts the maximum re- reduced until the fundamental component’s sponse and Fig. 5B the response at the null threshold response was achieved. Second, if position. These responses were Fourier an- the second-harmonic response component alyzed to determine the relative strength of was the more sensitive, contrast was reduced responses at the fundamental temporal fre- until the response at both stimulus half-cy- quency and at higher harmonics of this fre- cles was equaled, since the presence of a fun- damental component would create a larger
quency (insets). The ratio of the fundamen- tal to second-harmonic component is 100 in
response at one half-cycle than the other. Fig. 5A and 1.79 in Fig. 5B. This difference FUNDAMENTAL AND SECOND-HARMONIC RE- is due mainly to a dramatic loss of response SPONSES. Figure 5 illustrates for two W- at the fundamental frequency from Fig. 5A cells responses that characterize one as lin- to B. The response strength of the second- ear and the other as nonlinear. Figure 5A, harmonic component lies in the background B shows, for a typical linear W-cell, two level in both cases.

LINEAR AND NONLINEAR W-CELLS IN LGN 877
Figure SC, D depicts analogous responses for a tpical nonlinear W-cell. Again, the stimuli were separated by 90° in spatial phase between the two histograms. The re- sponses of these cells are characterized by both a strong second-harmonic component that is independent of spatial phase as well as a phase-dependent response at the fun- damental frequency. Figure 5C shows the maximum fundamental responses, and Fig. 5D shows the response at the null position for the fundamental component. The ratio of the fundamental response component to the second-harmonic response component is 1.34 for Fig. 5C and 0.22 for Fig. SD. The
LINEAR W-CELL
c
A 12
L 1 L L 1 c/) -05 .l .2 .4 .8 I.6
SPATIAL FREQUENCY
L 1 n I I 1
I 2 4 8 I6 32
magnitude of the fundamental response is reduced to the background level in Fig. 5D while the second-harmonic component in both phase positions is quite large.
For X- and Y-cells in the retina and the lateral geniculate nucleus, the presence of a null position or of frequency-doubled re- sponses at spatial frequencies that approach the spatial resolution of these cells ( 18) pro- vides a reliable measure of the linearity of summation. The spatial resolution of W-cells in the lateral geniculate nucleus is generally much lower than that of X- or Y-cells (see below, and for example, Refs. 23, 35), and most nonlinear W-cells show clear phase-in-
NONLINEAR W-CELL
o fundamental component
l second harmonac component
I 1 L 1 1 1
.05 .I .2 .4 8
(cycles/de&
8-
TEMPORAL FREQUENCY (wc~es/sec)
FIG. 6. Spatial and temporal contrast-sensitivity functions of fundamental and second-harmonic response com- ponents. For each W-cell, the fundamental response component was assessed with a grating positioned at 90” from its null position, and the second-harmonic component was assessed at the fundamental component’s null position. A: spatial function for a linear W-cell to a ~-HZ sine-wave grating. This cell had an off-center receptive field located 26.5 O from the area centralis with a center 3” in diameter. B: temporal function for same cell as in A to a 0.1 cycle/deg sine-wave grating. C: spatial functions for a nonlinear W-cell to a ~-HZ sine-wave grating. This cell had an off-center receptive field located 17” from the area centralis with a center 5” in diameter. D: temporal functions for same cell as in C to a 0.05 cycle/deg sine-wave grating.

878 M. SUR AND S. M. SHERMAN
dependent, second-harmonic responses at spatial frequencies as low as 0.05 cycle/deg.
Contrast-sensitivity functions We measured spatial and temporal con-
trast-sensitivity functions for seven linear and eight nonlinear W-cells. This was done by plotting contrast sensitivity as a function of spatial and temporal frequency. Further- more, for 10 linear and 12 nonlinear W-cells, we measured spatial resolution at 0.84 con- trast as the highest spatial frequency at 2 Hz to which the cell responded. For 10 linear and 9 nonlinear W-cells, we measured tem- poral resolution at 0.84 contrast as the high- est temporal frequency at any spatial fre- quency (down to 0.05 cycle/deg) to which the cell responded.
Figure 6A, B shows spatial and temporal contrast-sensitivity functions for a typical linear W-cell, and Fig. 6C, D does likewise for a typical nonlinear W-cell. For the linear W-cell, no nonlinear or second-harmonic re- sponse component was detected, and the con- trast-sensitivity functions decline monoton- ically with increasing spatial or temporal frequency (Fig. 6A, B; see also Fig. lOA).
Contrast-sensitivity measurements are more complicated in nonlinear W-cells be- cause of the presence of appreciable linear or fundamental-response components in ad- dition to the nonlinear or second-harmonic components (Fig. 6C, D). In seven of the eight nonlinear cells studied in this manner at a low temporal frequency (2 Hz), the non- linear component was more sensitive than was the linear component at all spatial fre- quencies tested (Fig. 6C, see also Fig. IOB ). The temporal contrast-sensitivity functions of these seven nonlinear W-cells are espe- cially complicated. At low spatial frequen- cies, temporal-contrast sensitivity of the lin- ear-response component, compared to that of the nonlinear component, was less at lower temporal frequencies but greater at higher temporal frequencies (Fig. 6D ). Further- more, the linear response component consis- tently exhibited a sensitivity loss at lower temporal frequencies, whereas no such loss was seen for the nonlinear component.
For the eighth nonlinear W-cell, contrast- sensitivity functions were somewhat differ- ent at the same low temporal frequency (2 Hz) from the other seven and resembled
those of Y-cells (see, for example, Fig. 1OB; see also Refs. 19, 36). That is, spatial-con- trast sensitivity of the linear response com- ponent was greater than that of the nonlinear component at lower, but not higher spatial frequencies. Consequently, at lower spatial frequencies, temporal-contrast sensitivity for the linear response component was greater than that for the nonlinear component at all temporal frequencies and displayed no at- tenuation at low temporal frequencies. This eighth nonlinear W-cell may not be funda- mentally different from the other seven, since it is possible that at other temporal frequencies all of the eight nonlinear W- cells, would exhibit similar spatial functions.
Spatial and temporal resolution
Figure 7A, B shows the distribution of spatial and temporal resolution values for W-cells. Linear and nonlinear W-cells are separately indicated. For nonlinear W-cells, spatial resolution was determined by the nonlinear response component (cf. Fig. 6C and 10 B ), but temporal resolution for these cells was determined by the linear compo- nent (cf. Fig. 6D). The temporal resolutions of the linear and nonlinear W-cells, there- fore, represent the same aspect of response (i.e., the fundamental component), while the spatial resolutions of the two types represent different aspects of response (i.e., the fun- damental versus second-harmonic compo- nent). In any case, no statistically reliable difference was seen between linear and non- linear W-cells for either spatial or temporal resolution (P > 0. I for each comparison on either a Mann-Whitney U test or an F test).
We measured both spatial- and temporal- contrast sensitivity for seven linear and eight nonlinear W-cells. Figure 8A plots for these cells the relationship between spatial and temporal resolution, As in Fig. 7, the values for the nonlinear W-cells represent second- harmonic responses for spatial resolution and fundamental responses for temporal res- olution. W-cells that were generally more responsive or sensitive to visual stimuli ex- hibited higher spatial and temporal resolu- tion.
The apparently equivalent spatial-resolu- tion values of linear and nonlinear W-cells shown in Fig. 7A and 8A are somewhat misleading because the comparisons involve

LINEAR AND NONLINEAR W-CELLS IN LGN
different response components (i.e., funda- mental versus second harmonic). If, instead, the fundamental-response components are compared between linear and nonlinear W- cells, a different picture emerges. In only four of the nonlinear W-cells was the spatial resolution of the fundamental response com- ponent above 0.05 cycle/deg, and these are shown in Fig. 8B, Consequently, the spatial resolution of the fundamental response com- ponent of nonlinear W-cells is lower than either the second-harmonic component of these cells (P < 0.01 on a Mann-Whitney U test) or the spatial resolution of the linear W-cells (P < 0.01 on a Mann-Whitney U test).
n Linear W-Cells
L
Nonlinear W-Cells
0 SPATIAL RESOLtJTION &c-a)4
TEMPORAL RESOLUTION (Hz)
FIG. 7. Frequency histograms of spatial and tem- poral resolutions. These are, respectively, the highest spatial frequency at 0.84 contrast and 2 Hz to which the cell responded and the highest temporal frequency at 0.84 contrast and any spatial frequency to which the cell responded. A: spatial resolution for 10 linear and 12 nonlinear W-cells. B: temporal resolution for 10 linear and 9 nonlinear W-cells.
0.6
u
Cl
B
0 0
0
00 0
I r I I 1 I r
SPATIAL RESOLhON (c3ycldeg)
FIG. 8. Spatial resolution of W-cells as a function of temporal resolution and receptive-field center diameter. A: spatial versus temporal resolution. The temporal resolution for each nonlinear W-cell was derived from the fundamental response component, but the spatial resolution was derived from the second-harmonic com- ponent (see text for details). B: spatial resolution versus the inverse of receptive-field center diameter. The res- olution values represented for nonlinear W-cells include only their fundamental response components, and only the four nonlinear W-cells shown displayed resolution values above 0.05 cycles/deg (see text for details).
Figure 88 shows the surprising l&k of correlation for W-cells between receptive- field center size and spatial resolution of the fundamental response component. No cor- relation was found for either linear or non- linear W-cells (P > 0.1 for either group). By contrast, for geniculate X- and Y-cells, there is a strong inverse relationship between these parameters of field size and spatial resolu- tion (23, 36). Such a relationship for W-cells would require nonlinear W-cells to have
880 M. SUR AND S. M. SHERMAN
much larger field centers than do linear W- cells, but Fig. 2 reveals no such difference. The conclusion derived from Fig. 8B must be qualified due to the uncertainty noted above in deriving precise receptive-field mea- surements for W-cells.
Contrast sensitivity: a comparison among W-, X-, and Y-cells
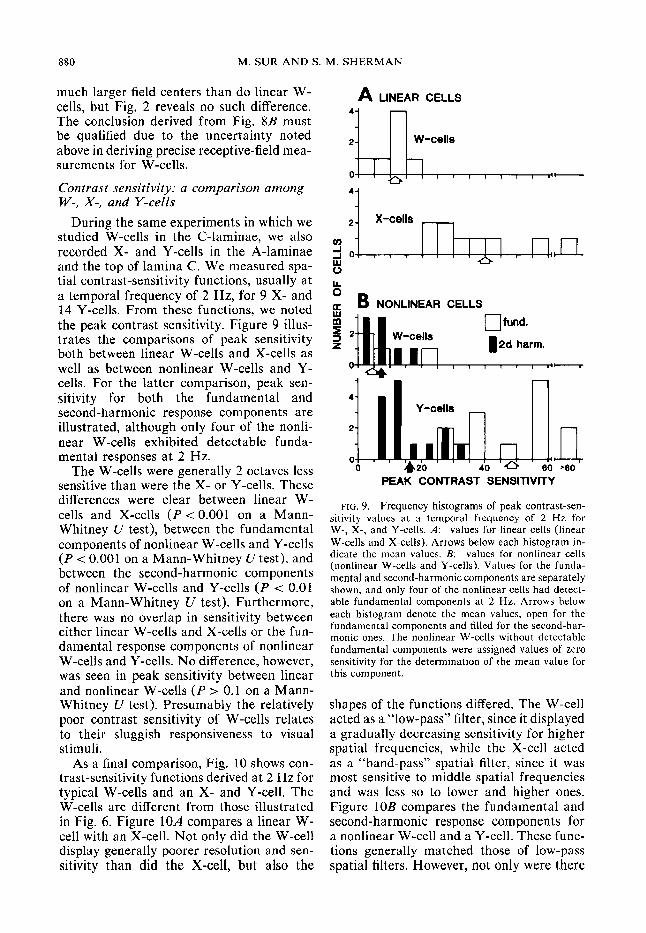
During the same experiments in which we studied W-cells in the C-laminae, we also recorded X- and Y-cells in the A-laminae and the top of lamina C. We measured spa- tial contrast-sensitivity functions, usually at a temporal frequency of 2 Hz, for 9 X- and 14 Y-cells. From these functions, we noted the peak contrast sensitivity. Figure 9 illus- trates the comparisons of peak sensitivity both between linear W-cells and X-cells as well as between nonlinear W-cells and Y- cells. For the latter comparison, peak sen- sitivity for both the fundamental and second-harmonic response components are illustrated, although only four of the nonli- near W-cells exhibited detectable funda- mental responses at 2 Hz.
The W-cells were generally 2 octaves less sensitive than were the X- or Y-cells. These differences were clear between linear W- cells and X-cells (P < 0.00 1 on a Mann- Whitney U test), between the fundamental components of nonlinear W-cells and Y-cells (P < 0.001 on a Mann-Whitney U test), and between the second-harmonic components of nonlinear W-cells and Y-cells (P < 0.01 on a Mann-Whitney U test). Furthermore, there was no overlap in sensitivity between either linear W-cells and X-cells or the fun- damental response components of nonlinear W-cells and Y-cells. No difference, however, was seen in peak sensitivity between linear and nonlinear W-cells (P > 0.1 on a Mann- Whitney U test). Presumably the relatively poor contrast sensitivity of W-cells relates to their sluggish responsiveness to visual stimuli,
As a final comparison, Fig. 10 shows con- trast-sensitivity functions derived at 2 Hz for typical W-cells and an X- and Y-cell. The W-cells are different from those illustrated in Fig. 6. Figure 1OA compares a linear W- cell with an X-cell. Not only did the W-cell display generally poorer resolution and sen- sitivity than did the X-cell, but also the
A LINEAR CELLS
0
& oc B NONLtNEAR CELLS
cl fund. W-cells 26 harm. j! 4
Y-CM3
2
0 n 0 420 40 6 60 ‘60
PEAK CONTRAST SENSlTtVlTY
FIG. 9. Frequency histograms of peak contrast-sen- sitivity values at a temporal frequency of 2 Hz for W-, X-, and Y-cells. A: values for linear cells (linear W-cells and X-cells). Arrows below each histogram in- dicate the mean values. B: values for nonlinear cells (nonlinear W-cells and Y-cells). Values for the funda- mental and second-harmonic components are separately shown, and only four of the nonlinear cells had detect- able fundamental components at 2 Hz. Arrows below each histogram denote the mean values, open for the fundamental components and filled for the second-har- monic ones. The nonlinear W-cells without detectable fundamental components were assigned values of zero sensitivity for the determination of the mean value for this component.
shapes of the functions differed. The W-cell acted as a “low-pass” filter, since it displayed a gradually decreasing sensitivity for higher spatial frequencies, while the X-cell acted as a “band-pass” spatial filter, since it was most sensitive to middle spatial frequencies and was less so to lower and higher ones, Figure 1OB compares the fundamental and second-harmonic response components for a nonlinear W-cell and a Y-cell. These func- tions generally matched those of low-pass spatial filters. However, not only were there

LINEAR AND NONLINEAR W-CELLS IN LGN 881
100 1A LINEAR CELLS
+ 100 co a a 50 I- z 0 0 20
10
B NONLINEAR CELLS
v
I I I 1 I I
0.05 0.1 0.2 0.5 1 2
SPATIAL FREQUENCY WC/D=)
FIG. 10. Spatial-contrast sensitivity functions at 2 Hz. A: functions for a linear W-cell and an X-cell. B: functions for a nonlinear W-cell and a Y-cell. The fun- damental and second-harmonic components are sepa- rately indicated.
differences in resolution and sensitivity be- tween the W- and Y-cell, but there also ex- isted differences in the relationship of the two response components for each cell. For the Y-cell, the fundamental component was more sensitive at lower spatial frequencies, and the second-harmonic component domi- nated at higher ones. For the W-cell, the second-harmonic component was more sen- sitive at all spatial frequencies tested. The greatest difference in contrast sensitivity be- tween the nonlinear W-cell and Y-cell was evident in their fundamental response com- ponents; their second-harmonic response
components displayed less of a difference from one another (Figs. 9B and 1OB ).
Other differences between linear and nonlinear W-cells
Although the W-cells in this study could be reliably and easily identified as linear or nonlinear, as described above, only one dif- ference could be detected in response prop- erties between linear and nonlinear W-cells. The one difference concerns response dy- namics: each of the 5 tonic W-cells (i.e., possibly related to sluggish-sustained gan- glion cells in the retina; see Refs. 5, 6, 8) was linear in spatial and temporal summa- tion, whereas the phasic W-cells (i.e., pos- sibly related to sluggish-transient ganglion cells in the retina; see Refs. 5, 6, 8) were either linear (7 cells) or nonlinear ( 14 cells) in spatial and temporal summation. The two on-off center W-cells were phasic and non- linear. Otherwise, no difference between lin- ear and nonlinear W-cells was seen for la- tency to optic chiasm stimulation (Fig. l), receptive-field center size (Fig. 2), sensitivity to visual stimuli (e.g., Figs. 6 and 9), or overall spatial or temporal resolution (Fig. 7).
DISCUSSION
A major conclusion of this study is that W-cells found in the C-laminae of the cat’s lateral geniculate nucleus can be reliably subdivided into types that exhibit linear or nonlinear spatial and temporal summation, These occur in roughly equal numbers. The linear or nonlinear classification does not appear to correlate with most other response properties (see RESULTS). The functional significance of this linear and nonlinear dis- tinction and its implications for cell classi- fication are considered below.
Cell classi$cation TERMINOLOGY. We have used the term W- cell to describe those cells in the geniculate C-laminae that do not exhibit X- or Y-cell properties. As noted in the INTRODUCTION,
the main justification for this terminology is our desire to avoid new nomenclature without sufficient data for doing so. We thus used existing terminology (cf. Ref. 39).
However, we emphasize that W-cell as a descriptive phrase should not carry the same

882 M. SUR AND S. M. SHERMAN
implication as X-cell or Y-cell. X- and Y- cells in retina and the lateral geniculate nu- cleus are each relatively homogeneous cell classes. Furthermore, geniculate X- or Y- cells closely resemble their retinal counter- parts in terms of reponse properties. Indeed, Cleland et al. (4) showed that each genic- ulate X- or Y-cell typically receives direct retinal input from one or very few ganglion cells of the same functional class.
The situation regarding W-cells is much less clear, partly because of the functional heterogeneity of the retinal W-cells and partly because so little is known of the prop- erties of retinal or geniculate W-cells. It is not clear what subclasses of retinal W-cells innervate the C-laminae cells described in the present study. The observation that these C-lamina cells are fairly homogeneous com- pared to the multiplicity of response types described for retina suggests that a fairly small subset provides the retinogeniculate innervation to the C-laminae. However, without more detailed knowledge of the re- sponse properties of retinal and geniculate W-cells, the nature of the retinogeniculate circuitry is barely open to speculation. In- deed, it is possible that many W-cells of the C-laminae do not receive monosynaptic in- put from the optic tract, since their long re- sponse latencies to optic chiasm stimulation raise the possibility that many of these cells are polysynaptically activated. Finally, the C-laminae receive inputs from visual struc- tures (e.g., the superior colliculus and nu- cleus of the optic tract) that do not innervate the A-laminae (16, 17, 27). For all of these reasons, circuitry in the W-cell pathway may be quite different from that in the X- and Y-cell pathways.
ARE W-CELLS A CLASS DISTINCT FROM X- AND Y-CELLS? X- and Y-cells in the retina were originally distinguished by Enroth-Cu- gel1 and Robson (11) on the basis of linearity of spatial summation to visual stimuli, and this has been extended to the lateral genic- ulate nucleus (32). X-cells are linear and Y- cells are nonlinear in much the same way as W-cells in the lateral geniculate nucleus have been termed linear or nonlinear in the present paper. This raises the possibility that linear W-cells really represent a subclass of X-cells and nonlinear W-cells, a subclass of
Y-cells. This, in turn, would require that lin- ear W-cell properties be continuous with those of X-cells and, likewise, for nonlinear W-cells and Y-cells.
We feel that the present evidence, al- though incomplete, rather convincingly ar- gues that W-cells, at least in the geniculate C-laminae, are quite distinct from genic- ulate X- and Y-cells. Indeed, linear and non- linear W-cells resemble each other much more than either resembles X- or Y-cells, although more detailed quantitative com- parisons among W-, X-, and Y-cells still need to be made. The features that seem to distinguish W-cells from X- and Y-cells in the lateral geniculate nucleus include axonal conduction velocity of retinal afferents (pres- ent study and Refs. 8,43,44), responsiveness and contrast sensitivity to visual stimuli (present study and Refs. 8, 43), receptive- field size (present study and Refs. 8, 43), spatial resolution (present study), contrast- sensitivity functions (present study), neu- ronal distribution and morphology (8, 12, 13, 38, 43), and geniculocortical projection pat- terns (8, 10, 14, 15, 25, 26, 28, 30, 37, 43). W-cells in the retina differ from retinal X- and Y-cells along most of these same par- ameters as well ( 1, 5-7, 40, 41). Although certain of these properties exhibit limited overlap with some X- or Y-cell properties, a consideration of all of these features rather clearly distinguishes W-cells as a neuronal class quite different from X- or Y-cells.
DO LINEAR AND NONLINEAR W-CELLS REP- RESENTSEPARATECLASSES? Although we feel that W-cells should not be placed in X- or Y-cell classes, we are not suggesting that W-cells are a single class, even in the C-lam- inae of the lateral geniculate nucleus. We cannot yet determine if more than one class is needed to encompass this rather hetero- geneous group, In the present study, we have concentrated on the division of W-cells into linear and nonlinear types.
We emphasize that the terminology of lin- ear and nonlinear, as applied to these neu- rons, refers only to limited linearity or non- linearity of spatial and temporal summation measured with sine-wave gratings as the vi- sual stimuli. This terminology does not en- compass other aspects of the responses of these cells. For example, all neurons possess

LINEAR AND NONLINEAR W-CELLS IN LGN 883
a number of nonlinearities of response that are independent of the spatial and temporal pooling that we have investigated in the pres- ent paper (e.g., the rectified action potential, refractory period, etc.). Similarly, many nonlinear W-cells and all Y-cells have re- sponse components that exhibit linearity of spatial and temporal summation.
By our criteria of identification, linear and nonlinear W-cells respond quite differently from one another to sine-wave gratings. That is, the fundamental-response component of linear W-cells exhibits greater contrast sen- sitivity and spatial resolution than does that of nonlinear W-cells. One obvious conse- quence of this is that the linear W-cells are more sensitive to the spatial phase, and thus position, of the stimulus than are the non- linear W-cells. Similarly, the linear W-cells more faithfully represent temporal aspects of the stimulus in their response dynamics than do nonlinear W-cells.
Nevertheless, W-cells that exhibit linear and nonlinear spatial and temporal sum- mation seem rather similar along other func- tional dimensions (response latency to optic chiasm stimulation, receptive-field size, etc.). There also appears to be no obvious mor- phological difference between linear and nonlinear W-cells, as judged by intracellular HRP injections placed into the physiologi- cally identified types (L. R. Stanford, M. J. Friedlander, and S. M. Sherman, unpub-
REFERENCES
1. BOYCOTT, B. B. ANDW~SSLE, H. The morpholog- ical types of ganglion cells of the domestic cat’s retina. J. Physiol. London 240: 397-419, 1974.
2. BULLIER, J. AND NORTON, T, T. X and Y relay cells in cat lateral geniculate nucleus: quantitative analysis of receptive-field properties and classifi- cation. J. Neurophysiol. 42: 244-273, 1979.
3. BWLLIER, J. AND NORTON, T. T. Comparison of receptive-field properties of X and Y ganglion cells with X and Y lateral geniculate cells in the cat. J. Neuruphysiol42: 274-29 1, 1979.
4. CLELAND, B. G., DUBIN, M. W., AND LEVICK, W. R. Sustained and transient neurones in the cat’s retina and lateral geniculate nucleus. J. Physiol. London 217: 413-496, 1971.
5. CLELAND, B. G, AND LEVICK, W. R. Brisk and sluggish concentrically organised ganglion cells in the cat’s retina. J. Physiol, London 240: 421-456, 1974.
6. CLELAND, B. G. ANDLEVICK, W. R. Properties of rarely encountered types of ganglion cells in the
lished observation). Therefore, differences in spatial and temporal summation do not at present seem to justify the division of linear and nonlinear W-cells into two classes. Much more data are needed to resolve this issue.
Concluding remarks The W-cells in the C-laminae of the cat’s
lateral geniculate nucleus seem quite differ- ent from X- and Y-cells, and at least two types have been noted. We have termed these linear and nonlinear W-cells on the basis of their spatial and temporal summa- tion properties. The large areas of cortex that are directly innervated by the W-cell geniculocortical pathway (e.g., Refs. 10, 28) suggest an important functional role for these W-cells of the geniculate C-laminae. The poor contrast sensitivity, poor respon- siveness, and poor spatial resolution that are characteristic features of these cells suggest that they function largely in the presence of large (i.e., low spatial frequency) stimuli of high contrast.
ACKNOWLEDGMENTS
We thank L. R. Stanford for assistance in some of the experiments, and Sally Gibson and Joan Sommer- meyer for technical help.
This research was supported by Public Health Service Grant EYO3038.
Received 29 June 198 1; accepted in final form 14 December I98 1.
cat’s retina and an overall classification. J. Physiol. London 240: 457-492, 1974.
7. CLELAND, B, G. LEVICK, W. R., ANDWASSLE, H. Physiological identification of a morphological class of cat retinal ganglion cells. J. Physiol. London 248: 151-171, 1975.
8. CLELAND, B.G., MORSTYN, R., WAGNER, H.G., AND LEVICK, W. R. Long-latency retinal input to lateral geniculate neurones of the cat. Brain Rex 91: 306-310, 1975.
9, DERRINGTON, A.M. ANDFUCHS, A.F.Spatialand temporal properties of X- and Y-cells in the cat lateral geniculate nucleus. J. Physiol. London 293: 347-364, 1979.
10. DREHER,B.,LEVENTHAL, A. G.,ANDHALE, P.T. Geniculate inut to cat visual cortex: a comparison of area 19 with areas 17 and 18. J. Neurophysiol. 44: 804-826, 1980.
11. ENROTH-CUGELL,~. ANDROBSON, J.G.Thecon- trast sensitivity of retinal ganglion cells of the cat, J. Physiol. London 187: 517-552, 1966.

884 M. SUR AND S. M. SHERMAN
12.
13.
14.
15.
16.
17.
18.
19.
20.
21.
22.
23.
24.
25.
26.
27.
28.
FRIEDLANDER, M. J., LIN, C.-S., AND SHERMAN, S. M. Structure of physiologically identified X- and Y-cells in the cat’s lateral geniculate nucleus. Sci- ence 204: 1114-l 117, 1979. 29. FRIEDLANDER, M. J., LIN, C.-S., STANFORD, L. R., AND SHERMAN, S. M. Morphology of func- 30. tionally identified neurons in the lateral geniculate nucleus of the cat. J. Neurophysiol 46: 80-l 29, 1981. 31. FUKUDA, Y. AND STONE, J. Retinal distribution and central projections of Y-, X-, and W-cells of 32. the cat’s retina. J. Neurophysiol. 37: 749-772, 1974. GEISERT, E. E. Cortical projections of the lateral 33. geniculate nucleus in the cat. J. Camp. Neural. 190: 793-812, 1980. GRAHAM, J. An autoradiographic study of the ef- 34. ferent connections of the superior colliculus in the cat. J. Camp. Neural. 173: 629-654, 1977. GRAYBIEL, A. M. AND BERSON, D. M. Autoradio- graphic evidence for a projection from the pretectal nucleus of the optic tract to the dorsal lateral ge- 35. niculate complex in the cat. Brain Res. 195: 1- 12, 1980. HOCHSTEIN, S. AND SHAPLEY, R. M. Quantitative analysis of retinal ganglion cell classifications. J. Physiol. London 262: 237-264, 1976.
36 .
HOCHSTEIN, S. AND SHAPLEY, R. M. Linear and nonlinear subunits in Y cat retinal ganglion cells. J. Physiol. London 262: 265-284, 1976. HOFFMANN, K.-P., STONE, J., AND SHERMAN,
37.
S. M. Relay of receptive-field properties in dorsal lateral geniculate nucleus of the cat. J. Neuro- physiol. 35: 518-531, 1972. IKEDA, H. AND WRIGHT, M. J. Receptive field or- 38* ganization of “sustained” and “transient” retinal ganglion cells which subserve different functional roles. J. PhysioI. London 227: 769-800, 1972. KRATZ, K. E,, WEBB, S. V., AND SHERMAN, S. M. Electrophysiological classification of X- and Y-cells 39. in the cat’s lateral geniculate nucleus. Vision Res. 18: 489-492, 1978. LEHMKUHLE, S., KRATZ, K. E., MANGEL, S. C., AND SHERMAN, S. M. Spatial and temporal sen- 40, sitivity of X- and Y-cells in dorsal lateral geniculate nucleus of the cat. J. Neurophysiol. 43: 520-541, 1980. LENNIE, P. Parallel visual pathways. Vision Res.
41.
20: 561-594, 1980. LEVENTHAL, A. G. Evidence that the different 42 classes of relay cells of the cat’s lateral geniculate * nucleus terminate in different layers of the striate cortex. Exp. Brain Rex 237: 349-372, 1979. LEVENTHAL, A. G., KEENS, J., AND TORK, I. The afferent ganglion cells and cortical projections of 43. the retinal recipient zone (RRZ) of the cat’s “pul- vinar complex.” J. Comp. Neural. 194: 535-554, 1980. NIIMI, K., MIKI, M., AND KAWAMURA, S. As- 44. tending projections of the superior colliculus in the cat. Ukajimas Fol. Anat. Jpn. 47: 269-287, 1970. RACZKOWSKI, D. AND ROSENQUIST, A. C. Con-
nections of the parvocellular C laminae of the dorsal lateral geniculate nucleus with the visual cortex in the cat. Bruin Res. 199: 447-45 1, 1980. RODIECK, R. W. Visual pathways. Ann. Rev. Neu- rosci. 2: 193-225, 1979. ROWE, M. H. AND STONE, J. Properties of ganglion cells in the visual streak of the cat’s retina. J. Comp. Neural. 169: 99- 126, 1976. ROWE, M. H. AND STONE, J. Naming of neurones. Brain Behav. Evol. 14: N-216, 1977. SHAPLEY, R. AND HOCHSTEIN, S. Visual spatial summation in two classes of geniculate cells. Nature London 256: 41 l-413, 1975. SHERMAN, S. M. The functional significance of X- and Y-cells in normal and visually deprived cats. Trends Neurosci. 2: 192- 195, 1979. SHERMAN, S. M. Parallel pathways in the cat’s geniculocortical system: W-, X-, and Y-cells. In: Changing Concepts in the Nervous System, edited by A. Morrison and P. Strick. New York: Aca- demic, 1982, p. 337-359. SO, Y.-T. AND SHAPLEY, R. M. Spatial properties of X and Y cells in the lateral geniculate nucleus of the cat and conduction velocities of their inputs. Exp. Brain Rex 36: 533-550, 1979. So, Y.-T. AND SHAPLEY, R. Spatial tuning of cells in and around lateral geniculate nucleus of the cat: X and Y relay cells and perigeniculate interneurons. J. Neurophysiol. 45: 107- 120, 198 1. SPEAR, P. D., SMITH, D. C., AND WILLIAMS, L. L. Visual receptive-field properties of single neu- rons in cat’s ventral lateral geniculate nucleus. J, Neurophysiol. 40: 390-409, 1977.
STANFORD, L, R., FRIEDLANDER, M. J., AND SHERMAN, S. M. Morphology of physiologically identified W-cells in the C laminae of the cat’s Iat- era1 geniculate nucleus. J. Neurosci. 1: 578-584, 1981. STONE, J., DREHER, B., AND LEVENTHAL, A. Hi- erarchical and parallel mechanisms in the organi- zation of visual cortex. Brain Rex Rev. 1: 345-394, 1979.
STONE, J. AND FUKUDA, Y. Properties of cat retinal ganglion cells: a comparison of W-cells with X- and Y-cells. J. Neurophysiol. 37: 722-748, 1974.
STONE, J. AND HOFFMANN, K,-P. Very slow-con- ducting ganglion ceils in the cat’s retina: a major, new functional type? Brain Res. 43: 610-6 16, 1972. SUR, M., STANFORD, L. R., AND SHERMAN, S. M. W-cells in the C laminae of the cat’s lateral genic- ulate nucleus: contrast sensitivity and other re- sponse measures. Sot. Neurosci. Abstr. 7: 25, 198 l_ WILSON, P. D., ROWE, M. H., ANDSTONE, J. Prop- erties of relay cells in the cat’s lateral geniculate nucleus. A comparison of W-cells with X- and Y- cells. J. Neuropbysiol. 39: 1193- 1209, 1976.
WILSON, P. D, AND STONE, J. Evidence of W-cell input to the cat’s visual cortex via the C-laminae of the lateral geniculate nucleus. Brain Rex 92: 472-478, 1975.