linear correlation and regression analysis
TRANSCRIPT
Linear Correlation and
Regression Analysis
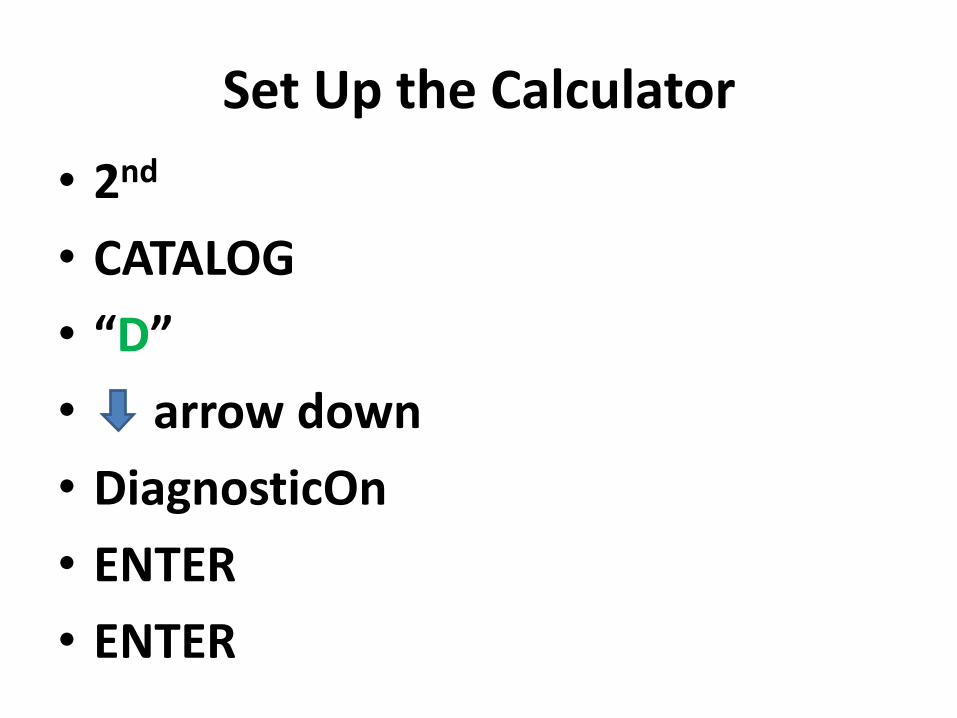
Set Up the Calculator
• 2nd
• CATALOG
• “D”
• arrow down
• DiagnosticOn
• ENTER
• ENTER
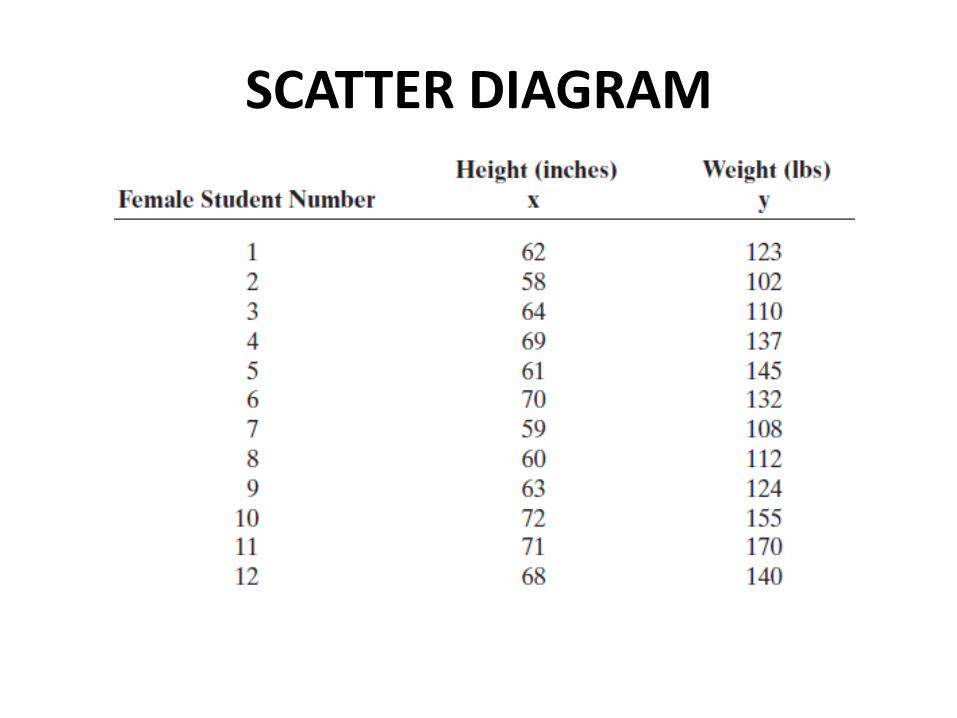
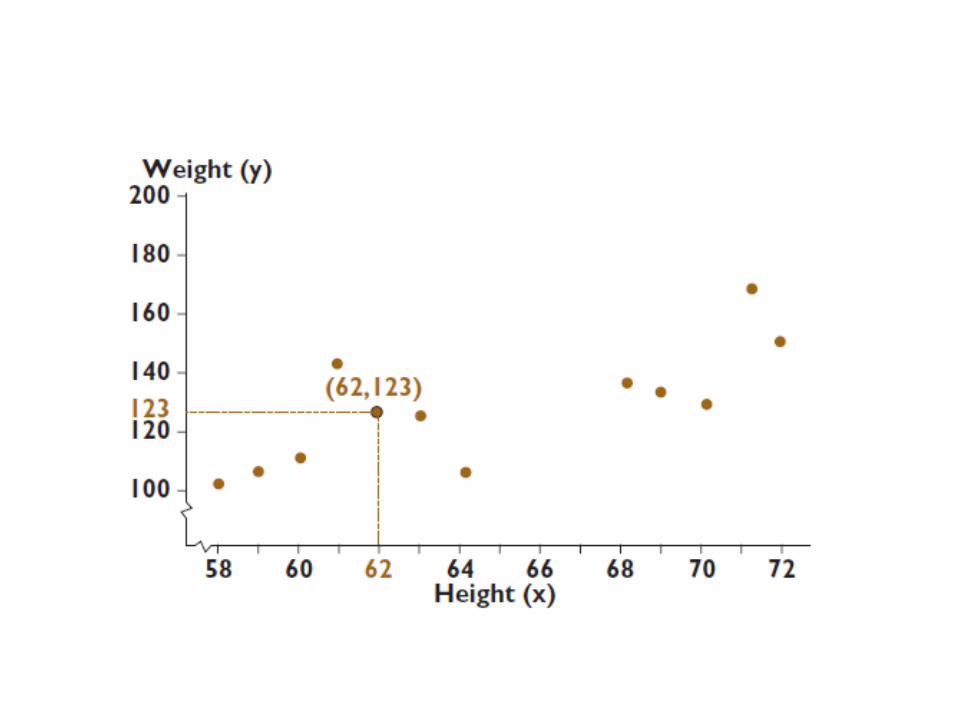
SCATTER DIAGRAM

Positive Linear Correlation

Positive Correlation
Variables will tend to pair
as high measurements for
x with high measurements
for y and low x with low y

Negative correlation
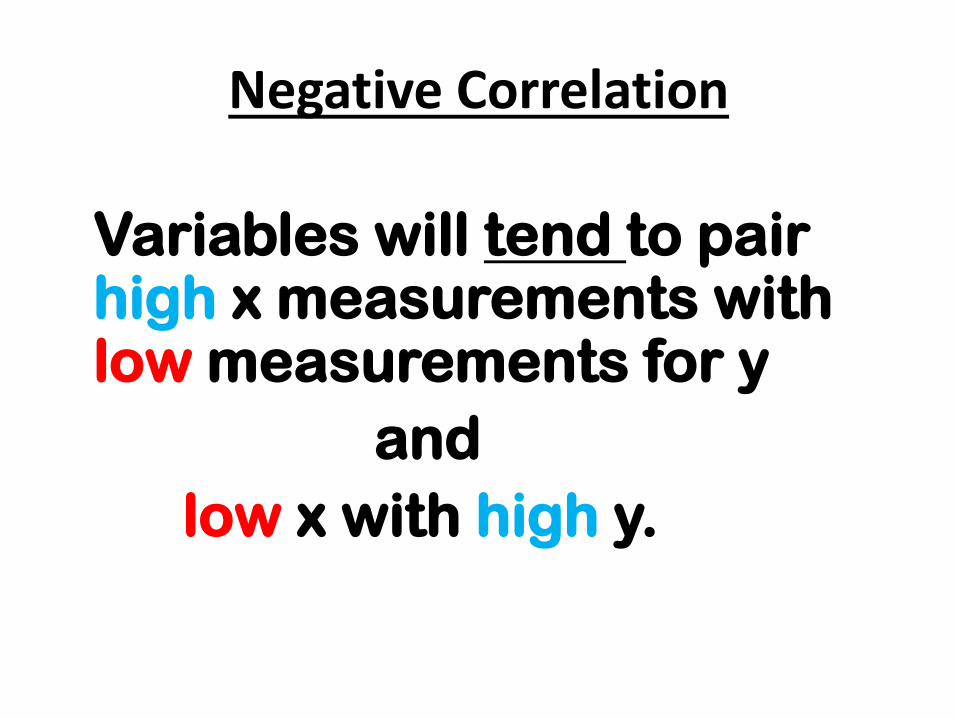
Negative Correlation
Variables will tend to pair high x measurements with low measurements for y
and
low x with high y.
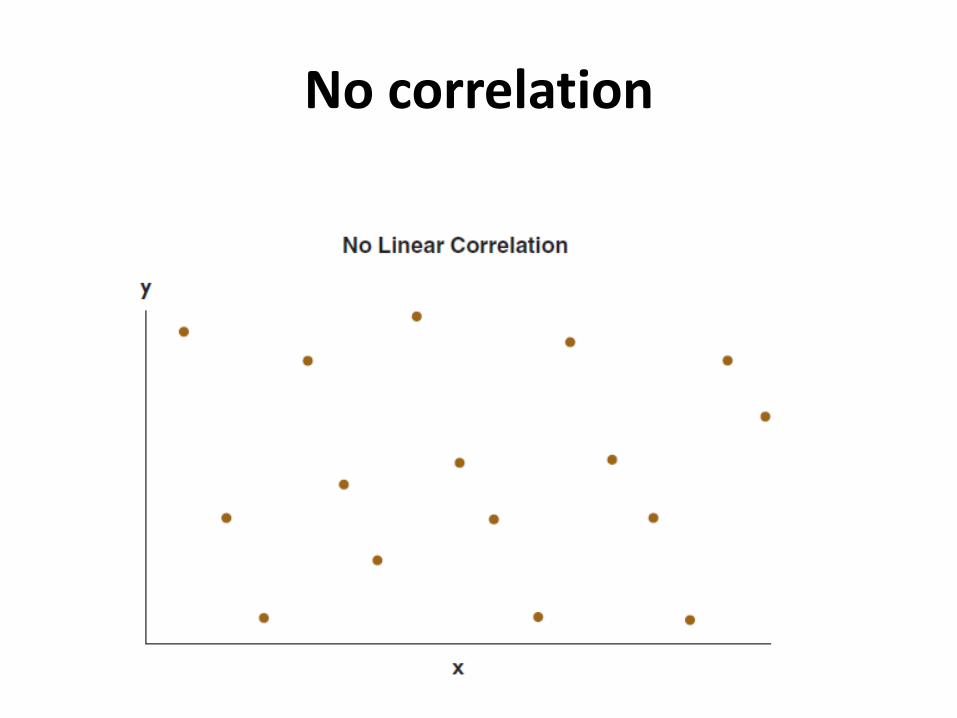
No correlation
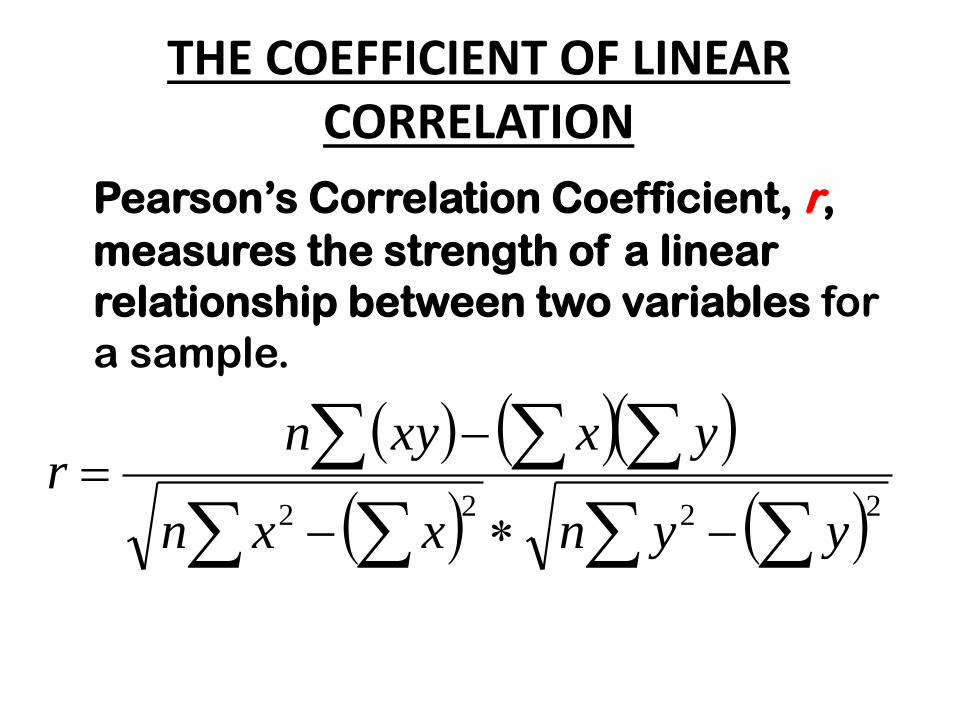
THE COEFFICIENT OF LINEAR CORRELATION
Pearson’s Correlation Coefficient, r,
measures the strength of a linear
relationship between two variables for
a sample.
2222
yynxxn
yxxynr
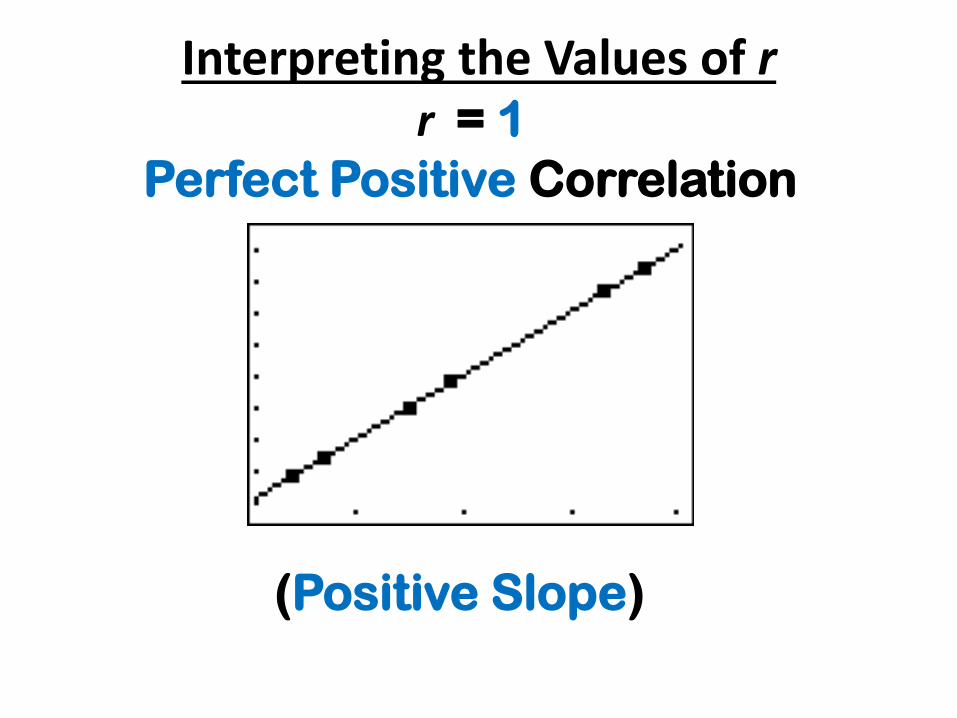
Interpreting the Values of r r = 1
Perfect Positive Correlation
(Positive Slope)
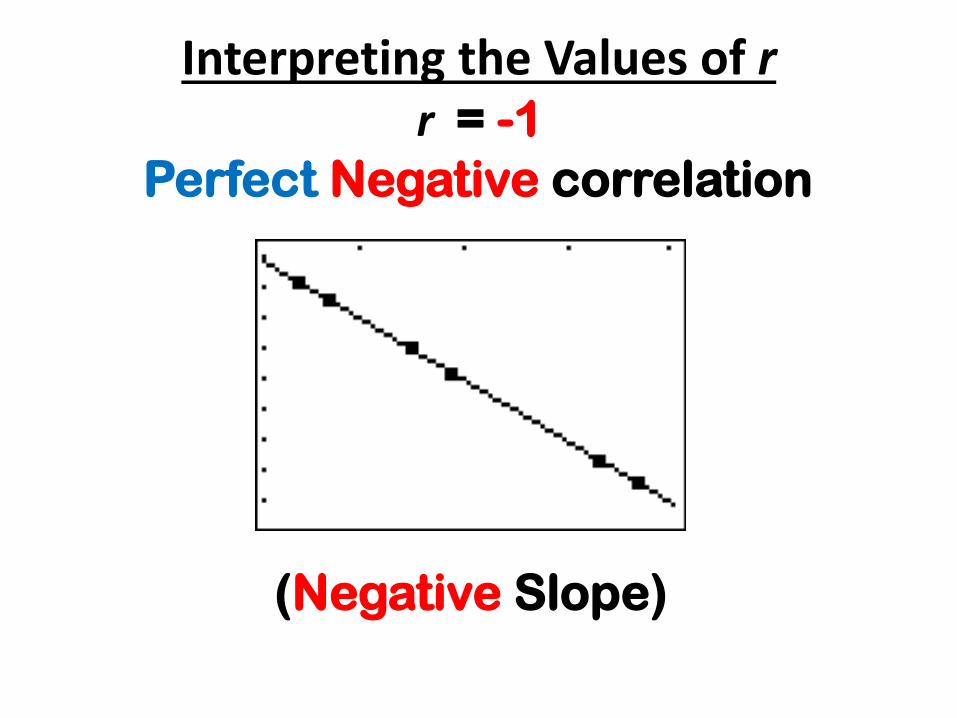
Interpreting the Values of r r = -1
Perfect Negative correlation
(Negative Slope)
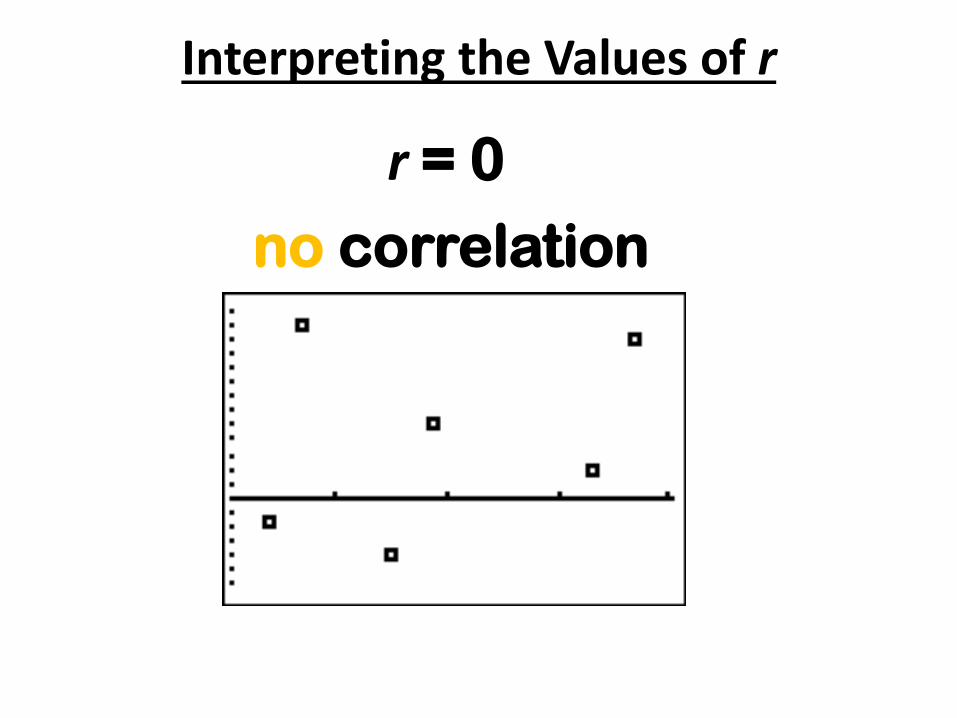
Interpreting the Values of r
r = 0
no correlation
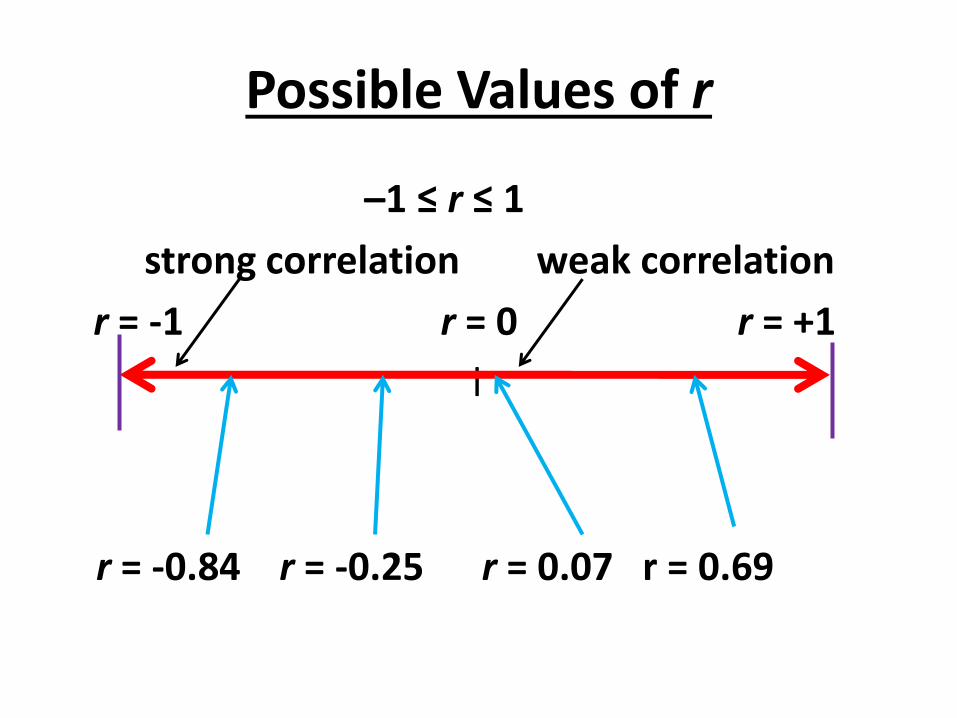
Possible Values of r
–1 ≤ r ≤ 1
strong correlation weak correlation
r = -1 r = 0 r = +1
l
r = -0.84 r = -0.25 r = 0.07 r = 0.69
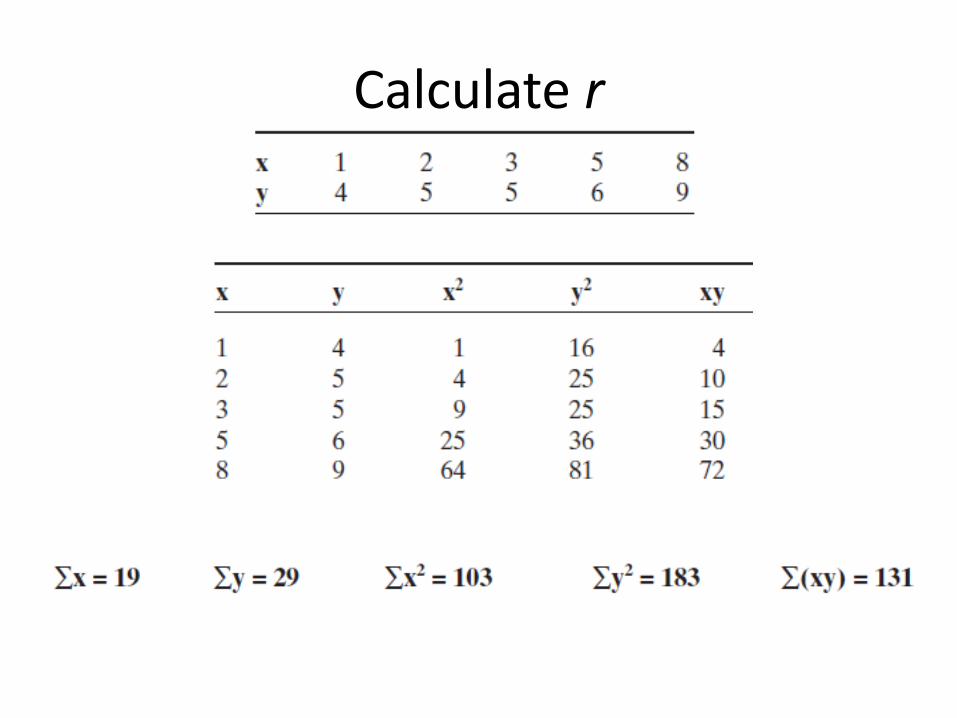
Calculate r
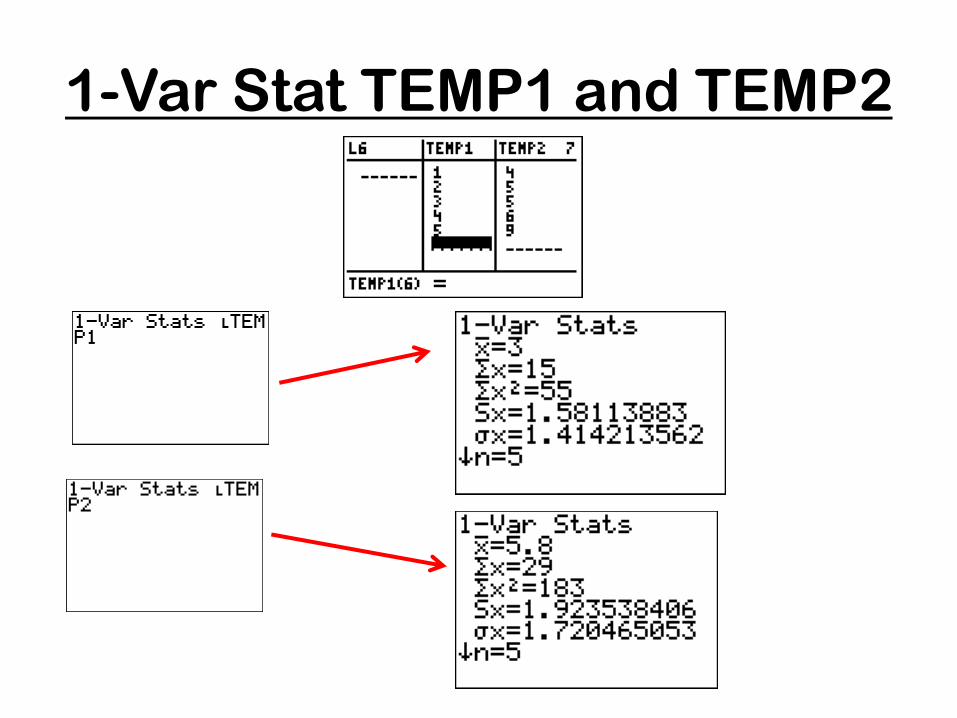
1-Var Stat TEMP1 and TEMP2
What is…
xy


TESTING THE SIGNIFICANCE OF THE CORRELATION COEFFICIENT
Is there a significant correlation between:
HS average and success in college?
Hours of T.V. watched and IQ score?
Age and blood pressure?
Advertising expenditures and sales?
Mothers shoe size and daughters IQ?
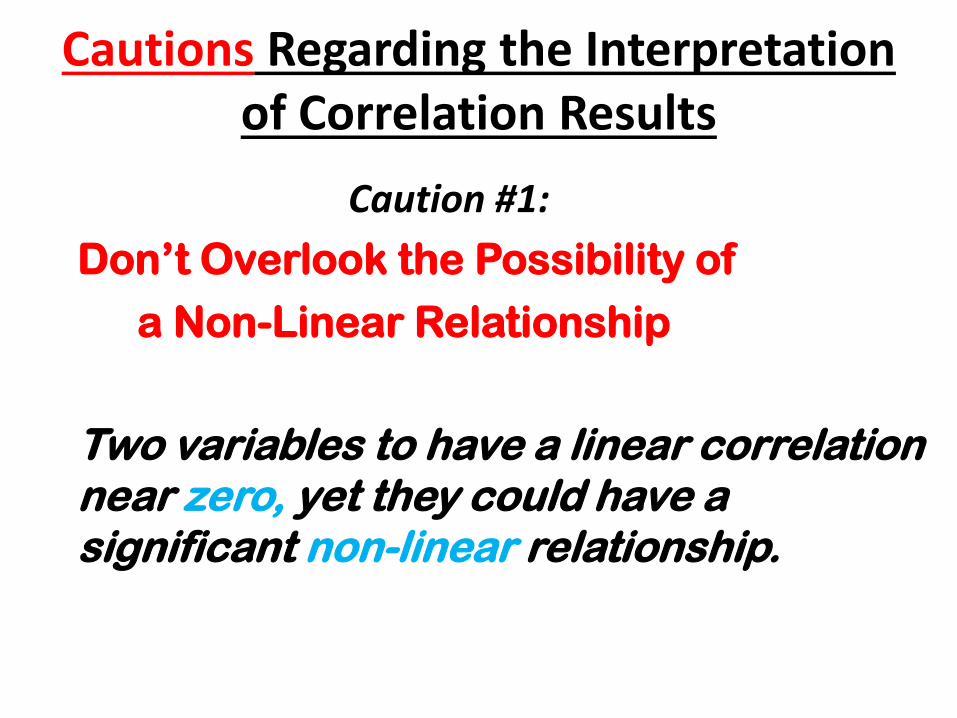
Cautions Regarding the Interpretation of Correlation Results
Caution #1:
Don’t Overlook the Possibility of
a Non-Linear Relationship
Two variables to have a linear correlation near zero, yet they could have a significant non-linear relationship.
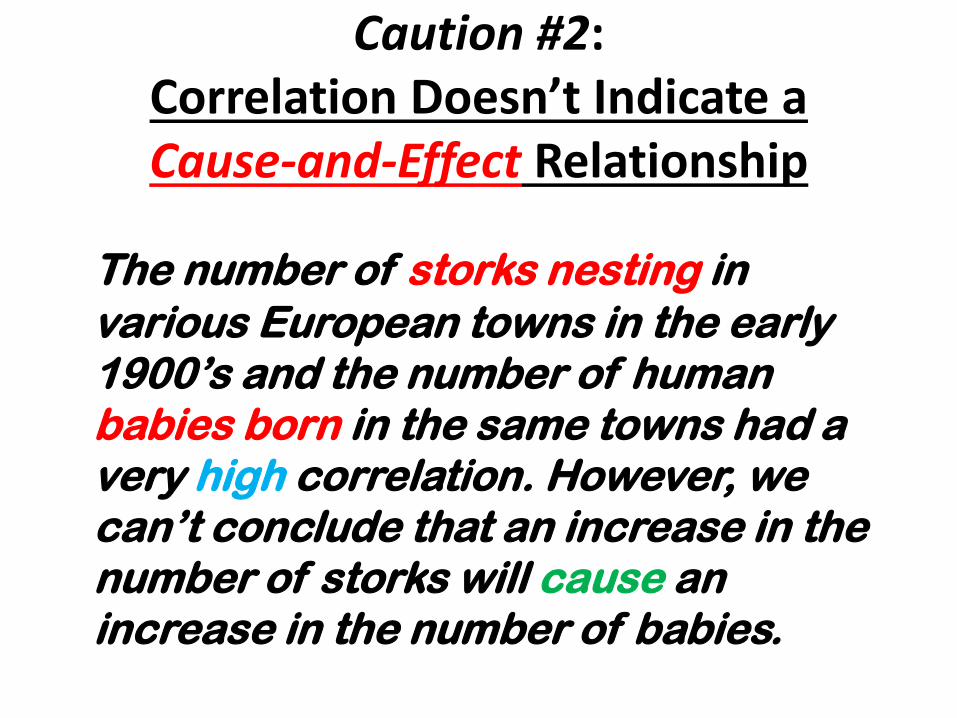
Caution #2: Correlation Doesn’t Indicate a Cause-and-Effect Relationship
The number of storks nesting in
various European towns in the early 1900’s and the number of human babies born in the same towns had a very high correlation. However, we can’t conclude that an increase in the number of storks will cause an increase in the number of babies.

TESTING THE SIGNIFICANCE OF THE CORRELATION COEFFICIENT
The population correlation coefficient
is symbolized by Greek letter rho: ρ
The sample correlation coefficient r is
an estimate of the population
correlation coefficient.
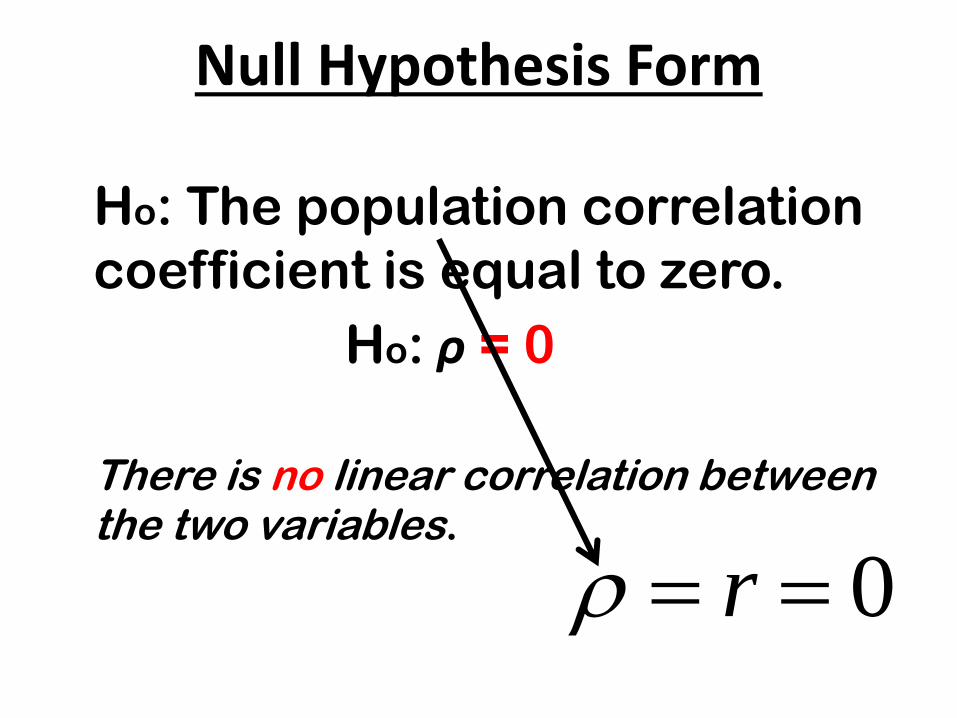
Null Hypothesis Form
Ho: The population correlation
coefficient is equal to zero.
Ho: ρ = 0
There is no linear correlation between the two variables.
0 r
3 Forms of the Alternative Hypothesis
Ha:
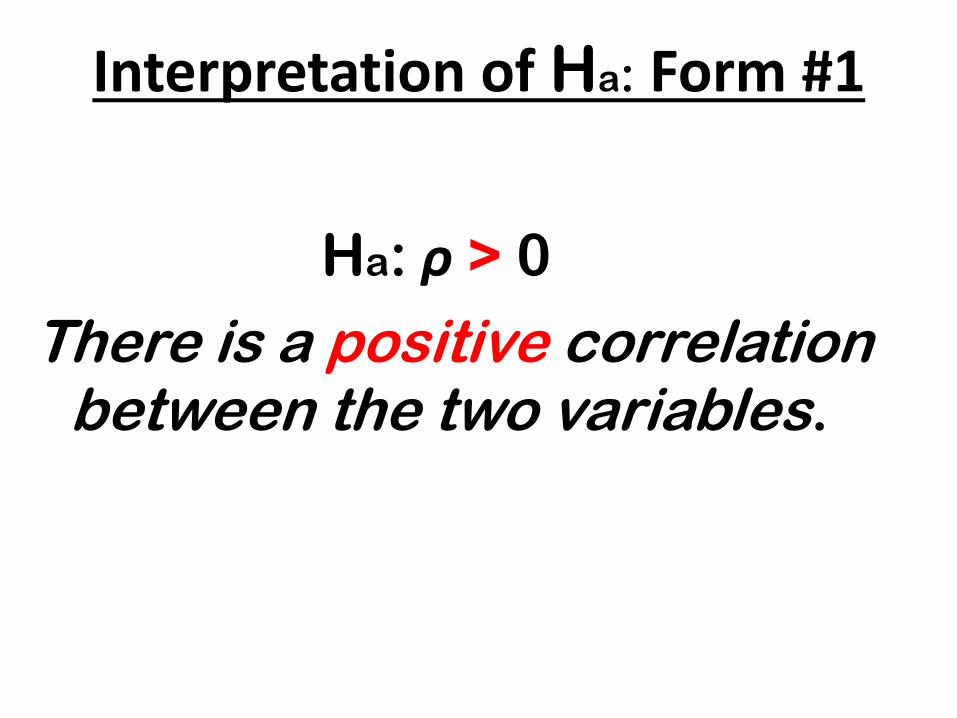
Ha: ρ > 0
There is a positive correlation between the two variables.
Interpretation of Ha: Form #1
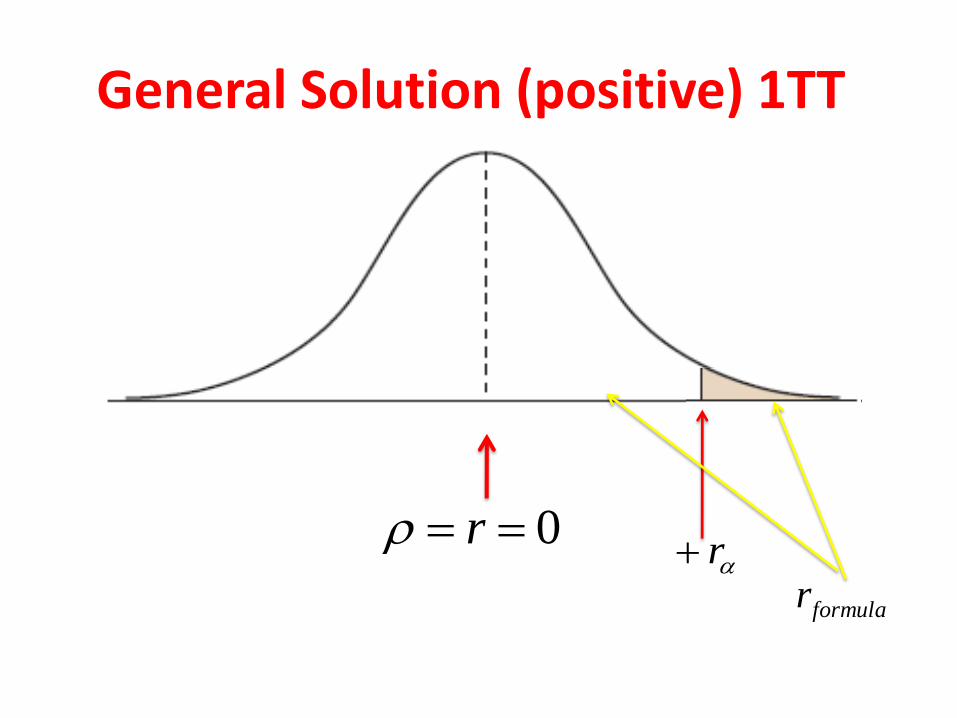
formular
General Solution (positive) 1TT >
0 rr
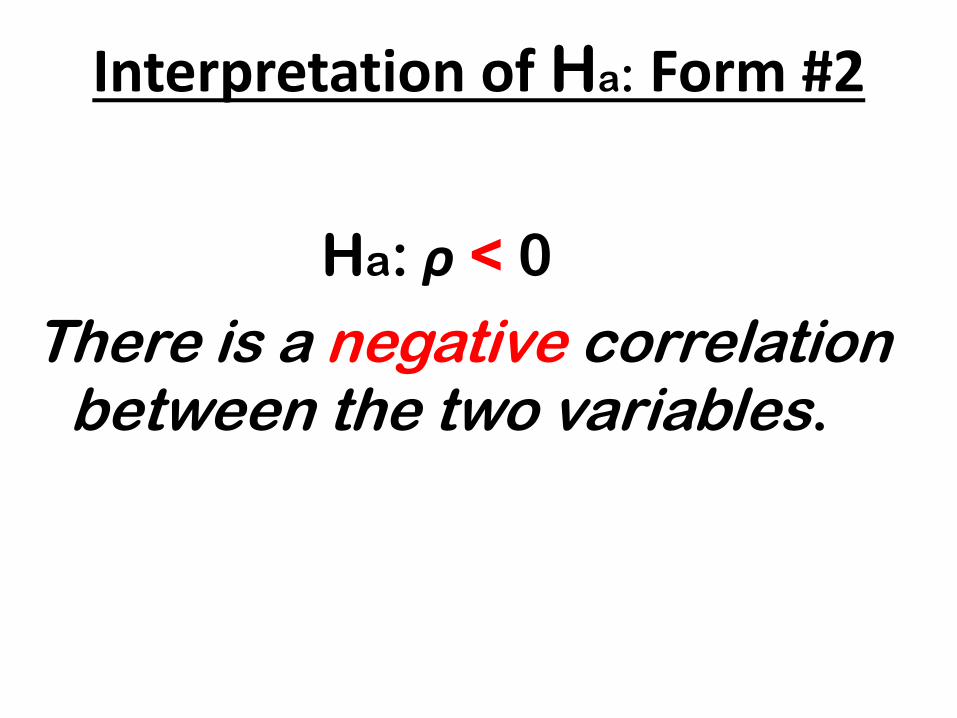
Ha: ρ < 0
There is a negative correlation between the two variables.
Interpretation of Ha: Form #2
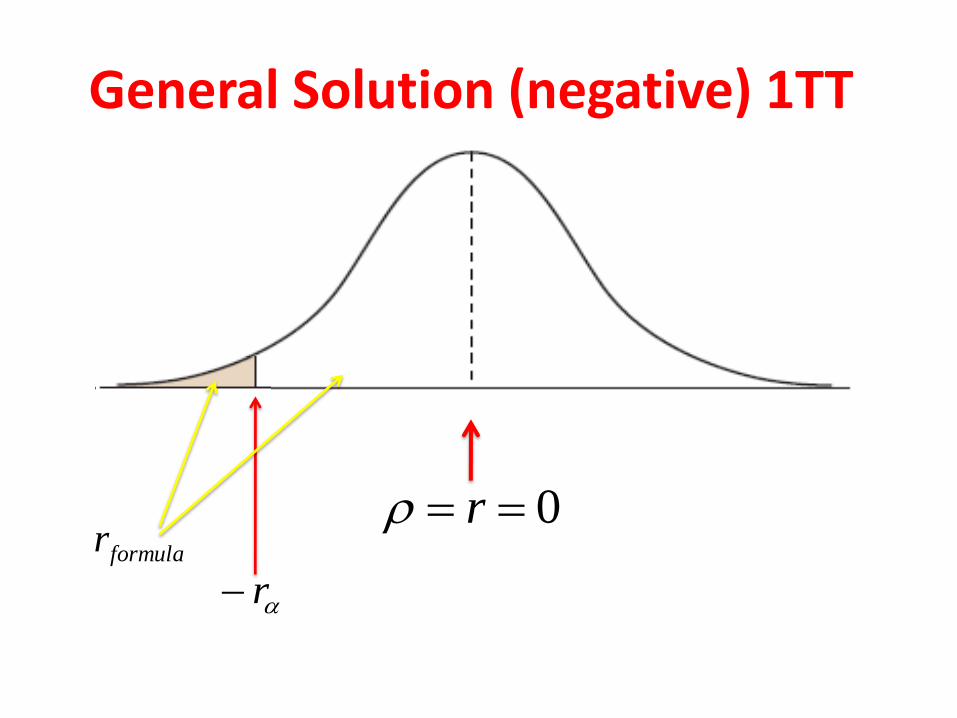
formular0 r
General Solution (negative) 1TT >
r
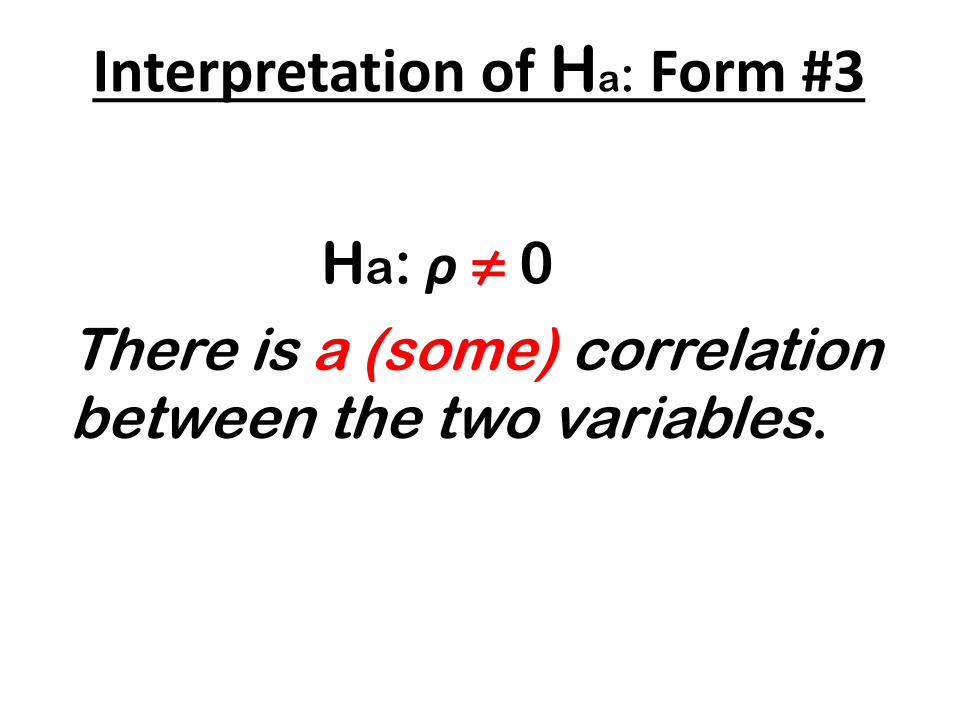
Ha: ρ ≠ 0
There is a (some) correlation between the two variables.
Interpretation of Ha: Form #3
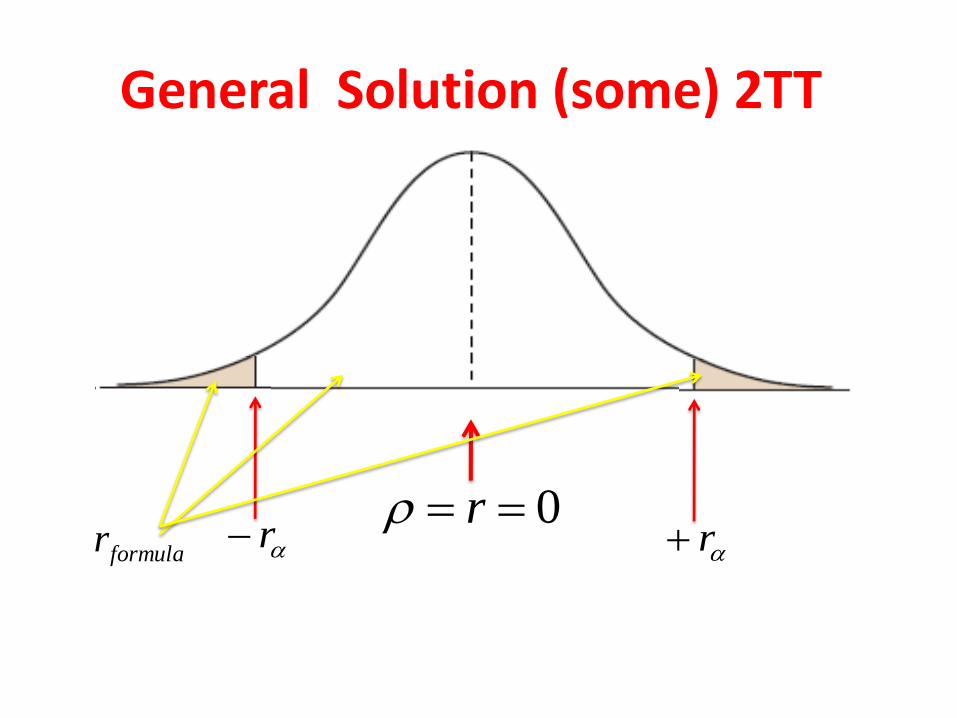
formular r0 r
General Solution (some) 2TT >
r
Degrees of freedom for
testing the correlation
coefficient
Subtract two from the
number of pairs of data
df = n – 2

Coefficient of Determination
is the influence that the
variance in the
independent variable
has on the
dependent variable.
is unexplained.
2r
21 r
Determine the variables
grades vs. study hours
independent is… dependent is…
Determine the variables
credits vs. age
sun light vs. height of a plant
bike vs. presidents
gift vs. work
LINEAR REGRESSION ANALYSIS
Regression Line Formula:
y' = a + bx
y' is the predicted value of y,
the dependent variable,
given
the value of x,
the independent variable.

Example
A scientists wants to
determine if there is a linear
relationship between the
amount of rainfall in May and
the number of mosquitoes. For
each of the selected years,
data pairs have listed in the
table.
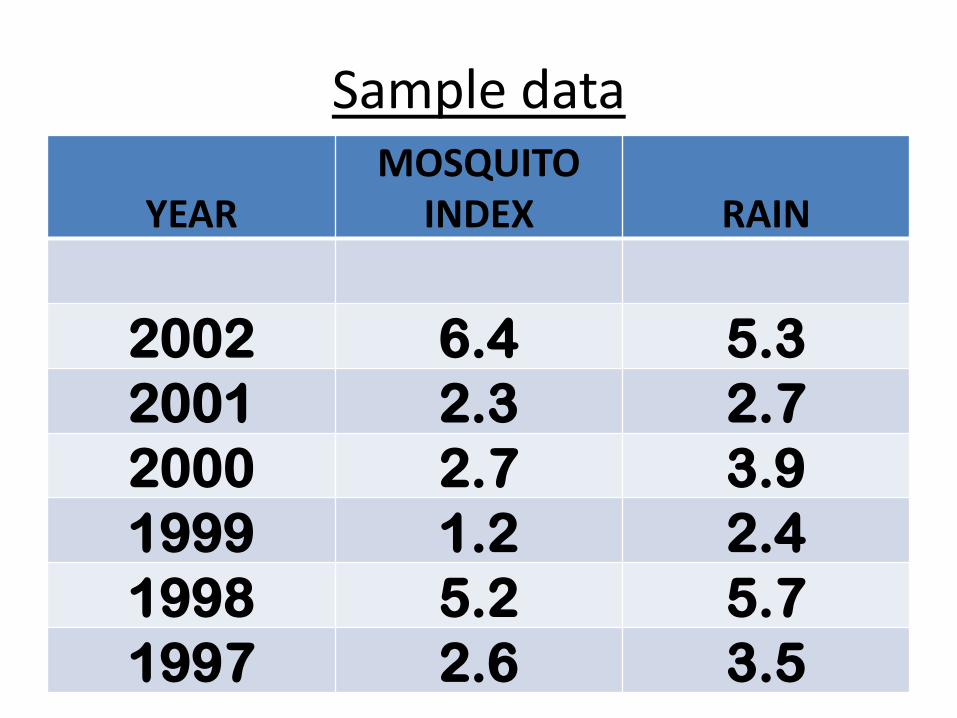
Sample data
YEAR MOSQUITO
INDEX RAIN
2002 6.4 5.3
2001 2.3 2.7
2000 2.7 3.9
1999 1.2 2.4
1998 5.2 5.7
1997 2.6 3.5
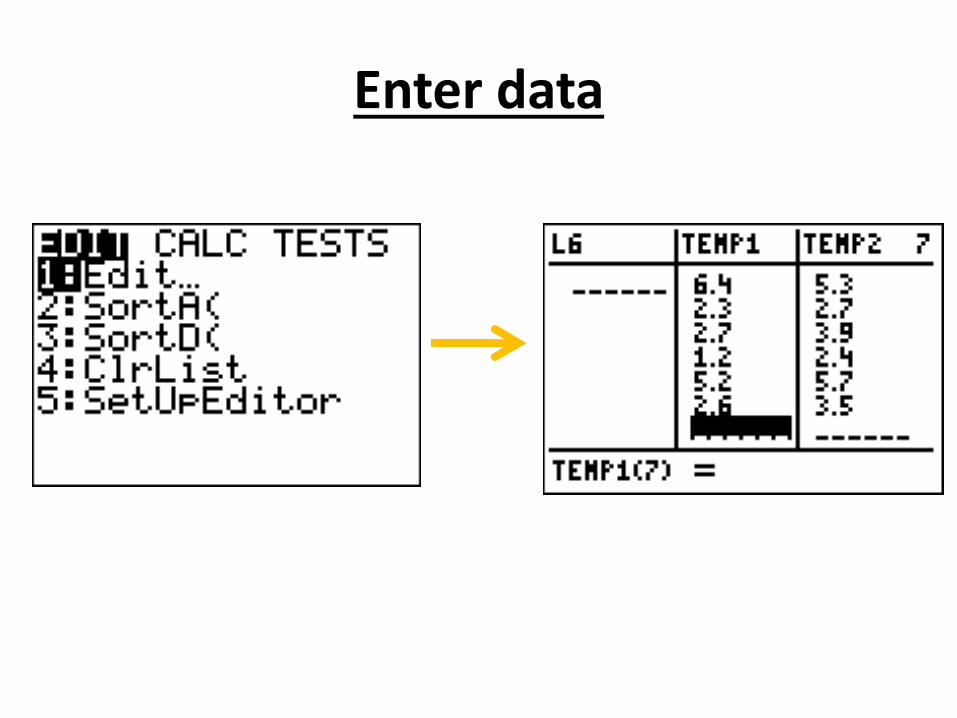
Enter data
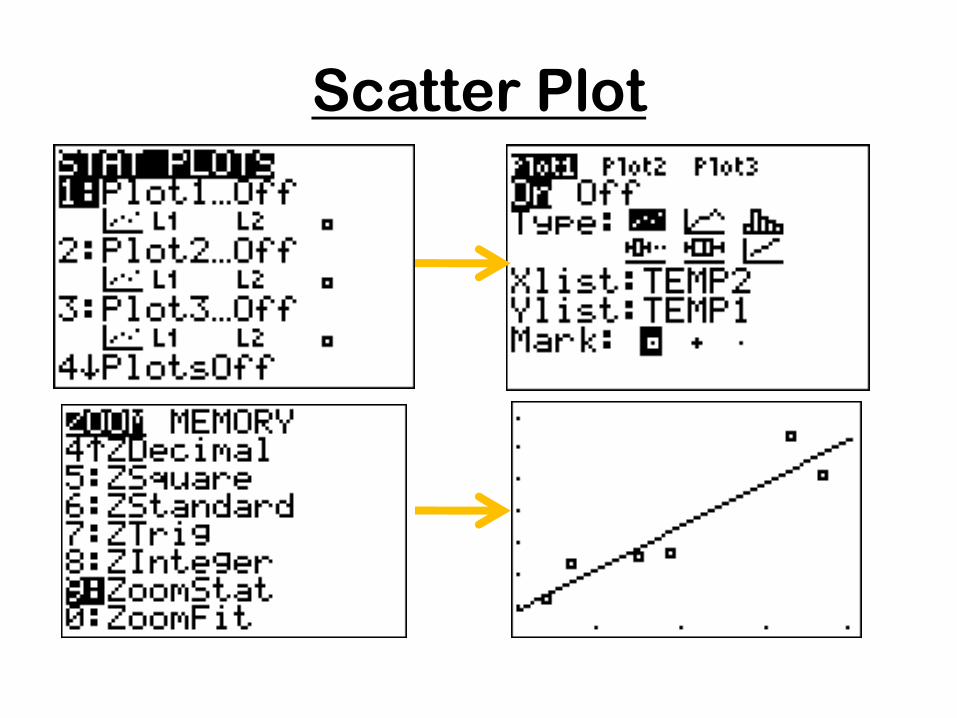
Scatter Plot
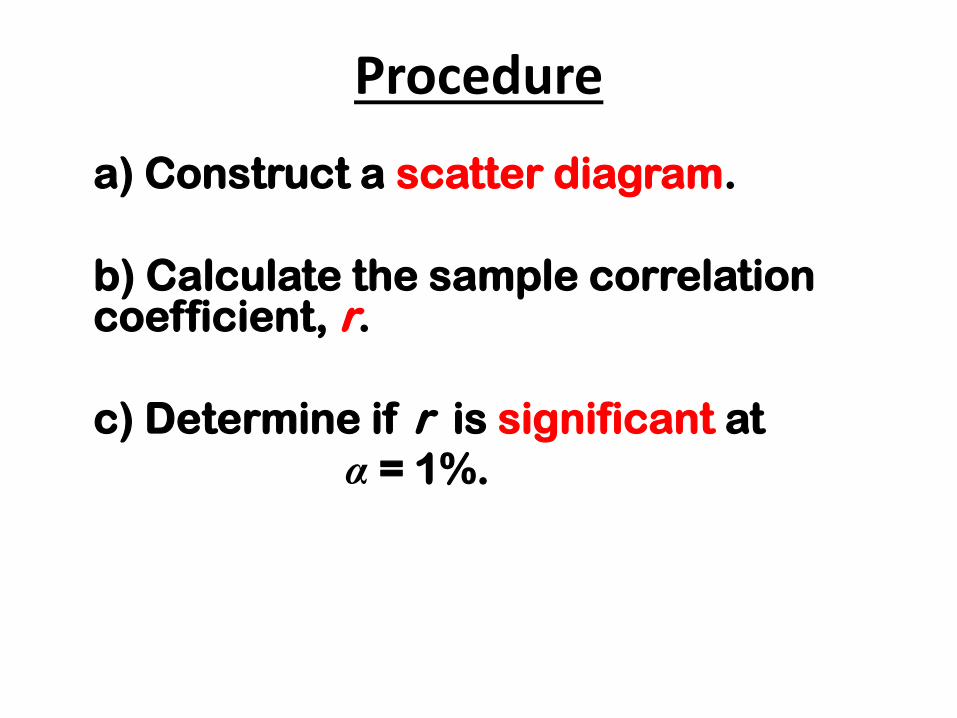
Procedure
a) Construct a scatter diagram.
b) Calculate the sample correlation coefficient, r.
c) Determine if r is significant at
α = 1%.

Procedure
If r is significant at α = 1%,
then continue…
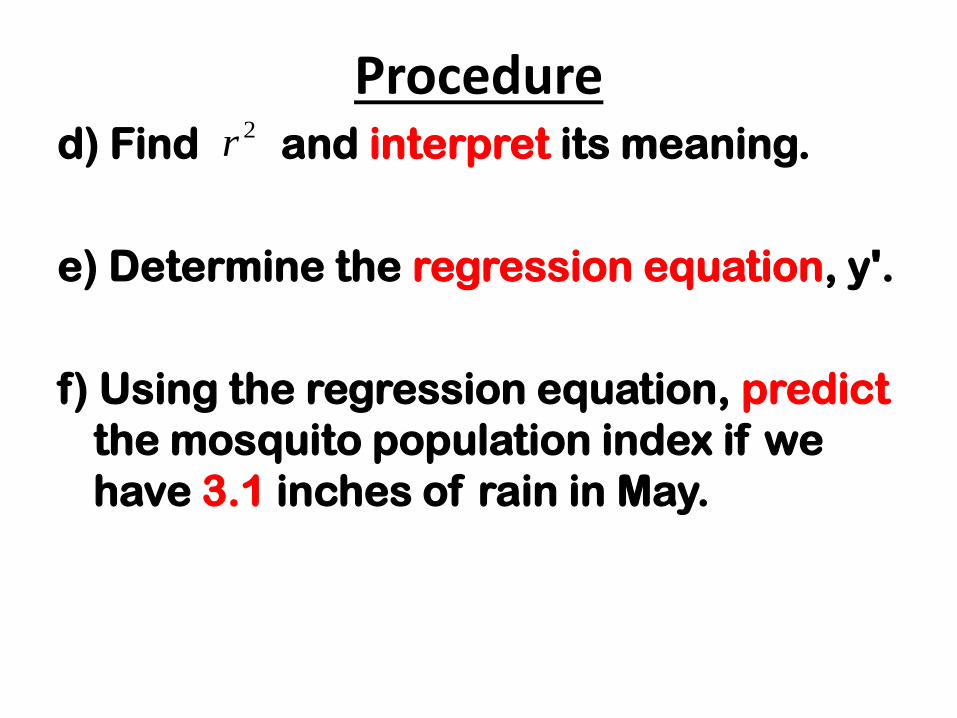
Procedure d) Find and interpret its meaning.
e) Determine the regression equation, y'.
f) Using the regression equation, predict
the mosquito population index if we
have 3.1 inches of rain in May.
2r

CORRECT ORDER?
Perform Linear Reg T Test
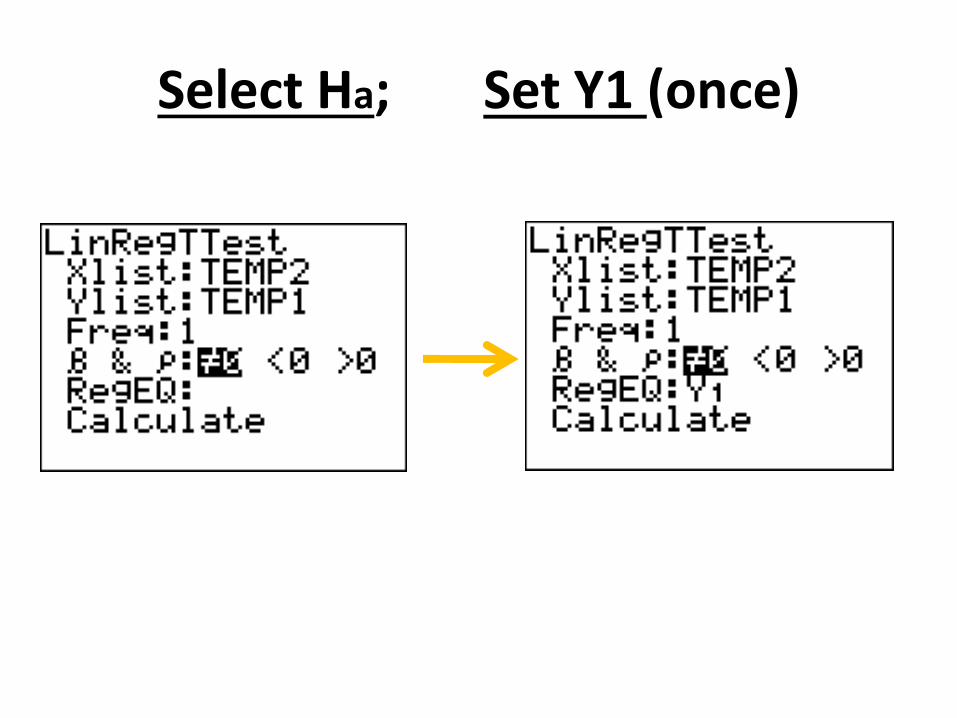
Select Ha; Set Y1 (once)
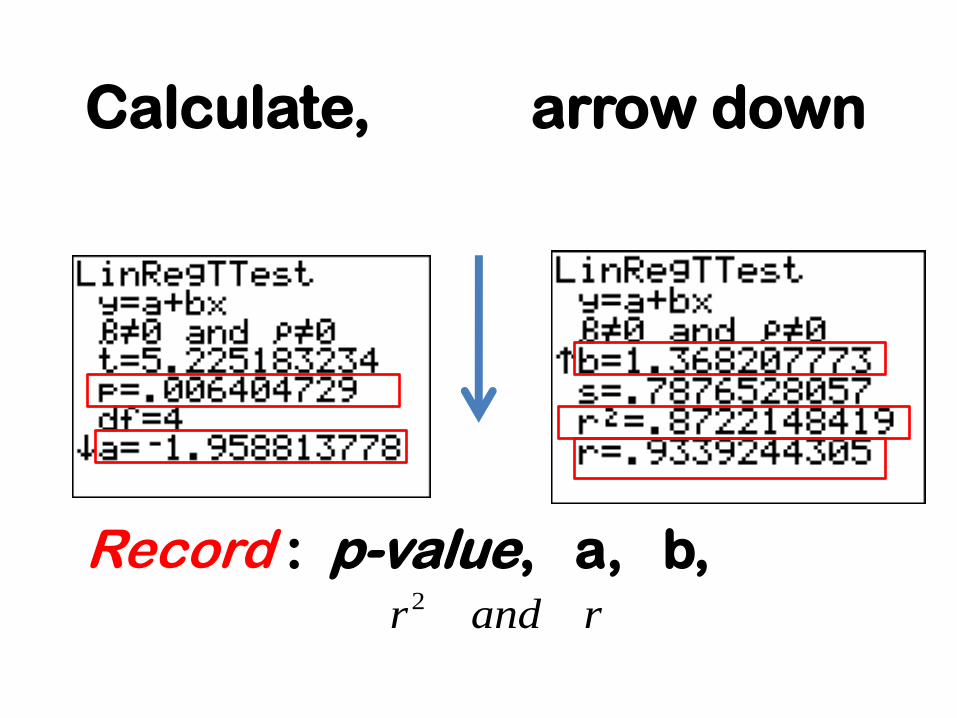
Record : p-value, a, b,
Calculate, arrow down
randr2
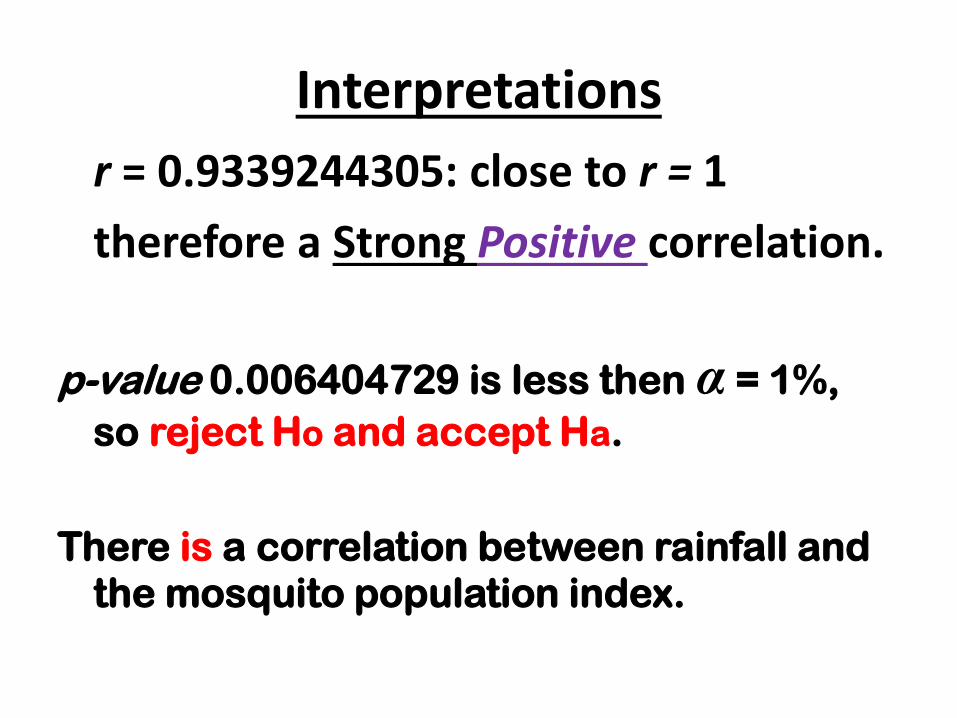
Interpretations
r = 0.9339244305: close to r = 1
therefore a Strong Positive correlation.
p-value 0.006404729 is less then α = 1%,
so reject Ho and accept Ha.
There is a correlation between rainfall and the mosquito population index.
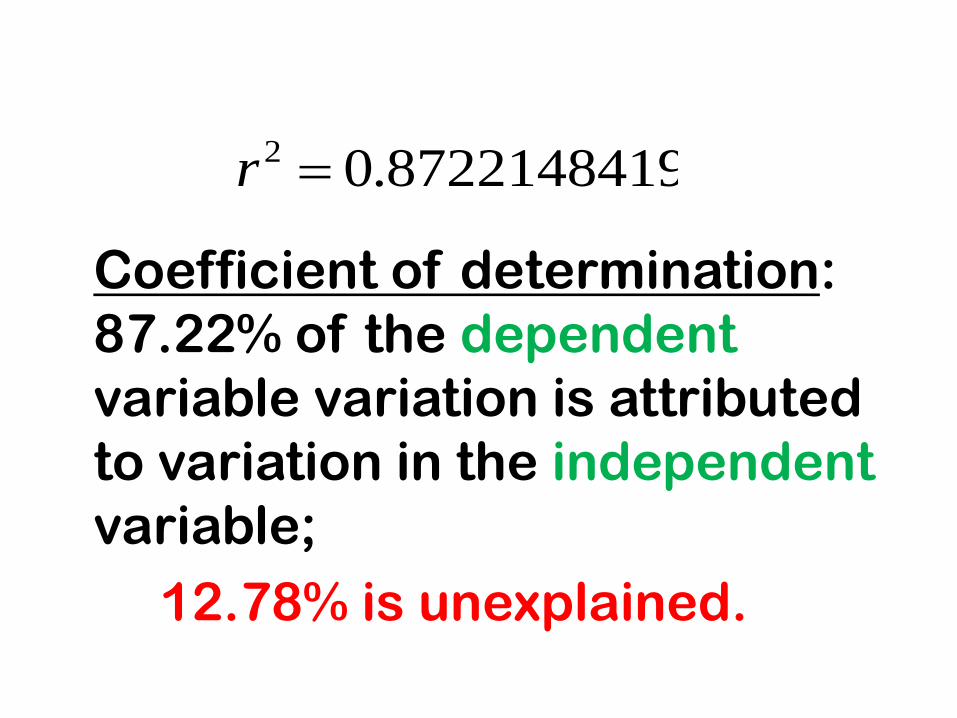
Coefficient of determination:
87.22% of the dependent
variable variation is attributed
to variation in the independent
variable;
12.78% is unexplained.
8722148419.02 r

Regression Equation
General form: y' = a + b (x)
y' = -1.9588137778595 + 1.368207773(x)
Prediction for the mosquito index:
Substitute rain = 3.1 inches
y' = 2.282630319

How much Confidence in the
Prediction of 2.282 population
index?
Since r = 0.9339244305, is very close to r = 1 (a perfect correlation),
there is a high level of confidence in the accuracy of the prediction.
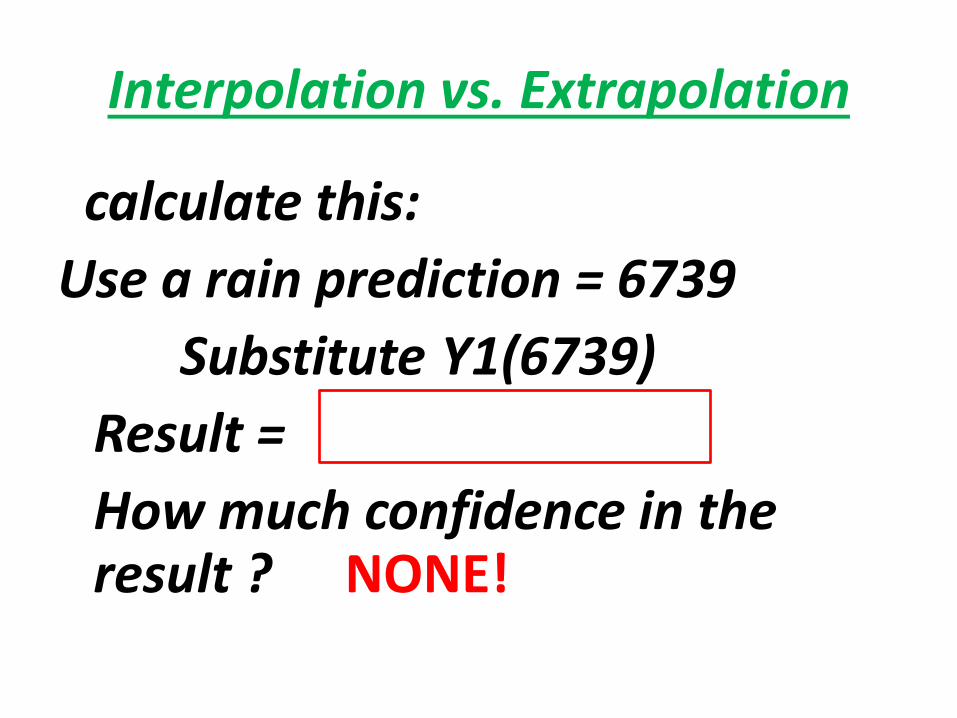
Interpolation vs. Extrapolation
calculate this:
Use a rain prediction = 6739
Substitute Y1(6739)
Result =
How much confidence in the result ? NONE!
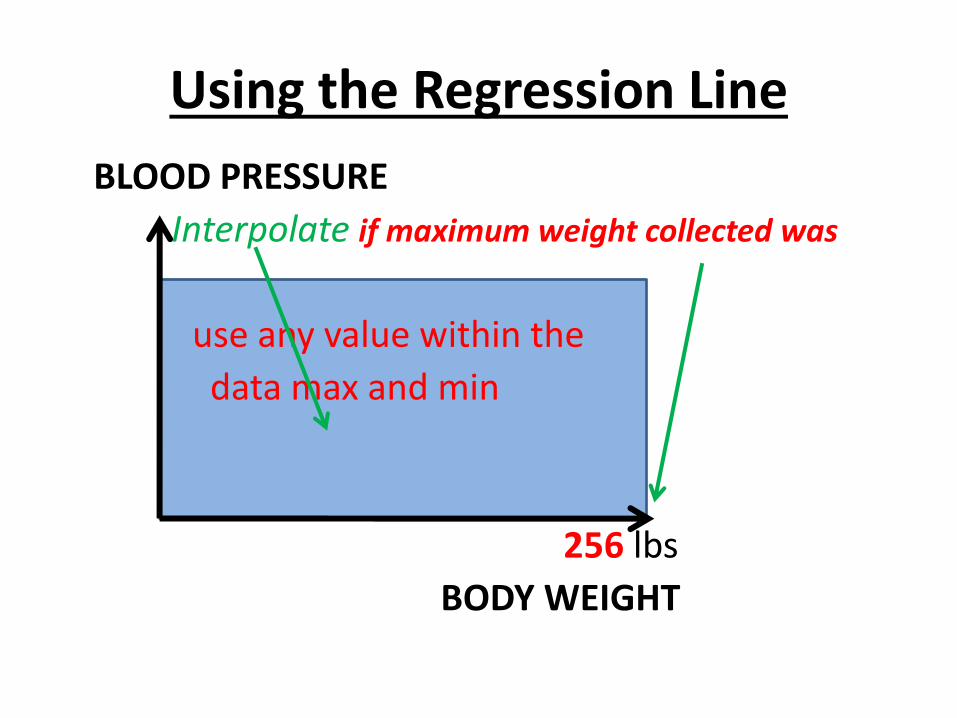
Using the Regression Line
BLOOD PRESSURE
Interpolate if maximum weight collected was
use any value within the
data max and min
256 lbs
BODY WEIGHT

Using the Regression Line
BLOOD PRESSURE
Interpolate Extrapolate
256 lbs 9842
BODY WEIGHT

Redo Scatter Plot for Regression line

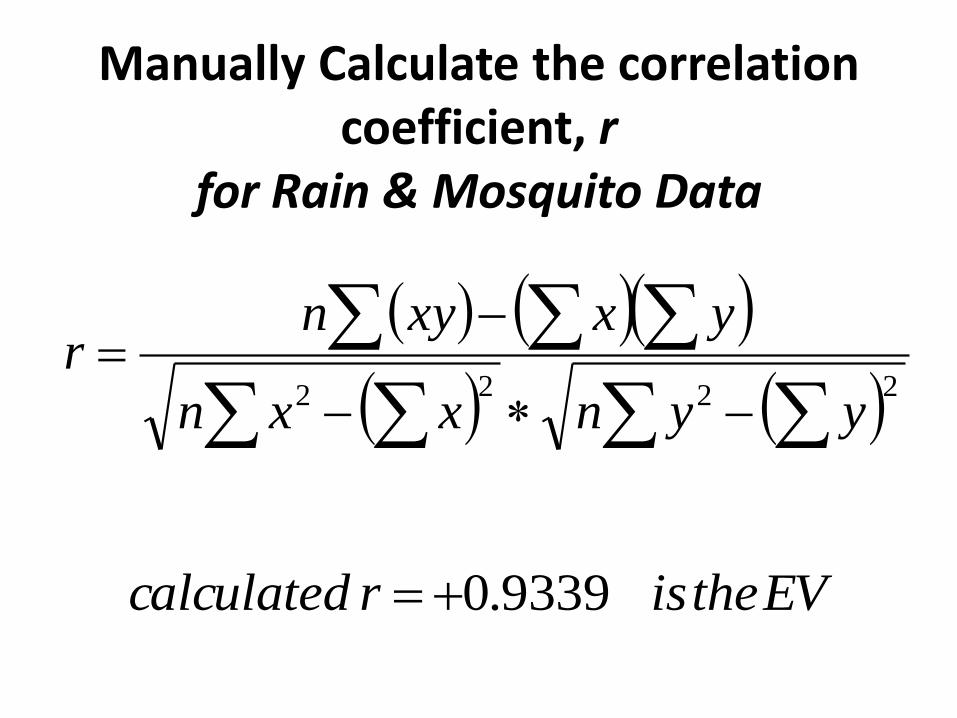
Manually Calculate the correlation coefficient, r
for Rain & Mosquito Data
2222
yynxxn
yxxynr
EVtheisrcalculated 9339.0
SECOND METHOD
Use the table
to generate
the critical value:
r

Determine value from page 810 table V
Pairs of mosquito & rain values, n= 6
Subtract two from the number of
pairs of data values to generate
Degrees of freedom:
df = n – 2 = 4
We were given α = 1% 2 Tail
rcritical
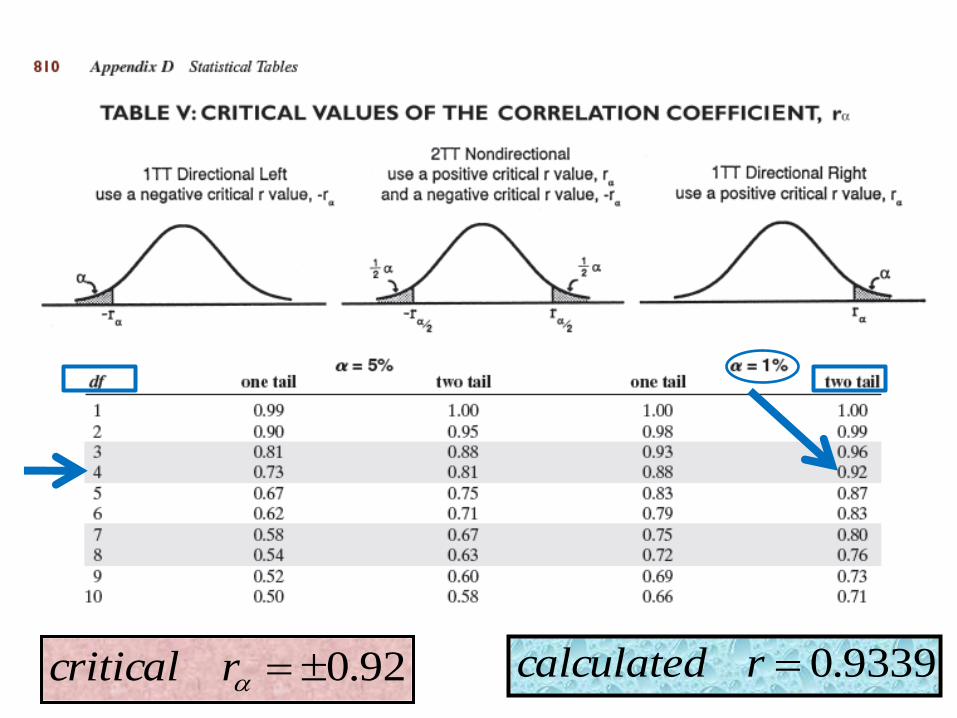
9339.0rcalculated92.0rcritical
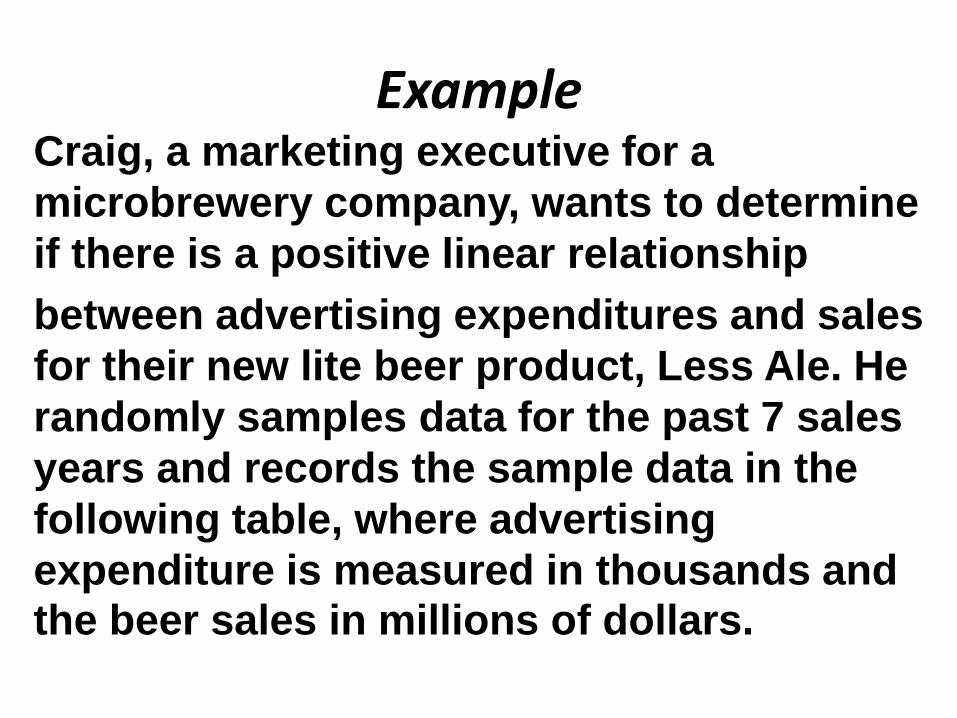
Example Craig, a marketing executive for a
microbrewery company, wants to determine
if there is a positive linear relationship
between advertising expenditures and sales
for their new lite beer product, Less Ale. He
randomly samples data for the past 7 sales
years and records the sample data in the
following table, where advertising
expenditure is measured in thousands and the beer sales in millions of dollars.
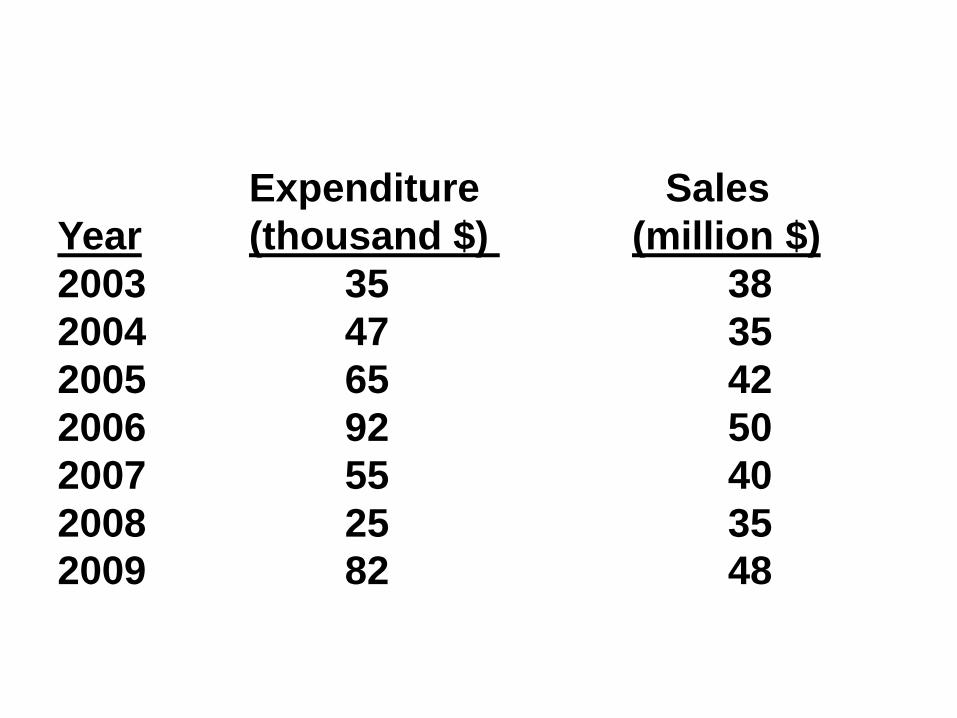
Expenditure Sales
Year (thousand $) (million $)
2003 35 38
2004 47 35
2005 65 42
2006 92 50
2007 55 40
2008 25 35
2009 82 48
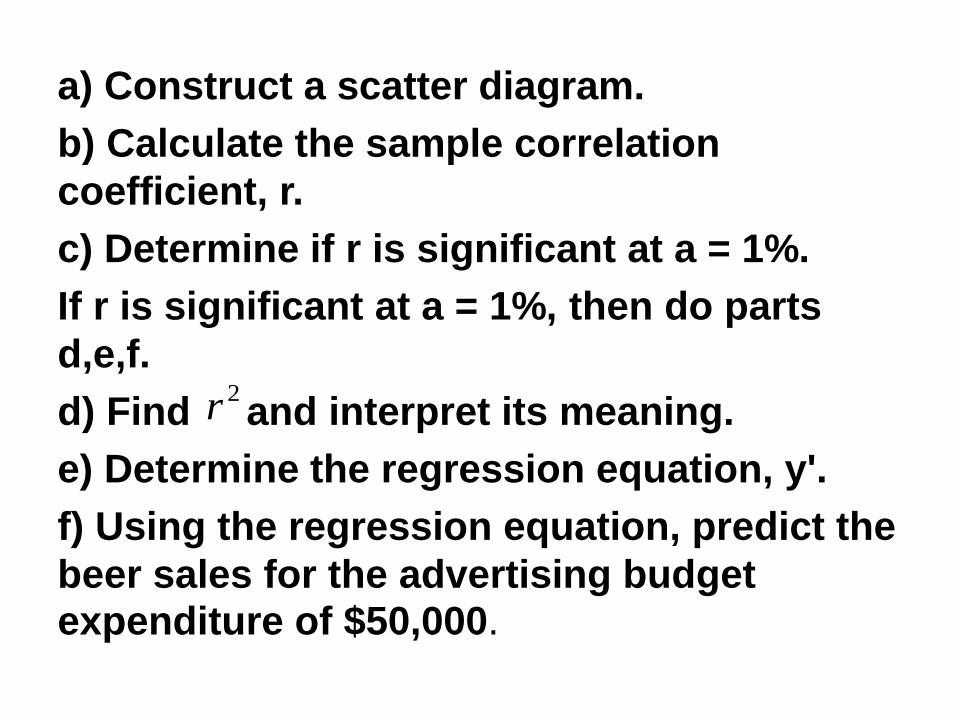
a) Construct a scatter diagram.
b) Calculate the sample correlation
coefficient, r.
c) Determine if r is significant at a = 1%.
If r is significant at a = 1%, then do parts
d,e,f.
d) Find and interpret its meaning.
e) Determine the regression equation, y'.
f) Using the regression equation, predict the
beer sales for the advertising budget expenditure of $50,000.
2r

A prominent psychologist wonders if a patient’s score on the extrovert scale (those who seek out social environments) is positively correlated with time spent on social network sites online. She gathers data from 20 patients for both variables; the results are as follows:
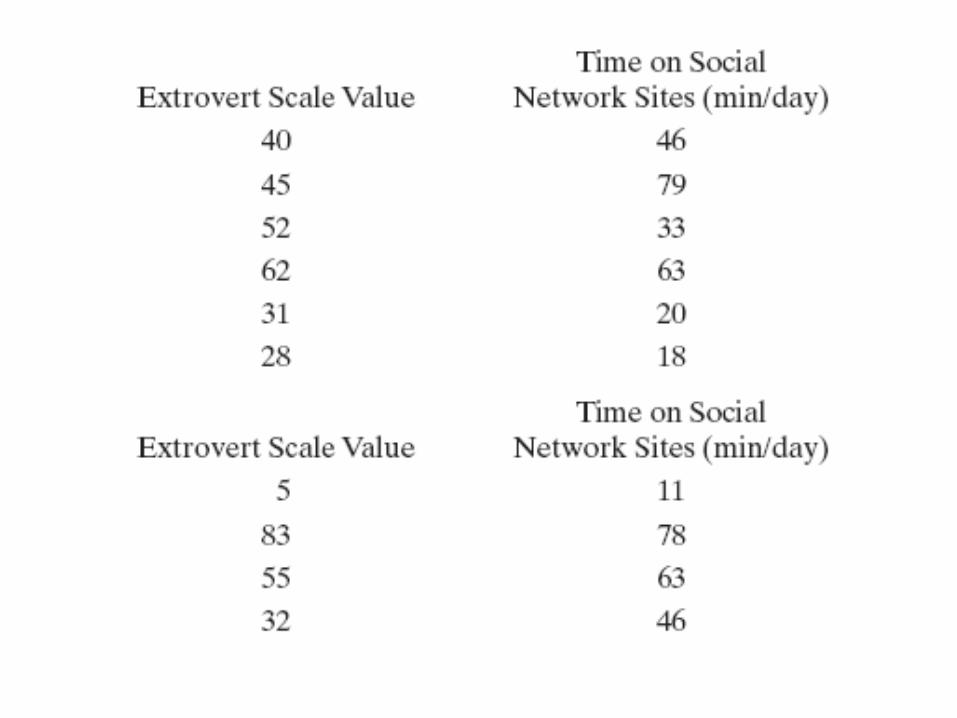


Can the psychologist conclude that scores on an extroversion scale are significantly correlated with time spent on social network sites? Test at an alpha level of 1%.
a) Generate the scatter diagram for the data.
b) Calculate the sample correlation coefficient, r.
c) Determine if r is significant at a = 1%.
d) Determine the regression equation, y'.
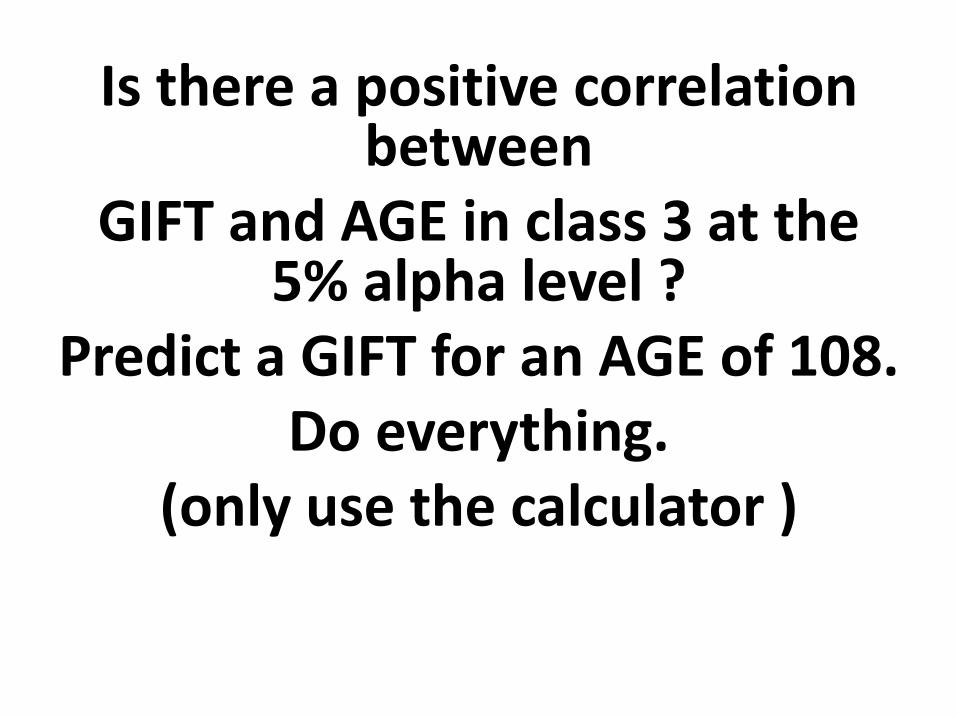
Is there a positive correlation between
GIFT and AGE in class 3 at the 5% alpha level ?
Predict a GIFT for an AGE of 108. Do everything.
(only use the calculator )