linear expansion and thickness swell of mdf as a function ...deteix/bois/rapport/... · linear...
TRANSCRIPT
Linear Expansion and Thickness Swell of MDF as a Function of Panel
Density and Sorption State
Stefan Ganev Ph.D. Candidate
Département des sciences du bois et de la forêt, Université Laval Québec, Canada G1K 7P4 and
Research Scientist Forintek Canada Corp.
319, rue Franquet, Sainte-Foy, Québec, Canada G1P 4R4
Alain Cloutier Associate Professor
Département des sciences du bois et de la forêt, Université Laval Wood Research Center and
Groupe interdisciplinaire de recherche en éléments finis Québec, Canada G1K 7P4
Robert Beauregard Associate Professor
Département des sciences du bois et de la forêt, Université Laval Wood Research Center
Québec, Canada G1K 7P4
Guy Gendron
Associate Professor Département de génie mécanique, Université Laval
Groupe interdisciplinaire de recherche en éléments finis Québec, Canada, G1K 7P4

ABSTRACT
Experiments were conducted using ASTM standard methods to determine the medium
density fiberboard (MDF) expansion and swelling properties as a function of panel
density and sorption state. Specimens without density profile were produced by
removing the surface layers of laboratory MDF panels. The results from the trials
showed that for laboratory MDF, linear expansion is homogenous in panel plane. When
specimen density increased, linear expansion, linear expansion coefficient, thickness
shrinkage coefficient, linear contraction and linear contraction coefficient increased.
Thickness swell was higher than thickness shrinkage at any density level. Thickness
swell coefficient was higher than TShC for low density levels. The values of LC and
LCC (in desorption) were higher than the values of LE and LEC (in adsorption). The
values of TS and TSh were much higher than the values of and LC, while the values of
TSC and TShC were much higher than the values of LEC and LCC at any density level.
The effect of density on LE, LEC and LCC was significantly stronger than the effect of
density on TS, TSC and TSh.
Keywords: medium density fiberboard, MDF, linear expansion, linear expansion
coefficient, thickness swell, thickness swell coefficient, hysteresis.
INTRODUCTION
As solid wood and other wood-based composites, medium density fiberboard (MDF) is a
hygroscopic material; therefore, its moisture content (M) depends on the relative

humidity (RH) and temperature of the surrounding air. It is common knowledge that M
and density affect MDF thickness swell and linear expansion (e.g. Chow, 1976;
Watkinson and Gosliga, 1990). Consequently, when M is unevenly distributed through
MDF thickness (M-profile, Xu et al. 1996), panel thickness swell and linear expansion
vary accordingly. The M-profile corresponds to the characteristic vertical distribution of
density (density profile) and it affects also the distribution of thickness swell (Xu and
Winistorfer, 1995) and linear expansion (Woodson, 1975). For example, in MDF, the
surface layers, although thinner, due to their higher compaction ratio, account for a more
important portion of the overall thickness swell (Xu and Winistorfer 1995) compared to
the core layer. The contribution of each panel layer on complex phenomena such as
warping and its dynamics could be simulated with methods such as the finite element. To
enable such simulations, the effects of MDF density and sorption branch on the linear
expansion and thickness swell at exposure to water in vapor phase (as opposed to
immersion in liquid water) need to be characterized.
BACKGROUND
A hygro-mechanical model for warping simulation based on the equations of equilibrium
has been presented in previous publications (Cloutier et al. 2001, Ganev et al. 2002b).
For MDF, there is limited literature data available for the effects of MDF density and
sorption state on the linear expansion and thickness swell at exposure to water in vapor
phase.

Determination of expansion properties
According to ASTM D 1037 (ASTM, 1999), for MDF the linear variation, or for
simplicity the linear expansion (LE), between two equilibrium moisture contents (EMC),
is calculated as a percentage of the initial specimen length. The hygroscopic strain is
determined at 20±2°C as the percentage change of the initial length recorded at
equilibrium, usually at 50% RH in adsorption and at 80 % (or 90%) RH in desorption. In
some studies the linear variation is expressed in terms of LE change per 1 % M change or
linear expansion coefficient, LEC (Suchsland, 1974). In desorption corresponding notions
would be linear contraction (LC) and linear contraction coefficient (LCC). In this study,
we use the group term “expansion properties” for LE, LEC, LC and LCC. In adsorption,
the ASTM D 1037-99 procedure provides for two possible levels of final equilibration,
either 80 or 90 % RH. The 80 % RH upper limit is more practical since when the 90 %
RH limit is used, wood composites may never reach equilibrium or the test could last for
many months (Suchsland and Xu, 1989).
In MDF similarly to solid wood, the LE is explained by swelling in the cell walls (e.g. Xu
and Suchsland 1991). Some authors (e.g. Suchsland and Xu, 1989) consider LE to be a
reversible phenomenon.
There is a contradiction in the literature concerning the effect of density on the expansion
properties. Suchsland et al. (1978) and Xu and Suchsland (1997) for MDF, and
Hiziroglu and Suchsland (1993) for particleboard did not find panel density to have an

effect on LE. Most other researchers observed that when density increases the expansion
properties also increase (e.g. Woodson, 1975 for MDF; Vital, et al. 1980; Fujimoto et
al.,1995; and Suzuki and Miyamoto, 1998 for particleboard; Geimer, 1982 for
flakeboard).
Determination of swelling properties
The thickness variation induced by a change in M, also called thickness swell (TS) is the
thickness variation between two EMC calculated as percentage of the initial specimen
thickness. This property has seldom been determined. A more popular evaluation has
been immersion in water according to ASTM D 1037-99: Water Absorption and
Thickness Swelling. The procedure can be modified for the determination of thickness
swell (TS) between two EMC levels (e.g. between 50 and 80 % RH similarly to LE).
Expressing the thickness variation as TS per 1 % M change results in a thickness swelling
coefficient, TSC. Similarly to expansion properties, the term “swelling properties” is
introduced. In desorption, the corresponding concept to TS would be thickness shrinkage
(TSh) and to TSC would be thickness shrinkage coefficient (TShC).
The size of the specimens specified in ASTM D 1037-99 water Adsorption and
Thickness Swelling can be altered as done by Niemz and Poblete (1996) who used
specimens with dimensions 20 mm x 200 mm or by Suzuki and Miyamoto (1998) who
took measurement on the standard-size LE specimens.

We could not find any data on the effect of density on the swelling properties in MDF
between two EMC. A theoretical model of Xu and Winistorfer (1995) predicts that in
MDF, the high-density regions in the density profile contribute twice as much to the total
cumulative TS as compared to the low-density layers. This was experimentally
confirmed. When immersed in water for 48 h, MDF specimens cut into 1.6 mm slices
across the thickness experienced two times higher swelling in the surface layers as
compared to the core layer (Xu and Winistorfer, 1995). Although the TS was a time
dependent process, the authors had no doubt that there was a positive correlation of TS
with layer density. For particleboard exposed to varying RH, Greubel and Paulitsch
(1977) observed that when panel average density increased, so did TS. These two studies
suggest that when specimen density increases so do the swelling properties.
Objective
The objective of this research is to determine MDF expansion properties LE, LEC, LC
and LCC, and swelling properties: TS, TSC, TSh and TShC as a function of panel density
and sorption state.
MATERIAL AND METHODS
Materials
Green Black Spruce (Picea mariana) chips, a typical raw material for MDF in Eastern
Canada, were provided by a local sawmill. The wood chips were reduced to fibers in an
industrial grade Andritz refiner at Forintek Canada Corp., Eastern Laboratory. The fibers

were dried to 2% initial M before resin blending. Commercial melamine urea
formaldehyde (MUF) resin was provided by Borden Canada.
The calculated quantities of the components were mixed in a laboratory rotary blender. A
MUF resin (12 % solid resin based on wood oven dry weight) and slack wax emulsion
(1% wax based on wood oven dry weight) were applied directly to the wood fibers using
an air-pressure spray nozzle set parallel to the axis of the blender drum. Catalyst was not
used. Typical mat moisture contents of approximately 12.5 % were obtained. The
blended fibers were formed on steel caul-plates into one-layer mats of 650 mm x 650 mm
by a fiber-felting machine. The mats were manually pre-pressed and then hot-pressed in a
Dieffenbacher hot press. The press closing time was 40 to 50 s at a maximum pressure of
about 5.4 MPa. The pressure was then reduced to 0.9 MPa and kept constant for 190 s to
achieve a core temperature of 120 °C for 70 s and a target thickness of 13 mm. Finally,
the pressure was gradually reduced to zero and the press opened within approximately 15
to 20 s.
A total of 39 laboratory MDF panels with a thickness of 12 mm divided into 3 nominal
density groups (13 x 540 kg/m3, 13 x 650 kg/m3, 13 x 800 kg/m3) was produced. Each
panel was edge trimmed (approximately 50 mm from each side) to discard the weak area
next to the edges. The surface layers of the panels were removed in a planer and the
thickness of the remaining core layer was reduced to 8 mm by sanding. Thus panels with
flat profile (without vertical density variation) with dimensions 540 mm x 540 mm were
obtained. This allowed to study the effect of density on panel properties and to eliminate
the effect of density profile shape on the panel properties.
Methods
Evaluation of vertical density profile
A QMS X-ray density profiler, Model QDP-01X was used to determine the vertical
density profile of each eight mm-thick panel in order to ensure that the density was
homogeneous across the thickness.
Expansion properties
The expansion properties (LE, LEC, LC and LCC) were determined according to ASTM
D 1037-99: Linear Variation with Change in Moisture Content (Figure 1). The change
in length was monitored at 20°C from 50 % to 80 % RH in adsorption and then from 80
% to 50 % RH in desorption on the same specimens. The expansion properties were
calculated as follows:
( )
initial
initial
LLL
LE_50
_5080 100×−= (1)
M
LELEC∆
= (2)

( )
80
_5080 100L
LLLC final ×−
= (3)
M
LCLCC∆
= (4)
5080 MMM −=∆ (5)
Where: LE = linear expansion, %;
LEC = linear expansion coefficient, %/%; LC = linear contraction, %;
LCC = linear contraction coefficient, %/%;
L50_initial = initial specimen length after conditioning to 50 % RH before
exposure to 80 % RH, m;
L80 = specimen length at equilibrium at 80 % RH, m;
L50_final = final specimen length after re-conditioning to 50 % RH, m;
∆M = moisture content increase (decrease), %;
M80 = moisture content at 80 % RH, %;
M50 = moisture content at 50 % RH, %;
Eight specimens were tested per density level. At each equilibrium level in addition to the
length also the mass of the specimens was recorded. At the end of the test the specimens
were oven-dried and M at each level of RH was determined according to ASTM D 1037-
99 Moisture Content and Specific Gravity. The standard LE test does not allow obtaining
expansion data at intermediate M values. It would be useful in a future research to modify
the test and to validate the linearity of the LE versus M relation.
Swelling properties
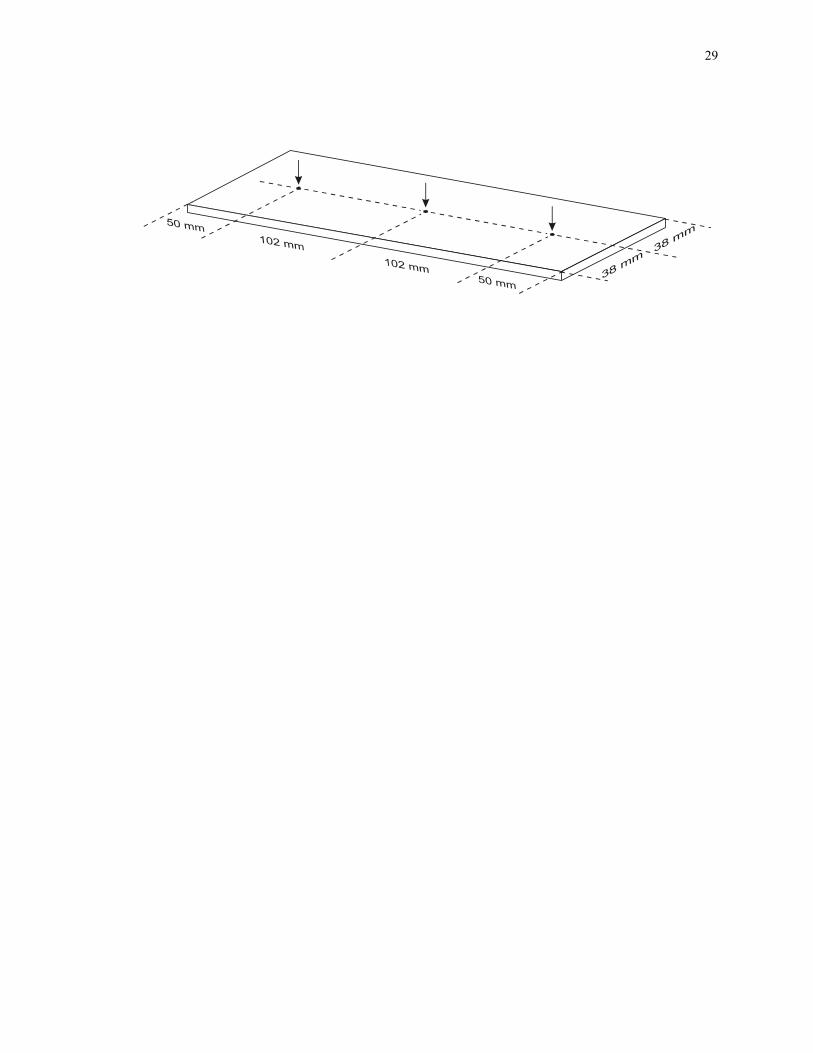
For evaluation of TS, the LE specimens (8 specimens per density level group) were used.
The specimen thicknesses at three points midway across the width of the specimens
(Figure 2) were measured with an accuracy of ± 0.3%. The thicknesses were recorded
once equilibrium was reached at 50 and 80 % RH and after reconditioning to 50 % RH.
The swelling properties were calculated as follows:
( )
initial
initial
TTT
TS_50
_5080 100×−= (6)
M
TSTSC∆
= (7)
( )
80
_5080 100TTT
TSh final ×−= (8)
M
TSh∆
=TShC (9)
Where: TS = thickness swell, %;
TSC = thickness swell coefficient, %/%;
TSh = thickness shrinkage, %;
TShC = thickness shrinkage coefficient, %/%;

T50_initial = initial specimen thickness after conditioning to 50 % RH before
exposure to 80 % RH;
T80 = specimen thickness at equilibrium at 80 % RH;
T50_final = final specimen thickness after re-conditioning to 50 % RH;
TS= thickness swell;
TSh = thickness shrinkage.
RESULTS AND DISCUSSION
The results obtained in this study are summarized in Table 1.
Test of isotropy in the panel 1-2 plane
Due to the methodology used to form the mat (see above) there was no reason for the
panels to exhibit anisotropy in the panel plane. Still, four of the specimens prepared for
tests in the panel plane were obtained parallel to one edge of the panel and the other four
perpendicular to that direction. A test of isotropy in the plane regarding expansion
properties was conducted as described below. An analysis of variance (ANOVA) was
performed on the LE data using the SAS GLM procedure considering the impact of
density (3 levels) and orientation (2 levels) of the LE specimens (Table 2). The effect of
nominal density on LE was significant, while the effects of orientation and of nominal
density combined with orientation were not significant. The results led to the conclusion
that for MDF panels used in this research there was no significant difference between LE
obtained for two perpendicular directions in the panel plane.

Effect of density and initial M on TS, TSC, LE, LEC, TSh, TShC, LC and LCC
The results of the analysis of variance for the impact of nominal density on the panel
expansion properties are presented in Table 3. The ANOVA was performed by
comparing the properties for the specimens grouped under the three nominal density
levels. The F-values showed a significant density effect for LE, LEC, TSh, TShC, LC and
LCC. For TS and TSC there were no significant differences between the three density
levels. A Duncan’s multiple range test on the mean expansion coefficients obtained as a
function of the nominal density showed that for LEC, LC and LCC, the means for all
density levels were significantly different. For LE, TSh and TShC there were significant
differences between the values at 540 kg/m³, and the values at 650 kg/m³ and 800 kg/m³.
The values at density levels 650 kg/m³ and 800 kg/m³ were not significantly different.
The coefficients of determination were high (R² between 0.60 and 0.77) except for the
cases of TS, TSC and TSh. This means that there is a strong effect of the actual specimen
density on LE, LEC, TShC, LC and LCC. The relations between density and the
expansion and swelling properties are presented in Fig. 3. It can be observed that when
density increases all expansion and swelling properties increase. The trends were in
agreement with a preliminary work on this topic (Ganev, 2000) and with the results
published by Vital et al. (1980) and Fujimoto et al. (1995).
Regression analysis between TS, TSC, LE, LEC, TSh, TShC, LC and LCC and the actual
density of the same specimens as above at nominal M of 6.9 % showed significant linear
regression models for all properties but TS, TSC and TSh (Table 4). The regression

analysis performed by density groups did not show significant models between TS, TSC,
LE, LEC, TSh, TShC, LC and LCC and actual specimen M (at initial equilibrium to 50 %
RH). This leads to the conclusion that variability in M of MDF specimens at equilibrium
in the beginning of the tests is not large enough to induce variability in the expansion
coefficients.
Effect of sorption state on the expansion properties
Differences were observed between the expansion properties recorded in adsorption and
desorption at the same density level (Table 1). The significance of difference between the
corresponding properties in adsorption and desorption were validated with ANOVA
(Table 5). The comparison between the expansion properties obtained in adsorption and
desorption, is facilitated by the linear regression curves (expansion properties versus
density) included in Fig. 3. Thickness swell (adsorption) is higher than the TSh
(desorption) at any density level (Fig. 3a). Recalculated per 1 % M change, the TSC
(adsorption) is higher than TShC (desorption) for lower density levels (Fig.3b). In wood
and wood composites, the moisture adsorbed at high RH exposure is never entirely
released when re-drying to lower RH levels (well-known hysteresis phenomenon, e.g.
Siau, 1995). The M-hysteresis is probably the reason for the swelling hysteresis (the
differences between TS and TSh). The different slopes of TSC and TShC as a function of
density may be attributed to a combined effect of two phenomena observed with MDF:
the lower M-hysteresis at higher M-levels and the lower equilibrium M of panels with
higher density.

It is observed (Table 1 and Figure 3c and d) that the LC (desorption) is approximately 20
% higher than the LE (adsorption); the LCC (desorption) is at least 50 % higher than the
LEC (adsorption) in the entire density range. It seems that the difference between LEC
and LCC even increases with density. The M-hysteresis emphasizes the differences in the
expansion properties in the panel plane because even though the specimens release less
moisture in desorption, they contract more than they had expanded. These observations
are supported by a study of Suchsland and Xu (1989). The authors observed a negative
expansion hysteresis in MDF (the specimens become shorter upon re-drying). According
to Suchsland and Xu (1989) this phenomenon is typical for all fiberboards (MDF and
hardboard). Given that hardboards made by a wet-process do not contain any glue, it is
not likely that a partial destruction of glue bonds during the expansion could lead to
weakening of the panel and from there to a higher level of contraction. Probably, for
explanation of the phenomenon a microscopic approach needs to be adopted: a
methodology based on microscopy needs to be developed for monitoring of the alignment
of the fibers and their configuration during the entire cycle of expansion and contraction.
Also, trials based on multiple cycles may help clarify this phenomenon.
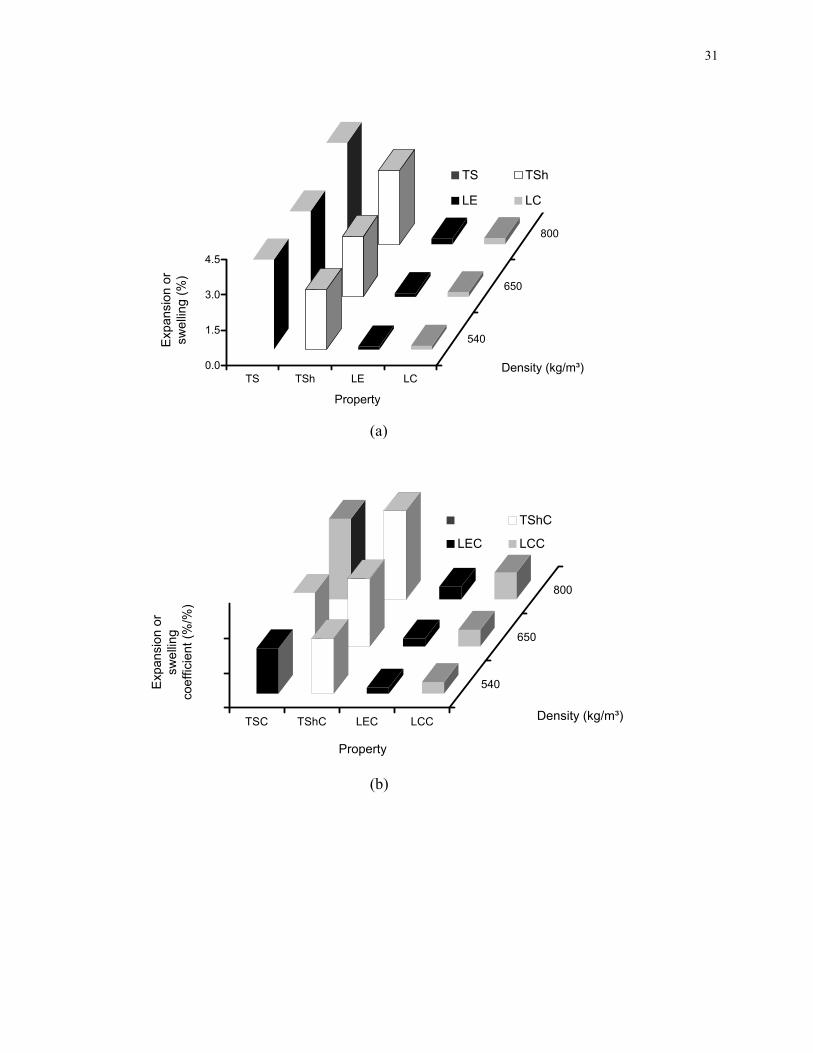
A complete illustration of the expansion properties for all densities and panel types is
given in Figure 4 (a) and (b). It suggests that:
- All expansion properties tend to increase when density increases;
- The values of TS and TSh are much higher than the values of LE and LC;

- The values of TSC and TShC are much higher than the values of LEC and LCC at
any density level.
Comparison of the rates of increase of the expansion properties
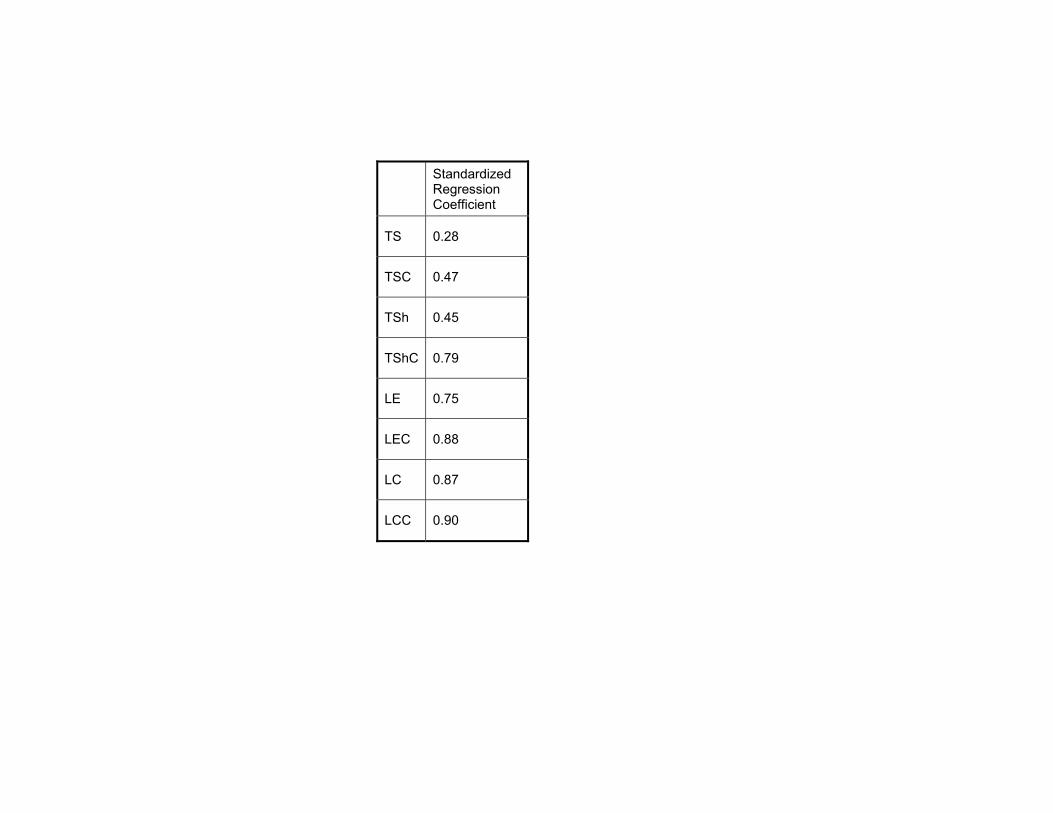
The SAS REG (STB) procedure was performed to obtain standardized regression
coefficients between the expansion properties and density. The standardized regression
coefficients are identical to Pearson’s correlation coefficients (r) between the same arrays
of data (Steiger, 1980). The null hypothesis of equality between the coefficients is
rejected with probability of 95 % when the corresponding p-value is lower than 0.05. In
the case when the null hypothesis is rejected, the higher the standardized regression
coefficient, the faster the property increases with density. These relations can help
explain some trends in complex phenomena such as warping, on which various properties
may have opposite effects, while affected by density to different extents.
The standardized regression coefficients and their grouping are summarized in Table 6. It
can be observed that density has the strongest effect on LEC, LC and LCC followed by
LE and TShC. The TSC, TSh and TS show a significantly lower standardized regression
coefficient with density indicating that these properties will not increase as fast as the
others when density increases.
CONCLUSIONS
The purpose of this study was to determine the MDF expansion properties LE, LEC, LC
and LCC, and swelling properties: TS, TSC, TSh and TShC as a function of panel density

and sorption state. The experiments were conducted using ASTM standard methods. The
results show that for laboratory MDF LE is homogenous in the panel plane.When
specimen density increases so do LE, LEC, TShC, LC and LCC. Thickness swell is
higher than thickness shrinkage at any density level. Thickness swell coefficient is higher
than TShC for low density levels. The expansion properties are higher in desorption than
in adsorption with LC approximately 20 % higher than LE and LCC at least 50 % higher
than LEC. The values of TS and TSh are much higher than the values of LE and LC; the
values of TSC and TShC are much higher than the values of LEC and LCC at any density
level. The effect of density on LE, LEC and LCC is significantly stronger than the effect
of density on TS, TSC and TSh.
ACKNOWLEDGEMENTS
Forintek Canada Corp. under research project no. 600-2683 supported this research
project. We thank Francine Côté, Louis Gravel and Gérald Bastien of Forintek Canada
Corp. for their assistance in measuring the expansion properties and producing the MDF
panels.
REFERENCES ASTM D 1037. 1999. Standard test methods for evaluating properties of wood base fiber
and particle panel materials. Annual Book of ASTM Standards, Vol. 04.10. CHOW, P., 1976. Properties of medium-density, dry formed fiberboard from seven
hardwood residues and bark. Forest. Prod. J. 26(5) : 23-32. CLOUTIER, A., S.B. GANEV, G. GENDRON, P. BLANCHET, AND R. BEAUREGARD. 2000.
Modelización por elemenots finitos de la deformación producida en paneles a base de medera. In Spanish. Presented at the IX reunion of the first Latino-American congress
on research and development of forest products. University of Bio Bio, Conception, Chile, Oct. 16-20.
FUJIMOTO, Y., S. MORIZONO, T. INAMASU, AND Y. MATAKI. 1995. Mechanism of
generating linear expansion with adsorption and desorption for particleboards: behavior of interactive restraint between layers. Bulletin-of-the-Kyushu-University-Forests. No. 73, 43-60; With English figures and tables.
GANEV, S. 2000. Modeling warping of MDF panels. Ph.D. proposal. Département des
sciences du bois et de la forêt, Université Laval, Québec, Canada. 89 p. GANEV, S., A. CLOUTIER, G. GENDRON, AND R. BEAUREGARD. 2002. Mechanical
properties of MDF as a function of density and moisture content. Wood and Fiber Science, submitted.
GEIMER,R.L. 1982. Dimensional stability of flakeboards as affected by board specific
gravity and flake alignment. Forest Prod. J. 32(8): 44-52. GREUBEL, D., AND M. PAULITSCH. 1977. Untersuchungen über die Dimensionänderungen
von Spanplatten in Plattenebene. 3. Mitteilung: Einfluss von Rohstoffzusammensetzung und verfahrentechnishen Variablen auf die Dimensionsänderung henolharzgebundener Spanplatten. Holz Roh- u. Werkstoff. 35: 413-420.
HIZIROGLU, S., AND O. SUCHSLAND. 1993. Linear expansion and surface stability of
particleboard. Forest-Prod. J. 43(4): 31-34.
NIEMZ, P., AND H. POBLETE. 1996. Untersuchungen zur Dimensionsstabilität von mitteldichten Fasrplatten (MDF) und Spanplatten. Holz Roh- u. Werkstoff. 54: 141-144.
SIAU, J.F. 1995. WOOD: Influence of moisture on physical properties. Dept. of Wood
Science and Forest Products. Virginia Polytechnic Institute and State University, USA. 227 p.
STEIGER, J.H. 1980. Tests for comparing elements of a correlation matrix. Psychological
Bulletin 87(2): 245-251. SUCHSLAND, O., D.E. LYON, AND P.E. SHORT. 1978. Selected properties of commercial
medium-density fiberboards. Forest Prod. J. 28(9) :45-49. SUCHSLAND, O., AND H. XU. 1989. On the measurement of linear expansion of
particleboard and medium density fiberboard Forest-Products-Journal. 39(6) : 39-42.

SUZUKI, S., AND K. MIYAMOTO. 1998. Effect of manufacturing parameters on the linear expansion and density profile of particleboard. Journal-of-Wood-Science. 44 ( 6): 444-450.
VITAL, B.R., WILSON, J.B., AND P.H. KANAREK.1980. Parameters affecting dimensional
stability of flakeboard and particleboard. Forest-Products-Journal. 30(12): 23-29. WATKINSON, P.J., AND N.L. GOSLIGA. 1989. Effect of moisture content on mechanical
and dimensional properties of New Zealand particleboards and fiberboards. 1989., Proceedings of the Second Pacific Timber Engineering Conference, University of Auckland, New Zealand, 28-31 August 1989. Volume 1 [edited by Walford, G.B.]. 171-176 Auckland, New Zealand; Centre for Continuing Education, University of Auckland.
WOODSON, G.E. 1975. Effects of bark, density profile, and resin content on medium-
density fiberboards from southern hardwoods. Forest prod. J. 26 (2) : 39-43. XU, H., AND O. SUCHSLAND. 1991.The expansion potential: a new evaluator of the
expansion behavior of wood composites. Forest-Products-Journal, 41 ( 6): 39-42. XU, W., AND O. SUCHSLAND. 1997. Linear expansion of wood composites: a model.
Wood-and-Fiber- Science. 1997, 29(3): 272-281. XU, W., AND P.M. WINISTORFER. 1995 Layer thickness swell and layer internal bond of
medium density fiberboard and oriented strandboard. Forest-Products-Journal. 45(10): 67-71.
XU, W., WINISTORFER, P.M., AND W.W. MOSHLER.1996. A procedure to determine water
absorption distribution in wood composite panels. Wood and Fiber Science. 28(3): 286-294.

Legends for Figures
Figure 1 Setup for determination of LE and LC.
Figure 2 Positions for measuring thickness variations.
Figure 3 Effect of actual specimen density and sorption factor on: (a) TS and TSh; (b)
TSC and TShC; (c) LE and LC and (d) LEC and LCC.
Figure 4 Summary of the effect of nominal density and property type on the level of: (a)
expansion and swelling; (b) expansion and swelling coefficients.

Legends for Tables
Table 1 Summary of results for swelling and expansion properties.
Table 2 Results of analysis of variance for the impact of the nominal density and
orientation on the LE.
Table 3 Analysis of variance for the impact of the nominal density on TS, TSC, TSh,
TShC, LE, LEC, LC and LCC.
Table 4 Results of regression analysis between actual specimen density and TS,
TSC, TSh, TShC, LE, LEC, LC and LCC.
Table 5 Results of analysis of variance for effect of sorption state on the swelling and
expansion properties.
Table 6 Effect of density on the expansion properties expressed by standardized
regression coefficients.

(kg/m³) (kg/m³) (%) (%) (%) (%) (%) (%/%)* (%/%)* (%) (%) (%/%)* (%/%)*
avg 535 6.8 14.2 9.4 3.8 2.6 0.74 0.54 0.13 0.16 0.017 0.034
std 14 0.4 0.9 0.6 0.4 0.4 0.05 0.08 0.05 0.02 0.006 0.004
avg 665 6.9 13.5 9.4 3.6 2.6 0.77 0.62 0.15 0.20 0.023 0.048
std 21 0.7 1.3 0.9 0.7 0.5 0.12 0.08 0.04 0.03 0.004 0.011
avg 790 6.8 13.2 9.9 4.3 3.1 0.84 0.95 0.23 0.25 0.036 0.077
std 26 0.4 0.7 0.6 0.7 0.4 0.12 0.14 0.03 0.01 0.002 0.005
Line
ar C
ontra
ctio
n C
oeffi
cien
t
Thic
knes
s Sw
ellin
g
Den
sity
at 5
0 %
RH
Actu
al M
at i
nitia
l 50
% R
H
Thic
knes
s Sh
rinka
ge C
oefic
ient
Actu
al M
at 8
0 %
RH
Actu
al M
at f
inal
50
% R
H
Stat
istic
Thic
knes
s Sh
rinka
ge
Line
ar E
xpan
sion
Coe
ffici
ent
Line
ar E
xpan
sion
Thic
knes
s Sw
ellin
g C
oeffi
cien
t
Line
ar C
ontra
ctio
n
540
650
800
Nom
inal
Den
sity
* % property change per % M-change

Property
Source DF F-value Pr>F
Model 2 6.01 0.0019
Error 18
orient 1 0.36 0.5585
nom_den 2 13.77 0.0002
orient*nom_den 2 1.09 0.357
LE

F-va
lue
Dun
can
F-va
lue
Dun
can
F-va
lue
Dun
can
F-va
lue
Dun
can
F-va
lue
Dun
can
F-va
lue
Dun
can
F-va
lue
Dun
can
F-va
lue
Dun
can
540 A A A A A A
650 B B B B B B
800 B B B C C C
69.4**
dens
ity le
vel
TS TSC LE LECTSh TShC LC LCC
4.9* 32.5** 41.5**2.4ns 2.1ns 13.6** 35.4**
ns non significant * significant at the 95 % probability level ** significant at the 99 % probability level

Source
DF F-value Pr>F DF F-value Pr>F DF F-value Pr>F DF F-value Pr>F
Model 1 3.08 0.0671 1 5.57 0.0276 1 5.47 0.0289 1 37.59 <.0001Error 22 - - 22 - - 22 - - 22 - -
ac_dens - - - 1 5.57 0.0276 1 5.47 0.0289 1 37.59 <.0001
Regression equation
R²
Source
DF F-value Pr>F DF F-value Pr>F DF F-value Pr>F DF F-value Pr>FModel 1 29.14 <.0001 1 72.47 <.0001 1 66.15 <.0001 1 91.84 <.0001Error 22 - - 22 - - 22 - - 22 - -
ac_dens 1 29.14 <.0001 1 72.47 <.0001 1 66.15 <.0001 1 91.84 <.0001
Regression equation
R² 0.6 0.77
TShC = 0.313+ 0.0015ac_dens
TS TShC
0.20
n.s.
LCC
LE = - 0.099+ 0.0004ac_dens
0.63
LE
LEC = - 0.023+ 7.3*10-5ac_dens
LC = - 0.037+ 3.6*10-4ac_dens
0.75 0.75
TSC TSh
LEC LC
TSC = 0.49+ 0.0004ac_dens
TSh = 1.44+ 0.002ac_dens
LCC = - 0.056+ 1.6*10-4ac_dens
0.20

Source
DF F-value Pr>F DF F-value Pr>F DF F-value Pr>F DF F-value Pr>F
Model 5 14.36 <.0001 5 15.85 <.0001 5 18.33 <.0001 5 95.78 <.0001
Error 42 42 42 42
sorption_state 1 58.63 <.0001 1 6.84 0.0123 1 10.93 0.0019 1 234.59 <.0001
density 2 6.43 0.0037 2 26.4 <.0001 2 39.99 <.0001 2 105.81 <.0001
sorption*density 2 0.16 0.8489 2 9.8 0.0003 2 0.36 0.7032 2 16.35 <.0001
TSC vs TShC LE vs LC LEC vs LCCTS vs TSh
Standardized Regression Coefficient
TS 0.28
TSC 0.47
TSh 0.45
TShC 0.79
LE 0.75
LEC 0.88
LC 0.87
LCC 0.90

27
Legends for Figures
Figure 1 Setup for determination of LE and LC.
Figure 2 Positions for measuring thickness variations.
Figure 3 Effect of actual specimen density and sorption factor on: (a) TS and TSh; (b)
TSC and TShC; (c) LE and LC and (d) LEC and LCC.
Figure 4 Summary of the effect of nominal density and property type on the level of: (a)
expansion and swelling; (b) expansion and swelling coefficients.

28
SPECIMEN LVDT
ALUMINUM BODY
29

30
0.0
1.5
3.0
4.5
6.0
500 600 700 800 900Density (kg/m³)
TS a
nd T
Sh (%
)
TS TShTSh TS
0.30
0.60
0.90
1.20
500 600 700 800 900Density (kg/m³)
TSC
and
TSh
C (%
/%)
TSC TShCTSC TShC
(a) (b)
0.0
0.1
0.2
0.3
500 600 700 800 900
Density (kg/m³)
LE a
nd L
C (%
)
LE LCLE LC
0.00
0.03
0.05
0.08
0.10
500 600 700 800 900Density (kg/m³)
LEC
and
LC
C (%
/%) LEC LCC
LEC LCC
(c) (d)
31
Expa
nsio
n or
sw
ellin
g (%
)
540
650
800
TS TSh LE LCDensity (kg/m³)
Property
TSh
LE LC
0.0
1.5
3.0
4.5
TS
0.00
0.10
0.20
0.30
TSC
(a)
Expa
nsio
n or
sw
ellin
g co
effic
ient
(%/%
)
540
650
800
TSC TShC LEC LCC Density (kg/m³)
Property
TShC
LEC LCC
(b)