linearity and local linearity. linear functions
TRANSCRIPT
Linearity and Local Linearity
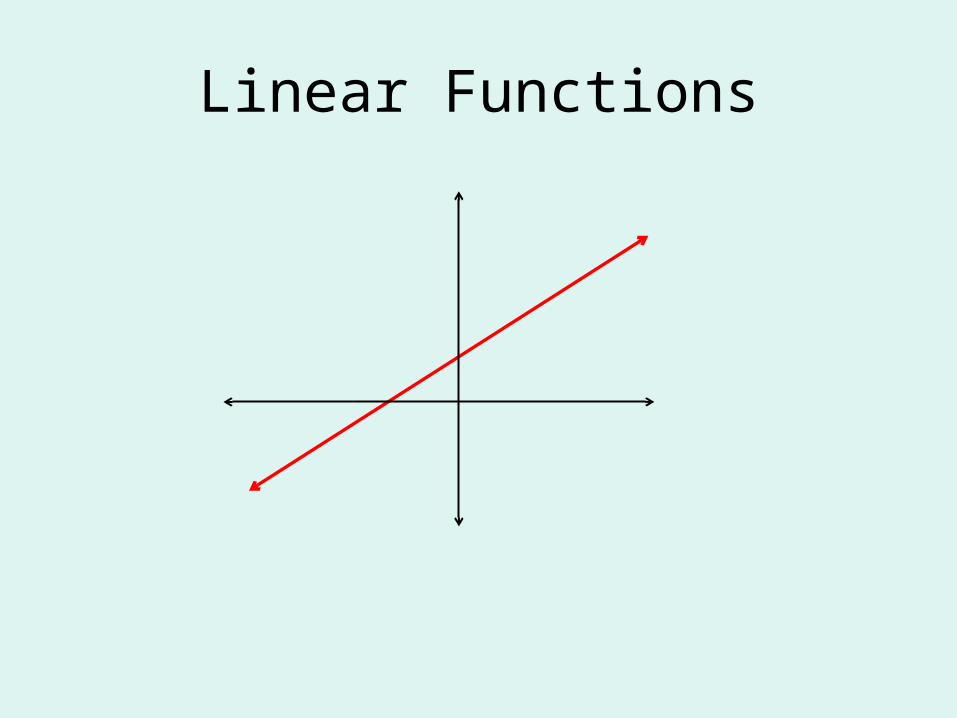
Linear Functions
Linear Functions
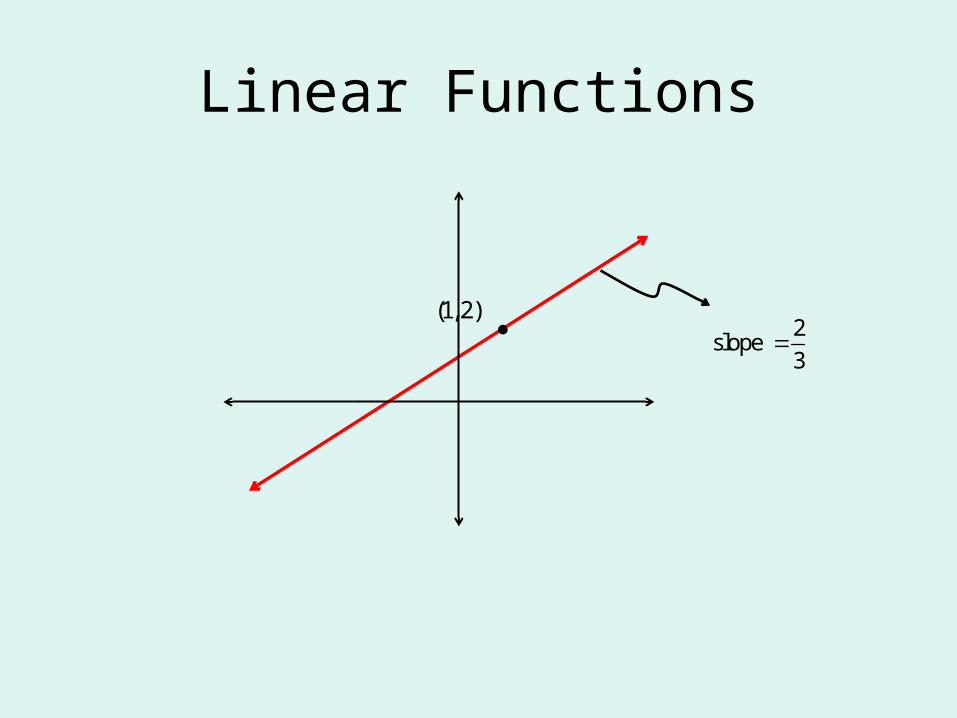
(1,2)2
slope 3
Linear Functions
(1,2)
2slope
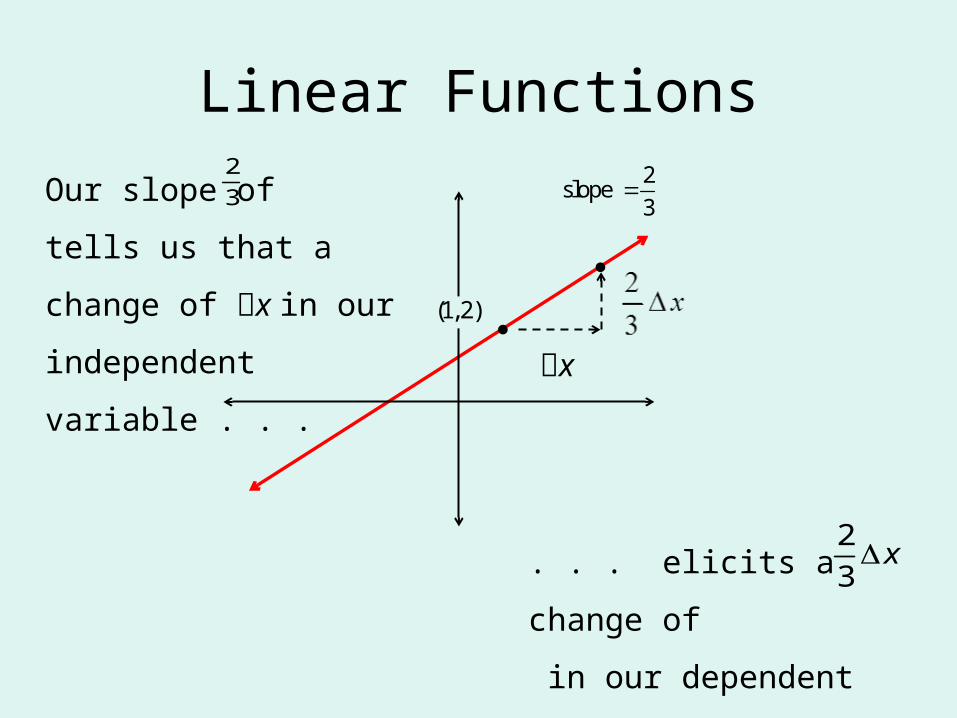
3Our slope of tells us
that a change of x in our
independent variable . . .
2
3
x
. . . elicits a change of
in our dependent variable.
2
3x
Linear Functions
(1,2)
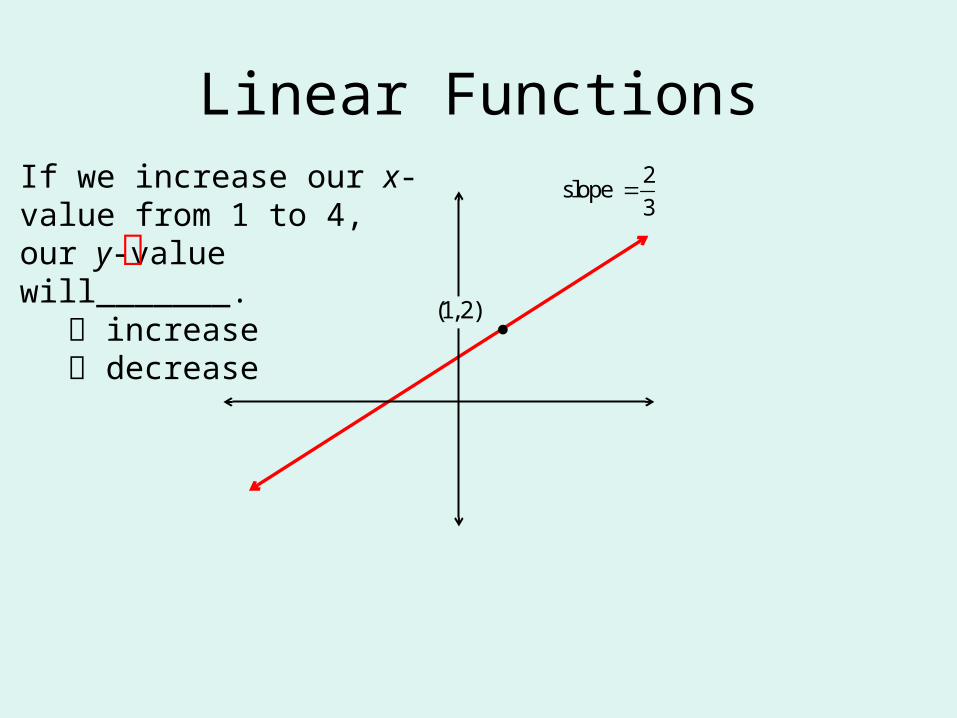
If we increase our x-value from 1 to 4, our y-value will_______.
increase decrease
2slope
3
Linear Functions
(1,2)
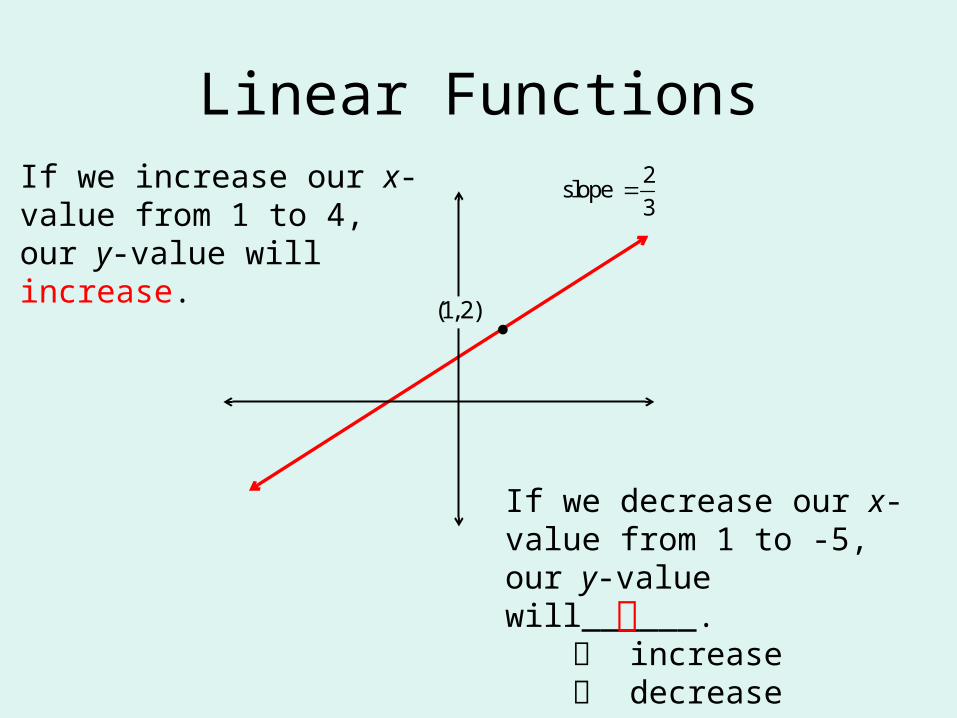
If we increase our x-value from 1 to 4, our y-value will increase.
2slope
3
If we decrease our x-value from 1 to -5, our y-value will______. increase
decrease
Linear Functions
(1,2)
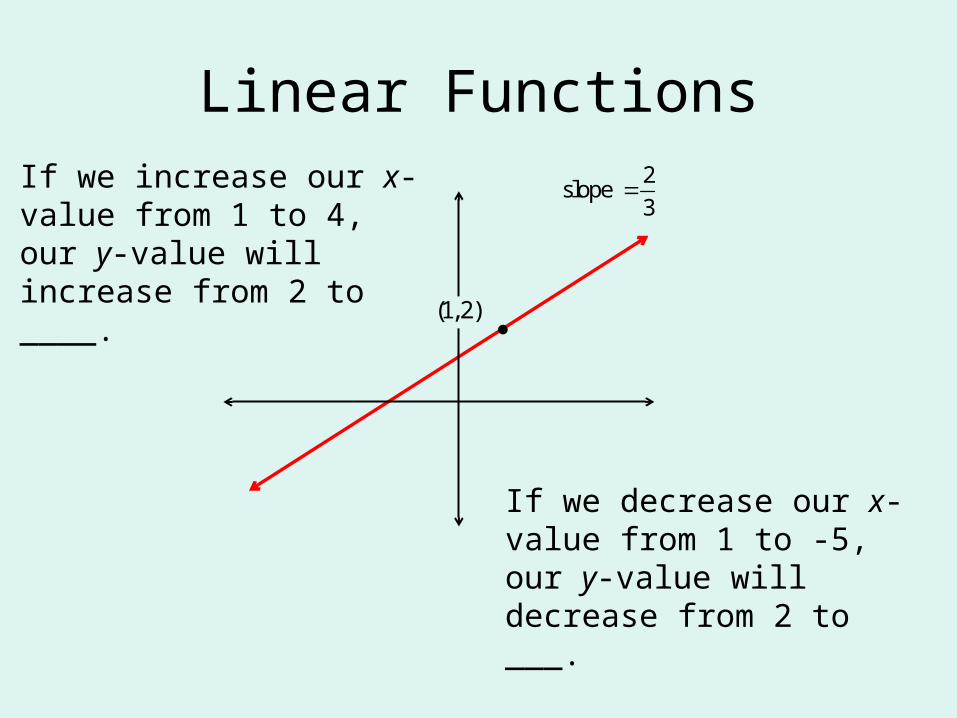
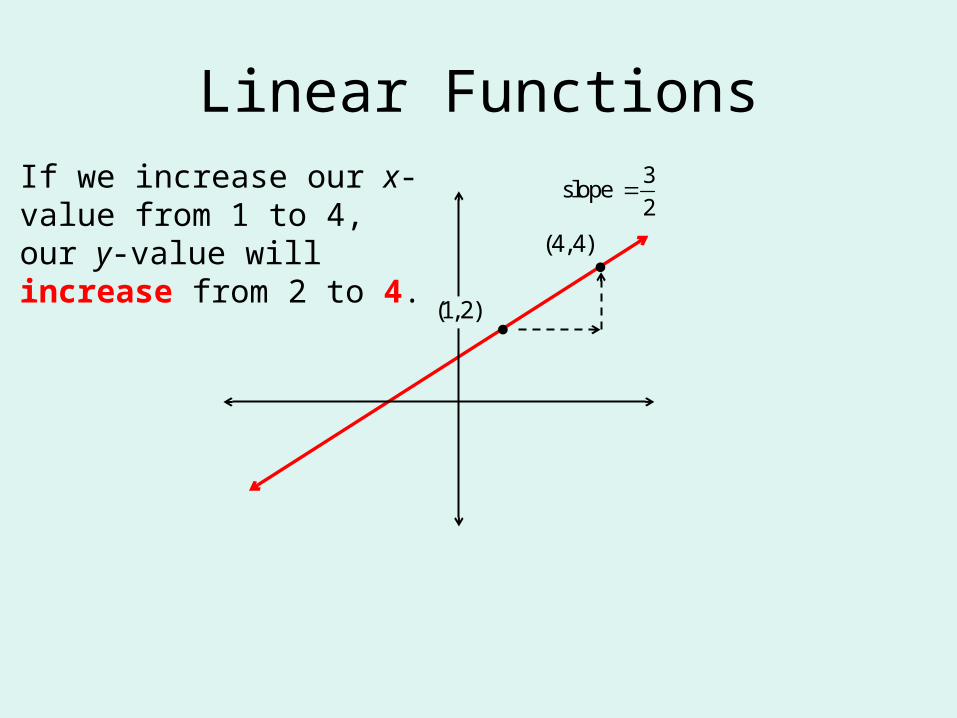
If we increase our x-value from 1 to 4, our y-value will increase from 2 to ____.
2slope
3
If we decrease our x-value from 1 to -5, our y-value will decrease from 2 to ___.
Linear Functions
(1,2)
3slope
2
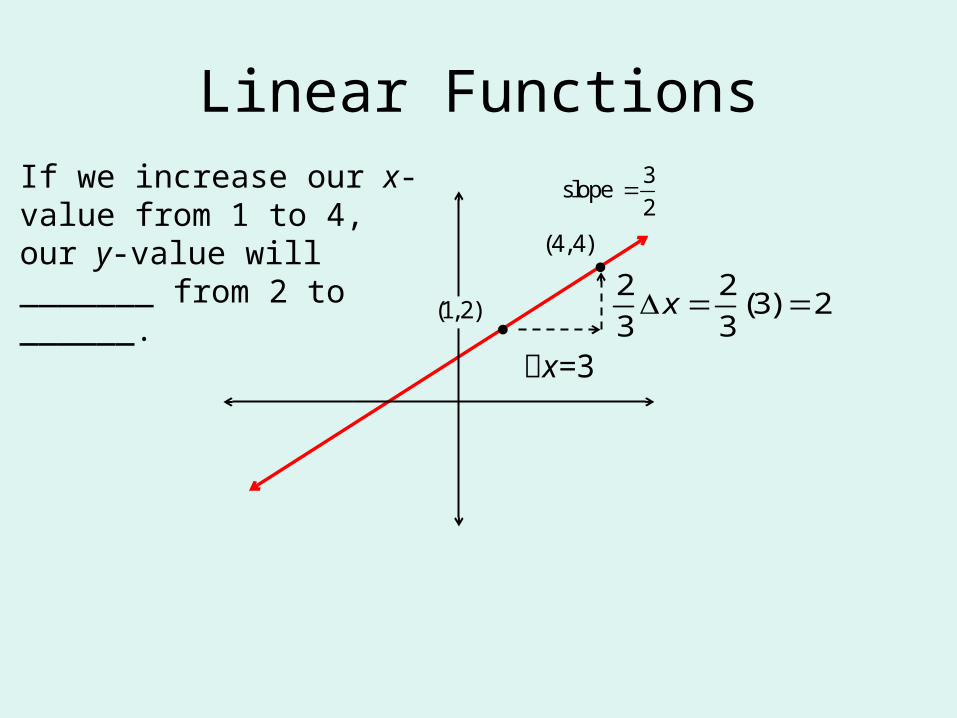
x=3
2
3x
If we increase our x-value from 1 to 4, our y-value will _______ from 2 to ______.
2(3) 2
3
(4,4)
Linear Functions
(1,2)
If we increase our x-value from 1 to 4, our y-value will increase from 2 to 4.
3slope
2
(4,4)
Linear Functions
(1,2)
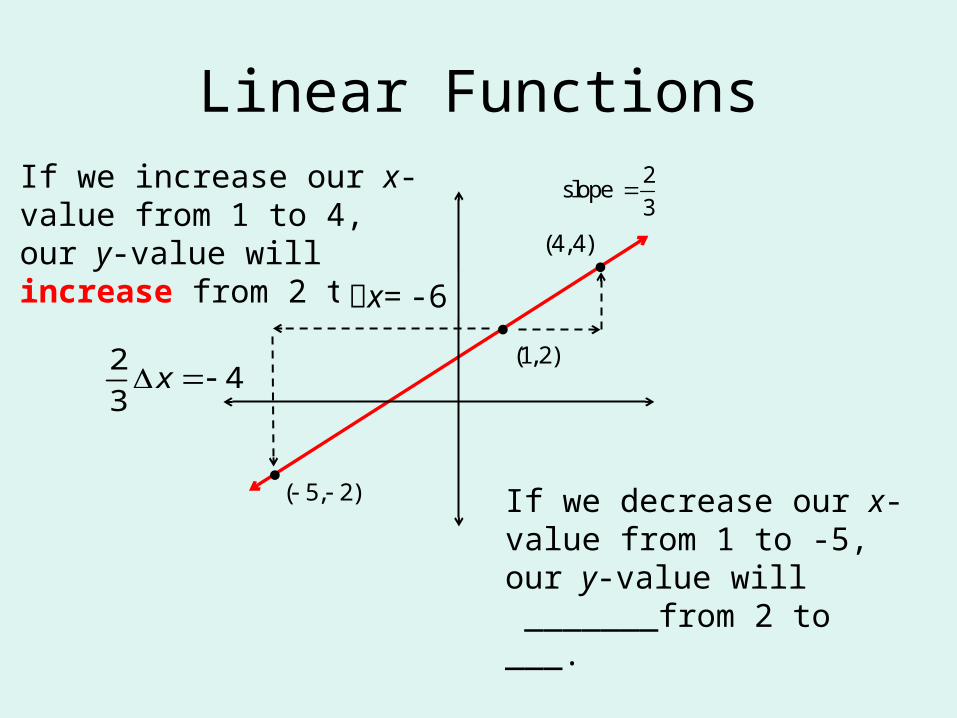
If we increase our x-value from 1 to 4, our y-value will increase from 2 to 4.
2slope
3
x= -6
If we decrease our x-value from 1 to -5, our y-value will _______from 2 to ___.
24
3x
( 5, 2)
(4,4)
Linear Functions
(1,2)
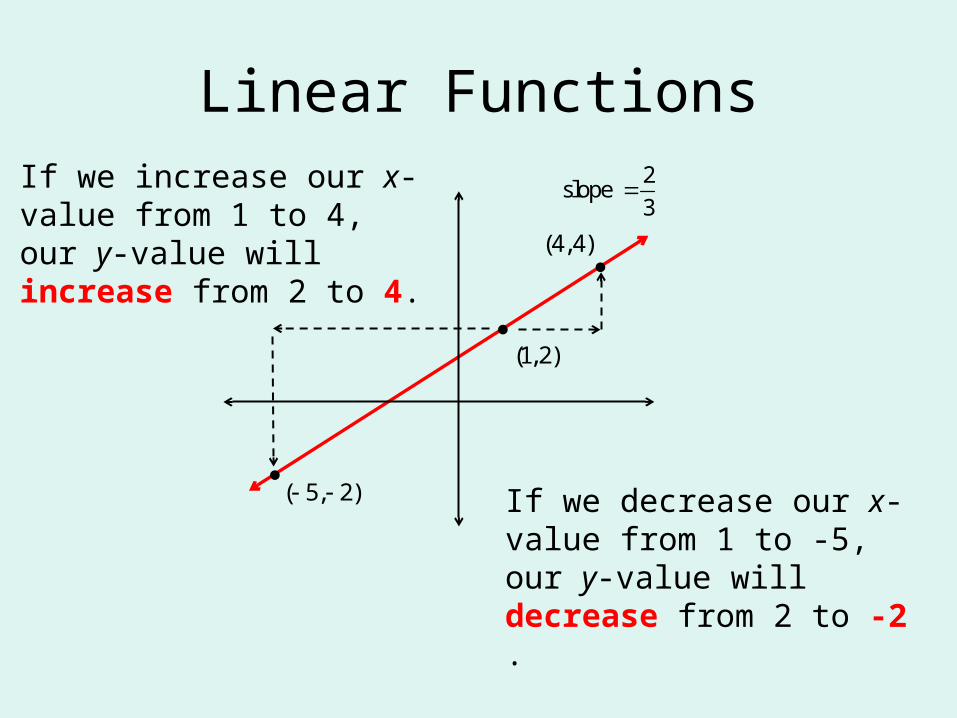
If we increase our x-value from 1 to 4, our y-value will increase from 2 to 4.
2slope
3
( 5, 2) If we decrease our x-value from 1 to -5, our y-value will decrease from 2 to -2 .
(4,4)
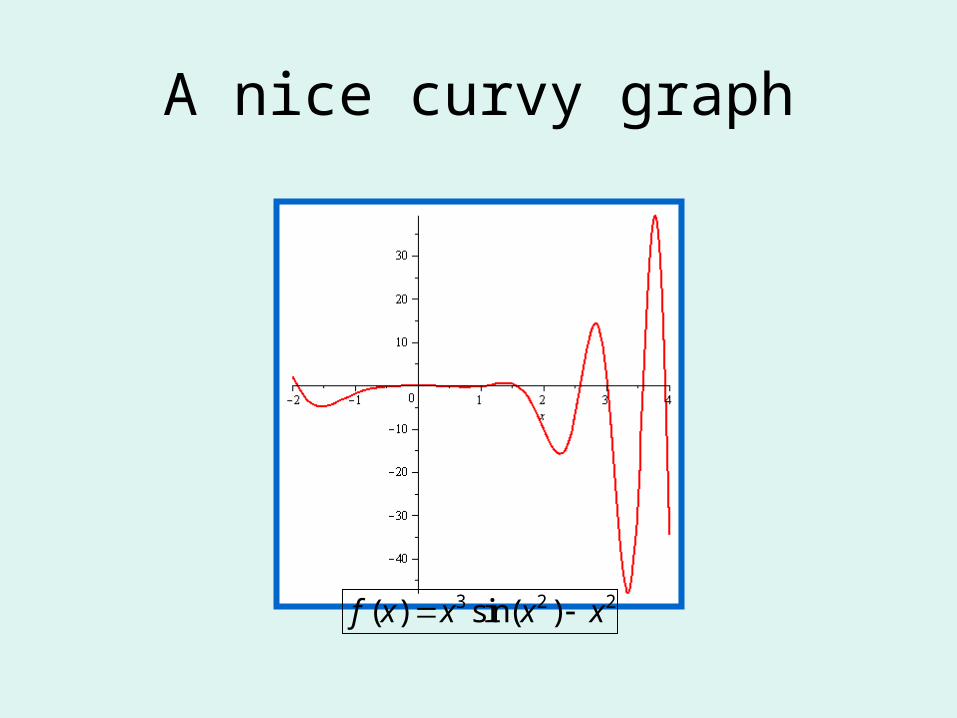
A nice curvy graph
3 2 2( ) sin( )f x x x x
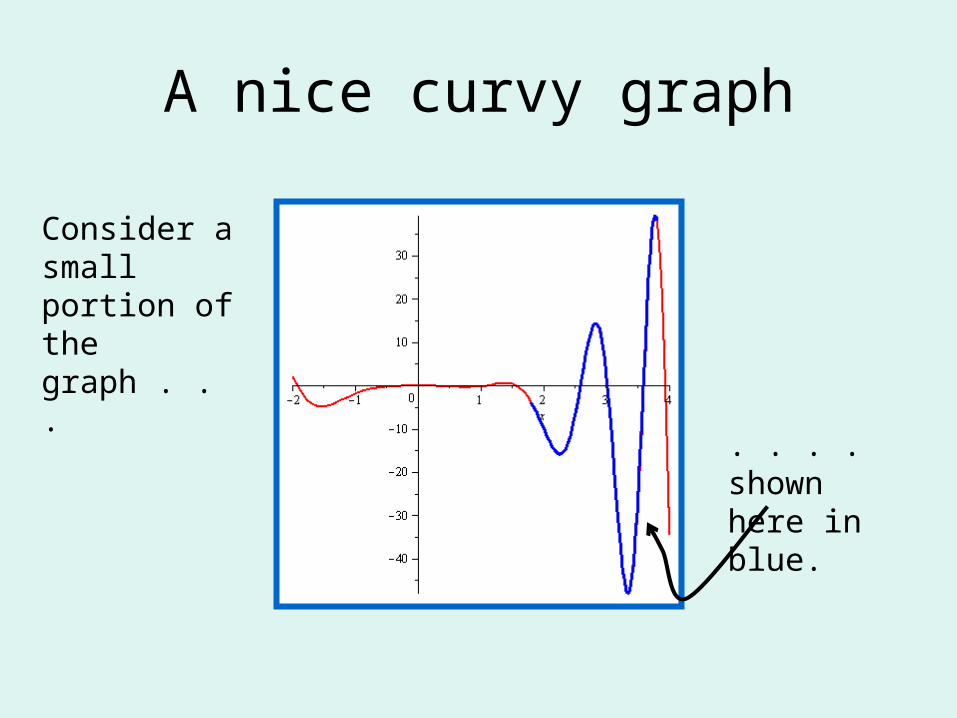
A nice curvy graph
Consider a small portion of the graph . . .
. . . . shown here in blue.
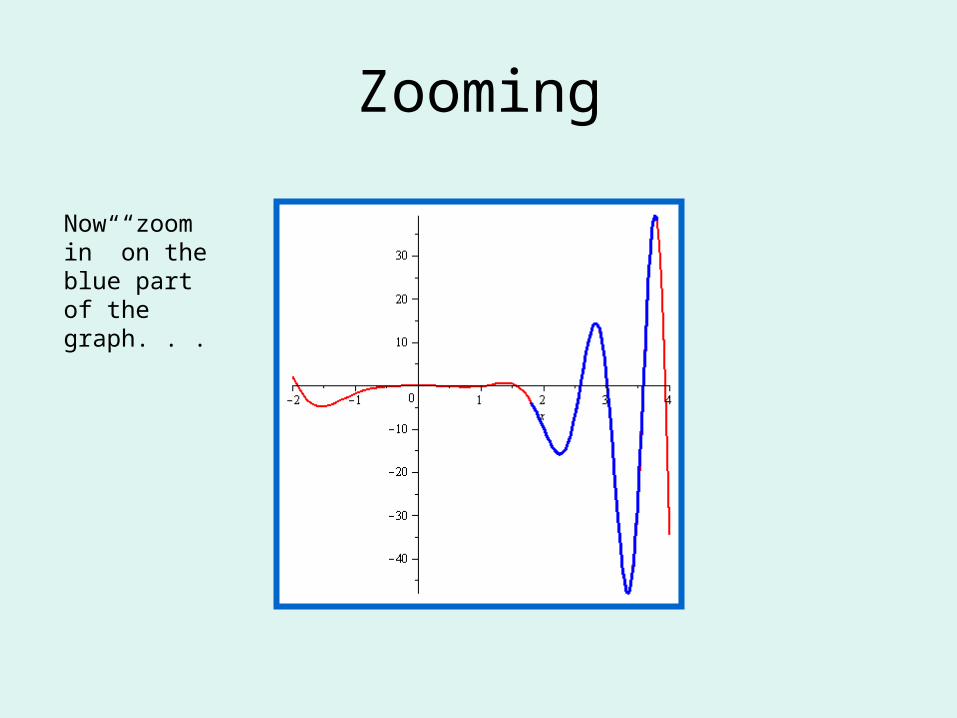
Zooming
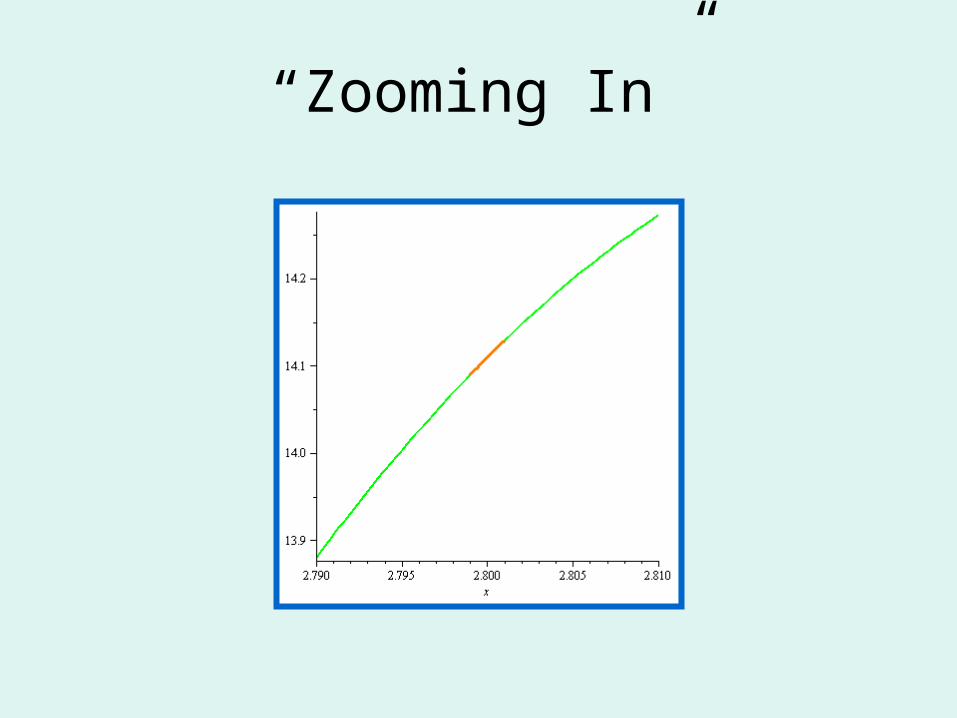
Now “zoom in” on the blue part of the graph. . .
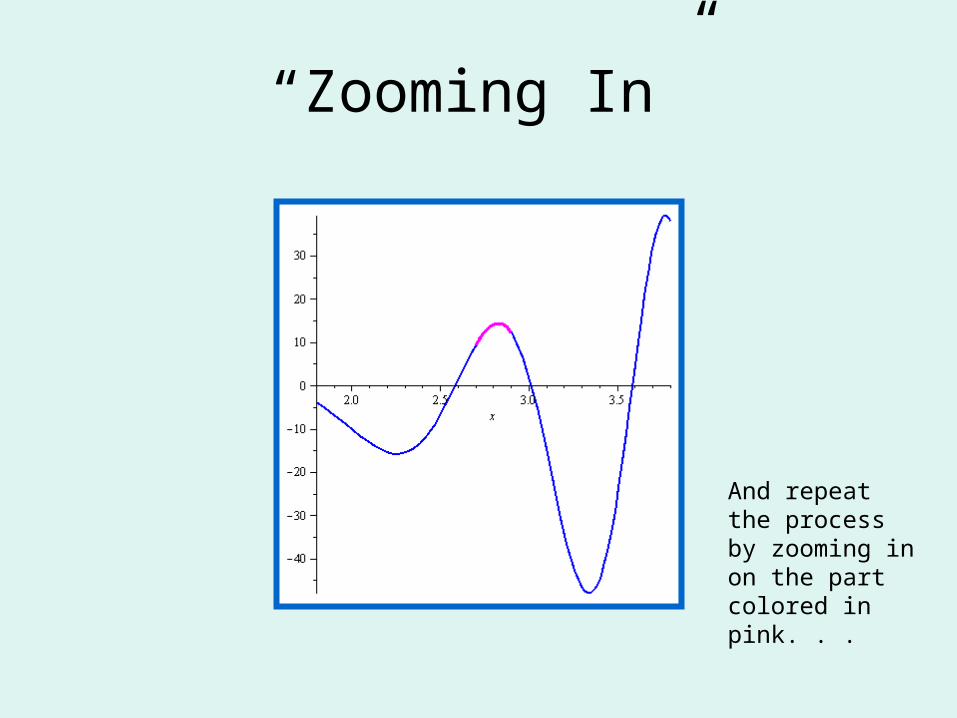
“Zooming In”
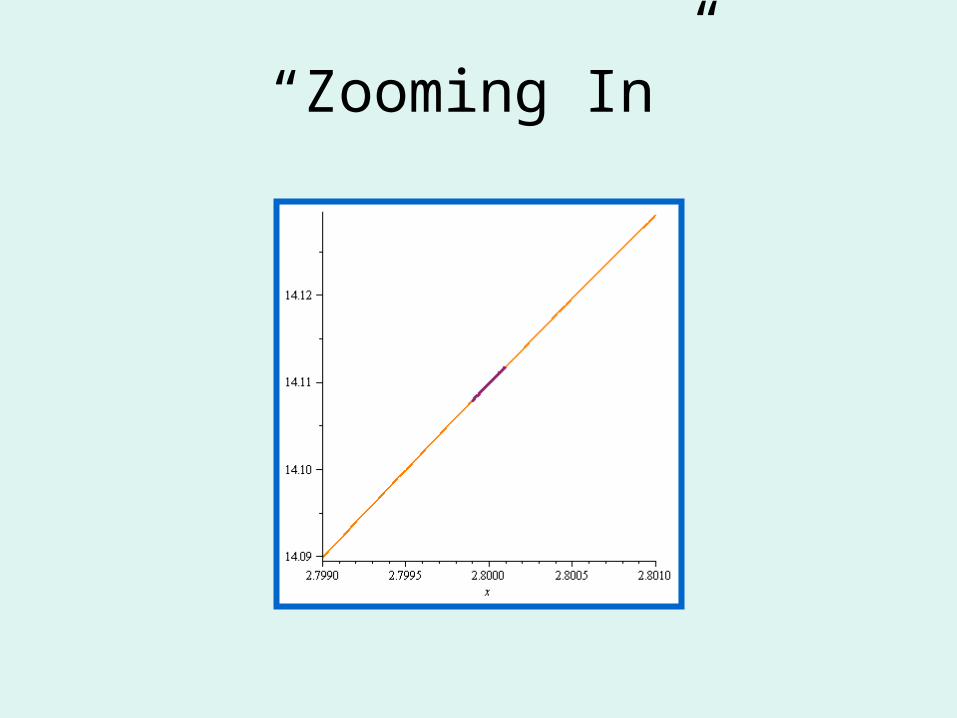
And repeat the process by zooming in on the part colored in pink. . .
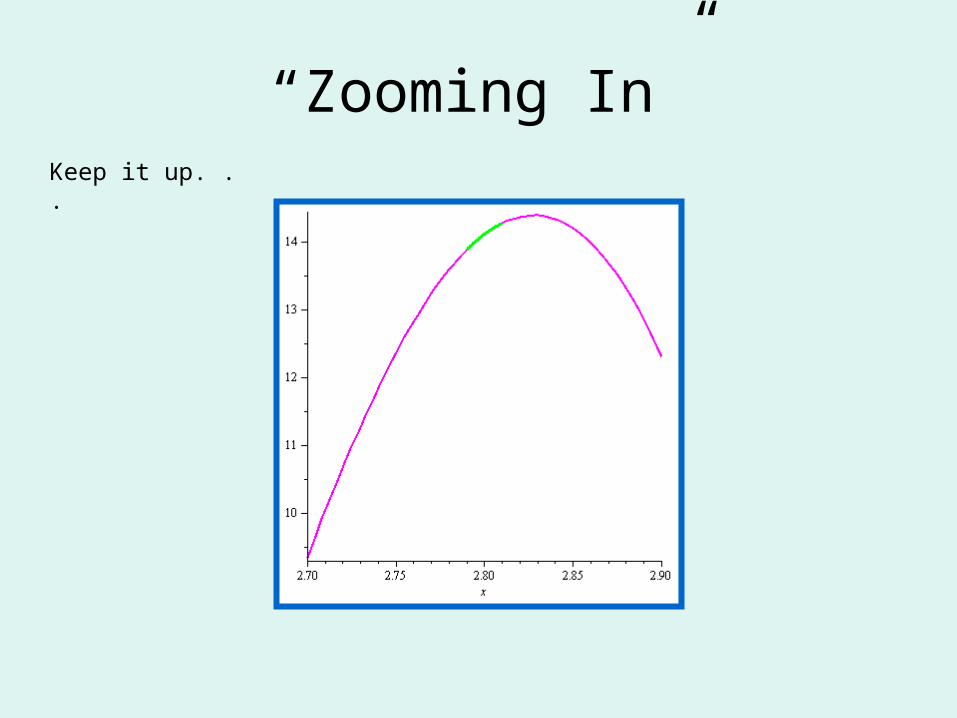
“Zooming In”Keep it up. . .
“Zooming In”
“Zooming In”
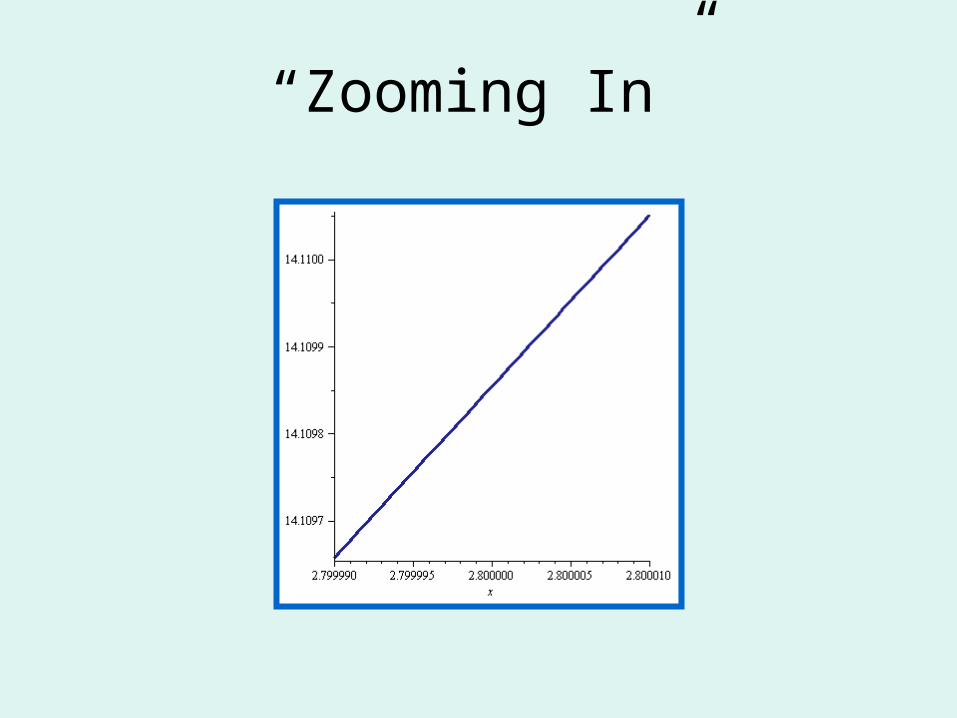
“Zooming In”
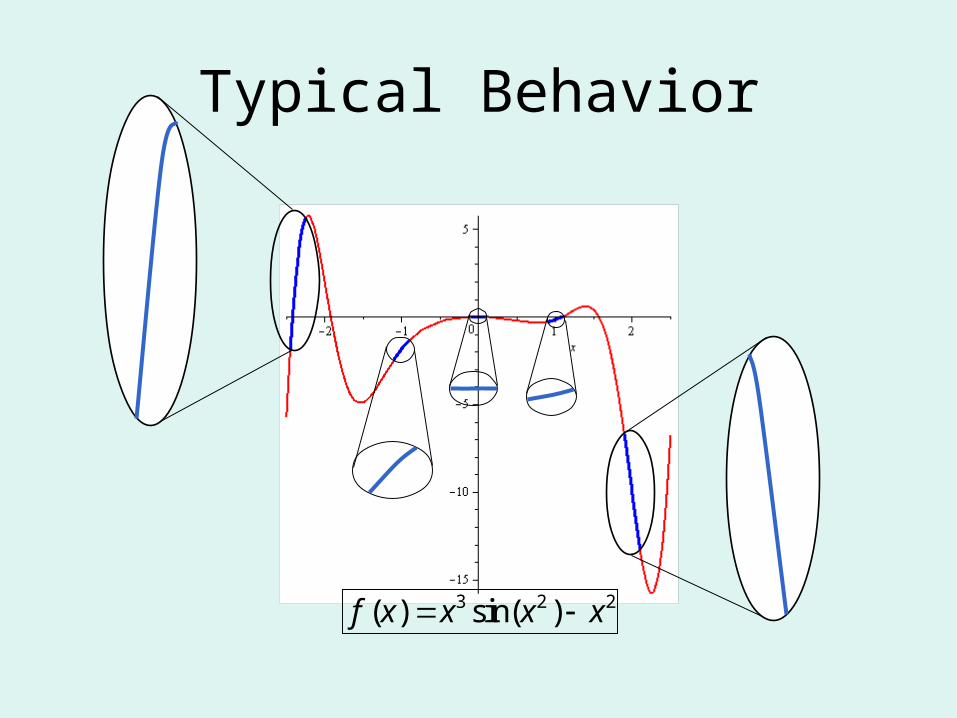
Typical Behavior
3 2 2( ) sin( )f x x x x
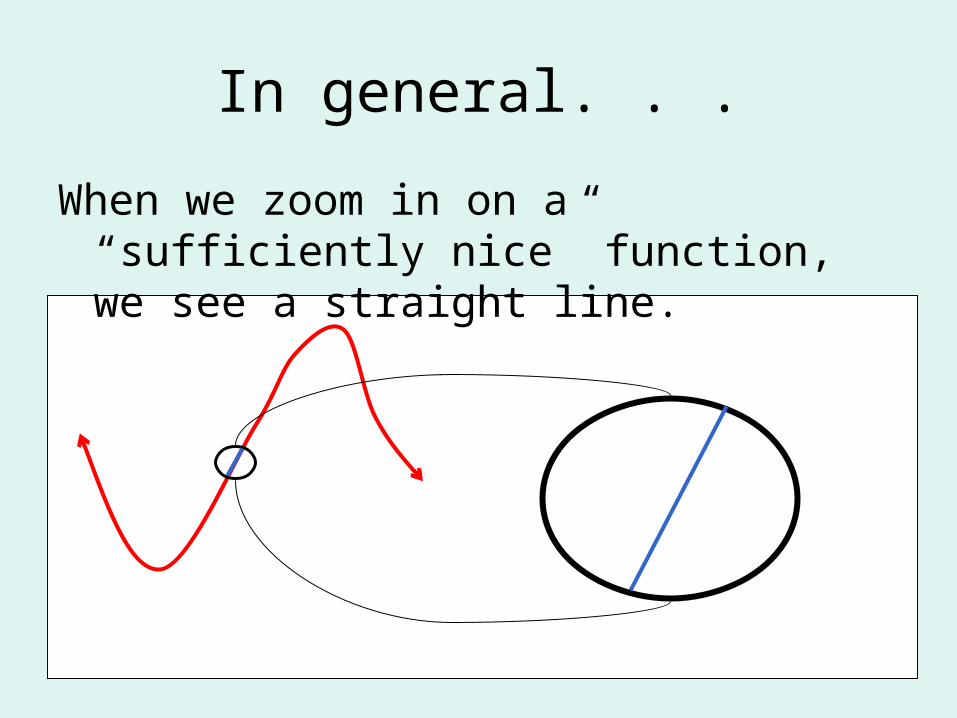
In general. . .
When we zoom in on a “sufficiently nice” function, we see a straight line.
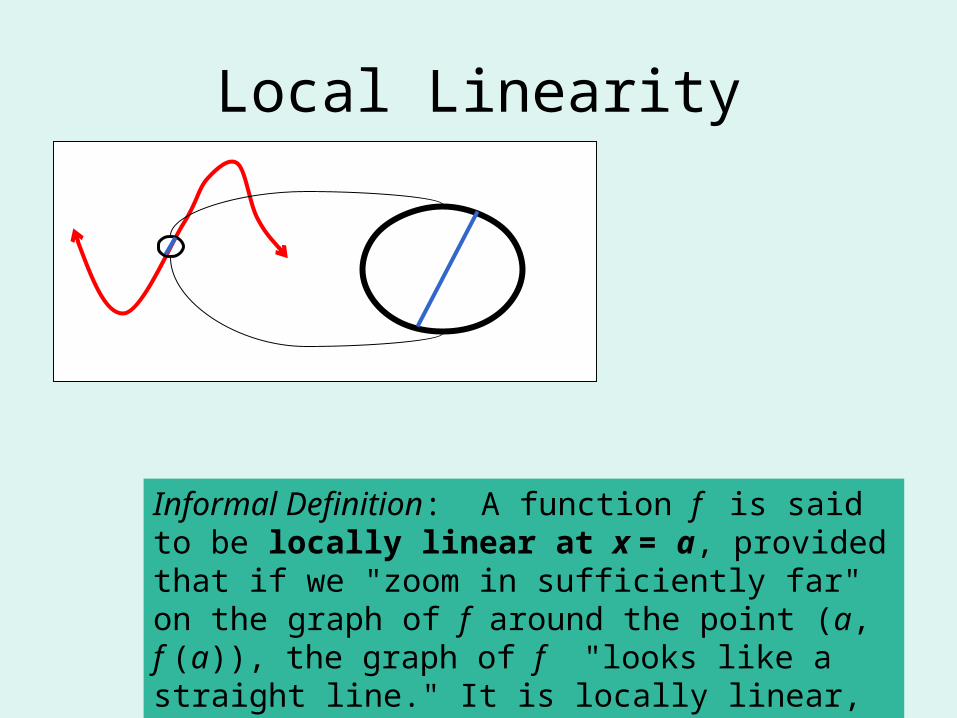
Informal Definition: A function f is said to be locally linear at x = a, provided that if we "zoom in sufficiently far" on the graph of f around the point (a, f (a)), the graph of f "looks like a straight line." It is locally linear, provided that it is locally linear at every point.
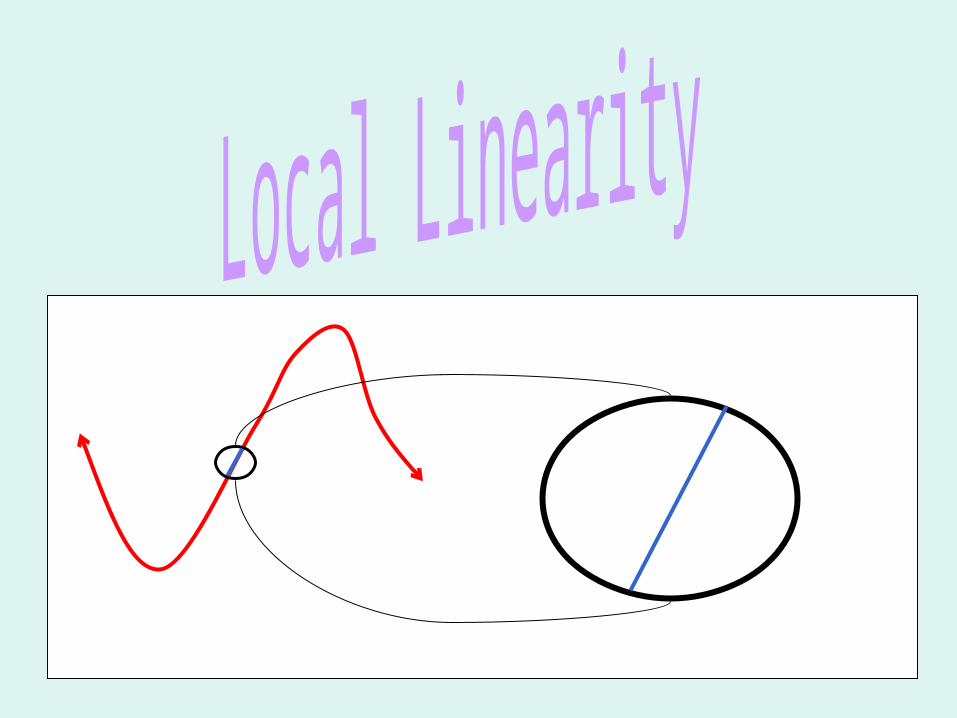
Local Linearity
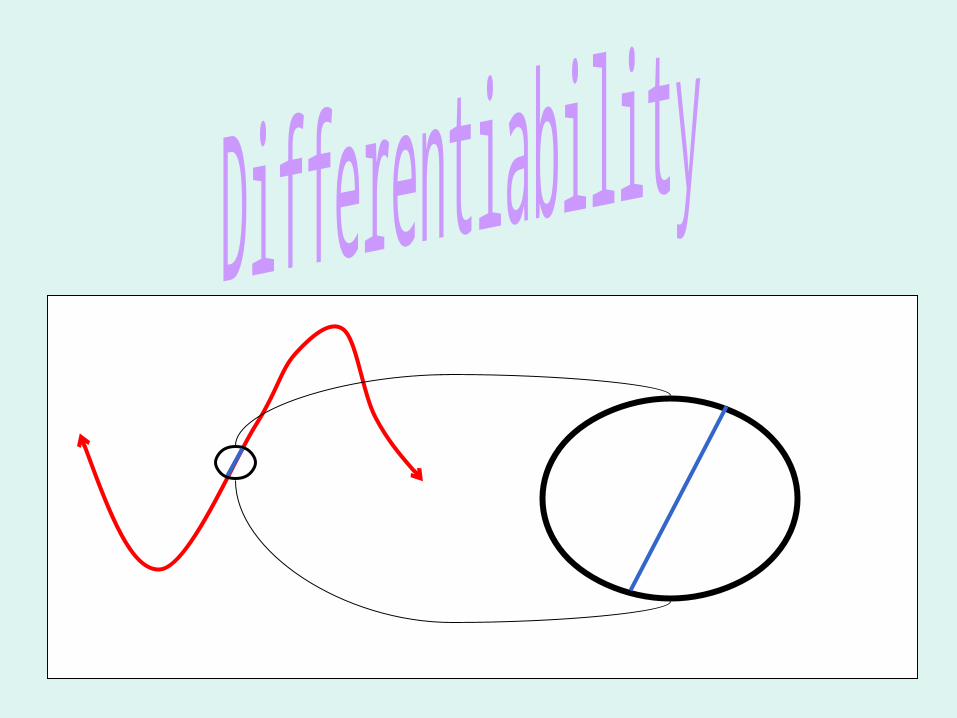
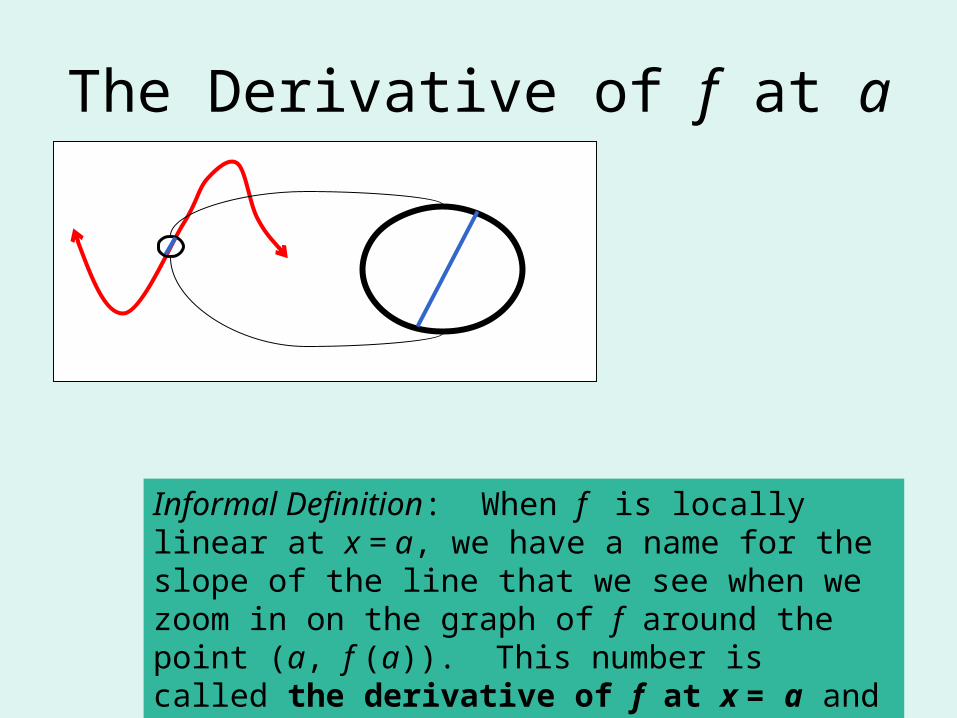
Informal Definition: When f is locally linear at x = a, we have a name for the slope of the line that we see when we zoom in on the graph of f around the point (a, f (a)). This number is called the derivative of f at x = a and is denoted, symbolically by f ’(a).
The Derivative of f at a