linguistic and cultural geography of contemporary peru
TRANSCRIPT

TEXAS PAPER ON LATIN AMERICA
Pre-publication working papers of the
Institute of Latin American Studies
University of Texas at Austin
ISSN 0392-3507
Linguistic and Cultural Geography
of Contemporary Peru
Gregory KnappDepartment of Geography
Paper No. 87-13

Linguistic and Cultural Geograpby of Contemporary Peru
Gregory Knapp
In view of the recent upsurge of interest in Peruvian regions and regional development (CDI-CEDESA 1984; González de Olarte 1985), it is surprising that none of these discussions of regional-ization adequately takes into account language or culture. In many countries, regional divisions havebeen primarily based on cultural or linguistic pattems, and the greatest challenge has been 10 achievebalanced development for all ethnic groups.
The available etbnic maps for Peru are based on language. They show spheres of influence forvarious languages (pesce 1969) but lack a quantitative basis and do not indicate the numerically pre-ponderant languages and cultures. They also do not distinguish between cultural groups that are notindigenous language speakers.
This report, by using quantitative data of language and ethnicity as found in various censuses,will attempt to map the cultural regions of Peru.
Language as a Cultural Indicator
There are three advantages to using language as a point of departure in mapping and definingculture regions: (1) language is strongly implicated in the transmission of culture and is thus linked tomany nonlinguistic cultural traits, such as folklore, religion, and music; (2) language frontiers betweengroups impede cultural transmission and many times coincide with other cultural boundaries, includingagricultural and housing traits; (3) language is a cultural trait that is relatively stable and easy 10determine through census information.
Here we will defme Peruvian cultural regions primarily in terms of language. We will assumethat language is related 10other cultural traits and 10ethnic self-identity (Stark 1985:485).
Census of Language
There were national censuses of language in 1940,1961,1972, and 1981 (tables 1 through 5).These censuses did not reach the entire Peruvian population because of oversight, hostility, or error. Inaddition, there was a substantial population (población selvícola) beyond the reach or knowledge of thePeruvian state.
The census may be treated as a sampling procedure. It most accurately reflects the linguisticcharacteristics of the population in those districts with a substantial majority speaking a single lan-guage. In those districts where more than one language is spoken, there is the possibility that underre-porting was more prevalent in one language than in another, biasing the results. Persons may alsohave lied about their language. Spanish-Indian bilinguals may have c1aimed to be Spanish monolin-guals, and Indian monolinguals may have claimed to be bilingual.
These difficulties may be addressed by several methods. It is wise 10combine monolingualsand bilinguals and define as Indian-speaking all who understand an Indian language.
It is also pertinent 10 use the smallest possible geographical units for mapping, since such smallunits are more likely 10possess uniform linguistic characteristics and adjacent units provide a check onthe accuracy of linguistic measurement.
Within the geographical units, the threshold population for linguistic domains should proba-bly be set at less than 50 percent for Indian languages, to correct for underreporting. EIsewhere 33 per-cent has been found 10be a useful threshold value (Knapp 1987).

Characteristics of Language Censuses: Geographical Coverage
The four modem language censuses were performed at varying intervals. In cach case, datawere provided for the territorial units of Pero (table 1). Peru is divided into departamentos (plus oneconstitutional province); the departamentos are in tum divided into provincias, which are divided intodistritos.
The number of distritos increased form 1,064 in 1940 to 1,680 in 1981. Each census hasprovided population data for the urban and rural parts of each distrito.
It is difficult to find base maps showing individual distritos. The oldest such map in thearchives of the Instituto Nacional de Estadística was used for this study (INE 1982); it shows the pat-tero of distritos about the time of the 1981 census (which was virtually unchanged since 1972). Be-tween 1961 and 1972, 185 new distritos. were formed. Most of these were created in the eastem low-lands, or in highland or coastal areas with relative1y few indigenous language speakers. Thus the recentdistrito map can be used-with apprapriate care--to map distributions from the 1961 census.
The only modero census that shows language distributions at the distrito level is the 1961census (tabIe 1). 1 therefore decided to use this census to map language use in the highlands and thecoast.
Language data were not availabIe for rural and urban areas within distritos; since 1 wanted tomap rural culture areas, I ignored results fram distritos containing the provincial capitals where theseresults differed fram those of surrounding distritos.
The 1961 census results were never published for the Departments of San Martín, Tacna, andTumbes. I mapped pattems for these arcas using data from 1941 and 1981 censuses.
In 1961, the Huanca dialect of Qucchua was rcported as a non-Quechua dialect. To correct forthis, in areas where Huanca is spoken, the numbcr of speakers of non-Quechua dialects was added to thenumbcr of people spcaking Quechua.
None of the modem population censuses provides adcquate information for the mapping oflanguages in the eastem lowlands of Pero. A better source is the recent Directorio de ComunidadesNativas del Perú (DCCN 1986). This gives the ethno-linguistic group, political district (distrito), andpopulation in 1986 for each village. The 1986 population is an adjusted value, based on the popula-tion provided the govemment at the time of inscription. plus an assumed growth since then of 3.5 per-cent per ycar.
The directory ineludes data on 701 villages with 124,411 estimated members in 1986. It doesnot inelude data on "acculturated" Indian groups, the most important of which are the Lamistas and theCocama.
Mapping the Areas of Indian Language Predominance
I decided to map three levels of intensity of non-Spanish language use: nuelei, domains, andspheres (maps.1-3). Nuclei (núcleos) are arcas where over 75 percent of the population spcaks an in-digenous language or is a member of a native selva community. Domains (dominios) are areas whereover 33 percent of the population speaks a native language or is a community member. Spheres areareas where over 1.5 percent of the population spcaks a native language or is a community membcr.
Different sources had to be used for different parts of the country. For the highlands and coast,except for Tumbes and Tacna, the 1961 language census was used. since this is the only census withdata at the distrito leve!. The number of persons reporting an Indian mother tongue was divided by thetotal number of persons in the reporting age group ror each distrito. Distritos that contained theprovincial capital were considered urban and thus ignored for mapping purposes.
2
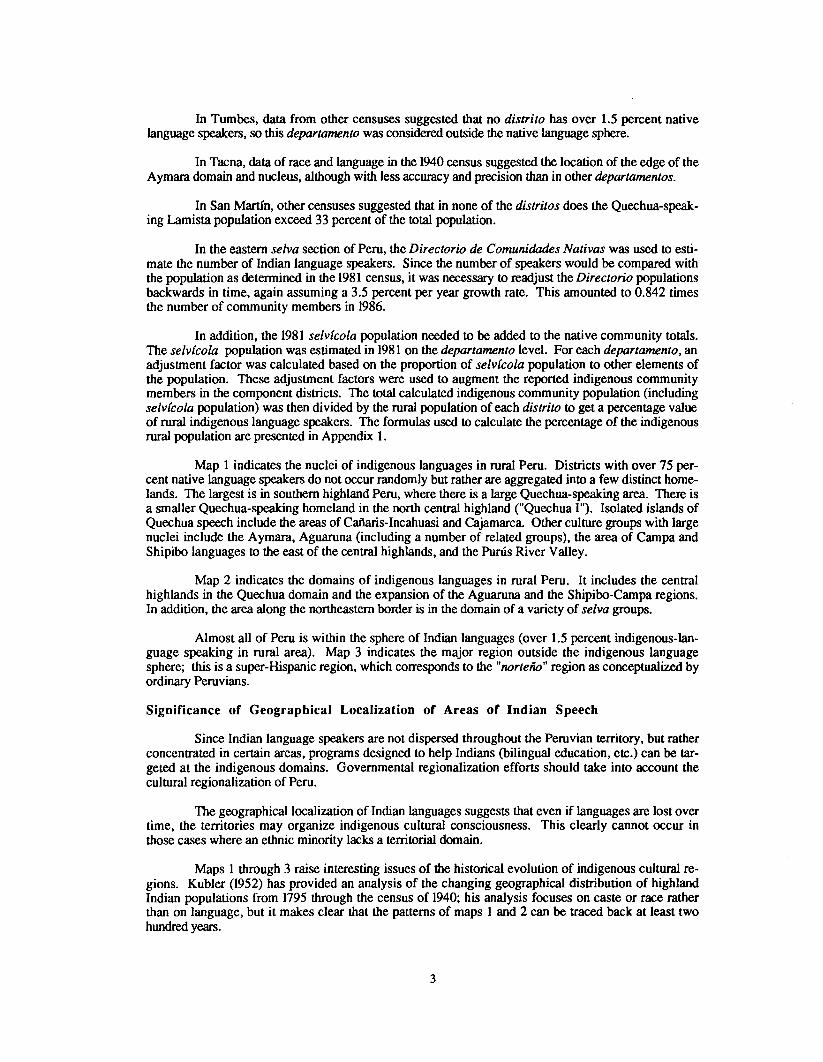
In Tumbes, data from other censuses suggested that no distrito has over 1.5 percent nativelanguage speakers, so this departamento was considered outside the native language sphere.
In Tacna, data of race and language in the 1940 census suggested the location of the edge of theAymara domaín and nucleus, although with less accuracy and precision than in other departamentos.
In San Martín, other censuses suggested that in none of the distritos does the Quechua-speak-ing Lamista population exceed 33 percent of the total population.
In the eastem selva sectíon of Peru, the Directorio de Comunidades Nativas was used to estí-mate the number of Indian language speakers. Since the number of speakers would be compared withthe population as determined in the 1981 census, it was necessary to readjust theDirectorio populatíonsbackwards in time, again assuming a 3.5 percent per year growth rate. This amounted to 0.842 timesthe number of community members in 1986.
In additíon, the 1981 selvícola population needed to be added to the native community totals.The selvícola populatíon was estímated in 1981on the departamento leve!. For each departamento, anadjustment factor was calculated based on the proportíon of selvícola populatíon to other elements ofthe population. These adjustment factors were used to augment the reported indigenous communítymembers in the component districts. The total calculated indigenous communíty populatíon (includingselvícola populatíon) was then divided by the rural populatíon of each distrito to get a percentage valueof rural indigenous language speakers. The formulas used to calculate the percentage of the indigenousrural populatíon are presented in Appendíx l.
Map 1 indicates the nuclei of indigenous languages in rural Peru. Districts with over 75 per-cent natíve language speakers do not occur randomly but rather are aggregated into a few distinct home-lands. The largest is in southem highland Peru, where there is a large Quechua-speaking area. There isa smaller Quechua-speakíng homeland in the north central highland ("Quechua 1"). lsolated islands ofQuechua speech include the areas of Cañaris- Incahuasi and Cajamarca. Other culture groups with largenuclei include the Aymara, Aguaruna (íncluding a number of related groups), the area of Campa andShipibo languages to the east of the central highlands, and the Purús River Valley.
Map 2 indicates the domains of indigenous languages in rural Peru. It includes the centralhighlands in the Quechua domaín and the expansion of the Aguaruna and the Shipibo-Campa regions.In additíon, the area along the northeastem border is in the domain of a variety of selva groups.
Almost all of Peru is within the sphere of Indian languages (over 1.5 percent indigenous-lan-guage speaking in rural area). Map 3 indicates the major region outside the indigenous languagesphere; this is a super-Hispanic region, which corresponds to the "norteño" regíon as conceptualízed byordinary Peruvians.
Significaoce of Geographical Localizatioo of Areas of lodian Speech
Since Indian language speakers are not dispersed throughout the Peruvian territory, but ratherconcentrated in certain areas, programs designed to help Indians (bilíngual educatíon, ete.) can be tar-geted at the indigenous domains. Govemmental regionalizatíon efforts should take into account thecultural regionalízatíon of Peru.
The geographicallocalizatíon of Indian languages suggests that even íf languages are lost overtime, the territories may organize indigenous cultural consciousness. This clearly cannot occur inthose cases where an ethnic minority lacks a territorial domaín.
Maps 1 through 3 raíse interesting issues of the historical evolutíon of indigenous cultural re-gions. Kubler (1952) has provided an analysis of the changing geographical distribution of highlandIndian populatíons from 1795 through the census of 1940; his analysis focuses on caste or cace ratherthan on language, but ít makes clear that the pattems of maps 1 and 2 can be traced back at least twohundred years.
3

o.
PERU
QUECHUA. 1961
OTRAS, 1981AYMARA. 1940 - 1961
200.
KM
400.
KNAPP 1987
Map 1. Nuclei of Indigenous Languages in Rural Peru
4

D '"o"
0,
'"
~. .
o
PERU
QUECHUA - SIERRA
OTRAS
200I
KM
400
KNAPP 1987
Map 2. Domains of Indigenous Languages in Rural Peru
5

r..:::. ::1 < 1.5% QUECHUA +AGUARUNA1961
\himbote
oI
100I
200I
300
KM
KNAPP 1987
Map 3. Region Outside of Sphere of Indigenous Languages in Peru
6

Modero Cultural Regions of Peru
If areas in which indigenous speech predominates constitute cultural regions, one may askabout the existence ol' non-Indian culture regions in modem Peru. For example, the last census withinformation on race, the census 01'1940,pcrmits us lo map the sphere of the black population (map 4),which, ckarly, is especially important on the central coast.
Similarly, the census of 1961 contained a question about the custom of chewing coca. Thenorthcm limit of coca chewing (see map 5) helps to indicate the presence of populations that may notspeak Quechua but still evince considerable Indian cultural traits.
1 have been unable to locate any previous attempt to map the cultural regions of Peru. Map 5is a tentative effort, based on the assumption that the great regions of Indian language dominance haveserved to isolate and define distinct intervcning areas of mestizo or Creole culture. These interveningarcas, in turn, owe their origins to the historical presence of novel agricultural strategies or the in-mi-gration of non-Indian ethnic groups.
Map 5 is somewhat different from the preccding maps in that it is based on a composite oflinguistic and nonlinguistic information. It is mcant to refer to the situation about 1981. Sixteen re-gions are dcfined, which are indicatcd by the letters A and Al through N. These regions will be briefIydescribcd below.
Sixteen Culture Regions
Región Norteña (A, map 5). This region is outside the sphere of indigenous languages(map 3) and, in addition, exhibits relatively fcw other indigenous culture traits; coca chewing is notpracticcd. Eightccnth-ccntury ccnsuses show a rclativcly high number of non-Indian persons in this re-gian. There are some local areas of blacks (map 4); there is also a small area of Quechua speakers atlncahuasi-Cañaris. Cities include Trujillo, Chiclayo, and Piura. This region also extends into the Lojaprovincc 01'southem Ecuador, which is also, for the most part, outside 01'the Quechua sphere. Peoplefrom this region have been important in colonizing the Peruvian northeast (regions M and B, map 5)and have brought with them such technologies as rice agriculture.
"Cajamarquino" Region (Al, map 5). This region is, for the most part, also outsidethe Qucchua sphere, but it exhibits numerous other indigenous traits, e.g. coca chewing. The problem01'the devclopment of a mestizo cultural identity in part of this area is discussed by Brush (1977:50-53).
Northeastern Peru (8, map 5). Although this region is predominantly Spanish speak-ing, thcre are numerous small Amazon Indian groups and some larger "acculturated" groups such as theJcberos, the Lamistas and the Cocama-Cocamilla. The dominant culture is the ribereño culture, appar-ently a dirfusion rrom the Moyobamba regíon beginning with the nineteenth-century rubber boom, al-though there may also be elements 01'acculturatíon daling rrom the Jcsuit mission activities in Mainas.Throughout the region there are strong similarities in dialect, music, and cuisine (Alberto Chirif, per-sonal communication).
Ancash-Huánuco Quechua Region (C, map 5). The boundaries of this region corre-spond with the area 01'Quechua domain, except to the southeast, where the boundary is the limit of thenucleus. This region assumcd its modem form in the nineteenth century, when, according to Kubler(1952), a wave of reindigenízation occurrcd during an economic depression. The region differs from thesouthem Peruvian Quechua regíon (Region E) in that the dominant dialect ol' spoken Quechua isQuechua 1 (or Qucchua B) rather than Qucchua Il (Parker 1963; Torero 1964, 1974). In addition, cer-tain traits ol' southem Peru, such as llama herdíng, are no longer signil'icant in this region.
Central Peruvian Region (Region D, map 5). Until 1961, this region was part ol'the Quechua domain; however, it has experienced a rapid decline in Quechua monolingualism and inQuechua speech. To a considerable extent, pcasants classify themselves as peasants (campesinos) rather
7

~ 101!)}ÚS > 12 lO NEGRO, 1940
PERU
o, 200I
KM
400I
KNAPP 1987
Map 4. Rural Cultural Regions of Black Population in Peru
8

~::.: :";":0::::
CJ,
.'. .'
D11
PERU
IDIOMA INDIGENA
BILINGÜE
IDIOMA ESPAÑOL
FRONTERAS
--- LIMITE DE MASTICAR COCA
o 200,KM
400
KNAPP 1987
Map S. Modero Peru, as Defined by Language, Presence or Absence of CocaChewing, and Presence or Absence of Indian Minorities
9

than as Indians. Ethnic process has probably been affected by the spread of commercial agriculture, theinfluence of mining, and the importance of railroads. This region has an active frontier to the east,where Arawakan cultures are being isolated and displaced by colonists.
South Peruvian Quechua Region (E, map 5). This is the heart of the "trapecioandino" and is marked by a notable dominance of Quechua (dialect 11[Mannheim 1985]), as well assuch traditional subsistence traits as llama herding. For many anthropologists this is the Andes. It isthe largest and most populated of the indigenous culture regions in any Andean country and thepresence of the Inca capital, Cusco, adds to its distinctiveness. Any system of political oradministrative regions that ignores this region is obviously culturally inappropriate. On the basis ofrecent evidence, this region is extending via colonization into the se/va to the north.
Central Peruvian Coast (Region F, map 5). This is the heartland of "Creo le" cul-ture. There is a greater Quechua presence than in the norteño region, due lOmigration from the adja-cent highlands, but the reasons for the region's distinctiveness are to be sought in the viceregal heritageof Lima, the distinctive way of life developed on central coastal plantations with slave labor (note thestrong black presence as indicated in map 4), and the subsequent migrations of Chinese, Europeans, andothers lOthe core of the Peruvian economy.
Arequipeño Region (G, map 5). This region is centered on irrigated highland basinsand cool coastal valleys where Quechua is present but not dominant. As elsewhere on the coast, slaveswere important in colonial times, but blacks are less evident on the modem ethnic map than in centralcoastal Peru (map 4). In general, there is less ethnic diversity here than on the central coast.
Aymara Region (H, map 5). This is the domain of Aymara speech and completes thetrapecio andino. There is some indication that this region is culturally distinctive in other ways, e.g.,because of the importance of quinoa. The region extends across the Bolivian border to the east.
Amaraceri-Machiguenga Region (1, map 5). This appears to be the largest area ofMadre de Dios where indigenous language speakers are still predominant over Quechua-speakingimmigrant gold seekers.
Arahuaca-Pano Region (J, map 5). This region ineludes the Campa and Shipibo-Conibo peoples, two of the most numerous Amazon lndian groups in Peru. Although the Shipiboappear to have good prospects for continuing domination of their rural terrilOry, the Campa have beensubject to continuing conflicts with in-migrating colonists from central and southem Peru.
Tahuamanu Region (K, map 5). This area appears to have received migrants fromBrazil, Bolivia, and Cusco, in addition to having indigenous settlements.
Indigenous Region o/ the Peruvian North (L, map 5). This region is marked bythe presence of numerous distinct Indian groups, ineluding the Napo Quechua, Bora, HuilOto, Yagua,and Ticuna. The region continues north into Ecuador, where Huaorani and Quichua are important.
Jibaroan Region (M, map 5). This region contains many groups, but the most numer-ous are members of the Jibaroan language group, ineluding the Aguaruna. This region continues intoEcuador, where it ineludes the Shuar and Achuar. The peoples of this region are relatively well orga-nized, and it seems likely that this will remain an area of Amazon Indian dominance for the foreseeablefuture.
Chayahuita Regíon (N, map 5). This is dominated by Chayahuita culture.
The Frontier o/ Huánuco (O, map 5). This region is an area where recent migrantshave predominated over indigenous people. The migrants in general are not Quechua speaking, butcoca has traditionally been culturally important and there is currently much coca agriculture. The majorthrusts of colonization are along the upper Huallaga to the north and toward Pachitea in the east.
10

Culture Regions and Frontiers
One of the attractions of using the culture region approach is that the Peruvian frontier can besubdivided culturally. In general, there are five Peruvian frontiers:
1. Frontera norteña (A/M). This involves an expansion of norteño culture into areas ofJibaroan culture, often associated with rice growing.
2. Frontera San Martinense (B). This is the oldest frontier and is largely complete, as theoriginal culture from Moyobamba has spread to the Brazilian border.
3. Frontera de Huánuco (O). This coca frontier has been very active.4. Frontera central (D/J). This frontier has involved the most critical conflict of cultures, as
the Campa have been actively encircled or pushed back by seulers. Local road construction has playeda vital role. Due to the proximity of Lima, commercial agriculture is most feasible here. Foreignmigrants, such as the Germans of Oxapamba, have been locally important.
5. Frontera cusqueña (E). The search for gold has driven highland Quechua speakers into thesparsely populated lowlands of Madre de Dios.
Conclusions
The results of this preliminary report may pro ve useful to a variety of persons interested inPcruvian cultures. For planning purposes, the cultural map of Peru should be consulted as often asmaps of soils, vegetation, altitudinal zones, or political subdivision. Only thus can a future that takesinto account the aspirations of Pern's varied ethnic groups be assured.
11

(2) X = fp
+ (fp - p)
Where:
Appendix 1. Calculations of Proportions of Indians
Selva Departmentos
The major difficulty with using the native community directory (DCCN 1986) is that it is in-complete. Not all communities have been inscribed. The population of indigenous people thus has tobe augmented by an adjustment factor,/.
For each departamento, we will define an adjustment factor/for that departamento based onthe 1981 census estimates of the jungle Indian (selvicola) population. This adjustment factor will bethe sum of the selv[cola and censused Indian language-speaking populations divided by the inscribedIndian population for the departamento. Or as a formula:
(1) f =S!&
b + d
e
Where:
a = rural population of the departamento in 1981
b = rural population of the departamento of five years of age and older in 1981
c = rural population of indigenous language speakers in the departamento in 1981 (of fiveyears of age or older)
d = selvicola population in 1981, according to the 1981 census
e =calculated inscribed indigenous population in the departamento in 1981 (0.842 times thevalues given in DCCN 1986)
The proportion X of rural persons considered indigenous for each distrito is then calculated as:
f = adjustment factor (equation 1) calculated for the departamento
p = population in native communities in the distrito in 1981, that is, 0.842 times the number given in DCCN (1986)
t = rural population in the distrito, as censused in 1981
These proportions (X) are then used to produce the maps (maps 1 through 3).
12

(3) ry=
sa
Where:
Highland and Coast Departamentos
In the highland and coastal departamentos, the proportion Y speaking an Indian language wasdetermined by the formula
a = the proportion of the national population that is five years old or older (1961)
r = the censused population of the dominant indigenous language in the district (five years oldor older [1961])
s = the censused total population in the district (1961)
Tumbes and Tacna
In Tumbes, there are no published data from the 1961 census, but provincia data from the1981 census and departamento data from the 1972 census suggest that nowhere does the indigenouslanguage-speaking population excecd 1.5 percent of the total.
In Tacna, there are no published data from the 1961 census. Data from the 1940 and 1981censuscs were uscd lOroughly estimate the boundary of the Aymara domain and nudeus.
13

Acknowledgments
In this work I have counted on the aid and interchange of ideas of many person, inc1udingGraciela Hernández de Baca of the Instituto Nacional de Estadística (Lima), Mary Ruth Wise of the In-stituto Lingüístico de Verano (Yarinacocha), Alberto Chirlf, Carlos Mora, Fernando Villiger, Juan Os-sio, Magda Comarco, Franklin Pease, María Rostoworowski, Dale Bandy, María Benavides, MarciaKoth de Paredes, Jean-Claude Roux, Nicole Bernex de Fallon, Hildegardo Córdova, Richard Schaedel,and Enrique Carrión. The personnel of the Consejo Nacional de Población (Lima) and the Archivo Na-cional de Historia (Lima) were aIso very helpful. The research was made possible by a grant from theComisión Fulbrighl. The research was undertaken while affiliated with the Pontificia UniversidadCalÓlica in Lima.
14

Bibliography
Brush, Stephen B. 1977. Mountain, Field. and Family: The Economy and Human Ecology of anAndean Val/ey. Philadelphia: University of Pennsylvania Press.
CDI-CEDESA. 1984. La crítica del centralismo y la cuestión regional. (CEDESA). Lima: Centrode Estudios del Desarrollo.
Cook, N. D. 1981. Demographic Col/apse: Indian Peru, 1520-1620. Cambridge.-. 1982. "Population Data for Indian Peru: Sixteenth and Seventeenth Centuries." Hispanic
American Historical Review 62 (1): 73-120.Dirección de Comunidades Campesinas y Nativas (DCCN). 1986. Directorio de comunidades nativas
del Perú. Lima.Dirección Nacional de Estadística (DNE). 1944. Censo nacional de población y ocupación. Lima.Dirección Nacional de Estadística y Censos (DNEC). 1966. VI censo nacional de población. Lima.González de Olarte, Efraín. 1985. Economías regionales del Perú. Lima: IEP.Instituto Nacional de Estadística (INE). 1984. Censos nacionales: VIII de población, II de vivienda,12
de julio de 1981. Lima.-. 1982. República del Perú: mapa distrital-INE: inventario cartográfico. Escala
1 :2,000,000. Lima: INE.Instituto Nacional de Estadística y Censos (INEC). 1974. Censos nacionales: VII de población. II de
vivienda. 4 de junio de 1972. Lima.Knapp, G. 1987. Geografía quichua del Ecuador. Abya Yala, Cayambe, Ecuador.Kubler, George. 1952. The Indian Caste of Peru. 1795-1940. Washington, D.C.: Smithsonian In-
stitution, Institute of Social Anthropology, no. 14.Mannheim Bruce. 1985. "Southern Peruvian Quechua." In H. E. M. Klein and L. R. Stark, eds.,
South American Indian Languages: Retrospect and Prospect, pp. 481-515. Austin: University ofTexas Press.
Oficina Nacional de Estadística y Censos (ONEC). n.d. "Usos y costumbres de la población indiaautóctona." Resultados del VI censo nacional de población, vol. 1, tomo 5. Lima.
Parker, Gary J. 1963. "La clasificación genética de los dialectos quechuas." Revista del Museo Na-cional(Lima) 32: 241-252.
Pesce, Hugo. 1969. "Mapa lingüístico del Perú." In Atlas histórico geográfico y de paisajes peru-anos. Lima: Instituto Nacional de Planificación.
Stark, Louisa. 1985. "Ecuadorian Highland Quechua: History and Current Status." In H. E. M.KIcin and L. R. Stark, eds., South American Indian Languages: Retrospect and Prospecto Austin:University of Texas Press.
Torero Fernández de Córdova, Alfredo. 1964. "Los dialectos quechuas." Anales Cient{ficos de la Uni-versidad Agraria 2: 446-478.
-. 1974. El Quechua y la historia social andina. Lima: Universidad Ricardo Palma.
15

Census Date Minimal Unit ofGeographical Disaggregation
Total Population 1 Uncensused Selvícola LanguagePopulation2 Population
1981 Distrito Dept. Prov.3 Prov.l,3
1972 Distrito Dept. 4 Dept.l
1961 Distrito Prov. Prov.2 Dist.l
1940 Distrito Prov. Prov.2 Prov.1
Depts.5 Provs. Dists.
25 153 1,680
24 150 1,676
24 144 1,491
23 122 1,064
Table 1. Geographical Information, Modero Peruvian Censuses
Number of Territorial Units
Notes: ldata broken down by urban and rural areas2data not broken down into urban and rural areas3unpublished data available on computer printout4data published in 1981 at nationallevel only5departments inelude one constitutional province

1972 Matemallanguage 5 or oyer
1961 Matemallanguage 5 or oyer
1940 Language 5 or oyer
Table 2. Language Inforrnation, Modern Peruvian Censuses
Census Year Criterion Age Class Language CIasses
1981 Language actually spoken 5 or oyer Quechua, Ayrnara, Otro Aborigen,Quechua-Spanish, Ayrnara-Spanish,Spanish-Quechua-Ayrnara, OtherCornbination
Quechua, Ayrnara, Otro Aborigen
Quechua, Ayrnara, Otro Aborigen
Quechua, Ayrnara, Dialecto, Spanishand Quechua, Spanish and Ayrnara,Spanish and Dialectos, Spanish andQuechua or Ayrnara and ForeignLanguage

July 12, 1981 17,005,210 85.7 727,021 30,000
June 4, 1972 13,538,208 83.7 543,556 39,800
July 2, 1961 9,906,746 83.1 412,781 100,830
June 9, 1940 6,207,967 84.2 465,144 350,000
Table 3. Peruvian Censuses, Characteristics of Population
Date Censused Population
% Population5 Years Old
or OlderUncensusedPopulation
SelvícolaPopulation

Table 4. Censused Population Speaking Indigenous Languages
Year Total Population Speaking lndigenous Languages, Adjusted foe Age*
Quechua** Aymara Other Selvícola
1981 3,755,770 418,743 152,384 30,000
1972 3,602,401 397,363 142,577 39,800
1961 3,232,026 349,127 256,623*** 100,830
1940 2,903,445 275,256 25,480 350,000
2.25 0.49
2.88 0.55
2.57 0.46
*Includes bilinguals. Numbers of speakers of language age five and over are divided by the proportion of the totalpopulation that is age five and overo
**lncludes Quechua-Aymara-Spanish trilinguals and Spanish-Aymara or Quechua-Foreign category.
***lncludes Huanca, elsewhere counted as a Quechua dialect.
Table 5. Average Growth Rates ofIndian Language-Speaking Population, Peru
Years Total Population AlI lndians %!Y ear
1940-1961
1972-1981
1961-1972