linhai wu, qipeng hu, dian zhu, and jianhua...
TRANSCRIPT

-1-
Empirical Analysis of the Main Factors Influencing Rice Harvest Losses Based on 1
Sampling Survey Data of 10 Provinces in China 2
3
4
Linhai Wu,1,2,*
Qipeng Hu,1 Dian Zhu,
3,4 and Jianhua Wang
1 5
6
1Food Safety Research Base of Jiangsu Province, School of Business, Jiangnan University, 7
No.1800, Lihu Road, Binhu District, Wuxi, Jiangsu 214122, PR China. 8
2Synergetic Innovation Center of Food Safety and Nutrition, Jiangnan University, 9
No.1800, Lihu Road, Binhu District, Wuxi, Jiangsu 214122, PR China. 10
3Department of Economics, School of Dongwu Business, Soochow University, 11
No. 50, Donghuan Road, Pingjiang District, Suzhou, Jiangsu 215021, PR China. 12
4School of Food Science and Technology, Jiangnan University, 13
No.1800, LihuRoad, Binhu District, Wuxi, Jiangsu 214122, PR China. 14
15
Contributed Paper prepared for presentation at the 90th Annual Conference of the 16
Agricultural Economics Society, University of Warwick, England 17
18
4 - 6 April 2016 19
20
Copyright 2016 by Linhai Wu. All rights reserved. Readers may make verbatim copies of this 21
document for non-commercial purposes by any means, provided that this copyright notice 22
appears on all such copies. 23
24
25
* Linhai Wu (Address: 88-1401, Jian Kang Yi Cun, Wuxi, Jiangu, Province, China. 26
Post Code: 214031;E-mail: [email protected]) 27
28
* Correspondence author: Linhai Wu, Tel: +86 051085327503; fax: +86 051085327503;
E-mail: [email protected]

- 2 -
Acknowledgments: This paper is a staged achievement of the 2015 special project on 29
nonprofit grain industry research, “Research on investigation and assessment techniques for 30
post-harvest grain losses and waste” (Project Number: 201513004-6), and the project “Food 31
safety risk control in China” (Project Number: 2013-011) run by the outstanding innovation 32
team of humanities and social sciences from universities in Jiangsu Province. Of course, the 33
authors take sole responsibility for their views. 34
35
Abstract 36
Grain security should be a priority for the Chinese government when managing state affairs. 37
The total rice production needs to remain stable at more than 200 million tons. However, there 38
have been serious rice harvest losses, especially the harvest stage. In this study, the meaning 39
of rice harvest losses was defined based on previous research findings on the definition of 40
grain harvest losses and the realities in China. The current rice harvest losses in different areas 41
in China were analyzed based on sampling survey data from 957 farmers in 10 provinces in 42
China. On this basis, the main factors influencing rice harvest losses and their marginal effects 43
were analyzed using the ordered multinomial logistic model. The survey found that 56.22% of 44
respondents believed that rice harvest losses were 4% or lower in China, though there were 45
differences among the provinces. The proportion of family rice-farming income, size of 46
production area, level of mechanization, timely harvest, and operational meticulousness had 47
negative effects on rice harvest losses. On the other hand, farmers’ experience of employment 48
as migrant workers had a positive effect on rice harvest losses. In addition, bad weather and 49
short handedness during harvest significantly increased rice harvest losses. 50
Keywords: rice, harvest losses, ordered multinomial logistic model, marginal effect 51
52
JEL code: Q18 53

- 3 -
54
1. Introduction 55
For 11 years in a row, rain output increased in China and was estimated to be 607.1 million 56
tons in 2014*. This was a record high yield, a 0.9% (5.16 million tons) increase over 2013
†. 57
Another historic breakthrough occurred in 2014 when China's grain output surpassed the 58
previously high level of 600 billion kilograms. The continuous increase in grain output of 59
China not only plays an important role in its own smooth economical operation, but also 60
contributes to world food security. However, studies indicate that China's grain supply will 61
face serious challenges due to tight resources, frequent extreme weather events, population 62
growth, rigid growth of grain demand for feed and processing use, and uncertainty in the 63
world grain market (Aulakh and Regmi, 2013; Li, 2014). The Food and Agriculture 64
Organization of the United Nations (FAO) estimated that the average annual growth rates of 65
grain production and supply/consumer demand would be 1.7% and 1.9%‡, respectively, 66
between 2013 and 2022 in China representing a gradually widening gap between grain supply 67
and demand (Liu et al., 2013). The Development Research Center of the State Council of 68
China reported that China’s grain imports exceeded 90 million tons in 2014, accounting for 69
15% of domestic grain production. This included 19.51 million tons of cereal imports (an 70
increase of 33.8% over 2013), and 71.4 million tons of soybean imports (an increase of 12.7% 71
over 2013)§. Grain losses and waste are serious outstanding problems in China's grain security. 72
However, in terms of grain security, China has placed great emphasis on pre-harvest input and 73
management of production factors, while paying seriously insufficient attention to reducing 74
post-harvest grain losses and waste. China’s annual post-harvest grain losses are estimated to 75
be 50 billion kilograms. This amount is equivalent to the grain output of 200 million mu of 76
* National Bureau of Statistics of the People's Republic of China: Announcement on grain output in 2014 by the Bureau of
Statistics, http://www.stats.gov.cn/tjsj/zxfb/201311/t20131129_475486.html. † National Bureau of Statistics of the People's Republic of China: Announcement on grain output in 2014 by the Bureau of
Statistics, http://www.stats.gov.cn/tjsj/zxfb/201311/t20131129_475486.html. ‡ This grain production and consumption data in China and other data presented in this paper refer to mainland China,
excluding Taiwan, Hong Kong, and Macao. § http://news.1nongjing.com/a/201504/83458.html, China Agricultural Outlook Prospect Report (2015-2024), 2015-04-21.

- 4 -
arable land. In addition, China’s post-harvest grain loss rate* is approximately 10%, much 77
higher than the world average of 3% to 5% and that of developed countries (Guo et al., 2014). 78
Post-harvest grain losses represent a waste of manpower, fresh water, arable land, fertilizers, 79
and other resources expended during grain production (Ridoutt et al., 2010; Gustavsson et al., 80
2011). In addition, greenhouse gas emissions, arising from previous production and 81
subsequent waste treatment of lost grain, can exert tremendous pressure on the environment 82
(WRAP, 2011; Dorward, 2012; Kummu et al., 2012). 83
The post-harvest system of grain has a rich meaning. The levels and causes of post-harvest 84
grain losses vary with the different post-harvest stages and grain varieties. In China, the 85
post-harvest period of grain can be generally divided into seven stages, harvest, transport, 86
drying, storage, processing, distribution, and consumption (Cao and Jiang, 1999). As the first 87
stage of the post-harvest period, harvest has a special status in reducing post-harvest grain 88
losses. Rice, for example, is one of the most important grain crops in China, with an output 89
accounting for approximately 33.83% of the domestic grain output in 2013†. Along with the 90
urbanization process, a large number of young farmers have migrated to the cities. As a result, 91
women and older male farmers have become the main labor force for rice production. This 92
situation has not only led to extensive initial post-harvest processing by traditional small-scale 93
farmers, but also has further increased rice harvest losses (Zhang et al., 2009). Therefore, an 94
empirical analysis of the key nodes and main influencing factors of rice harvest losses can 95
provide a reference for the government for guiding farmers in controlling post-harvest rice 96
losses. 97
98
2. Literature review and concept definition 99
Post-harvest food losses can be further divided into food losses and food waste. Based on 100
the different factors causing food losses, Aulakh and Regmi (2013) defined those in two ways. 101
* Post-harvest grain loss rate is the ratio of post-harvest grain losses to total grain output. † Source: The website of National Bureau of Statistics of China (http://www.stats.gov.cn).

- 5 -
Those based on objective factors (such as natural conditions and technical equipment) were 102
defined as as food losses, and those caused by decision-making mistakes of the supply chain 103
players as food waste. Priefer et al. (2013) regarded food waste as a subset of food losses. 104
Food losses include all food that runs off the supply chain, while food waste refers a particular 105
part of food losses caused by human factors. Zhang et al. (1998) and Song et al. (2015) made 106
no distinction between losses and waste in their analyses of post-harvest food losses in China. 107
They believed that waste fell into the moral category, rather than an economic or technical 108
category, and was just a judgment on post-harvest food losses. Based on the existing literature, 109
the authors believed that food losses referred to a reduction in the quantity and quality of 110
edible food in the post-harvest supply chain, and that losses caused by human factors were 111
called food waste*. 112
In the early 1990s, Zhejiang Academy of Agricultural Sciences (1991) subdivided the 113
post-harvest grain losses of China into nine sub-systems, i.e., harvest, threshing, transport, 114
cleaning, drying, storage, processing, distribution, and consumption. Teshome et al. (1999) 115
divided the post-harvest grain losses of African countries into seven stages, including harvest, 116
transport, drying, threshing, storage, processing, and consumption. However, most researchers 117
divided the post-harvest grain losses based on the conditions of developing countries with a 118
low mechanization level. At present, the mechanization level in rice harvesting has been 119
increasing rapidly in China. According to statistics, 73.59% of rice was harvested by machine 120
in 2012 throughout China (Liu et al., 2014). In addition, the area of rice harvested via the 121
combine harvesting method accounts for an increasing proportion of rice planting area. 122
Unlike traditional segment harvesting, reaping and threshing are completed in one operation 123
through the combine harvesting method. Hence, it is difficult to make a strict distinction 124
between the actual losses of reaping and threshing in practice. Therefore, rice harvest losses 125
can be defined as a reduction in quantity or quality of rice due to natural conditions, technical 126
* As there are no uniform definitions for food losses and food waste, and previous studies did not make a strict distinction
between them due to practical factors, grain losses discussed in this paper cover grain waste, in order to improve the
comparability between China's grain harvest loss data and those in other countries.

- 6 -
equipment, management skills, and farmers’ decision-making from reaping and threshing to 127
bagging (loading). 128
The main factors influencing rice harvest losses have been analyzed from different angles. 129
Timely harvest is crucial to reducing the loss of rice quantity and quality during a harvest. It 130
has been noted that the period from 10 to 15 days after physical maturity is the best time to 131
harvest rice (Akar et al., 2004). Lantin (1999) suggested that premature harvesting led to 132
inclusion of a large amount of immature rice with a high moisture content, while delayed 133
harvesting exposed mature rice to risks of being attacked by insects, birds, animals, and 134
microorganisms; timely harvest not only reduces the impact of bad weather on output, but 135
also decreases the crack ratio*. It was also demonstrated that harvesting too early led to a 136
lower grain weight. Timely harvest based on rice maturity and local climatic conditions can 137
not only improve rice yield, but also provide a higher milled rice rate and a better cooking 138
quality (Chen et al., 2006). Weather conditions during harvest also have a close relationship 139
with rice harvest losses. Akar et al. (2004) indicated that rainy weather during harvest would 140
exacerbate pest problems and premature senescence, resulting in a decreased maturation rate, 141
and thus yield losses. Moreover, prolonged exposure of mature rice to high temperatures and 142
humid environments would increase perishability, resulting in reduced yield and quality of 143
rice (World Bank et al., 2011). Continuous rainy weather would not only lead to a sharp drop 144
in the biological production of rice, but also result in mildew of unhusked rice spread on the 145
ground due to untimely sun-drying (Fei et al., 2013). Furthermore, stormy weather will 146
increase the lodging area of rice and harvest difficulty, resulting in shattering and pre-harvest 147
sprouting during reaping and threshing, thus increasing harvest losses (Zhang et al., 2013). 148
Rice harvest losses are directly related to field management as well as the meticulousness 149
of farmers’ harvesting operations. World Bank et al. (2011) found that pre-harvest 150
management and decisions, such as planting density, field management (weeding, 151
* The occurrence of transverse cracks in rice grain is termed “cracking”, which not only reduces grain quality, but also
increases the broken rice rate in post-harvest processing.

- 7 -
disinsection, fertilization, etc.), and timely harvesting, had an impact on final rice harvest 152
losses. In addition, Hodges and Maritime (2012) believed that non-meticulous harvesting 153
operations would significantly increase the quantity loss of rice during harvest, and that 154
random placement of rice ears would make the rice more vulnerable to microorganisms, thus 155
causing a greater quality loss. Appiah et al. (2011) reached a similar conclusion that rice 156
harvest losses in different plots were closely related to field weed control, farmers’ harvest 157
experience and skills, and the meticulousness of harvesting operations. Harvesting methods* 158
also influence rice harvest losses. Lantin (1999) indicated that, compared to combine 159
harvesting, segment harvesting involved more stages, and each stage inevitably caused 160
quantity and quality losses of rice. However, Akar et al. (2004) pointed out that harvesters 161
might substantially increase the operation speed of machines to increase the harvest area per 162
unit time during combine harvesting, thus increasing the harvest loss rate. Li et al. (1991) 163
suggested that due to unreaped rice and harvest shattering losses, rice losses during combine 164
harvesting were much greater than those during segment harvesting. Feng and Sun (2014) 165
also believed that the effect of combine harvesting was susceptible to mechanical properties 166
and operator skills, while segment harvesting allowed more meticulous harvest of lodged rice 167
and provided a threshing efficiency of 99.5%, as well as comprehensive loss rates of 2% or 168
lower. 169
In addition, the causes of rice harvest losses have also been analyzed from the perspective 170
of economic and social development. Grethe et al. (2011) noted that socio-economic factors 171
and agricultural technology were the main causes of rice harvest losses in developing 172
countries. Buchner et al. (2012) found that rice losses at the front end of the post-harvest 173
supply chain were significantly higher in developing countries than in developed countries, 174
and that the main reason was related to the fact that small-scale labor-intensive agricultural 175
production in developing countries was inefficient due to the limitation of capital, technology, 176
* There are two main harvesting methods: combine harvesting and segment harvesting. The latter includes reaping, bundling,
stacking, picking, threshing, and cleaning.

- 8 -
and management. Priefer et al. (2013) suggested that rice harvest losses were increased by 177
farmers’ poor harvesting operation skills, insufficient government management, and a lack of 178
relevant policies. Liu (2014) found that inadequate infrastructure, poor awareness of grain 179
saving and loss reduction, lag in harvesting operation technology, and small-scale scattered 180
production were common factors affecting post-harvest rice losses in China and other 181
developing countries. 182
The existing research results serve as an important reference for this study. After 183
summarizing and reflecting on the previous research results, the authors found two significant 184
deficiencies in existing studies. First, most existing studies focus on the assessment of rice 185
losses in all post-harvest stages, while rice losses in a particular stage and the influencing 186
factors have rarely been analyzed using quantitative tools. Second, most existing studies focus 187
on post-harvest rice losses in backward developing countries, while rice harvest losses in 188
China during its agricultural transition to modernization have rarely been analyzed. To this 189
end, on the basis of the existing literature, the main factors influencing rice harvest losses and 190
their marginal effects were analyzed using the ordered multinomial logistic model based on 191
sampling survey data from 957 farmers in 10 provinces in China. 192
193
3. Survey design and sample analysis 194
3.1. Survey design 195
In this study, data were collected using a multi-stage sampling method from 10 196
provinces/regions in China, including Heilongjiang, Jiangsu, Zhejiang, Guangdong, Hubei, 197
Hunan, Anhui, Jiangxi, Sichuan, and Guangxi. Most of these are major rice producing 198
provinces in China. The rice production of the 10 provinces/regions accounted for 78.96% of 199
the national rice production in 2013*. The sampling area not only involves four major regions 200
of China, i.e., the eastern (Jiangsu, Zhejiang, and Guangdong), central (Hubei, Hunan, Anhui, 201
* Calculated based on the relevant data from the China Statistical Yearbook 2014 (National Bureau of Statistics of China, ed.,
China Statistics Press, 2014).

- 9 -
and Jiangxi), western (Sichuan, and Guangxi), and northeast regions (Heilongjiang), but also 202
stretches across the five major rice areas of China, i.e., the south, central, north, southwest, 203
and northeast regions of China*. Therefore, the sampling area is highly representative in terms 204
of spatial distribution. On this basis, five counties were selected from each of these 205
provinces/regions according to rice harvesting methods, topographic features, rice planting 206
proportion, and rural residents’ income. Five administrative villages were then randomly 207
selected from each of the selected counties. In the actual survey, house numbers were 208
randomly selected, and then corresponding farmer households were visited by trained 209
investigators. The questionnaire was answered directly by the respondents. The rice harvest 210
loss rate† was divided into six levels, “lower than 3%”, “3%-4%”, “4%-5%”, “5%-6%”, 211
“6%-7%”, and “higher than 7%” based on the existing research results‡, as well as farmers’ 212
feedback from the pre-survey. A total of 1000 copies of the questionnaire was distributed in 213
the above 10 provinces/regions. After careful screening, 957 copies of valid questionnaires 214
were collected, representing a response rate of 95.7%. The survey was carried out in July and 215
August, 2014. 216
3.2. Sample analysis 217
3.2.1. Demographics of respondents 218
Table 1 lists the basic demographics of the respondents. Of the 957 respondents, men 219
comprised a slightly higher proportion (54.96%) than women. Most respondents were aged 220
"46-55 years" and "56-65 years", accounting for 41.27% and 29.68% of the total sample, 221
respectively. In terms of education, family size, and annual household income, most 222
respondents fell into the category of “middle and high school”, “3-4”, and “60,000 yuan and 223
less”, respectively, accounting for 65.20%, 67.71%, and 69.80% of the total sample. In 224
addition, 47.23% of respondents had experience of working in the city. 225
* China generally includes six major rice areas, i.e., the south, central, north, southwest, and northeast single cropping rice areas,
and the northwest arid area. † Rice harvest loss rate = rice harvest losses per mu/rice yield per mu. ‡ A relatively consistent conclusion on rice harvest losses in existing literature is that rice harvest loss rates generally range
from 3% to 7%.

- 10 -
3.2.2. Overall estimates of rice harvest loss rate 226
As shown in Tables 2 and 3, 26.96% and 29.26% of respondents believed that the rice 227
harvest loss rate was “lower than 3%” and “3%-4%”, respectively, 18.29% and 13.06% 228
suggested that it was “4%-5%” and “5%-6%”, respectively, and 5.64% and 6.79% estimated 229
that it was “6%-7%” and “higher than 7%”, respectively. As to the main cause of rice harvest 230
losses, 45.46% of respondents attributed the losses to “changeable weather”, while 19.65%, 231
18.18%, and 10.55% suggested that it was due to “outdated equipment”, “diseases and pests”, 232
and “shattering during harvest” , respectively. 233
3.2.3. Estimates of rice harvest loss rates in different regions 234
As shown in Tables 2 and 3, respondents in different regions had different estimates of rice 235
harvest loss rates. In the survey sample, 50.13% of respondents from the eastern region and 236
56.71% from the central region believed that the rice harvest loss rates in their regions were 237
“lower than 3%” or “3%-4%”. In the western region, 61.92% of respondents estimated the 238
rice harvest loss rates in their region to be “3%-4%” and “4%-5%”, and 64.93% of 239
respondents from the northeast region estimated the rice harvest loss rate to be “lower than 240
3%”. In addition, the respondents believed that “changeable weather” was a major factor for 241
rice harvest losses in all regions, followed by “diseases and pests” and “outdated equipment”. 242
243
4. Theoretical model and variable settings 244
4.1. Theoretical model of rice harvest losses 245
Intuitively, farmers are not pleased to see losses. However, as an economic person, a farmer 246
aims to maximize his/her net income. The reduction of rice harvest losses will inevitably 247
increase costs. If the increase in cost exceeds the increase in income, the net income of the 248
farmer will be reduced. The net income of the farmer can be maximized only when the 249
marginal cost of reducing harvest losses equals the marginal income. In this regard, it is 250
assumed that iMC is the increase in subjective cost for farmer i to reduce harvest losses. 251

- 11 -
The judgment of subjective cost is affected by many factors, i.e., 252
i i iM C X
(1) 253
In equation (1), iX is the vector of factors affecting the subjective cost judgment of 254
farmer i , is the vector of the coefficient to be estimated, and i is an independent and 255
identically distributed random disturbance. As the farmer aims to maximize net income, the 256
increase in cost for the farmer to reduce harvest losses should theoretically equal the increase 257
in income. Therefore, since it is difficult to observe subjective cost, rice loss iY was
selected 258
as a display variable and takes on the values in [1, ]n . iY =1 represents “lower than 3%”, 259
iY =2 represents “3%-4%”, iY =3 represents “4%-5%”, iY =4 represents “5%-6%”, iY =5 260
represents “6%-7%”, and iY =6 represents “higher than 7%”. A larger value of iY indicates a 261
greater loss. The following classification framework was constructed: 262
1
1 2
1,
2
,
i i
i i
i n i
Y MC
Y MC
Y n MC
, (2) 263
In equation (2), n is the critical point for changes in the farmer’s subjective cost and 264
satisfies 1 2 n … . As the ordered multinomial logistic model does not require a 265
normal distribution or equal variances, it can be used to assess the relationship between 266
multinomial dependent variables and their influencing factors, and thus to quantitatively 267
assess the factors influencing different levels of rice harvest losses. In general, the distribution 268
function of i is assumed to be ( )F x , and the probability for the dependent variable iY to 269
take each value can then be calculated as below: 270

- 12 -
1
2 1
( 1)= ( )
( 2)= ( ) ( )
( )=1 ( )
i i
i i i
i n i
p Y F X
p Y F X F X
p Y n F X
(3) 271
Since i follows a logistic distribution, then: 272
1 1
1
1
1
( 0) ( 0) ( )
1 ( )
( )
1 ( )
i i i i
i i
i
i
p Y F U F X
F X
exp X
exp X
(4) 273
274
4.2. Composition and variable selection for rice harvest losses 275
Rice harvest losses can be subdivided into harvest shattering loss, unreaped loss, 276
windrowing loss, unthreshed loss, spatter loss, and entrainment loss (Li, etc., 1991; Aulakh 277
and Regmi, 2013). Among them, harvest shattering loss, unreaped loss, unthreshed loss, 278
spatter loss, and entrainment loss consist mostly of grain weight losses (volume and 279
quantity losses), and are predominantly affected by the mature period of rice, lodging, field 280
size and shape, harvesting methods, manpower adequacy, and harvesting techniques. The 281
quality loss (reduced nutrition and increased deterioration) during windrowing is closely 282
related with weather conditions during harvest and windrowing duration (see Figure 1). 283
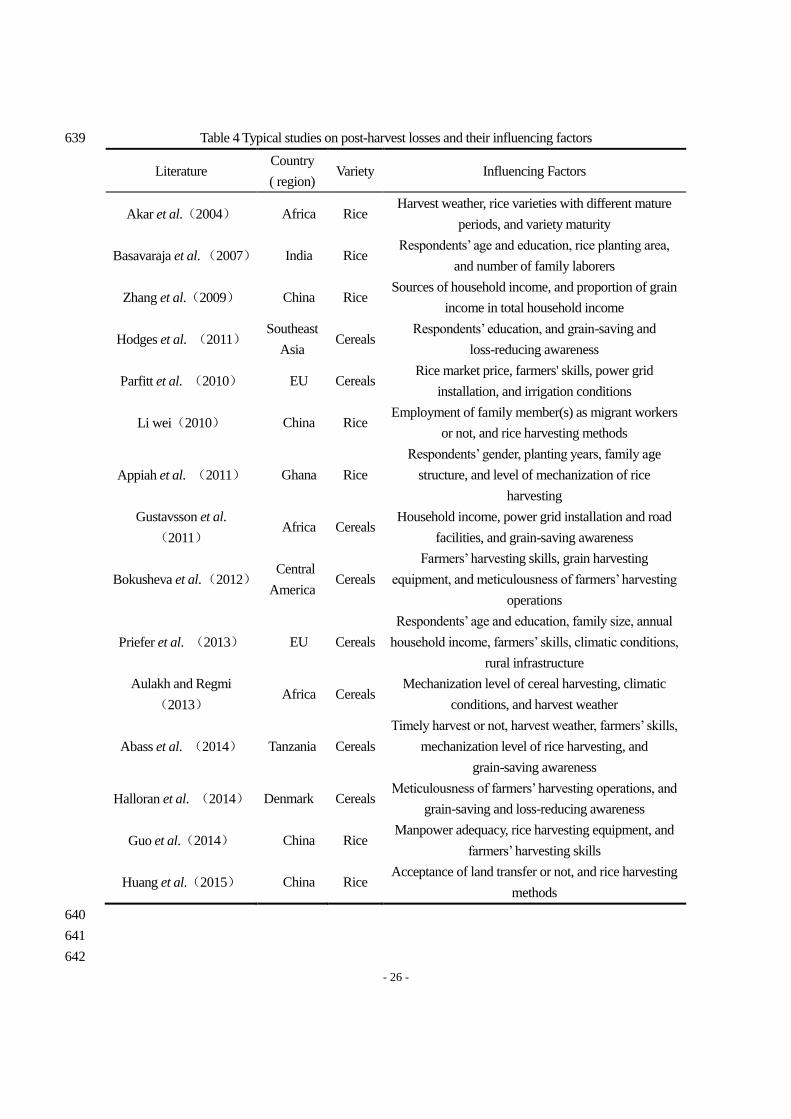
In fact, there are many factors influencing rice harvest losses, and intensive studies have 284
been carried out from several different perspectives. Table 4 provides a preliminary summary 285
of the main conclusions of these studies. 286
Based on previous research findings, factors affecting rice harvest losses are summarized as 287
15 variables in three categories, demographics, production characteristics, and harvesting 288
operation characteristics, as shown in Table 5. 289
290
5. Model estimation results and discussion 291
5.1. Estimation results 292

- 13 -
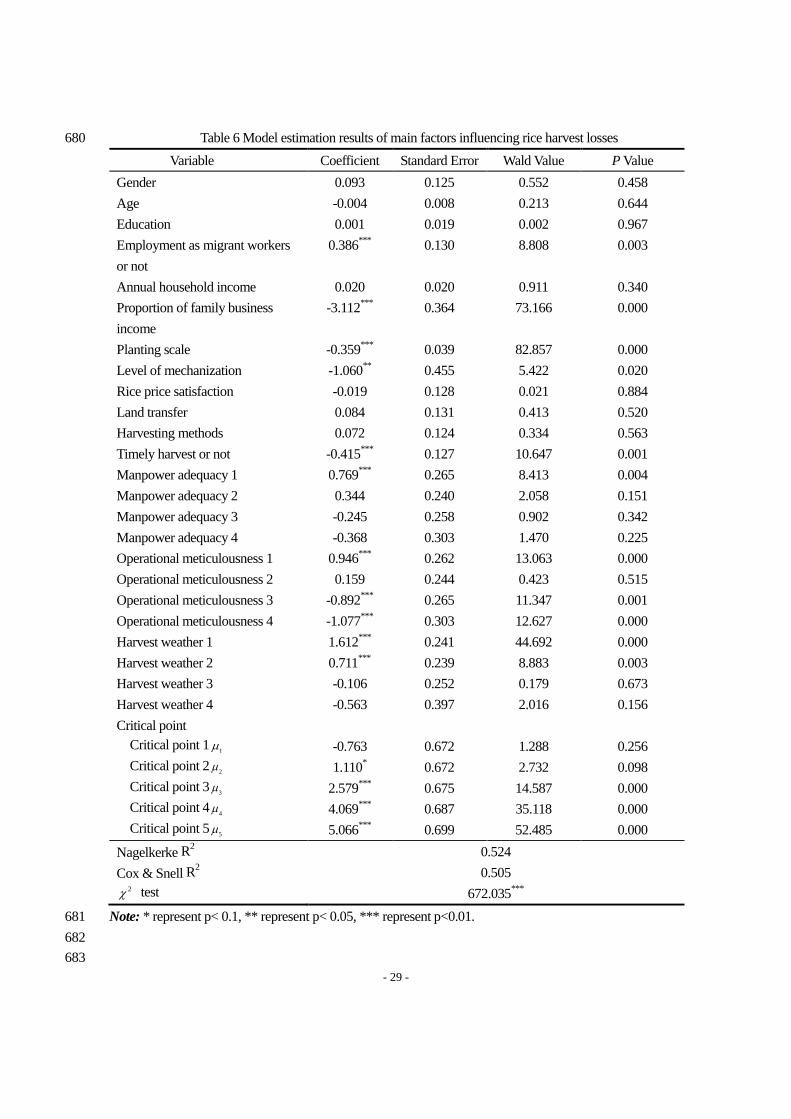
In this study, factors affecting rice harvest losses were estimated using SPSS 21.0. The 293
model estimation results are shown in Table 6. Eight independent variables, including 294
employment as migrant workers, proportion of family business income, planting scale, level 295
of mechanization, timely harvest, manpower adequacy, operational meticulousness, and 296
harvest weather, passed the significance test. The production characteristics and harvesting 297
operation characteristics had a greater influence on rice harvest losses. 298
299
5.2. Interpretation of estimation results 300
5.2.1. Influence of demographics 301
The estimated coefficient of “employment as migrant workers” was 0.386, which was 302
significant at the 0.003 level, indicating that the employment of respondents as migrant 303
workers increased rice harvest losses. This is consistent with the argument of Li (2010) that 304
the transfer of rural labor force to cities and towns has exacerbated the extensive land 305
management. However, this study argues that the increase of rice harvest losses is actually a 306
result of the increased opportunity cost of rice cultivation due to the employment of farmers 307
as migrant workers. When the income obtained by reducing harvest losses is insufficient to 308
make up for the explicit and opportunity costs, the willingness of farmers to reduce harvest 309
losses will be reduced. In addition, the estimated coefficient of the variable “proportion of 310
family business income” was -3.112, which was significant at the 0.000 level, indicating that 311
the rice harvest losses were significantly reduced with the increase in the proportion of family 312
business income. This may be because the higher dependency of family income on rice, the 313
greater the cost of rice harvest losses for farmers, and the higher their willingness to control 314
harvest losses. 315
5.2.2. Influence of production characteristics 316
The estimated coefficient of “planting scale” was -0.359, which was significant at the 0.003 317
level, indicating that rice harvest losses were reduced by the increase of planting scale. This is 318
in agreement with the conclusions of Basavaraja et al. (2007). The possible reason for this is 319

- 14 -
that large-scale rice farmers can also effectively reduce the cost of rice harvest losses in the 320
entire production process by using advantages in capital availability and advanced equipment. 321
The analysis of large-scale rice cultivation by Huang et al. (2014) indicated that large-scale 322
agricultural operations could reduce land fragmentation and help increase post-harvest 323
working efficiency, thus reducing harvest losses. The estimated coefficient of “mechanization 324
level” was -1.060, and was significant at the 0.020 level, indicating that rice harvest losses 325
were effectively reduced by the increase in harvesting mechanization level. This is similar to 326
the conclusions of Buchner et al. (2012). This may be because, with the continuous decrease 327
of mechanized harvesting costs and rapid improvement of technology, farmers can reduce 328
harvest losses at a lower cost by using mechanical harvesting equipment. 329
5.2.3. Influence of harvesting operation characteristics 330
The estimated coefficients of “meticulousness level 3” and “timely harvest” were -0.892 331
and -0.415, respectively, and both were significant at the 0.001 level, indicating rice harvest 332
losses were reduced by timely harvest and meticulous harvesting operations. The willingness 333
of farmers to reduce rice harvest losses depends on their subjective judgment of the costs of 334
loss reduction and the resulting income. The higher the farmers’ subjective judgment of 335
income from reducing rice harvest losses, the higher their motivation to perform timely 336
harvest and improve the meticulousness of harvesting operations, and the smaller the rice 337
harvest losses. In addition, the estimated coefficient of “harvest weather 1” was 1.612, and it 338
was significant at the 0.000 level, indicating that adverse harvest weather significantly 339
increased rice harvest losses. This is in accordance with the findings of Abass et al. (2014). 340
This may be because adverse harvest weather increases the rice lodging area, and thereby 341
increases the harvesting difficulty; when the income obtained by reducing harvest losses is 342
insufficient to make up for the costs, farmers will ignore such losses. In addition, the model 343
estimation results of this study reveal that, although “inadequate manpower” may increase 344
rice harvest losses, “adequate manpower” does not effectively reduce the losses. The possible 345
reason for this is that the marginal effect of unit manpower on reducing rice harvest losses will 346

- 15 -
be decreased with the increase in manpower. 347
348
5.3. Marginal effect analysis 349
Although the estimated coefficients in Table 5 reflect the influences of different factors on 350
rice harvest losses, they cannot accurately reflect the degree of influence of these factors. To 351
this end, marginal effects of influencing factors were calculated using critical point estimates 352
and related estimated coefficients to perform further analysis. Since the method of calculating 353
marginal effects for conventional continuous variables does not apply to dummy variables, all 354
other variables were assumed to be zero in the calculation of marginal effect of a single 355
dummy variable (see Greene, 2003), and the following equation was used (Newell and 356
Anderson, 2003): 357
1 0ik ik n ik nE Y x E Y x F c x F c (5) 358
In equation (5), nc is the critical point, and n = 1, 2, 3, 4, and 5. The results are shown in 359
Table 7. 360
The following findings were obtained by analyzing the marginal effects of the variables in 361
Table 7. 362
First, the marginal effect of “employment as migrant workers” was less than zero when 363
iY = 0 and iY = 1. This indicated that ceteris paribus, there was a higher probability for the 364
rice harvest loss rate to be higher than 4% if farmers had experience as migrant workers. The 365
marginal effects of “meticulousness level 1” and “meticulousness level 3” were also less than 366
zero when iY = 0 and iY = 1, while that of “meticulousness level 4” was greater than zero 367
when iY = 0. This indicated that farmers’ operational meticulousness did not significantly 368
reduce the rice harvest losses, and there was still a high probability for the rice harvest loss 369
rate to be higher than 4%. Only with a high rate of operational meticulousness, can the 370
probability for a rice harvest loss rate higher than 3% be significantly reduced. 371

- 16 -
Second, the marginal effects of “proportion of family business income”, “planting scale”, 372
“level of mechanization”, “timely harvest”, “harvest weather 1”, “harvest weather 2”, and 373
“manpower adequacy 1”, were greater than zero when iY = 0. This indicated that ceteris 374
paribus, there was a higher probability for the rice harvest loss rate to be lower than 3% for 375
farmers with a high proportion of family business income in total income, large rice planting 376
scale, timely harvest, and a high level of mechanization. Moreover, it is more likely to keep a 377
rice harvest loss rate lower than 3% with favorable harvest weather conditions and 378
appropriately tight manpower, compared with adverse harvest weather conditions and 379
shortage of manpower. 380
381
6. Main conclusions 382
As the first stage of the post-harvest rice processing system, harvest is related to the 383
post-harvest quantity and quality of rice. The current rice harvest losses in different regions in 384
China, as well as the main influencing factors, were analyzed using an ordered multinomial 385
logistic model based on sampling survey data from 957 farmers in 10 provinces/regions in 386
China. Survey results revealed that, compared with the cereal harvest loss rate of around 2% 387
in American and European countries, the rice harvest loss rate in China was not only higher, 388
but also had regional differences. According to statistics, the average rice harvest loss rate in 389
China was 4% or lower. The rice harvest loss rate in the eastern and central regions was close 390
to the national average; that in the western region was generally 3% to 5%, which was higher 391
than the national average, and that in the northeast was generally 3% or lower, representing a 392
lower than average level. Further analysis revealed that the proportion of family business 393
income, rice planting scale, timely harvest, level of mechanization, and operational 394
meticulousness had a negative impact on rice harvest losses, while employment as migrant 395
workers had a positive impact. Moreover, although “inadequate manpower” and adverse 396
weather conditions increased rice harvest losses, “adequate manpower” and favorable weather 397

- 17 -
conditions had no significant impact on the reduction of rice harvest losses. 398
This study has some notable limitations. For example, quality loss, as part of rice harvest 399
losses, was not fully investigated, as it is difficult to measure by survey. In addition, rice 400
harvest losses of large-scale rice farmers, family farms, and specialized cooperatives for rice 401
production were not investigated, as this survey focused on ordinary farmers. These will be 402
important issues to be investigated in follow-up research. 403
404
405
406
407
408
409
410
411
412
413
414
415
416
417
418
419
420
421
422
423
424

- 18 -
References 425
Abass, A. B., Ndunguru, G., Mamiro, P., Alenkhe, B., Mlingi, N. and Bekunda, M. 426
‘Post-harvest Food Losses in a Maize-based Farming System of Semi-arid Savannah Area 427
of Tanzania’, Journal of Stored Products Research, Vol. 57, (2014) pp. 49-57. 428
Akar, T., Avci, M. and Dusunceli, F. Berley: Post-harvesting operations (Food and 429
Agriculture Organization of the United Nations, Turkey, 2004). 430
Appiah, F., Guisse, R. and Dartey, P. K. ‘Post-harvest Losses of Rice from Harvesting to 431
Milling in Ghana’, Journal of Stored Products and Postharvest Research, Vol. 2, (2011) 432
pp.64-71. 433
Aulakh, J. and Regmi, A. Post-harvest Food Losses Estimation-Development of Consistent 434
Methodology (paper submitted to Agricultural & Applied Economics Association’s 2013 435
AAEA & CAES Joint Annual Meeting, Washington DC, 2013). 436
Basavaraja, H., Mahajanashetti, S. B. and Udagatti, N. C. ‘Economic Analysis of Post-harvest 437
Losses in Food Grains in India: A Case Study of Karnataka’, Agricultural Economics 438
Research Review, Vol. 20 (2007) pp.117-126. 439
Bokusheva, R., Finger, R., Fischler, M., Berlin, R., Marín, Y. and Pérez, F. Factors 440
Determining the Adoption and Impact of a Postharvest Storage Technology (IAAE, Brazil, 441
2012). 442
Buchner, B., Fischler, C., Gustafson, E., Reilly, J., Riccardi, G., Ricordi, C. and Veronesi, U. 443
Food Waste: Causes, Impacts and Proposals (Barilla Center for Food & Nutrition, 2012). 444
Cao, B. M. and Jiang, D. B. ‘Post-harvest grain losses in Jiangsu Province, China, and their 445
causes and countermeasures’, Journal of Nanjing University of Economics, Vol. 1 (1999) 446
pp.21-27. 447
Chen, W. J., Zhou, Q. F. and Huang, J. J. ‘Estimating pigment contents in leaves and panicles 448
of rice after milky ripening by hyperspectral vegetation indices’, Chinese Journal of Rice 449
Science, Vol. 20 (2006) pp.434-439. 450
Dorward, L. J. ‘Where Are the Best Opportunities for Reducing Greenhouse Gas Emissions 451

- 19 -
in the Food System (including the food chain)? A comment’, Food Policy, Vol. 37 (2012) 452
pp. 463-466. 453
Fei, Y. C., Chen, L., Peng, G. Z., Rong, R. and Zhu, K. ‘The characteristics of autumn 454
continuous rain and rice harvest weather suitability in Sichuan Province, China’, Jiangsu 455
Agricultural Sciences, Vol. 41 (2013) pp.312-316. 456
Feng, G. and Sun, C. C. ‘Segment harvesting technique including reaping, sun-drying and 457
picking’, Rural Science & Technology, Vol. 04 (2014) pp.10-11. 458
Greene, W. H. Econometric Analysis (Prentice Hall, New Jersey, 2003). 459
Grethe, H., Dembele, A. and Duman, N. How to Feed the World's Growing Billions: 460
Understanding FAO World Food Projections and Their Implications (Study for WWF 461
Deutschland and the Heinrich-Böll-Stiftung, Berlin, 2011). 462
Guo, Y. Z., Chen, R. and Guo, J. L. ‘Analysis of grain losses in the whole industry chain from 463
farm to table in China and countermeasures’, Agricultural Economy, Vol. 01 (2014) pp. 464
23-24. 465
Gustavsson, J., Cederberg, C., Sonesson, U., Otterdijk, R. V. and Meybeck, A. Global Food 466
Losses and Food Waste: Extent, Causes and Prevention (Food and Agriculture 467
Organization of the United Nations, Rome, 2011). 468
Halloran, A., Clement, J., Kornum, N., Bucatariu, C. and Magid, J. ‘Addressing Food Waste 469
Reduction in Denmark’, Food Policy, Vol. 49 (2014) pp. 294-301. 470
Hodges, R. J., Buzby, J. C. and Bennett, B. ‘Postharvest Losses and Waste in Developed and 471
Less Developed Countries: Opportunities to Improve Resource Use’, The Journal of 472
Agricultural Science, Vol.149 (2011) pp. 37-45. 473
Hodges, R. J. and Maritime, C. Post-harvest Weight Losses of Cereal Grains in Sub-Saharan 474
Africa (Natural Resources Institute, University of Greenwich, 2012). 475
Huang, Y. X., Zhang, H. Y., Li, W. Y. and Liu,Q. ‘Rural land transfer: survey and reflections’, 476
Issues in Agricultural Economy, Vol. 32 (2015) pp.4-9. 477
Huang, Z. H., Wang, J. Y. and Chen, G. ‘impacts of off-farm employment, land transfer, and 478
- 20 -
land fragmentation on technical efficiency of rice farmers’, Chinese Rural Economy, Vol.11 479
(2014) pp.4-15. 480
Kummu, M., Moel, H. D., Porkka, M., Siebertd, S., Varisa, O. and Wardb, P. J. ‘Lost food, 481
Wasted Resources: Global Food Supply Chain Losses and Their Impacts on Fresh Water, 482
Cropland, and Fertiliser Use’, Science of the Total Environment, Vol. 438 (2012) pp. 483
477-489. 484
Lantin, R. Rice: Post-harvesting operations (International Rice Research Institute, Philippines, 485
1999). 486
Li, G. X. ‘Analysis of grain production capacity and national food security assurance of China 487
in 2020’, Chinese Rural Economy, Vol. 5 (2014) pp. 4-12. 488
Li. W. ‘Peasants’ willingness to rice planting and its influential factors: Based on data of 489
Zixing, Hunan’, Journal of Hunan Agricultural University (Social Science), Vol. 11 (2010) 490
pp.7-13. 491
Li, Z. F., Xia, P. K., Wang, Z. H., Wan, S. Y. and He, Y. ‘Composition of post-harvest grain 492
losses and their prevention measures’, Journal of Zhejiang Agricultural University, Vol. 4 493
(1991) pp.389-395. 494
Liu, G. ‘Food Losses and Food Waste in China: A First Estimate’, OECD Food, Agriculture 495
and Fisheries Papers, Vol. 66 (2014) pp.3-29. 496
Liu, H., Chen, W. L., Zou, S. Y. and Zhou, H. L. ‘Application status and development trend of 497
Rice Harvesting machinery in South China’, Modern Agricultural Equipments, Vol. 1 498
(2014) pp. 37-40. 499
Liu, J., Folberth, C., Yang, H., Röckström, J., Abbaspour, K. and Alexander, J. B. ‘A Global 500
and Spatially Explicit Assessment of Climate Change Impacts on Crop Production and 501
Consumptive Water Use’. Plus One, Vol. 8 (2013) pp. 1-13. 502
Newell, R. G. and Anderson, S. ‘Simplified Marginal Effects in Discrete Choice Models’, 503
Economics Letters, Vol. 81 (2003) pp. 321-326. 504
Parfitt, J., Barthel, M. and Macnaughton, S. ‘Food Waste within Food Supply Chains: 505

- 21 -
Quantification and Potential for Change to 2050’, Philosophical Transactions, Vol. 365 506
(2010) pp. 3065-3081. 507
Priefer, C., Jörissen, J. and Bräutigam, K. R. Technology Options for Feeding 10 Billion 508
People. Options for Cutting Food Waste (Institute for Technology Assessment and Systems 509
Analysis, 2013). 510
Ridoutt, B. G., Juliano, P., Sanguansri, P. and Sellahewa, J. ‘The Water Footprint of Food 511
Waste: Case Study of Fresh Mango in Australia’, Journal of Cleaner Production, Vol. 18 512
(2010) pp. 1714-1721. 513
Song, H. Y., Zhang, H. C., Li, J. and Wu, Z. G. ‘Study of post-harvest grain losses in China: 514
The case of wheat in Henan Province’, Journal of Huazhong Agricultural University 515
(Social Science), Vol. 4 (2015) pp.1-6. 516
Teshome, A., Kenneth, T. J., Bernard, B., Lenore, F. and Lambert, D. H. ‘Traditional Farmers’ 517
Knowledge of Sorghum Landrace Storability in Ethiopia’, Economic Botany, Vol. 53 (1999) 518
pp. 69-78. 519
World Bank, FAO and NRI. Missing Food: The Case of Post-harvest Grain Losses in 520
Sub-Saharan Africa (World Bank, Washington DC, 2011). 521
WRAP. New Estimates for Household Food and Drink Waste in the UK (Waste and 522
Resources Action Program, Bradbury, UK, 2011). 523
Zhan, Y. E., Chu, Q. Q. and Wang, H. G. ‘Grain security situation and countermeasures during 524
urbanization in China’, Research of Agricultural Modernization, Vol. 30 (2009) pp. 525
270-274. 526
Zhang, H. Y., Liu, Y. M. and Chen, X. L. ‘Causes and prevention measures of high-yielding 527
rice lodging’, Nongmin Zhifuzhiyou Yuekan, Vol. 6 (2013) pp.68-68. 528
Zhang, J., Fu, Z. T. and Li, D. L. ‘Formation of grain losses and current situation of grain 529
losses in China’, Journal of China Agricultural University (Social Science), Vol. 4 (1998) 530
pp. 59-63. 531
Zhejiang Academy of Agricultural Sciences. Grain Post-production System Analysis in China: 532

- 22 -
Terminal Report (Zhejiang Academy of Agricultural Sciences, Postharvest Development 533
Research Center, Hangzhou, China, 1991). 534
535
536
537
538
539
540
541
542
543
544
545
546
547
548
549
550
551
552
553
554
555
556
557
558
559

- 23 -
Table 1 The basic demographics of respondents 560
Characteristic Classification n %
Gender Male 526 54.96
Female 431 45.04
Age
≤ 35 years 64 6.69
36 - 45 years 160 16.72
46 - 55 years 395 41.27
56 - 65 years 284 29.68
≥ 66 years 54 5.64
Education
Primary or lower 209 21.84
Junior high school or lower 369 38.56
High school or lower
( including vocational high
school)
255 26.64
College and above 124 12.96
Family size
1 - 2 members 53 5.54
3 members 282 29.47
4 members 366 38.24
≥ 5 members 256 26.75
Annual household
income
≤ 30000 yuan 296 30.93
30000 - 60000 yuan 372 38.87
60000 - 100000 yuan 207 21.63
≥ 100000 yuan 82 8.57
Experience of working
in the city
Yes 452 47.23
No 505 52.77
561
562
563
564
565
566
567
568
569
570
571
572
573
574

- 24 -
Table 2 Percentage of respondents selecting each rice harvest loss rate range(%) 575
Harvest loss
rate
Region
Lower than
3% 3%-4% 4%-5% 5%-6% 6%-7%
Higher than
7%
Nationwide 26.96 29.26 18.29 13.06 5.64 6.79
Eastern region 26.27 23.86 18.50 12.87 6.43 12.07
Central region 24.25 32.46 13.81 16.79 8.21 4.48
Western region 19.25 35.56 26.36 12.97 3.77 2.09
Northeast region 64.93 23.38 6.49 1.30 1.30 2.60
576
577
578
579
580
581
582
583
584
585
586
587
588
589
590
591
592
593
594
595
596
597
598
599
600
601
602
603
604
605
606

- 25 -
Table 3 Percentage of respondents selecting each rice harvest loss influencing factor(%) 607
Influencing
factor
Region
Changeable
Weather
Outdated
Equipment
Inadequate
Manpower
Diseases
and Pests Shattering Others
Nationwide 45.46 19.65 2.82 18.18 10.55 3.34
Eastern region 44.77 21.44 3.49 15.55 11.80 2.95
Central region 47.76 13.06 3.73 23.13 10.45 1.87
Western region 33.89 20.50 4.60 30.55 5.02 5.44
Northeast region 49.35 14.29 1.30 25.97 7.79 1.30
Note: The percentage data for the entire country were calculated by dividing the total sample size by the 608
frequency of each option. The percentage data for each region were calculated by dividing the sample size 609
in that region by the frequency of each option. 610
611
612
613
614
615
616
617
618
619
620
621
622
623
624
625
626
627
628
629
630
631
632
633
634
635
636
637
638
- 26 -
Table 4 Typical studies on post-harvest losses and their influencing factors 639
Literature Country
( region) Variety Influencing Factors
Akar et al.(2004) Africa Rice Harvest weather, rice varieties with different mature
periods, and variety maturity
Basavaraja et al. (2007) India Rice Respondents’ age and education, rice planting area,
and number of family laborers
Zhang et al.(2009) China Rice Sources of household income, and proportion of grain
income in total household income
Hodges et al. (2011) Southeast
Asia Cereals
Respondents’ education, and grain-saving and
loss-reducing awareness
Parfitt et al. (2010) EU Cereals Rice market price, farmers' skills, power grid
installation, and irrigation conditions
Li wei(2010) China Rice Employment of family member(s) as migrant workers
or not, and rice harvesting methods
Appiah et al. (2011) Ghana Rice
Respondents’ gender, planting years, family age
structure, and level of mechanization of rice
harvesting
Gustavsson et al.
(2011) Africa Cereals
Household income, power grid installation and road
facilities, and grain-saving awareness
Bokusheva et al. (2012) Central
America Cereals
Farmers’ harvesting skills, grain harvesting
equipment, and meticulousness of farmers’ harvesting
operations
Priefer et al. (2013) EU Cereals
Respondents’ age and education, family size, annual
household income, farmers’ skills, climatic conditions,
rural infrastructure
Aulakh and Regmi
(2013) Africa Cereals
Mechanization level of cereal harvesting, climatic
conditions, and harvest weather
Abass et al. (2014) Tanzania Cereals
Timely harvest or not, harvest weather, farmers’ skills,
mechanization level of rice harvesting, and
grain-saving awareness
Halloran et al. (2014) Denmark Cereals Meticulousness of farmers’ harvesting operations, and
grain-saving and loss-reducing awareness
Guo et al.(2014) China Rice Manpower adequacy, rice harvesting equipment, and
farmers’ harvesting skills
Huang et al.(2015) China Rice Acceptance of land transfer or not, and rice harvesting
methods
640
641
642

- 27 -
Table 5 Names, meanings, and statistical characteristics of model variables 643
Variable
Name
Variable
Meaning
Mean Standard
Deviation
Demographics
Gender Male=1; female=0 0.55 0.50
Age Actual age (years) 51.43 9.72
Education Specific years of schooling (years) 8.97 3.23
Employment as migrant
workers or not Yes=1; no=0 0.47 0.50
Annual household income Family net income value (10 thousand) 5.45 3.05
Proportion of family business
income
Family business income accounting for the proportion of
total household income 0.56 0.20
Production characteristics
Planting scale Household per capita rice cultivation area (mu) 4.23 2.38
Level of mechanization Proportion of mechanically harvested area in the total
harvested area 0.59 0.14
Land transfer Yes=1; no=0 0.51 0.50
Rice prices Satisfaction Satisfaction =1; Not satisfaction =0 0.63 0.48
Harvesting operation characteristics
Harvesting methods Segment harvesting =1; combine harvesting =0 0.47 0.50
Timely harvest or not Timely harvest =1; Not timely harvest =0 0.45 0.50
Operational meticulousness
Including five categories: very crude, crude, moderate,
meticulous, very meticulous (with “very crude” as the
reference)
— —
Operational meticulousness 1 Operational meticulousness is “crude”(yes=1, no=0) 0.20 0.40
Operational meticulousness 2 Operational meticulousness is “moderate,”(yes=1, no=0) 0.42 0.49
Operational meticulousness 3 Operational meticulousness is “meticulous”(yes=1,
no=0) 0.21 0.41
Operational meticulousness 4 Operational meticulousness is “very meticulous”(yes=1,
no=0) 0.11 0.31
Harvest weather
Including five categories: very adverse, adverse,
moderate, favorable, very favorable (with “very adverse”
as the reference)
— —
Harvest weather 1 Harvest weather is “adverse”(yes=1, no=0) 0.29 0.45
Harvest weather 2 Harvest weather is “moderate”(yes=1, no=0) 0.31 0.46
Harvest weather 3 Harvest weather is “favorable”(yes=1, no=0) 0.24 0.42
Harvest weather 4 Harvest weather is “very favorable”(yes=1, no=0) 0.06 0.23
Manpower adequacy
Including five categories: very inadequate, inadequate,
moderate, adequate, very adequate (with “very
inadequate” as the reference)
— —

- 28 -
Manpower adequacy 1 Manpower adequacy is “inadequate”(yes=1, no=0) 0.17 0.38
Manpower adequacy 2 Manpower adequacy is “moderate”(yes=1, no=0) 0.43 0.50
Manpower adequacy 3 Manpower adequacy is “adequate”(yes=1, no=0) 0.22 0.42
Manpower adequacy 4 Manpower adequacy is “very adequate”(yes=1, no=0) 0.09 0.29
644
645
646
647
648
649
650
651
652
653
654
655
656
657
658
659
660
661
662
663
664
665
666
667
668
669
670
671
672
673
674
675
676
677
678
679
- 29 -
Table 6 Model estimation results of main factors influencing rice harvest losses 680
Variable Coefficient Standard Error Wald Value P Value
Gender 0.093 0.125 0.552 0.458
Age -0.004 0.008 0.213 0.644
Education 0.001 0.019 0.002 0.967
Employment as migrant workers
or not
0.386***
0.130 8.808 0.003
Annual household income 0.020 0.020 0.911 0.340
Proportion of family business
income
-3.112***
0.364 73.166 0.000
Planting scale -0.359***
0.039 82.857 0.000
Level of mechanization -1.060**
0.455 5.422 0.020
Rice price satisfaction -0.019 0.128 0.021 0.884
Land transfer 0.084 0.131 0.413 0.520
Harvesting methods 0.072 0.124 0.334 0.563
Timely harvest or not -0.415***
0.127 10.647 0.001
Manpower adequacy 1 0.769***
0.265 8.413 0.004
Manpower adequacy 2 0.344 0.240 2.058 0.151
Manpower adequacy 3 -0.245 0.258 0.902 0.342
Manpower adequacy 4 -0.368 0.303 1.470 0.225
Operational meticulousness 1 0.946***
0.262 13.063 0.000
Operational meticulousness 2 0.159 0.244 0.423 0.515
Operational meticulousness 3 -0.892***
0.265 11.347 0.001
Operational meticulousness 4 -1.077***
0.303 12.627 0.000
Harvest weather 1 1.612***
0.241 44.692 0.000
Harvest weather 2 0.711***
0.239 8.883 0.003
Harvest weather 3 -0.106 0.252 0.179 0.673
Harvest weather 4 -0.563 0.397 2.016 0.156
Critical point
Critical point 11
-0.763 0.672 1.288 0.256
Critical point 22
1.110* 0.672 2.732 0.098
Critical point 33
2.579***
0.675 14.587 0.000
Critical point 44
4.069***
0.687 35.118 0.000
Critical point 55
5.066***
0.699 52.485 0.000
Nagelkerke R2 0.524
Cox & Snell R2 0.505
2 test 672.035***
Note: * represent p< 0.1, ** represent p< 0.05, *** represent p<0.01. 681
682
683

- 30 -
Table 7 Marginal effects of significant independent variable on rice harvest losses (ceteris paribus) 684
Significant Independent Variable iY =0 iY =1
iY =2 iY =3
iY =4 iY =5
Employment as migrant workers
or not -0.0773 -0.0013 0.0488 0.0222 0.0048 0.0029
Proportion of family business
income 0.5949 -0.3614 -0.1663 -0.0511 -0.0101 -0.0060
Planting scale 0.0824 -0.0216 -0.0406 -0.0152 -0.0031 -0.0019
Level of mechanization 0.2557 -0.1103 -0.1005 -0.0340 -0.0068 -0.0041
Timely harvest or not 0.0959 -0.0267 -0.0463 -0.0172 -0.0035 -0.0021
Manpower adequacy 1 0.1690 -0.0605 -0.0740 -0.0261 -0.0053 -0.0032
Operational meticulousness 1 -0.1403 -0.0274 0.0976 0.0514 0.0116 0.0072
Operational meticulousness 3 -0.1647 -0.0465 0.1183 0.0676 0.0156 0.0097
Operational meticulousness 4 0.2142 -0.0853 -0.0885 -0.0305 -0.0062 -0.0037
Harvest weather 1 0.2599 -0.1129 -0.1016 -0.0343 -0.0069 -0.0041
Harvest weather 2 0.3824 -0.1962 -0.1306 -0.0422 -0.0084 -0.0050
685
686
687
688
689
690
691
692
693
694
695
696
697
698
699
700
701

- 31 -
702
Figure 1. Composition of rice harvest losses 703
704
705