linkage between risk strategy, a ppetite, tolerances, and
TRANSCRIPT
October 7, 2016
Linkage Between Risk Strategy, Appetite, Tolerances, and Limits2016 ERM Seminar for the P&C Actuary
Speakers:Jason Abril (also Moderator)Kevin Madigan
© 2016 Willis Towers Watson. All rights reserved.
Linking Strategy to ERM
1
A more detailed discussion of linking strategy to ERM was contained in another session (Aligning ERM, Risk Models and Business Strategy) on Thursday, October 6.
Here we want to specifically address linking strategy to one component of ERM: Risk Appetite.
We will illustrate how this linkage allows for the development of tolerances and limits that help insurers obtain real value from their ERM framework.
© 2016 Willis Towers Watson. All rights reserved. Proprietary and Confidential. For Willis Towers Watson and Willis Towers Watson client use only.
Benefits of ERM
2
Traditional Risk Management -Insurers already have extensive risk management practices.
Enterprise Risk Management can add three things to the existing risk management: Transparency – everyone will be able to
see what is being done and not done for risk mitigation and control of the key risks
Discipline – an expectation that the planned risk management will actually take place continually and that all key risks will be managed
Alignment – Risk management can be aligned with company strategy
Alignment
© 2016 Willis Towers Watson. All rights reserved. Proprietary and Confidential. For Willis Towers Watson and Willis Towers Watson client use only.
Defining risk in the context of an insurer
3
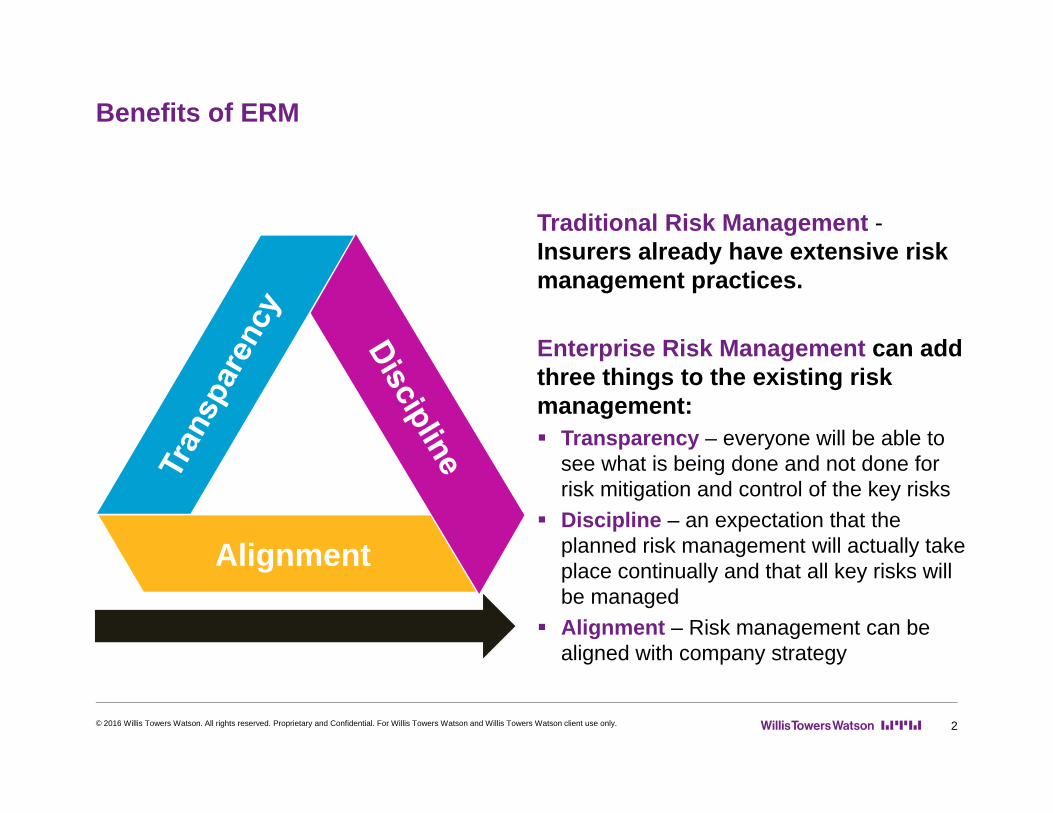
Mission success depends on creating value Developing and maintaining a comparative advantage
Purpose Responsibilities Mission Time Horizon Delivering value to
shareholders Fulfilling the social
purpose of insurance
Good security and service to policyholders
Rewarding careers for employees
Responsible conduct for regulators
Contracts make long-term promises
Business, investment and insurance cycles
Risk is an insurer failing to deliver on its mission
© 2016 Willis Towers Watson. All rights reserved. Proprietary and Confidential. For Willis Towers Watson and Willis Towers Watson client use only.
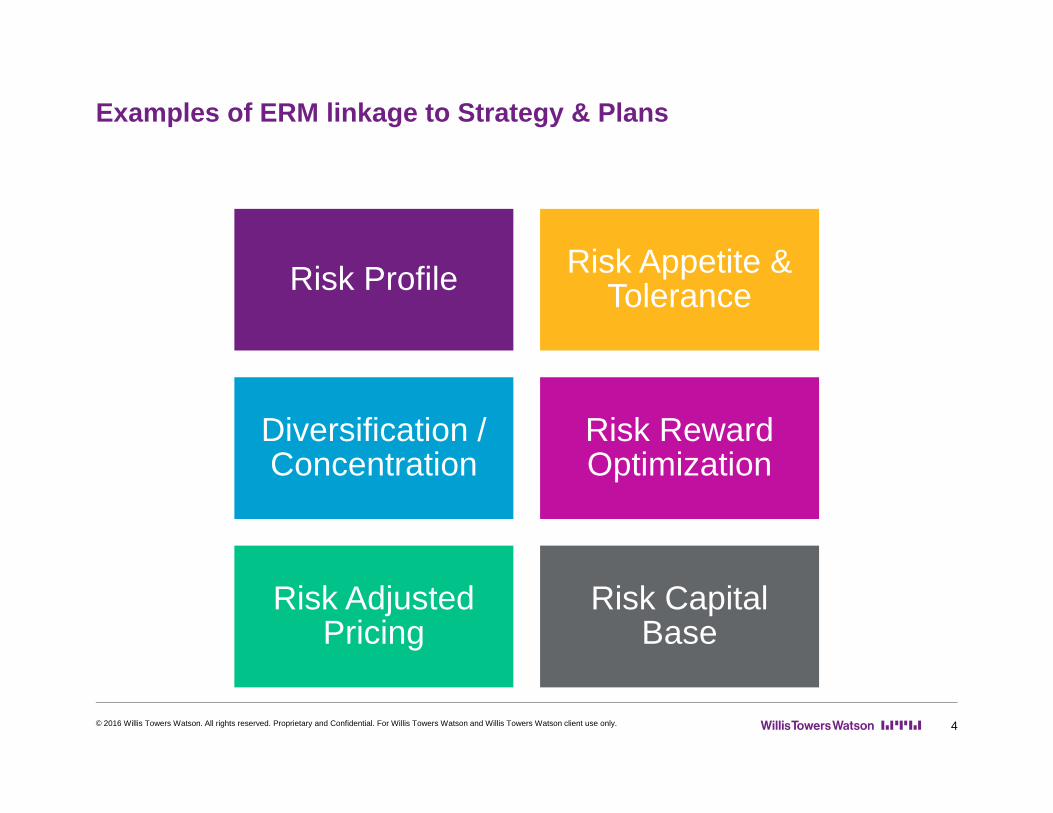
Examples of ERM linkage to Strategy & Plans
4
Risk Profile Risk Appetite & Tolerance
Diversification / Concentration
Risk Reward Optimization
Risk Adjusted Pricing
Risk Capital Base
© 2016 Willis Towers Watson. All rights reserved. Proprietary and Confidential. For Willis Towers Watson and Willis Towers Watson client use only.
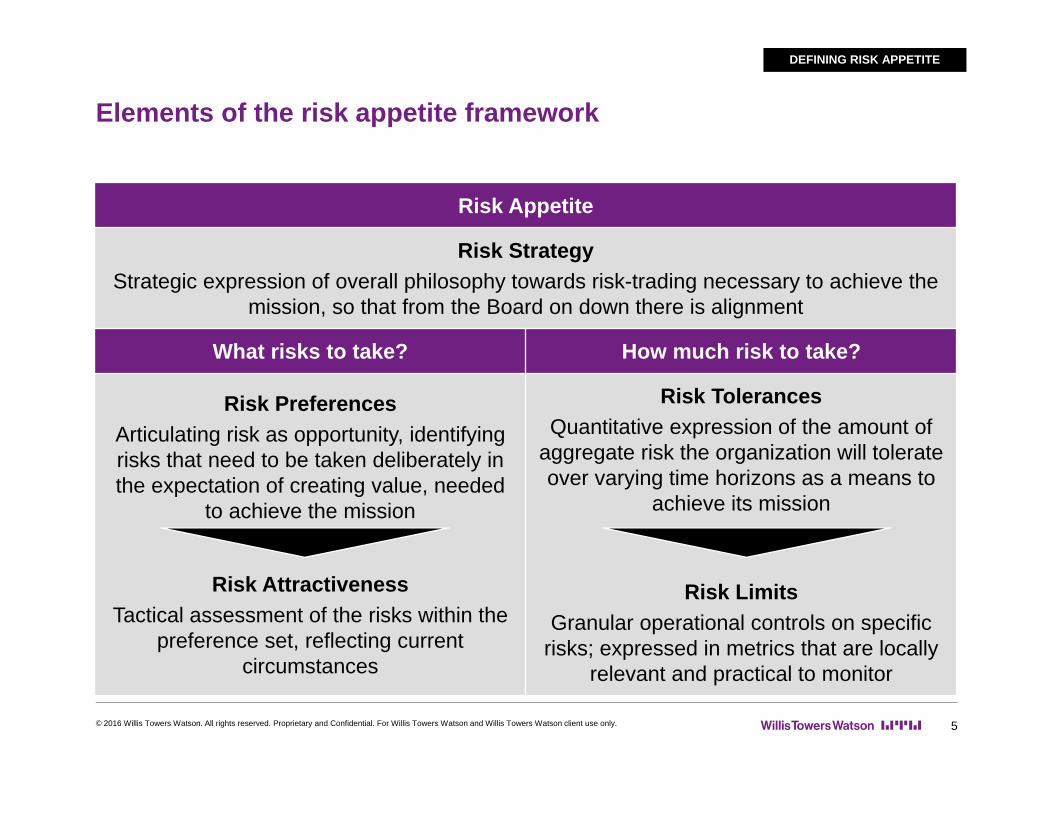
Elements of the risk appetite framework
5
Risk Appetite
Risk StrategyStrategic expression of overall philosophy towards risk-trading necessary to achieve the
mission, so that from the Board on down there is alignment
What risks to take? How much risk to take?
Risk PreferencesArticulating risk as opportunity, identifying risks that need to be taken deliberately in the expectation of creating value, needed
to achieve the mission
Risk AttractivenessTactical assessment of the risks within the
preference set, reflecting current circumstances
Risk TolerancesQuantitative expression of the amount of
aggregate risk the organization will tolerate over varying time horizons as a means to
achieve its mission
Risk LimitsGranular operational controls on specific
risks; expressed in metrics that are locally relevant and practical to monitor
DEFINING RISK APPETITE
© 2016 Willis Towers Watson. All rights reserved. Proprietary and Confidential. For Willis Towers Watson and Willis Towers Watson client use only.
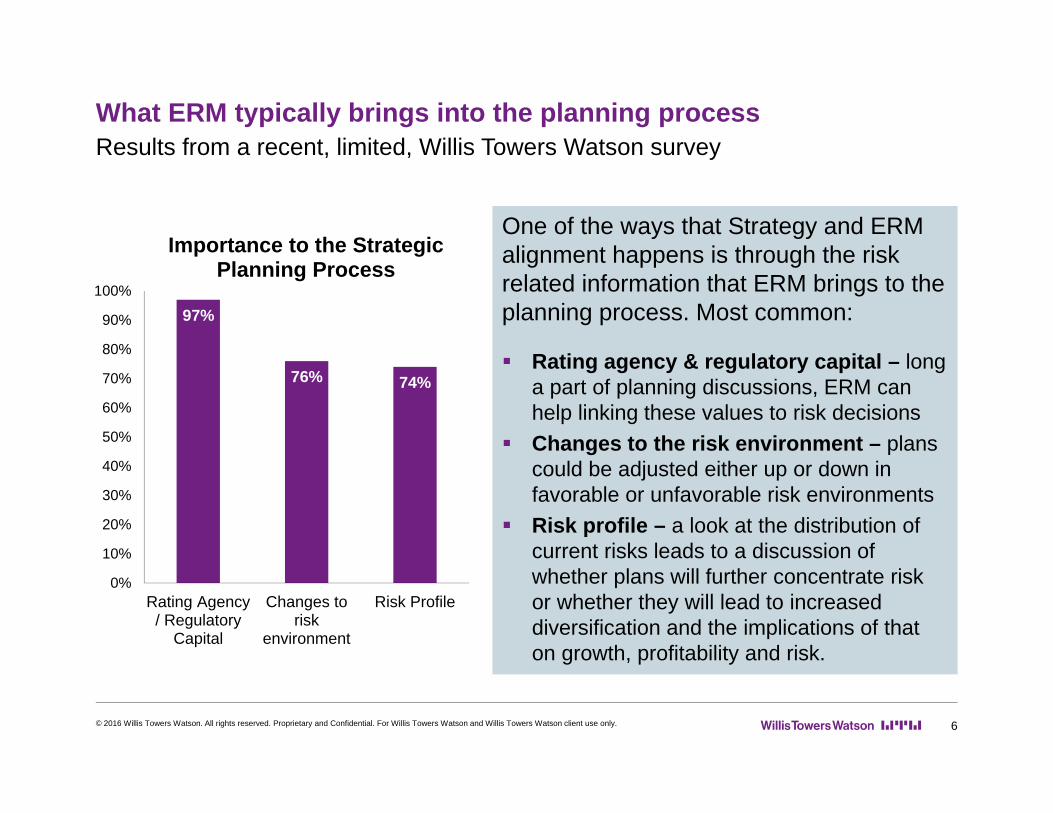
What ERM typically brings into the planning process
© 2016 Willis Towers Watson. All rights reserved. Proprietary and Confidential. For Willis Towers Watson and Willis Towers Watson client use only. 6
Results from a recent, limited, Willis Towers Watson survey
One of the ways that Strategy and ERM alignment happens is through the risk related information that ERM brings to the planning process. Most common:
Rating agency & regulatory capital – long a part of planning discussions, ERM can help linking these values to risk decisions
Changes to the risk environment – plans could be adjusted either up or down in favorable or unfavorable risk environments
Risk profile – a look at the distribution of current risks leads to a discussion of whether plans will further concentrate risk or whether they will lead to increased diversification and the implications of that on growth, profitability and risk.
97%
76% 74%
0%
10%
20%
30%
40%
50%
60%
70%
80%
90%
100%
Rating Agency/ Regulatory
Capital
Changes torisk
environment
Risk Profile
Importance to the Strategic Planning Process
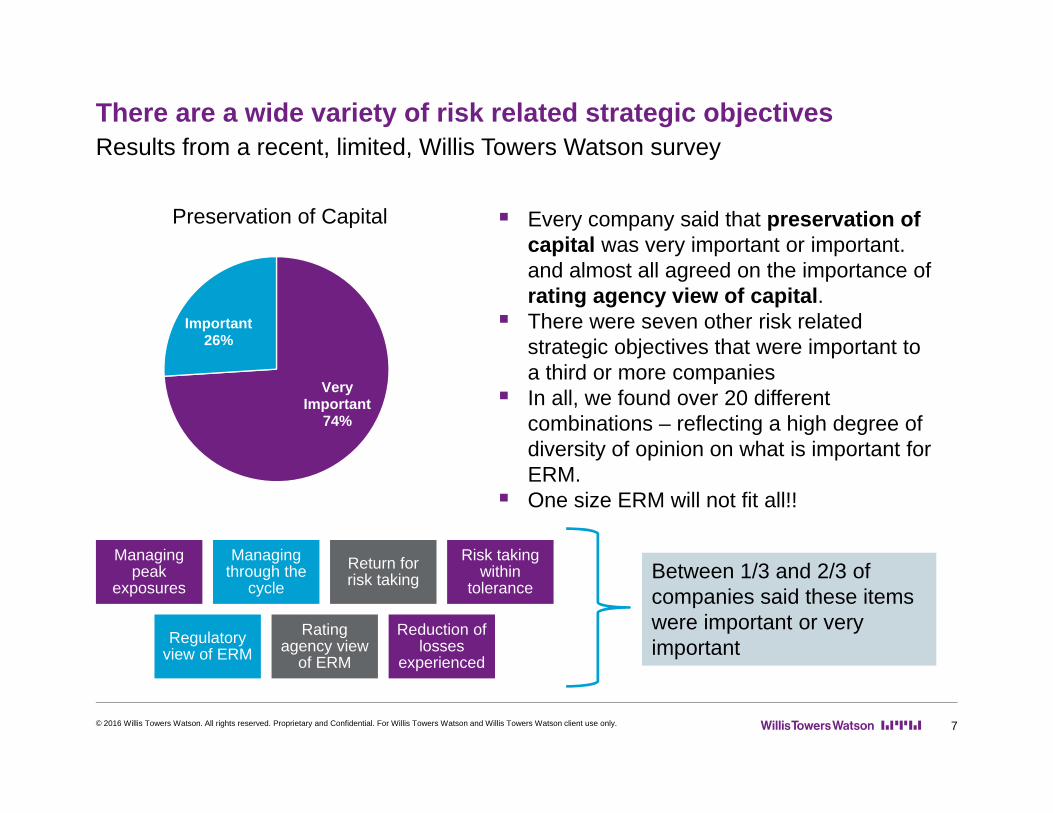
There are a wide variety of risk related strategic objectives
© 2016 Willis Towers Watson. All rights reserved. Proprietary and Confidential. For Willis Towers Watson and Willis Towers Watson client use only. 7
Results from a recent, limited, Willis Towers Watson survey
Every company said that preservation of capital was very important or important. and almost all agreed on the importance of rating agency view of capital.
There were seven other risk related strategic objectives that were important to a third or more companies
In all, we found over 20 different combinations – reflecting a high degree of diversity of opinion on what is important for ERM.
One size ERM will not fit all!!
Between 1/3 and 2/3 of companies said these items were important or very important
Very Important
74%
Important26%
Preservation of Capital
Managing peak
exposures
Managing through the
cycleReturn for risk taking
Risk taking within
tolerance
Regulatory view of ERM
Rating agency view
of ERM
Reduction of losses
experienced
Defining an enterprise’s risk appetite is a strong foundation upon which to build broader risk management activities
© 2016 Willis Towers Watson. All rights reserved. Proprietary and Confidential. For Willis Towers Watson and Willis Towers Watson client use only. 8
While many insurers have developed risk appetite statements, there remains strong dissatisfaction with the value of the statements in making business decisions
Risk appetite should begin by stating the linkage to an organization’s business strategy, yet many statements miss this link
The link to business strategy leads to an enhanced approach to understanding the company’s willingness to accept the adverse consequences of uncertainty, i.e. risk
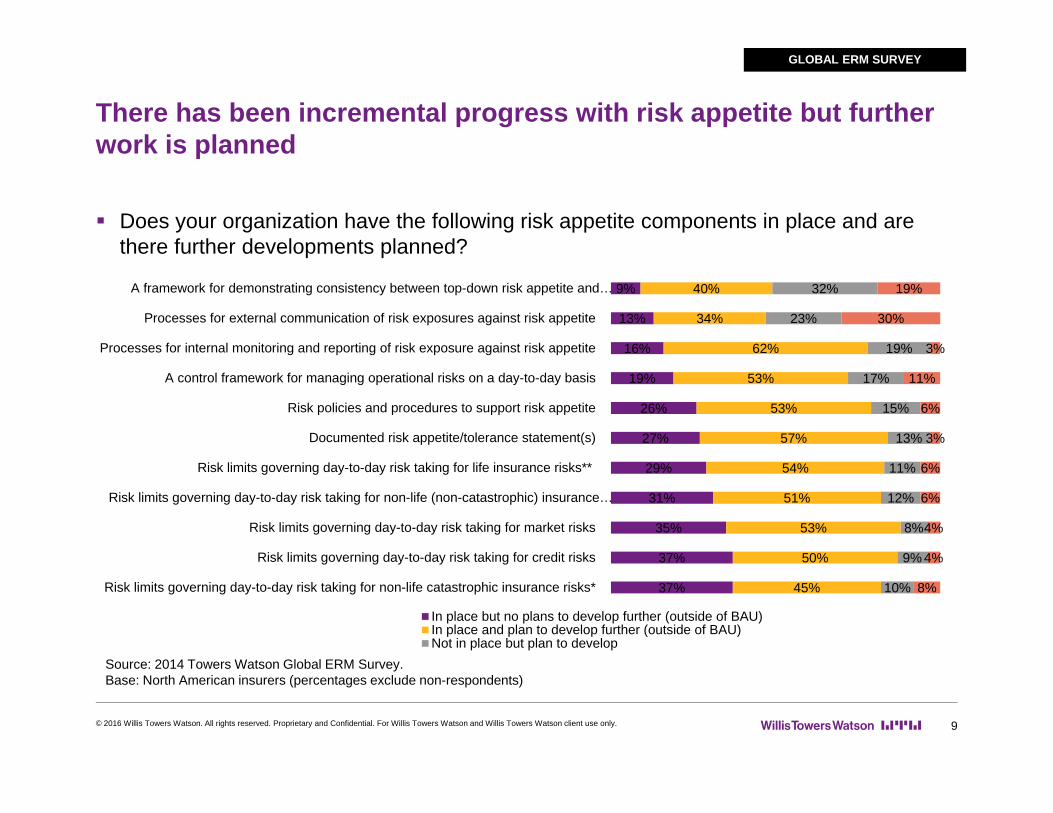
There has been incremental progress with risk appetite but further work is planned
© 2016 Willis Towers Watson. All rights reserved. Proprietary and Confidential. For Willis Towers Watson and Willis Towers Watson client use only. 9
Does your organization have the following risk appetite components in place and are there further developments planned?
GLOBAL ERM SURVEY
Source: 2014 Towers Watson Global ERM Survey.Base: North American insurers (percentages exclude non-respondents)
9%
13%
16%
19%
26%
27%
29%
31%
35%
37%
37%
40%
34%
62%
53%
53%
57%
54%
51%
53%
50%
45%
32%
23%
19%
17%
15%
13%
11%
12%
8%
9%
10%
19%
30%
3%
11%
6%
3%
6%
6%
4%
4%
8%
A framework for demonstrating consistency between top-down risk appetite and…
Processes for external communication of risk exposures against risk appetite
Processes for internal monitoring and reporting of risk exposure against risk appetite
A control framework for managing operational risks on a day-to-day basis
Risk policies and procedures to support risk appetite
Documented risk appetite/tolerance statement(s)
Risk limits governing day-to-day risk taking for life insurance risks**
Risk limits governing day-to-day risk taking for non-life (non-catastrophic) insurance…
Risk limits governing day-to-day risk taking for market risks
Risk limits governing day-to-day risk taking for credit risks
Risk limits governing day-to-day risk taking for non-life catastrophic insurance risks*
In place but no plans to develop further (outside of BAU)In place and plan to develop further (outside of BAU)Not in place but plan to develop
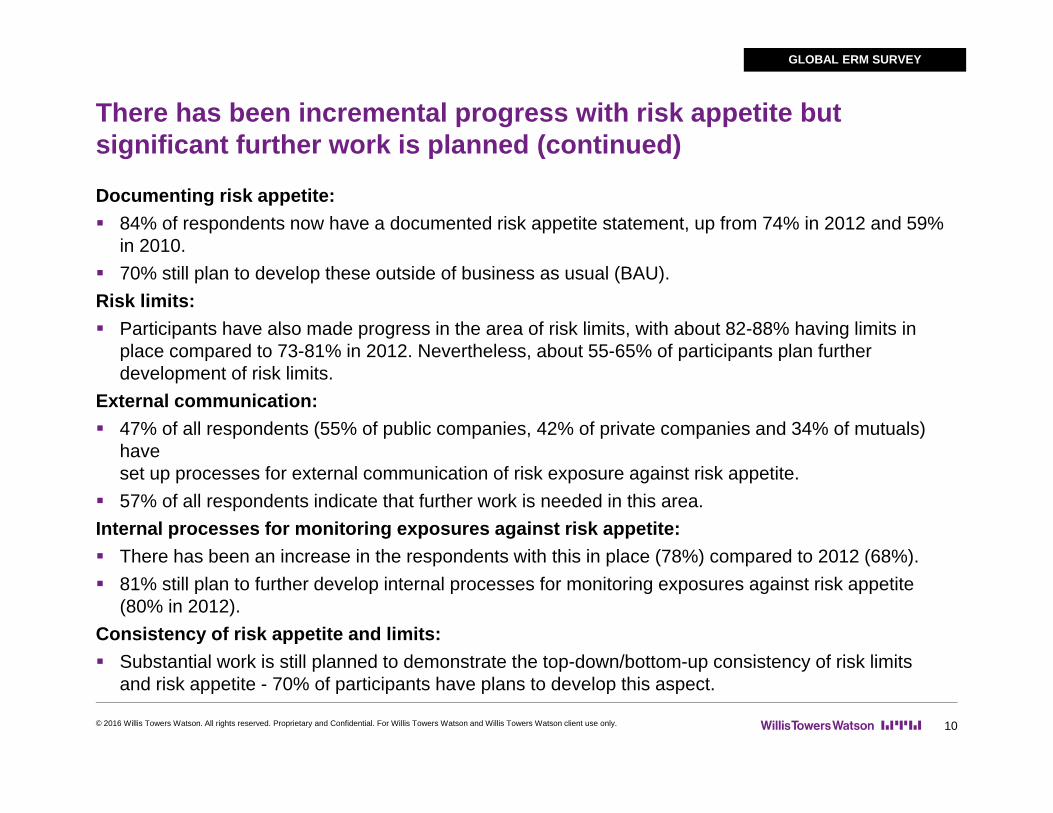
There has been incremental progress with risk appetite but significant further work is planned (continued)
© 2016 Willis Towers Watson. All rights reserved. Proprietary and Confidential. For Willis Towers Watson and Willis Towers Watson client use only. 10
Documenting risk appetite: 84% of respondents now have a documented risk appetite statement, up from 74% in 2012 and 59%
in 2010. 70% still plan to develop these outside of business as usual (BAU).Risk limits: Participants have also made progress in the area of risk limits, with about 82-88% having limits in
place compared to 73-81% in 2012. Nevertheless, about 55-65% of participants plan further development of risk limits.
External communication: 47% of all respondents (55% of public companies, 42% of private companies and 34% of mutuals)
have set up processes for external communication of risk exposure against risk appetite.
57% of all respondents indicate that further work is needed in this area. Internal processes for monitoring exposures against risk appetite: There has been an increase in the respondents with this in place (78%) compared to 2012 (68%). 81% still plan to further develop internal processes for monitoring exposures against risk appetite
(80% in 2012).Consistency of risk appetite and limits: Substantial work is still planned to demonstrate the top-down/bottom-up consistency of risk limits
and risk appetite - 70% of participants have plans to develop this aspect.
GLOBAL ERM SURVEY
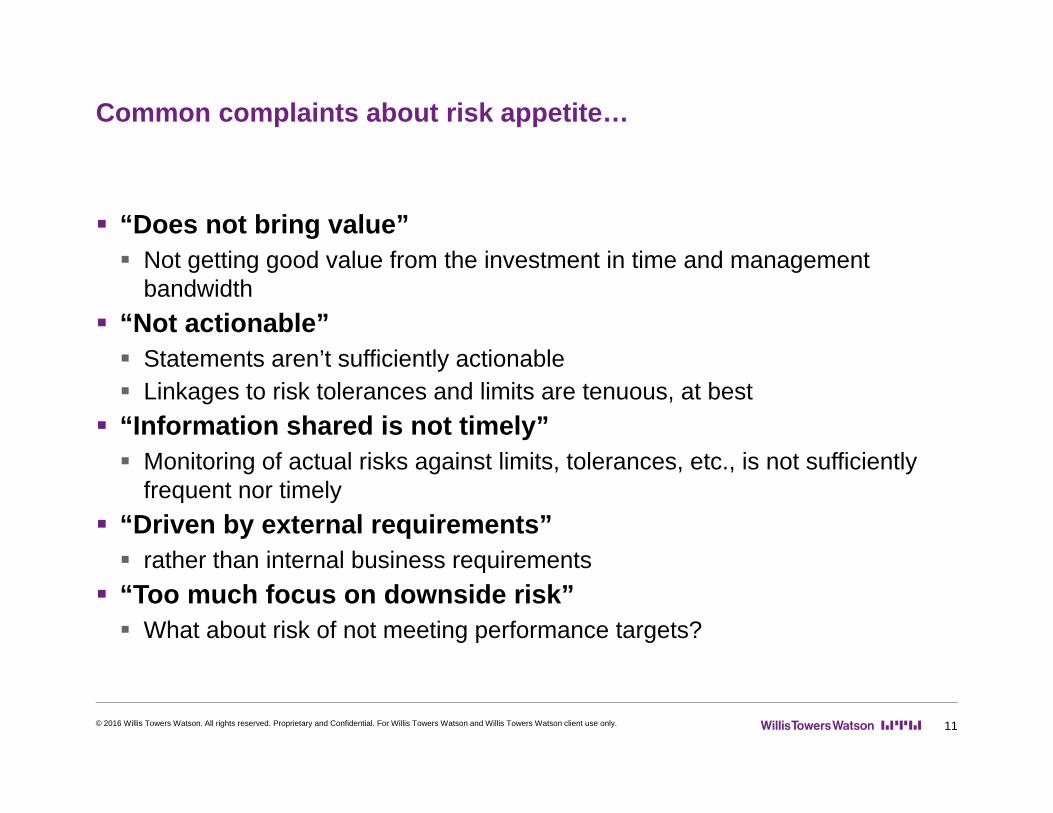
Common complaints about risk appetite…
© 2016 Willis Towers Watson. All rights reserved. Proprietary and Confidential. For Willis Towers Watson and Willis Towers Watson client use only. 11
“Does not bring value” Not getting good value from the investment in time and management
bandwidth “Not actionable” Statements aren’t sufficiently actionable Linkages to risk tolerances and limits are tenuous, at best
“Information shared is not timely” Monitoring of actual risks against limits, tolerances, etc., is not sufficiently
frequent nor timely “Driven by external requirements” rather than internal business requirements
“Too much focus on downside risk” What about risk of not meeting performance targets?
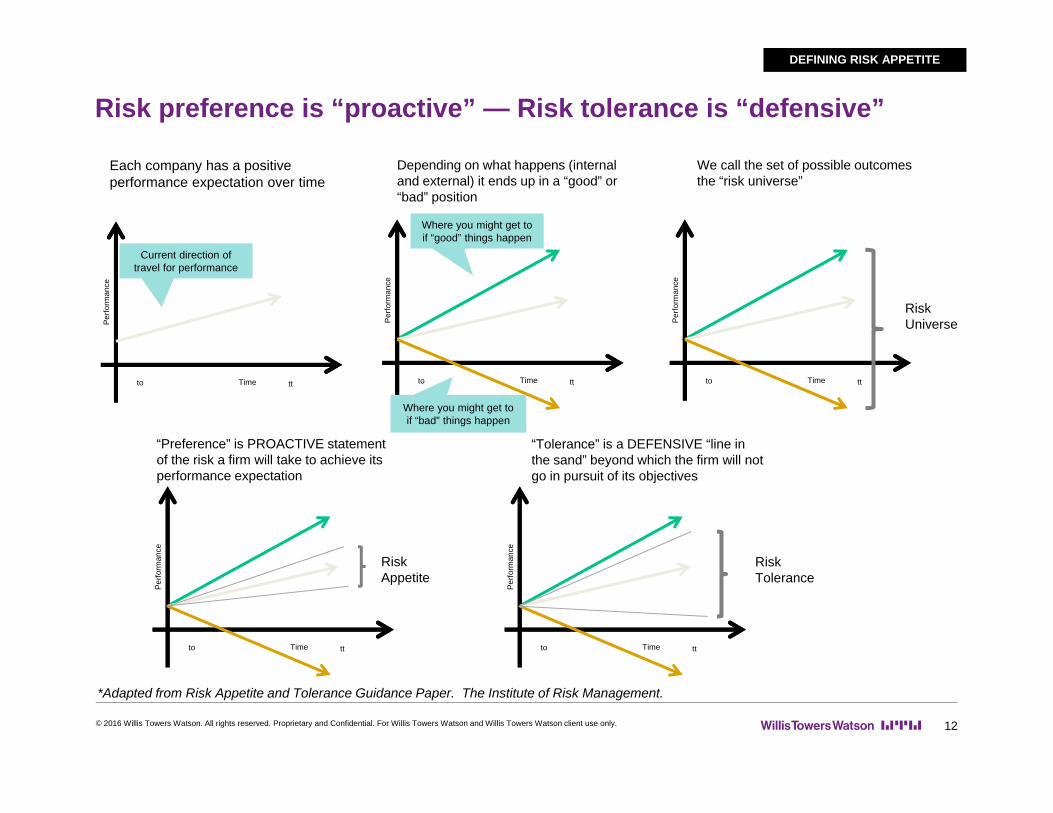
Risk preference is “proactive” — Risk tolerance is “defensive”
12
DEFINING RISK APPETITE
© 2016 Willis Towers Watson. All rights reserved. Proprietary and Confidential. For Willis Towers Watson and Willis Towers Watson client use only.
Current direction of travel for performance
Time ttto
Per
form
ance
Time tttoP
erfo
rman
ce
Where you might get to if “good” things happen
Where you might get to if “bad” things happen
Time ttto
Per
form
ance
Risk Universe
Time ttto
Per
form
ance
Risk Appetite
Time ttto
Per
form
ance
Risk Tolerance
Each company has a positive performance expectation over time
Depending on what happens (internal and external) it ends up in a “good” or “bad” position
“Preference” is PROACTIVE statement of the risk a firm will take to achieve its performance expectation
“Tolerance” is a DEFENSIVE “line in the sand” beyond which the firm will not go in pursuit of its objectives
We call the set of possible outcomes the “risk universe”
*Adapted from Risk Appetite and Tolerance Guidance Paper. The Institute of Risk Management.
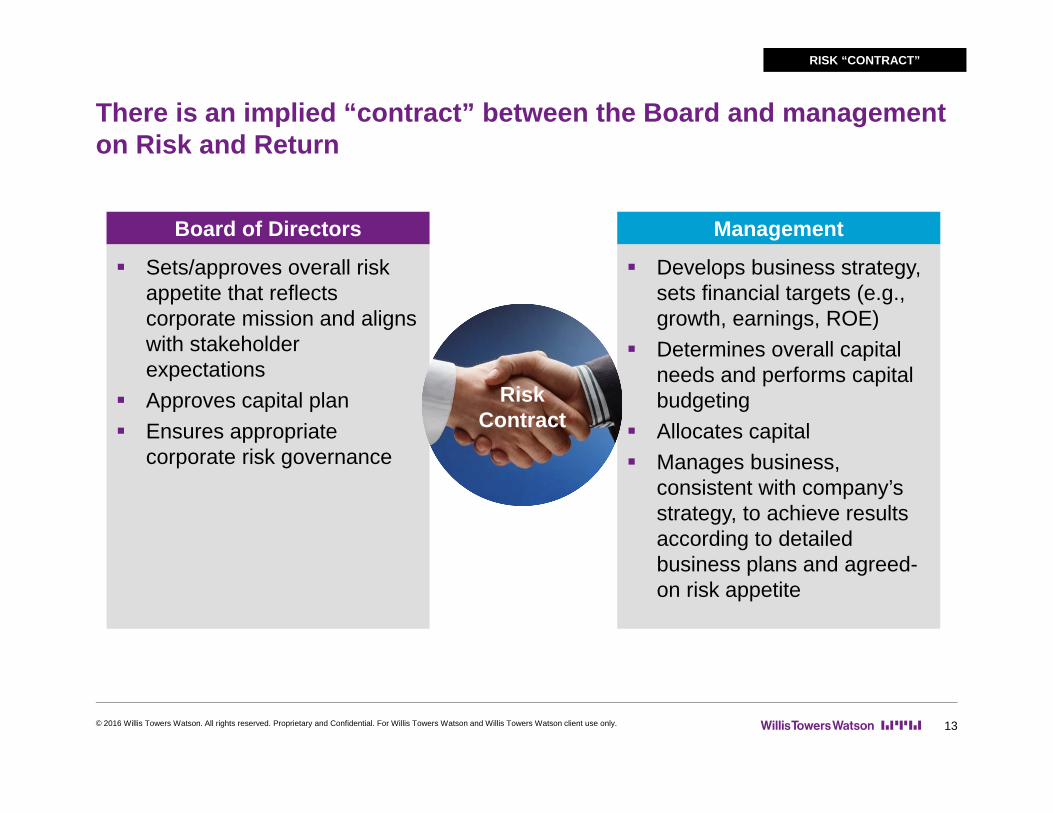
There is an implied “contract” between the Board and management on Risk and Return
© 2016 Willis Towers Watson. All rights reserved. Proprietary and Confidential. For Willis Towers Watson and Willis Towers Watson client use only. 13
RISK “CONTRACT”
Management
Develops business strategy, sets financial targets (e.g., growth, earnings, ROE)
Determines overall capital needs and performs capital budgeting
Allocates capital Manages business,
consistent with company’s strategy, to achieve results according to detailed business plans and agreed-on risk appetite
Board of Directors
Sets/approves overall risk appetite that reflects corporate mission and aligns with stakeholder expectations
Approves capital plan Ensures appropriate
corporate risk governance
RiskContract
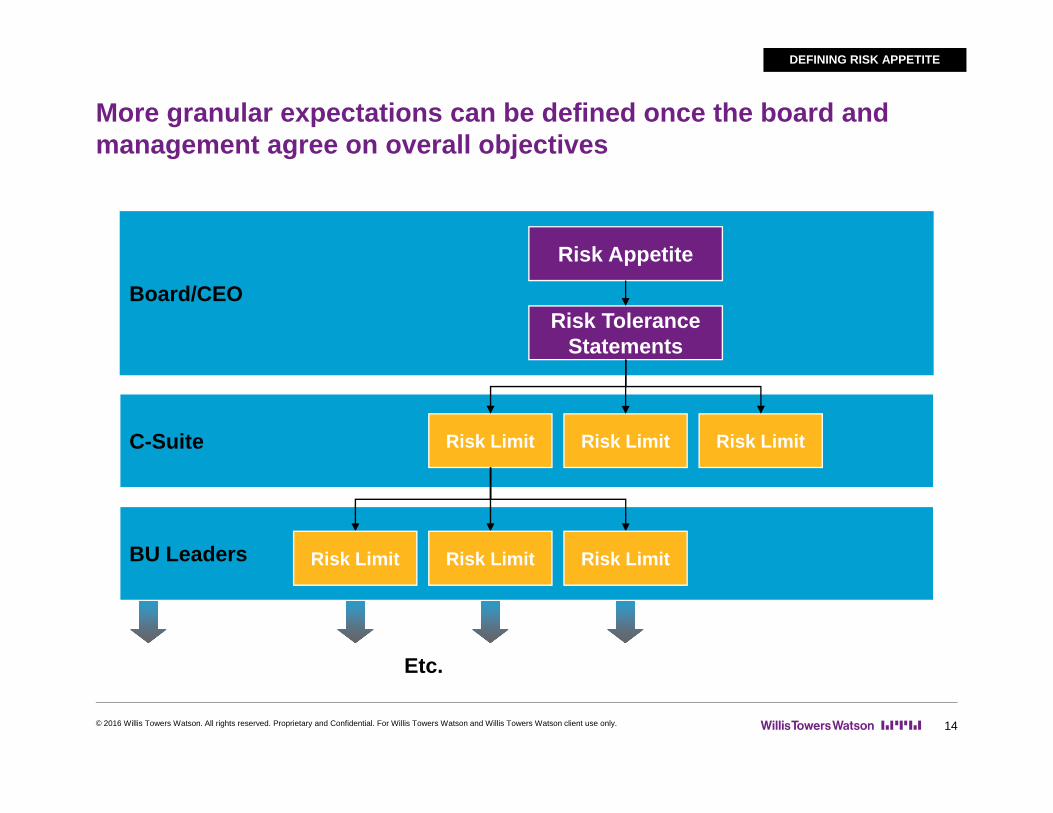
More granular expectations can be defined once the board and management agree on overall objectives
© 2016 Willis Towers Watson. All rights reserved. Proprietary and Confidential. For Willis Towers Watson and Willis Towers Watson client use only. 14
DEFINING RISK APPETITE
Board/CEO
Risk Appetite
Risk Tolerance Statements
C-Suite Risk Limit Risk Limit Risk Limit
BU Leaders Risk Limit Risk Limit Risk Limit
Etc.
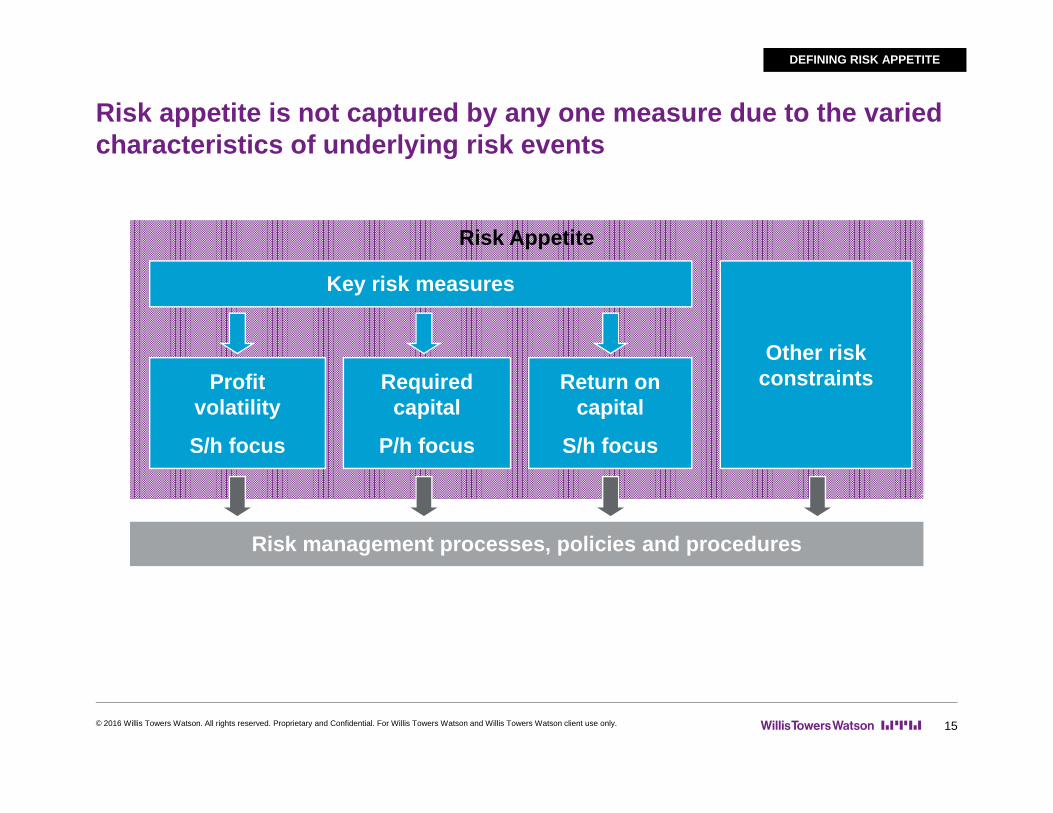
Risk appetite is not captured by any one measure due to the varied characteristics of underlying risk events
© 2016 Willis Towers Watson. All rights reserved. Proprietary and Confidential. For Willis Towers Watson and Willis Towers Watson client use only. 15
Risk Appetite
Key risk measures
Other risk constraintsRequired
capital
P/h focus
Return on capital
S/h focus
Profit volatility
S/h focus
Risk management processes, policies and procedures
DEFINING RISK APPETITE
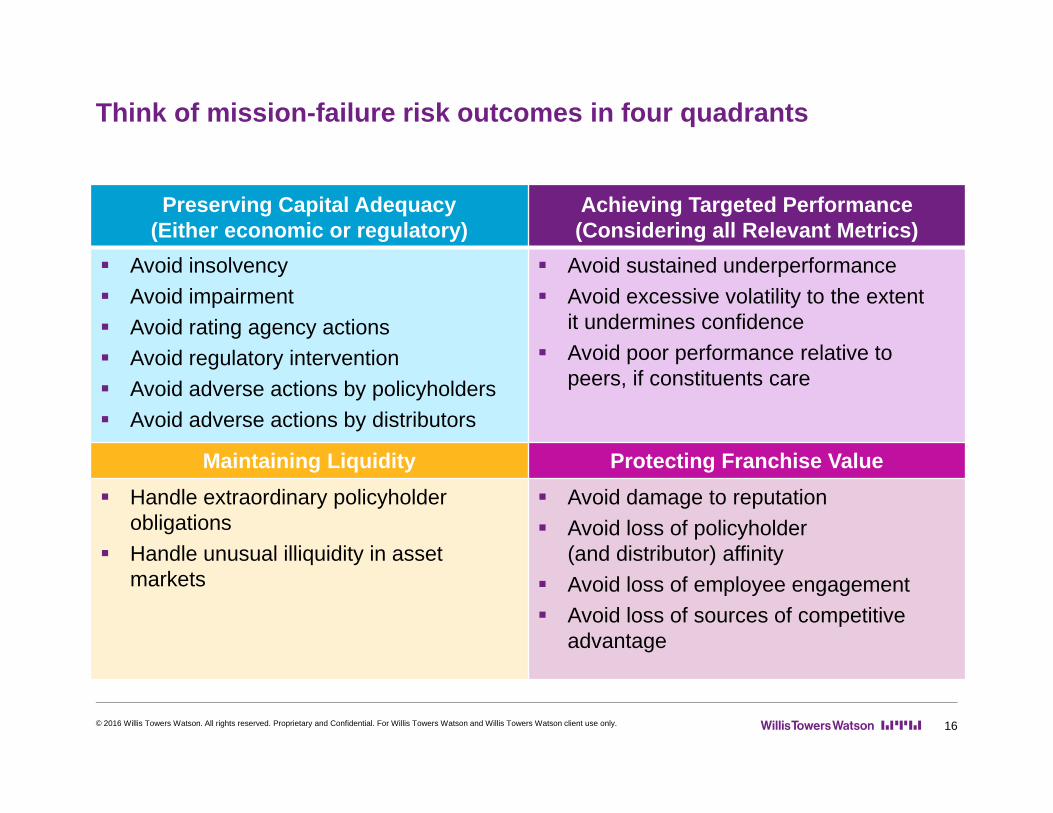
Think of mission-failure risk outcomes in four quadrants
Preserving Capital Adequacy(Either economic or regulatory)
Achieving Targeted Performance(Considering all Relevant Metrics)
Avoid insolvency Avoid impairment Avoid rating agency actions Avoid regulatory intervention Avoid adverse actions by policyholders Avoid adverse actions by distributors
Avoid sustained underperformance Avoid excessive volatility to the extent
it undermines confidence Avoid poor performance relative to
peers, if constituents care
Maintaining Liquidity Protecting Franchise Value Handle extraordinary policyholder
obligations Handle unusual illiquidity in asset
markets
Avoid damage to reputation Avoid loss of policyholder
(and distributor) affinity Avoid loss of employee engagement Avoid loss of sources of competitive
advantage
16© 2016 Willis Towers Watson. All rights reserved. Proprietary and Confidential. For Willis Towers Watson and Willis Towers Watson client use only.
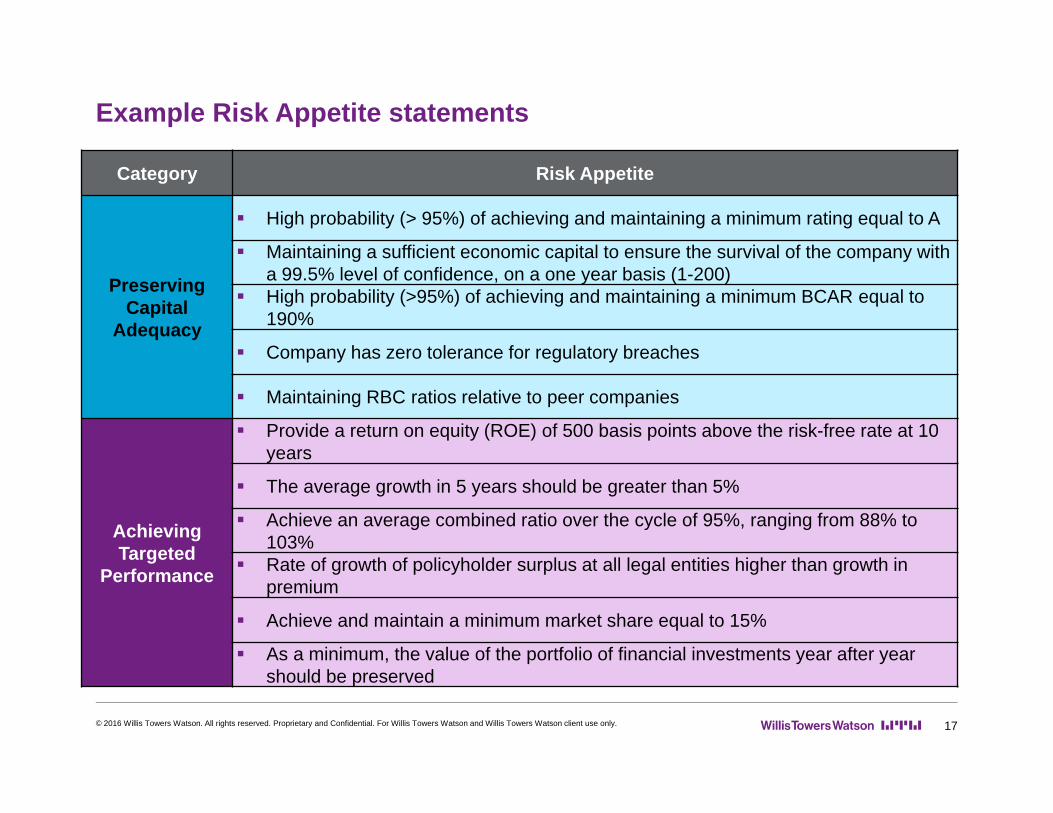
Example Risk Appetite statements
17
Category Risk Appetite
PreservingCapital
Adequacy
High probability (> 95%) of achieving and maintaining a minimum rating equal to A
Maintaining a sufficient economic capital to ensure the survival of the company with a 99.5% level of confidence, on a one year basis (1-200)
High probability (>95%) of achieving and maintaining a minimum BCAR equal to 190%
Company has zero tolerance for regulatory breaches
Maintaining RBC ratios relative to peer companies
Achieving Targeted
Performance
Provide a return on equity (ROE) of 500 basis points above the risk-free rate at 10 years
The average growth in 5 years should be greater than 5%
Achieve an average combined ratio over the cycle of 95%, ranging from 88% to 103%
Rate of growth of policyholder surplus at all legal entities higher than growth in premium
Achieve and maintain a minimum market share equal to 15%
As a minimum, the value of the portfolio of financial investments year after year should be preserved
© 2016 Willis Towers Watson. All rights reserved. Proprietary and Confidential. For Willis Towers Watson and Willis Towers Watson client use only.
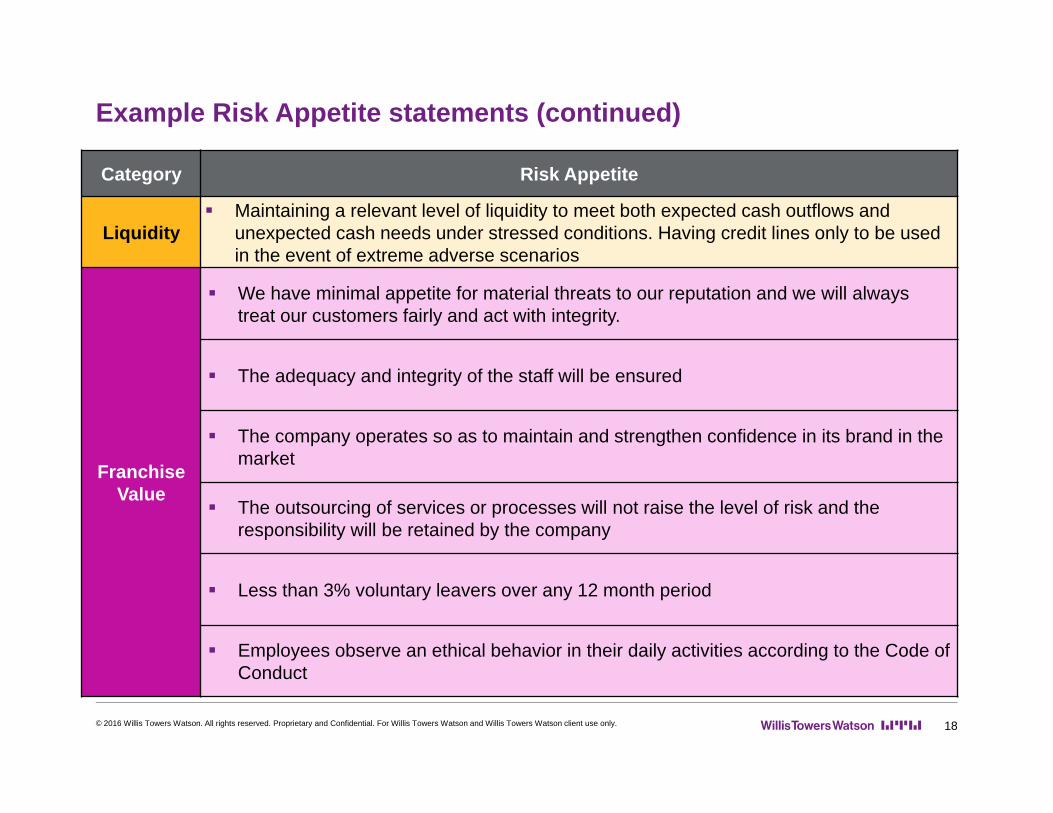
Example Risk Appetite statements (continued)
18
Category Risk Appetite
Liquidity Maintaining a relevant level of liquidity to meet both expected cash outflows and
unexpected cash needs under stressed conditions. Having credit lines only to be used in the event of extreme adverse scenarios
FranchiseValue
We have minimal appetite for material threats to our reputation and we will always treat our customers fairly and act with integrity.
The adequacy and integrity of the staff will be ensured
The company operates so as to maintain and strengthen confidence in its brand in the market
The outsourcing of services or processes will not raise the level of risk and the responsibility will be retained by the company
Less than 3% voluntary leavers over any 12 month period
Employees observe an ethical behavior in their daily activities according to the Code of Conduct
© 2016 Willis Towers Watson. All rights reserved. Proprietary and Confidential. For Willis Towers Watson and Willis Towers Watson client use only.
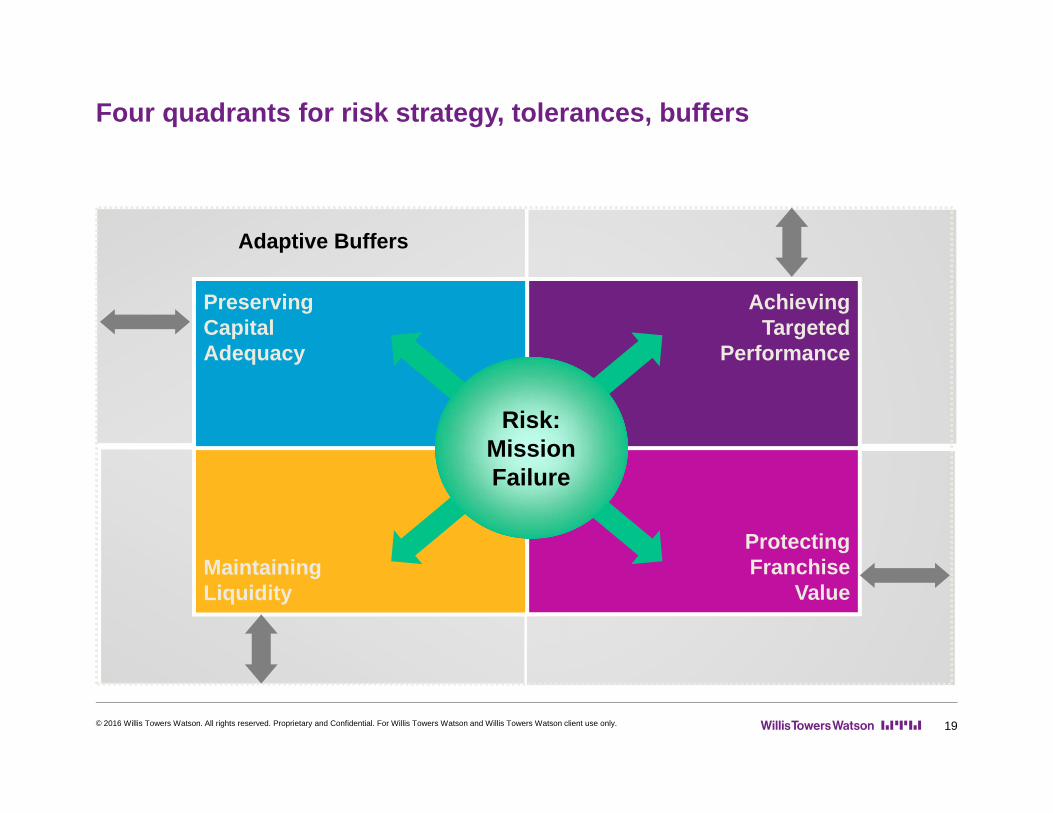
Four quadrants for risk strategy, tolerances, buffers
© 2016 Willis Towers Watson. All rights reserved. Proprietary and Confidential. For Willis Towers Watson and Willis Towers Watson client use only. 19
Protecting Franchise
ValueMaintainingLiquidity
AchievingTargeted
Performance
PreservingCapitalAdequacy
Adaptive Buffers
Risk:Mission Failure
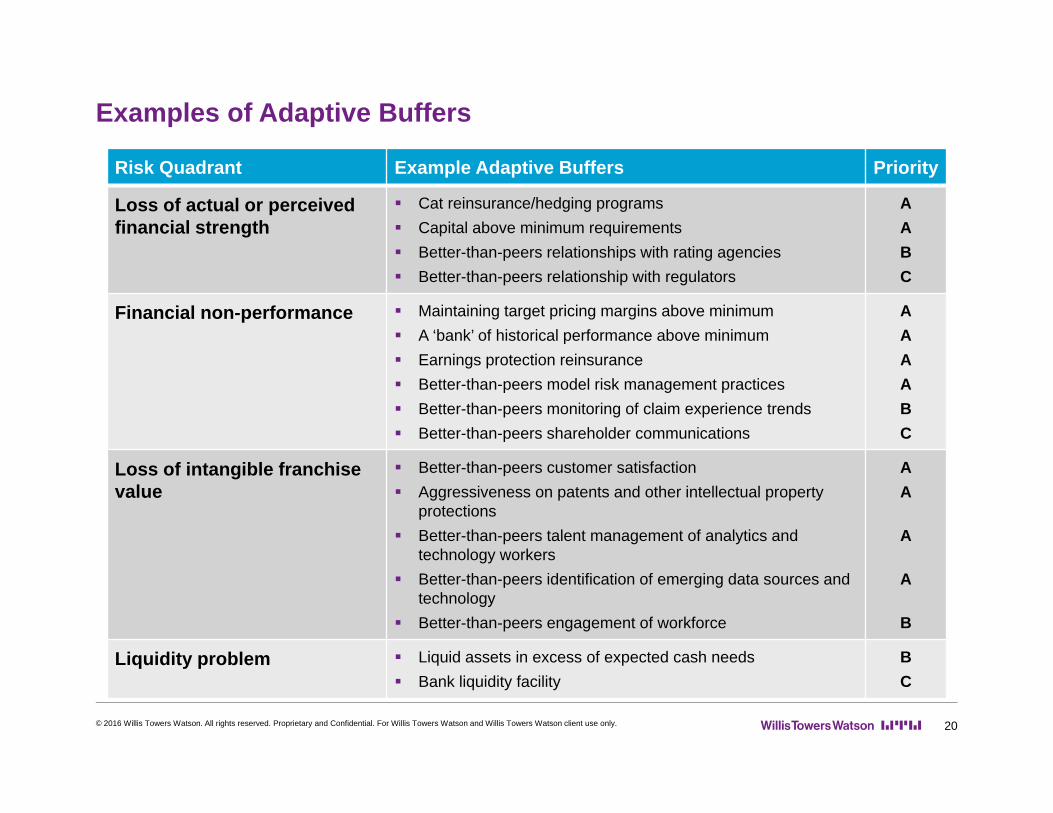
Examples of Adaptive Buffers
20
Risk Quadrant Example Adaptive Buffers Priority
Loss of actual or perceived financial strength
Cat reinsurance/hedging programs Capital above minimum requirements Better-than-peers relationships with rating agencies Better-than-peers relationship with regulators
AABC
Financial non-performance Maintaining target pricing margins above minimum A ‘bank’ of historical performance above minimum Earnings protection reinsurance Better-than-peers model risk management practices Better-than-peers monitoring of claim experience trends Better-than-peers shareholder communications
AAAABC
Loss of intangible franchisevalue
Better-than-peers customer satisfaction Aggressiveness on patents and other intellectual property
protections Better-than-peers talent management of analytics and
technology workers Better-than-peers identification of emerging data sources and
technology Better-than-peers engagement of workforce
AA
A
A
B
Liquidity problem Liquid assets in excess of expected cash needs Bank liquidity facility
BC
© 2016 Willis Towers Watson. All rights reserved. Proprietary and Confidential. For Willis Towers Watson and Willis Towers Watson client use only.
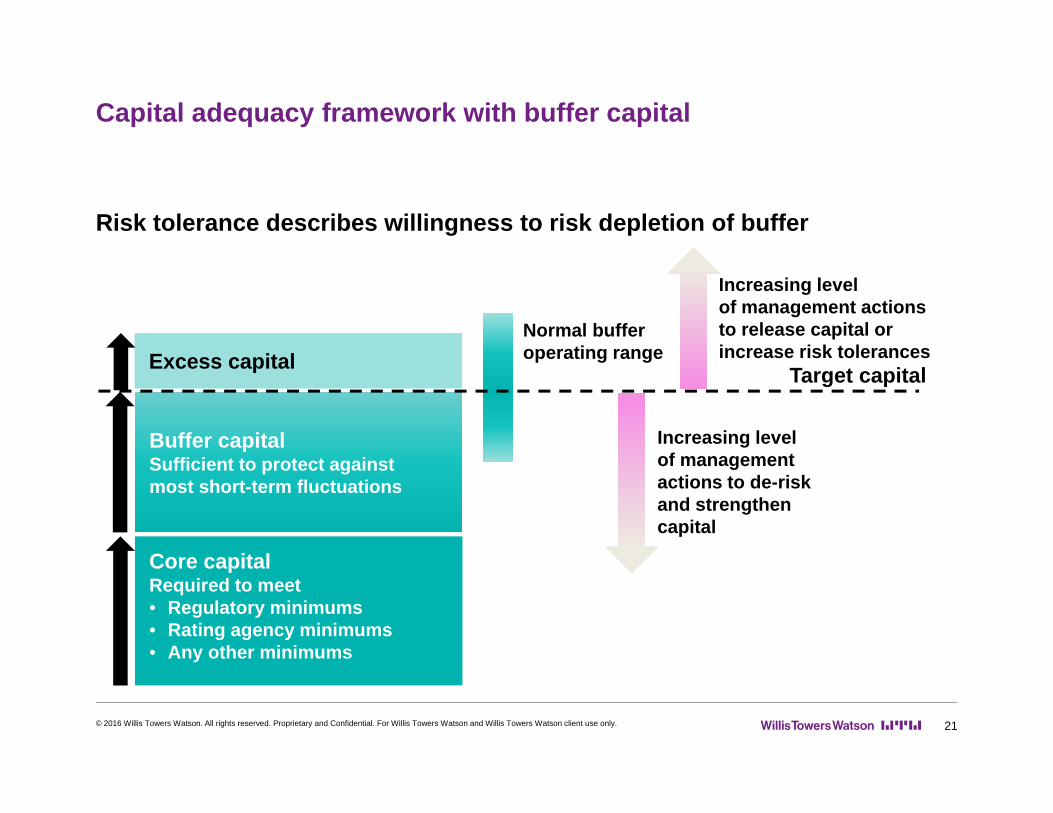
Capital adequacy framework with buffer capital
© 2016 Willis Towers Watson. All rights reserved. Proprietary and Confidential. For Willis Towers Watson and Willis Towers Watson client use only. 21
Risk tolerance describes willingness to risk depletion of buffer
Core capitalRequired to meet• Regulatory minimums• Rating agency minimums• Any other minimums
Buffer capitalSufficient to protect against most short-term fluctuations
Normal buffer operating range
Increasing level of management actions to de-riskand strengthen capital
Target capitalExcess capital
Increasing level of management actions to release capital or increase risk tolerances
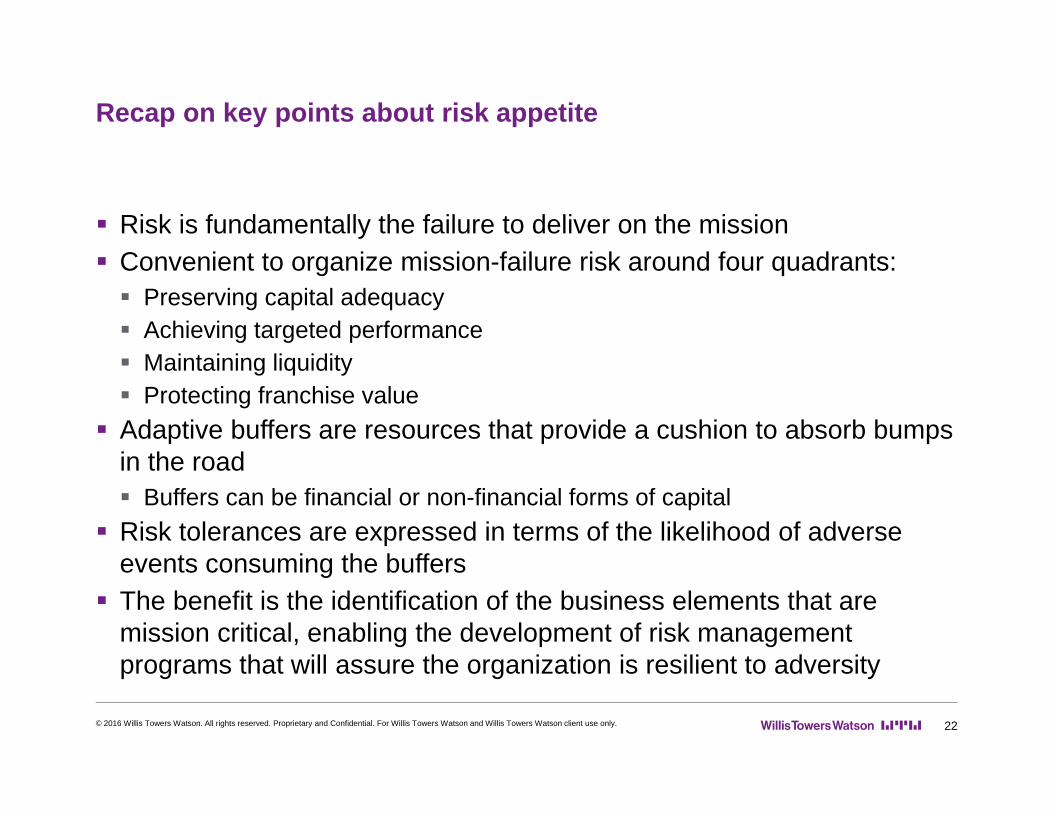
Recap on key points about risk appetite
© 2016 Willis Towers Watson. All rights reserved. Proprietary and Confidential. For Willis Towers Watson and Willis Towers Watson client use only. 22
Risk is fundamentally the failure to deliver on the mission Convenient to organize mission-failure risk around four quadrants: Preserving capital adequacy Achieving targeted performance Maintaining liquidity Protecting franchise value
Adaptive buffers are resources that provide a cushion to absorb bumps in the road Buffers can be financial or non-financial forms of capital
Risk tolerances are expressed in terms of the likelihood of adverse events consuming the buffers
The benefit is the identification of the business elements that are mission critical, enabling the development of risk management programs that will assure the organization is resilient to adversity
© 2016 Willis Towers Watson. All rights reserved. Proprietary and Confidential. For Willis Towers Watson and Willis Towers Watson client use only. 23
Tying Risk Limits to Risk Tolerances
Link between risk tolerances and risk limits
24
Risk tolerances are enterprise-level metrics that quantify the amount of aggregate risk that a company is willing to accept Usually it is expressed in probabilistic terms, time horizons and mission impairment
impacts In contrast risk limits are more granular and help to implement the risk
tolerances They are often expressed employing practical metrics that are measurable and
relevant to managers based on authority levels, like underwriting or claim settlement authority
Effective risk limits help management execute its plan while staying within chosen risk tolerances
Several practical issues become apparent How to move down from the enterprise all-risk-driver view to specific individual risk
drivers How one tests if the risk limit metrics have the right linkage to the enterprise risk
tolerances?
© 2016 Willis Towers Watson. All rights reserved. Proprietary and Confidential. For Willis Towers Watson and Willis Towers Watson client use only.
How risk budgets can help
25
Risk budgets are essentially a top-down exercise in which senior management actively deploys the total risk-taking capacity of the enterprise to the various risk drivers/business units When the capacity has been allocated, actual levels of deployment can then
be actively monitored to assure they stay within agreed upon targets In essence risk budgets are the highest-level set of risk limits imposed
on each business portfolio They can focus on either specific risk drivers that are problematic, or They can focus on the total risk budget for a business unit, without specifying
budgets by risk factor
© 2016 Willis Towers Watson. All rights reserved. Proprietary and Confidential. For Willis Towers Watson and Willis Towers Watson client use only.
Risk budgeting can help create the linkages between enterprise risk tolerances and local risk limits
26
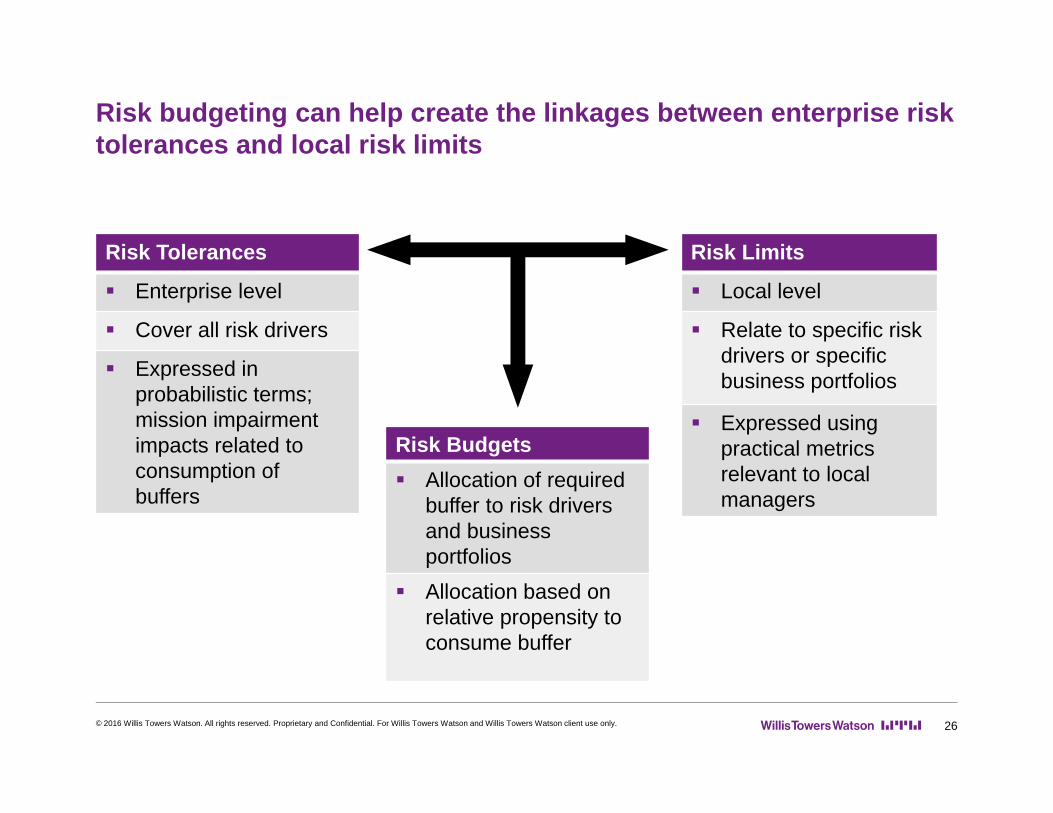
Risk Tolerances
Enterprise level
Cover all risk drivers
Expressed in probabilistic terms; mission impairment impacts related to consumption of buffers
Risk Limits
Local level
Relate to specific risk drivers or specific business portfolios
Expressed using practical metrics relevant to local managers
Risk Budgets Allocation of required
buffer to risk drivers and business portfolios
Allocation based on relative propensity to consume buffer
© 2016 Willis Towers Watson. All rights reserved. Proprietary and Confidential. For Willis Towers Watson and Willis Towers Watson client use only.
Implementing risk tolerances may require an alternative implementation of enterprise risk models
27
A risk measurement model is a system that measures the financial impact of risk drivers on a business portfolio The enterprise model is the special case
First-generation models were built at the business unit level first and then aggregated to the enterprise level This approach produces accurate results, yet it is cumbersome to maintain
and run For a risk model to be useful it should produce results near real-time
and be transparent, and flexible Enterprise models could leverage the business unit models through the
use of loss functions to proxy the business results The loss functions are capable of being updated as the business and
environment changes
© 2016 Willis Towers Watson. All rights reserved. Proprietary and Confidential. For Willis Towers Watson and Willis Towers Watson client use only.

28
Risk Appetite Case Study
© 2016 Willis Towers Watson. All rights reserved. Proprietary and Confidential. For Willis Towers Watson and Willis Towers Watson client use only.

Common characteristics
29
Board members with varied backgrounds and different industries No/minimal Board engagement No common definition or understanding of “risk” No common perspective on amount of risk currently being accepted No common perspective on desired amount of risk to accept No risk appetite or risk tolerance statements
© 2016 Willis Towers Watson. All rights reserved. Proprietary and Confidential. For Willis Towers Watson and Willis Towers Watson client use only.
CASE STUDY
Common objectives
© 2016 Willis Towers Watson. All rights reserved. Proprietary and Confidential. For Willis Towers Watson and Willis Towers Watson client use only. 30
Establish a common foundation of risk Develop preliminary risk appetite and risk tolerance statements Validate and refine the preliminary risk appetite/tolerance statements
CASE STUDY
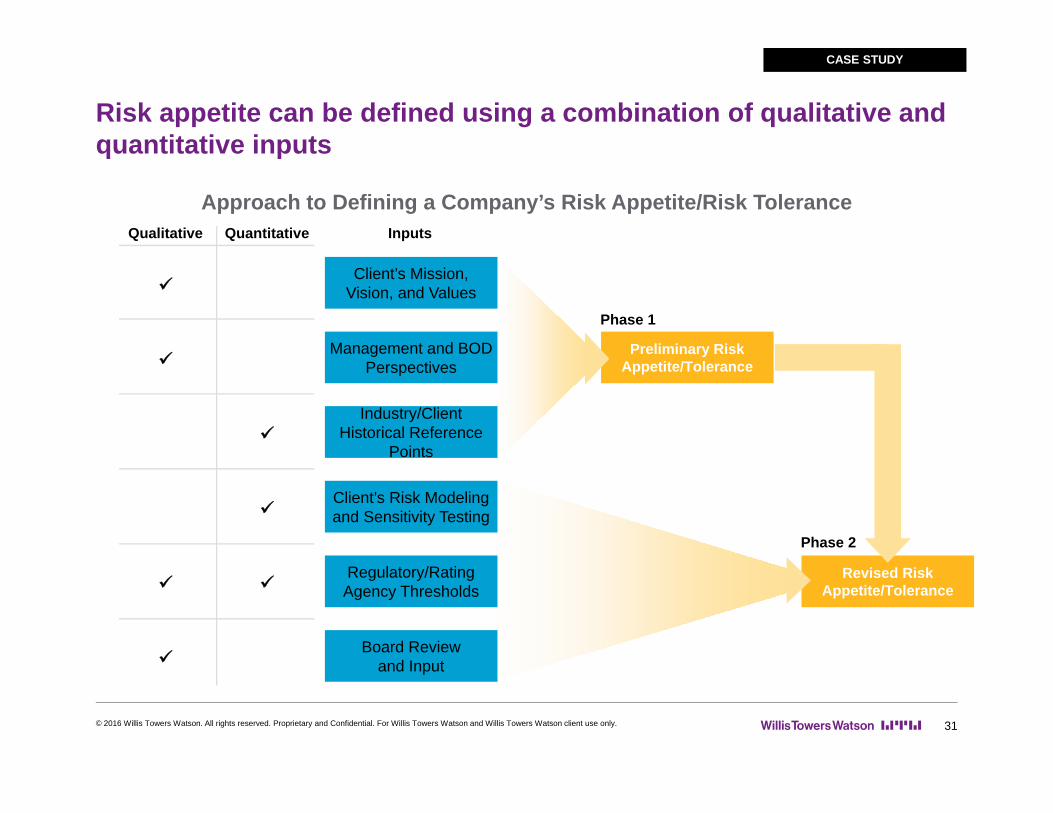
Risk appetite can be defined using a combination of qualitative and quantitative inputs
© 2016 Willis Towers Watson. All rights reserved. Proprietary and Confidential. For Willis Towers Watson and Willis Towers Watson client use only. 31
CASE STUDY
Approach to Defining a Company’s Risk Appetite/Risk ToleranceInputsQuantitativeQualitative
Preliminary Risk
Appetite/Tolerance
Phase 1
Phase 2
Revised Risk Appetite/Tolerance
Client’s Mission, Vision, and Values
Management and BOD Perspectives
Industry/Client Historical Reference
Points
Client’s Risk Modeling and Sensitivity Testing
Regulatory/Rating Agency Thresholds
Board Review and Input
An initial phase might be aimed at establishing a common understanding and risk vocabulary
© 2016 Willis Towers Watson. All rights reserved. Proprietary and Confidential. For Willis Towers Watson and Willis Towers Watson client use only. 32
1. Capture existing perspectives on risk2. Measure how much uniformity there is among the group3. Use a common set of questions4. Play back the results
CASE STUDY
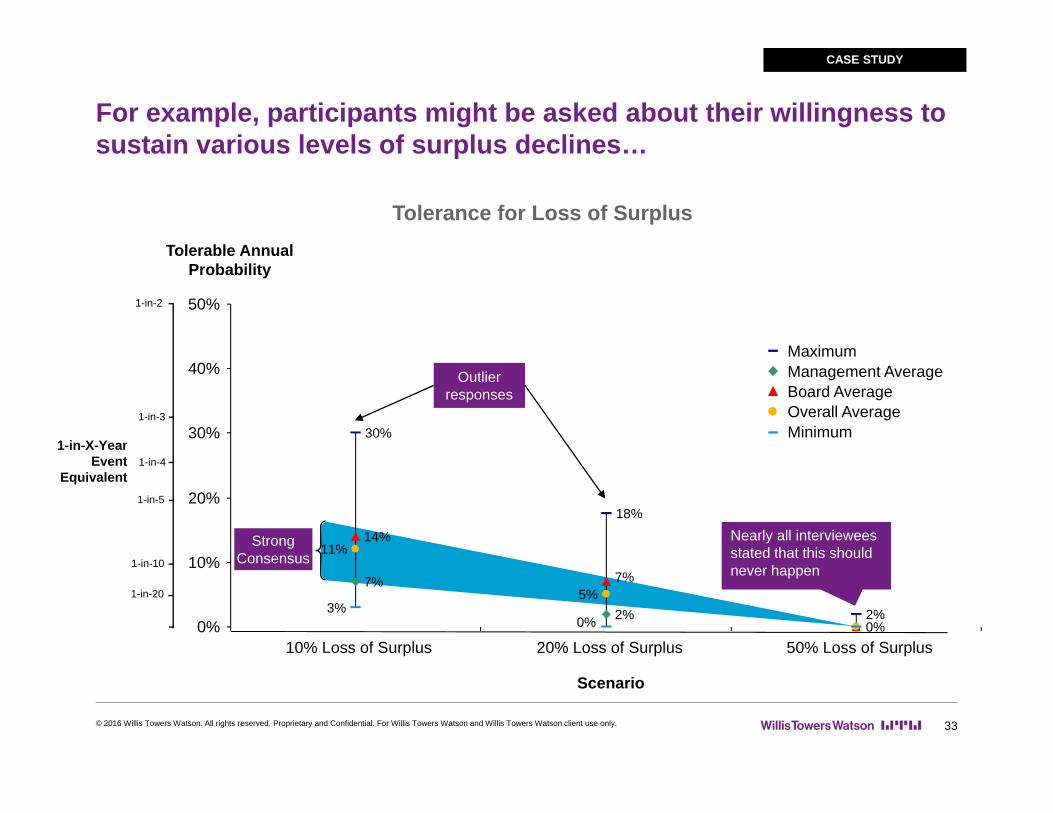
For example, participants might be asked about their willingness to sustain various levels of surplus declines…
© 2016 Willis Towers Watson. All rights reserved. Proprietary and Confidential. For Willis Towers Watson and Willis Towers Watson client use only. 33
CASE STUDY
Tolerance for Loss of SurplusTolerable Annual
Probability
Scenario
1-in-X-Year Event
Equivalent
1-in-10
1-in-5
1-in-3
1-in-2
1-in-20
1-in-4
Outlier responses
Nearly all interviewees stated that this should never happen
StrongConsensus
30%
18%
7%
14%
5%3%
7%
11%
0%
10%
20%
30%
40%
50%
2% 2%0% 0%10% Loss of Surplus 20% Loss of Surplus 50% Loss of Surplus
MaximumManagement AverageBoard AverageOverall AverageMinimum
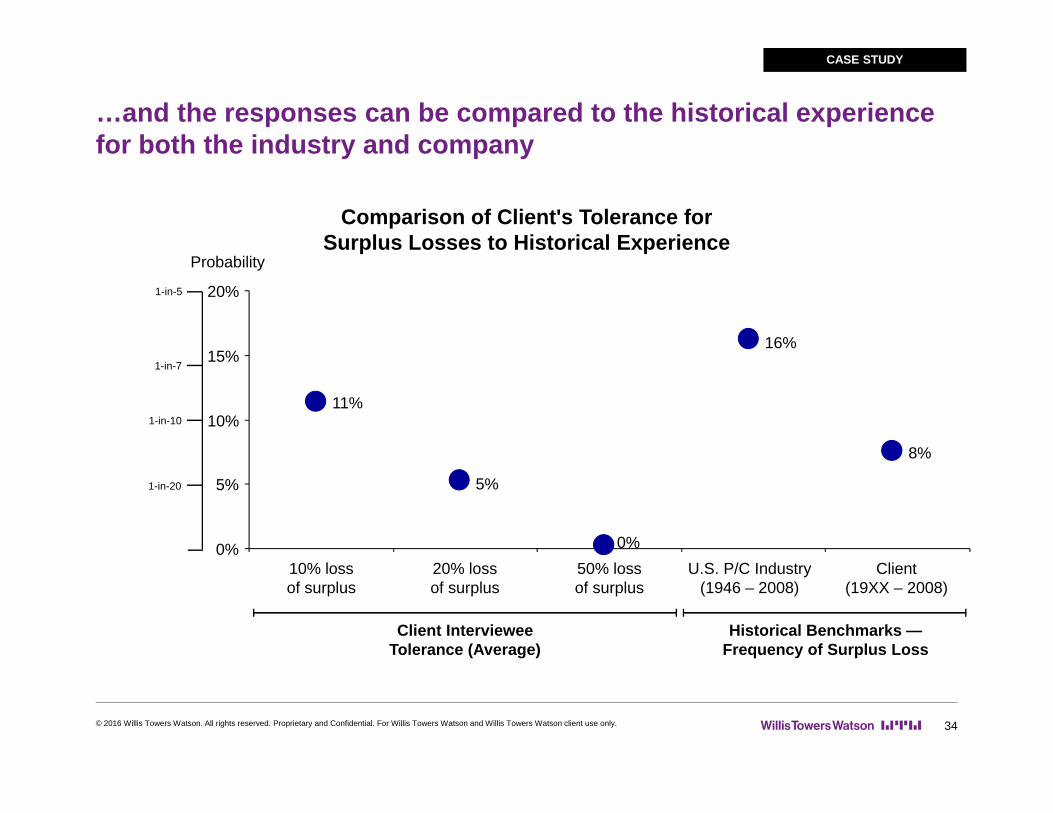
…and the responses can be compared to the historical experience for both the industry and company
© 2016 Willis Towers Watson. All rights reserved. Proprietary and Confidential. For Willis Towers Watson and Willis Towers Watson client use only. 34
CASE STUDY
Probability
1-in-20
1-in-10
1-in-7
1-in-5
Comparison of Client's Tolerance forSurplus Losses to Historical Experience
Client Interviewee Tolerance (Average)
Historical Benchmarks —Frequency of Surplus Loss
11%
16%
0%
8%
5%
0%
5%
10%
15%
20%
10% lossof surplus
20% lossof surplus
50% lossof surplus
U.S. P/C Industry(1946 – 2008)
Client(19XX – 2008)
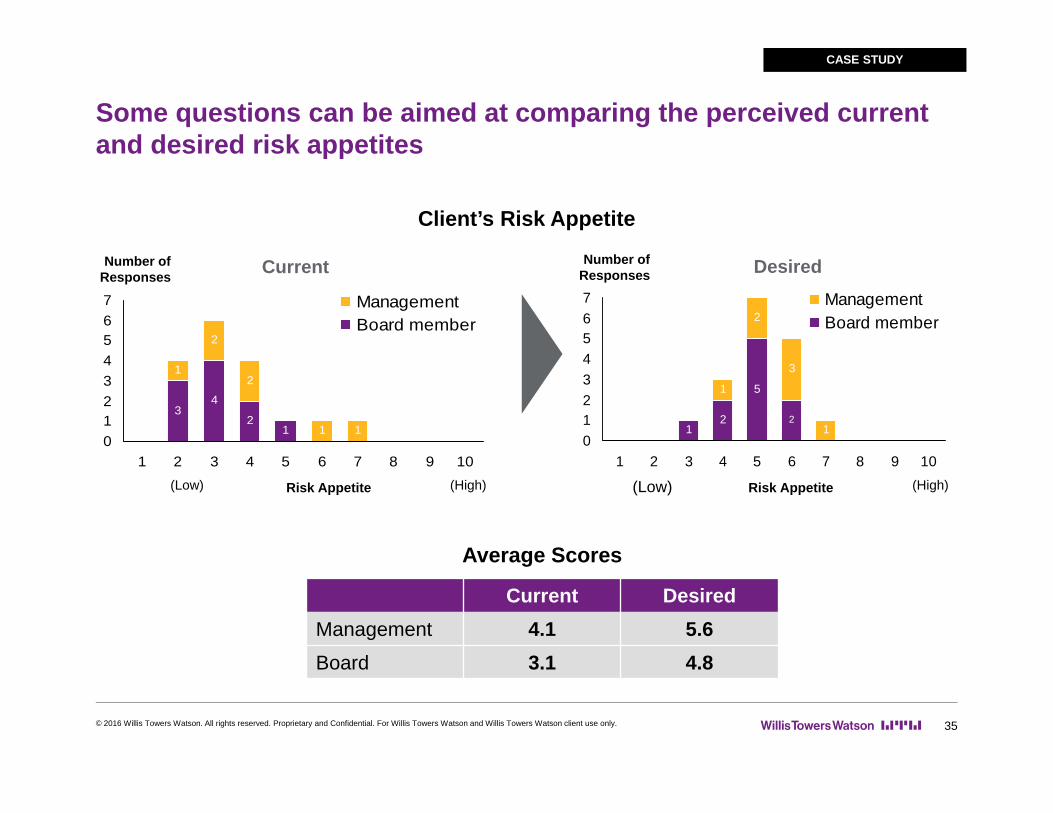
Some questions can be aimed at comparing the perceived current and desired risk appetites
© 2016 Willis Towers Watson. All rights reserved. Proprietary and Confidential. For Willis Towers Watson and Willis Towers Watson client use only. 35
CASE STUDY
2
1 12
1
34
1
2
01234567
1 2 3 4 5 6 7 8 9 10
ManagementBoard member
1
2
3
112
5
2
01234567
1 2 3 4 5 6 7 8 9 10
ManagementBoard member
Client’s Risk Appetite
(Low) (High)
Number of Responses Current
Current DesiredManagement 4.1 5.6Board 3.1 4.8
Risk Appetite
Average Scores
(Low) (High)
Number of Responses Desired
Risk Appetite
This interview/feedback approach can lay the foundation for developing a risk appetite statement
© 2016 Willis Towers Watson. All rights reserved. Proprietary and Confidential. For Willis Towers Watson and Willis Towers Watson client use only. 36
Consistent vocabulary Consistent appetite for risk Preliminary risk appetite statement
CASE STUDY
Additional phases involve validation and refinement
© 2016 Willis Towers Watson. All rights reserved. Proprietary and Confidential. For Willis Towers Watson and Willis Towers Watson client use only. 37
In subsequent phases: Quantify the existing risk Compare results with the preliminary risk tolerances Some incompatibility is inevitable
Refine the preliminary risk appetite statement Develop plan to move from existing to target Establish risk monitoring and reporting processes Establish risk limits Refine risk modeling/quantification
CASE STUDY
38
Risk Tolerances/Limits
© 2016 Willis Towers Watson. All rights reserved. Proprietary and Confidential. For Willis Towers Watson and Willis Towers Watson client use only.
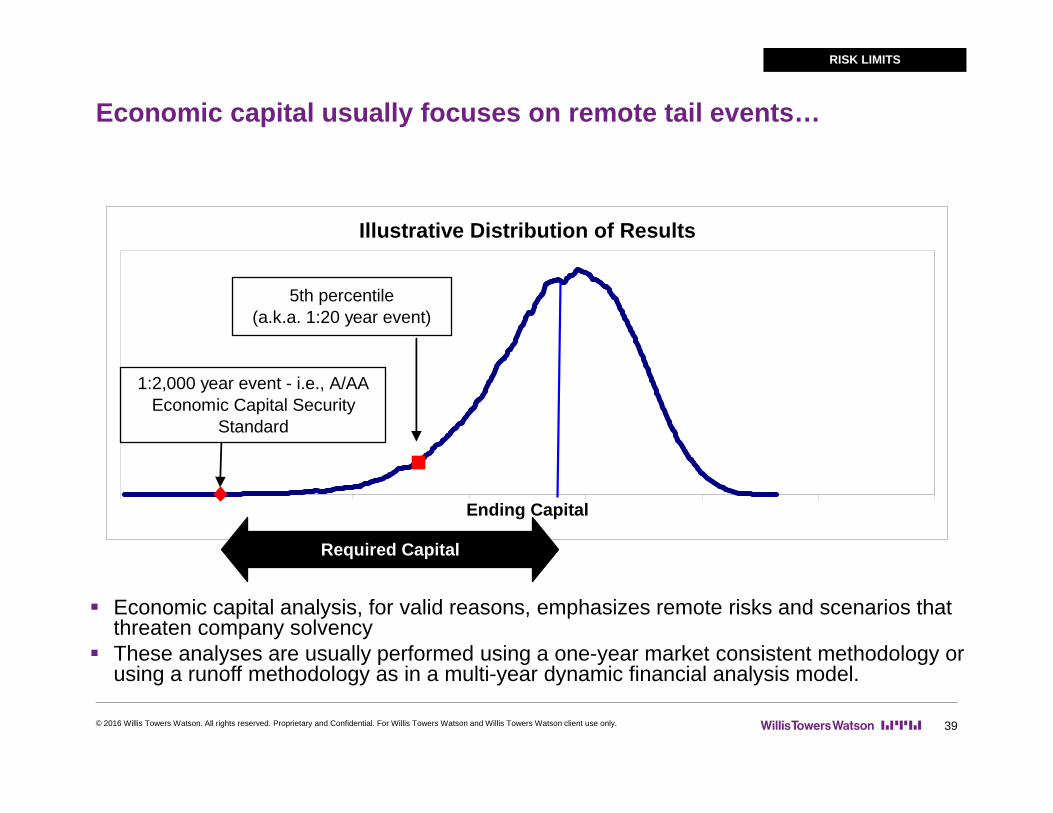
Economic capital usually focuses on remote tail events…
© 2016 Willis Towers Watson. All rights reserved. Proprietary and Confidential. For Willis Towers Watson and Willis Towers Watson client use only. 39
RISK LIMITS
Economic capital analysis, for valid reasons, emphasizes remote risks and scenarios that threaten company solvency
These analyses are usually performed using a one-year market consistent methodology or using a runoff methodology as in a multi-year dynamic financial analysis model.
Illustrative Distribution of Results
Ending Capital
5th percentile (a.k.a. 1:20 year event)
Required Capital
1:2,000 year event - i.e., A/AA Economic Capital Security
Standard
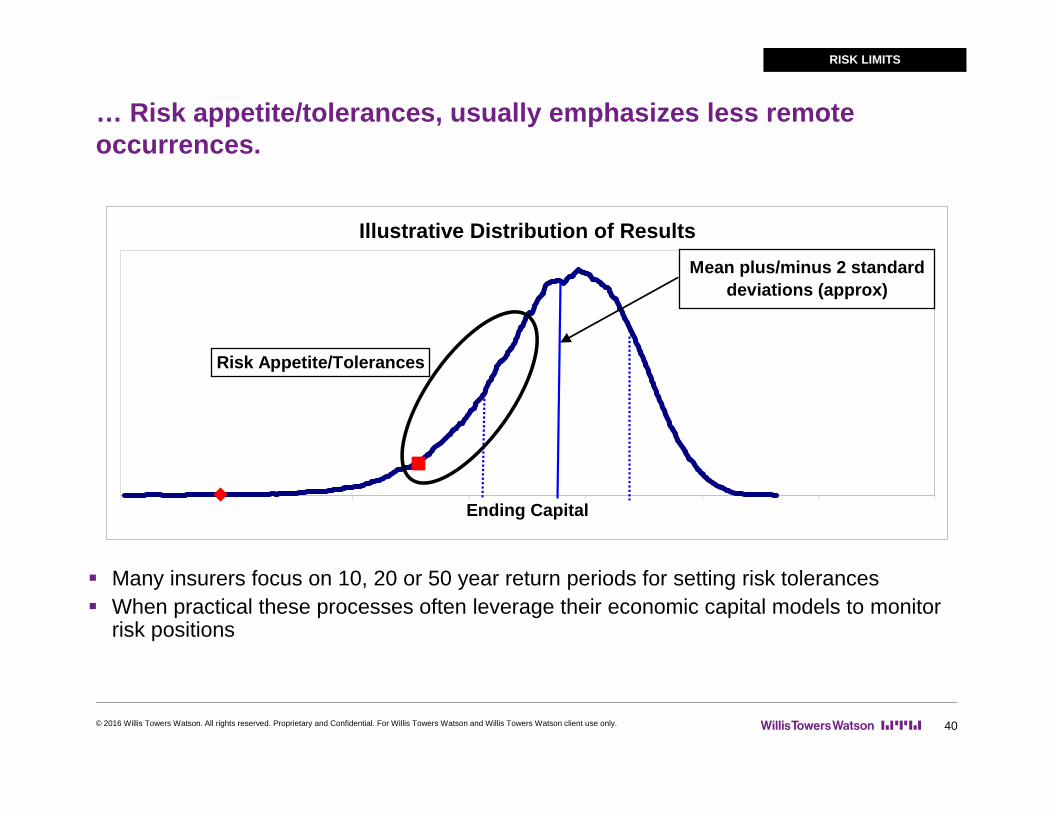
… Risk appetite/tolerances, usually emphasizes less remote occurrences.
© 2016 Willis Towers Watson. All rights reserved. Proprietary and Confidential. For Willis Towers Watson and Willis Towers Watson client use only. 40
RISK LIMITS
Many insurers focus on 10, 20 or 50 year return periods for setting risk tolerances When practical these processes often leverage their economic capital models to monitor
risk positions
Illustrative Distribution of Results
Ending Capital
Mean plus/minus 2 standard deviations (approx)
Risk Appetite/Tolerances
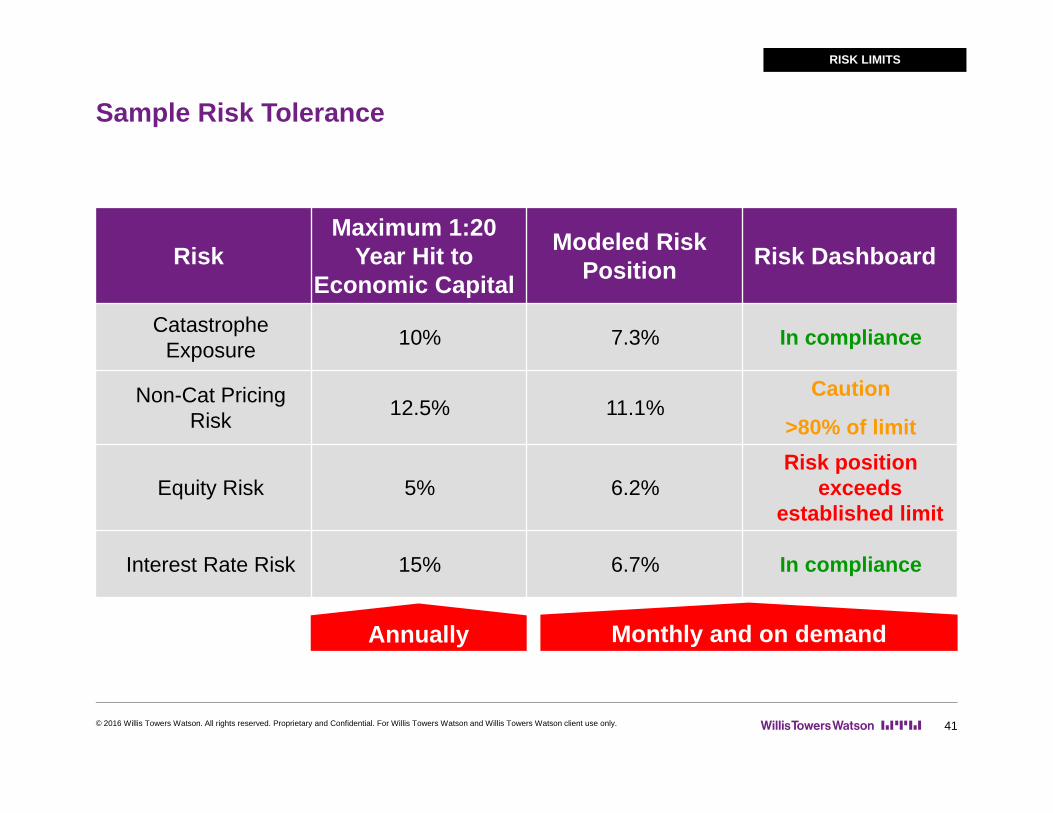
Sample Risk Tolerance
© 2016 Willis Towers Watson. All rights reserved. Proprietary and Confidential. For Willis Towers Watson and Willis Towers Watson client use only. 41
RISK LIMITS
RiskMaximum 1:20
Year Hit to Economic Capital
Modeled Risk Position Risk Dashboard
Catastrophe Exposure 10% 7.3% In compliance
Non-Cat Pricing Risk 12.5% 11.1%
Caution
>80% of limit
Equity Risk 5% 6.2%Risk position
exceeds established limit
Interest Rate Risk 15% 6.7% In compliance
Annually Monthly and on demand
From Tolerances to Limits
© 2016 Willis Towers Watson. All rights reserved. Proprietary and Confidential. For Willis Towers Watson and Willis Towers Watson client use only. 42
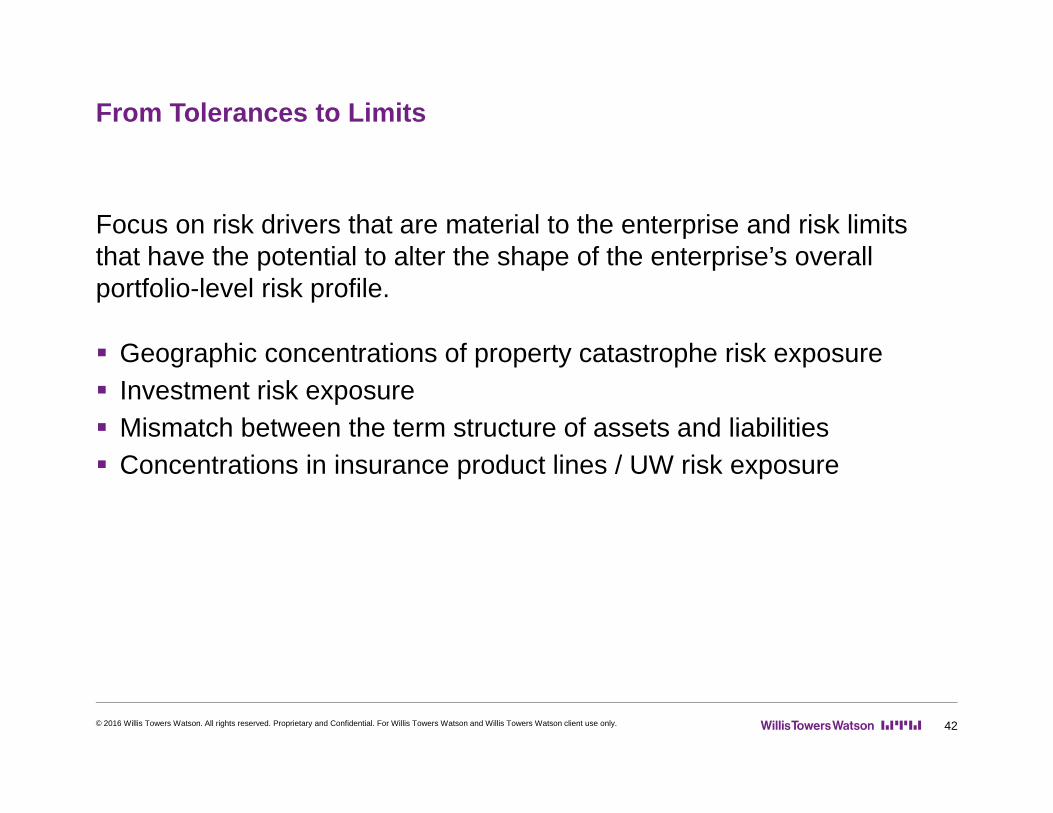
Focus on risk drivers that are material to the enterprise and risk limits that have the potential to alter the shape of the enterprise’s overall portfolio-level risk profile.
Geographic concentrations of property catastrophe risk exposure Investment risk exposure Mismatch between the term structure of assets and liabilities Concentrations in insurance product lines / UW risk exposure
Challenges linking tolerances and limits
© 2016 Willis Towers Watson. All rights reserved. Proprietary and Confidential. For Willis Towers Watson and Willis Towers Watson client use only. 43
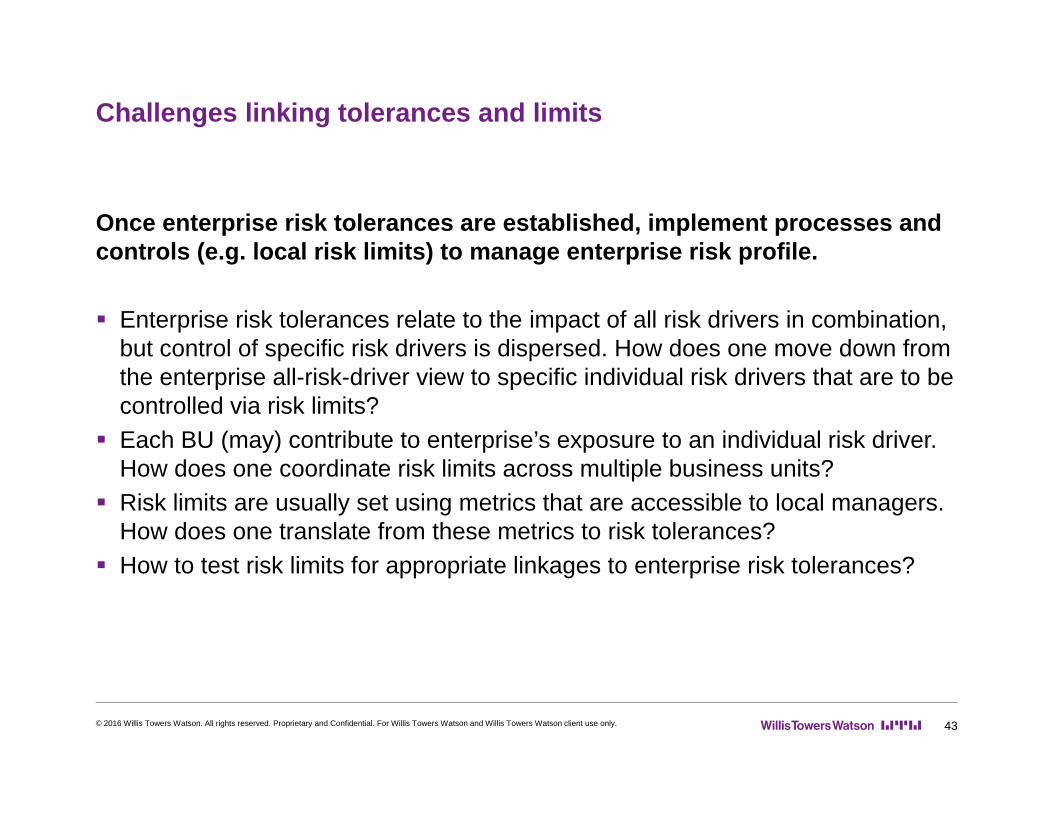
Once enterprise risk tolerances are established, implement processes and controls (e.g. local risk limits) to manage enterprise risk profile.
Enterprise risk tolerances relate to the impact of all risk drivers in combination, but control of specific risk drivers is dispersed. How does one move down from the enterprise all-risk-driver view to specific individual risk drivers that are to be controlled via risk limits?
Each BU (may) contribute to enterprise’s exposure to an individual risk driver. How does one coordinate risk limits across multiple business units?
Risk limits are usually set using metrics that are accessible to local managers. How does one translate from these metrics to risk tolerances?
How to test risk limits for appropriate linkages to enterprise risk tolerances?

© 2016 Willis Towers Watson. All rights reserved. Proprietary and Confidential. For Willis Towers Watson and Willis Towers Watson client use only. 44
Risk Limits Case Study
Mutual insurer linking risk tolerances and risk limits
© 2016 Willis Towers Watson. All rights reserved. Proprietary and Confidential. For Willis Towers Watson and Willis Towers Watson client use only. 45
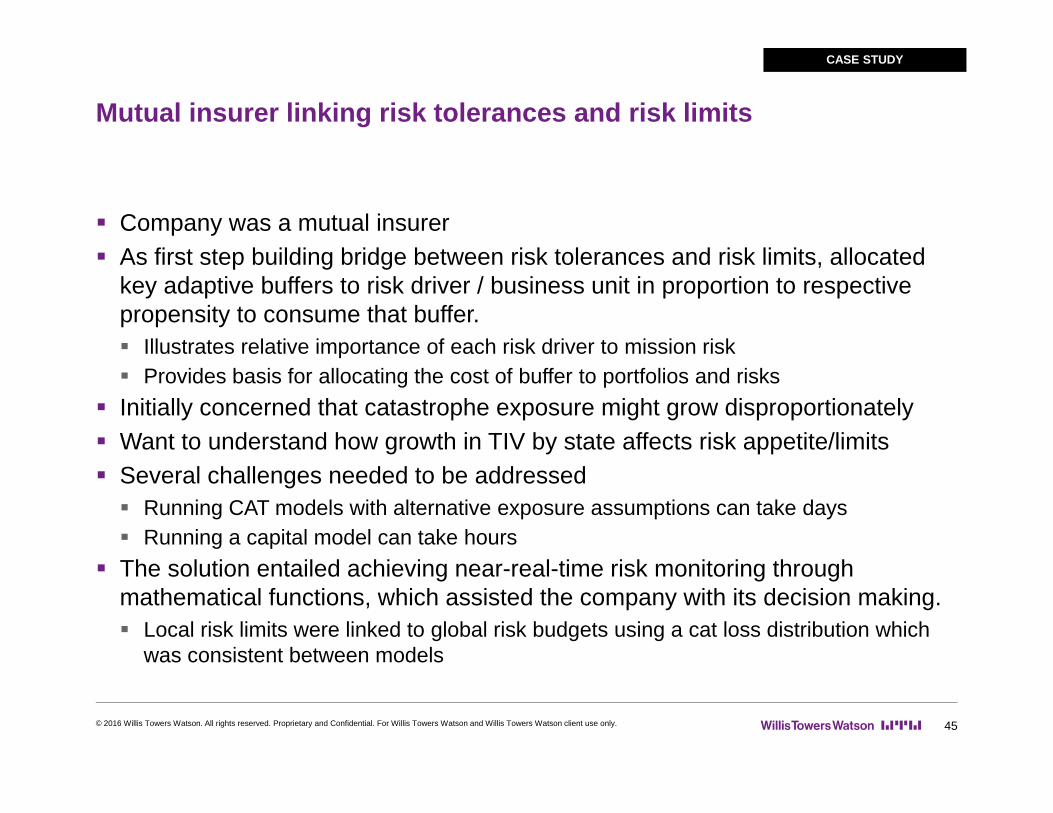
Company was a mutual insurer As first step building bridge between risk tolerances and risk limits, allocated
key adaptive buffers to risk driver / business unit in proportion to respective propensity to consume that buffer. Illustrates relative importance of each risk driver to mission risk Provides basis for allocating the cost of buffer to portfolios and risks
Initially concerned that catastrophe exposure might grow disproportionately Want to understand how growth in TIV by state affects risk appetite/limits Several challenges needed to be addressed Running CAT models with alternative exposure assumptions can take days Running a capital model can take hours
The solution entailed achieving near-real-time risk monitoring through mathematical functions, which assisted the company with its decision making. Local risk limits were linked to global risk budgets using a cat loss distribution which
was consistent between models
CASE STUDY
Multiple runs of the risk measurement and enterprise risk model
46
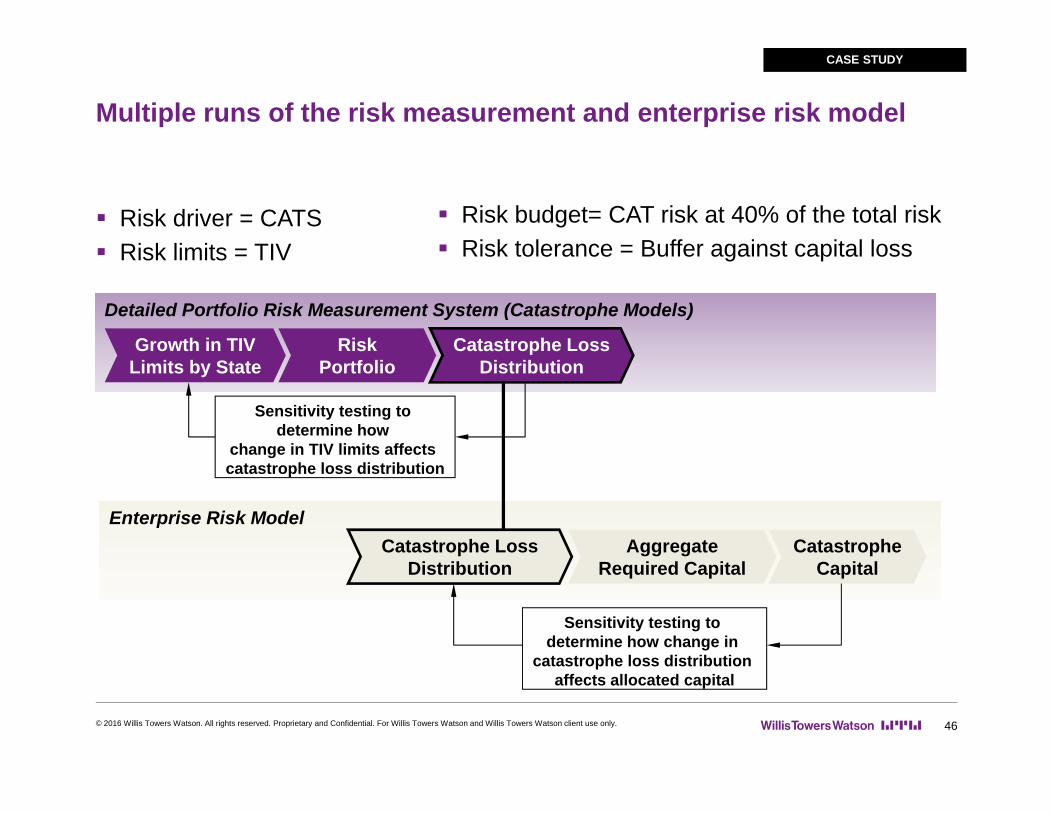
Risk driver = CATS Risk limits = TIV
Risk budget= CAT risk at 40% of the total risk Risk tolerance = Buffer against capital loss
Enterprise Risk Model
Detailed Portfolio Risk Measurement System (Catastrophe Models)
Risk Portfolio
Growth in TIV Limits by State
Catastrophe LossDistribution
Catastrophe LossDistribution
AggregateRequired Capital
CatastropheCapital
Sensitivity testing to determine how change in
catastrophe loss distribution affects allocated capital
Sensitivity testing to determine how
change in TIV limits affects catastrophe loss distribution
CASE STUDY
© 2016 Willis Towers Watson. All rights reserved. Proprietary and Confidential. For Willis Towers Watson and Willis Towers Watson client use only.