linkage disequilibrium decay and haplotype block structure
TRANSCRIPT
Copyright � 2008 by the Genetics Society of AmericaDOI: 10.1534/genetics.107.084277
Linkage Disequilibrium Decay and Haplotype Block Structure in the Pig
Andreia J. Amaral, Hendrik-Jan Megens,1 Richard P. M. A. Crooijmans,Henri C. M. Heuven and Martien A. M. Groenen
Animal Breeding and Genomics Centre, Wageningen UR, 6700AH, Wageningen, The Netherlands
Manuscript received November 9, 2007Accepted for publication February 26, 2008
ABSTRACT
Linkage disequilibrium (LD) may reveal much about domestication and breed history. An investigationwas conducted, to analyze the extent of LD, haploblock partitioning, and haplotype diversity withinhaploblocks across several pig breeds from China and Europe and in European wild boar. In total, 371single-nucleotide-polymorphisms located in three genomic regions were genotyped. The extent of LDdiffered significantly between European and Chinese breeds, extending up to 2 cM in Europe and up to0.05 cM in China. In European breeds, LD extended over large haploblocks up to 400 kb, whereas inChinese breeds the extent of LD was smaller and generally did not exceed 10 kb. The European wild boarshowed an intermediate level of LD between Chinese and European breeds. In Europe, the extent of LDalso differed according to genomic region. Chinese breeds showed a higher level of haplotype diversity andshared high levels of frequent haplotypes with Large White, Landrace, and Duroc. The extent of LD differsbetween both centers of pig domestication, being higher in Europe. Two hypotheses can explain thesefindings. First, the European ancestral stock had a higher level of LD. Second, modern breeding programsincreased the extent of LD in Europe and caused differences of LD between genomic regions. Large White,Landrace, and Duroc showed evidence of past introgression from Chinese breeds.
LINKAGE disequilibrium (LD), which refers to non-random association of alleles at different loci,
has received increasing attention in recent years andhas gained unprecedented momentum as a result of theavailability of genome sequences and large numbersof identified single-nucleotide polymorphisms (SNPs).The Human HapMap project (International Hapmap
Consortium 2003, 2005) has revealed a large degreeof variation of LD across the human genome and theintrinsic difficulty of analysis of genomewide LD data(Reich et al. 2001). It also showed the presence of im-portant differences in LD among human populations,which result from differences in population history anddemography (Reich et al. 2001; Ardlie et al. 2002).Furthermore, the detailed information on genomic hap-lotype structure was shown to be of high utility for finemapping of genes responsible for complex multifacto-rial diseases (Rigby et al. 2006; Wright et al. 2006;Baessler et al. 2007; Wellcome Trust Case Control
Consortium 2007).Understanding the properties of LD in domesticated
animals is important because it underlies all forms ofgenetic mapping (Nordborg and Tavare 2002). LDcan reveal much about domestication and breed historybecause the distribution of LD is, in part, determined by
population history and demography (Pritchard andPrzeworski 2001; Tenesa et al.2007).
LD has been studied in a variety of domestic animalspecies, e.g., cattle (Farnir et al. 2000), sheep (McRae
et al. 2002), pigs (Nsengimana et al. 2004), dogs(Lindblad-Toh et al. 2005), and chickens (Aerts et al.2007). In some of these species, a substantial extent ofLD was found over several centimorgans and exceededthe extent of LD found in humans (Reich et al. 2001).This larger extent of LD in animal species may be due tosmall effective population sizes in commercially heldpopulations, and these may not be typical for the entirespecies. Dogs, for instance, show a large degree of varia-tion in LD patterns, reflecting both high variability of theancestor (wolf) and the result of low population sizes inbreed formation and maintenance (Lindblad-Toh et al.2005). In addition, most animal species are now knownto have complex domestication histories (Bruford et al.2003).
Pigs are among the most important domestic animals(Chen et al. 2007), being an important protein source.They are also an important animal model to study do-mestication because Chinese and European pigs’ an-cestors still exist (Giuffra et al. 2000). European andChinese pigs were domesticated independently fromEuropean and Asian subspecies of wild boar (Giuffra
et al. 2000; Larson et al. 2005). Studies on mitochon-drial DNA suggest the occurrence of introgression ofAsian domestic pigs into European breeds after domes-
1Corresponding author: Animal Breeding and Genomics Centre, Wage-ningen UR, P.O. Box 338, 6700AH, Wageningen, The Netherlands.E-mail: [email protected]
Genetics 179: 569–579 (May 2008)
Dow
nloaded from https://academ
ic.oup.com/genetics/article/179/1/569/6064744 by guest on 30 January 2022
tication (Giuffra et al. 2000; Fang and Andersson
2006). More recently, Larson et al. (2007) demon-strated that domestic pigs of Near Eastern ancestry wereintroduced into Europe during the Neolithic. Euro-pean wild boar was also domesticated by this time, pos-sibly as a direct consequence of the introduction of NearEastern pigs.
The possibility of using large numbers of SNPs en-ables the detection of nuclear haplotypes that may beassociated with introgression and/or phenotypic selec-tion that occurred during the domestication process.Analysis of the extent of useful LD (Kruglyak 1999)could provide information about sample sizes and thenumber of markers required to fine map genes re-sponsible for common diseases and other phenotypictraits (Zhang et al. 2002).
Our aim was to investigate the extent of LD, LDhaploblock partitioning, and haplotype diversity withinhaploblocks across a total of 20 pig breeds in Europeand China and in the ancestral European wild boar.With the commercial lines possibly containing the largerextent of LD in the species, we examined three geno-mic regions, each�1–3 cM, at a higher SNP density thanprevious studies (Nsengimana et al. 2004; Du et al.2007). This study provides insight into the extent of use-ful LD across a wide range of breeds and the requiredsample sizes and number of markers for associationstudies.
MATERIALS AND METHODS
DNA samples: DNA samples were obtained from 10European and 10 Chinese pig breeds and from wild boarindividuals from France, which came from a single reserve,were certified as 2n¼ 36, and are to the best of our knowledgeunrelated. Sample size ranged from 15 to 25 individuals (Table1). The material from these breeds was collected in theframework of PigBioDiv (Ollivier et al. 2005; Sancristobal
et al. 2006) and PigBiodiv II (Blott et al. 2003) projects.European breeds were grouped by origin and history intolocal, international, and commercial breeds. Chinese breedswere grouped by lower Changjiang River basin, southwestChina, central China, north China, Plateau, and south China(Zhang 1986; Fang et al. 2005; Megens et al. 2008).
SNP development and selection: The National Institutes ofHealth (NIH) Intramural Sequencing Center (NISC) (http://www.nisc.nih.gov) sequenced a large number of porcine BACs(supplemental Table 1). These BACs were derived from a pigBAC library developed using DNA of four crossbred male pigs(breed composition: 37.5% Yorkshire, 37.5% Landrace, and25% Meishan) (Fahrenkrug et al. 2001). NISC grouped theseBACs by targets. The porcine sequences from targets 1, 2, and4 have previously been used to randomly identify SNPs( Jungerius et al. 2005). In our study additional SNPs wereidentified within these genomic regions by aligning sequencesderived from overlapping BAC clones (supplemental Table 1).The list of identified SNPs and respective accession numbers isin supplemental Table 2.
SNP mapping: BAC sequences were masked for repeatmotifs using RepeatMAsker v3.1.6 and RepBase 11.06 (http://repeatmasker.org) and aligned to porcine BAC end sequences
(BES) available in GenBank using Megablast v2.2.14 (Altschul
et al. 1990). Positions of BES in the pig genome are available inthe FPC map (http://www.sanger.ac.uk/Projects/S_scrofa/).Hits with a bit score $1000 were therefore selected and usedto obtain the BAC position on the FPC map (FPC map of08.10.06). The SNP position on the BAC was converted to aSNP position on the chromosome, using information on theBAC position and sequence length. SNP positions are insupplemental Table 2.
SNP genotyping: Because only small amounts of genomicDNA were available for each Chinese breed except Meishan,whole-genome amplification (WGA) (Dean et al. 2002) was per-formed on these samples using the REPLI-g kit from QIAGEN(Valencia, CA), with 50–150 ng of input genomic DNA.
Genotyping was done in a 1536-plex format using theGoldenGate assay and Sentrix array matrices (Illumina, SanDiego) (Fan et al. 2003). Genotyping, including data editing,was performed by the Illumina service facility. A total of 1536SNPs were genotyped with this procedure, but only 44 locatedin target 1, 128 located in target 2, and 199 located in target 4are described in this study.
Predicted decay of LD by breed: To measure LD, pairwise r2
was calculated using Haploview version 3.2 (Barrett et al.2005). In this study, r2 was chosen because it is very useful inthe case of biallelic markers such as SNPs and because it isindependent from sample size (Devlin and Risch 1995).Further, Du et al. (2007) evaluated recently how r2 and D9 areaffected by several levels of minor allele frequency (MAF).Their results suggest that D9 is highly dependent on levels ofMAF, whereas r2 is less.
For SNPs genotyped for $ 75% of the total samples perbreed in each genomic region within breed, tests for deviationsfrom Hardy–Weinberg (HW) equilibrium were performedand allele frequencies for all SNPs were estimated. SNPs inHW disequilibrium (P , 0.001) and/or with MAF , 0.05 wereexcluded.
To assess the extent and decline of LD between breeds theequation
LDijk ¼1
1 1 4bjkdijk1 eijk ð1Þ
was used (Sved 1971; Heifetz et al. 2005), where LDijk is theobserved LD for marker pair i of breed j in genomic region k,dijk is the distance in base pairs for marker pair i of breed j ingenomic region k, bjk is the coefficient that describes thedecline of LD with distance for breed j in genomic region k,and eijk is a random residual. For each genomic region withinbreed LDijk , bjk , and eijk were estimated using the nonlinear fitfunction in R environment (http://www.r-project.org/). Graphicdisplays of LDijk vs. distance were produced.
Test for breed and genomic region effects in the extent ofLD: Markers were not evenly distributed within genomicregions. This can have an effect in the evaluation of LD, sincepairwise calculations are not assessed at equal distances andmay cause a distortion in LD values. To test for breed andgenomic region effects it was necessary to correct LDijk fordifferences in map distance when evaluating differences in LDbetween genomic regions. LDcijk is the distance-corrected andvariance-stabilized LD for marker pair i in genomic region kand breed j and it was estimated using bjk and eijk obtained withEquation 1:
LDcijk ¼eijk
1 1 4bj dijk
: ð2Þ
Differences in LD between genomic regions (target 1, target 2,and target 4) and breeds were analyzed,
570 A. J. Amaral et al.D
ownloaded from
https://academic.oup.com
/genetics/article/179/1/569/6064744 by guest on 30 January 2022
LDcijk ¼ Bj 1 Tk 1 BTjk 1 eijk ; ð3Þ
where Bj is the fixed effect of breed j, Tk is the fixed effect ofgenomic region k, BTjk is the fixed interaction effect, and eijk isthe random residual. Equation 3 was fitted using the linearmodel function in the R environment (http://www.r-project.org/). Differences among all interaction levels were testedusing the lsmeans function in SAS version 9.1 (SAS Institute,Cary, NC).
LD haploblock partitioning and haplotype diversity: Due tothe variation in local recombination rates, the breakdown ofLD is often discontinuous and presents a haploblock-like struc-ture (Daly et al. 2001; International Hapmap Consortium
2005). Therefore, it is important to analyze the haploblockstructure and haplotypes that underlie LD. Analysis of haplo-block partition defines the haploblock from the LD measure r2,initiating and extending a haploblock according to the pairwiseand grouped r2 values (Gu et al. 2005). The algorithm startsa haploblock by selecting the pair of adjacent SNPs with thehighest r2 (r2 . a) and extends the haploblock if the averager2 between an adjacent site and current haploblock membersis .b and each r2 . g. Here, a . b . g and in this case they werea ¼ 0.4, b ¼ 0.3, and g ¼ 0.1 (Gu et al. 2005). After the firsthaploblock is identified, a new pair of adjacent SNPs with thehighest r2 (r2 $ a) is used to start a new haploblock accretionprocess.
Haplotypes within haploblocks were obtained using anaccelerated EM algorithm, similar to the partition/ligationmethod of Qin et al. (2002) and implemented in Haploviewversion 3.2 (Barrett et al. 2005). The method creates highlyaccurate population frequency estimates of the phased hap-lotypes on the basis of the maximum likelihood as determinedfrom the unphased genotypes.
Plots of LD were generated using Haploview version 3.2(Barrett et al. 2005). Frequencies of classes of haploblocksizes were calculated per breed. In this study, haplotype diver-sity was considered as the number of haplotypes found withina haploblock. Plots of haplotype diversity for each genomicregion were produced.
Areas in the analyzed genomic regions that presentedhaploblock-like structure in all breeds were selected for studyof haplotype frequency and of haplotype sharing betweenbreeds. In these areas, a unique haploblock was forced for allbreeds (supplemental Table 3) and haplotypes were generatedas described above. Median-joining networks (Bandelt et al.1999) of these haplotypes were made using Network 4.2(http://www.fluxus-engineering.com).
RESULTS
SNP identification and selection: Accurate estima-tion of the extent of LD within a selection of breedsfrom Europe and China required availability of genomicregions with high densities of identified SNPs. Becausesuch information was not available at the start of thecurrent study, we decided to analyze three genomic re-gions in pigs for which high-quality sequences wereavailable. The comparative vertebrate sequencing pro-ject of NISC (http://www.nisc.nih.gov) provided thenecessary porcine genome sequences and NISC target1, target 2, and target 4 were chosen for the presentstudy. Because the available sequenced BACs werederived from crossbred animals originally derived fromthree different breeds, it is likely that overlapping BACs
are derived from different haplotypes. Consequently,these overlapping sequences provide a rich resource forthe identification of SNPs. Alignment of these sequencesidentified several hundred potential SNPs of which371 were selected for genotyping. Of these SNPs 93%yielded genotyping results for .75% of individualsfor all genomic regions. In total, 40 SNPs in target 1,114 in target 2, and 183 in target 4 remained for furtheranalysis.
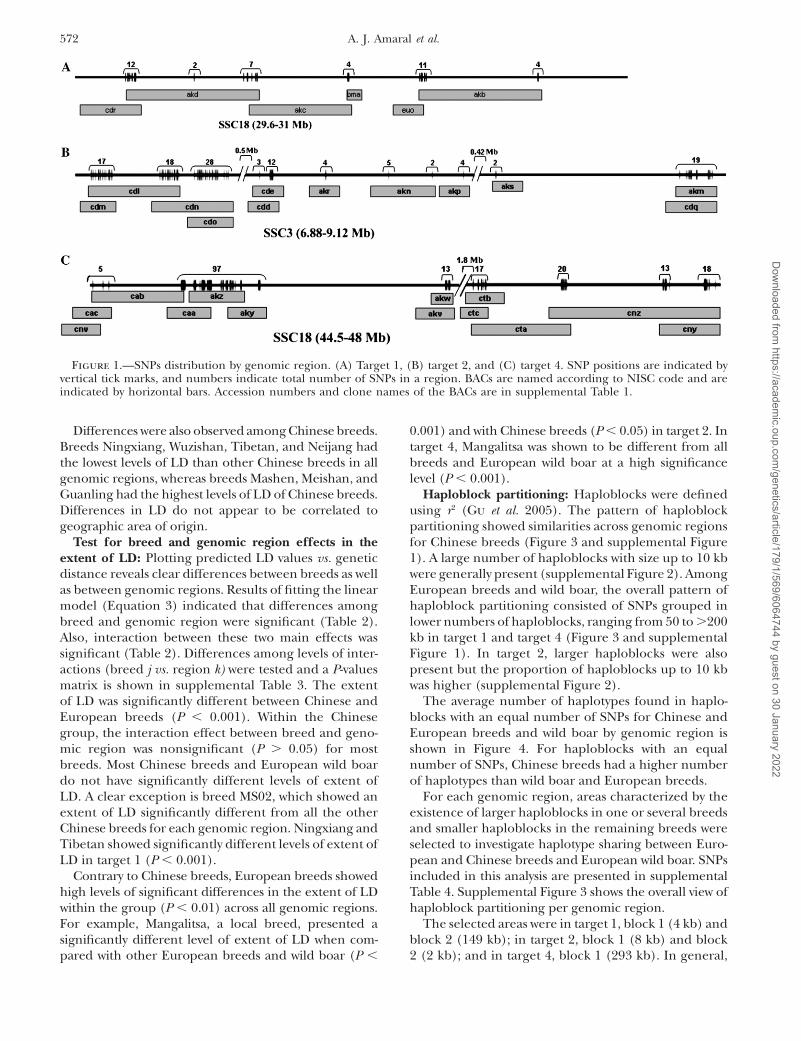
Due to the absence of a genome sequence for the pig,positions of SNPs were based on alignment of BACsequences with BES from clones located on the porcineBAC contig map (FPC map: http://www.sanger.ac.uk/Projects/S_scrofa/). This comparison indicates thattarget 1 and target 4 are located within q21 of SSC18and target 2 within q17 of SSC3 (Figure 1). The SNPs’distribution across each genomic region for SNPs withgenotypes in at least 75% of the animals is shown inFigure 1. Available BACs are unevenly distributed alongthe chromosome and, consequently, SNPs also are un-evenly distributed across the different genomic regions.
Predicted decay of LD per breed: Markers withdepartures from HW equilibrium were found at low fre-quencies in each genomic region and discarded. Theproportion of markers with MAF , 0.05 is higher formost European breeds especially in target 1 and forMangalitsa in target 2. Predicted values of LD vs. linkagedistance per genomic region and per breed are in Figure2. Most tightly linked SNP pairs have the highest r2 andaverage r2 rapidly decreases as linkage distance increases.Overall, there is a clear difference in the decay of LDbetween Chinese and European pig breeds for each ofthree genomic regions; r2 decreases over short distancesin Chinese breeds. This difference is most prominent intarget 1 and target 4. (Figures 2A and 3).
In target 1, observed r2 ¼ 1 for breeds Tamworth,Duroc, Middle White, British Saddleback, and LargeBlack. Therefore predicted values were not estimatedfor these breeds and Figure 2B shows observed r2.
For all genomic regions, LD decays more rapidly inChinese breeds than in European breeds, indicatingthat in these breeds the extent of LD is smaller than inEuropean breeds. LD in the European wild boar (FrWb)is in between European and Chinese breeds for target 2and target 4 (Figure 2, C and D).
In European breeds, different patterns of decay of LDwere observed across the three analyzed genomicregions between local, international, and commercialgroups of breeds (Table 1, Figure 2). International andcommercial breeds present a larger extent of LD thanlocal European breeds, but there are some exceptions.For example, Landrace, an international breed, whichshows a large extent of LD in target 1 and in target 4,presents a rapid LD decay in target 2. These resultsshowed that besides differences in the pattern of decayof LD between breeds, differences between genomicregions also exist.
Linkage Disequilibrium in Pigs From China and Europe 571D
ownloaded from
https://academic.oup.com
/genetics/article/179/1/569/6064744 by guest on 30 January 2022
Differences were also observed among Chinese breeds.Breeds Ningxiang, Wuzishan, Tibetan, and Neijang hadthe lowest levels of LD than other Chinese breeds in allgenomic regions, whereas breeds Mashen, Meishan, andGuanling had the highest levels of LD of Chinese breeds.Differences in LD do not appear to be correlated togeographic area of origin.
Test for breed and genomic region effects in theextent of LD: Plotting predicted LD values vs. geneticdistance reveals clear differences between breeds as wellas between genomic regions. Results of fitting the linearmodel (Equation 3) indicated that differences amongbreed and genomic region were significant (Table 2).Also, interaction between these two main effects wassignificant (Table 2). Differences among levels of inter-actions (breed j vs. region k) were tested and a P-valuesmatrix is shown in supplemental Table 3. The extentof LD was significantly different between Chinese andEuropean breeds (P , 0.001). Within the Chinesegroup, the interaction effect between breed and geno-mic region was nonsignificant (P . 0.05) for mostbreeds. Most Chinese breeds and European wild boardo not have significantly different levels of extent ofLD. A clear exception is breed MS02, which showed anextent of LD significantly different from all the otherChinese breeds for each genomic region. Ningxiang andTibetan showed significantly different levels of extent ofLD in target 1 (P , 0.001).
Contrary to Chinese breeds, European breeds showedhigh levels of significant differences in the extent of LDwithin the group (P , 0.01) across all genomic regions.For example, Mangalitsa, a local breed, presented asignificantly different level of extent of LD when com-pared with other European breeds and wild boar (P ,
0.001) and with Chinese breeds (P , 0.05) in target 2. Intarget 4, Mangalitsa was shown to be different from allbreeds and European wild boar at a high significancelevel (P , 0.001).
Haploblock partitioning: Haploblocks were definedusing r2 (Gu et al. 2005). The pattern of haploblockpartitioning showed similarities across genomic regionsfor Chinese breeds (Figure 3 and supplemental Figure1). A large number of haploblocks with size up to 10 kbwere generally present (supplemental Figure 2). AmongEuropean breeds and wild boar, the overall pattern ofhaploblock partitioning consisted of SNPs grouped inlower numbers of haploblocks, ranging from 50 to .200kb in target 1 and target 4 (Figure 3 and supplementalFigure 1). In target 2, larger haploblocks were alsopresent but the proportion of haploblocks up to 10 kbwas higher (supplemental Figure 2).
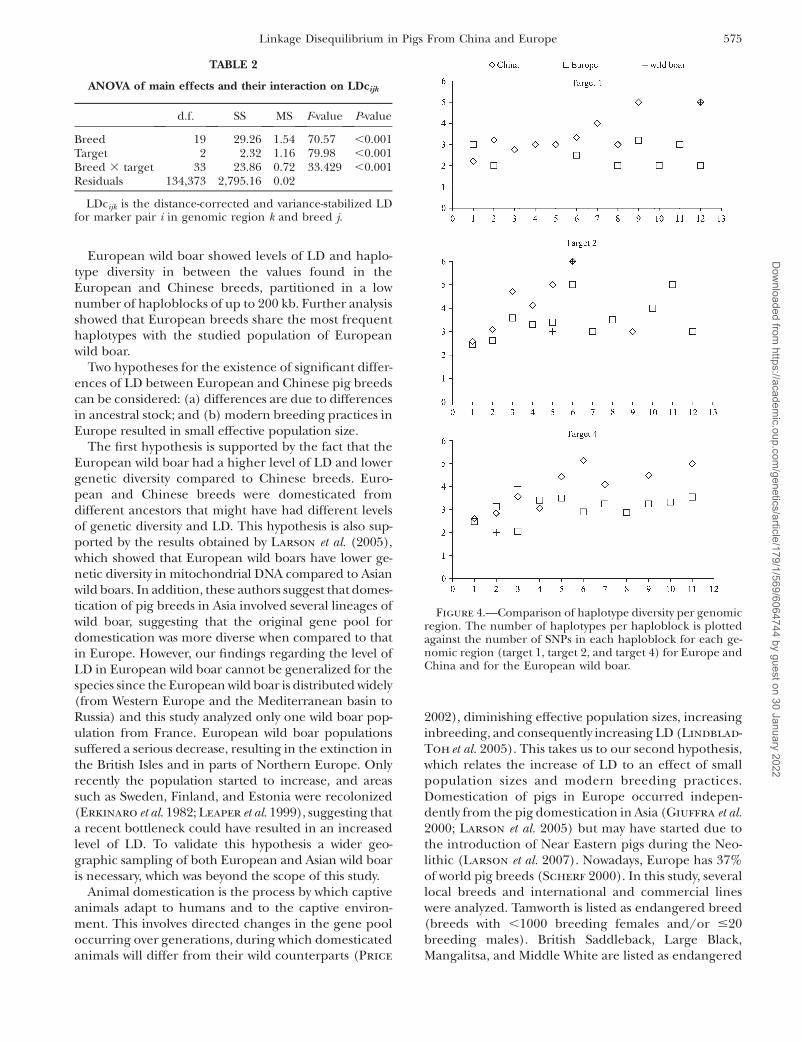
The average number of haplotypes found in haplo-blocks with an equal number of SNPs for Chinese andEuropean breeds and wild boar by genomic region isshown in Figure 4. For haploblocks with an equalnumber of SNPs, Chinese breeds had a higher numberof haplotypes than wild boar and European breeds.
For each genomic region, areas characterized by theexistence of larger haploblocks in one or several breedsand smaller haploblocks in the remaining breeds wereselected to investigate haplotype sharing between Euro-pean and Chinese breeds and European wild boar. SNPsincluded in this analysis are presented in supplementalTable 4. Supplemental Figure 3 shows the overall view ofhaploblock partitioning per genomic region.
The selected areas were in target 1, block 1 (4 kb) andblock 2 (149 kb); in target 2, block 1 (8 kb) and block2 (2 kb); and in target 4, block 1 (293 kb). In general,
Figure 1.—SNPs distribution by genomic region. (A) Target 1, (B) target 2, and (C) target 4. SNP positions are indicated byvertical tick marks, and numbers indicate total number of SNPs in a region. BACs are named according to NISC code and areindicated by horizontal bars. Accession numbers and clone names of the BACs are in supplemental Table 1.
572 A. J. Amaral et al.D
ownloaded from
https://academic.oup.com
/genetics/article/179/1/569/6064744 by guest on 30 January 2022
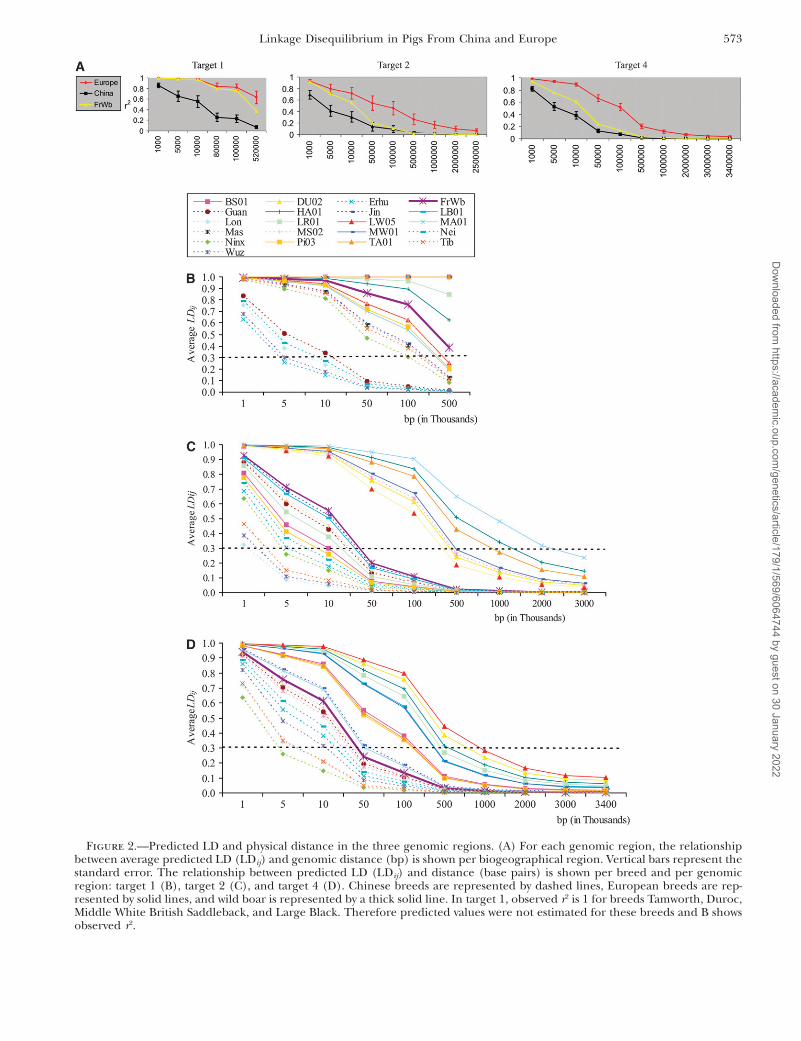
Figure 2.—Predicted LD and physical distance in the three genomic regions. (A) For each genomic region, the relationshipbetween average predicted LD (LDij) and genomic distance (bp) is shown per biogeographical region. Vertical bars represent thestandard error. The relationship between predicted LD (LDij) and distance (base pairs) is shown per breed and per genomicregion: target 1 (B), target 2 (C), and target 4 (D). Chinese breeds are represented by dashed lines, European breeds are rep-resented by solid lines, and wild boar is represented by a thick solid line. In target 1, observed r2 is 1 for breeds Tamworth, Duroc,Middle White British Saddleback, and Large Black. Therefore predicted values were not estimated for these breeds and B showsobserved r2.
Linkage Disequilibrium in Pigs From China and Europe 573D
ownloaded from
https://academic.oup.com
/genetics/article/179/1/569/6064744 by guest on 30 January 2022
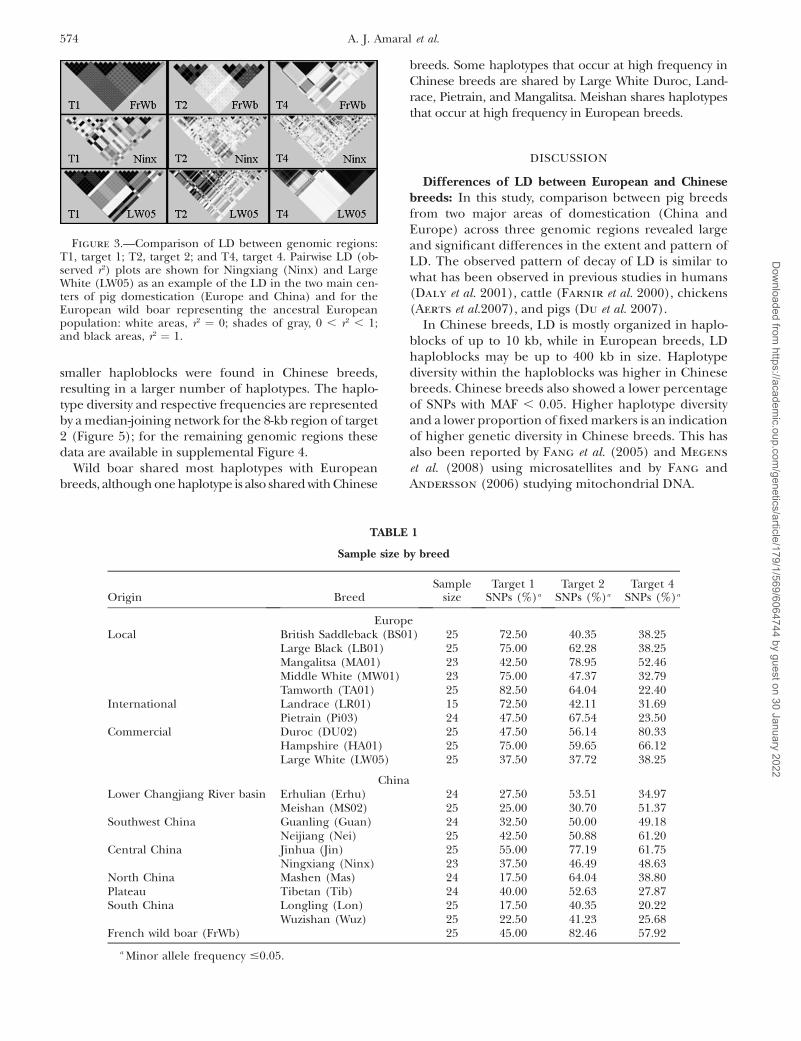
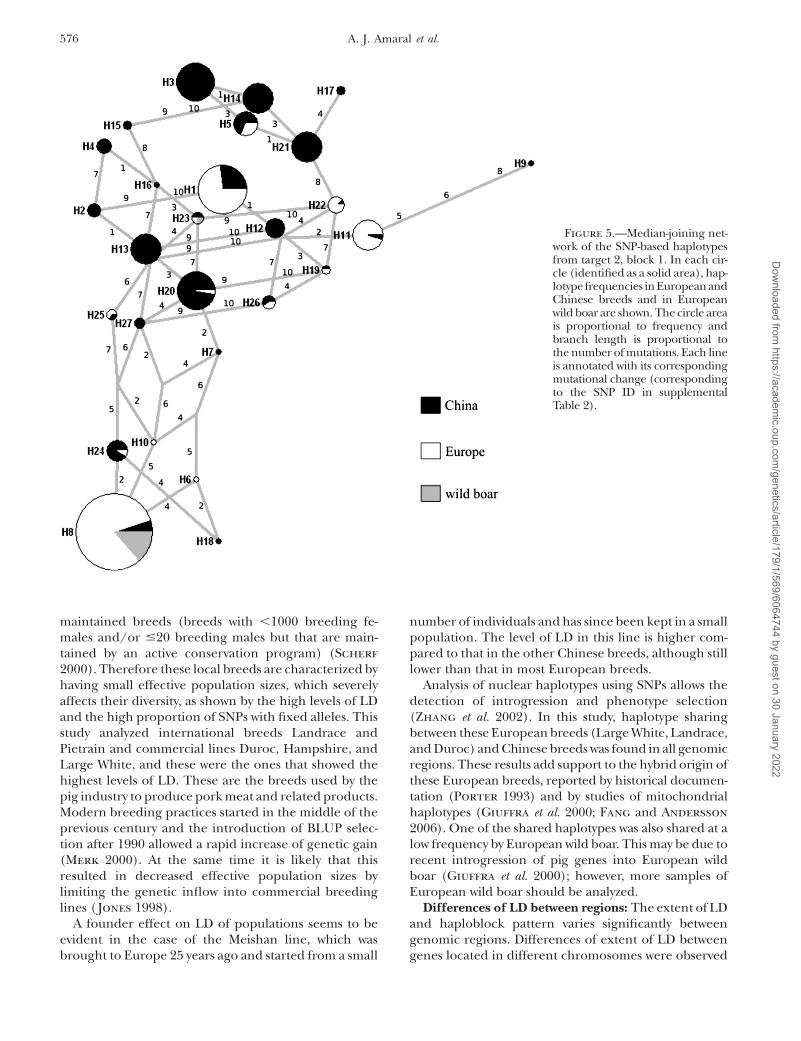
smaller haploblocks were found in Chinese breeds,resulting in a larger number of haplotypes. The haplo-type diversity and respective frequencies are representedby a median-joining network for the 8-kb region of target2 (Figure 5); for the remaining genomic regions thesedata are available in supplemental Figure 4.
Wild boar shared most haplotypes with Europeanbreeds, although one haplotype is also shared with Chinese
breeds. Some haplotypes that occur at high frequency inChinese breeds are shared by Large White Duroc, Land-race, Pietrain, and Mangalitsa. Meishan shares haplotypesthat occur at high frequency in European breeds.
DISCUSSION
Differences of LD between European and Chinesebreeds: In this study, comparison between pig breedsfrom two major areas of domestication (China andEurope) across three genomic regions revealed largeand significant differences in the extent and pattern ofLD. The observed pattern of decay of LD is similar towhat has been observed in previous studies in humans(Daly et al. 2001), cattle (Farnir et al. 2000), chickens(Aerts et al.2007), and pigs (Du et al. 2007).
In Chinese breeds, LD is mostly organized in haplo-blocks of up to 10 kb, while in European breeds, LDhaploblocks may be up to 400 kb in size. Haplotypediversity within the haploblocks was higher in Chinesebreeds. Chinese breeds also showed a lower percentageof SNPs with MAF , 0.05. Higher haplotype diversityand a lower proportion of fixed markers is an indicationof higher genetic diversity in Chinese breeds. This hasalso been reported by Fang et al. (2005) and Megens
et al. (2008) using microsatellites and by Fang andAndersson (2006) studying mitochondrial DNA.
Figure 3.—Comparison of LD between genomic regions:T1, target 1; T2, target 2; and T4, target 4. Pairwise LD (ob-served r2) plots are shown for Ningxiang (Ninx) and LargeWhite (LW05) as an example of the LD in the two main cen-ters of pig domestication (Europe and China) and for theEuropean wild boar representing the ancestral Europeanpopulation: white areas, r2 ¼ 0; shades of gray, 0 , r2 , 1;and black areas, r2 ¼ 1.
TABLE 1
Sample size by breed
Origin BreedSample
sizeTarget 1
SNPs (%)a
Target 2SNPs (%)a
Target 4SNPs (%)a
EuropeLocal British Saddleback (BS01) 25 72.50 40.35 38.25
Large Black (LB01) 25 75.00 62.28 38.25Mangalitsa (MA01) 23 42.50 78.95 52.46Middle White (MW01) 23 75.00 47.37 32.79Tamworth (TA01) 25 82.50 64.04 22.40
International Landrace (LR01) 15 72.50 42.11 31.69Pietrain (Pi03) 24 47.50 67.54 23.50
Commercial Duroc (DU02) 25 47.50 56.14 80.33Hampshire (HA01) 25 75.00 59.65 66.12Large White (LW05) 25 37.50 37.72 38.25
ChinaLower Changjiang River basin Erhulian (Erhu) 24 27.50 53.51 34.97
Meishan (MS02) 25 25.00 30.70 51.37Southwest China Guanling (Guan) 24 32.50 50.00 49.18
Neijiang (Nei) 25 42.50 50.88 61.20Central China Jinhua (Jin) 25 55.00 77.19 61.75
Ningxiang (Ninx) 23 37.50 46.49 48.63North China Mashen (Mas) 24 17.50 64.04 38.80Plateau Tibetan (Tib) 24 40.00 52.63 27.87South China Longling (Lon) 25 17.50 40.35 20.22
Wuzishan (Wuz) 25 22.50 41.23 25.68French wild boar (FrWb) 25 45.00 82.46 57.92
a Minor allele frequency #0.05.
574 A. J. Amaral et al.D
ownloaded from
https://academic.oup.com
/genetics/article/179/1/569/6064744 by guest on 30 January 2022
European wild boar showed levels of LD and haplo-type diversity in between the values found in theEuropean and Chinese breeds, partitioned in a lownumber of haploblocks of up to 200 kb. Further analysisshowed that European breeds share the most frequenthaplotypes with the studied population of Europeanwild boar.
Two hypotheses for the existence of significant differ-ences of LD between European and Chinese pig breedscan be considered: (a) differences are due to differencesin ancestral stock; and (b) modern breeding practices inEurope resulted in small effective population size.
The first hypothesis is supported by the fact that theEuropean wild boar had a higher level of LD and lowergenetic diversity compared to Chinese breeds. Euro-pean and Chinese breeds were domesticated fromdifferent ancestors that might have had different levelsof genetic diversity and LD. This hypothesis is also sup-ported by the results obtained by Larson et al. (2005),which showed that European wild boars have lower ge-netic diversity in mitochondrial DNA compared to Asianwild boars. In addition, these authors suggest that domes-tication of pig breeds in Asia involved several lineages ofwild boar, suggesting that the original gene pool fordomestication was more diverse when compared to thatin Europe. However, our findings regarding the level ofLD in European wild boar cannot be generalized for thespecies since the European wild boar is distributed widely(from Western Europe and the Mediterranean basin toRussia) and this study analyzed only one wild boar pop-ulation from France. European wild boar populationssuffered a serious decrease, resulting in the extinction inthe British Isles and in parts of Northern Europe. Onlyrecently the population started to increase, and areassuch as Sweden, Finland, and Estonia were recolonized(Erkinaro et al. 1982; Leaper et al. 1999), suggesting thata recent bottleneck could have resulted in an increasedlevel of LD. To validate this hypothesis a wider geo-graphic sampling of both European and Asian wild boaris necessary, which was beyond the scope of this study.
Animal domestication is the process by which captiveanimals adapt to humans and to the captive environ-ment. This involves directed changes in the gene pooloccurring over generations, during which domesticatedanimals will differ from their wild counterparts (Price
2002), diminishing effective population sizes, increasinginbreeding, and consequently increasing LD (Lindblad-Toh et al. 2005). This takes us to our second hypothesis,which relates the increase of LD to an effect of smallpopulation sizes and modern breeding practices.Domestication of pigs in Europe occurred indepen-dently from the pig domestication in Asia (Giuffra et al.2000; Larson et al. 2005) but may have started due tothe introduction of Near Eastern pigs during the Neo-lithic (Larson et al. 2007). Nowadays, Europe has 37%of world pig breeds (Scherf 2000). In this study, severallocal breeds and international and commercial lineswere analyzed. Tamworth is listed as endangered breed(breeds with ,1000 breeding females and/or #20breeding males). British Saddleback, Large Black,Mangalitsa, and Middle White are listed as endangered
TABLE 2
ANOVA of main effects and their interaction on LDcijk
d.f. SS MS F-value P-value
Breed 19 29.26 1.54 70.57 ,0.001Target 2 2.32 1.16 79.98 ,0.001Breed 3 target 33 23.86 0.72 33.429 ,0.001Residuals 134,373 2,795.16 0.02
LDcijk is the distance-corrected and variance-stabilized LDfor marker pair i in genomic region k and breed j.
Figure 4.—Comparison of haplotype diversity per genomicregion. The number of haplotypes per haploblock is plottedagainst the number of SNPs in each haploblock for each ge-nomic region (target 1, target 2, and target 4) for Europe andChina and for the European wild boar.
Linkage Disequilibrium in Pigs From China and Europe 575D
ownloaded from
https://academic.oup.com
/genetics/article/179/1/569/6064744 by guest on 30 January 2022
maintained breeds (breeds with ,1000 breeding fe-males and/or #20 breeding males but that are main-tained by an active conservation program) (Scherf
2000). Therefore these local breeds are characterized byhaving small effective population sizes, which severelyaffects their diversity, as shown by the high levels of LDand the high proportion of SNPs with fixed alleles. Thisstudy analyzed international breeds Landrace andPietrain and commercial lines Duroc, Hampshire, andLarge White, and these were the ones that showed thehighest levels of LD. These are the breeds used by thepig industry to produce pork meat and related products.Modern breeding practices started in the middle of theprevious century and the introduction of BLUP selec-tion after 1990 allowed a rapid increase of genetic gain(Merk 2000). At the same time it is likely that thisresulted in decreased effective population sizes bylimiting the genetic inflow into commercial breedinglines ( Jones 1998).
A founder effect on LD of populations seems to beevident in the case of the Meishan line, which wasbrought to Europe 25 years ago and started from a small
number of individuals and has since been kept in a smallpopulation. The level of LD in this line is higher com-pared to that in the other Chinese breeds, although stilllower than that in most European breeds.
Analysis of nuclear haplotypes using SNPs allows thedetection of introgression and phenotype selection(Zhang et al. 2002). In this study, haplotype sharingbetween these European breeds (Large White, Landrace,and Duroc) and Chinese breeds was found in all genomicregions. These results add support to the hybrid origin ofthese European breeds, reported by historical documen-tation (Porter 1993) and by studies of mitochondrialhaplotypes (Giuffra et al. 2000; Fang and Andersson
2006). One of the shared haplotypes was also shared at alow frequency by European wild boar. This may be due torecent introgression of pig genes into European wildboar (Giuffra et al. 2000); however, more samples ofEuropean wild boar should be analyzed.
Differences of LD between regions: The extent of LDand haploblock pattern varies significantly betweengenomic regions. Differences of extent of LD betweengenes located in different chromosomes were observed
Figure 5.—Median-joining net-work of the SNP-based haplotypesfrom target 2, block 1. In each cir-cle (identified as a solid area), hap-lotype frequencies in European andChinese breeds and in Europeanwild boar are shown. The circle areais proportional to frequency andbranch length is proportional tothe number of mutations. Each lineis annotated with its correspondingmutational change (correspondingto the SNP ID in supplementalTable 2).
576 A. J. Amaral et al.D
ownloaded from
https://academic.oup.com
/genetics/article/179/1/569/6064744 by guest on 30 January 2022
by Reich et al. (2001) in human populations. Theseauthors found levels of LD extending up to 160 kb insome genomic regions while in others the LD extendedonly up to 40 kb.
Nsengimana et al. (2004) assessed LD in five pop-ulations of commercial pigs (Large White, Landrace,Duroc/Large White, and Yorkshire/Large White) in twochromosomal regions, one on SCC4 (33 cM) and an-other on SCC7 (48 cM), using 15 microsatellites with aninterval spacing of 5 cM. The region on SSC7 presented asignificantly larger extent of LD compared to SSC4.Since SSC7 harbors QTL associated with growth rateand fat deposition, Nsengimana et al. (2004) suggestedthat these differences in the extent of LD were due toselection.
A likely cause of the observed differences in the ex-tent of LD between genomic regions located in chro-mosomes SSC18 and SSC3 is selection. In region q21 ofSSC18, previous studies identified a number of genesthat are obvious candidates to be under selection ½e.g.,INSIG1 (Qiu et al. 2005), LEP (Campbell et al. 2001),and GHRHR (Sun et al. 1997)�. Further, several QTLhave been mapped to this region as well (pH, cook loss,and feed-conversion ratio) (Hu et al. 2005). In contrast,region q17 on SSC3 contains mainly genes involved ingeneral cellular processes such as DNA transcription,transduction, and cell differentiation, which are notlikely candidate genes to be under selection, and nomajor QTL have been described for this region (Hu
et al. 2005). This hypothesis is also supported by thesimilarity in the extent of LD across genomic regions inthe European wild boar population. The effect of selec-tion on the extent of LD in other domestic animals hasbeen reported in other studies ½cattle (Farnir et al.2000) and sheep (McRae et al. 2002)�.
Assessing the extent of useful LD: The threshold foruseful LD that was chosen in this study was the same aspreviously used in LD studies of pig populations using r2
as a measure of LD (Jungerius et al. 2005; Du et al.2007). With a threshold of 0.3, and considering that onaverage 1 cM is equivalent to 1 Mb, LD extended in theEuropean breeds over 0.5–2 cM on SSC18 and 0.1–1 cMon SSC3. In the case of Chinese breeds LD rangedbetween 0.005 and 0.05 cM in the studied genomicregions.
This study shows that LD for European pig breeds ishigher compared to that in human populations (Reich
et al. 2001; Ardlie et al. 2002). Higher values of theextent of LD in domestic animals have been reported inprevious studies ½e.g., cattle (Farnir et al. 2000) andsheep (McRae et al. 2002)�. Previous reports on theextent of LD in European pigs (Nsengimana et al. 2004;Du et al. 2007) also showed large levels of LD exceedingthe values obtained in our study. As described above,Nsengimana et al. (2004) studied the extent of LD usingmicrosatellites, and LD was measured using D9. Theseauthors concluded using the threshold for useful LD of
0.5 that LD ranges from 3 to 10 cM. However, theseconclusions were based on a low number of distantlyspaced markers. Du et al. (2007) also studied LD usingcommercial lines (Pietrain, Duroc, Landrace, and LargeWhite). LD was assessed using SNPs across 18 chromo-somes with an average of 330 markers per chromosome,with a maximum length of 100 cM and a marker spacingon average of 0.44 cM. LD was measured using r2 and 0.3as a threshold for useful LD. These authors suggest thatLD extends to 1–3 cM in these pig populations. This isonly somewhat higher than values obtained in thecurrent study, which could be due to the greater markerspacing used by Du et al. (2007).
By contrast, the present study aimed at assessing theextent of LD with high definition, and the trade-off wasto have high SNP frequencies (0.02 cM) preferablycovering regions of a few centimorgans in size. The sizeof target 1, however, was only 1 cM and in the case ofmany European breeds this length was too small toobserve the decay of the LD. In targets 2 and 4 the decayof LD can be observed in detail with maxima rangingfrom 1 cM in target 2 to 2 cM in target 4. This experi-mental design allowed us to study LD in a large set ofbreeds, from Europe and China. The most importantdifference between our study and that of Nsengimana
et al. (2004) and Du et al. (2007) is the high markerdensity used and wider sampling of pig populations. InChinese breeds, the results of decay of LD would havebeen inconclusive if the same smaller marker spacinghad been used as by Du et al. (2007). Our results indicatethat we would have found a very steep decay in LD andwould not have been able to precisely identify the pointat which LD drops below 0.3. For Chinese breeds, this isthe first study that aimed to assess LD. The level of ex-tent of LD is very small, 0.005–0.05 cM, which is similarto the extent of LD observed in human populations(Reich et al. 2001; Ardlie et al. 2002; International
Hapmap Consortium 2005). Populations with a shorterextent of LD are more suitable for fine mapping ofgenes responsible for phenotypic traits (Ardlie et al.2002). Therefore, Chinese pig breeds may be useful tofine map QTL; however, the QTL alleles that have aneffect on the phenotypic trait have to be segregating inthese breeds.
For future populationwide studies with a whole-genome approach, our results indicate that, assuminga threshold of 0.3 for r2, the SNP spacing for Europeanpig breeds should be �0.1 cM. This implies the use of30,000 SNPs per individual, using the same sample sizesas in this study and assuming that all SNPs are in-formative (with a MAF . 0.05). For Chinese breeds in astudy with a similar sample size a SNP spacing of 0.005cM and the use of �500,000 SNPs per individual wouldbe required.
European pig DNA samples, other than provided by the authors,were provided by Agence de la Selection Porcine, France; Georg-August University, Gottingen, Germany; Rare Breeds Survival Trust,
Linkage Disequilibrium in Pigs From China and Europe 577D
ownloaded from
https://academic.oup.com
/genetics/article/179/1/569/6064744 by guest on 30 January 2022
United Kingdom; Roslin Institute, United Kingdom; and PIC In-ternational Group, United Kingdom. European wild boar sampleswere provided by Alain Ducos (Unite Mixte de Recherche, InstitutNational de la Recherche Agronomique–ENVT 898, Cytogenetiquedes Populations Animales), and Chinese breeds were provided byNing Li (China Agricultural University, National Laboratories forAgrobiotechnology). This work was funded by European Union grantQLRT-2001-01059. This work was conducted as part of the SABRE-TRAIN Project, funded by the Marie Curie Host Fellowships for EarlyStage Research Training, as part of the 6th Framework Programme ofthe European Commission.
LITERATURE CITED
Aerts, J., H. J. Megens, T. Veenendaal, I. Ovcharenko, R. Crooijmans
et al., 2007 Extent of linkage disequilibrium in chicken. Cytogenet.Genome Res. 117: 338–345.
Altschul, S. F., W. Gish, W. Miller, E. W. Myers and D. J. Lipman,1990 Basic local alignment search tool. J. Mol. Biol. 215: 403–410.
Ardlie, K. G., L. Kruglyak and M. Seielstad, 2002 Patterns oflinkage disequilbrium in the human genome. Nat. Rev. Genet.3: 299–309 (erratum: Nat. Rev. Genet. 3: 566.
Baessler, A., M. Fischer, B. Mayer, M. Koehler, S. Wiedmann et al.,2007 Epistatic interaction between haplotypes of the ghrelin li-gand and receptor genes influence susceptibility to myocardialinfarction and coronary artery disease. Hum. Mol. Genet. 16:887–899.
Bandelt, H. J., P. Forster and A. Rohl, 1999 Median-joining net-works for inferring intraspecific phylogenies. Mol. Biol. Evol. 16:37–48.
Barrett, J. C., B. Fry, J. Maller and M. J. Daly, 2005 Haploview:analysis and visualization of LD and haplotype maps. Bioinfor-matics 21: 263–265.
Blott, S., L. Andersson, M. Groenen, M. Sancristobal, C. Chevalet
et al., 2003 Characterisation of genetic variation in the pig breedsof China and Europe—the pigbiodiv2 project. Arch. Zootec.52: 207.
Bruford, M. W. M. W., D. G. D. G. Bradley and G. G. Luikart,2003 DNA markers reveal the complexity of livestock domesti-cation. Nat. Rev. Genet. 4: 900–910.
Campbell, E. M. G., S. C. Fahrenkrug, J. L. Vallet, T. P. L. Smith
and G. A. Rohrer, 2001 An updated linkage and comparativemap of porcine chromosome 18. Anim. Genet. 32: 375–379.
Chen, K. K., T. T. Baxter, W. M. W. M. Muir, M. A. M. A. Groenen
and L. B. L. B. Schook, 2007 Genetic resources, genome map-ping and evolutionary genomics of the pig (Sus scrofa). Int. J.Biol. Sci. 3: 153–165.
Daly, M. J., J. D. Rioux, S. E. Schaffner, T. J. Hudson and E. S.Lander, 2001 High-resolution haplotype structure in the hu-man genome. Nat. Genet. 29: 229–232.
Dean, F. B., S. Hosono, L. H. Fang, X. H. Wu, A. F. Faruqi et al.,2002 Comprehensive human genome amplification using mul-tiple displacement amplification. Proc. Natl. Acad. Sci. USA 99:5261–5266.
Devlin, B., and N. Risch, 1995 A comparison of linkage disequilib-rium measures for fine-scale mapping. Genomics 29: 311–322.
Du, F. X., A. C. Clutter and M. M. Lohuis, 2007 Characterizinglinkage disequilibrium in pig populations. Int. J. Biol. Sci. 3:166–178.
Erkinaro, E., K. Heikura, E. Pullianen and S. Sulkava, 1982 Occur-rence and spread of the wild boar (Sus scrofa) in eastern Fennoscan-dia. Memo. Flora Fauna Fennoscand. 58: 39–47.
Fahrenkrug, S. C., G. A. Rohrer, B. A. Freking, T. P. L. Smith, K.Osoegawa et al., 2001 A porcine BAC library with tenfold ge-nome coverage: a resource for physical and genetic map integra-tion. Mamm. Genome 12: 472–474.
Fan, J. B., A. Oliphant, R. Shen, B. G. Kermani, F. Garcia et al.,2003 Highly parallel SNP genotyping. Cold Spring HarborSymp. Quant. Biol. 68: 69–78.
Fang, M., X. Hu, T. Jiang, M. Braunschweig, L. Hu et al., 2005 Thephylogeny of Chinese indigenous pig breeds inferred from mi-crosatellite markers. Anim. Genet. 36: 7–13.
Fang, M. Y., and L. Andersson, 2006 Mitochondrial diversity inEuropean and Chinese pigs is consistent with population expan-sions that occurred prior to domestication. Proc. R. Soc. B Biol.Sci. 273: 1803–1810.
Farnir, F., W. Coppieters, J. J. Arranz, P. Berzi, N. Cambisano et al.,2000 Extensive genome-wide linkage disequilibrium in cattle.Genome Res. 10: 220–227.
Giuffra, E., J. M. H. Kijas, V. Amarger, O. Carlborg, J. T. Jeon et al.,2000 The origin of the domestic pig: independent domes-tication and subsequent introgression. Genetics 154: 1785–1791.
Gu, S., A. J. Pakstis and K. K. Kidd, 2005 HAPLOT: a graphicalcomparison of haplotype blocks, tagSNP sets and SNP variationfor multiple populations. Bioinformatics 21: 3938–3939.
Heifetz, E. M., J. E. Fulton, N. O’Sullivan, H. Zhao, J. C. M. Dekkers
et al., 2005 Extent and consistency across generations of linkagedisequilibrium in commercial layer chicken breeding populations.Genetics 171: 1173–1181.
Hu, Z. L. Z.-L., S. S. Dracheva, W. W. Jang, D. D. Maglott, J. J.Bastiaansen et al., 2005 A QTL resource and comparison toolfor pigs: PigQTLDB. Mamm. Genome 16: 792–800.
International HapMap Consortium, 2003 The InternationalHapMap Project. Nature 426: 789–796.
International HapMap Consortium, 2005 A haplotype map ofthe human genome. Nature 437: 1299–1320.
Jones, G. F., 1998 Aspects of domestication, common breeds andtheir origin, pp. 17–50 in The Genetics of the Pig, edited by M. F.Rothschild and A. Ruvinsky. CAB International, New York.
Jungerius, B. J., J. J. Gu, R. Crooijmans, J. J. Van Der Poel, M. A. M.Groenen et al., 2005 Estimation of the extent of linkage dis-equilibrium in seven regions of the porcine genome. Anim. Bio-technol. 16: 41–54.
Kruglyak, L., 1999 Prospects for whole-genome linkage disequi-librium mapping of common disease genes. Nat. Genet. 22:139–144.
Larson, G., K. Dobney, U. Albarella, M. Y. Fang, E. Matisoo-Smith et al., 2005 Worldwide phylogeography of wild boarreveals multiple centers of pig domestication. Science 307:1618–1621.
Larson, G., U. Albarella, K. Dobney, P. Rowley-Conwy, J.Schibler et al., 2007 From the cover: ancient DNA, pig domes-tication, and the spread of the Neolithic into Europe. Proc. Natl.Acad. Sci. USA 104: 15276–15281.
Leaper, R., G. Massei, M. L. Gorman and R. Aspinall, 1999 Thefeasibility of reintroducing wild boar (Sus scofa) to Scotland.Mammal Rev. 29: 239–259.
Lindblad-Toh, K., C. M. Wade, T. S. Mikkelsen, E. K. Karlsson, D. B.Jaffe et al., 2005 Genome sequence, comparative analysis andhaplotype structure of the domestic dog. Nature 438: 803–819.
McRae, A. F., J. C. McEwan, K. G. Dodds, T. Wilson, A. M.Crawford et al., 2002 Linkage disequilibrium in domesticsheep. Genetics 160: 1113–1122.
Megens, H.-J., R. P. M. A. Crooijmans, M. Sancristobal, X. Hui, N.Li et al., 2008 Biodiversity of pig breeds from China and Europeestimated from pooled DNA samples: differences in microsatel-lite variation between two areas of domestication. Genet. Sel.Evol. 40: 103–128.
Merks, J. W. M., 2000 One century of genetic changes in pigs andfuture needs, pp. 8–19 in The Challenge of Genetic Change in AnimalProduction, edited by W. G. Hill, S. C. Bishop, B. McQuirk, J. C.McKay, G. Simm and A. J. Webb. British Society of Animal Sci-ence Occasional Publication, Edinburgh, UK.
Nordborg, M., and S. Tavare, 2002 Linkage disequilibrium: whathistory has to tell us. Trends Genet. 18: 83–90.
Nsengimana, J., P. Baret, C. S. Haley and P. M. Visscher, 2004 Link-age disequilibrium in the domesticated pig. Genetics 166: 1395–1404.
Ollivier, L., L. Alderson, G. C. Gandini, J. L. Foulley, C. S. Haley
et al., 2005 An assessment of European pig diversity using mo-lecular markers: partitioning of diversity among breeds. Conserv.Genet. 6: 729–741.
Porter, V., 1993 Pigs, A Handbook to the Breeds of the World. Helm In-formation, London.
Price, E. O., 2002 Animal Domestication and Behavior. CABI Interna-tional, New York.
578 A. J. Amaral et al.D
ownloaded from
https://academic.oup.com
/genetics/article/179/1/569/6064744 by guest on 30 January 2022
Pritchard, J. K., and M. Przeworski, 2001 Linkage disequilibriumin humans: models and data. Am. J. Hum. Genet. 69: 1–14.
Qin, Z. H. S., T. H. Niu and J. S. Liu, 2002 Partition-ligation-expectation-maximization algorithm for haplotype inference with single-nucleotidepolymorphisms. Am. J. Hum. Genet. 71: 1242–1247.
Qiu, H., T. Xia, X. D. Chen, L. Gan, S. Q. Feng et al., 2005 Charac-terization of pig INSIG1 and assignment to SSC18. Anim. Genet.36: 284–286.
Reich, D. E., M. Cargill, S. Bolk, J. Ireland, P. C. Sabeti et al.,2001 Linkage disequilibrium in the human genome. Nature411: 199–204.
Rigby, R. J., M. M. A. Fernando and T. J. Vyse, 2006 Mice, humansand haplotypes—the hunt for disease genes in SLE. Rheumatol-ogy 45: 1062–1067.
Sancristobal, M., C. Chevalet, C. S. Haley, R. Joosten, A. P.Rattink et al., 2006 Genetic diversity within and between Euro-pean pig breeds using microsatellite markers. Anim. Genet. 37:189–198.
Scherf, B. D., 2000 World Watch List for Domestic Animal Diversity,Ed. 2. Food and Agriculture Organization, Rome.
Sun, H. S., C. Taylor, L. Wang, M. F. Rothschild, C. K. Tuggle
et al., 1997 Mapping of growth hormone releasing hormone re-ceptor to swine chromosome 18. Anim. Genet. 28: 351–353.
Sved, J. A., 1971 Linkage disequilibrium and homozygosity of chro-mosome segments in finite populations. Theor. Popul. Biol. 2:125–141.
Tenesa, A., P. Navarro, B. J. Hayes, D. L. Duffy, G. M. Clarke et al.,2007 Recent human effective population size estimated fromlinkage disequilibrium. Genome Res. 17: 520–526.
Wellcome Trust Case Control Consortium, 2007 Genome-wideassociation study of 14,000 cases of seven common diseases and3,000 shared controls. Nature 447: 661–678.
Wright, W. T., I. S. Young, D. P. Nicholls, C. Patterson, K. Lyttle
et al., 2006 SNPs at the APOA5 gene account for the strong as-sociation with hypertriglyceridaemia at the APOA5/A4/C3/A1locus on chromosome 11q23 in the Northern Irish population.Atherosclerosis 185: 353–360.
Zhang, Z., 1986 Pig Breeds in China. Shanghai Scientific and Tech-nical Publishers, Shanghai, China.
Zhang, K., M. H. Deng, T. Chen, M. S. Waterman and F. Z. Sun,2002 A dynamic programming algorithm for haplotype blockpartitioning. Proc. Natl. Acad. Sci. USA 99: 7335–7339.
Communicating editor: M. W. Feldman
Linkage Disequilibrium in Pigs From China and Europe 579D
ownloaded from
https://academic.oup.com
/genetics/article/179/1/569/6064744 by guest on 30 January 2022