linked data quality assessment and its application to ... · linked data quality assessment and its...
TRANSCRIPT
Linked Data Quality Assessment and itsApplication to Societal Progress
Measurement
Der Fakultat fur Mathematik und Informatikder Universitat Leipzig
eingereichte
DISSERTATION
zur Erlangung des akademischen Grades
DOKTOR-INGENIEUR(Dr. Ing.)
im Fachgebiet Informatik
vorgelegt
von M.Sc. Amrapali Zaveri
geboren am 09. November 1984 in Mumbai, Indien
Leipzig, den 17.04.2015

Bibliographic Data
Title: Linked Data Quality Assessment and its Application to Societal Progress Mea-surementAuthor: Amrapali ZaveriInstitution: Universitat Leipzig, Fakultat fur Mathematik und InformatikStatistical Information: 149 pages, 22 figures, 23 tables, 149 literature references
Abstract
In recent years, the Linked Data (LD) paradigm has emerged as a simple mechanismfor employing the Web as a medium for data and knowledge integration where bothdocuments and data are linked. Moreover, the semantics and structure of the underlyingdata are kept intact, making this the Semantic Web. LD essentially entails a set of bestpractices for publishing and connecting structure data on the Web, which allows publish-ing and exchanging information in an interoperable and reusable fashion. Many differentcommunities on the Internet such as geographic, media, life sciences and governmenthave already adopted these LD principles. This is confirmed by the dramatically growingLinked Data Web, where currently more than 50 billion facts are represented.
With the emergence of Web of Linked Data, there are several use cases, which arepossible due to the rich and disparate data integrated into one global information space.Linked Data, in these cases, not only assists in building mashups by interlinking hetero-geneous and dispersed data from multiple sources but also empowers the uncoveringof meaningful and impactful relationships. These discoveries have paved the way forscientists to explore the existing data and uncover meaningful outcomes that they mightnot have been aware of previously.
In all these use cases utilizing LD, one crippling problem is the underlying dataquality. Incomplete, inconsistent or inaccurate data affects the end results gravely, thusmaking them unreliable. Data quality is commonly conceived as fitness for use, be itfor a certain application or use case. There are cases when datasets that contain qualityproblems, are useful for certain applications, thus depending on the use case at hand.Thus, LD consumption has to deal with the problem of getting the data into a state inwhich it can be exploited for real use cases. The insufficient data quality can be causedeither by the LD publication process or is intrinsic to the data source itself.
A key challenge is to assess the quality of datasets published on the Web and makethis quality information explicit. Assessing data quality is particularly a challenge inLD as the underlying data stems from a set of multiple, autonomous and evolving datasources. Moreover, the dynamic nature of LD makes assessing the quality crucial to
III
measure the accuracy of representing the real-world data. On the document Web, dataquality can only be indirectly or vaguely defined, but there is a requirement for moreconcrete and measurable data quality metrics for LD. Such data quality metrics includecorrectness of facts wrt. the real-world, adequacy of semantic representation, quality ofinterlinks, interoperability, timeliness or consistency with regard to implicit information.Even though data quality is an important concept in LD, there are few methodologiesproposed to assess the quality of these datasets.
Thus, in this thesis, we first unify 18 data quality dimensions and provide a totalof 69 metrics for assessment of LD. The first methodology includes the employmentof LD experts for the assessment. This assessment is performed with the help ofthe TripleCheckMate tool, which was developed specifically to assist LD experts forassessing the quality of a dataset, in this case DBpedia. The second methodology is asemi-automatic process, in which the first phase involves the detection of common qualityproblems by the automatic creation of an extended schema for DBpedia. The secondphase involves the manual verification of the generated schema axioms. Thereafter,we employ the wisdom of the crowds i.e. workers for online crowdsourcing platformssuch as Amazon Mechanical Turk (MTurk) to assess the quality of DBpedia. We thencompare the two approaches (previous assessment by LD experts and assessment byMTurk workers in this study) in order to measure the feasibility of each type of theuser-driven data quality assessment methodology.
Additionally, we evaluate another semi-automated methodology for LD qualityassessment, which also involves human judgement. In this semi-automated methodology,selected metrics are formally defined and implemented as part of a tool, namely R2RLint.The user is not only provided the results of the assessment but also specific entitiesthat cause the errors, which help users understand the quality issues and thus can fixthem. Finally, we take into account a domain-specific use case that consumes LD andleverages on data quality. In particular, we identify four LD sources, assess their qualityusing the R2RLint tool and then utilize them in building the Health Economic Research(HER) Observatory. We show the advantages of this semi-automated assessment overthe other types of quality assessment methodologies discussed earlier. The Observatoryaims at evaluating the impact of research development on the economic and healthcareperformance of each country per year. We illustrate the usefulness of LD in this use caseand the importance of quality assessment for any data analysis.
IV
Publications
This thesis is based on the following conference and journal publications, in which Ihave either been an author or a contributor. At the respective chapter and section, I haveincluded the references to the appropriate publications. The full list of publications canbe found in Appendix A.
Conference publications, peer-reviewed
• Using Linked Data to evaluate the impact of Research and Development in Europe:a Structural Equation Model, In Proceedings of 12th International Semantic WebConference, 21-25 October 2013, Sydney, Australia (ISWC 2013) [Zaveri et al.,2013d]
• User-driven Quality Evaluation of DBpedia, In Proceedings of 9th InternationalConference on Semantic Systems, I-SEMANTICS ’13, Graz, Austria, September4-6, (I-Semantics 2013) [Zaveri et al., 2013a]
• Crowdsourcing Linked Data quality assessment, In Proceedings of 12th Interna-tional Semantic Web Conference, 21-25 October 2013, Sydney, Australia (ISWC2013) [Acosta et al., 2013]
Journal publications, peer-reviewed
• Quality assessment methodologies for Linked Data: A Survey, Semantic WebJournal (2015) [Zaveri et al., 2015]
• Publishing and Interlinking the Global Health Observatory Dataset, SemanticWeb Journal (2013) [Zaveri et al., 2013b]
Journal publications, under review
• Using Linked Data to build an Observatory of Societal Progress Indicators, Journalof Web Semantics (2014) [Zaveri et al., 2014b]
• Publishing and Interlinking the USPTO Patent Data, Semantic Web Journal(2014) [Zaveri et al., 2014a]
V
Acknowledgments
“Der Weg ist das Ziel” - Confucius. This proverb translates to “The journey isthe destination” and very aptly fits the journey of a PhD student. Thus, I would liketo thank all the people who were part of my journey. First of all, I would like tothank my supervisors: Dr. Klaus-Peter Fahnrich and Dr. Soren Auer for giving methe opportunity to pursue PhD. I would like to specially thank Soren for his excellentguidance, stimulating discussions and keen observations, which helped me improve overtime. Moreover, he taught me how to balance work and family efficiently. I am alsoindebted to my supervisor Dr. Jens Lehmann for his constant support, motivation andconfidence in me that enabled me to progress in my work with each passing day. Mostimportantly, I would like to thank the German Academic Exchange Service (DAAD) forgranting me the scholarship, without which pursuing a PhD would be more difficult.
I would also like to thank all my colleagues at AKSW for their help and engagingdiscussions. A big thank you to all my co-authors for believing in my ideas, seeingthem through and for their work so that this thesis could be completed. I am grateful tomy colleagues for their companionship that helped me pull through the several yearsaway from home. In particular, I would like to thank Saeedeh Shekarpour, for alwaysbeing there when I needed someone to talk to; Timofey Ermilov, for his jolly nature andeverything-is-easy attitude; Nadine Janicke for helping me fill out numerous Germanforms and translate contracts; Thomas Riechert for helping me always and making mefeel as a part of his family; Konrad Hoffner for being a good friend and for helping mefor every little thing I asked for.
A special thanks also goes to Dr. Ricardo Pietrobon, who inspired me to pursueresearch and remotely guided me throughout the journey. Moreover, thanks to AnisaRula, Maribel Acosta, Joao Ricardo Nickenig Vissoci and Cinzia Daraio, with whomworking remotely, despite the time or location differences, was not only engaging butalso enjoyable. I would like to thank my German language teacher Frau Zajonz forteaching me the German language well so that I could go through my daily activitieseffortlessly. I would also like to thank my gym instructor, Laura for keeping me fitthroughout these years.
Most importantly, I would like to thank my parents, Jayshree and Jyotindra Zaveri,for their unconditional love. Also, I am grateful for the support from my family, Preksha,Soham, Aanya and Tanishi Chakravarti. A big thank you to my friends for their support,whose friendship I truly cherish, Siddha Joshi, Sunita Patil, Elena Ermilov and AnnettRiechert.
VI
Contents
1. Introduction 11.1. Linked Data and Data Quality on the Web . . . . . . . . . . . . . . . . . 11.2. User Scenario . . . . . . . . . . . . . . . . . . . . . . . . . . . . . . . . . . 31.3. Challenges . . . . . . . . . . . . . . . . . . . . . . . . . . . . . . . . . . . 4
1.3.1. Lack of unified descriptions for data quality dimensions andmetrics for Linked Data . . . . . . . . . . . . . . . . . . . . . . . 4
1.3.2. Lack of user-driven data quality assessment methodologies forLinked Data . . . . . . . . . . . . . . . . . . . . . . . . . . . . . . 4
1.3.3. Lack of quality assessment of datasets before utilization in par-ticular use cases . . . . . . . . . . . . . . . . . . . . . . . . . . . . 5
1.4. Research Questions and Contributions . . . . . . . . . . . . . . . . . . . . 51.4.1. Descriptions of data quality dimensions and metrics . . . . . . . 61.4.2. User-driven data quality assessment methodologies . . . . . . . 61.4.3. Consumption of Linked Data leveraging on data quality . . . . . 8
1.5. Thesis Overview . . . . . . . . . . . . . . . . . . . . . . . . . . . . . . . . 8
2. Semantic Web Technologies 112.1. The Semantic Web Vision . . . . . . . . . . . . . . . . . . . . . . . . . . . 112.2. Resource Description Framework (RDF) . . . . . . . . . . . . . . . . . . 12
2.2.1. Resource . . . . . . . . . . . . . . . . . . . . . . . . . . . . . . . . 122.2.2. Property . . . . . . . . . . . . . . . . . . . . . . . . . . . . . . . . 132.2.3. Statement . . . . . . . . . . . . . . . . . . . . . . . . . . . . . . . 132.2.4. Resource Description Framework (RDF) Serialization Formats . 14
2.3. Ontology . . . . . . . . . . . . . . . . . . . . . . . . . . . . . . . . . . . . 172.3.1. Ontology Languages . . . . . . . . . . . . . . . . . . . . . . . . . 18
2.4. SPARQL Query Language . . . . . . . . . . . . . . . . . . . . . . . . . . 192.5. Triplestore . . . . . . . . . . . . . . . . . . . . . . . . . . . . . . . . . . . . 20
3. Linked Data Quality Dimension and Metrics 213.1. Conceptualization . . . . . . . . . . . . . . . . . . . . . . . . . . . . . . . 21
3.1.1. Data Quality . . . . . . . . . . . . . . . . . . . . . . . . . . . . . . 213.1.2. Data Quality Problems . . . . . . . . . . . . . . . . . . . . . . . . 223.1.3. Data Quality Dimensions and Metrics . . . . . . . . . . . . . . . 233.1.4. Data Quality Assessment Methodology . . . . . . . . . . . . . . 23
3.2. Linked Data Quality dimensions . . . . . . . . . . . . . . . . . . . . . . . 233.2.1. Accessibility dimensions . . . . . . . . . . . . . . . . . . . . . . . 24
VII
Contents
3.2.2. Intrinsic dimensions . . . . . . . . . . . . . . . . . . . . . . . . . 303.2.3. Contextual dimensions . . . . . . . . . . . . . . . . . . . . . . . . 383.2.4. Representational dimensions . . . . . . . . . . . . . . . . . . . . 443.2.5. Inter-relationships between dimensions . . . . . . . . . . . . . . 47
3.3. Summary . . . . . . . . . . . . . . . . . . . . . . . . . . . . . . . . . . . . 49
4. User-Driven Linked Data Quality Evaluation 514.1. Assessment Methodology . . . . . . . . . . . . . . . . . . . . . . . . . . . 524.2. Quality Problem Taxonomy . . . . . . . . . . . . . . . . . . . . . . . . . . 55
4.2.1. Accuracy . . . . . . . . . . . . . . . . . . . . . . . . . . . . . . . . 554.2.2. Relevancy . . . . . . . . . . . . . . . . . . . . . . . . . . . . . . . 574.2.3. Representational-consistency . . . . . . . . . . . . . . . . . . . . 594.2.4. Interlinking . . . . . . . . . . . . . . . . . . . . . . . . . . . . . . 59
4.3. A Crowdsourcing Quality Assessment Tool . . . . . . . . . . . . . . . . . 594.4. Evaluation of DBpedia Data Quality . . . . . . . . . . . . . . . . . . . . . 60
4.4.1. Evaluation Methodology . . . . . . . . . . . . . . . . . . . . . . . 604.4.2. Evaluation Results . . . . . . . . . . . . . . . . . . . . . . . . . . 61
4.5. Summary . . . . . . . . . . . . . . . . . . . . . . . . . . . . . . . . . . . . 64
5. Crowdsourcing Linked Data Quality Assessment 665.1. Linked Data Quality Issues . . . . . . . . . . . . . . . . . . . . . . . . . . 675.2. Crowdsourcing . . . . . . . . . . . . . . . . . . . . . . . . . . . . . . . . . 69
5.2.1. Contest-based Crowdsourcing . . . . . . . . . . . . . . . . . . . . 705.2.2. Paid Microtasks . . . . . . . . . . . . . . . . . . . . . . . . . . . . 72
5.3. Evaluation . . . . . . . . . . . . . . . . . . . . . . . . . . . . . . . . . . . . 745.3.1. Experimental Design . . . . . . . . . . . . . . . . . . . . . . . . . 755.3.2. Results . . . . . . . . . . . . . . . . . . . . . . . . . . . . . . . . . 76
5.4. Discussion . . . . . . . . . . . . . . . . . . . . . . . . . . . . . . . . . . . . 805.5. Summary . . . . . . . . . . . . . . . . . . . . . . . . . . . . . . . . . . . . 81
6. Semi-automated Quality Assessment of Linked Data 826.1. Data Quality Metrics . . . . . . . . . . . . . . . . . . . . . . . . . . . . . . 826.2. Summary . . . . . . . . . . . . . . . . . . . . . . . . . . . . . . . . . . . . 88
7. Use Case Leveraging on Data Quality 897.1. Linked Data and Data Quality on the Web . . . . . . . . . . . . . . . . . 897.2. Background and Research Question . . . . . . . . . . . . . . . . . . . . . 90
7.2.1. Previous Efforts . . . . . . . . . . . . . . . . . . . . . . . . . . . . 907.2.2. Limitations . . . . . . . . . . . . . . . . . . . . . . . . . . . . . . . 917.2.3. Research Question . . . . . . . . . . . . . . . . . . . . . . . . . . 93
7.3. Methodology and Datasets . . . . . . . . . . . . . . . . . . . . . . . . . . 937.3.1. Methodology . . . . . . . . . . . . . . . . . . . . . . . . . . . . . 937.3.2. Datasets, Variables and Data Extraction . . . . . . . . . . . . . . 96
VIII
Contents
7.4. Results . . . . . . . . . . . . . . . . . . . . . . . . . . . . . . . . . . . . . . 1007.4.1. Data Quality Assessment . . . . . . . . . . . . . . . . . . . . . . . 1007.4.2. HER Observatory . . . . . . . . . . . . . . . . . . . . . . . . . . . 103
7.5. Summary, Impact, Limitations and Future Work . . . . . . . . . . . . . . 109
8. Related Work 1118.1. Data Quality Dimensions . . . . . . . . . . . . . . . . . . . . . . . . . . . 1118.2. Data Quality Assessment Efforts . . . . . . . . . . . . . . . . . . . . . . . 1118.3. Data Quality Assessment Tools . . . . . . . . . . . . . . . . . . . . . . . . 1138.4. Calculation of Societal Progress Indicators . . . . . . . . . . . . . . . . . 116
9. Conclusions and Future Work 1179.1. Summary of Contributions . . . . . . . . . . . . . . . . . . . . . . . . . . 117
9.1.1. Descriptions of data quality dimensions and metrics . . . . . . . 1179.1.2. User-driven data quality assessment methodologies . . . . . . . 1189.1.3. Consumption of Linked Data leveraging on data quality . . . . . 119
9.2. Limitations and Future Work . . . . . . . . . . . . . . . . . . . . . . . . . 1209.2.1. Quality Assessment Methodology for Linked Data . . . . . . . . 1209.2.2. Quality Assessment Tools for Linked Data . . . . . . . . . . . . 1219.2.3. Consumption of Linked Data leveraging on Data Quality . . . . 121
A. Curriculum Vitae 122
List of Abbreviations 129
List of Tables 131
List of Figures 133
Selbstandigkeitserklarung 149
IX
1. Introduction
1.1. Linked Data and Data Quality on the Web
The World Wide Web (WWW), since its inception, has drastically altered the waywe share knowledge by publishing documents as part of a global information space.This Web of Documents contains hypertext links that enables users to traverse thisinformation using Web browsers. Despite the inarguable benefits that the Web provides,until recently the same principles that enabled the Web of Documents to expand have notbeen applied to data. Traditionally, data published on the Web is available in a variety offormats such as CSV or XML, or marked up as HTML tables, neglecting much of itsstructure and semantics. These diverse formats are not expressive enough to enable thelinking of individual facts/entities in a particular document to be connected to relatedfacts/entities in another document.
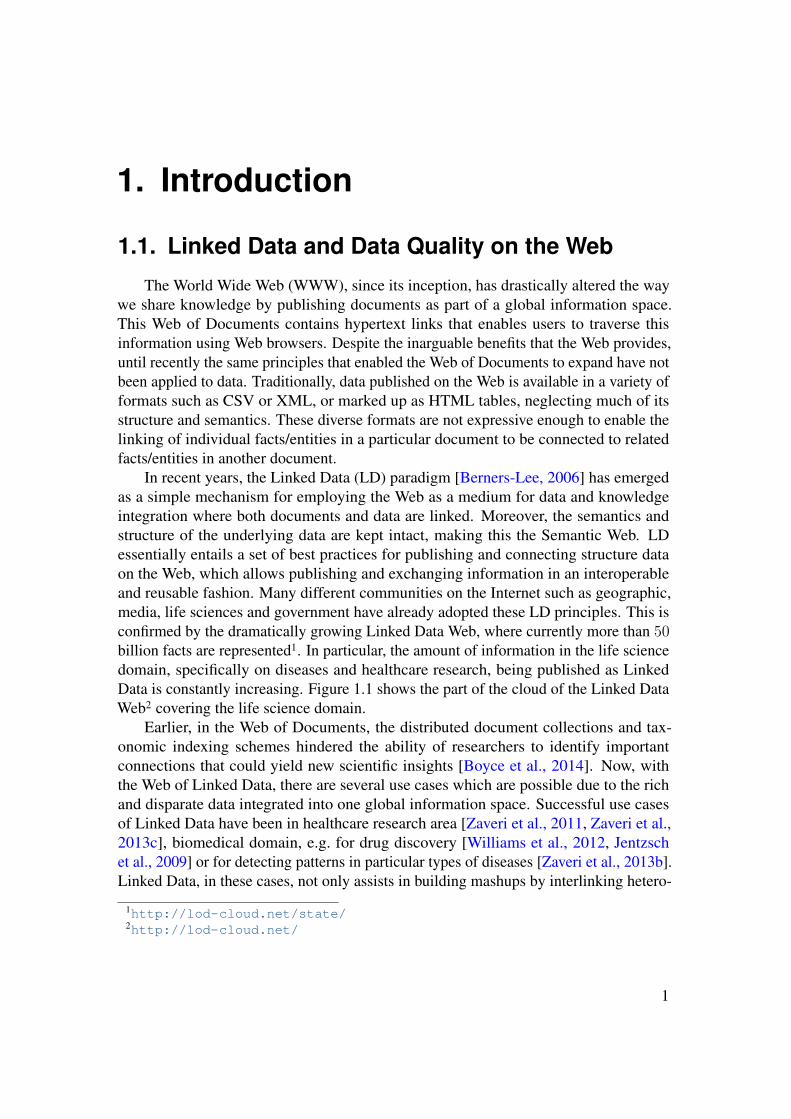
In recent years, the Linked Data (LD) paradigm [Berners-Lee, 2006] has emergedas a simple mechanism for employing the Web as a medium for data and knowledgeintegration where both documents and data are linked. Moreover, the semantics andstructure of the underlying data are kept intact, making this the Semantic Web. LDessentially entails a set of best practices for publishing and connecting structure dataon the Web, which allows publishing and exchanging information in an interoperableand reusable fashion. Many different communities on the Internet such as geographic,media, life sciences and government have already adopted these LD principles. This isconfirmed by the dramatically growing Linked Data Web, where currently more than 50billion facts are represented1. In particular, the amount of information in the life sciencedomain, specifically on diseases and healthcare research, being published as LinkedData is constantly increasing. Figure 1.1 shows the part of the cloud of the Linked DataWeb2 covering the life science domain.
Earlier, in the Web of Documents, the distributed document collections and tax-onomic indexing schemes hindered the ability of researchers to identify importantconnections that could yield new scientific insights [Boyce et al., 2014]. Now, withthe Web of Linked Data, there are several use cases which are possible due to the richand disparate data integrated into one global information space. Successful use casesof Linked Data have been in healthcare research area [Zaveri et al., 2011, Zaveri et al.,2013c], biomedical domain, e.g. for drug discovery [Williams et al., 2012, Jentzschet al., 2009] or for detecting patterns in particular types of diseases [Zaveri et al., 2013b].Linked Data, in these cases, not only assists in building mashups by interlinking hetero-
1http://lod-cloud.net/state/2http://lod-cloud.net/
1
1. Introduction
Figure 1.1.: The life science Linked Data Web.
geneous and dispersed data from multiple sources but also empowers the uncoveringof meaningful and impactful relationships. These discoveries have paved the way forscientists to explore the existing data and uncover meaningful outcomes that they mightnot have been aware of previously.
In all these use cases utilizing LD, one crippling problem is the underlying dataquality. Incomplete, inconsistent or inaccurate data affects the end results gravely, thusmaking them unreliable. In [Orr, 1998], data quality is “the measure of the agreementbetween the data views presented by an information system and that same data in thereal world”, however, it is commonly conceived as fitness for use [Juran, 1974, Wangand Strong, 1996] for a certain application or use case. There are cases when datasets,that contain quality problems, are useful for particular applications, thus depending onthe use case at hand. Linked Data on the Web is either created from structured datasources (such as relational databases), from semi-structured sources (such as Wikipedia),or from unstructured sources (such as text). Thus, in the case of DBpedia [Lehmannet al., 2014, Morsey et al., 2012] (the LD version of Wikipedia), the quality is sufficientfor providing facts about general information. However, when using this informationto making important decisions, such as in case of a medical application, the quality isinsufficient [Zaveri et al., 2013a]. The insufficient data quality can be caused either bythe LD publication process or is intrinsic to the data source itself. Thus, LD consumptionhas to deal with the problem of getting the data into a state in which it can be exploitedfor real use cases.
A key challenge is to assess the quality of datasets published on the Web and makethis quality information explicit. Assessing data quality is particularly a challenge in
2
1.2. User Scenario
LD as the underlying data stems from a set of multiple, autonomous and evolving datasources. Moreover, the dynamic nature of LD makes assessing the quality crucial tomeasure the accuracy of representing the real-world data. On the document Web, dataquality can only be indirectly or vaguely defined, but there is a requirement for moreconcrete and measurable data quality metrics for LD. Such data quality metrics includecorrectness of facts wrt. the real-world, adequacy of semantic representation, quality ofinterlinks, interoperability, timeliness or consistency with regard to implicit information.Even though data quality is an important concept in LD, there are few methodologiesproposed to assess the quality of these datasets. Thus, in this thesis, we investigate thefollowing research areas:
• different user-driven data quality assessment methodologies particularly for LD
• consumption of LD for a particular use case leveraging on data quality
1.2. User Scenario
Ms. Sharma, a healthcare policy maker is interested in knowing which diseasesrepresent the largest threat to the citizens of India and for which of these are the affordableand effective treatment options currently available. She is looking to improve healthoutcomes and lower the cost of the delivery of healthcare services for individuals withspecific needs. Obtaining this information will help her in allocating funds appropriatelyto develop corresponding treatment options and to conduct clinical trials in India forthat disease. Since this information (combining the threat information and the treatmenteffectiveness of diseases) is not explicitly present in any one source, Ms. Sharma needsto gather information from different sources.
First, she looks up the World Health Organization (WHO) website to ascertain whichdiseases (and their regional variations) are currently the most prevalent in developingregions in India. After manually searching through the many reports, she discoversthat a particular variant of tuberculosis is becoming more and more prevalent, thatis the Multi-drug-resistant tuberculosis (MDR-TB). Next, she looks up the http://clinicaltrials.gov website and uses the keyword “Tuberculosis” in order tofind the countries where the most number of clinical trials for tuberculosis are beingconducted. Her query results in a list of the clinical trials for tuberculosis containing allthe information that is reported for each clinical trial such as verification date, sponsor,secondary outcomes etc., which is not relevant for his analysis. Therefore, an additionalburden for her is to extract relevant information from each of the trials and store it in aseparate file.
After retrieving the results from his query, she finds that some of the trials do notcontain complete and accurate information, which may hamper the results. In other trails,she notices that the data is not updated and thus her analysis misses out on valuableinformation. Also, after extracting relevant information from the datasets, she needs toperform statistical tests on the data. But, since the datasets are not in a single format andnot aligned with each other, she has to manually record the values in another file in a
3
1. Introduction
format, which will help in the statistical calculation. This task of manually gatheringstatistical values is a very cumbersome and time-consuming process and may also leadto errors since it involves a lot of manual work. Additionally, analyzing the results willalso pose problems in case any of the presumptions (such as the region, type of diseaseor time frame of the analysis) need to be changed. Also, she will not be able to viewthe disparity over time as this information is also dispersed and difficult to calculatemanually. Due to these obstacles, the analysis performed consequently leads to aninappropriate allocation of funds neglecting the most threatening diseases, despite thesignificant amount of work Ms. Sharma spend in this case.
1.3. Challenges
We identified the following challenges in the area of data quality, specifically forLD, and of the role of data quality for optimal utilization of LD: (1) Lack of unifieddescriptions for data quality dimensions and metrics for Linked Data, (2) Lack of user-driven data quality assessment methodologies for Linked Data and (3) Lack of qualityassessment of datasets before utilization in particular use cases, which we outline in thissection.
1.3.1. Lack of unified descriptions for data qualitydimensions and metrics for Linked Data
There have been several different definitions as well as classifications of data qualitydimensions and metrics proposed in the literature [Wang and Strong, 1996, Wand andWang, 1996, Redman, 1997, Naumann, 2002, Batini and Scannapieco, 2006, Jarke et al.,2010]. These concepts focus on non or semi-structured data sources. Bizer [Bizer, 2007]adapted these concepts and proposed several data quality dimensions into a classificationscheme specifically for LD. Recently, however, there have been different notions ofdata quality in terms of the dimensions as well as the metrics that should be consideredwhile assessing the quality of LD [Furber and Hepp, 2011, Mendes et al., 2012b, Hoganet al., 2012, Gamble and Goble, 2011]. But, there is no consensus on the definitions ofthese data quality concepts or the categorization. Moreover, means of measuring thesedimensions i.e. the metrics are not clearly assigned to each dimension. Thus, one is leftwith a myriad of data quality problems but without a guide to understand, appropriatelychoose and measure them.
1.3.2. Lack of user-driven data quality assessmentmethodologies for Linked Data
Data quality assessment is a well-known issue for data in any format, right fromunstructured content to relational databases. In the case of Linked Data specifically, therehave been several data quality assessment methodologies that have been proposed [Flem-ming, 2011, Gueret et al., 2012b, Mendes et al., 2012b]. However, these methodologies
4
1.4. Research Questions and Contributions
are either very specific to a domain, thus being inapplicable to all use cases and unableto provide meaningful results for the task at hand.
There are several data quality metrics belonging to certain dimensions, whichcannot be measured quantitatively, but require human judgement. Trustworthiness,relevancy, understandability are few examples, which require the user to subjectivelymeasure the dimension. However, the existing methodologies do not involve users, be itpublishers or consumers, in the assessment process. These methodologies are either fullyautomated, inhibiting the users from choosing the dataset of interest or semi-automated,thus demanding considerable amount of user expertise. Thus, the users are unable tochoose the quality requirements of interest and are provided with results, which are hardto interpret thus leaving the user without clear insights as to how to improve the qualityof the data used.
1.3.3. Lack of quality assessment of datasets beforeutilization in particular use cases
With a huge amount of data recently being published on the Web as LD, severaldifferent use cases are being made possible in different domains. However, one of themain obstacles for the reliability of the results of these use cases is the data quality. Withdata being either incomplete or inconsistent or in some cases, untrustworthy, these usecases are unreliable. Recent studies have shown that majority of these datasets sufferfrom data quality problems [Hogan et al., 2012]. However, there are very few studiesthat undertake quality assessment measures before utilizing the data in particular usecases. These datasets are used directly and the poor data quality significantly affects theresults.
1.4. Research Questions and Contributions
In this section, we outline the key research questions (RQ) that address the afore-mentioned challenges along with our contributions towards each of them, which are:
• RQ1: What are the existing approaches to assess the quality of Linked Dataemploying a conceptual framework integrating prior approaches?
– RQ1.1: What are the data quality problems that each approach assesses?
– RQ1.2: Which are the data quality dimensions and metrics supported by theproposed approaches?
• RQ2: How can we assess the quality of Linked Data using a user-driven method-ology?
– RQ2.1 How feasible is it to employ Linked Data experts to assess the qualityissues of LD?
– RQ2.2 How feasible is it to use a combination of user-driven and semi-automated methodology to assess the quality of LD?
5
1. Introduction
– RQ2.3 Is it possible to detect quality issues in LD data sets via crowdsourcingmechanisms?
– RQ2.4 What type of crowd is most suitable for each type of quality issues?
– RQ2.5 Which types of assessment errors are made by lay users and experts?
– RQ2.6 How can we semi-automatically assess the quality of datasets andprovide meaningful results to the user?
• RQ3: How can we exploit Linked Data for building the HER Observatory andensure good data quality?
1.4.1. Descriptions of data quality dimensions and metricsThe research question we aim to answer is:
• RQ1: What are the existing approaches to assess the quality of Linked Dataemploying a conceptual framework integrating prior approaches?
To address this question, we conducted a literature review following the systematicreview procedures described in [Kitchenham, 2004, Moher et al., 2009]. As a result ofthe survey, we identified 30 different approaches that propose a data quality assessmentmethodology, specifically for LD. Further, we divide this general research question intothe following sub-questions:
• RQ1.1: What are the data quality problems that each approach assesses?
• RQ1.2: Which are the data quality dimensions and metrics supported by theproposed approaches?
We first identified the problems that each of the 30 approaches addressed (RQ1.1) andthen mapped these problems to a particular data quality dimension. We then unifiedthe definitions that each approach provides and formalized them (RQ1.2) in Chapter 3for each of the 18 identified dimensions. Additionally, we provided a total of 69metrics for these dimensions (RQ1.2). Furthermore, we classified each metric into beingqualitatively or quantitatively assessed.
1.4.2. User-driven data quality assessment methodologiesThe research question we aim to answer is:
• RQ2: How can we assess the quality of Linked Data using a user-driven method-ology?
In order to address this research question, we present three different data quality assess-ment methodologies, which are user-driven and/or sensitive to a use case. Firstly, wepresent a user-driven methodology for assessing the quality of LD resources comprisingof a manual and a semi-automatic process. The research question we aim to answer is:
6
1.4. Research Questions and Contributions
• RQ2.1 How feasible is it to employ Linked Data experts to assess the quality issuesof LD?
• RQ2.2 How feasible is it to use a combination of user-driven and semi-automatedmethodology to assess the quality of LD?
In the manual process, the first phase includes the detection of common quality problemsand their representation in a quality problem taxonomy. The second phase comprisesof the evaluation of a large number of individual resources, according to the qualityproblem taxonomy, performed by users. This process is accompanied by a tool, namelyTripleCheckMate, wherein a user assesses an individual resource and evaluates each factfor correctness. In this case, the user is a LD expert who is conversant with RDF. Wethen analyze the results to assess the feasibility of this approach (RQ2.1). In case ofthe semi-automatic process, the first phase involves the detection of common qualityproblems by the automatic creation of an extended schema for DBpedia. The secondphase involves the generation and manual verification of schema axioms. We reportresults of applying this methodology to DBpedia and thus assess the feasibility of thisapproach (RQ2.2) in Chapter 4 .
Another means we employ for assessing the quality of LD is via crowdsourcing. Wefurther break down our research question into the following:
• RQ2.3 Is it possible to detect quality issues in LD data sets via crowdsourcingmechanisms?
• RQ2.4 What type of crowd is most suitable for each type of quality issues?
• RQ2.5 Which types of errors are made by lay users and experts?
We utilize the wisdom of the crowd, i.e. workers from online crowdsourcing platformssuch as MTurk, to assess the quality of DBpedia. We analyze the results to assessthe feasibility of this approach (RQ2.3). Then, we use the results from the previoususer-driven assessment (performed by LD experts) and feed them to MTurk. We thencompare the two methodologies in order to determine the type of crowd as well as costand time feasibility of the approaches (RQ2.4). We analyze the types of errors made byusers and experts by comparing the results from both the assessments (RQ2.5). We reportthe results obtained by applying both these methodologies to DBpedia in Chapter 5.
The third assessment methodology we propose is that which implements the dataquality metrics identified in our survey to provide a tool, namely R2RLint, to assess thequality of LD. The research question we aim to answer here is:
• RQ2.6 How can we semi-automatically assess the quality of datasets and providemeaningful results to the user?
This tool takes as input an RDF dump or SPARQL Protocol and RDF Query Language(SPARQL) endpoint and the various quality metrics to assess the quality of any particulardataset. The user can choose which metrics are required based on the use case. Moreover,
7
1. Introduction
the user is not only provided the results of the assessment but also specific entities thatcause the errors, which help users understand the quality issues and thus can fix them. Weprovide the specific dimensions along with detailed explanations of the implementationof the metrics in Chapter 6. The results of the quality assessment of the four datasetsthat are part of our use case are reported in Chapter 7. We discuss the advantagesof this semi-automated quality assessment over the other types of quality assessmentmethodologies discussed earlier.
1.4.3. Consumption of Linked Data leveraging on dataquality
The research question we aim to answer is:
• RQ3: How can we exploit Linked Data for a particular use case and ensure gooddata quality?
In response to this question, we design a use case employing Linked Data to build theHER Observatory of societal progress indicators. We choose four linked datasets andintegrate them to build the HER Observatory, which determines the impact of researchand technology on health and economic performance of countries per year. In order toensure good data quality of the datasets, we perform semi-automated quality assessmenton all the four datasets involved in the use case. We employ the R2RLint tool to performthis assessment, wherein the metrics are chosen based on the use case, thus being usecase specific. Also, the user is provided with the underlying triples causing the qualityproblems, thus being able to improve the quality. We show the importance of the role ofdata quality assessment and improvement in such a use case. We provide details of theuse case, results of the data quality assessment and results of the use case in Chapter 7.
1.5. Thesis Overview
As depicted in Figure 1.2, this thesis is divided into seven chapters, which aredescribed in this section.
• Chapter 2 introduces the concepts of the Semantic Web and its associated tech-nologies, which constitutes the basic scientific background required for the readerto understand the thesis. The chapter introduces the reader to the fundamentals ofthe Semantic Web followed by discussing the RDF language and its components .Thereafter, the various RDF serialization formats (e.g. N-Triples) and the differ-ences among them are explained. Then, the crucial topic of Semantic Web, theontology and the various languages that can be uses to develop the ontologies arediscussed. At the end, the SPARQL query language, triple stores and how theysupport the SPARQL language are described.
• In Chapter 3, 18 data quality dimensions are introduced and defined with the helpof examples. These 18 dimensions have been identified as a result of the systematic
8
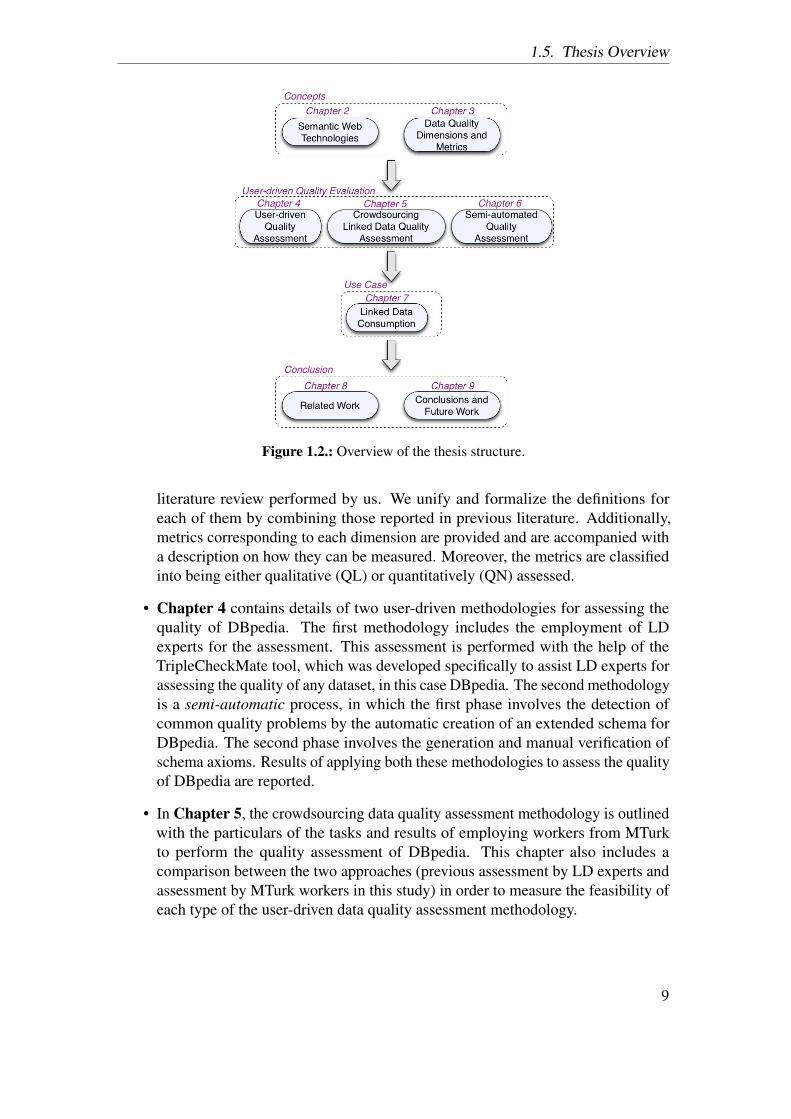
1.5. Thesis Overview
Figure 1.2.: Overview of the thesis structure.
literature review performed by us. We unify and formalize the definitions foreach of them by combining those reported in previous literature. Additionally,metrics corresponding to each dimension are provided and are accompanied witha description on how they can be measured. Moreover, the metrics are classifiedinto being either qualitative (QL) or quantitatively (QN) assessed.
• Chapter 4 contains details of two user-driven methodologies for assessing thequality of DBpedia. The first methodology includes the employment of LDexperts for the assessment. This assessment is performed with the help of theTripleCheckMate tool, which was developed specifically to assist LD experts forassessing the quality of any dataset, in this case DBpedia. The second methodologyis a semi-automatic process, in which the first phase involves the detection ofcommon quality problems by the automatic creation of an extended schema forDBpedia. The second phase involves the generation and manual verification ofschema axioms. Results of applying both these methodologies to assess the qualityof DBpedia are reported.
• In Chapter 5, the crowdsourcing data quality assessment methodology is outlinedwith the particulars of the tasks and results of employing workers from MTurkto perform the quality assessment of DBpedia. This chapter also includes acomparison between the two approaches (previous assessment by LD experts andassessment by MTurk workers in this study) in order to measure the feasibility ofeach type of the user-driven data quality assessment methodology.
9
1. Introduction
• The Chapter 6 proposes another semi-automated methodology for LD qual-ity assessment, which also involves human judgement. In this semi-automatedmethodology, selected metrics are formally defined and implemented as part of atool, namely R2RLint. This work was developed by a colleague from the AKSWgroup but built upon the metrics identified as part of the survey performed by theauthor of this thesis (as described in Chapter 3). The user is not only provided theresults of the assessment but also specific entities that cause the errors, which helpusers understand the quality issues and thus can fix them. Details of these metricsalong with formulae of the assessments are provided in this chapter.
• In Chapter 7, the details of a use case of utilizing LD for building the HERObservatory for several societal progress indicators, is presented. The use caseinvolves the assessment of the impact of research and technology on healthcareand economic performance of each country per year. This chapter also includesthe specifics of performing data quality assessment on the four datasets involved inthis use case by using the semi-automated methodology (described in Chapter 6)backed by user-involvement. Thus, this chapter brings together both the challengesthat this thesis addresses, that is, utilization of LD for a specific use case enhancedwith the assessment of the quality of the datasets involved. We illustrate theimportance of assessment of data quality in this use case and how the quality affectsthe end results. Additionally, we describe the advantages of this semi-automatedquality assessment over the other types of quality assessment methodologiesdiscussed earlier.
• Chapter 8 provides an overview of the state-of-the-art in four areas that are partof this thesis. First, a discussion on the various data quality dimensions alreadyavailable in the literature is presenting portraying that there is no harmony in thedimensions, their definitions and the classification that currently exists. Then, thevarious data quality assessment efforts undertaken are examined. These effortsare either done on the entire Web of Data, LD, a representative part of it or onparticular dataset (e.g. DBpedia). We also discuss the existing efforts on crowd-sourcing quality assessment undertaken. Thereafter, a qualitative comparisonof 12 tools based on eight different attributes is presented. These 12 tools areidentified from the 30 articles that are part of our survey. The eight attributes are (i)accessibility, (ii) licensing, (iii) automation, (iv) collaboration, (v) customizability,(vi) scalability, (vii) usability and (viii) maintenance. Finally, a discussion onthe current efforts to calculate societal progress indicators is provided with thedifferent methodologies and organisations that are involved in this process.
• Finally, Chapter 9 summarizes the main contributions of this thesis and outlinesdirections for future research.
10
2. Semantic Web Technologies
This chapter gives a general overview of the Semantic Web. It describes the basicconcepts, different RDF serialization formats as well as the ontology and its languagesin detail. This chapter is mainly based on [Yu, 2007]1.
The rest of the chapter is organized as follows: In Section 2.1, we define SemanticWeb as a whole. In Section 2.2, we describe RDF and its advantages. In Section 2.2.1,Section 2.2.2 and Section 2.2.3 we describe the basic elements of RDF in more detail. InSection 2.2.4, we introduce the RDF serialization formats. In Section 2.3, we define theterm Ontology. In Section 2.3.1, we describe the ontology languages. In Section 2.4, wedescribe the SPARQL query language. Finally, in Section 2.5, we explain triplestores.
2.1. The Semantic Web Vision
With the widespread adoption of the World Wide Web, it has become a commonplace to share information around the world. This current Web infrastructure supportsa distributed network of web pages that can refer to one another with global linkscalled Uniform Resource Locators (URLs). However, the main idea of the SemanticWeb is to support a distributed Web not at the level of the data rather at the level ofthe representation. The idea is that instead of having one web page indicate another,one data item can indicate another using global references called Uniform ResourceIdentifiers (URIs). The data model used by the Semantic Web infrastructure to representthis distributed web of data is called the Resource Description Framework (describedin Section 2.2).
There are many different definitions of the Semantic Web. Tim Berners-Lee, theinventor of the World Wide Web, defined it as “not a separate Web but an extension ofthe current one, in which information is given well-defined meaning, better enablingcomputers and people to work in cooperation.” [Berners-Lee et al., 2001] In other words,Semantic Web allows the machines not only to present data but also to process it.
There is a dedicated team of people at the World Wide Web consortium workingtowards improving, extending and standardizing the Semantic Web, and many languages,publications, tools have already been developed (e.g. [Tramp et al., 2010]). W3C hasdefined Semantic Web as “the idea of having data on the Web defined and linked in away that it can be used by machines not just for display purposes, but for automation,integration, and reuse of data across various applications.” [World Wide Web Consortium,
1Standard components of the Semantic Web and definitions for them are taken from this book as theyfollow the defined standards and are widely used. Examples for each component are provided by theauthor.
11
2. Semantic Web Technologies
2009] In other words, Semantic Web is the machine-readable Web and can be thoughtof as an efficient way of representing the data on the World Wide Web or as a globallylinked database.
2.2. Resource Description Framework (RDF)
The basic representation languages of the Semantic Web are RDF, RDFS, and WebOntology Language (OWL), with RDF serving as the foundation. RDF is an XML-basedlanguage for describing information contained in a Web resource. This Web resource canbe anything, for example a Web page or a Web site. RDF is the basic building block forsupporting the Semantic Web, and is same as HTML is for the conventional Web. RDFrelies heavily on the infrastructure of the Web, using many of its familiar and provenfeatures, while extending them to provide a foundation for a distributed network of data.
The properties of RDF are:
• RDF is a language recommended by W3C [World Wide Web Consortium, 2004],which serves in managing the distributed data.
• RDF is capable of describing any fact (resource) independent of any domain.
• RDF provides a basis for coding, exchanging, and reusing structured (meta)data.
• RDF is structured; i.e. it is machine-readable. Machines can do useful operationswith the knowledge expressed in RDF.
• RDF allows interoperability among applications by exchanging machine under-standable information on the Web.
RDF has several basic elements, namely Resource, Property and Statement, whichare discussed in the following subsections.
2.2.1. ResourceIn the Semantic Web, we refer to the things in the world that are described by an
RDF expression as resources (or entities or things). The resource can be a Web site, aperson or anything else that one wants to talk about. Resource is identified by a UniformResource Identifier (URI). The rationale of using URIs is that the name of a resourcemust be globally unique.
In fact, the URLs, commonly used for accessing Web sites, are simply a subsetof URIs. URIs take the same format as URLs, for example, http://aksw.org/AmrapaliZaveri and in fact the URL is just a special case of the URI. The mainreason behind this is that the domain name used in the URL is guaranteed to be unique,therefore the uniqueness of the resource is ensured. Any two Web applications in theworld can refer to the same thing by referencing the same URI. Unlike URLs, URIs mayor may not refer to an actual Web site or a Web page.
12
2.2. Resource Description Framework (RDF)
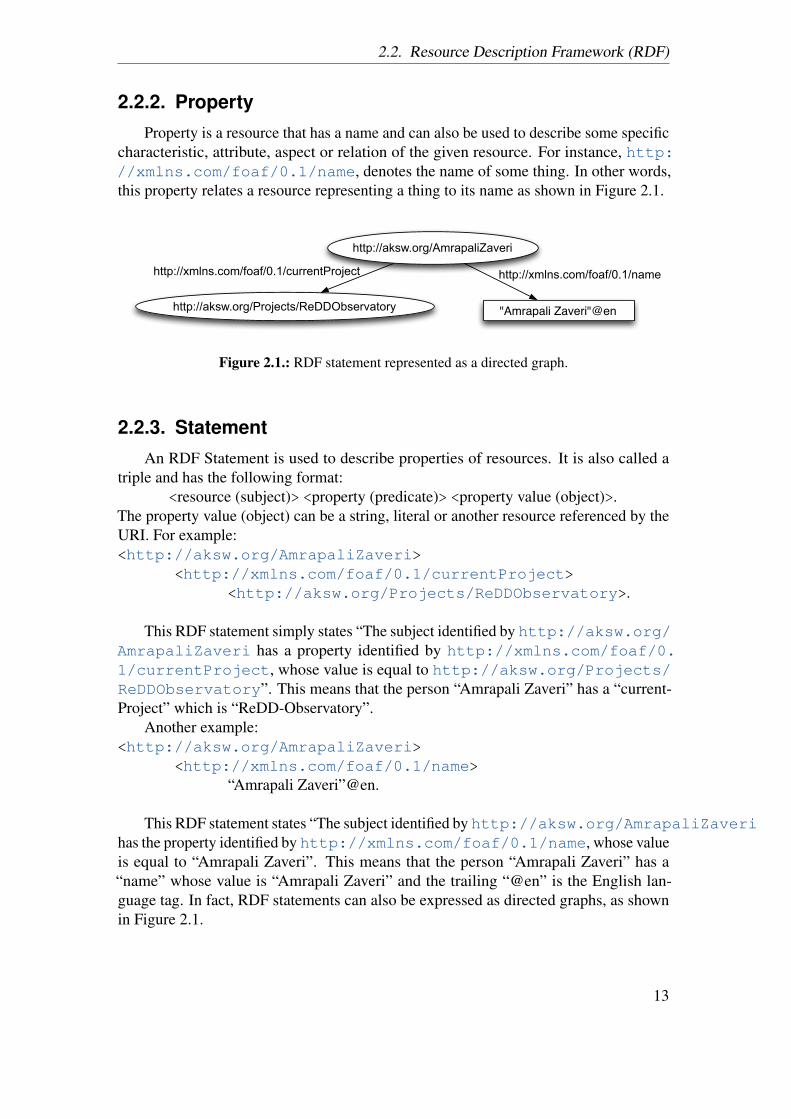
2.2.2. PropertyProperty is a resource that has a name and can also be used to describe some specific
characteristic, attribute, aspect or relation of the given resource. For instance, http://xmlns.com/foaf/0.1/name, denotes the name of some thing. In other words,this property relates a resource representing a thing to its name as shown in Figure 2.1.
http://aksw.org/Projects/ReDDObservatory
http://aksw.org/AmrapaliZaveri
"Amrapali Zaveri"@en
http://xmlns.com/foaf/0.1/namehttp://xmlns.com/foaf/0.1/currentProject
Figure 2.1.: RDF statement represented as a directed graph.
2.2.3. StatementAn RDF Statement is used to describe properties of resources. It is also called a
triple and has the following format:<resource (subject)> <property (predicate)> <property value (object)>.
The property value (object) can be a string, literal or another resource referenced by theURI. For example:<http://aksw.org/AmrapaliZaveri>
<http://xmlns.com/foaf/0.1/currentProject><http://aksw.org/Projects/ReDDObservatory>.
This RDF statement simply states “The subject identified by http://aksw.org/AmrapaliZaveri has a property identified by http://xmlns.com/foaf/0.1/currentProject, whose value is equal to http://aksw.org/Projects/ReDDObservatory”. This means that the person “Amrapali Zaveri” has a “current-Project” which is “ReDD-Observatory”.
Another example:<http://aksw.org/AmrapaliZaveri>
<http://xmlns.com/foaf/0.1/name>“Amrapali Zaveri”@en.
This RDF statement states “The subject identified by http://aksw.org/AmrapaliZaverihas the property identified by http://xmlns.com/foaf/0.1/name, whose valueis equal to “Amrapali Zaveri”. This means that the person “Amrapali Zaveri” has a“name” whose value is “Amrapali Zaveri” and the trailing “@en” is the English lan-guage tag. In fact, RDF statements can also be expressed as directed graphs, as shownin Figure 2.1.
13
2. Semantic Web Technologies
Subject Predicate Object
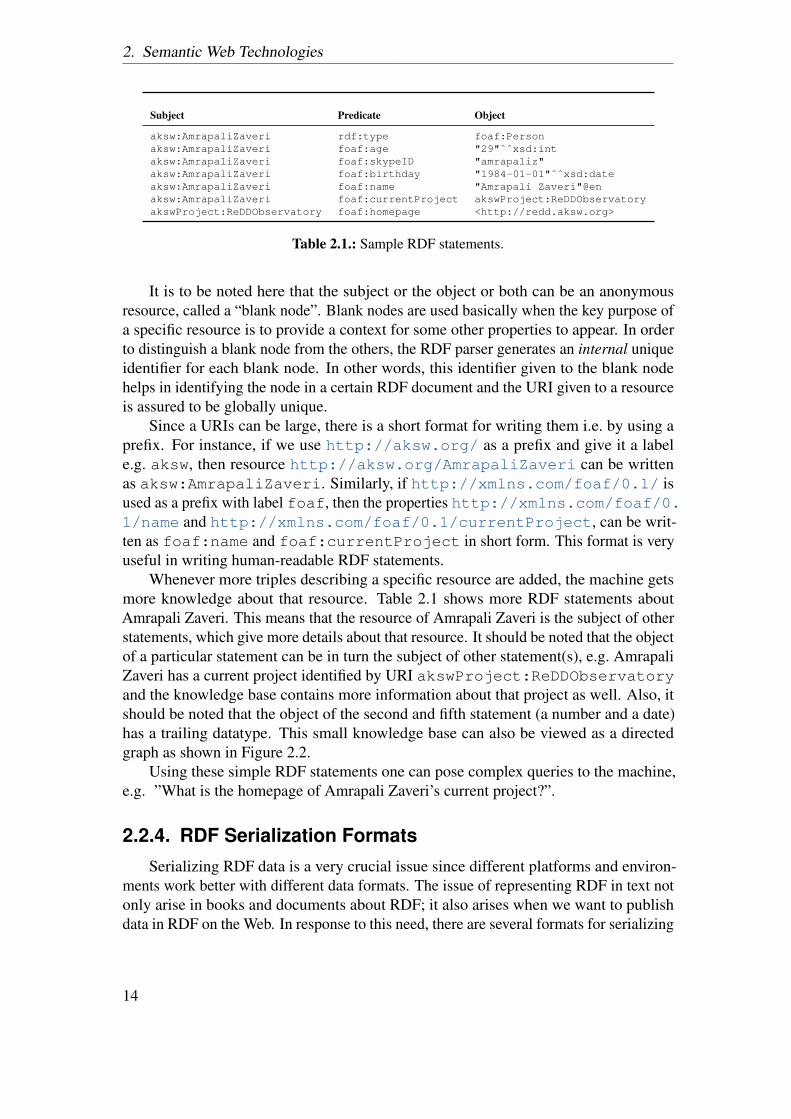
aksw:AmrapaliZaveri rdf:type foaf:Personaksw:AmrapaliZaveri foaf:age "29"ˆˆxsd:intaksw:AmrapaliZaveri foaf:skypeID "amrapaliz"aksw:AmrapaliZaveri foaf:birthday "1984-01-01"ˆˆxsd:dateaksw:AmrapaliZaveri foaf:name "Amrapali Zaveri"@enaksw:AmrapaliZaveri foaf:currentProject akswProject:ReDDObservatoryakswProject:ReDDObservatory foaf:homepage <http://redd.aksw.org>
Table 2.1.: Sample RDF statements.
It is to be noted here that the subject or the object or both can be an anonymousresource, called a “blank node”. Blank nodes are used basically when the key purpose ofa specific resource is to provide a context for some other properties to appear. In orderto distinguish a blank node from the others, the RDF parser generates an internal uniqueidentifier for each blank node. In other words, this identifier given to the blank nodehelps in identifying the node in a certain RDF document and the URI given to a resourceis assured to be globally unique.
Since a URIs can be large, there is a short format for writing them i.e. by using aprefix. For instance, if we use http://aksw.org/ as a prefix and give it a labele.g. aksw, then resource http://aksw.org/AmrapaliZaveri can be writtenas aksw:AmrapaliZaveri. Similarly, if http://xmlns.com/foaf/0.1/ isused as a prefix with label foaf, then the properties http://xmlns.com/foaf/0.1/name and http://xmlns.com/foaf/0.1/currentProject, can be writ-ten as foaf:name and foaf:currentProject in short form. This format is veryuseful in writing human-readable RDF statements.
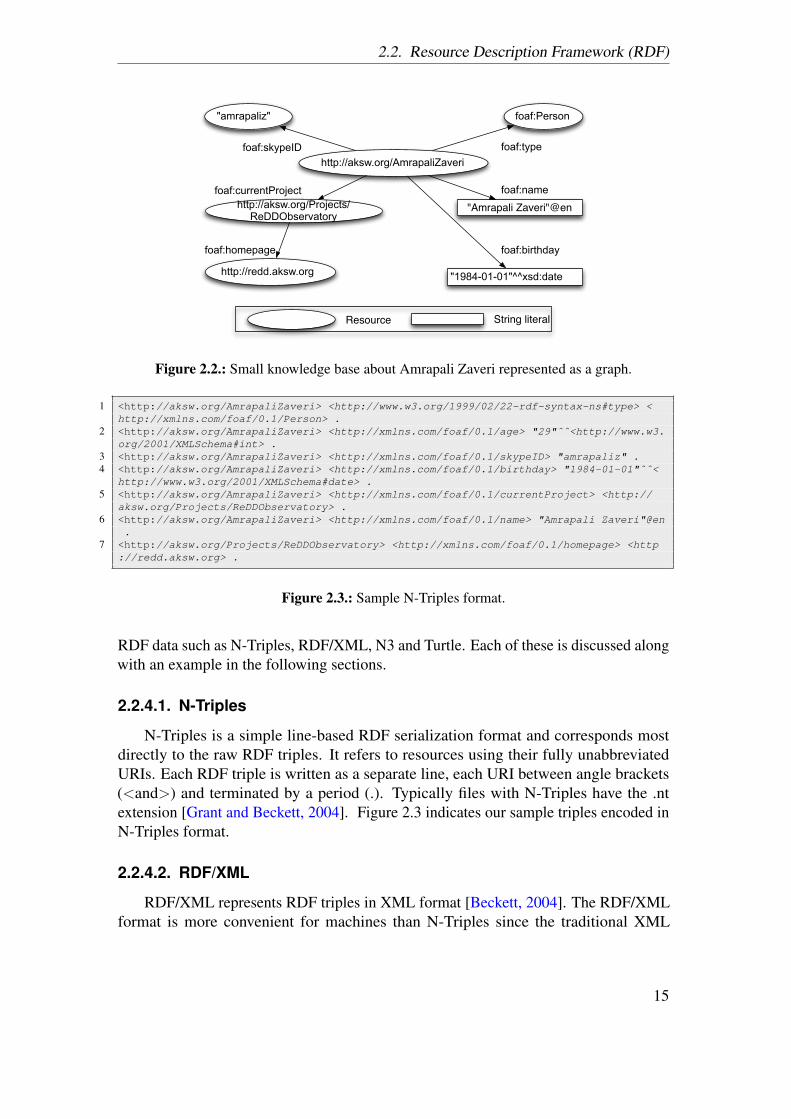
Whenever more triples describing a specific resource are added, the machine getsmore knowledge about that resource. Table 2.1 shows more RDF statements aboutAmrapali Zaveri. This means that the resource of Amrapali Zaveri is the subject of otherstatements, which give more details about that resource. It should be noted that the objectof a particular statement can be in turn the subject of other statement(s), e.g. AmrapaliZaveri has a current project identified by URI akswProject:ReDDObservatoryand the knowledge base contains more information about that project as well. Also, itshould be noted that the object of the second and fifth statement (a number and a date)has a trailing datatype. This small knowledge base can also be viewed as a directedgraph as shown in Figure 2.2.
Using these simple RDF statements one can pose complex queries to the machine,e.g. ”What is the homepage of Amrapali Zaveri’s current project?”.
2.2.4. RDF Serialization FormatsSerializing RDF data is a very crucial issue since different platforms and environ-
ments work better with different data formats. The issue of representing RDF in text notonly arise in books and documents about RDF; it also arises when we want to publishdata in RDF on the Web. In response to this need, there are several formats for serializing
14
2.2. Resource Description Framework (RDF)
http://aksw.org/Projects/ReDDObservatory
http://aksw.org/AmrapaliZaveri
"Amrapali Zaveri"@enfoaf:namefoaf:currentProject
"amrapaliz" foaf:Person
http://redd.aksw.org "1984-01-01"^^xsd:date
foaf:typefoaf:skypeID
foaf:homepage foaf:birthday
Resource String literal
Figure 2.2.: Small knowledge base about Amrapali Zaveri represented as a graph.
1 <http://aksw.org/AmrapaliZaveri> <http://www.w3.org/1999/02/22-rdf-syntax-ns#type> <http://xmlns.com/foaf/0.1/Person> .
2 <http://aksw.org/AmrapaliZaveri> <http://xmlns.com/foaf/0.1/age> "29"ˆˆ<http://www.w3.org/2001/XMLSchema#int> .
3 <http://aksw.org/AmrapaliZaveri> <http://xmlns.com/foaf/0.1/skypeID> "amrapaliz" .4 <http://aksw.org/AmrapaliZaveri> <http://xmlns.com/foaf/0.1/birthday> "1984-01-01"ˆˆ<
http://www.w3.org/2001/XMLSchema#date> .5 <http://aksw.org/AmrapaliZaveri> <http://xmlns.com/foaf/0.1/currentProject> <http://
aksw.org/Projects/ReDDObservatory> .6 <http://aksw.org/AmrapaliZaveri> <http://xmlns.com/foaf/0.1/name> "Amrapali Zaveri"@en
.7 <http://aksw.org/Projects/ReDDObservatory> <http://xmlns.com/foaf/0.1/homepage> <http
://redd.aksw.org> .
Figure 2.3.: Sample N-Triples format.
RDF data such as N-Triples, RDF/XML, N3 and Turtle. Each of these is discussed alongwith an example in the following sections.
2.2.4.1. N-Triples
N-Triples is a simple line-based RDF serialization format and corresponds mostdirectly to the raw RDF triples. It refers to resources using their fully unabbreviatedURIs. Each RDF triple is written as a separate line, each URI between angle brackets(<and>) and terminated by a period (.). Typically files with N-Triples have the .ntextension [Grant and Beckett, 2004]. Figure 2.3 indicates our sample triples encoded inN-Triples format.
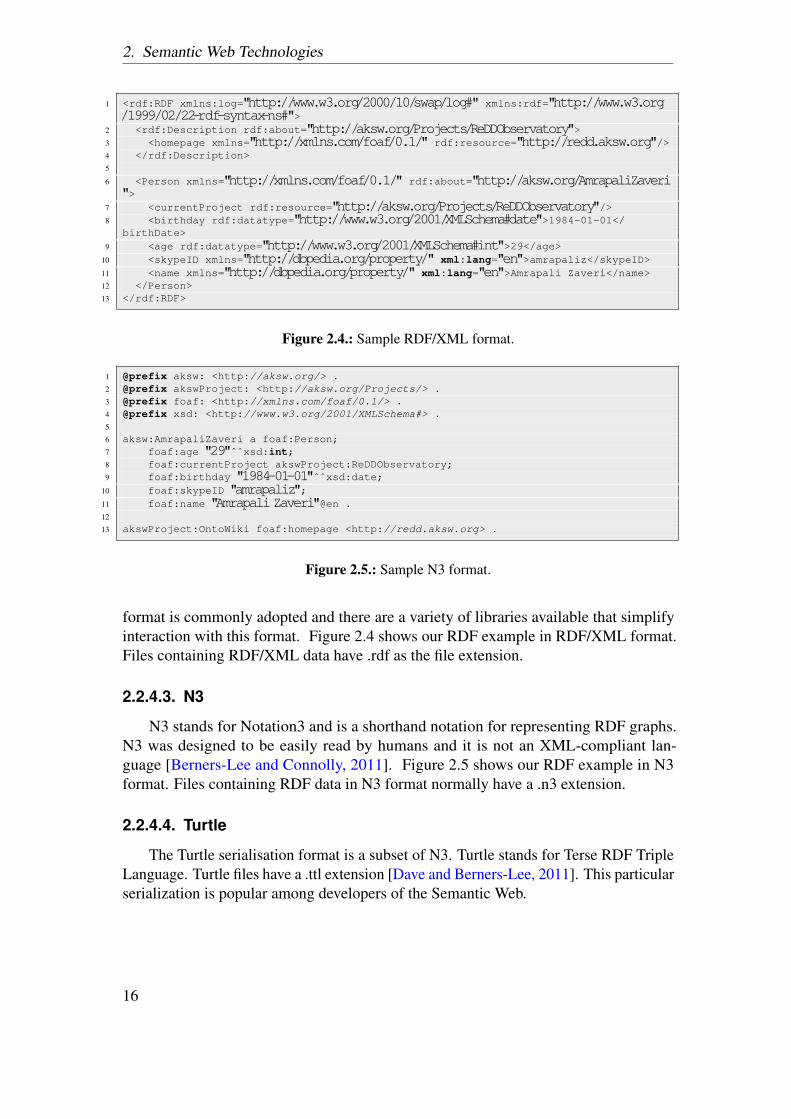
2.2.4.2. RDF/XML
RDF/XML represents RDF triples in XML format [Beckett, 2004]. The RDF/XMLformat is more convenient for machines than N-Triples since the traditional XML
15
2. Semantic Web Technologies
1 <rdf:RDF xmlns:log="http://www.w3.org/2000/10/swap/log#" xmlns:rdf="http://www.w3.org/1999/02/22-rdf-syntax-ns#">
2 <rdf:Description rdf:about="http://aksw.org/Projects/ReDDObservatory">3 <homepage xmlns="http://xmlns.com/foaf/0.1/" rdf:resource="http://redd.aksw.org"/>4 </rdf:Description>5
6 <Person xmlns="http://xmlns.com/foaf/0.1/" rdf:about="http://aksw.org/AmrapaliZaveri">
7 <currentProject rdf:resource="http://aksw.org/Projects/ReDDObservatory"/>8 <birthday rdf:datatype="http://www.w3.org/2001/XMLSchema#date">1984-01-01</
birthDate>9 <age rdf:datatype="http://www.w3.org/2001/XMLSchema#int">29</age>
10 <skypeID xmlns="http://dbpedia.org/property/" xml:lang="en">amrapaliz</skypeID>11 <name xmlns="http://dbpedia.org/property/" xml:lang="en">Amrapali Zaveri</name>12 </Person>13 </rdf:RDF>
Figure 2.4.: Sample RDF/XML format.
1 @prefix aksw: <http://aksw.org/> .2 @prefix akswProject: <http://aksw.org/Projects/> .3 @prefix foaf: <http://xmlns.com/foaf/0.1/> .4 @prefix xsd: <http://www.w3.org/2001/XMLSchema#> .5
6 aksw:AmrapaliZaveri a foaf:Person;7 foaf:age "29"ˆˆxsd:int;8 foaf:currentProject akswProject:ReDDObservatory;9 foaf:birthday "1984-01-01"ˆˆxsd:date;
10 foaf:skypeID "amrapaliz";11 foaf:name "AmrapaliZaveri"@en .12
13 akswProject:OntoWiki foaf:homepage <http://redd.aksw.org> .
Figure 2.5.: Sample N3 format.
format is commonly adopted and there are a variety of libraries available that simplifyinteraction with this format. Figure 2.4 shows our RDF example in RDF/XML format.Files containing RDF/XML data have .rdf as the file extension.
2.2.4.3. N3
N3 stands for Notation3 and is a shorthand notation for representing RDF graphs.N3 was designed to be easily read by humans and it is not an XML-compliant lan-guage [Berners-Lee and Connolly, 2011]. Figure 2.5 shows our RDF example in N3format. Files containing RDF data in N3 format normally have a .n3 extension.
2.2.4.4. Turtle
The Turtle serialisation format is a subset of N3. Turtle stands for Terse RDF TripleLanguage. Turtle files have a .ttl extension [Dave and Berners-Lee, 2011]. This particularserialization is popular among developers of the Semantic Web.
16
2.3. Ontology
2.3. Ontology
W3C defines an ontology as “the terms used to describe and represent an area ofknowledge.” [Heflin, 2004].
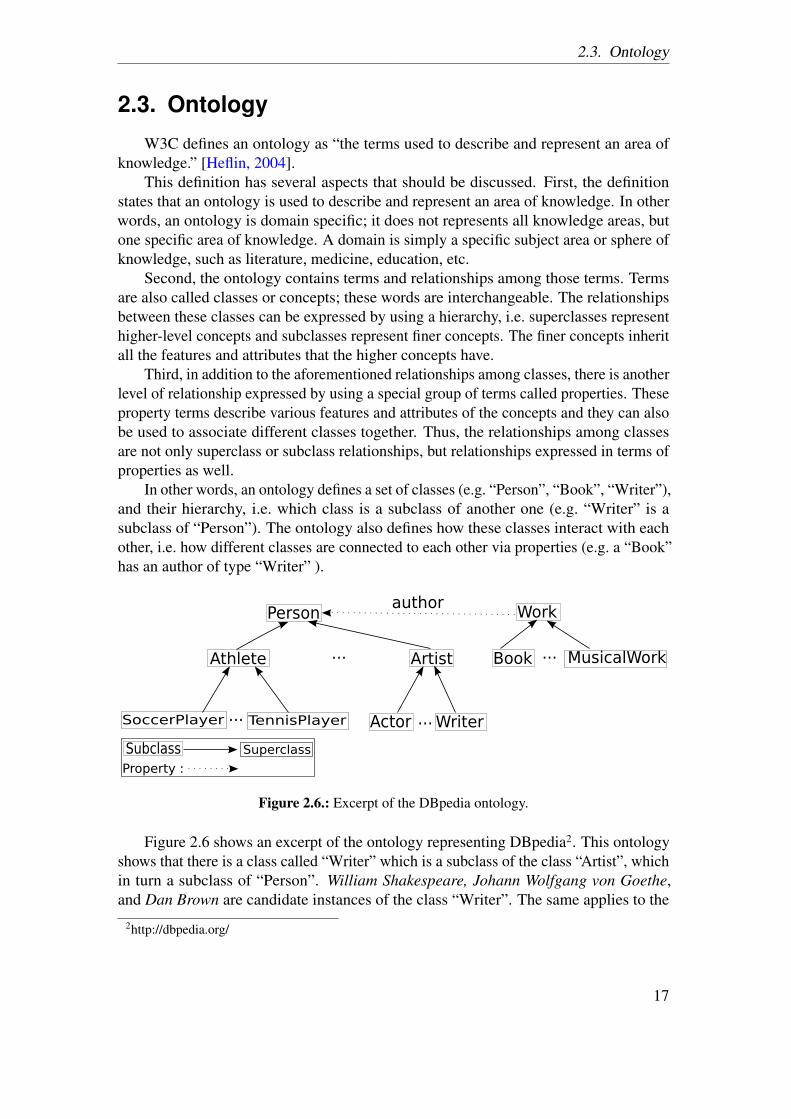
This definition has several aspects that should be discussed. First, the definitionstates that an ontology is used to describe and represent an area of knowledge. In otherwords, an ontology is domain specific; it does not represents all knowledge areas, butone specific area of knowledge. A domain is simply a specific subject area or sphere ofknowledge, such as literature, medicine, education, etc.
Second, the ontology contains terms and relationships among those terms. Termsare also called classes or concepts; these words are interchangeable. The relationshipsbetween these classes can be expressed by using a hierarchy, i.e. superclasses representhigher-level concepts and subclasses represent finer concepts. The finer concepts inheritall the features and attributes that the higher concepts have.
Third, in addition to the aforementioned relationships among classes, there is anotherlevel of relationship expressed by using a special group of terms called properties. Theseproperty terms describe various features and attributes of the concepts and they can alsobe used to associate different classes together. Thus, the relationships among classesare not only superclass or subclass relationships, but relationships expressed in terms ofproperties as well.
In other words, an ontology defines a set of classes (e.g. “Person”, “Book”, “Writer”),and their hierarchy, i.e. which class is a subclass of another one (e.g. “Writer” is asubclass of “Person”). The ontology also defines how these classes interact with eachother, i.e. how different classes are connected to each other via properties (e.g. a “Book”has an author of type “Writer” ).
Person
Athlete Artist...
SoccerPlayer ... TennisPlayer Actor Writer...
Work
MusicalWorkBook ...
author
Subclass Superclass
Property :
Figure 2.6.: Excerpt of the DBpedia ontology.
Figure 2.6 shows an excerpt of the ontology representing DBpedia2. This ontologyshows that there is a class called “Writer” which is a subclass of the class “Artist”, whichin turn a subclass of “Person”. William Shakespeare, Johann Wolfgang von Goethe,and Dan Brown are candidate instances of the class “Writer”. The same applies to the
2http://dbpedia.org/
17
2. Semantic Web Technologies
class “Work” and its subclasses. Note that there is a property called “author” relating aninstance of class “Work” to an instance of the class “Person” i.e. it relates a work to itsauthor. For instance, the book titled “First Folio” is an instance of classes “Work” and“Book”, and related via property “author” to its author “William Shakespeare”, which isan instance of the classes “Person”, “Artist” and “Writer”.
The main benefits of using an ontology are that it:
• enables a shared and common understanding about certain key concepts in adomain,
• facilitates a way for reuse of domain knowledge,
• makes the domain assumptions explicit and
• provides a way to combine knowledge and semantics in such a way that machinescan understand it.
2.3.1. Ontology LanguagesThe question now is “What are the languages used to create ontologies?”. There are
several languages, which can be used to encode ontologies such as Resource DescriptionFramework Schema (RDFS) and OWL.
2.3.1.1. RDFS
RDFS is an ontology language, which can be used to create a vocabulary for de-scribing classes, subclasses and properties of RDF resources and it is a W3C recommen-dation [Brickley and Guha, 2004]. The RDFS language also associates the propertieswith the classes it defines. RDFS can add semantics to RDF predicates and resources,i.e. it defines the meaning of a given term by specifying its properties and what kinds ofobjects these properties can have. It is worth noting here that RDFS is written in RDF,so any RDFS document is a legal RDF document.
2.3.1.2. OWL
The Web Ontology Language (OWL), built on RDFS, is used to create ontologiesand is also a W3C recommendation [Bechhofer et al., 2004]. We can say that OWL= RDFS + new constructs for expressiveness. All classes and properties provided byRDFS can be used in OWL ontologies. OWL and RDFS have the same purpose, whichis defining classes, properties and relations among these classes. OWL has an advantageover RDFS, which is its capability to express more complex relationships.
Due to its expressiveness power, most ontology developers use OWL to developtheir ontologies. For example, an ontology developer can create a new class as the unionor intersection of two or more classes using the expressive power of OWL. With OWLone can also declare that two classes are representing the same thing. For instance,consider the case that there are two separate ontologies created by different developers.
18
2.4. SPARQL Query Language
1 <http://dbpedia.org/ontology/Person> <http://www.w3.org/1999/02/22-rdf-syntax-ns#type><http://www.w3.org/2002/07/owl#Class> .
2 <http://dbpedia.org/ontology/Artist> <http://www.w3.org/1999/02/22-rdf-syntax-ns#type><http://www.w3.org/2002/07/owl#Class> .
3 <http://dbpedia.org/ontology/Artist> <http://www.w3.org/2000/01/rdf-schema#subClassOf><http://dbpedia.org/ontology/Person> .
4 <http://dbpedia.org/ontology/Writer> <http://www.w3.org/1999/02/22-rdf-syntax-ns#type><http://www.w3.org/2002/07/owl#Class> .
5 <http://dbpedia.org/ontology/Writer> <http://www.w3.org/2000/01/rdf-schema#subClassOf><http://dbpedia.org/ontology/Artist> .
6 <http://dbpedia.org/ontology/Work> <http://www.w3.org/1999/02/22-rdf-syntax-ns#type> <http://www.w3.org/2002/07/owl#Class> .
7 <http://dbpedia.org/ontology/Book> <http://www.w3.org/1999/02/22-rdf-syntax-ns#type> <http://www.w3.org/2002/07/owl#Class> .
8 <http://dbpedia.org/ontology/Book> <http://www.w3.org/2000/01/rdf-schema#subClassOf> <http://dbpedia.org/ontology/Work> .
9 <http://dbpedia.org/ontology/author> <http://www.w3.org/1999/02/22-rdf-syntax-ns#type><http://www.w3.org/2002/07/owl#ObjectProperty> .
10 <http://dbpedia.org/ontology/author> <http://www.w3.org/2000/01/rdf-schema#domain> <http://dbpedia.org/ontology/Work> .
11 <http://dbpedia.org/ontology/author> <http://www.w3.org/2000/01/rdf-schema#range> <http://dbpedia.org/ontology/Person> .
Figure 2.7.: OWL representation of a part of an ontology in N-Triples format.
In the first ontology there is a class called “Poet” and in the other ontology there is aclass called “PoetryWriter”. In fact, these classes are equivalent to each other and inRDFS one cannot declare that these classes are equivalent, but with OWL one can.
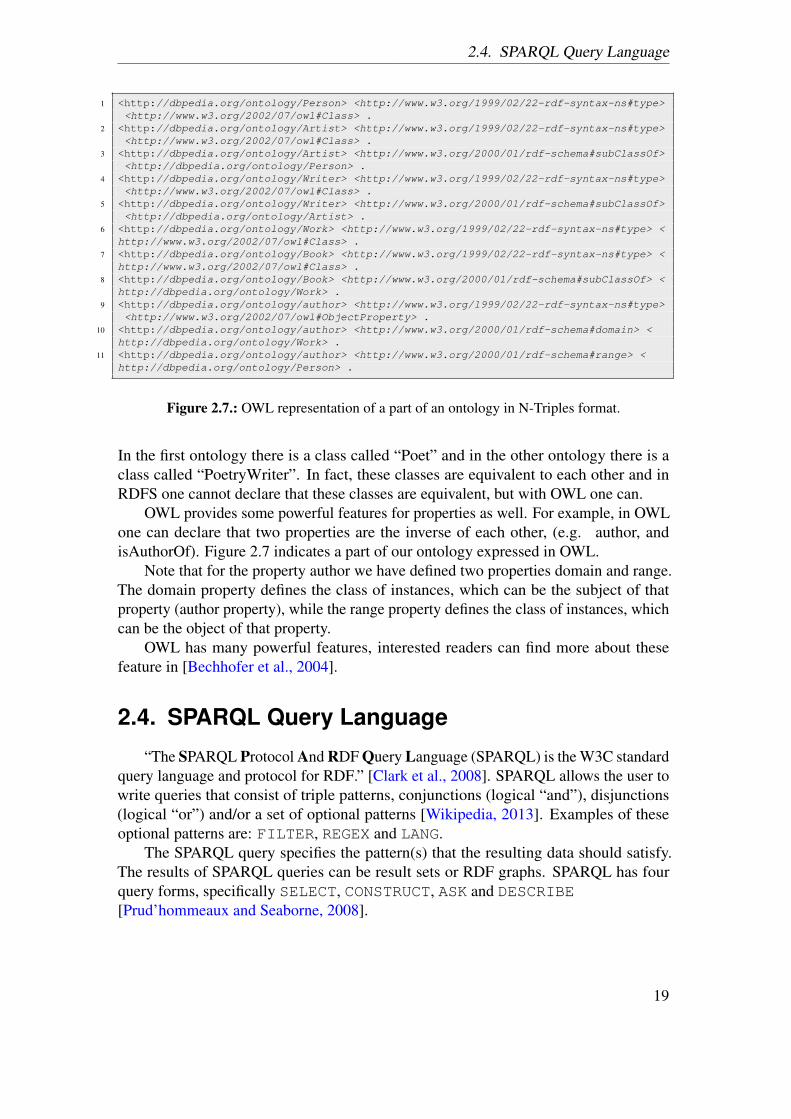
OWL provides some powerful features for properties as well. For example, in OWLone can declare that two properties are the inverse of each other, (e.g. author, andisAuthorOf). Figure 2.7 indicates a part of our ontology expressed in OWL.
Note that for the property author we have defined two properties domain and range.The domain property defines the class of instances, which can be the subject of thatproperty (author property), while the range property defines the class of instances, whichcan be the object of that property.
OWL has many powerful features, interested readers can find more about thesefeature in [Bechhofer et al., 2004].
2.4. SPARQL Query Language
“The SPARQL Protocol And RDF Query Language (SPARQL) is the W3C standardquery language and protocol for RDF.” [Clark et al., 2008]. SPARQL allows the user towrite queries that consist of triple patterns, conjunctions (logical “and”), disjunctions(logical “or”) and/or a set of optional patterns [Wikipedia, 2013]. Examples of theseoptional patterns are: FILTER, REGEX and LANG.
The SPARQL query specifies the pattern(s) that the resulting data should satisfy.The results of SPARQL queries can be result sets or RDF graphs. SPARQL has fourquery forms, specifically SELECT, CONSTRUCT, ASK and DESCRIBE[Prud’hommeaux and Seaborne, 2008].
19
2. Semantic Web Technologies
1 PREFIX aksw: <http://aksw.org/>2 PREFIX foaf: <http://xmlns.com/foaf/0.1/>3 SELECT ?homepage4 WHERE {aksw:AmrapaliZaveri foaf:currentProject ?project.5 ?project foaf:homepage ?homepage. }
Figure 2.8.: SPARQL query to get the homepage of Amrapali Zaveri’s current project.
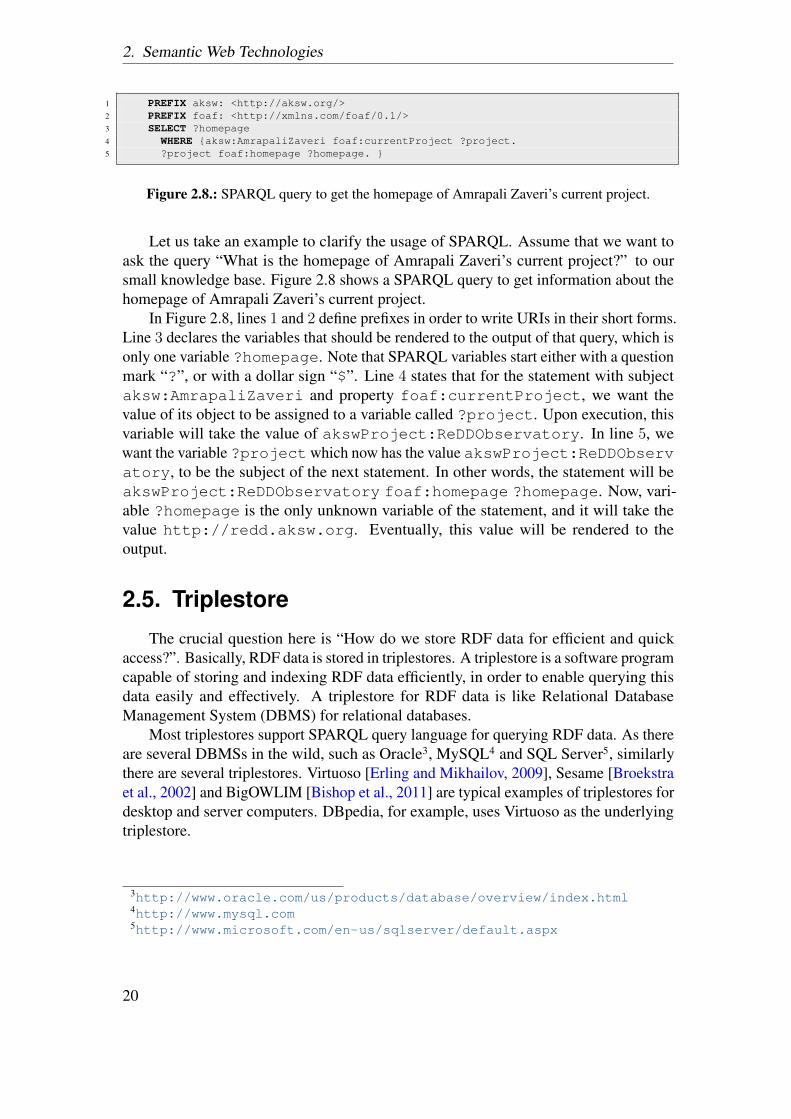
Let us take an example to clarify the usage of SPARQL. Assume that we want toask the query “What is the homepage of Amrapali Zaveri’s current project?” to oursmall knowledge base. Figure 2.8 shows a SPARQL query to get information about thehomepage of Amrapali Zaveri’s current project.
In Figure 2.8, lines 1 and 2 define prefixes in order to write URIs in their short forms.Line 3 declares the variables that should be rendered to the output of that query, which isonly one variable ?homepage. Note that SPARQL variables start either with a questionmark “?”, or with a dollar sign “$”. Line 4 states that for the statement with subjectaksw:AmrapaliZaveri and property foaf:currentProject, we want thevalue of its object to be assigned to a variable called ?project. Upon execution, thisvariable will take the value of akswProject:ReDDObservatory. In line 5, wewant the variable ?projectwhich now has the value akswProject:ReDDObservatory, to be the subject of the next statement. In other words, the statement will beakswProject:ReDDObservatory foaf:homepage ?homepage. Now, vari-able ?homepage is the only unknown variable of the statement, and it will take thevalue http://redd.aksw.org. Eventually, this value will be rendered to theoutput.
2.5. Triplestore
The crucial question here is “How do we store RDF data for efficient and quickaccess?”. Basically, RDF data is stored in triplestores. A triplestore is a software programcapable of storing and indexing RDF data efficiently, in order to enable querying thisdata easily and effectively. A triplestore for RDF data is like Relational DatabaseManagement System (DBMS) for relational databases.
Most triplestores support SPARQL query language for querying RDF data. As thereare several DBMSs in the wild, such as Oracle3, MySQL4 and SQL Server5, similarlythere are several triplestores. Virtuoso [Erling and Mikhailov, 2009], Sesame [Broekstraet al., 2002] and BigOWLIM [Bishop et al., 2011] are typical examples of triplestores fordesktop and server computers. DBpedia, for example, uses Virtuoso as the underlyingtriplestore.
3http://www.oracle.com/us/products/database/overview/index.html4http://www.mysql.com5http://www.microsoft.com/en-us/sqlserver/default.aspx
20
3. Linked Data Quality Dimensionand Metrics
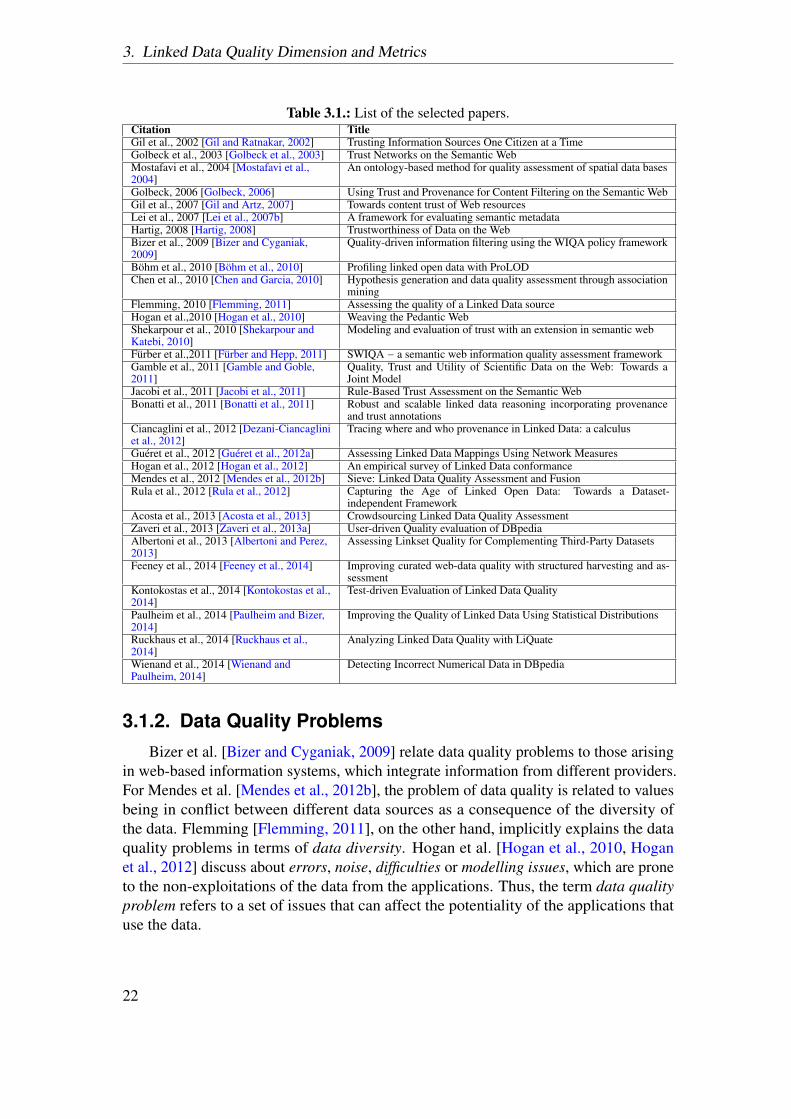
In this chapter, we first describe the basic concepts of data quality and then present alist of 18 quality dimensions and 69 metrics that can be applied for quality assessment ofLD. These dimensions and metrics have been identified as a result of a literature reviewconducted in order to identify the approaches for assessing the quality of LD. As a resultof the systematic literature review, as described in [Zaveri et al., 2015], a total of 30articles (Table 3.1) were identified that proposed methodologies, dimensions and metricsfor quality assessment of LD. We unify and define each dimension and provide differentmeans to measure them (metrics) along with an example for each. The occurrences ofeach dimension in the 30 core articles are illustrated in Table 3.8. These dimensions andmetrics form the core of this thesis as they are used in formulating the quality problemtaxonomy (Chapter 4), which in turn is used to select the types of quality issues thatare presented to the MTurk workers (Chapter 5). Also, specific metrics identified as aresult of this survey are implemented as part of a tool (Chapter 6) and used to assess thequality of four datasets that are part of our use case (Chapter 7). This chapter is basedon [Zaveri et al., 2015].
3.1. Conceptualization
3.1.1. Data QualityData quality is commonly conceived as a multi-dimensional construct with a popular
definition ”‘fitness for use’ [Juran, 1974]”. Data quality may depend on various factors(dimensions or characteristics) such as accuracy, timeliness, completeness, relevancy,objectivity, believability, understandability, consistency, conciseness, availability andverifiability [Wang and Strong, 1996].
In terms of the Semantic Web, there exist different means of assessing data quality.The process of measuring data quality is supported by quality related metadata as well asdata itself. On the one hand, provenance (as a particular case of metadata) information,for example, is an important concept to be considered when assessing the trustworthinessof datasets [Lei et al., 2007a]. On the other hand, the notion of link quality is anotherimportant aspect that is introduced in LD, where it is automatically detected whether alink is useful or not [Gueret et al., 2012a]. It is to be noted that data and information areinterchangeably used in the literature.
21
3. Linked Data Quality Dimension and Metrics
Table 3.1.: List of the selected papers.Citation TitleGil et al., 2002 [Gil and Ratnakar, 2002] Trusting Information Sources One Citizen at a TimeGolbeck et al., 2003 [Golbeck et al., 2003] Trust Networks on the Semantic WebMostafavi et al., 2004 [Mostafavi et al.,2004]
An ontology-based method for quality assessment of spatial data bases
Golbeck, 2006 [Golbeck, 2006] Using Trust and Provenance for Content Filtering on the Semantic WebGil et al., 2007 [Gil and Artz, 2007] Towards content trust of Web resourcesLei et al., 2007 [Lei et al., 2007b] A framework for evaluating semantic metadataHartig, 2008 [Hartig, 2008] Trustworthiness of Data on the WebBizer et al., 2009 [Bizer and Cyganiak,2009]
Quality-driven information filtering using the WIQA policy framework
Bohm et al., 2010 [Bohm et al., 2010] Profiling linked open data with ProLODChen et al., 2010 [Chen and Garcia, 2010] Hypothesis generation and data quality assessment through association
miningFlemming, 2010 [Flemming, 2011] Assessing the quality of a Linked Data sourceHogan et al.,2010 [Hogan et al., 2010] Weaving the Pedantic WebShekarpour et al., 2010 [Shekarpour andKatebi, 2010]
Modeling and evaluation of trust with an extension in semantic web
Furber et al.,2011 [Furber and Hepp, 2011] SWIQA − a semantic web information quality assessment frameworkGamble et al., 2011 [Gamble and Goble,2011]
Quality, Trust and Utility of Scientific Data on the Web: Towards aJoint Model
Jacobi et al., 2011 [Jacobi et al., 2011] Rule-Based Trust Assessment on the Semantic WebBonatti et al., 2011 [Bonatti et al., 2011] Robust and scalable linked data reasoning incorporating provenance
and trust annotationsCiancaglini et al., 2012 [Dezani-Ciancagliniet al., 2012]
Tracing where and who provenance in Linked Data: a calculus
Gueret et al., 2012 [Gueret et al., 2012a] Assessing Linked Data Mappings Using Network MeasuresHogan et al., 2012 [Hogan et al., 2012] An empirical survey of Linked Data conformanceMendes et al., 2012 [Mendes et al., 2012b] Sieve: Linked Data Quality Assessment and FusionRula et al., 2012 [Rula et al., 2012] Capturing the Age of Linked Open Data: Towards a Dataset-
independent FrameworkAcosta et al., 2013 [Acosta et al., 2013] Crowdsourcing Linked Data Quality AssessmentZaveri et al., 2013 [Zaveri et al., 2013a] User-driven Quality evaluation of DBpediaAlbertoni et al., 2013 [Albertoni and Perez,2013]
Assessing Linkset Quality for Complementing Third-Party Datasets
Feeney et al., 2014 [Feeney et al., 2014] Improving curated web-data quality with structured harvesting and as-sessment
Kontokostas et al., 2014 [Kontokostas et al.,2014]
Test-driven Evaluation of Linked Data Quality
Paulheim et al., 2014 [Paulheim and Bizer,2014]
Improving the Quality of Linked Data Using Statistical Distributions
Ruckhaus et al., 2014 [Ruckhaus et al.,2014]
Analyzing Linked Data Quality with LiQuate
Wienand et al., 2014 [Wienand andPaulheim, 2014]
Detecting Incorrect Numerical Data in DBpedia
3.1.2. Data Quality ProblemsBizer et al. [Bizer and Cyganiak, 2009] relate data quality problems to those arising
in web-based information systems, which integrate information from different providers.For Mendes et al. [Mendes et al., 2012b], the problem of data quality is related to valuesbeing in conflict between different data sources as a consequence of the diversity ofthe data. Flemming [Flemming, 2011], on the other hand, implicitly explains the dataquality problems in terms of data diversity. Hogan et al. [Hogan et al., 2010, Hoganet al., 2012] discuss about errors, noise, difficulties or modelling issues, which are proneto the non-exploitations of the data from the applications. Thus, the term data qualityproblem refers to a set of issues that can affect the potentiality of the applications thatuse the data.
22
3.2. Linked Data Quality dimensions
3.1.3. Data Quality Dimensions and MetricsData quality assessment involves the measurement of quality dimensions or criteria
that are relevant to the consumer. The dimensions can be considered as the characteristicsof a dataset. A data quality assessment metric, measure or indicator is a procedurefor measuring a data quality dimension [Bizer and Cyganiak, 2009]. These metricsare heuristics that are designed to fit a specific assessment situation [Leo Pipino andRybold, 2005]. Since dimensions are rather abstract concepts, the assessment metricsrely on quality indicators that allow the assessment of the quality of a data source w.r.tthe criteria [Flemming, 2011]. An assessment score is computed from these indicatorsusing a scoring function.
There are a number of studies, which have identified, defined and grouped dataquality dimensions into different classifications [Wang and Strong, 1996, Wand andWang, 1996, Redman, 1997, Naumann, 2002, Batini and Scannapieco, 2006, Jarke et al.,2010]. For example, Bizer et al. [Bizer and Cyganiak, 2009], classified the data qualitydimensions into three categories according to the type of information that is used as aquality dimension: (i) Content Based − information content itself; (ii) Context Based− information about the context in which information was claimed; (iii) Rating Based− based on the ratings about the data itself or the information provider. However, weidentify further dimensions and classify the dimensions into the (i) Accessibility (ii)Intrinsic (iii) Contextual and (iv) Representational groups.
3.1.4. Data Quality Assessment MethodologyA data quality assessment methodology is defined as the process of evaluating if a
piece of data meets the information consumers need in a specific use case. The processinvolves measuring the quality dimensions that are relevant to the user and comparingthe assessment results with the user’s quality requirements [Bizer and Cyganiak, 2009].
3.2. Linked Data Quality dimensions
After analyzing the 30 selected approaches in detail, we identified a core set of 18different data quality dimensions that can be applied to assess the quality of LD. Wegrouped the identified dimensions according to the classification introduced in [Wangand Strong, 1996]:
• Accessibility dimensions
• Intrinsic dimensions
• Contextual dimensions
• Representational dimensions
23
3. Linked Data Quality Dimension and Metrics
We further re-examine the dimensions belonging to each group and change their mem-bership according to the LD context. In this section, we unify, formalize and adaptthe definition for each dimension according to LD. For each dimension, we identifymetrics and report them too. In total, 69 metrics are provided for all the 18 dimensions.Furthermore, we classify each metric as being quantitatively or qualitatively assessed.Quantitatively (QN) measured metrics are those that are quantified or for which a con-crete value (score) can be calculated. Qualitatively (QL) measured metrics are thosewhich cannot be quantified and depend on the users perception of the respective metric.
In general, a group captures the same essence for the underlying dimensions thatbelong to that group. However, these groups are not strictly disjoint but can partiallyoverlap since there exist trade-offs between the dimensions of each group as describedin Section 3.2.5. Additionally, we provide a general use case scenario and specificexamples for each of the dimensions. In certain cases, the examples point towards thequality of the information systems such as search engines (e.g. performance) and inother cases, about the data itself.
Use case scenario. Since data quality is conceived as “fitness for use”, we introducea specific use case that will allow us to illustrate the importance of each dimension withthe help of an example. The use case is about an intelligent flight search engine, whichrelies on aggregating data from several datasets. The search engine obtains informationabout airports and airlines from an airline dataset (e.g. OurAirports1, OpenFlights2).Information about the location of countries, cities and particular addresses is obtainedfrom a spatial dataset (e.g. LinkedGeoData3). Additionally, aggregators pull all the in-formation related to flights from different booking services (e.g. Expedia4) and representthis information as RDF. This allows a user to query the integrated dataset for a flightbetween any start and end destination for any time period. We will use this scenariothroughout as an example to explain each quality dimension through a quality issue.
3.2.1. Accessibility dimensionsThe dimensions belonging to this category involve aspects related to the access,
authenticity and retrieval of data to obtain either the entire or some portion of the data(or from another linked dataset) for a particular use case. There are five dimensionsthat are part of this group, which are availability, licensing, interlinking, security andperformance. Table 3.2 displays metrics for these dimensions and provides references tothe original literature.
3.2.1.1. Availability
Flemming [Flemming, 2011] referred to availability as the proper functioning ofall access methods. The other articles [Hogan et al., 2010, Hogan et al., 2012] provide
1http://thedatahub.org/dataset/ourairports2http://thedatahub.org/dataset/open-flights3http://linkedgeodata.org4http://www.expedia.com/
24
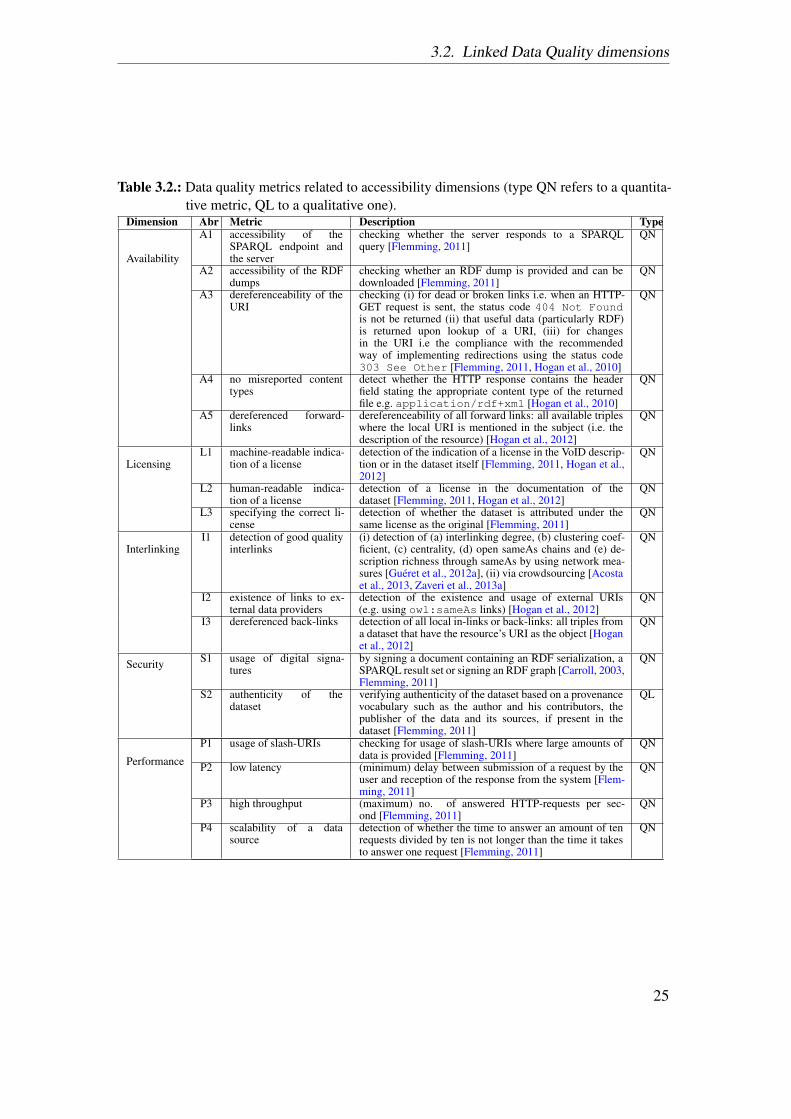
3.2. Linked Data Quality dimensions
Table 3.2.: Data quality metrics related to accessibility dimensions (type QN refers to a quantita-tive metric, QL to a qualitative one).
Dimension Abr Metric Description Type
Availability
A1 accessibility of theSPARQL endpoint andthe server
checking whether the server responds to a SPARQLquery [Flemming, 2011]
QN
A2 accessibility of the RDFdumps
checking whether an RDF dump is provided and can bedownloaded [Flemming, 2011]
QN
A3 dereferenceability of theURI
checking (i) for dead or broken links i.e. when an HTTP-GET request is sent, the status code 404 Not Foundis not be returned (ii) that useful data (particularly RDF)is returned upon lookup of a URI, (iii) for changesin the URI i.e the compliance with the recommendedway of implementing redirections using the status code303 See Other [Flemming, 2011, Hogan et al., 2010]
QN
A4 no misreported contenttypes
detect whether the HTTP response contains the headerfield stating the appropriate content type of the returnedfile e.g. application/rdf+xml [Hogan et al., 2010]
QN
A5 dereferenced forward-links
dereferenceability of all forward links: all available tripleswhere the local URI is mentioned in the subject (i.e. thedescription of the resource) [Hogan et al., 2012]
QN
LicensingL1 machine-readable indica-
tion of a licensedetection of the indication of a license in the VoID descrip-tion or in the dataset itself [Flemming, 2011, Hogan et al.,2012]
QN
L2 human-readable indica-tion of a license
detection of a license in the documentation of thedataset [Flemming, 2011, Hogan et al., 2012]
QN
L3 specifying the correct li-cense
detection of whether the dataset is attributed under thesame license as the original [Flemming, 2011]
QN
InterlinkingI1 detection of good quality
interlinks(i) detection of (a) interlinking degree, (b) clustering coef-ficient, (c) centrality, (d) open sameAs chains and (e) de-scription richness through sameAs by using network mea-sures [Gueret et al., 2012a], (ii) via crowdsourcing [Acostaet al., 2013, Zaveri et al., 2013a]
QN
I2 existence of links to ex-ternal data providers
detection of the existence and usage of external URIs(e.g. using owl:sameAs links) [Hogan et al., 2012]
QN
I3 dereferenced back-links detection of all local in-links or back-links: all triples froma dataset that have the resource’s URI as the object [Hoganet al., 2012]
QN
Security S1 usage of digital signa-tures
by signing a document containing an RDF serialization, aSPARQL result set or signing an RDF graph [Carroll, 2003,Flemming, 2011]
QN
S2 authenticity of thedataset
verifying authenticity of the dataset based on a provenancevocabulary such as the author and his contributors, thepublisher of the data and its sources, if present in thedataset [Flemming, 2011]
QL
Performance
P1 usage of slash-URIs checking for usage of slash-URIs where large amounts ofdata is provided [Flemming, 2011]
QN
P2 low latency (minimum) delay between submission of a request by theuser and reception of the response from the system [Flem-ming, 2011]
QN
P3 high throughput (maximum) no. of answered HTTP-requests per sec-ond [Flemming, 2011]
QN
P4 scalability of a datasource
detection of whether the time to answer an amount of tenrequests divided by ten is not longer than the time it takesto answer one request [Flemming, 2011]
QN
25
3. Linked Data Quality Dimension and Metrics
metrics for this dimension.
Definition 1 (Availability). Availability of a dataset is the extent to which data (or someportion of it) is present, obtainable and ready for use.
Metrics. The metrics identified for availability are:
• A1: checking whether the server responds to a SPARQL query [Flemming, 2011]
• A2: checking whether an RDF dump is provided and can be downloaded [Flem-ming, 2011]
• A3: detection of dereferenceability of URIs by checking:
– for dead or broken links [Hogan et al., 2010], i.e. that when an HTTP-GETrequest is sent, the status code 404 Not Found is not returned [Flemming,2011]
– that useful data (particularly RDF) is returned upon lookup of a URI [Hoganet al., 2010]
– for changes in the URI, i.e. compliance with the recommended way of imple-menting redirections using the status code 303 See Other [Flemming,2011]
• A4: detect whether the HTTP response contains the header field stating the appro-priate content type of the returned file, e.g. application/rdf+xml [Hoganet al., 2010]
• A5: dereferenceability of all forward links: all available triples where the localURI is mentioned in the subject (i.e. the description of the resource) [Hogan et al.,2012]
Example. Let us consider the case in which a user looks up a flight in our flightsearch engine. She requires additional information such as car rental and hotel booking atthe destination, which is present in another dataset and interlinked with the flight dataset.However, instead of retrieving the results, she receives an error response code 404 NotFound. This is an indication that the requested resource cannot be dereferenced and istherefore unavailable. Thus, with this error code, she may assume that either there is noinformation present at that specified URI or the information is unavailable.
3.2.1.2. Licensing
Licensing is a new quality dimensions not considered for relational databases butmandatory in the LD world. Flemming [Flemming, 2011] and Hogan et al. [Hoganet al., 2012] both stated that each RDF document should contain a license under whichthe content can be (re)used, in order to enable information consumers to use the dataunder clear legal terms. Additionally, the existence of a machine-readable indication
26
3.2. Linked Data Quality dimensions
(by including the specifications in a VoID5 description) as well as a human-readableindication of a license are important not only for the permissions a license grants butas an indication of which requirements the consumer has to meet [Flemming, 2011].Although both these studies do not provide a formal definition, they agree on the useand importance of licensing in terms of data quality.
Definition 2 (Licensing). Licensing is defined as the granting of permission for aconsumer to re-use a dataset under defined conditions.
Metrics. The metrics identified for licensing are:
• L1: machine-readable indication of a license in the VoID description or in thedataset itself [Flemming, 2011, Hogan et al., 2012]
• L2: human-readable indication of a license in the documentation of the dataset [Flem-ming, 2011, Hogan et al., 2012]
• L3: detection of whether the dataset is attributed under the same license as theoriginal [Flemming, 2011]
Example. Since our flight search engine aggregates data from several existing datasources, a clear indication of the license allows the search engine to re-use the data fromthe airlines websites. For example, the LinkedGeoData dataset is licensed under theOpen Database License6, which allows others to copy, distribute and use the data andproduce work from the data allowing modifications and transformations. Due to thepresence of this specific license, the flight search engine is able to re-use this dataset topull geo-spatial information and feed it to the search engine.
3.2.1.3. Interlinking
Interlinking is a relevant dimension in LD since it supports data integration. Inter-linking is provided by RDF triples that establish a link between the entity identified bythe subject with the entity identified by the object. Through the typed RDF links, dataitems are effectively interlinked. Even though the core articles in this survey do not con-tain a formal definition for interlinking, they provide metrics for this dimension [Gueretet al., 2012a, Hogan et al., 2010, Hogan et al., 2012].
Definition 3 (Interlinking). Interlinking refers to the degree to which entities that repre-sent the same concept are linked to each other, be it within or between two or more datasources.
Metrics. The metrics identified for interlinking are:
• I1: detection of:
5http://vocab.deri.ie/void6http://opendatacommons.org/licenses/odbl/
27
3. Linked Data Quality Dimension and Metrics
– interlinking degree: how many hubs there are in a network7 [Gueret et al.,2012a]
– clustering coefficient: how dense is the network [Gueret et al., 2012a]
– centrality: indicates the likelihood of a node being on the shortest pathbetween two other nodes [Gueret et al., 2012a]
– whether there are open sameAs chains in the network [Gueret et al., 2012a]
– how much value is added to the description of a resource through the use ofsameAs edges [Gueret et al., 2012a]
• I2: detection of the existence and usage of external URIs (e.g. using owl:sameAslinks) [Hogan et al., 2010, Hogan et al., 2012]
• I3: detection of all local in-links or back-links: all triples from a dataset that havethe resource’s URI as the object [Hogan et al., 2012]
Example. In our flight search engine, the instance of the country "UnitedStates" in the airline dataset should be interlinked with the instance "America" inthe spatial dataset. This interlinking can help when a user queries for a flight, as thesearch engine can display the correct route from the start destination to the end destina-tion by correctly combining information for the same country from both datasets. Sincenames of various entities can have different URIs in different datasets, their interlinkingcan help in disambiguation.
3.2.1.4. Security
Flemming [Flemming, 2011] referred to security as “the possibility to restrict accessto the data and to guarantee the confidentiality of the communication between a sourceand its consumers”. Additionally, Flemming referred to the verifiability dimension as themeans a consumer is provided with to examine the data for correctness. Thus, securityand verifiability point towards the same quality dimension i.e. to avoid alterations of thedataset and verify its correctness.
Definition 4 (Security). Security is the extent to which data is protected against alter-ation and misuse.
Metrics. The metrics identified for security are:
• S1: using digital signatures to sign documents containing an RDF serialization, aSPARQL result set or signing an RDF graph [Flemming, 2011]
• S2: verifying authenticity of the dataset based on provenance information such asthe author and his contributors, the publisher of the data and its sources (if presentin the dataset) [Flemming, 2011]
7In [Gueret et al., 2012a], a network is described as a set of facts provided by the graph of the Web ofData, excluding blank nodes.
28

3.2. Linked Data Quality dimensions
Example: In our use case, if we assume that the flight search engine obtainsflight information from arbitrary airline websites, there is a risk for receiving incorrectinformation from malicious websites. For instance, an airline or sales agency websitecan pose as its competitor and display incorrect flight fares. Thus, by this spoofingattack, this airline can prevent users to book with the competitor airline. In this case,the use of standard security techniques such as digital signatures allows verifying theidentity of the publisher.
3.2.1.5. Performance
Performance is a dimension that has an influence on the quality of the informationsystem or search engine, not on the dataset itself. Flemming [Flemming, 2011] states“the performance criterion comprises aspects of enhancing the performance of a sourceas well as measuring of the actual values”. Also, response-time and performance pointtowards the same quality dimension.
Definition 5 (Performance). Performance refers to the efficiency of a system that bindsto a large dataset, that is, the more performant a data source is the more efficiently asystem can process data.
Metrics. The metrics identified for performance are:
• P1: checking for usage of slash-URIs where large amounts of data is provided8 [Flem-ming, 2011]
• P2: low latency9: (minimum) delay between submission of a request by the userand reception of the response from the system [Flemming, 2011]
• P3: high throughput: (maximum) number of answered HTTP-requests per sec-ond [Flemming, 2011]
• P4: scalability: detection of whether the time to answer an amount of ten requestsdivided by ten is not longer than the time it takes to answer one request [Flemming,2011]
Example. In our use case, the performance may depend on the type and complexityof the query by a large number of users. Our flight search engine can perform well byconsidering response-time when deciding which sources to use to answer a query.
3.2.1.6. Intra-relations
The dimensions in this group are related with each other as follows: performance(response-time) of a system is related to the availability dimension. A dataset can
8http://www.w3.org/wiki/HashVsSlash9Latency is the amount of time from issuing the query until the first information reaches the user [Nau-
mann, 2002].
29
3. Linked Data Quality Dimension and Metrics
perform well only if it is available and has low response time. Also, interlinking isrelated to availability because only if a dataset is available, it can be interlinked andthese interlinks can be traversed. Additionally, the dimensions security and licensing arerelated since providing a license and specifying conditions for re-use helps secure thedataset against alterations and misuse.
3.2.2. Intrinsic dimensionsIntrinsic dimensions are those that are independent of the user’s context. There are
five dimensions that are part of this group, which are syntactic validity, semantic accu-racy, consistency, conciseness and completeness. These dimensions focus on whetherinformation correctly (syntactically and semantically), compactly and completely repre-sents the real world and whether information is logically consistent in itself. Table 3.3provides metrics for these dimensions along with references to the original literature.
3.2.2.1. Syntactic validity
Furber et al. [Furber and Hepp, 2011] classified accuracy into syntactic and semanticaccuracy. He explained that a “value is syntactically accurate, when it is part of a legalvalue set for the represented domain or it does not violate syntactical rules defined forthe domain”. Flemming [Flemming, 2011] defined the term validity of documents as“the valid usage of the underlying vocabularies and the valid syntax of the documents”.We thus associate the validity of documents defined by Flemming to syntactic validity.We similarly distinguish between the two types of accuracy defined by Furber et al. andform two dimensions: Syntactic validity (syntactic accuracy) and Semantic accuracy.Additionally, Hogan et al. [Hogan et al., 2010] identify syntax errors such as RDF/XMLsyntax errors, malformed datatype literals and literals incompatible with datatype range,which we associate with syntactic validity. The other articles [Acosta et al., 2013, Feeneyet al., 2014, Kontokostas et al., 2014, Wienand and Paulheim, 2014, Zaveri et al., 2013a]provide metrics for this dimension.
Definition 6 (Syntactic validity). Syntactic validity is defined as the degree to which anRDF document conforms to the specification of the serialization format.
Metrics. The metrics identified for syntactic validity are:
• SV1: detecting syntax errors using (i) validators [Flemming, 2011, Hogan et al.,2010], (ii) via crowdsourcing [Acosta et al., 2013, Zaveri et al., 2013a]
• SV2: detecting use of:
– explicit definition of the allowed values for a certain datatype, (ii) syntacticrules [Furber and Hepp, 2011], (iii) detecting whether the data conformsto the specific RDF pattern and that the “types” are defined for specificresources [Kontokostas et al., 2014], (iv) use of different outlier techniquesand clustering for detecting wrong values [Wienand and Paulheim, 2014]
30
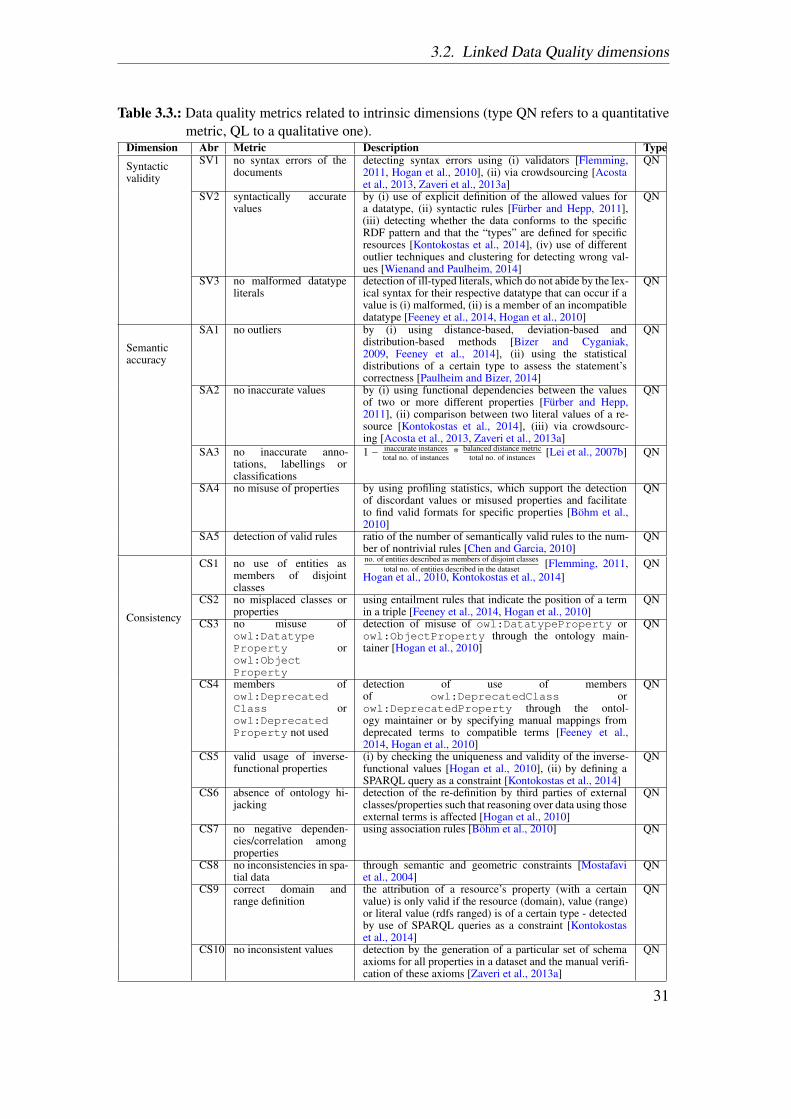
3.2. Linked Data Quality dimensions
Table 3.3.: Data quality metrics related to intrinsic dimensions (type QN refers to a quantitativemetric, QL to a qualitative one).
Dimension Abr Metric Description Type
Syntacticvalidity
SV1 no syntax errors of thedocuments
detecting syntax errors using (i) validators [Flemming,2011, Hogan et al., 2010], (ii) via crowdsourcing [Acostaet al., 2013, Zaveri et al., 2013a]
QN
SV2 syntactically accuratevalues
by (i) use of explicit definition of the allowed values fora datatype, (ii) syntactic rules [Furber and Hepp, 2011],(iii) detecting whether the data conforms to the specificRDF pattern and that the “types” are defined for specificresources [Kontokostas et al., 2014], (iv) use of differentoutlier techniques and clustering for detecting wrong val-ues [Wienand and Paulheim, 2014]
QN
SV3 no malformed datatypeliterals
detection of ill-typed literals, which do not abide by the lex-ical syntax for their respective datatype that can occur if avalue is (i) malformed, (ii) is a member of an incompatibledatatype [Feeney et al., 2014, Hogan et al., 2010]
QN
Semanticaccuracy
SA1 no outliers by (i) using distance-based, deviation-based anddistribution-based methods [Bizer and Cyganiak,2009, Feeney et al., 2014], (ii) using the statisticaldistributions of a certain type to assess the statement’scorrectness [Paulheim and Bizer, 2014]
QN
SA2 no inaccurate values by (i) using functional dependencies between the valuesof two or more different properties [Furber and Hepp,2011], (ii) comparison between two literal values of a re-source [Kontokostas et al., 2014], (iii) via crowdsourc-ing [Acosta et al., 2013, Zaveri et al., 2013a]
QN
SA3 no inaccurate anno-tations, labellings orclassifications
1 − inaccurate instancestotal no. of instances * balanced distance metric
total no. of instances [Lei et al., 2007b] QN
SA4 no misuse of properties by using profiling statistics, which support the detectionof discordant values or misused properties and facilitateto find valid formats for specific properties [Bohm et al.,2010]
QN
SA5 detection of valid rules ratio of the number of semantically valid rules to the num-ber of nontrivial rules [Chen and Garcia, 2010]
QN
Consistency
CS1 no use of entities asmembers of disjointclasses
no. of entities described as members of disjoint classestotal no. of entities described in the dataset [Flemming, 2011,
Hogan et al., 2010, Kontokostas et al., 2014]QN
CS2 no misplaced classes orproperties
using entailment rules that indicate the position of a termin a triple [Feeney et al., 2014, Hogan et al., 2010]
QN
CS3 no misuse ofowl:DatatypeProperty orowl:ObjectProperty
detection of misuse of owl:DatatypeProperty orowl:ObjectProperty through the ontology main-tainer [Hogan et al., 2010]
QN
CS4 members ofowl:DeprecatedClass orowl:DeprecatedProperty not used
detection of use of membersof owl:DeprecatedClass orowl:DeprecatedProperty through the ontol-ogy maintainer or by specifying manual mappings fromdeprecated terms to compatible terms [Feeney et al.,2014, Hogan et al., 2010]
QN
CS5 valid usage of inverse-functional properties
(i) by checking the uniqueness and validity of the inverse-functional values [Hogan et al., 2010], (ii) by defining aSPARQL query as a constraint [Kontokostas et al., 2014]
QN
CS6 absence of ontology hi-jacking
detection of the re-definition by third parties of externalclasses/properties such that reasoning over data using thoseexternal terms is affected [Hogan et al., 2010]
QN
CS7 no negative dependen-cies/correlation amongproperties
using association rules [Bohm et al., 2010] QN
CS8 no inconsistencies in spa-tial data
through semantic and geometric constraints [Mostafaviet al., 2004]
QN
CS9 correct domain andrange definition
the attribution of a resource’s property (with a certainvalue) is only valid if the resource (domain), value (range)or literal value (rdfs ranged) is of a certain type - detectedby use of SPARQL queries as a constraint [Kontokostaset al., 2014]
QN
CS10 no inconsistent values detection by the generation of a particular set of schemaaxioms for all properties in a dataset and the manual verifi-cation of these axioms [Zaveri et al., 2013a]
QN
31
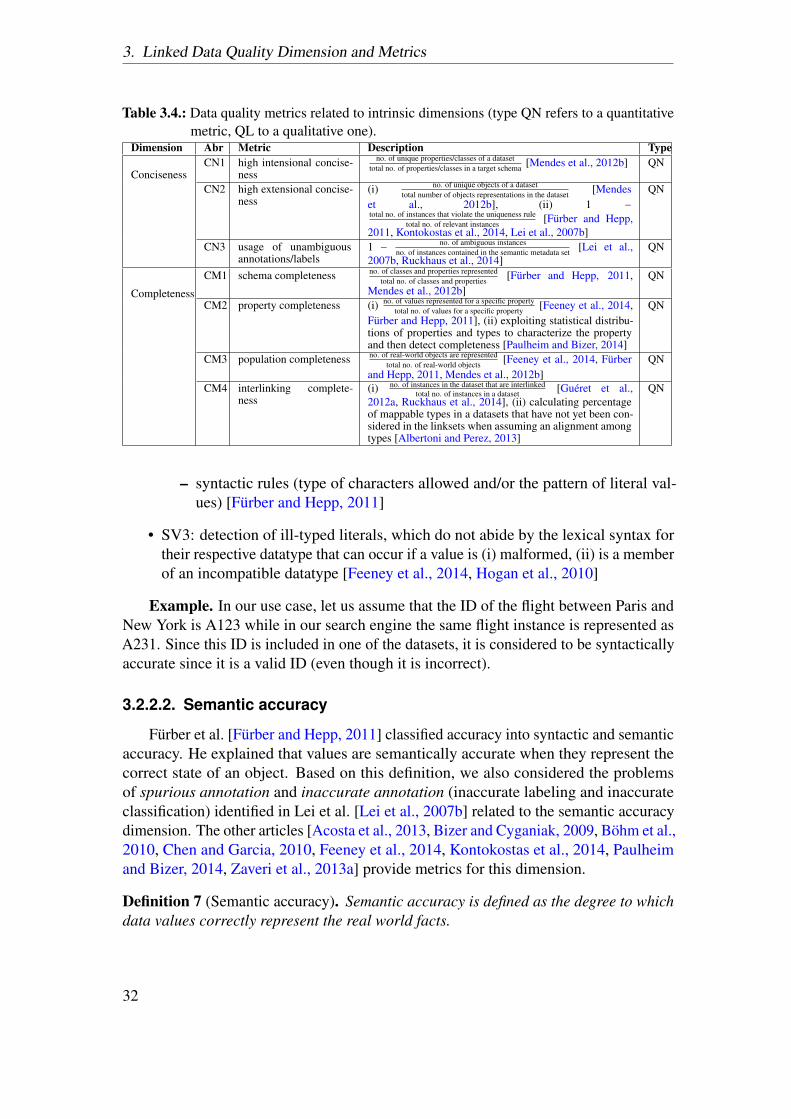
3. Linked Data Quality Dimension and Metrics
Table 3.4.: Data quality metrics related to intrinsic dimensions (type QN refers to a quantitativemetric, QL to a qualitative one).
Dimension Abr Metric Description Type
ConcisenessCN1 high intensional concise-
ness
no. of unique properties/classes of a datasettotal no. of properties/classes in a target schema [Mendes et al., 2012b] QN
CN2 high extensional concise-ness
(i) no. of unique objects of a datasettotal number of objects representations in the dataset [Mendes
et al., 2012b], (ii) 1 −
total no. of instances that violate the uniqueness ruletotal no. of relevant instances [Furber and Hepp,
2011, Kontokostas et al., 2014, Lei et al., 2007b]
QN
CN3 usage of unambiguousannotations/labels
1 − no. of ambiguous instancesno. of instances contained in the semantic metadata set [Lei et al.,
2007b, Ruckhaus et al., 2014]QN
Completeness
CM1 schema completeness no. of classes and properties representedtotal no. of classes and properties [Furber and Hepp, 2011,
Mendes et al., 2012b]QN
CM2 property completeness (i) no. of values represented for a specific propertytotal no. of values for a specific property [Feeney et al., 2014,
Furber and Hepp, 2011], (ii) exploiting statistical distribu-tions of properties and types to characterize the propertyand then detect completeness [Paulheim and Bizer, 2014]
QN
CM3 population completeness no. of real-world objects are representedtotal no. of real-world objects [Feeney et al., 2014, Furber
and Hepp, 2011, Mendes et al., 2012b]QN
CM4 interlinking complete-ness
(i) no. of instances in the dataset that are interlinkedtotal no. of instances in a dataset [Gueret et al.,
2012a, Ruckhaus et al., 2014], (ii) calculating percentageof mappable types in a datasets that have not yet been con-sidered in the linksets when assuming an alignment amongtypes [Albertoni and Perez, 2013]
QN
– syntactic rules (type of characters allowed and/or the pattern of literal val-ues) [Furber and Hepp, 2011]
• SV3: detection of ill-typed literals, which do not abide by the lexical syntax fortheir respective datatype that can occur if a value is (i) malformed, (ii) is a memberof an incompatible datatype [Feeney et al., 2014, Hogan et al., 2010]
Example. In our use case, let us assume that the ID of the flight between Paris andNew York is A123 while in our search engine the same flight instance is represented asA231. Since this ID is included in one of the datasets, it is considered to be syntacticallyaccurate since it is a valid ID (even though it is incorrect).
3.2.2.2. Semantic accuracy
Furber et al. [Furber and Hepp, 2011] classified accuracy into syntactic and semanticaccuracy. He explained that values are semantically accurate when they represent thecorrect state of an object. Based on this definition, we also considered the problemsof spurious annotation and inaccurate annotation (inaccurate labeling and inaccurateclassification) identified in Lei et al. [Lei et al., 2007b] related to the semantic accuracydimension. The other articles [Acosta et al., 2013, Bizer and Cyganiak, 2009, Bohm et al.,2010, Chen and Garcia, 2010, Feeney et al., 2014, Kontokostas et al., 2014, Paulheimand Bizer, 2014, Zaveri et al., 2013a] provide metrics for this dimension.
Definition 7 (Semantic accuracy). Semantic accuracy is defined as the degree to whichdata values correctly represent the real world facts.
32
3.2. Linked Data Quality dimensions
Metrics. The metrics identified for semantic accuracy are:
• SA1: detection of outliers by (i) using distance-based, deviation-based anddistribution-based methods [Bizer and Cyganiak, 2009, Feeney et al., 2014],(ii) using the statistical distributions of a certain type to assess the statement’scorrectness [Paulheim and Bizer, 2014]
• SA2: detection of inaccurate values by (i) using functional dependencies10 [Furberand Hepp, 2011] between the values of two or more different properties [Furber andHepp, 2011], (ii) comparison between two literal values of a resource [Kontokostaset al., 2014], (iii) via crowdsourcing [Acosta et al., 2013, Zaveri et al., 2013a]
• SA3: detection of inaccurate annotations11, labellings12 or classifications13 usingthe formula:1 − inaccurate instances
total no. of instances * balanced distance metrictotal no. of instances
14 [Lei et al., 2007b]
• SA4: detection of misuse of properties15 by using profiling statistics, whichsupport the detection of discordant values or misused properties and facilitate tofind valid values for specific properties [Bohm et al., 2010]
• SA5: ratio of the number of semantically valid rules 16 to the number of nontrivialrules17 [Chen and Garcia, 2010]
Example. Let us assume that the ID of the flight between Paris and New Yorkis A123, while in our search engine the same flight instance is represented as A231(possibly manually introduced by a data acquisition error). In this case, the instanceis semantically inaccurate since the flight ID does not represent its real-world statei.e. A123.
3.2.2.3. Consistency
Hogan et al. [Hogan et al., 2010] defined consistency as “no contradictions in thedata”. Another definition was given by Mendes et al. [Mendes et al., 2012b] that “adataset is consistent if it is free of conflicting information”. The other articles [Bohmet al., 2010, Feeney et al., 2014, Flemming, 2011, Hogan et al., 2010, Kontokostas et al.,
10Functional dependencies are dependencies between the values of two or more different properties.11Where an instance of the semantic metadata set can be mapped back to more than one real world object
or in other cases, where there is no object to be mapped back to an instance.12Where mapping from the instance to the object is correct but not properly labeled.13In which the knowledge of the source object has been correctly identified by not accurately classified.14Balanced distance metric is an algorithm that calculates the distance between the extracted (or learned)
concept and the target concept [Maynard et al., 2006].15Properties are often misused when no applicable property exists.16Valid rules are generated from the real data and validated against a set of principles specified in the
semantic network.17The intuition is that the larger a dataset is, the more closely it should reflect the basic domain principles
and the semantically incorrect rules will be generated.
33
3. Linked Data Quality Dimension and Metrics
2014, Mostafavi et al., 2004, Zaveri et al., 2013a] provide metrics for this dimension.However, it should be noted that for some languages such as OWL DL, there areclearly defined semantics, including clear definitions of what inconsistency means. Indescription logics, model based semantics are used: A knowledge base is a set of axioms.A model is an interpretation, which satisfies all axioms in the knowledge base. Aknowledge base is consistent if and only if it has a model [Baader et al., 2003].
Definition 8 (Consistency). Consistency means that a knowledge base is free of (log-ical/formal) contradictions with respect to particular knowledge representation andinference mechanisms.
Metrics. A straightforward way to check for consistency is to load the knowledgebase into a reasoner and check whether it is consistent. However, for certain knowledgebases (e.g. very large or inherently inconsistent ones) this approach is not feasible.Moreover, most OWL reasoners specialize in the OWL (2) DL sublanguage as they areinternally based on description logics. However, it should be noted that Linked Datadoes not necessarily conform to OWL DL and, therefore, those reasoners cannot directlybe applied. Some of the important metrics identified in the literature are:
• CS1: detection of use of entities as members of disjoint classes using the formula:no. of entities described as members of disjoint classes
total no. of entities described in the dataset [Flemming, 2011, Hogan et al., 2010, Kon-tokostas et al., 2014]
• CS2: detection of misplaced classes or properties18 using entailment rules thatindicate the position of a term in a triple [Feeney et al., 2014, Hogan et al., 2010]
• CS3: detection of misuse of owl:DatatypeProperty or owl:ObjectPro-perty through the ontology maintainer19 [Hogan et al., 2010]
• CS4: detection of use of members of owl:DeprecatedClass or owl:Depre-catedProperty through the ontology maintainer or by specifying manual map-pings from deprecated terms to compatible terms [Feeney et al., 2014, Hoganet al., 2010]
• CS5: detection of bogus owl:InverseFunctionalProperty values (i) bychecking the uniqueness and validity of the inverse-functional values [Hogan et al.,2010], (ii) by defining a SPARQL query as a constraint [Kontokostas et al., 2014]
• CS6: detection of the re-definition by third parties of external classes/properties(ontology hijacking) such that reasoning over data using those external terms isnot affected [Hogan et al., 2010]
• CS7: detection of negative dependencies/correlation among properties usingassociation rules [Bohm et al., 2010]
18For example, a URI defined as a class is used as a property or vice-a-versa.19For example, attribute properties used between two resources and relation properties used with literal
values.
34
3.2. Linked Data Quality dimensions
• CS8: detection of inconsistencies in spatial data through semantic and geometricconstraints [Mostafavi et al., 2004]
• CS9: the attribution of a resource’s property (with a certain value) is only valid ifthe resource (domain), value (range) or literal value (rdfs ranged) is of a certaintype - detected by use of SPARQL queries as a constraint [Kontokostas et al.,2014]
• CS10: detection of inconsistent values by the generation of a particular set ofschema axioms for all properties in a dataset and the manual verification of theseaxioms [Zaveri et al., 2013a]
Example. Let us assume a user looking for flights between Paris and New York onthe 21st of December, 2013. Her query returns the following results:
Flight From To Arrival DepartureA123 Paris NewYork 14:50 22:35A123 Paris London 14:50 22:35
The results show that the flight number A123 has two different destinations20 at thesame date and same time of arrival and departure, which is inconsistent with the ontologydefinition that one flight can only have one destination at a specific time and date. Thiscontradiction arises due to inconsistency in data representation, which is detected byusing inference and reasoning.
3.2.2.4. Conciseness
Mendes et al. [Mendes et al., 2012b] classified conciseness into schema and instancelevel conciseness. On the schema level (intensional), “a dataset is concise if it does notcontain redundant attributes (two equivalent attributes with different names)”. Thus,intensional conciseness measures the number of unique schema elements (i.e. propertiesand classes) of a dataset in relation to the overall number of schema elements in a schema.On the data (instance) level (extensional), “a dataset is concise if it does not containredundant objects (two equivalent objects with different identifiers)”. Thus, extensionalconciseness measures the number of unique objects in relation to the overall number ofobjects in the dataset. This definition of conciseness is very similar to the definition of‘uniqueness’ defined by Furber et al. [Furber and Hepp, 2011] as the “degree to whichdata is free of redundancies, in breadth, depth and scope”. This comparison shows thatuniqueness and conciseness point to the same dimension. Redundancy occurs when thereare equivalent schema elements with different names/identifiers (in case of intensionalconciseness) and when there are equivalent objects (instances) with different identifiers(in case of extensional conciseness) present in a dataset [Lei et al., 2007b]. Kontokostaset al.[Kontokostas et al., 2014] provide metrics for this dimension.
Definition 9 (Conciseness). Conciseness refers to the minimization of redundancy ofentities at the schema and the data level. Conciseness is classified into (i) intensional20Under the assumption that we can infer that NewYork and London are different entities or, alterna-
tively, make the unique name assumption.
35
3. Linked Data Quality Dimension and Metrics
conciseness (schema level) which refers to the case when the data does not containredundant schema elements (properties and classes) and (ii) extensional conciseness(data level) which refers to the case when the data does not contain redundant objects(instances).
Metrics. The metrics identified for conciseness are:
• CN1: intensional conciseness measured by no. of unique properties/classes of a datasettotal no. of properties/classes in a target schema [Mendes
et al., 2012b]
• CN2: extensional conciseness measured by:
– no. of unique instances of a datasettotal number of instances representations in the dataset [Mendes et al., 2012b],
– 1 − total no. of instances that violate the uniqueness ruletotal no. of relevant instances [Furber and Hepp, 2011, Kontokostas
et al., 2014, Lei et al., 2007b]
• CN3: detection of unambiguous annotations using the formula:1 − no. of ambiguous instances
no. of instances contained in the semantic metadata set21 [Lei et al., 2007b, Ruckhaus et al.,
2014]
Example. In our flight search engine, an example of intensional conciseness wouldbe a particular flight, say A123, being represented by two different properties in the samedataset, such as http://flights.org/airlineID and http://flights.org/name. This redundancy (‘airlineID’ and ‘name’ in this case) can ideally be solved byfusing the two properties and keeping only one unique identifier. On the other hand,an example of extensional conciseness is when both these identifiers of the same flighthave the same information associated with them in both the datasets, thus duplicatingthe information.
3.2.2.5. Completeness
Furber et al. [Furber and Hepp, 2011] classified completeness into: (i) Schemacompleteness, which is the degree to which classes and properties are not missing in aschema; (ii) Column completeness, which is a function of the missing property valuesfor a specific property/column; and (iii) Population completeness, which refers to theratio between classes represented in an information system and the complete population.Mendes et al. [Mendes et al., 2012b] distinguished completeness on the schema and thedata level. On the schema level, a dataset is complete if it contains all of the attributesneeded for a given task. On the data (i.e. instance) level, a dataset is complete if itcontains all of the necessary objects for a given task. The two types of completenessdefined in Mendes et al. can be mapped to the two categories (i) Schema completenessand (iii) Population completeness provided by Furber et al. Additionally, we introducethe category interlinking completeness, which refers to the degree to which instances in
21Detection of an instance mapped back to more than one real world object leading to more than oneinterpretation.
36
3.2. Linked Data Quality dimensions
the dataset are interlinked [Gueret et al., 2012a]. Albertoni et al. [Albertoni and Perez,2013] define interlinking completeness as “linkset completeness as the degree to whichlinks in the linksets are not missing.” The other articles [Feeney et al., 2014, Paulheimand Bizer, 2014, Ruckhaus et al., 2014] provide metrics for this dimension.
Definition 10 (Completeness). Completeness refers to the degree to which all requiredinformation is present in a particular dataset. In terms of LD, completeness comprisesof the following aspects: (i) Schema completeness, the degree to which the classes andproperties of an ontology are represented, thus can be called “ontology completeness”,(ii) Property completeness, measure of the missing values for a specific property, (iii)Population completeness is the percentage of all real-world objects of a particular typethat are represented in the datasets and (iv) Interlinking completeness, which has to beconsidered especially in LD, refers to the degree to which instances in the dataset areinterlinked.
Metrics. The metrics identified for completeness are:
• CM1: schema completeness no. of classes and properties representedtotal no. of classes and properties [Furber and Hepp, 2011,
Mendes et al., 2012b]
• CM2: property completeness (i) no. of values represented for a specific propertytotal no. of values for a specific property [Feeney et al.,
2014, Furber and Hepp, 2011], (ii) exploiting statistical distributions of propertiesand types to characterize the property and then detect completeness [Paulheimand Bizer, 2014]
• CM3: population completeness no. of real-world objects are representedtotal no. of real-world objects [Feeney et al., 2014,
Furber and Hepp, 2011, Mendes et al., 2012b]
• CM4: interlinking completeness(i) no. of instances in the dataset that are interlinked
total no. of instances in a dataset [Gueret et al., 2012a, Ruckhaus et al., 2014],(ii) calculating percentage of mappable types in a datasets that have not yet beenconsidered in the linksets when assuming an alignment among types [Albertoniand Perez, 2013]
It should be noted that in this case, users should assume a closed-world-assumptionwhere a gold standard dataset is available and can be used to compare against theconverted dataset.
Example. In our use case, the flight search engine contains complete informationto include all the airports and airport codes such that it allows a user to find an optimalroute from the start to the end destination (even in cases when there is no direct flight).For example, the user wants to travel from Santa Barbara to San Francisco. Since ourflight search engine contains interlinks between these close airports, the user is able tolocate a direct flight easily.
37
3. Linked Data Quality Dimension and Metrics
3.2.2.6. Intra-relations
The dimensions in this group are related to each other as follows: Data can besemantically accurate by representing the real world state but still can be inconsistent.However, if we merge accurate datasets, we will most likely get fewer inconsistenciesthan merging inaccurate datasets. On the other hand, being syntactically valid doesnot necessarily mean that the value is semantically accurate. Moreover, if a dataset iscomplete, tests for syntactic validity, semantic accuracy and consistency checks need tobe performed to determine if the values have been completed correctly. Additionally,the conciseness dimension is related to the completeness dimension since both pointtowards the dataset having all, however unique (non-redundant) information. However,if data integration leads to duplication of instances, it may lead to contradictory valuesthus leading to inconsistency [Bleiholder and Naumann, 2008].
3.2.3. Contextual dimensionsContextual dimensions are those that highly depend on the context of the task at hand.
There are four dimensions that are part of this group, namely relevancy, trustworthiness,understandability and timeliness. These dimensions along with their correspondingmetrics and references to the original literature are presented in Table 3.5 and Table 3.6.
3.2.3.1. Relevancy
Flemming [Flemming, 2011] defined amount-of-data as the “criterion influencingthe usability of a data source”. Thus, since the amount-of-data dimension is similar tothe relevancy dimension, we merge both dimensions. Bonatti et al. [Bonatti et al., 2011]provides a metric for this dimension. The other articles [Acosta et al., 2013, Zaveri et al.,2013a] provide metrics for this dimension.
Definition 11 (Relevancy). Relevancy refers to the provision of information which is inaccordance with the task at hand and important to the users’ query.
Metrics. The metrics identified for relevancy are:
• R1: obtaining relevant data by: (i) ranking (a numerical value similar to PageRank),which determines the centrality of RDF documents and statements [Bonatti et al.,2011]), (ii) via crowdsourcing [Acosta et al., 2013, Zaveri et al., 2013a]
• R2: measuring the coverage (i.e. number of entities described in a dataset) andlevel of detail (i.e. number of properties) in a dataset to ensure that the dataretrieved is appropriate for the task at hand [Flemming, 2011]
Example. When a user is looking for flights between any two cities, only relevantinformation i.e. departure and arrival airports, starting and ending time, duration and costper person should be provided. Some datasets, in addition to relevant information, alsocontain much irrelevant data such as car rental, hotel booking, travel insurance etc. and
38
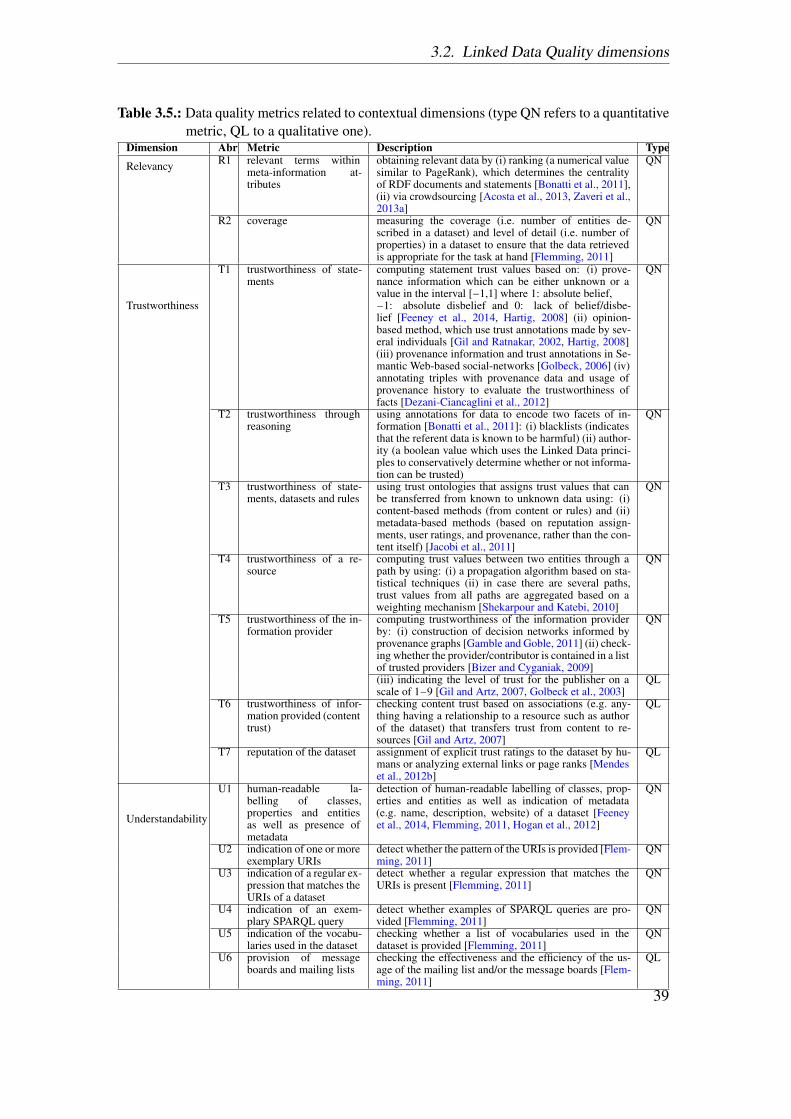
3.2. Linked Data Quality dimensions
Table 3.5.: Data quality metrics related to contextual dimensions (type QN refers to a quantitativemetric, QL to a qualitative one).
Dimension Abr Metric Description Type
Relevancy R1 relevant terms withinmeta-information at-tributes
obtaining relevant data by (i) ranking (a numerical valuesimilar to PageRank), which determines the centralityof RDF documents and statements [Bonatti et al., 2011],(ii) via crowdsourcing [Acosta et al., 2013, Zaveri et al.,2013a]
QN
R2 coverage measuring the coverage (i.e. number of entities de-scribed in a dataset) and level of detail (i.e. number ofproperties) in a dataset to ensure that the data retrievedis appropriate for the task at hand [Flemming, 2011]
QN
Trustworthiness
T1 trustworthiness of state-ments
computing statement trust values based on: (i) prove-nance information which can be either unknown or avalue in the interval [−1,1] where 1: absolute belief,−1: absolute disbelief and 0: lack of belief/disbe-lief [Feeney et al., 2014, Hartig, 2008] (ii) opinion-based method, which use trust annotations made by sev-eral individuals [Gil and Ratnakar, 2002, Hartig, 2008](iii) provenance information and trust annotations in Se-mantic Web-based social-networks [Golbeck, 2006] (iv)annotating triples with provenance data and usage ofprovenance history to evaluate the trustworthiness offacts [Dezani-Ciancaglini et al., 2012]
QN
T2 trustworthiness throughreasoning
using annotations for data to encode two facets of in-formation [Bonatti et al., 2011]: (i) blacklists (indicatesthat the referent data is known to be harmful) (ii) author-ity (a boolean value which uses the Linked Data princi-ples to conservatively determine whether or not informa-tion can be trusted)
QN
T3 trustworthiness of state-ments, datasets and rules
using trust ontologies that assigns trust values that canbe transferred from known to unknown data using: (i)content-based methods (from content or rules) and (ii)metadata-based methods (based on reputation assign-ments, user ratings, and provenance, rather than the con-tent itself) [Jacobi et al., 2011]
QN
T4 trustworthiness of a re-source
computing trust values between two entities through apath by using: (i) a propagation algorithm based on sta-tistical techniques (ii) in case there are several paths,trust values from all paths are aggregated based on aweighting mechanism [Shekarpour and Katebi, 2010]
QN
T5 trustworthiness of the in-formation provider
computing trustworthiness of the information providerby: (i) construction of decision networks informed byprovenance graphs [Gamble and Goble, 2011] (ii) check-ing whether the provider/contributor is contained in a listof trusted providers [Bizer and Cyganiak, 2009]
QN
(iii) indicating the level of trust for the publisher on ascale of 1−9 [Gil and Artz, 2007, Golbeck et al., 2003]
QL
T6 trustworthiness of infor-mation provided (contenttrust)
checking content trust based on associations (e.g. any-thing having a relationship to a resource such as authorof the dataset) that transfers trust from content to re-sources [Gil and Artz, 2007]
QL
T7 reputation of the dataset assignment of explicit trust ratings to the dataset by hu-mans or analyzing external links or page ranks [Mendeset al., 2012b]
QL
Understandability
U1 human-readable la-belling of classes,properties and entitiesas well as presence ofmetadata
detection of human-readable labelling of classes, prop-erties and entities as well as indication of metadata(e.g. name, description, website) of a dataset [Feeneyet al., 2014, Flemming, 2011, Hogan et al., 2012]
QN
U2 indication of one or moreexemplary URIs
detect whether the pattern of the URIs is provided [Flem-ming, 2011]
QN
U3 indication of a regular ex-pression that matches theURIs of a dataset
detect whether a regular expression that matches theURIs is present [Flemming, 2011]
QN
U4 indication of an exem-plary SPARQL query
detect whether examples of SPARQL queries are pro-vided [Flemming, 2011]
QN
U5 indication of the vocabu-laries used in the dataset
checking whether a list of vocabularies used in thedataset is provided [Flemming, 2011]
QN
U6 provision of messageboards and mailing lists
checking the effectiveness and the efficiency of the us-age of the mailing list and/or the message boards [Flem-ming, 2011]
QL
39
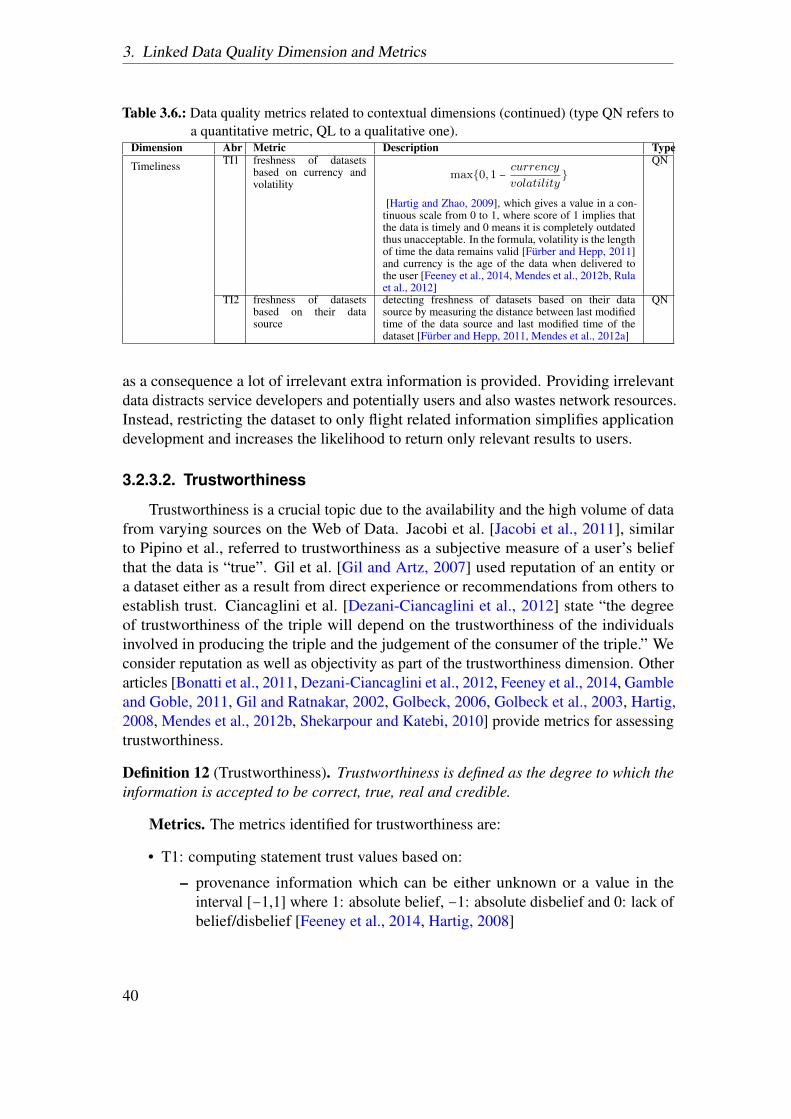
3. Linked Data Quality Dimension and Metrics
Table 3.6.: Data quality metrics related to contextual dimensions (continued) (type QN refers toa quantitative metric, QL to a qualitative one).
Dimension Abr Metric Description Type
Timeliness TI1 freshness of datasetsbased on currency andvolatility
max{0,1 −currency
volatility}
[Hartig and Zhao, 2009], which gives a value in a con-tinuous scale from 0 to 1, where score of 1 implies thatthe data is timely and 0 means it is completely outdatedthus unacceptable. In the formula, volatility is the lengthof time the data remains valid [Furber and Hepp, 2011]and currency is the age of the data when delivered tothe user [Feeney et al., 2014, Mendes et al., 2012b, Rulaet al., 2012]
QN
TI2 freshness of datasetsbased on their datasource
detecting freshness of datasets based on their datasource by measuring the distance between last modifiedtime of the data source and last modified time of thedataset [Furber and Hepp, 2011, Mendes et al., 2012a]
QN
as a consequence a lot of irrelevant extra information is provided. Providing irrelevantdata distracts service developers and potentially users and also wastes network resources.Instead, restricting the dataset to only flight related information simplifies applicationdevelopment and increases the likelihood to return only relevant results to users.
3.2.3.2. Trustworthiness
Trustworthiness is a crucial topic due to the availability and the high volume of datafrom varying sources on the Web of Data. Jacobi et al. [Jacobi et al., 2011], similarto Pipino et al., referred to trustworthiness as a subjective measure of a user’s beliefthat the data is “true”. Gil et al. [Gil and Artz, 2007] used reputation of an entity ora dataset either as a result from direct experience or recommendations from others toestablish trust. Ciancaglini et al. [Dezani-Ciancaglini et al., 2012] state “the degreeof trustworthiness of the triple will depend on the trustworthiness of the individualsinvolved in producing the triple and the judgement of the consumer of the triple.” Weconsider reputation as well as objectivity as part of the trustworthiness dimension. Otherarticles [Bonatti et al., 2011, Dezani-Ciancaglini et al., 2012, Feeney et al., 2014, Gambleand Goble, 2011, Gil and Ratnakar, 2002, Golbeck, 2006, Golbeck et al., 2003, Hartig,2008, Mendes et al., 2012b, Shekarpour and Katebi, 2010] provide metrics for assessingtrustworthiness.
Definition 12 (Trustworthiness). Trustworthiness is defined as the degree to which theinformation is accepted to be correct, true, real and credible.
Metrics. The metrics identified for trustworthiness are:
• T1: computing statement trust values based on:
– provenance information which can be either unknown or a value in theinterval [−1,1] where 1: absolute belief, −1: absolute disbelief and 0: lack ofbelief/disbelief [Feeney et al., 2014, Hartig, 2008]
40
3.2. Linked Data Quality dimensions
– opinion-based method, which use trust annotations made by several individ-uals [Gil and Ratnakar, 2002, Hartig, 2008]
– provenance information and trust annotations in Semantic Web-based social-networks [Golbeck, 2006]
– annotating triples with provenance data and usage of provenance history toevaluate the trustworthiness of facts [Dezani-Ciancaglini et al., 2012]
• T2: using annotations for data to encode two facets of information:
– blacklists (indicates that the referent data is known to be harmful) [Bonattiet al., 2011] and
– authority (a boolean value which uses the Linked Data principles to conser-vatively determine whether or not information can be trusted) [Bonatti et al.,2011]
• T3: using trust ontologies that assigns trust values that can be transferred fromknown to unknown data [Jacobi et al., 2011] using:
– content-based methods (from content or rules) and
– metadata-based methods (based on reputation assignments, user ratings, andprovenance, rather than the content itself)
• T4: computing trust values between two entities through a path by using:
– a propagation algorithm based on statistical techniques [Shekarpour andKatebi, 2010]
– in case there are several paths, trust values from all paths are aggregatedbased on a weighting mechanism [Shekarpour and Katebi, 2010]
• T5: computing trustworthiness of the information provider by:
– construction of decision networks informed by provenance graphs [Gambleand Goble, 2011]
– checking whether the provider/contributor is contained in a list of trustedproviders [Bizer and Cyganiak, 2009]
– indicating the level of trust for the publisher on a scale of 1 − 9 [Gil and Artz,2007, Golbeck et al., 2003]
• T6: checking content trust22 based on associations (e.g. anything having a rela-tionship to a resource such as author of the dataset) that transfer trust from contentto resources [Gil and Artz, 2007]
• T7: assignment of explicit trust ratings to the dataset by humans or analyzingexternal links or page ranks [Mendes et al., 2012b]
22Content trust is a trust judgement on a particular piece of information in a given context [Gil and Artz,2007].
41
3. Linked Data Quality Dimension and Metrics
Example. In our flight search engine use case, if the flight information is providedby trusted and well-known airlines then a user is more likely to trust this informationthan when an unknown travel agency provides it. Generally information about a productor service (e.g. a flight) can be trusted when it is directly published by the producer orservice provider (e.g. the airline). On the other hand, if a user retrieves informationfrom a previously unknown source, she can decide whether to believe this informationby checking whether the source is well-known or if it is contained in a list of trustedproviders.
3.2.3.3. Understandability
Flemming [Flemming, 2011] related understandability to the comprehensibility ofdata i.e. the ease with which human consumers can understand and utilize the data.Thus, comprehensibility can be interchangeably used with understandability. Hogan etal. [Hogan et al., 2012] specified the importance of providing human-readable metadata“for allowing users to visualize, browse and understand RDF data, where providing labelsand descriptions establishes a baseline”. Feeney et al. [Feeney et al., 2014] provide ametric for this dimension.
Definition 13 (Understandability). Understandability refers to the ease with which datacan be comprehended without ambiguity and be used by a human information consumer.
Metrics. The metrics identified for understandability are:
• U1: detection of human-readable labelling of classes, properties and entities aswell as indication of metadata (e.g. name, description, website) of a dataset [Feeneyet al., 2014, Flemming, 2011, Hogan et al., 2012]
• U2: detect whether the pattern of the URIs is provided [Flemming, 2011]
• U3: detect whether a regular expression that matches the URIs is present [Flem-ming, 2011]
• U4: detect whether examples of SPARQL queries are provided [Flemming, 2011]
• U5: checking whether a list of vocabularies used in the dataset is provided [Flem-ming, 2011]
• U6: checking the effectiveness and the efficiency of the usage of the mailing listand/or the message boards [Flemming, 2011]
Example. Let us assume that a user wants to search for flights between Boston andSan Francisco using our flight search engine. From the data related to Boston in theintegrated dataset for the required flight, the following URIs and a label is retrieved:
• http://rdf.freebase.com/ns/m.049jnng
• http://rdf.freebase.com/ns/m.043j22x
42
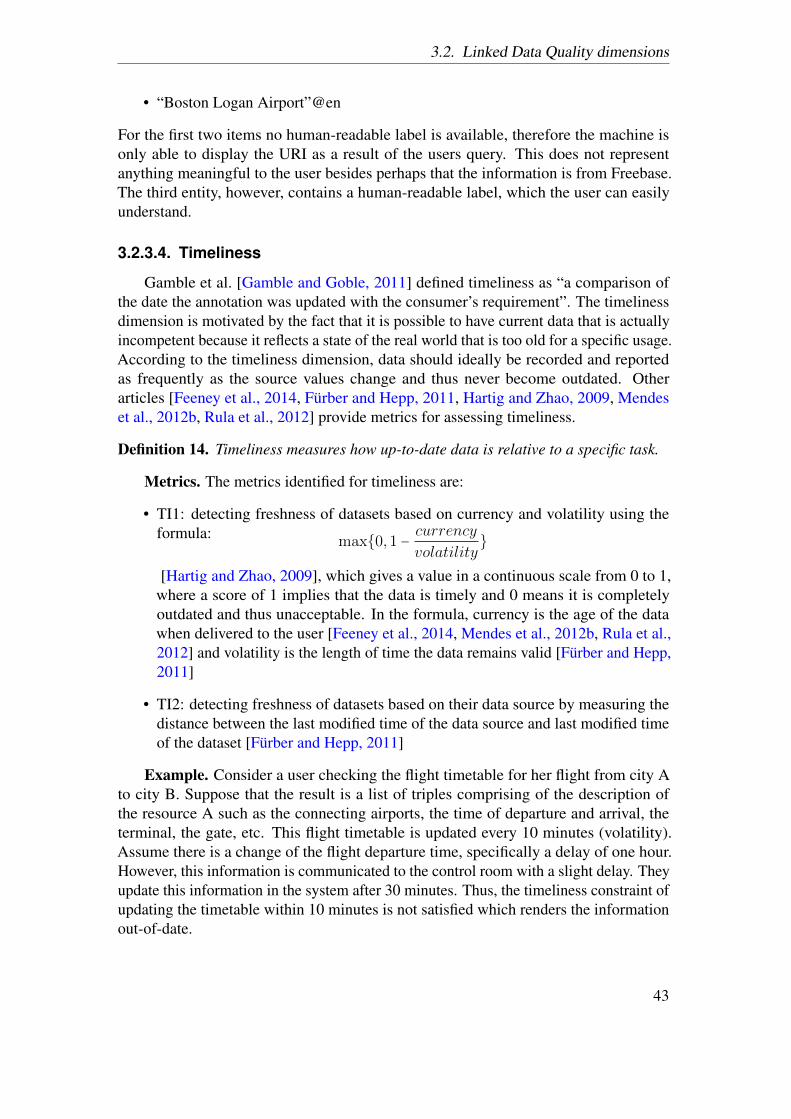
3.2. Linked Data Quality dimensions
• “Boston Logan Airport”@en
For the first two items no human-readable label is available, therefore the machine isonly able to display the URI as a result of the users query. This does not representanything meaningful to the user besides perhaps that the information is from Freebase.The third entity, however, contains a human-readable label, which the user can easilyunderstand.
3.2.3.4. Timeliness
Gamble et al. [Gamble and Goble, 2011] defined timeliness as “a comparison ofthe date the annotation was updated with the consumer’s requirement”. The timelinessdimension is motivated by the fact that it is possible to have current data that is actuallyincompetent because it reflects a state of the real world that is too old for a specific usage.According to the timeliness dimension, data should ideally be recorded and reportedas frequently as the source values change and thus never become outdated. Otherarticles [Feeney et al., 2014, Furber and Hepp, 2011, Hartig and Zhao, 2009, Mendeset al., 2012b, Rula et al., 2012] provide metrics for assessing timeliness.
Definition 14. Timeliness measures how up-to-date data is relative to a specific task.
Metrics. The metrics identified for timeliness are:
• TI1: detecting freshness of datasets based on currency and volatility using theformula: max{0,1 − currency
volatility}
[Hartig and Zhao, 2009], which gives a value in a continuous scale from 0 to 1,where a score of 1 implies that the data is timely and 0 means it is completelyoutdated and thus unacceptable. In the formula, currency is the age of the datawhen delivered to the user [Feeney et al., 2014, Mendes et al., 2012b, Rula et al.,2012] and volatility is the length of time the data remains valid [Furber and Hepp,2011]
• TI2: detecting freshness of datasets based on their data source by measuring thedistance between the last modified time of the data source and last modified timeof the dataset [Furber and Hepp, 2011]
Example. Consider a user checking the flight timetable for her flight from city Ato city B. Suppose that the result is a list of triples comprising of the description ofthe resource A such as the connecting airports, the time of departure and arrival, theterminal, the gate, etc. This flight timetable is updated every 10 minutes (volatility).Assume there is a change of the flight departure time, specifically a delay of one hour.However, this information is communicated to the control room with a slight delay. Theyupdate this information in the system after 30 minutes. Thus, the timeliness constraint ofupdating the timetable within 10 minutes is not satisfied which renders the informationout-of-date.
43
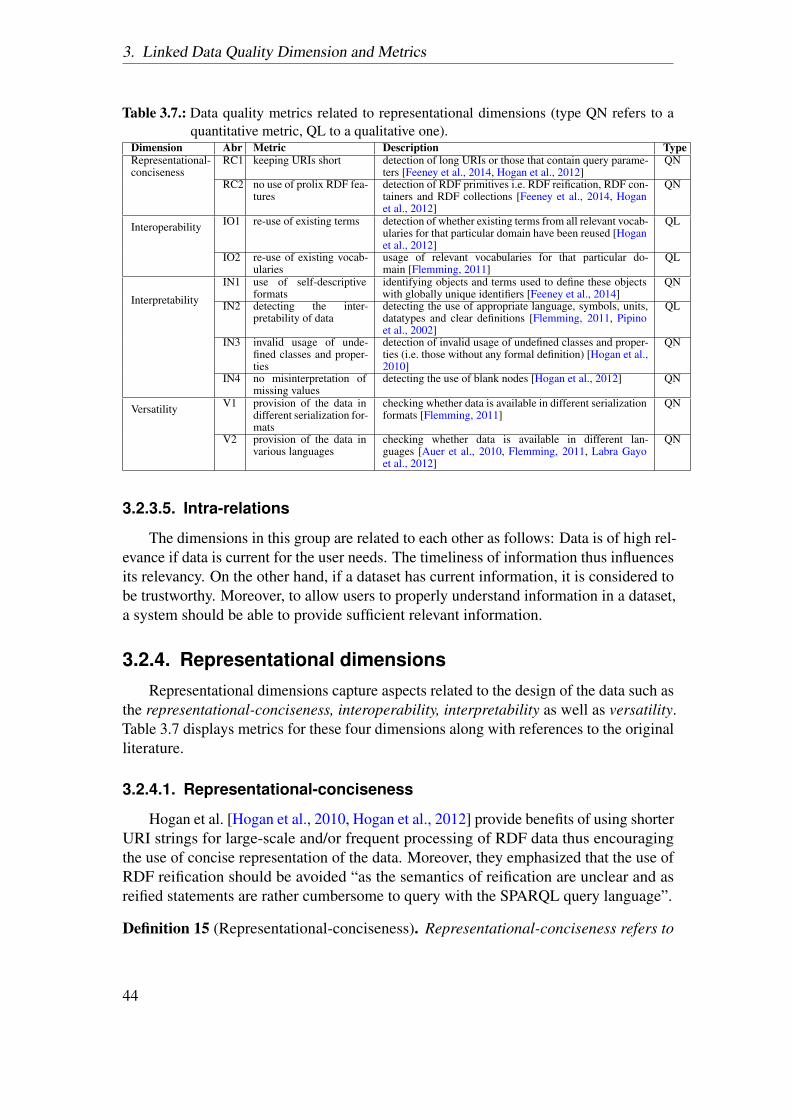
3. Linked Data Quality Dimension and Metrics
Table 3.7.: Data quality metrics related to representational dimensions (type QN refers to aquantitative metric, QL to a qualitative one).
Dimension Abr Metric Description TypeRepresentational-conciseness
RC1 keeping URIs short detection of long URIs or those that contain query parame-ters [Feeney et al., 2014, Hogan et al., 2012]
QN
RC2 no use of prolix RDF fea-tures
detection of RDF primitives i.e. RDF reification, RDF con-tainers and RDF collections [Feeney et al., 2014, Hoganet al., 2012]
QN
Interoperability IO1 re-use of existing terms detection of whether existing terms from all relevant vocab-ularies for that particular domain have been reused [Hoganet al., 2012]
QL
IO2 re-use of existing vocab-ularies
usage of relevant vocabularies for that particular do-main [Flemming, 2011]
QL
Interpretability
IN1 use of self-descriptiveformats
identifying objects and terms used to define these objectswith globally unique identifiers [Feeney et al., 2014]
QN
IN2 detecting the inter-pretability of data
detecting the use of appropriate language, symbols, units,datatypes and clear definitions [Flemming, 2011, Pipinoet al., 2002]
QL
IN3 invalid usage of unde-fined classes and proper-ties
detection of invalid usage of undefined classes and proper-ties (i.e. those without any formal definition) [Hogan et al.,2010]
QN
IN4 no misinterpretation ofmissing values
detecting the use of blank nodes [Hogan et al., 2012] QN
Versatility V1 provision of the data indifferent serialization for-mats
checking whether data is available in different serializationformats [Flemming, 2011]
QN
V2 provision of the data invarious languages
checking whether data is available in different lan-guages [Auer et al., 2010, Flemming, 2011, Labra Gayoet al., 2012]
QN
3.2.3.5. Intra-relations
The dimensions in this group are related to each other as follows: Data is of high rel-evance if data is current for the user needs. The timeliness of information thus influencesits relevancy. On the other hand, if a dataset has current information, it is considered tobe trustworthy. Moreover, to allow users to properly understand information in a dataset,a system should be able to provide sufficient relevant information.
3.2.4. Representational dimensionsRepresentational dimensions capture aspects related to the design of the data such as
the representational-conciseness, interoperability, interpretability as well as versatility.Table 3.7 displays metrics for these four dimensions along with references to the originalliterature.
3.2.4.1. Representational-conciseness
Hogan et al. [Hogan et al., 2010, Hogan et al., 2012] provide benefits of using shorterURI strings for large-scale and/or frequent processing of RDF data thus encouragingthe use of concise representation of the data. Moreover, they emphasized that the use ofRDF reification should be avoided “as the semantics of reification are unclear and asreified statements are rather cumbersome to query with the SPARQL query language”.
Definition 15 (Representational-conciseness). Representational-conciseness refers to
44

3.2. Linked Data Quality dimensions
the representation of the data, which is compact and well formatted on the one hand andclear and complete on the other hand.
Metrics. The metrics identified for representational-conciseness are:
• RC1: detection of long URIs or those that contain query parameters [Feeney et al.,2014, Hogan et al., 2012]
• RC2: detection of RDF primitives i.e. RDF reification, RDF containers and RDFcollections [Feeney et al., 2014, Hogan et al., 2012]
Example. Our flight search engine represents the URIs for the destination compactlywith the use of the airport codes. For example, LEJ is the airport code for Leipzig,therefore the URI is http://airlines.org/LEJ. Such short representation ofthe URIs helps users share and memorize them easily.
3.2.4.2. Interoperability
Hogan et al. [Hogan et al., 2012] state that the re-use of well-known terms to describeresources in a uniform manner increases the interoperability of data published in thismanner and contributes towards the interoperability of the entire dataset. The definitionof “uniformity”, which refers to the re-use of established formats to represent data asdescribed by Flemming [Flemming, 2011], is also associated to the interoperability ofthe dataset.
Definition 16 (Interoperability). Interoperability is the degree to which the format andstructure of the information conforms to previously returned information as well as datafrom other sources.
Metrics. The metrics identified for interoperability are:
• IO1: detection of whether existing terms from all relevant vocabularies for thatparticular domain have been reused [Hogan et al., 2012]
• IO2: usage of relevant vocabularies for that particular domain [Flemming, 2011]
Example. Let us consider different airline datasets using different notations forrepresenting the geo-cordinates of a particular flight location. While one dataset uses theWGS 84 geodetic system, another one uses the GeoRSS points system to specify thelocation. This makes querying the integrated dataset difficult, as it requires users and themachines to understand the heterogeneous schema. Additionally, with the differencein the vocabularies used to represent the same concept (in this case the co-ordinates),consumers are faced with the problem of how the data can be interpreted and displayed.
45
3. Linked Data Quality Dimension and Metrics
3.2.4.3. Interpretability
Hogan et al. [Hogan et al., 2010, Hogan et al., 2012] specify that the ad-hocdefinition of classes and properties as well use of blank nodes makes the automaticintegration of data less effective and forgoes the possibility of making inferences throughreasoning. Thus, these features should be avoided in order to make the data much moreinterpretable. The other articles [Feeney et al., 2014, Flemming, 2011] provide metricsfor this dimension.
Definition 17 (Interpretability). Interpretability refers to technical aspects of the data,that is, whether information is represented using an appropriate notation and whetherthe machine is able to process the data.
Metrics. The metrics identified for interpretability are:
• IN1: identifying objects and terms used to define these objects with globallyunique identifiers [Feeney et al., 2014]
• IN2: detecting the use of appropriate language, symbols, units, datatypes and cleardefinitions [Flemming, 2011]
• IN3: detection of invalid usage of undefined classes and properties (i.e. thosewithout any formal definition) [Hogan et al., 2010]
• IN4: detecting the use of blank nodes23 [Hogan et al., 2012]
Example. Consider our flight search engine and a user that is looking for a flightfrom Mumbai to Boston with a two day stop-over in Berlin. The user specifiesthe dates correctly. However, since the flights are operated by different airlines, thusdifferent datasets, they have a different way of representing the date. In the first leg ofthe trip, the date is represented in the format dd/mm/yyyy whereas in the other case,the date is represented as mm/dd/yy. Thus, the machine is unable to correctly interpretthe data and cannot provide an optimal result for this query. This lack of consensus inthe format of the date hinders the ability of the machine to interpret the data and thusprovide the appropriate flights.
3.2.4.4. Versatility
Flemming [Flemming, 2011] defined versatility as the “alternative representationsof the data and its handling.”
Definition 18 (Versatility). Versatility refers to the availability of the data in differentrepresentations and in an internationalized way.
Metrics. The metrics identified for versatility are:
23Blank nodes are not recommended since they cannot be externally referenced.
46
3.2. Linked Data Quality dimensions
• V1: checking whether data is available in different serialization formats [Flem-ming, 2011]
• V2: checking whether data is available in different languages [Flemming, 2011]
Example. Consider a user who does not understand English but only Chinese andwants to use our flight search engine. In order to cater to the needs of such a user, thedataset should provide labels and other language-dependent information in Chinese sothat any user has the capability to understand it.
3.2.4.5. Intra-relations
The dimensions in this group are related as follows: Interpretability is related tothe interoperability of data since the consistent representation (e.g. re-use of establishedvocabularies) ensures that a system will be able to interpret the data correctly [Dingand Finin, 2006]. Versatility is also related to the interpretability of a dataset as themore different forms a dataset is represented in (e.g. in different languages), the moreinterpretable a dataset is. Additionally, concise representation of the data allows the datato be interpreted correctly.
3.2.5. Inter-relationships between dimensionsThe 18 data quality dimensions explained in the previous sections are not indepen-
dent from each other but correlations exist among them. In this section, we describe theinter-relations between the 18 dimensions, as shown in Figure 3.1. If some dimensionsare considered more important than others for a specific application (or use case), thenfavoring the more important ones will result in downplaying the influence of others. Theinter-relationships help to identify which dimensions should possibly be considered to-gether in a certain quality assessment application. Hence, investigating the relationshipsamong dimensions is an interesting problem, as shown by the following examples.
First, relationships exist between the dimensions trustworthiness, semantic accuracyand timeliness. When assessing the trustworthiness of a LD dataset, the semanticaccuracy and the timeliness of the dataset should be assessed. Frequently the assumptionis made that a publisher with a high reputation will produce data that is also semanticallyaccurate and current, when in reality this may not be so.
Second, relationships occur between timeliness and the semantic accuracy, com-pleteness and consistency dimensions. On the one hand, having semantically accurate,complete or consistent data may require time and thus timeliness can be negativelyaffected. Conversely, having timely data may cause low accuracy, incompleteness and/orinconsistency. Based on quality preferences given by an application, a possible orderof quality can be as follows: timely, consistent, accurate and then complete data. Forinstance, a list of courses published on a university website might be first of all timely,secondly consistent and accurate, and finally complete. Conversely, when consideringan e-banking application, first of all it is preferred that data is accurate, consistent and
47
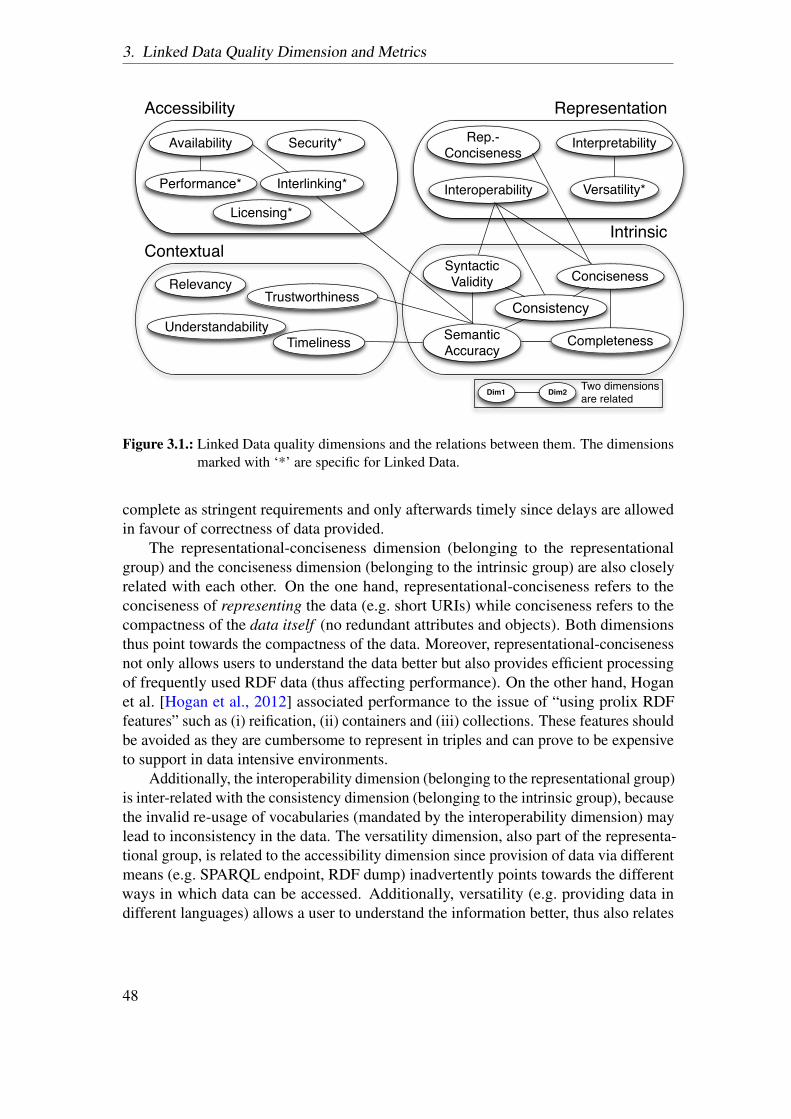
3. Linked Data Quality Dimension and Metrics
Relevancy Conciseness
Timeliness
Rep.-Conciseness
Interoperability
Consistency
Interpretability
Understandability
Versatility*
Availability
Performance* Interlinking*
SyntacticValidity
Representation
ContextualIntrinsic
Accessibility
Trustworthiness
Two dimensionsare related
Licensing*
Semantic Accuracy
Completeness
Security*
Dim1 Dim2
Figure 3.1.: Linked Data quality dimensions and the relations between them. The dimensionsmarked with ‘*’ are specific for Linked Data.
complete as stringent requirements and only afterwards timely since delays are allowedin favour of correctness of data provided.
The representational-conciseness dimension (belonging to the representationalgroup) and the conciseness dimension (belonging to the intrinsic group) are also closelyrelated with each other. On the one hand, representational-conciseness refers to theconciseness of representing the data (e.g. short URIs) while conciseness refers to thecompactness of the data itself (no redundant attributes and objects). Both dimensionsthus point towards the compactness of the data. Moreover, representational-concisenessnot only allows users to understand the data better but also provides efficient processingof frequently used RDF data (thus affecting performance). On the other hand, Hoganet al. [Hogan et al., 2012] associated performance to the issue of “using prolix RDFfeatures” such as (i) reification, (ii) containers and (iii) collections. These features shouldbe avoided as they are cumbersome to represent in triples and can prove to be expensiveto support in data intensive environments.
Additionally, the interoperability dimension (belonging to the representational group)is inter-related with the consistency dimension (belonging to the intrinsic group), becausethe invalid re-usage of vocabularies (mandated by the interoperability dimension) maylead to inconsistency in the data. The versatility dimension, also part of the representa-tional group, is related to the accessibility dimension since provision of data via differentmeans (e.g. SPARQL endpoint, RDF dump) inadvertently points towards the differentways in which data can be accessed. Additionally, versatility (e.g. providing data indifferent languages) allows a user to understand the information better, thus also relates
48
3.3. Summary
to the understandability dimension. Furthermore, there exists an inter-relation betweenthe conciseness and the relevancy dimensions. Conciseness frequently positively affectsrelevancy since removing redundancies increases the proportion of relevant data that canbe retrieved.
The interlinking dimension is associated with the semantic accuracy dimension. Itis important to choose the correct similarity relationship such as same, matches, similaror related between two entities to capture the most appropriate relationship [Halpinet al., 2010] thus contributing towards the semantic accuracy of the data. Additionally,interlinking is directly related to the interlinking completeness dimension. However, theinterlinking dimension focuses on the quality of the interlinks whereas the interlinkingcompleteness focus on the presence of all relevant interlinks in a dataset.
These sets of non-exhaustive examples of inter-relations between the dimensionsbelonging to different groups indicates the interplay between them and show that thesedimensions are to be considered differently in different data quality assessment scenarios.
3.3. Summary
In this section, we provided a total of 18 quality dimensions and 69 metrics thatcan be applied for quality assessment of LD identified from the 30 core articles ofour survey. In particular, we provided a definition and an example for each of the 18dimensions. Additionally, different metrics were identified for each dimension andwere furthermore classified into being qualitatively or quantitatively assessed. The 18dimensions were classified into four groups and the intra as well as the inter relationsbetween the dimensions were discussed.
49
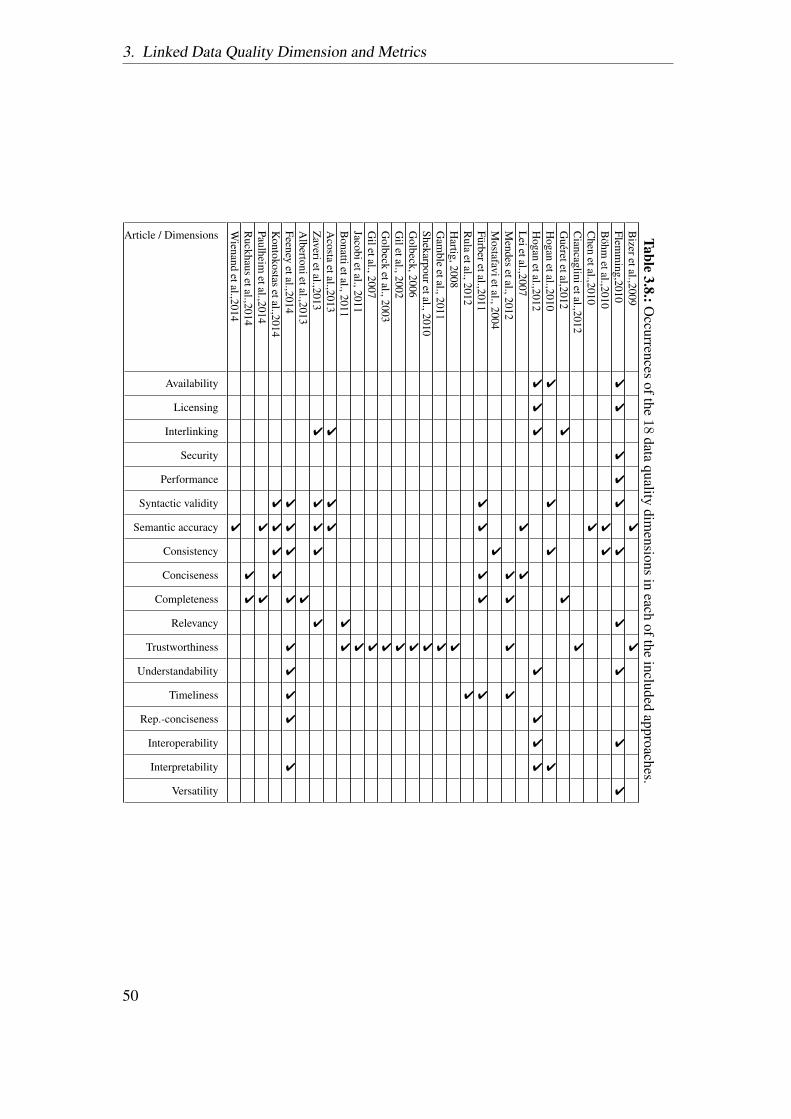
3. Linked Data Quality Dimension and Metrics
Table3.8.:O
ccurrencesofthe
18data
qualitydim
ensionsin
eachofthe
includedapproaches.
Bizeretal.,2009
4
4
Flemm
ing,2010
4
4
4
4
4
4
4
4
4
4
Bohm
etal.,2010
4
4
Chen
etal.,2010
4
Ciancaglinietal.,2012
4
Gueretetal,2012
4
4
Hogan
etal.,2010
4
4
4
4
Hogan
etal.,2012
4
4
4
4
4
4
4
Leietal.,2007
4
4
Mendes
etal.,2012
4
4
4
4
Mostafavietal.,2004
4
Furberetal.,2011
4
4
4
4
4
Rula
etal.,2012
4
Hartig,2008
4
Gam
bleetal.,2011
4
Shekarpouretal.,2010
4
Golbeck,2006
4
Giletal.,2002
4
Golbeck
etal.,2003
4
Giletal.,2007
4
Jacobietal.,2011
4
Bonattietal.,2011
4
4
Acosta
etal.,2013
4
4
4
Zaverietal.,2013
4
4
4
4
4
Albertonietal.,2013
4
Feeneyetal.,2014
4
4
4
4
4
4
4
4
4
Kontokostas
etal.,20144
4
4
4
Paulheimetal.,2014
4
4
Ruckhaus
etal.,2014
4
4
Wienand
etal.,2014
4
Article / Dimensions
Availability
Licensing
Interlinking
Security
Performance
Syntactic validity
Semantic accuracy
Consistency
Conciseness
Completeness
Relevancy
Trustworthiness
Understandability
Timeliness
Rep.-conciseness
Interoperability
Interpretability
Versatility
50

4. User-Driven Linked Data QualityEvaluation
On the Data Web, we have varying quality of information covering various domains.There are a large number of high quality datasets (in particular in the life-sciencesdomain), which are carefully curated over decades and recently published on the Web.There are, however, also many datasets, which were extracted from unstructured andsemi-structured information or are the result of some crowdsourcing process, where largenumbers of users contribute small parts. DBpedia [Auer and Lehmann, 2007, Lehmannet al., 2009] is actually an example for both - a dataset extracted from the result of acrowdsourcing process. Hence, we assess and present results of assessing the quality ofDBpedia in this chapter, which is based on [Zaveri et al., 2013a].
Quality usually means fitness for a certain use case [Juran, 1974]. Hence, evendatasets with quality problems might be useful for certain applications, as long as thequality is in the required range. In the case of DBpedia, for example, the data quality isperfectly sufficient for enriching Web search with facts or suggestions about commonsense information, such as entertainment topics. In such a scenario, where the DBpediabackground knowledge can be, for example, used to show the movies Angelina Joliewas starring in and actors she played with it is rather neglectable if, in relatively fewcases, a movie or an actor is missing. For developing a medical application, on the otherhand, the quality of DBpedia is probably completely insufficient. Please note, that alsoon the traditional document-oriented Web we have varying quality of the informationand still the Web is perceived to be extremely useful by most people. Consequently, akey challenge is to determine the quality of datasets published on the Web and make thisquality information explicit. Other than on the document Web where information qualitycan be only indirectly defined, we can have much more concrete and measurable dataquality indicators for structured information, such as correctness of facts, adequacy ofsemantic representation or degree of coverage.
In this chapter, we devise a data quality assessment methodology, which comprisesof a manual and a semi-automatic process. We empirically assess, based on this method-ology, the data quality of one of the major knowledge hubs on the Data Web – DBpedia.In the manual process, the first phase includes the detection of common quality problemsand their representation in a quality problem taxonomy. The second phase comprisesof the evaluation of a large number of individual resources, according to the qualityproblem taxonomy, performed by users. Here we would like to clarify the use of crowd-source used in this study. Crowdsourcing involves the creating if Human IntelligentTasks (HIT), submitting them to a crowdsourcing platform (e.g. Amazon Mechanical
51
4. User-Driven Linked Data Quality Evaluation
Turk1) and providing a (financial) reward for each HIT [Howe, 2006]. However, we usethe broader-sense of the word as a large-scale problem-solving approach by which aproblem is divided into several smaller tasks (assessing the quality of each triple, in thiscase) that can be independently solved by a large group of people. Each representedfact is evaluated for correctness by each user and, if found problematic, annotated withone of 17 pre-defined quality criteria. This process is accompanied by a tool, namelyTripleCheckMate, wherein a user assesses an individual resource and evaluates each factfor correctness. In this case, the user is a LD expert who is conversant with RDF. Incase of the semi-automatic process, the first phase involves the detection of commonquality problems by the automatic creation of an extended schema for DBpedia. Thesecond phase involves the generation and manual verification of schema axioms.
The semi-automatic process involves the generation and verification of schemaaxioms, which yielded a total of 222,982 triples that have a high probability to beincorrect. We find that while a substantial number of problems exist, the overall qualityis with a less than 11.93% error rate relatively high. With this study we not only aim toassess the quality of DBpedia but also to adopt a methodology to improve the quality infuture versions by regularly providing feedback to the DBpedia maintainers to fix theseproblems.
Our main contributions are:
• a crowdsourcing based methodology for data quality assessment (Section 4.1),
• a comprehensive quality issue taxonomy comprising common knowledge extrac-tion problems (Section 4.2),
• a crowdsourcing based data quality assessment tool (Section 4.3),
• an empirical data quality analysis of the DBpedia dataset performed using crowd-sourcing (Section 5.3) and
• a semi-automated evaluation of data quality problems in DBpedia (Section 5.3).
We conclude with an outlook on future work in Section 7.5.
4.1. Assessment Methodology
In this section, we describe a generalized methodology for the assessment andsubsequent data quality improvement of resources belonging to a dataset. The assessmentmethodology we propose is depicted in Figure 4.1. This methodology consists of thefollowing four steps: 1. Resource selection, 2. Evaluation mode selection, 3. Resourceevaluation and 4. Data quality improvement. In the following, we describe these steps inmore detail.
1http://mturk.com
52
4.1. Assessment Methodology
Step I: Resource selection. In this first step, the resources belonging to a particulardataset are selected. This selection can be performed in three different ways:
• Per Class: select resources belonging to a particular class
• Completely random: a random resource from the dataset
• Manual: a resource selected manually from the dataset
Choosing resources per class (e.g. animal, sport, place etc.) gives the user the flexibilityto choose resources belonging to only those classes she is familiar with. However,when choosing resources from a class, the selection should be made in proportion tothe number of instances of that class. Random selection, on the other hand, ensuresan unbiased and uniform coverage of the underlying dataset. In the manual selectionoption, the user is free to select resources with problems that she has perhaps previouslyidentified.
Step II: Evaluation mode selection. The assignment of the resources to a personor machine, selected in Step I, can be accomplished in the following three ways:
• Manual: the selected resources are assigned to a person (or group of individuals)who will then proceed to manually evaluate the resources individually.
• Semi-automatic: selected resources are assigned to a semi-automatic tool, whichperforms data quality assessment employing some form of user feedback.
• Automatic: the selected resources are given as input to an automatic tool, whichperforms the quality assessment without any user involvement.
For the semi-automatic evaluation, machine learning can be applied as shown in[Buhmann and Lehmann, 2012] and provided by the DL-Learner framework [Lehmann,2009, Lehmann and Hitzler, 2010], where the workflow can be as follows: (i) based onthe instance data, generate OWL axioms which can also be seen as restrictions2, e.g.learn characteristics (irreflexivity, (inverse) functionality, asymmetry) of properties aswell as definitions and disjointness of classes in the knowledge base; (ii) ask queriesvia SPARQL or a reasoner for violations of theses restrictions, e.g. in case of anirreflexive property, triples where subject and object are the same would indeed violatethe characteristic of the irreflexivity. In the automatic case, a possible approach is tocheck for inconsistencies and other modelling problems as, e.g., described in [Lehmannand Buhmann, 2010].
2A local Unique Name Assumption is used therefore, i.e. every named individual is assumed to bedifferent from every other, unless stated explicitly otherwise
53
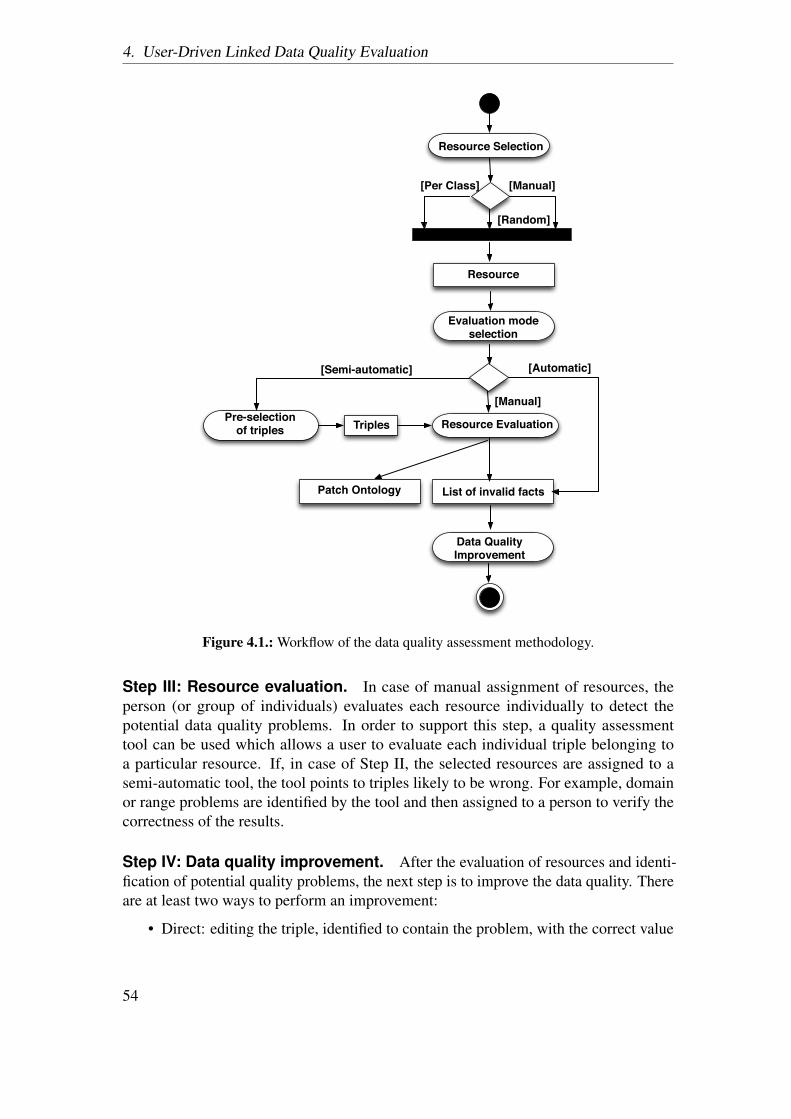
4. User-Driven Linked Data Quality Evaluation
Resource Selection
[Per Class] [Manual]
[Random]
Resource
Evaluation mode selection
Resource Evaluation
[Manual]
Triples
[Semi-automatic] [Automatic]
List of invalid facts
Data QualityImprovement
Pre-selection of triples
Patch Ontology
Figure 4.1.: Workflow of the data quality assessment methodology.
Step III: Resource evaluation. In case of manual assignment of resources, theperson (or group of individuals) evaluates each resource individually to detect thepotential data quality problems. In order to support this step, a quality assessmenttool can be used which allows a user to evaluate each individual triple belonging toa particular resource. If, in case of Step II, the selected resources are assigned to asemi-automatic tool, the tool points to triples likely to be wrong. For example, domainor range problems are identified by the tool and then assigned to a person to verify thecorrectness of the results.
Step IV: Data quality improvement. After the evaluation of resources and identi-fication of potential quality problems, the next step is to improve the data quality. Thereare at least two ways to perform an improvement:
• Direct: editing the triple, identified to contain the problem, with the correct value
54
4.2. Quality Problem Taxonomy
• Indirect: using the Patch Request Ontology3 [Knuth et al., 2012], which allowsgathering user feedbacks about erroneous triples.
4.2. Quality Problem Taxonomy
A systematic review done in [Zaveri et al., 2015] identified a number of differentdata quality dimensions (criteria) applicable to LD. After carrying out an initial dataquality assessment on DBpedia (as part of the first phase of the manual assessmentmethodology cf. subsubsection 4.4.1.1), the problems identified were mapped to thislist of identified dimensions. In particular, Accuracy, Relevancy, Representational-consistency and Interlinking were identified to be problems affecting a large number ofDBpedia resources. Additionally, these dimensions were further divided into categoriesand sub-categories.
Table 4.1 gives an overview of these data quality dimensions along with theircategories and sub-categories. We indicate whether the problems are automaticallydetectable (column D) and fixable (column F). The ones marked with a 4in column Drefer to those categories that can be automatically identified such as invalid datatypes("1981-01-01T00:00:00+02:00"ˆˆxsd:gYear), irrelevant properties (dbpprop:imageCaption)or dead links. The column F refers to those categories that can be automatically amended,like fixing an invalid datatype ("1981"ˆˆxsd:gYear) or removing triples with irrelevant properties and dead links. If theproblem is fixable, we determined whether the problem can be fixed by amending the (i)extraction framework (E), (ii) the mappings wiki (M) or (iii) Wikipedia itself (W).
Moreover, the table specifies whether the problems are specific to DBpedia (markedwith a 4) or could potentially occur in any RDF dataset. For example, the sub-categorySpecial template not properly recognized is a problem that occurs only in DBpedia dueto the presence of specific keywords in Wikipedia articles that do not cite any referencesor resources (e.g. {{Unreferenced stub—auto=yes}}). On the other hand, the problemsthat are not DBpedia specific can occur in any other datasets. In the following, weprovide the quality problem taxonomy and discuss each of the dimensions along with itscategories and sub-categories in detail by providing examples.
4.2.1. AccuracyAccuracy is defined as the extent to which data is correct, that is, the degree to which
it correctly represents the real world facts and is also free of error [Zaveri et al., 2015].We further classify this dimension into the categories (i) object incorrectly extracted, (ii)datatype problems and (iii) implicit relationship between attributes.
Object incorrectly extracted. This category refers to those problems, which arisewhen the object value of a triple is flawed. This may occur when the value is either (i)
3http://141.89.225.43/patchr/ontologies/patchr.ttl#
55
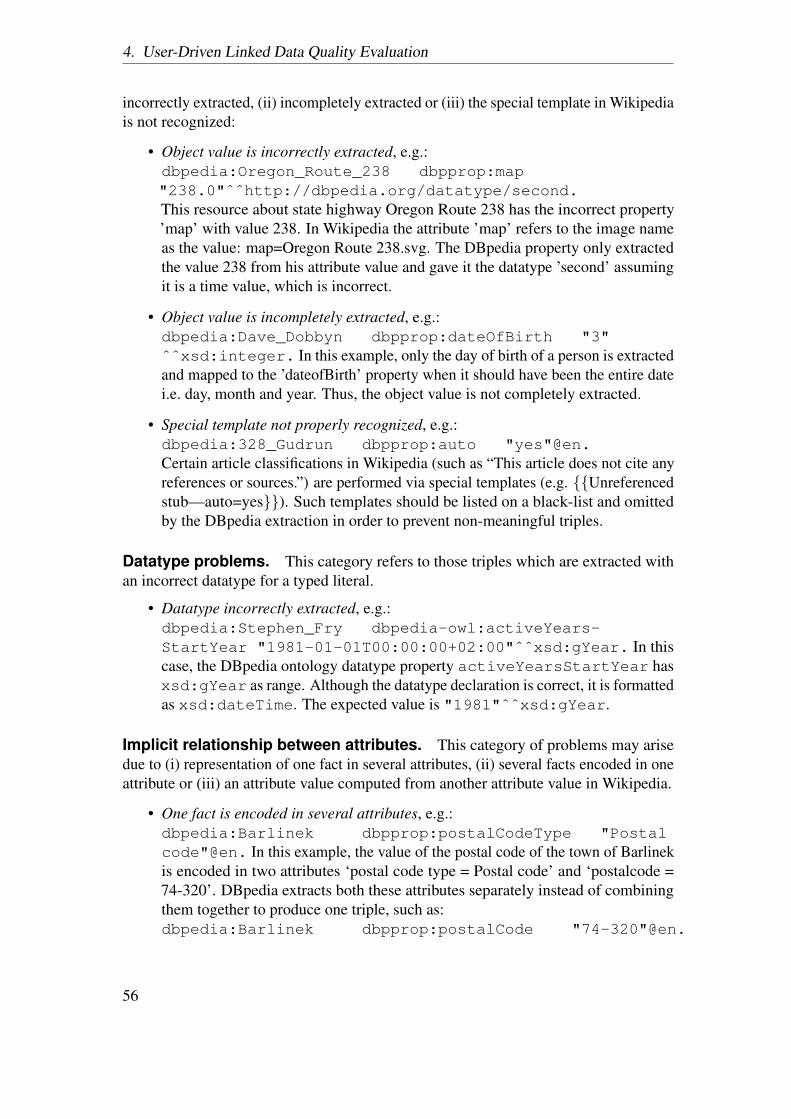
4. User-Driven Linked Data Quality Evaluation
incorrectly extracted, (ii) incompletely extracted or (iii) the special template in Wikipediais not recognized:
• Object value is incorrectly extracted, e.g.:dbpedia:Oregon_Route_238 dbpprop:map"238.0"ˆˆhttp://dbpedia.org/datatype/second.This resource about state highway Oregon Route 238 has the incorrect property’map’ with value 238. In Wikipedia the attribute ’map’ refers to the image nameas the value: map=Oregon Route 238.svg. The DBpedia property only extractedthe value 238 from his attribute value and gave it the datatype ’second’ assumingit is a time value, which is incorrect.
• Object value is incompletely extracted, e.g.:dbpedia:Dave_Dobbyn dbpprop:dateOfBirth "3"ˆˆxsd:integer. In this example, only the day of birth of a person is extractedand mapped to the ’dateofBirth’ property when it should have been the entire datei.e. day, month and year. Thus, the object value is not completely extracted.
• Special template not properly recognized, e.g.:dbpedia:328_Gudrun dbpprop:auto "yes"@en.Certain article classifications in Wikipedia (such as “This article does not cite anyreferences or sources.”) are performed via special templates (e.g. {{Unreferencedstub—auto=yes}}). Such templates should be listed on a black-list and omittedby the DBpedia extraction in order to prevent non-meaningful triples.
Datatype problems. This category refers to those triples which are extracted withan incorrect datatype for a typed literal.
• Datatype incorrectly extracted, e.g.:dbpedia:Stephen_Fry dbpedia-owl:activeYears-StartYear "1981-01-01T00:00:00+02:00"ˆˆxsd:gYear. In thiscase, the DBpedia ontology datatype property activeYearsStartYear hasxsd:gYear as range. Although the datatype declaration is correct, it is formattedas xsd:dateTime. The expected value is "1981"ˆˆxsd:gYear.
Implicit relationship between attributes. This category of problems may arisedue to (i) representation of one fact in several attributes, (ii) several facts encoded in oneattribute or (iii) an attribute value computed from another attribute value in Wikipedia.
• One fact is encoded in several attributes, e.g.:dbpedia:Barlinek dbpprop:postalCodeType "Postalcode"@en. In this example, the value of the postal code of the town of Barlinekis encoded in two attributes ‘postal code type = Postal code’ and ‘postalcode =74-320’. DBpedia extracts both these attributes separately instead of combiningthem together to produce one triple, such as:dbpedia:Barlinek dbpprop:postalCode "74-320"@en.
56
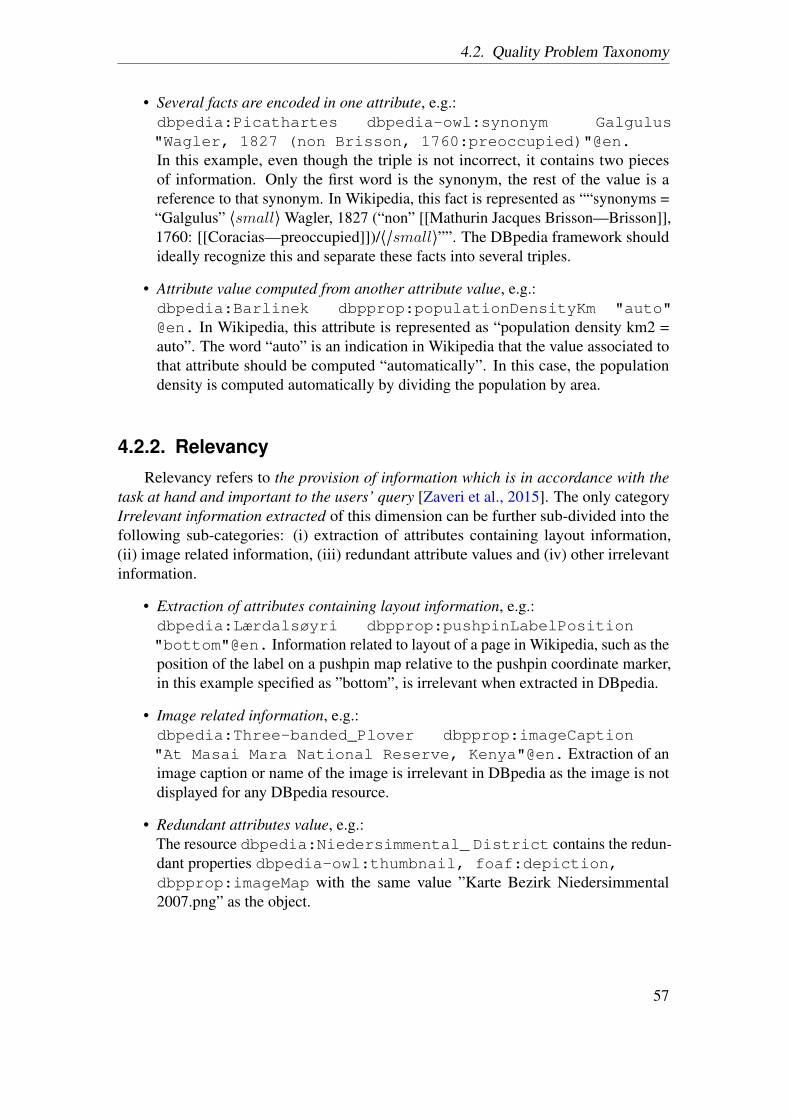
4.2. Quality Problem Taxonomy
• Several facts are encoded in one attribute, e.g.:dbpedia:Picathartes dbpedia-owl:synonym Galgulus"Wagler, 1827 (non Brisson, 1760:preoccupied)"@en.In this example, even though the triple is not incorrect, it contains two piecesof information. Only the first word is the synonym, the rest of the value is areference to that synonym. In Wikipedia, this fact is represented as ““synonyms =“Galgulus” ⟨small⟩Wagler, 1827 (“non” [[Mathurin Jacques Brisson—Brisson]],1760: [[Coracias—preoccupied]])/⟨/small⟩””. The DBpedia framework shouldideally recognize this and separate these facts into several triples.
• Attribute value computed from another attribute value, e.g.:dbpedia:Barlinek dbpprop:populationDensityKm "auto"@en. In Wikipedia, this attribute is represented as “population density km2 =auto”. The word “auto” is an indication in Wikipedia that the value associated tothat attribute should be computed “automatically”. In this case, the populationdensity is computed automatically by dividing the population by area.
4.2.2. RelevancyRelevancy refers to the provision of information which is in accordance with the
task at hand and important to the users’ query [Zaveri et al., 2015]. The only categoryIrrelevant information extracted of this dimension can be further sub-divided into thefollowing sub-categories: (i) extraction of attributes containing layout information,(ii) image related information, (iii) redundant attribute values and (iv) other irrelevantinformation.
• Extraction of attributes containing layout information, e.g.:dbpedia:Lærdalsøyri dbpprop:pushpinLabelPosition"bottom"@en. Information related to layout of a page in Wikipedia, such as theposition of the label on a pushpin map relative to the pushpin coordinate marker,in this example specified as ”bottom”, is irrelevant when extracted in DBpedia.
• Image related information, e.g.:dbpedia:Three-banded_Plover dbpprop:imageCaption"At Masai Mara National Reserve, Kenya"@en. Extraction of animage caption or name of the image is irrelevant in DBpedia as the image is notdisplayed for any DBpedia resource.
• Redundant attributes value, e.g.:The resource dbpedia:Niedersimmental_ District contains the redun-dant properties dbpedia-owl:thumbnail, foaf:depiction,dbpprop:imageMap with the same value ”Karte Bezirk Niedersimmental2007.png” as the object.
57
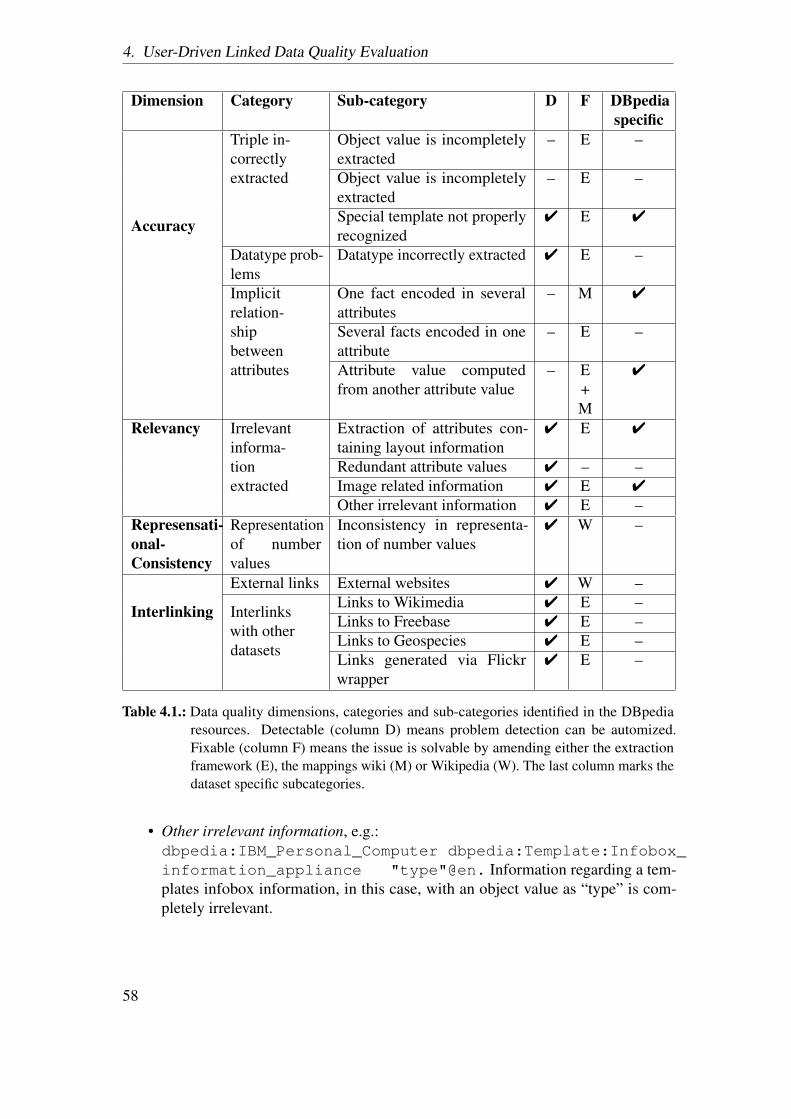
4. User-Driven Linked Data Quality Evaluation
Dimension Category Sub-category D F DBpediaspecific
Accuracy
Triple in-correctlyextracted
Object value is incompletelyextracted
– E –
Object value is incompletelyextracted
– E –
Special template not properlyrecognized
4 E 4
Datatype prob-lems
Datatype incorrectly extracted 4 E –
Implicitrelation-shipbetweenattributes
One fact encoded in severalattributes
– M 4
Several facts encoded in oneattribute
– E –
Attribute value computedfrom another attribute value
– E+M
4
Relevancy Irrelevantinforma-tionextracted
Extraction of attributes con-taining layout information
4 E 4
Redundant attribute values 4 – –Image related information 4 E 4
Other irrelevant information 4 E –Represensati-onal-Consistency
Representationof numbervalues
Inconsistency in representa-tion of number values
4 W –
Interlinking
External links External websites 4 W –
Interlinkswith otherdatasets
Links to Wikimedia 4 E –Links to Freebase 4 E –Links to Geospecies 4 E –Links generated via Flickrwrapper
4 E –
Table 4.1.: Data quality dimensions, categories and sub-categories identified in the DBpediaresources. Detectable (column D) means problem detection can be automized.Fixable (column F) means the issue is solvable by amending either the extractionframework (E), the mappings wiki (M) or Wikipedia (W). The last column marks thedataset specific subcategories.
• Other irrelevant information, e.g.:dbpedia:IBM_Personal_Computer dbpedia:Template:Infobox_information_appliance "type"@en. Information regarding a tem-plates infobox information, in this case, with an object value as “type” is com-pletely irrelevant.
58
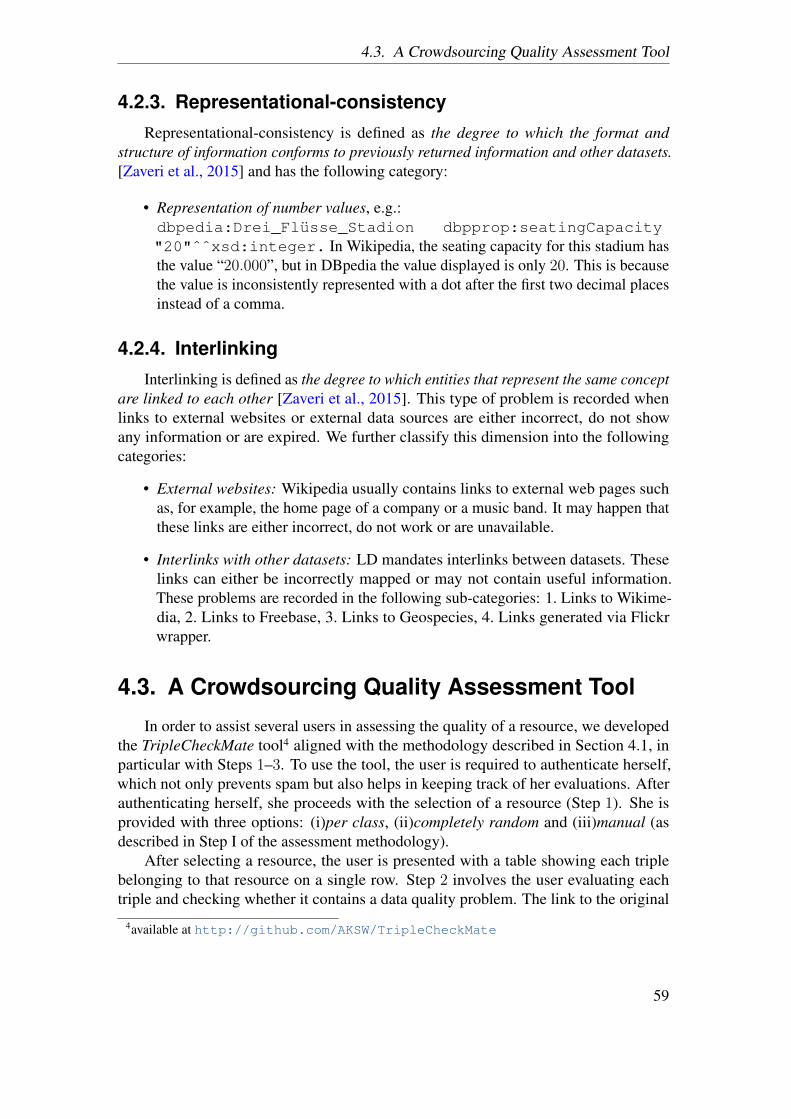
4.3. A Crowdsourcing Quality Assessment Tool
4.2.3. Representational-consistencyRepresentational-consistency is defined as the degree to which the format and
structure of information conforms to previously returned information and other datasets.[Zaveri et al., 2015] and has the following category:
• Representation of number values, e.g.:dbpedia:Drei_Flusse_Stadion dbpprop:seatingCapacity"20"ˆˆxsd:integer. In Wikipedia, the seating capacity for this stadium hasthe value “20.000”, but in DBpedia the value displayed is only 20. This is becausethe value is inconsistently represented with a dot after the first two decimal placesinstead of a comma.
4.2.4. InterlinkingInterlinking is defined as the degree to which entities that represent the same concept
are linked to each other [Zaveri et al., 2015]. This type of problem is recorded whenlinks to external websites or external data sources are either incorrect, do not showany information or are expired. We further classify this dimension into the followingcategories:
• External websites: Wikipedia usually contains links to external web pages suchas, for example, the home page of a company or a music band. It may happen thatthese links are either incorrect, do not work or are unavailable.
• Interlinks with other datasets: LD mandates interlinks between datasets. Theselinks can either be incorrectly mapped or may not contain useful information.These problems are recorded in the following sub-categories: 1. Links to Wikime-dia, 2. Links to Freebase, 3. Links to Geospecies, 4. Links generated via Flickrwrapper.
4.3. A Crowdsourcing Quality Assessment Tool
In order to assist several users in assessing the quality of a resource, we developedthe TripleCheckMate tool4 aligned with the methodology described in Section 4.1, inparticular with Steps 1–3. To use the tool, the user is required to authenticate herself,which not only prevents spam but also helps in keeping track of her evaluations. Afterauthenticating herself, she proceeds with the selection of a resource (Step 1). She isprovided with three options: (i)per class, (ii)completely random and (iii)manual (asdescribed in Step I of the assessment methodology).
After selecting a resource, the user is presented with a table showing each triplebelonging to that resource on a single row. Step 2 involves the user evaluating eachtriple and checking whether it contains a data quality problem. The link to the original
4available at http://github.com/AKSW/TripleCheckMate
59

4. User-Driven Linked Data Quality Evaluation
Wikipedia page for the chosen resource is provided on top of the page, which facilitatesthe user to check against the original values. If the triple contains a problem, she checksthe box “is wrong”. Moreover, she is provided with a taxonomy of pre-defined dataquality problems where she assigns each incorrect triple to a problem. If the detectedproblem does not match any of the existing types, she has the option to provide anew type and extend the taxonomy. After evaluating one resource, the user saves theevaluation and proceeds to choosing another random resource and follows the sameprocedure.
Another important feature of the tool is to allow measuring of inter-rater agreements.That is, when a user selects a random method (Any or Class) to choose a resource, thereis a 50% probability that she is presented with a resource that was already evaluatedby another user. This probability as well as the number of evaluations per resource isconfigurable. Allowing many users evaluating a single resource not only helps to deter-mine whether incorrect triples are recognized correctly but also to determine incorrectevaluations (e.g. incorrect classification of problem type or marking correct triples asincorrect), especially when crowdsourcing the quality assessment of resources. Oneimportant feature of the tool is that although it was built for DBpedia, it is parametriz-able to accept any endpoint and, with very few adjustments in the database back-end(i.e. ontology classes and problem types) one could use it for any LD dataset (open orclosed).
4.4. Evaluation of DBpedia Data Quality
4.4.1. Evaluation Methodology
4.4.1.1. Manual Methodology
We performed the assessment of the quality of DBpedia in two phases: Phase I:Problem detection and creation of taxonomy and Phase II: Evaluation via crowdsourcing.
Phase I: Creation of quality problem taxonomy. In the first phase, two researchersindependently assessed the quality of 20 DBpedia resources each. During this phasean initial list of data quality problems, which occurred in each resource, was identified.These identified problems were mapped to the different quality dimensions from [Zaveriet al., 2015]. After analyzing the root cause of these problems, a refinement of thequality dimensions was done to obtain a finer classification of the dimensions. Thisclassification of the dimensions into sub-categories resulted in a total of 17 types of dataquality problems (cf. Table 4.1) as described in Section 4.2.
Phase II: Crowdsourcing quality assessment. In the second phase, we crowdsourcedthe quality evaluation wherein we invited researchers who are familiar with RDF to usethe TripleCheckMate tool (described in Section 4.3). First, each user after authenticatingoneself, chooses a resource by one of three options mentioned in Section 4.1. Thereafter,the extracted facts about that resource are shown to the user. The user then looks at eachindividual fact and records whether it contains a data quality problem and maps it to the
60
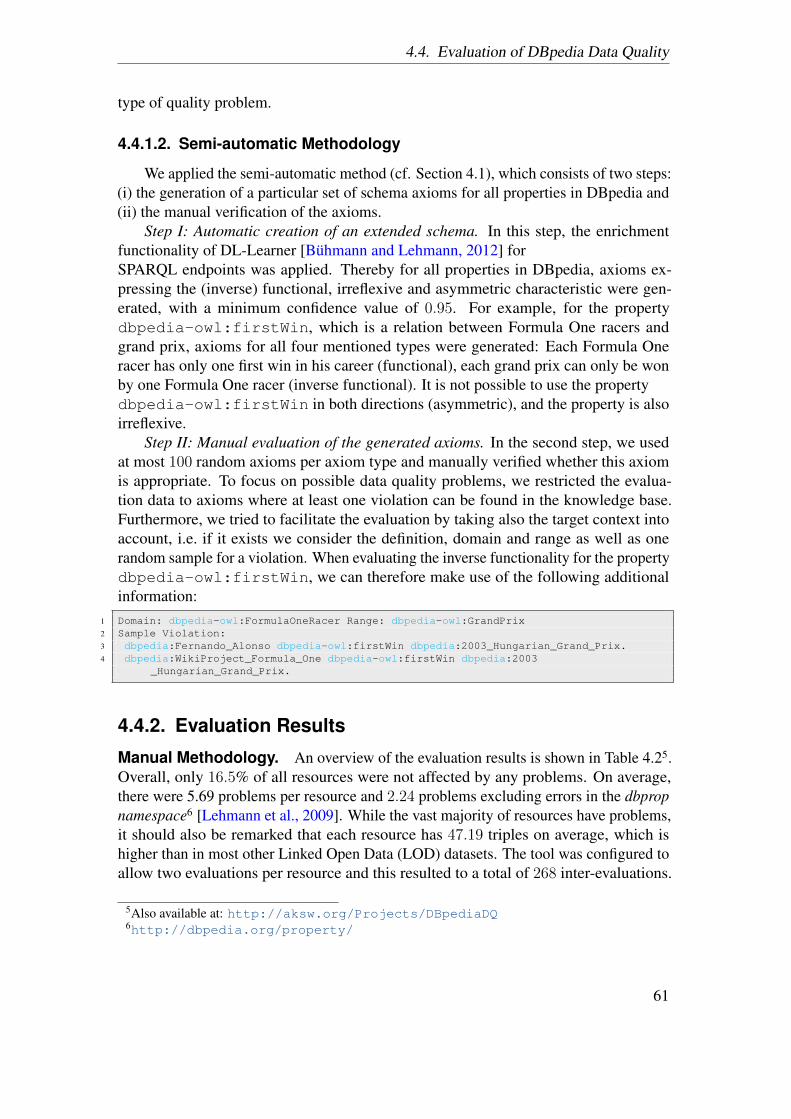
4.4. Evaluation of DBpedia Data Quality
type of quality problem.
4.4.1.2. Semi-automatic Methodology
We applied the semi-automatic method (cf. Section 4.1), which consists of two steps:(i) the generation of a particular set of schema axioms for all properties in DBpedia and(ii) the manual verification of the axioms.
Step I: Automatic creation of an extended schema. In this step, the enrichmentfunctionality of DL-Learner [Buhmann and Lehmann, 2012] forSPARQL endpoints was applied. Thereby for all properties in DBpedia, axioms ex-pressing the (inverse) functional, irreflexive and asymmetric characteristic were gen-erated, with a minimum confidence value of 0.95. For example, for the propertydbpedia-owl:firstWin, which is a relation between Formula One racers andgrand prix, axioms for all four mentioned types were generated: Each Formula Oneracer has only one first win in his career (functional), each grand prix can only be wonby one Formula One racer (inverse functional). It is not possible to use the propertydbpedia-owl:firstWin in both directions (asymmetric), and the property is alsoirreflexive.
Step II: Manual evaluation of the generated axioms. In the second step, we usedat most 100 random axioms per axiom type and manually verified whether this axiomis appropriate. To focus on possible data quality problems, we restricted the evalua-tion data to axioms where at least one violation can be found in the knowledge base.Furthermore, we tried to facilitate the evaluation by taking also the target context intoaccount, i.e. if it exists we consider the definition, domain and range as well as onerandom sample for a violation. When evaluating the inverse functionality for the propertydbpedia-owl:firstWin, we can therefore make use of the following additionalinformation:
1 Domain: dbpedia-owl:FormulaOneRacer Range: dbpedia-owl:GrandPrix2 Sample Violation:3 dbpedia:Fernando_Alonso dbpedia-owl:firstWin dbpedia:2003_Hungarian_Grand_Prix.4 dbpedia:WikiProject_Formula_One dbpedia-owl:firstWin dbpedia:2003
_Hungarian_Grand_Prix.
4.4.2. Evaluation Results
Manual Methodology. An overview of the evaluation results is shown in Table 4.25.Overall, only 16.5% of all resources were not affected by any problems. On average,there were 5.69 problems per resource and 2.24 problems excluding errors in the dbpropnamespace6 [Lehmann et al., 2009]. While the vast majority of resources have problems,it should also be remarked that each resource has 47.19 triples on average, which ishigher than in most other Linked Open Data (LOD) datasets. The tool was configured toallow two evaluations per resource and this resulted to a total of 268 inter-evaluations.
5Also available at: http://aksw.org/Projects/DBpediaDQ6http://dbpedia.org/property/
61
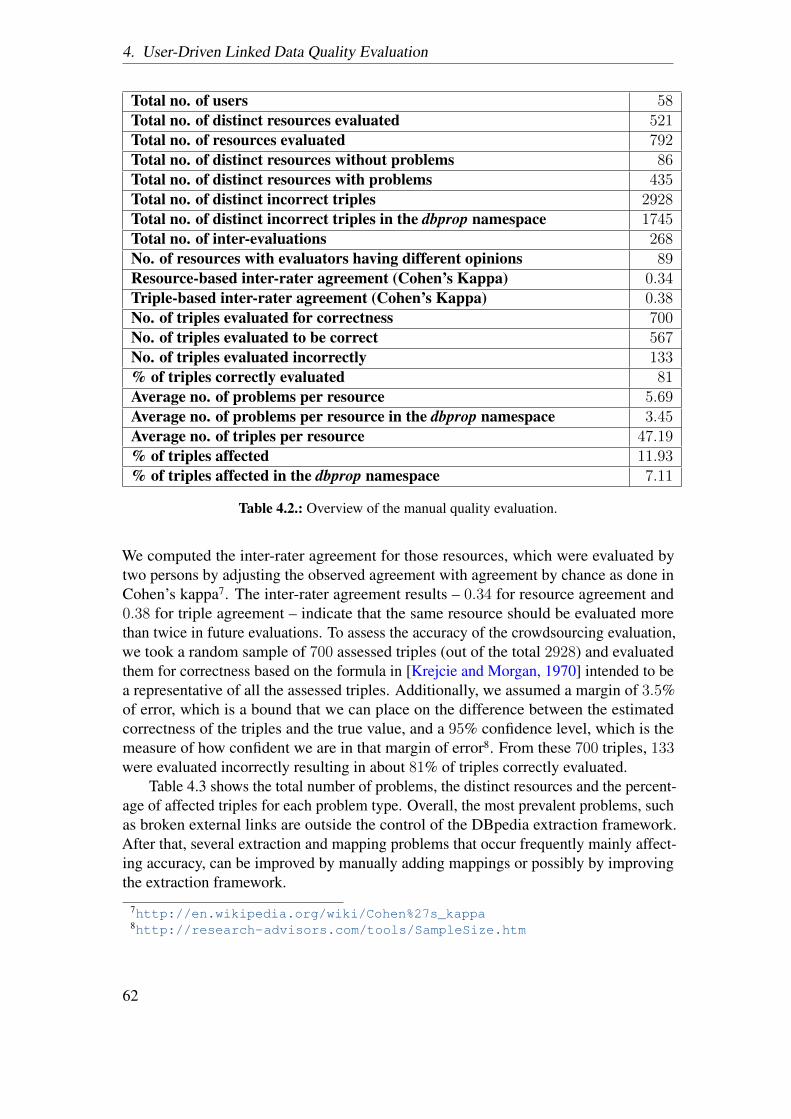
4. User-Driven Linked Data Quality Evaluation
Total no. of users 58Total no. of distinct resources evaluated 521Total no. of resources evaluated 792Total no. of distinct resources without problems 86Total no. of distinct resources with problems 435Total no. of distinct incorrect triples 2928Total no. of distinct incorrect triples in the dbprop namespace 1745Total no. of inter-evaluations 268No. of resources with evaluators having different opinions 89Resource-based inter-rater agreement (Cohen’s Kappa) 0.34Triple-based inter-rater agreement (Cohen’s Kappa) 0.38No. of triples evaluated for correctness 700No. of triples evaluated to be correct 567No. of triples evaluated incorrectly 133% of triples correctly evaluated 81Average no. of problems per resource 5.69Average no. of problems per resource in the dbprop namespace 3.45Average no. of triples per resource 47.19% of triples affected 11.93% of triples affected in the dbprop namespace 7.11
Table 4.2.: Overview of the manual quality evaluation.
We computed the inter-rater agreement for those resources, which were evaluated bytwo persons by adjusting the observed agreement with agreement by chance as done inCohen’s kappa7. The inter-rater agreement results – 0.34 for resource agreement and0.38 for triple agreement – indicate that the same resource should be evaluated morethan twice in future evaluations. To assess the accuracy of the crowdsourcing evaluation,we took a random sample of 700 assessed triples (out of the total 2928) and evaluatedthem for correctness based on the formula in [Krejcie and Morgan, 1970] intended to bea representative of all the assessed triples. Additionally, we assumed a margin of 3.5%of error, which is a bound that we can place on the difference between the estimatedcorrectness of the triples and the true value, and a 95% confidence level, which is themeasure of how confident we are in that margin of error8. From these 700 triples, 133were evaluated incorrectly resulting in about 81% of triples correctly evaluated.
Table 4.3 shows the total number of problems, the distinct resources and the percent-age of affected triples for each problem type. Overall, the most prevalent problems, suchas broken external links are outside the control of the DBpedia extraction framework.After that, several extraction and mapping problems that occur frequently mainly affect-ing accuracy, can be improved by manually adding mappings or possibly by improvingthe extraction framework.
7http://en.wikipedia.org/wiki/Cohen%27s_kappa8http://research-advisors.com/tools/SampleSize.htm
62
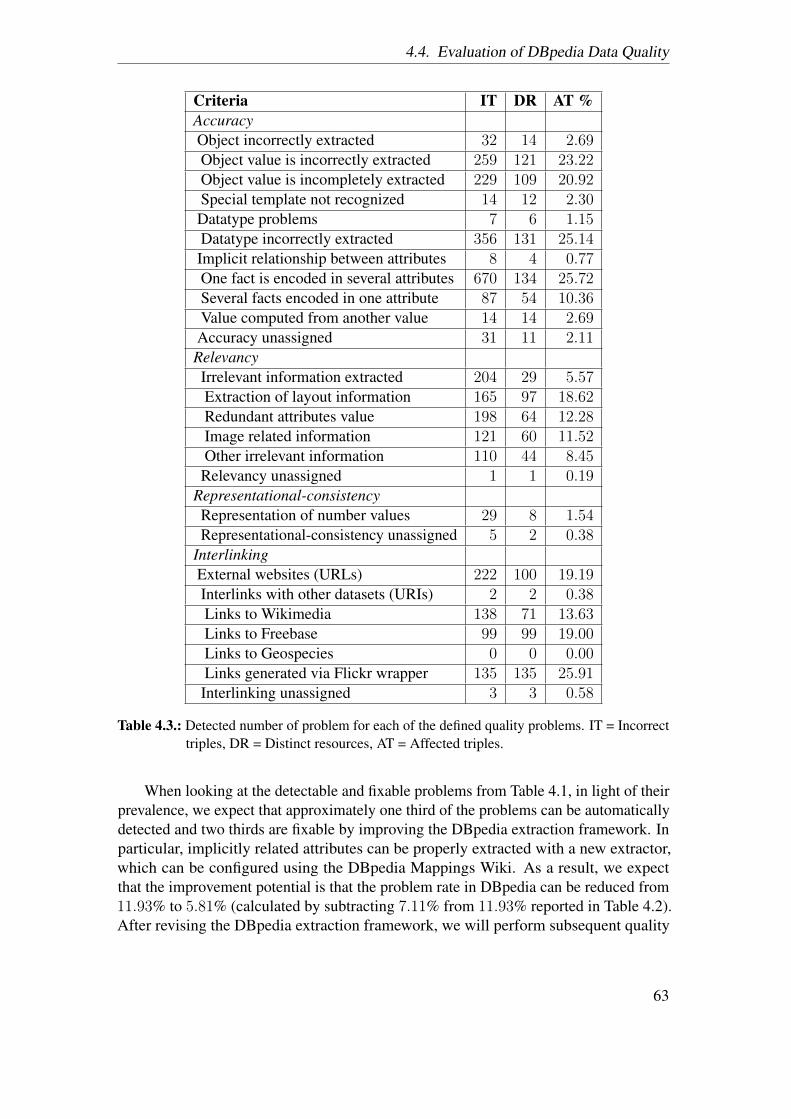
4.4. Evaluation of DBpedia Data Quality
Criteria IT DR AT %AccuracyObject incorrectly extracted 32 14 2.69Object value is incorrectly extracted 259 121 23.22Object value is incompletely extracted 229 109 20.92Special template not recognized 14 12 2.30Datatype problems 7 6 1.15Datatype incorrectly extracted 356 131 25.14Implicit relationship between attributes 8 4 0.77One fact is encoded in several attributes 670 134 25.72Several facts encoded in one attribute 87 54 10.36Value computed from another value 14 14 2.69Accuracy unassigned 31 11 2.11RelevancyIrrelevant information extracted 204 29 5.57Extraction of layout information 165 97 18.62Redundant attributes value 198 64 12.28Image related information 121 60 11.52Other irrelevant information 110 44 8.45Relevancy unassigned 1 1 0.19
Representational-consistencyRepresentation of number values 29 8 1.54Representational-consistency unassigned 5 2 0.38
InterlinkingExternal websites (URLs) 222 100 19.19Interlinks with other datasets (URIs) 2 2 0.38Links to Wikimedia 138 71 13.63Links to Freebase 99 99 19.00Links to Geospecies 0 0 0.00Links generated via Flickr wrapper 135 135 25.91Interlinking unassigned 3 3 0.58
Table 4.3.: Detected number of problem for each of the defined quality problems. IT = Incorrecttriples, DR = Distinct resources, AT = Affected triples.
When looking at the detectable and fixable problems from Table 4.1, in light of theirprevalence, we expect that approximately one third of the problems can be automaticallydetected and two thirds are fixable by improving the DBpedia extraction framework. Inparticular, implicitly related attributes can be properly extracted with a new extractor,which can be configured using the DBpedia Mappings Wiki. As a result, we expectthat the improvement potential is that the problem rate in DBpedia can be reduced from11.93% to 5.81% (calculated by subtracting 7.11% from 11.93% reported in Table 4.2).After revising the DBpedia extraction framework, we will perform subsequent quality
63
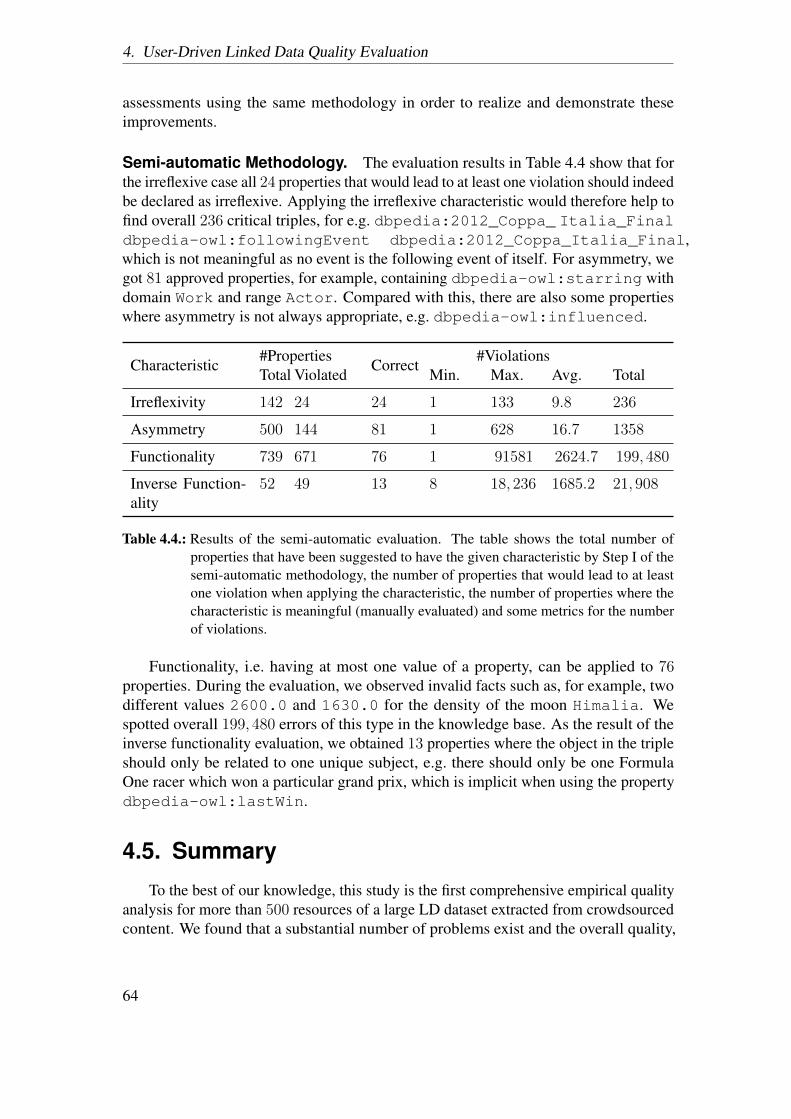
4. User-Driven Linked Data Quality Evaluation
assessments using the same methodology in order to realize and demonstrate theseimprovements.
Semi-automatic Methodology. The evaluation results in Table 4.4 show that forthe irreflexive case all 24 properties that would lead to at least one violation should indeedbe declared as irreflexive. Applying the irreflexive characteristic would therefore help tofind overall 236 critical triples, for e.g. dbpedia:2012_Coppa_ Italia_Finaldbpedia-owl:followingEvent dbpedia:2012_Coppa_Italia_Final,which is not meaningful as no event is the following event of itself. For asymmetry, wegot 81 approved properties, for example, containing dbpedia-owl:starring withdomain Work and range Actor. Compared with this, there are also some propertieswhere asymmetry is not always appropriate, e.g. dbpedia-owl:influenced.
Characteristic#Properties
Correct#Violations
Total Violated Min. Max. Avg. Total
Irreflexivity 142 24 24 1 133 9.8 236
Asymmetry 500 144 81 1 628 16.7 1358
Functionality 739 671 76 1 91581 2624.7 199,480
Inverse Function-ality
52 49 13 8 18,236 1685.2 21,908
Table 4.4.: Results of the semi-automatic evaluation. The table shows the total number ofproperties that have been suggested to have the given characteristic by Step I of thesemi-automatic methodology, the number of properties that would lead to at leastone violation when applying the characteristic, the number of properties where thecharacteristic is meaningful (manually evaluated) and some metrics for the numberof violations.
Functionality, i.e. having at most one value of a property, can be applied to 76properties. During the evaluation, we observed invalid facts such as, for example, twodifferent values 2600.0 and 1630.0 for the density of the moon Himalia. Wespotted overall 199,480 errors of this type in the knowledge base. As the result of theinverse functionality evaluation, we obtained 13 properties where the object in the tripleshould only be related to one unique subject, e.g. there should only be one FormulaOne racer which won a particular grand prix, which is implicit when using the propertydbpedia-owl:lastWin.
4.5. Summary
To the best of our knowledge, this study is the first comprehensive empirical qualityanalysis for more than 500 resources of a large LD dataset extracted from crowdsourcedcontent. We found that a substantial number of problems exist and the overall quality,
64
4.5. Summary
with a 11.93% error rate, is moderate. Moreover, the semi-automatic analysis revealedmore than 200,000 violations of property characteristics. The detailed analysis of dataquality problems occurring in DBpedia allows us to devise and implement correspondingmitigation strategies. Many of the problems found can be firstly automatically detectedand secondly avoided by (i) improving existing extractors, (ii) developing new ones(e.g. for implicitly related attributes) or (iii) improving and extending mappings andextraction hints on the DBpedia Mappings Wiki. With this study, we not only aim toassess the quality of this sample of DBpedia resources but also adopt an agile method-ology to improve the quality in future versions by regularly providing feedback to theDBpedia maintainers to fix these problems. We plan to improve the DBpedia extractionframework along these detected problems and periodically revisit the quality analysis(in regular intervals) in order to demonstrate possible improvements.
In addition to the quality analysis of DBpedia, we devised a generic methodology forLD quality analysis, derived a comprehensive taxonomy of extraction quality problemsand developed a crowdsourcing tool, which can assist in the evaluation. All thesecontributions can be reused for analyzing any other extracted dataset (even by domainexperts). In sum, we showed that the employment of Linked Data experts to assess thequality issues of LD is feasible to a certain extent as it can be time-consuming and costly.We illustrated that a combination of user-driven and semi-automated methodology toperform LD quality assessment is a feasible means of performing quality assessment.
65
5. Crowdsourcing Linked DataQuality Assessment
Many would agree that LD is one of the most important technological developmentsin data management of the last decade. However, one of the less positive aspects ofthis great success story is related to the varying quality of LD sources, which oftenposes serious problems to developers aiming to seamlessly consume and integrate LDin their applications. This state of the affairs is the result of a combination of data-and process-related factors. Keeping aside the factual flaws of the original sources,the array of data sources that may be subject to RDFication is highly heterogeneous interms of format, organization and vocabulary. As a direct consequence, some kinds ofdata tend to be more challenging to translate into RDF than others, leading to errors inthe LD provisioning process. Some of the quality issues hence produced (e.g. missingvalues) can be easily repaired automatically, but others require manual intervention.In this chapter, we look into the use of crowdsourcing as a data curation strategy thatis cost-efficient and accurate in terms of the level of granularity of the errors to bespotted. This chapter is based on [Acosta et al., 2013]. This is a joint work, where I havecontributed as a co-author in the following tasks:
• creation of a taxonomy of data quality problems occurring in LD
• creation of the gold standard dataset
• comparison and evaluation of results from the crowdsourcing tasks with the goldstandard dataset
• calculation and comparison of results from the crowdsourcing tasks with thebaseline results
We analyzed the most common quality problems encountered in LD sources andclassified them according to the extent to which they are likely to be amenable toa specific form of crowdsourcing. Based on this analysis, we implemented a qualityassessment methodology for LD that leverages the wisdom of the crowds in the followingways: (i) we first launched a contest targeting an expert crowd of LD researchers andenthusiasts in order to find and classify erroneous RDF triples; and then (ii) publishedthe outcome of this contest as paid microtasks on Amazon Mechanical Turk (MTurk)1
in order to verify the issues spotted by the experts [Bernstein et al., 2010].
1https://www.mturk.com/
66
5.1. Linked Data Quality Issues
These two crowdsourcing approaches have advantages and disadvantages. Eachapproach makes specific assumptions about the audiences they address (the ‘crowd’)and the skills of the potential contributors. A contest reaches out to the crowd to solvea given problem and rewards the best ideas; it exploits competition and intellectualchallenge as main drivers for participation. The idea, originating from open innovation,has been employed in many domains, from creative industries to sciences, for tasks ofvarying complexity (from designing logos to building sophisticated algorithms). Weapplied this contest-based model to mobilize an expert crowd consisting of researchersand LD enthusiasts to discover and classify quality issues in DBpedia. The participantwho covered the highest number of DBpedia resources won a prize.
Microtask crowdsourcing traditionally covers a different set of scenarios. Tasksprimarily rely on basic human abilities, including visual and audio cognition, as well asnatural language understanding and communication (sometimes in different languages)and less on acquired skills (such as subject-matter knowledge). As such, a great share ofthe tasks addressed via microtask platforms like MTurk could be referred to as ‘routine’tasks – recognizing objects in images, transcripting audio and video material and textediting. To be more efficient than traditional outsourcing (or even in-house resources),the tasks need to be highly parallelized. This means that the actual work is executed by ahigh number of contributors in a decentralized fashion; this not only leads to significantimprovements in terms of time of delivery, but also offers a means to cross-check theaccuracy of the answers (as each task is typically assigned to more than one person)and reward the workers according to their performance and productivity. We appliedmicrotask crowdsourcing as a fast and cost-efficient way to examine the errors spotted bythe expert crowd who participated in the contest. More concretely, we looked into threetypes of quality problems the experts found in DBpedia: (i) object values incorrectlyor incompletely extracted; (ii) data type incorrectly extracted; and (iii) incorrect linksbetween DBpedia entities and related sources on the Web. The underlying data wastranslated into HITs, the unit of work in MTurk, which were handled by workers on theMTurk platform.
We empirically evaluated how this methodology – based on a mixed crowdsourcingapproach – could efficiently spot quality issues in DBpedia. The results show that thetwo styles of crowdsourcing are complementary and that crowdsourcing-enabled qualityassessment is a promising and affordable yet a limited way to enhance the quality ofLD sets, which, in the long run, may address many of the problems that fundamentallyconstrain the usability of the Web of Data in real-world applications.
5.1. Linked Data Quality Issues
The Web of Data spans a network of data sources of varying quality. There are alarge number of high-quality data sets, for instance, in the life-science domain, whichare the result of decades of thorough curation and have been recently made available as
67
5. Crowdsourcing Linked Data Quality Assessment
LD2. Other data sets, however, have been (semi-)automatically translated to RDF fromtheir primary sources, or via crowdsourcing in a decentralized process involving a largenumber of contributors. Probably the best example of a data set produced in this manneris DBpedia [Lehmann et al., 2009]. While the combination of machine-driven extractionand crowdsourcing was a reasonable approach to produce a baseline version of a greatlyuseful resource, it was also the cause of a wide range of quality problems, in particular inthe mappings between Wikipedia attributes and their corresponding DBpedia properties.
Our analysis of LD quality issues focuses on DBpedia as a representative data setfor the broader Web of Data due to the diversity of the types of errors exhibited and thevast domain and scope of the data set. In our previous work [Zaveri et al., 2015], wecompiled a list of data quality dimensions (criteria) applicable to Linked Data qualityassessment. Afterwards, we mapped these dimensions to DBpedia [Zaveri et al., 2013a].A sub-set of four criteria of the original framework were found particularly relevant inthis setting: Accuracy, Relevancy, Representational-Consistency and Interlinking. Toprovide a comprehensive analysis of DBpedia quality, we further divided these fourcategories of problems into sub-categories. For the purpose of this study, from thesecategories we chose the following three triple-level quality issues.
Object incorrectly/incompletely extracted. Consider the triple:dbpedia:Firewing dbpprop:isbn "978"ˆˆxsd:integer. This DBpe-dia resource is about the children’s book ‘Firewing’, with the incomplete and incorrectvalue of the ISBN number. Instead of extracting the entire ISBN number from Wikipedia,978-0-00-639194-4, only the first three digits were extracted.
Data type incorrectly extracted. This category refers to triples with an incorrectdata type for a typed literal. For example, in the DBpedia ontology, the range of thepropertyverb—activeYearsStartYear— is defined as xsd:gYear. Although the data type decla-ration is correct in the triple dbpedia:Stephen_Fry dbpedia-owl:activeYears-StartYear "1981-01-01T00:00:00+02:00"ˆˆxsd:gYear, it isformatted as xsd:dateTime. The expected value is "1981"ˆˆxsd:gYear.
Interlinking. In this case, links to external Web sites or other external data sourcessuch as Wikimedia, Freebase, GeoSpecies or links generated via the Flickr wrapper areincorrect; that is, they do not show any related content pertaining to the resource.
The categories of quality problems just discussed occur pervasively in DBpedia. Theseproblems might be present in other data sets, which are extracted in a similar fashion asDBpedia. Given the diversity of the situations in which they can be instantiated (broadrange of data types and object values) and their sometimes deeply contextual character(interlinking), assessing them automatically is challenging. In the following we explainhow crowdsourcing could support quality assessment processes.
2http://beta.bio2rdf.org/
68
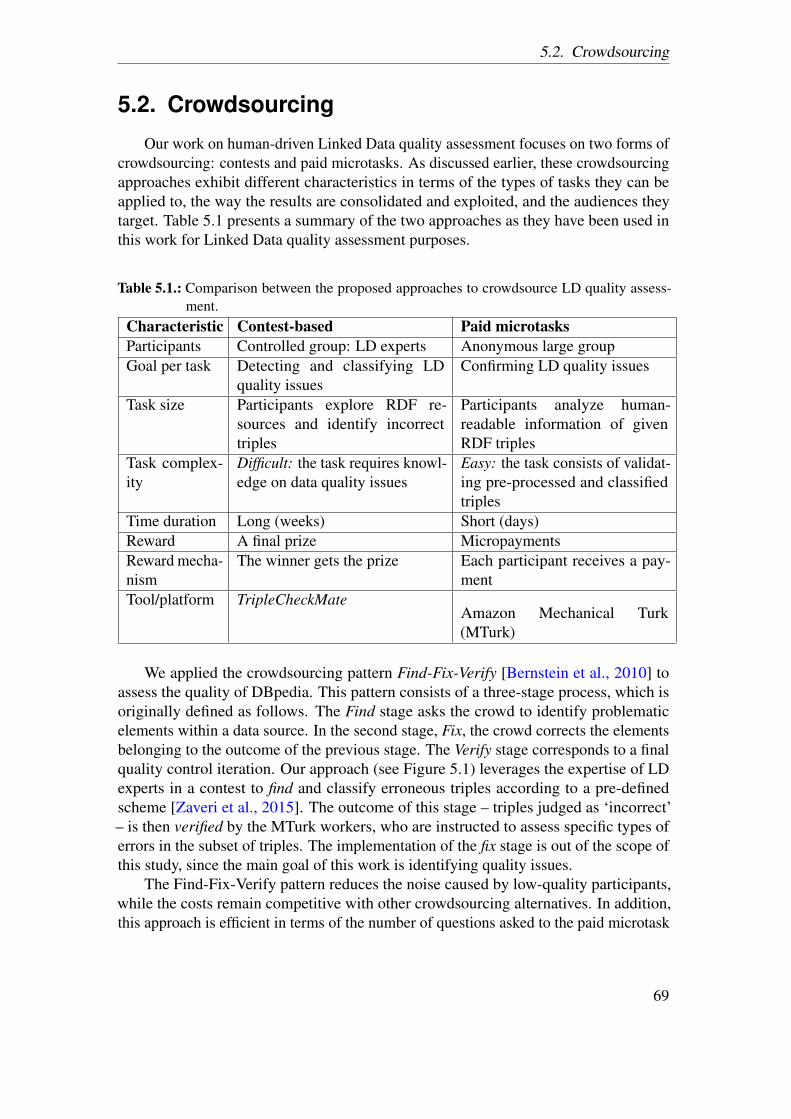
5.2. Crowdsourcing
5.2. Crowdsourcing
Our work on human-driven Linked Data quality assessment focuses on two forms ofcrowdsourcing: contests and paid microtasks. As discussed earlier, these crowdsourcingapproaches exhibit different characteristics in terms of the types of tasks they can beapplied to, the way the results are consolidated and exploited, and the audiences theytarget. Table 5.1 presents a summary of the two approaches as they have been used inthis work for Linked Data quality assessment purposes.
Table 5.1.: Comparison between the proposed approaches to crowdsource LD quality assess-ment.
Characteristic Contest-based Paid microtasksParticipants Controlled group: LD experts Anonymous large groupGoal per task Detecting and classifying LD
quality issuesConfirming LD quality issues
Task size Participants explore RDF re-sources and identify incorrecttriples
Participants analyze human-readable information of givenRDF triples
Task complex-ity
Difficult: the task requires knowl-edge on data quality issues
Easy: the task consists of validat-ing pre-processed and classifiedtriples
Time duration Long (weeks) Short (days)Reward A final prize MicropaymentsReward mecha-nism
The winner gets the prize Each participant receives a pay-ment
Tool/platform TripleCheckMateAmazon Mechanical Turk(MTurk)
We applied the crowdsourcing pattern Find-Fix-Verify [Bernstein et al., 2010] toassess the quality of DBpedia. This pattern consists of a three-stage process, which isoriginally defined as follows. The Find stage asks the crowd to identify problematicelements within a data source. In the second stage, Fix, the crowd corrects the elementsbelonging to the outcome of the previous stage. The Verify stage corresponds to a finalquality control iteration. Our approach (see Figure 5.1) leverages the expertise of LDexperts in a contest to find and classify erroneous triples according to a pre-definedscheme [Zaveri et al., 2015]. The outcome of this stage – triples judged as ‘incorrect’– is then verified by the MTurk workers, who are instructed to assess specific types oferrors in the subset of triples. The implementation of the fix stage is out of the scope ofthis study, since the main goal of this work is identifying quality issues.
The Find-Fix-Verify pattern reduces the noise caused by low-quality participants,while the costs remain competitive with other crowdsourcing alternatives. In addition,this approach is efficient in terms of the number of questions asked to the paid microtask
69
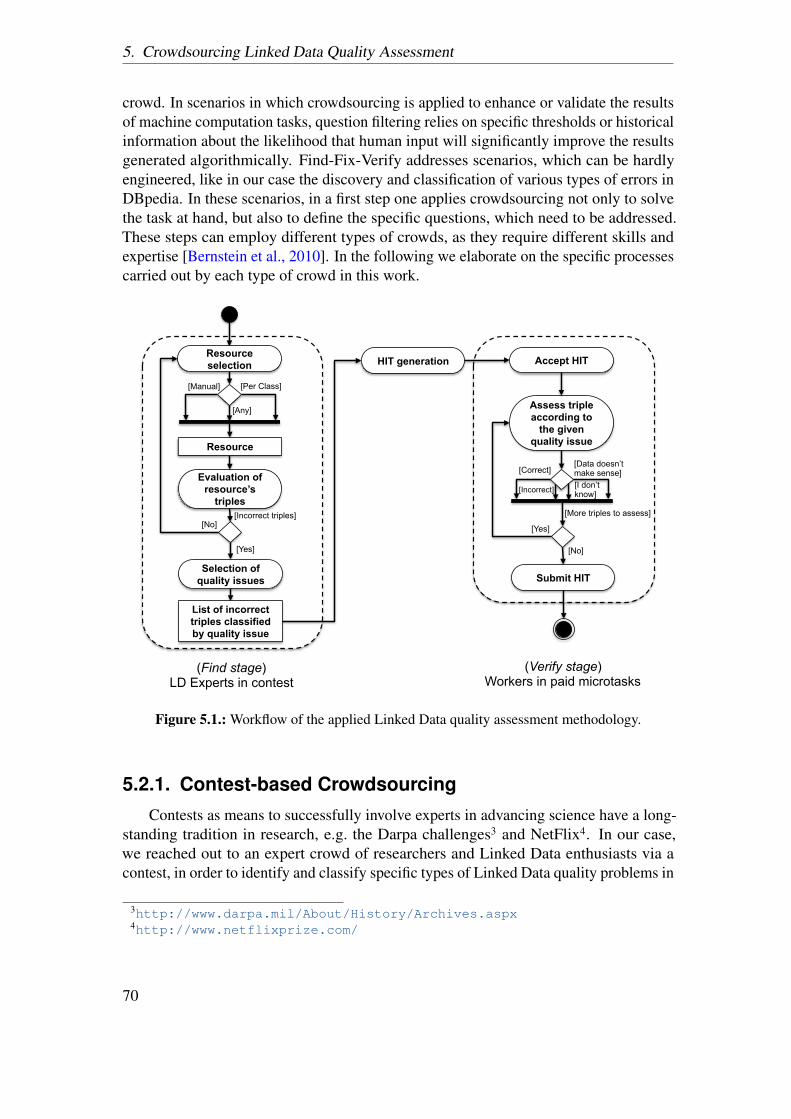
5. Crowdsourcing Linked Data Quality Assessment
crowd. In scenarios in which crowdsourcing is applied to enhance or validate the resultsof machine computation tasks, question filtering relies on specific thresholds or historicalinformation about the likelihood that human input will significantly improve the resultsgenerated algorithmically. Find-Fix-Verify addresses scenarios, which can be hardlyengineered, like in our case the discovery and classification of various types of errors inDBpedia. In these scenarios, in a first step one applies crowdsourcing not only to solvethe task at hand, but also to define the specific questions, which need to be addressed.These steps can employ different types of crowds, as they require different skills andexpertise [Bernstein et al., 2010]. In the following we elaborate on the specific processescarried out by each type of crowd in this work.
Resource
[Manual]
[Any]
Resource selection
Evaluation of resource’s
triples
Selection of quality issues
[Incorrect triples]
[Yes]
[No]
List of incorrect triples classified by quality issue
(Find stage) LD Experts in contest
HIT generation
(Verify stage) Workers in paid microtasks
Accept HIT
Assess triple according to
the given quality issue
Submit HIT
[Per Class]
[Correct]
[Incorrect]
[Data doesn’t make sense] [I don’t know]
[More triples to assess]
[No]
[Yes]
Figure 5.1.: Workflow of the applied Linked Data quality assessment methodology.
5.2.1. Contest-based CrowdsourcingContests as means to successfully involve experts in advancing science have a long-
standing tradition in research, e.g. the Darpa challenges3 and NetFlix4. In our case,we reached out to an expert crowd of researchers and Linked Data enthusiasts via acontest, in order to identify and classify specific types of Linked Data quality problems in
3http://www.darpa.mil/About/History/Archives.aspx4http://www.netflixprize.com/
70

5.2. Crowdsourcing
DBpedia. To collect the contributions from this crowd, in a previous work of ours [Zaveriet al., 2015], we developed a web-based tool, TripleCheckMate5 (see Figure 5.2), whichallows users to select resources, identify issues related to triples of the resource andclassify these issues according to a pre-defined taxonomy of data quality problems.A prize was announced for the user submitting the highest number of (real) qualityproblems.
1
2
3
Figure 5.2.: Screenshot of the TripleCheckMate crowdsourcing data quality assessment tool.
As a basic means to avoid spam, each user first has to login using her Google MailID. Then, as shown in Figure 5.1, she is presented with three options to choose a resourcefrom DBpedia: (i) Any, for random selection; (ii) Per Class, where she may choosea resource belonging to a particular class of her interest; and (iii) Manual, where shemay provide a URI of a resource herself. Once a resource is selected following oneof these alternatives, the user is presented with a table in which each row correspondsto an RDF triple of that resource. The next step is the actual quality assessment attriple level. The user is provided with the link to the corresponding Wikipedia pageof the given resource in order to offer more context for the evaluation. If she detects atriple containing a problem, she checks the box ‘Is Wrong’. Moreover, she can assignthese troublesome triples to quality problems (according to the classification devisedin [Zaveri et al., 2013a]), as shown in Figure 5.2. In this manner, the tool only records thetriples that are identified as ‘incorrect’. This is consistent with the Find stage from theFind-Fix-Verify pattern, where the crowd exclusively detects the problematic elements;while the remaining data is not taken into consideration.
5Available at http://github.com/AKSW/TripleCheckMate
71

5. Crowdsourcing Linked Data Quality Assessment
The tool TripleCheckMate measures inter-rater agreements. This means that DB-pedia resources are typically checked multiple times. This redundancy mechanism isextremely useful to analyze the performance of the users (as we compare their responsesagainst each other), to identify quality problems which are likely to be real (as they areconfirmed by more than one opinion) and to detect unwanted behavior (as users are not‘rewarded’ unless their assessments are ‘consensual’).
The outcome of this contest corresponds to a set of triples judged as ‘incorrect’ bythe experts and classified according to the detected quality issue.
5.2.2. Paid MicrotasksTo fully unfold its benefits, this form of crowdsourcing needs to be applied to
problems which can be broken down into smaller units of work (called ‘microtasks’ or‘Human Intelligence Tasks’ – HITs) that can be undertaken in parallel by independentparties6. As noted earlier, the most common model implies small financial rewards foreach worker taking on a microtask, whereas each microtask may be assigned to morethan one worker in order to allow for techniques such as majority voting to automaticallyidentify accurate responses.
We applied this crowdsourcing approach in order to verify quality issues in DBpediaRDF triples identified as problematic during the contest (see Figure 5.1). One of thechallenges in this context is to develop useful human-understandable interfaces for HITs.In microtasks, optimal user interfaces reduce ambiguity as well as the probability toretrieve erroneous answers from the crowd due to a misinterpretation of the task. Furtherdesign criteria were related to spam detection and quality control; we used differentmechanisms to discourage low-effort behavior, which leads to random answers and toidentify accurate answers (see subsubsection 5.3.1.2).
Based on the classification of LD quality issues explained in Section 5.1, we createdthree different types of HITs. Each type of HIT contains the description of the procedureto be carried out to complete the task successfully. We provided the worker examples ofincorrect and correct examples along with four options: (i) Correct; (ii) Incorrect; (iii) Icannot tell/I don’t know; (iv) Data doesn’t make sense. The third option was meant toallow the user to specify when the question or values were unclear. The fourth optionreferred to those cases in which the presented data was truly unintelligible. Furthermore,the workers were not aware that the presented triples were previously identified as‘incorrect’ by experts and the questions were designed such that the worker could notforesee the right answer. The resulting HITs were submitted to Amazon MechanicalTurk using the MTurk SDK for Java7. We describe the particularities of each type ofHIT in the following.
6More complex workflows, though theoretically feasible, require additional functionality to handle taskdependencies.
7http://aws.amazon.com/code/695
72
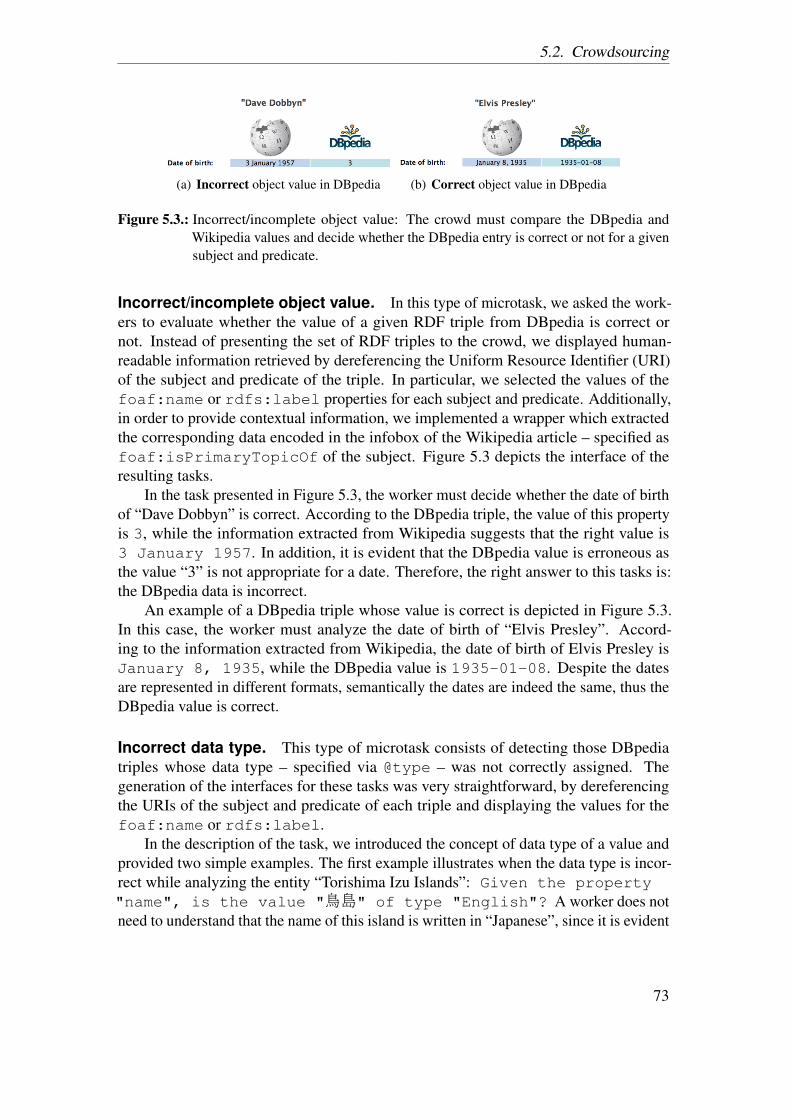
5.2. Crowdsourcing
(a) Incorrect object value in DBpedia (b) Correct object value in DBpedia
Figure 5.3.: Incorrect/incomplete object value: The crowd must compare the DBpedia andWikipedia values and decide whether the DBpedia entry is correct or not for a givensubject and predicate.
Incorrect/incomplete object value. In this type of microtask, we asked the work-ers to evaluate whether the value of a given RDF triple from DBpedia is correct ornot. Instead of presenting the set of RDF triples to the crowd, we displayed human-readable information retrieved by dereferencing the Uniform Resource Identifier (URI)of the subject and predicate of the triple. In particular, we selected the values of thefoaf:name or rdfs:label properties for each subject and predicate. Additionally,in order to provide contextual information, we implemented a wrapper which extractedthe corresponding data encoded in the infobox of the Wikipedia article – specified asfoaf:isPrimaryTopicOf of the subject. Figure 5.3 depicts the interface of theresulting tasks.
In the task presented in Figure 5.3, the worker must decide whether the date of birthof “Dave Dobbyn” is correct. According to the DBpedia triple, the value of this propertyis 3, while the information extracted from Wikipedia suggests that the right value is3 January 1957. In addition, it is evident that the DBpedia value is erroneous asthe value “3” is not appropriate for a date. Therefore, the right answer to this tasks is:the DBpedia data is incorrect.
An example of a DBpedia triple whose value is correct is depicted in Figure 5.3.In this case, the worker must analyze the date of birth of “Elvis Presley”. Accord-ing to the information extracted from Wikipedia, the date of birth of Elvis Presley isJanuary 8, 1935, while the DBpedia value is 1935-01-08. Despite the datesare represented in different formats, semantically the dates are indeed the same, thus theDBpedia value is correct.
Incorrect data type. This type of microtask consists of detecting those DBpediatriples whose data type – specified via @type – was not correctly assigned. Thegeneration of the interfaces for these tasks was very straightforward, by dereferencingthe URIs of the subject and predicate of each triple and displaying the values for thefoaf:name or rdfs:label.
In the description of the task, we introduced the concept of data type of a value andprovided two simple examples. The first example illustrates when the data type is incor-rect while analyzing the entity “Torishima Izu Islands”: Given the property"name", is the value "鳥島" of type "English"? A worker does notneed to understand that the name of this island is written in “Japanese”, since it is evident
73
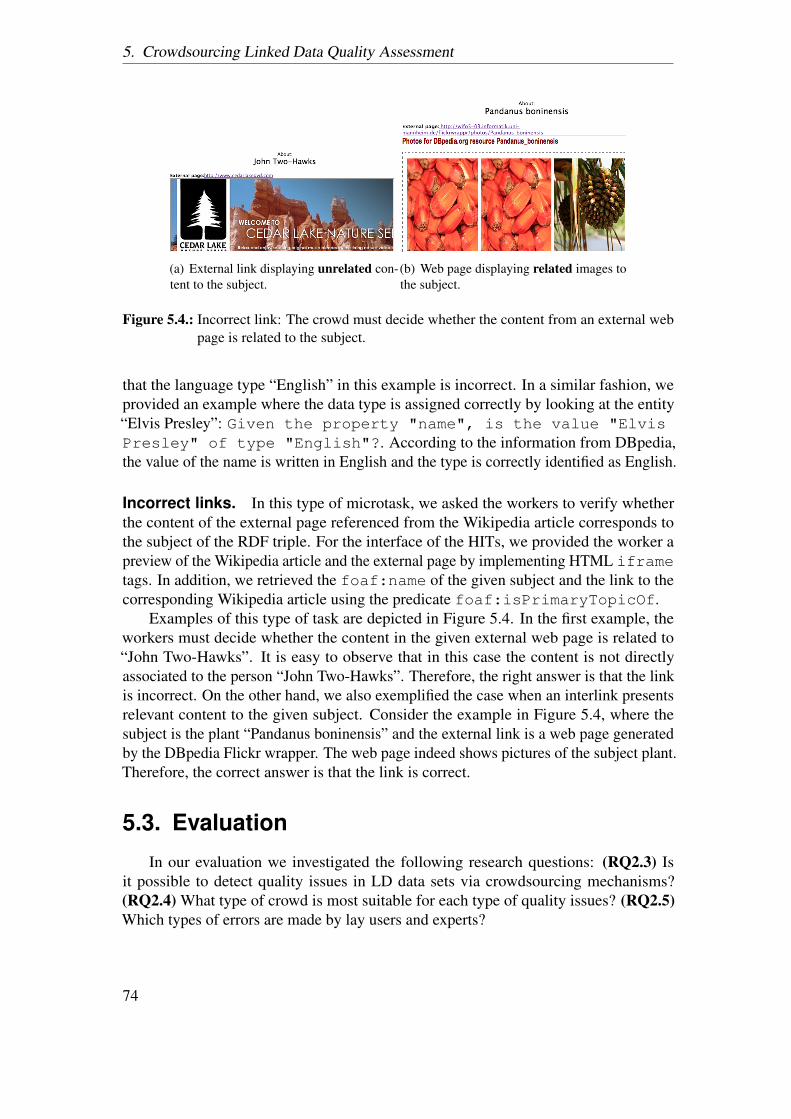
5. Crowdsourcing Linked Data Quality Assessment
(a) External link displaying unrelated con-tent to the subject.
(b) Web page displaying related images tothe subject.
Figure 5.4.: Incorrect link: The crowd must decide whether the content from an external webpage is related to the subject.
that the language type “English” in this example is incorrect. In a similar fashion, weprovided an example where the data type is assigned correctly by looking at the entity“Elvis Presley”: Given the property "name", is the value "ElvisPresley" of type "English"?. According to the information from DBpedia,the value of the name is written in English and the type is correctly identified as English.
Incorrect links. In this type of microtask, we asked the workers to verify whetherthe content of the external page referenced from the Wikipedia article corresponds tothe subject of the RDF triple. For the interface of the HITs, we provided the worker apreview of the Wikipedia article and the external page by implementing HTML iframetags. In addition, we retrieved the foaf:name of the given subject and the link to thecorresponding Wikipedia article using the predicate foaf:isPrimaryTopicOf.
Examples of this type of task are depicted in Figure 5.4. In the first example, theworkers must decide whether the content in the given external web page is related to“John Two-Hawks”. It is easy to observe that in this case the content is not directlyassociated to the person “John Two-Hawks”. Therefore, the right answer is that the linkis incorrect. On the other hand, we also exemplified the case when an interlink presentsrelevant content to the given subject. Consider the example in Figure 5.4, where thesubject is the plant “Pandanus boninensis” and the external link is a web page generatedby the DBpedia Flickr wrapper. The web page indeed shows pictures of the subject plant.Therefore, the correct answer is that the link is correct.
5.3. Evaluation
In our evaluation we investigated the following research questions: (RQ2.3) Isit possible to detect quality issues in LD data sets via crowdsourcing mechanisms?(RQ2.4) What type of crowd is most suitable for each type of quality issues? (RQ2.5)Which types of errors are made by lay users and experts?
74
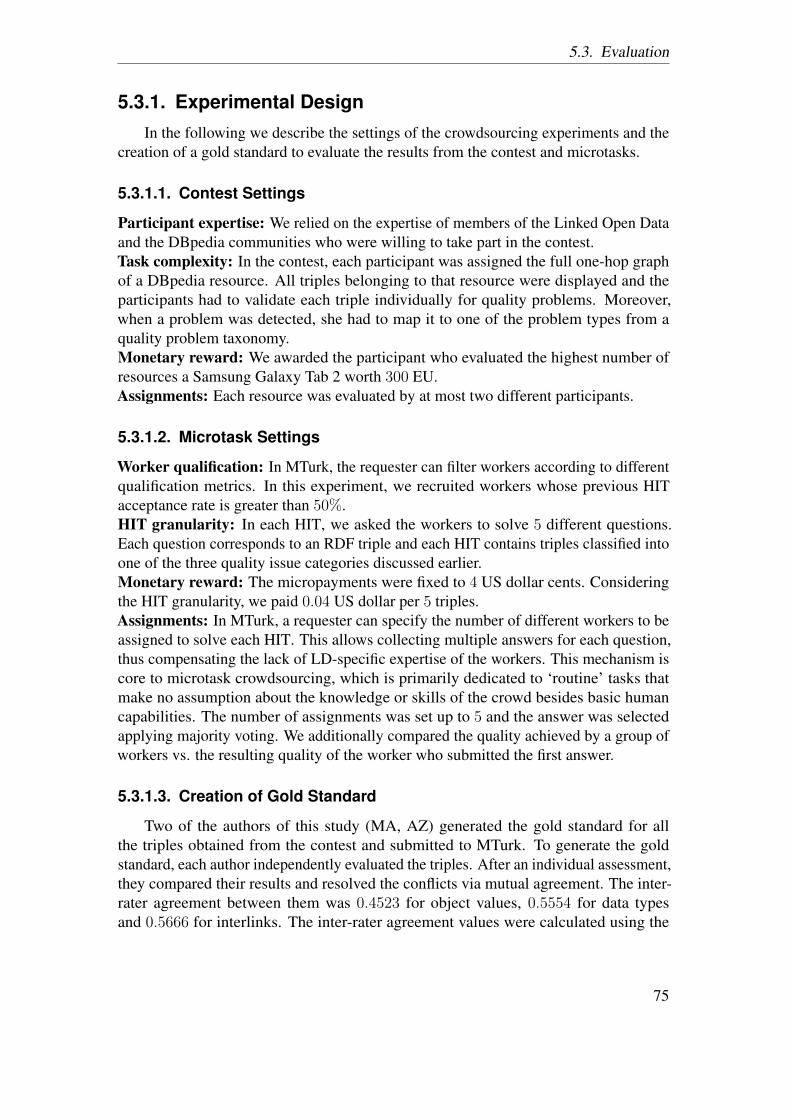
5.3. Evaluation
5.3.1. Experimental DesignIn the following we describe the settings of the crowdsourcing experiments and the
creation of a gold standard to evaluate the results from the contest and microtasks.
5.3.1.1. Contest Settings
Participant expertise: We relied on the expertise of members of the Linked Open Dataand the DBpedia communities who were willing to take part in the contest.Task complexity: In the contest, each participant was assigned the full one-hop graphof a DBpedia resource. All triples belonging to that resource were displayed and theparticipants had to validate each triple individually for quality problems. Moreover,when a problem was detected, she had to map it to one of the problem types from aquality problem taxonomy.Monetary reward: We awarded the participant who evaluated the highest number ofresources a Samsung Galaxy Tab 2 worth 300 EU.Assignments: Each resource was evaluated by at most two different participants.
5.3.1.2. Microtask Settings
Worker qualification: In MTurk, the requester can filter workers according to differentqualification metrics. In this experiment, we recruited workers whose previous HITacceptance rate is greater than 50%.HIT granularity: In each HIT, we asked the workers to solve 5 different questions.Each question corresponds to an RDF triple and each HIT contains triples classified intoone of the three quality issue categories discussed earlier.Monetary reward: The micropayments were fixed to 4 US dollar cents. Consideringthe HIT granularity, we paid 0.04 US dollar per 5 triples.Assignments: In MTurk, a requester can specify the number of different workers to beassigned to solve each HIT. This allows collecting multiple answers for each question,thus compensating the lack of LD-specific expertise of the workers. This mechanism iscore to microtask crowdsourcing, which is primarily dedicated to ‘routine’ tasks thatmake no assumption about the knowledge or skills of the crowd besides basic humancapabilities. The number of assignments was set up to 5 and the answer was selectedapplying majority voting. We additionally compared the quality achieved by a group ofworkers vs. the resulting quality of the worker who submitted the first answer.
5.3.1.3. Creation of Gold Standard
Two of the authors of this study (MA, AZ) generated the gold standard for allthe triples obtained from the contest and submitted to MTurk. To generate the goldstandard, each author independently evaluated the triples. After an individual assessment,they compared their results and resolved the conflicts via mutual agreement. The inter-rater agreement between them was 0.4523 for object values, 0.5554 for data typesand 0.5666 for interlinks. The inter-rater agreement values were calculated using the
75
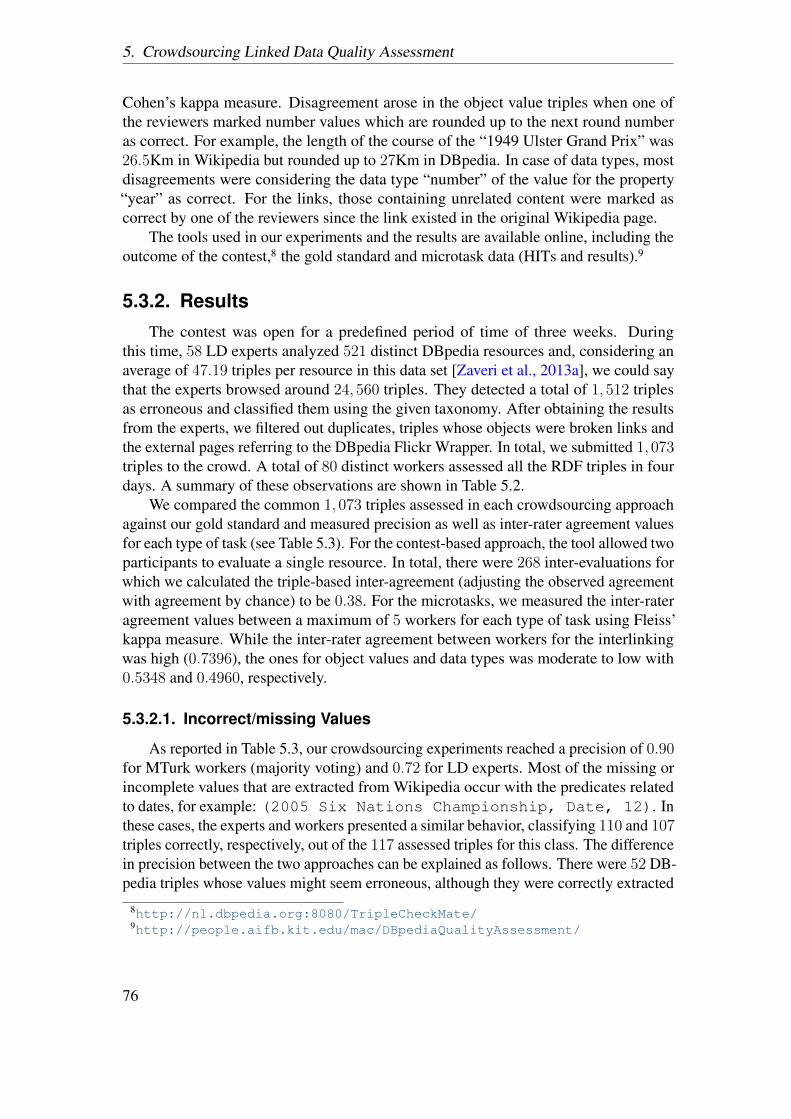
5. Crowdsourcing Linked Data Quality Assessment
Cohen’s kappa measure. Disagreement arose in the object value triples when one ofthe reviewers marked number values which are rounded up to the next round numberas correct. For example, the length of the course of the “1949 Ulster Grand Prix” was26.5Km in Wikipedia but rounded up to 27Km in DBpedia. In case of data types, mostdisagreements were considering the data type “number” of the value for the property“year” as correct. For the links, those containing unrelated content were marked ascorrect by one of the reviewers since the link existed in the original Wikipedia page.
The tools used in our experiments and the results are available online, including theoutcome of the contest,8 the gold standard and microtask data (HITs and results).9
5.3.2. ResultsThe contest was open for a predefined period of time of three weeks. During
this time, 58 LD experts analyzed 521 distinct DBpedia resources and, considering anaverage of 47.19 triples per resource in this data set [Zaveri et al., 2013a], we could saythat the experts browsed around 24,560 triples. They detected a total of 1,512 triplesas erroneous and classified them using the given taxonomy. After obtaining the resultsfrom the experts, we filtered out duplicates, triples whose objects were broken links andthe external pages referring to the DBpedia Flickr Wrapper. In total, we submitted 1,073triples to the crowd. A total of 80 distinct workers assessed all the RDF triples in fourdays. A summary of these observations are shown in Table 5.2.
We compared the common 1,073 triples assessed in each crowdsourcing approachagainst our gold standard and measured precision as well as inter-rater agreement valuesfor each type of task (see Table 5.3). For the contest-based approach, the tool allowed twoparticipants to evaluate a single resource. In total, there were 268 inter-evaluations forwhich we calculated the triple-based inter-agreement (adjusting the observed agreementwith agreement by chance) to be 0.38. For the microtasks, we measured the inter-rateragreement values between a maximum of 5 workers for each type of task using Fleiss’kappa measure. While the inter-rater agreement between workers for the interlinkingwas high (0.7396), the ones for object values and data types was moderate to low with0.5348 and 0.4960, respectively.
5.3.2.1. Incorrect/missing Values
As reported in Table 5.3, our crowdsourcing experiments reached a precision of 0.90for MTurk workers (majority voting) and 0.72 for LD experts. Most of the missing orincomplete values that are extracted from Wikipedia occur with the predicates relatedto dates, for example: (2005 Six Nations Championship, Date, 12). Inthese cases, the experts and workers presented a similar behavior, classifying 110 and 107triples correctly, respectively, out of the 117 assessed triples for this class. The differencein precision between the two approaches can be explained as follows. There were 52 DB-pedia triples whose values might seem erroneous, although they were correctly extracted
8http://nl.dbpedia.org:8080/TripleCheckMate/9http://people.aifb.kit.edu/mac/DBpediaQualityAssessment/
76
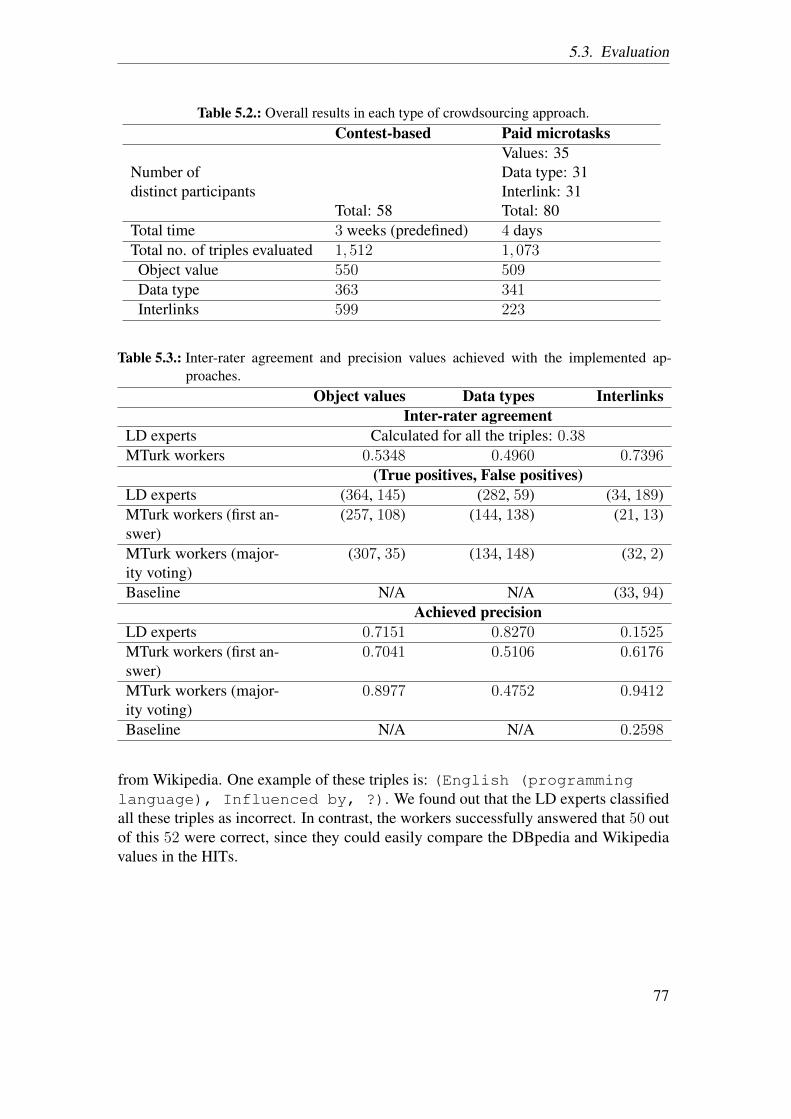
5.3. Evaluation
Table 5.2.: Overall results in each type of crowdsourcing approach.Contest-based Paid microtasks
Values: 35Number of Data type: 31distinct participants Interlink: 31
Total: 58 Total: 80Total time 3 weeks (predefined) 4 daysTotal no. of triples evaluated 1,512 1,073Object value 550 509Data type 363 341Interlinks 599 223
Table 5.3.: Inter-rater agreement and precision values achieved with the implemented ap-proaches.
Object values Data types InterlinksInter-rater agreement
LD experts Calculated for all the triples: 0.38MTurk workers 0.5348 0.4960 0.7396
(True positives, False positives)LD experts (364, 145) (282, 59) (34, 189)MTurk workers (first an-swer)
(257, 108) (144, 138) (21, 13)
MTurk workers (major-ity voting)
(307, 35) (134, 148) (32, 2)
Baseline N/A N/A (33, 94)Achieved precision
LD experts 0.7151 0.8270 0.1525MTurk workers (first an-swer)
0.7041 0.5106 0.6176
MTurk workers (major-ity voting)
0.8977 0.4752 0.9412
Baseline N/A N/A 0.2598
from Wikipedia. One example of these triples is: (English (programminglanguage), Influenced by, ?). We found out that the LD experts classifiedall these triples as incorrect. In contrast, the workers successfully answered that 50 outof this 52 were correct, since they could easily compare the DBpedia and Wikipediavalues in the HITs.
77
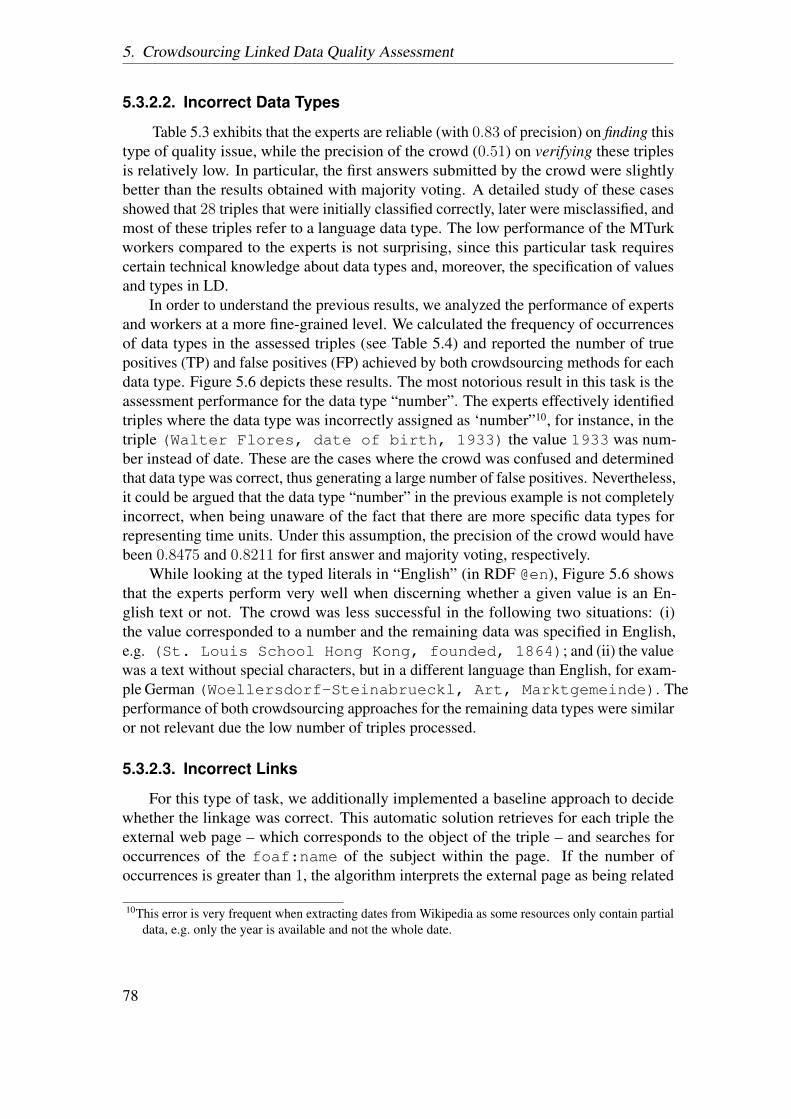
5. Crowdsourcing Linked Data Quality Assessment
5.3.2.2. Incorrect Data Types
Table 5.3 exhibits that the experts are reliable (with 0.83 of precision) on finding thistype of quality issue, while the precision of the crowd (0.51) on verifying these triplesis relatively low. In particular, the first answers submitted by the crowd were slightlybetter than the results obtained with majority voting. A detailed study of these casesshowed that 28 triples that were initially classified correctly, later were misclassified, andmost of these triples refer to a language data type. The low performance of the MTurkworkers compared to the experts is not surprising, since this particular task requirescertain technical knowledge about data types and, moreover, the specification of valuesand types in LD.
In order to understand the previous results, we analyzed the performance of expertsand workers at a more fine-grained level. We calculated the frequency of occurrencesof data types in the assessed triples (see Table 5.4) and reported the number of truepositives (TP) and false positives (FP) achieved by both crowdsourcing methods for eachdata type. Figure 5.6 depicts these results. The most notorious result in this task is theassessment performance for the data type “number”. The experts effectively identifiedtriples where the data type was incorrectly assigned as ‘number”10, for instance, in thetriple (Walter Flores, date of birth, 1933) the value 1933 was num-ber instead of date. These are the cases where the crowd was confused and determinedthat data type was correct, thus generating a large number of false positives. Nevertheless,it could be argued that the data type “number” in the previous example is not completelyincorrect, when being unaware of the fact that there are more specific data types forrepresenting time units. Under this assumption, the precision of the crowd would havebeen 0.8475 and 0.8211 for first answer and majority voting, respectively.
While looking at the typed literals in “English” (in RDF @en), Figure 5.6 showsthat the experts perform very well when discerning whether a given value is an En-glish text or not. The crowd was less successful in the following two situations: (i)the value corresponded to a number and the remaining data was specified in English,e.g. (St. Louis School Hong Kong, founded, 1864); and (ii) the valuewas a text without special characters, but in a different language than English, for exam-ple German (Woellersdorf-Steinabrueckl, Art, Marktgemeinde). Theperformance of both crowdsourcing approaches for the remaining data types were similaror not relevant due the low number of triples processed.
5.3.2.3. Incorrect Links
For this type of task, we additionally implemented a baseline approach to decidewhether the linkage was correct. This automatic solution retrieves for each triple theexternal web page – which corresponds to the object of the triple – and searches foroccurrences of the foaf:name of the subject within the page. If the number ofoccurrences is greater than 1, the algorithm interprets the external page as being related
10This error is very frequent when extracting dates from Wikipedia as some resources only contain partialdata, e.g. only the year is available and not the whole date.
78
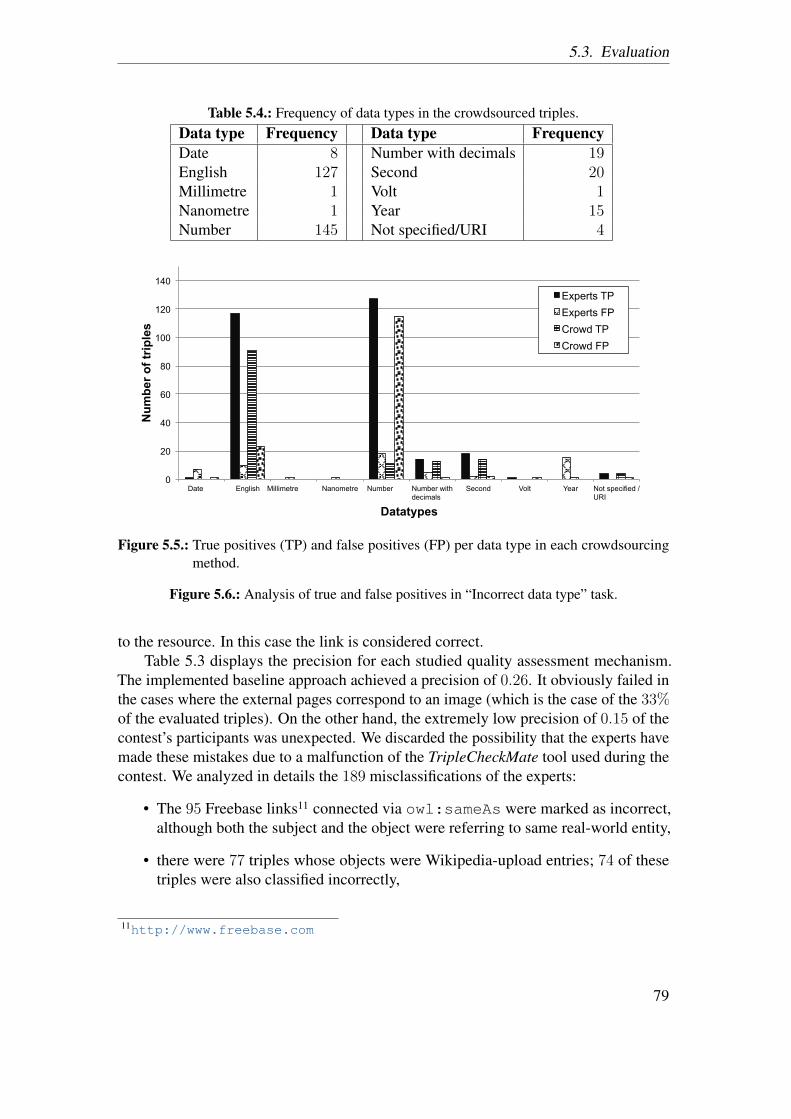
5.3. Evaluation
Table 5.4.: Frequency of data types in the crowdsourced triples.Data type Frequency Data type FrequencyDate 8 Number with decimals 19English 127 Second 20Millimetre 1 Volt 1Nanometre 1 Year 15Number 145 Not specified/URI 4
0
20
40
60
80
100
120
140
Date English Millimetre Nanometre Number Number with decimals
Second Volt Year Not specified / URI
Num
ber o
f trip
les
Datatypes
Experts TP Experts FP Crowd TP Crowd FP
Figure 5.5.: True positives (TP) and false positives (FP) per data type in each crowdsourcingmethod.
Figure 5.6.: Analysis of true and false positives in “Incorrect data type” task.
to the resource. In this case the link is considered correct.Table 5.3 displays the precision for each studied quality assessment mechanism.
The implemented baseline approach achieved a precision of 0.26. It obviously failed inthe cases where the external pages correspond to an image (which is the case of the 33%of the evaluated triples). On the other hand, the extremely low precision of 0.15 of thecontest’s participants was unexpected. We discarded the possibility that the experts havemade these mistakes due to a malfunction of the TripleCheckMate tool used during thecontest. We analyzed in details the 189 misclassifications of the experts:
• The 95 Freebase links11 connected via owl:sameAs were marked as incorrect,although both the subject and the object were referring to same real-world entity,
• there were 77 triples whose objects were Wikipedia-upload entries; 74 of thesetriples were also classified incorrectly,
11http://www.freebase.com
79
5. Crowdsourcing Linked Data Quality Assessment
• 20 links (blogs, web pages, etc.) referenced from the Wikipedia article of thesubject were also misclassified, regardless of the language of the content in theweb page.
The two settings of the MTurk workers outperformed the baseline approach. The‘first answer’ setting reports a precision of 0.62, while the ‘majority voting’ achieveda precision of 0.94. The 6% of the links that were not properly classified by the crowdcorrespond to those web pages whose content is in a different language than English or,despite they are referenced from the Wikipedia article of the subject, their association tothe subject is not straightforward. Examples of these cases are the following subjects andlinks: ‘Frank Stanford’ and http://nw-ar.com/drakefield/, ‘Forever Green’and http://www.stirrupcup.co.ukf. We hypothesize that the design of theuser interface of the HITs – displaying a preview of the web pages to analyze – helpedthe workers to easily identify those links containing related content to the triple subject.
5.4. Discussion
Referring back to the research questions formulated at the beginning of Section 5.3,our experiments let us understand the strengths and weaknesses of applying crowd-sourcing mechanisms for data quality assessment, following the Find-Fix-Verify pattern.For instance, we were able to detect common cases in which none of the two forms ofcrowdsourcing we studied seem to be feasible (RQ2.5). The most problematic task forthe LD experts was the one about discerning whether a web page is related to a resource.Although the experimental data does not provide insights into this behavior, we areinclined to believe that this is due to the relatively higher effort required by this specifictype of task, which involves checking an additional site outside the TripleCheckMatetool. In turn the MTurk workers did not perform so well on tasks about data types wherethey recurrently confused numerical data types with time units.
In each type of task, the LD experts and MTurk workers applied different skills andstrategies to solve the assignments successfully (RQ2.4). The data collected for eachtype of task suggests that the effort of LD experts must be applied on the Find stage ofthose tasks demanding specific-domain skills beyond common knowledge. On the otherhand, the MTurk crowd was exceptionally good and efficient at performing comparisonsbetween data entries, especially when some contextual information is provided. Thisresult suggests that microtask crowdsourcing can be effectively applied on the Verifystage of these tasks and possibly on the Find stage of the ‘incorrect links’ task.
Regarding the accuracy achieved in both cases, we compared the outcomes producedby each of the two crowds against a manually defined gold standard and against anautomatically computed baseline, clearly showing that both forms of crowdsourcingoffer feasible solutions to enhance the quality of Linked Data data sets (RQ2.3).
One of the goals of our work is to investigate how the contributions of the twocrowdsourcing approaches can be integrated into LD curation processes, by evaluatingthe performance of the two crowds in a cost-efficient way. In order to do this, both
80
5.5. Summary
crowds must evaluate a common set of triples. The straightforward solution would besubmitting to MTurk all the triples assessed by the LD experts, i.e. all the triples judgedas ‘incorrect’ and ‘correct’ in the contest. As explained in Section 5.3, the expertsbrowsed around 24,560 triples in total. Considering our microtask settings, the cost ofsubmitting all these triple to MTurk would add up to over US$ 1,000. By contrast, ourmethodology aims at reducing the number of triples submitted to the microtask platform,while asking the workers to assess only the problematic triples found by the experts. Bydoing this, the cost of the experiments was reduced to only US$ 43.
The design of our methodology allowed us to exploit the strengths of both crowds:the LD experts detected and classified data quality problems, while the workers confirmedor disconfirmed the output of the experts in ‘routine’ tasks. In addition, an appropriatequality assurance methodology requires a quality control iteration, in this case performedby the MTurk workers. As can be seen in our experimental results (Table 5.3), it wasnot always the case that the triples judged as incorrect by the LD experts were indeedincorrect. In fact, the number of misjudged triples by the experts was 145 (out of 509)for incorrect/missing values, 59 (out of 341) for incorrect data type and 189 (out of 223)for incorrect interlinking. Therefore, always agreeing with the experts would deterioratethe overall output of the quality assurance process. In addition, the workers did not knowthat the data provided to them was previously classified as problematic. In consequence,the turkers could not have applied an strategy to guess the right answers.
5.5. Summary
In this chapter, we presented a methodology that adjusts the crowdsourcing patternFind-Fix-Verify to exploit the strengths of experts and microtask workers. The Findstage was implemented using a contest-based format to engage with a community of LDexperts in discovering and classifying quality issues of DBpedia resources. We selecteda subset of the contributions obtained through the contest (referring to flawed objectvalues, incorrect data types and missing links) and asked the MTurk crowd to Verifythem. The evaluation showed that both types of approaches are successful but limited;in particular, the microtask experiments revealed that people with no expertise in LinkedData can be a useful resource to identify only very specific quality issues in an accurateand affordable manner, using the MTurk model. On the other hand, we showed that theassessment by LD experts was error-prone, costly and time consuming. We consider ourmethodology can be applied to RDF data sets, which are extracted from other sourcesand, hence, are likely to suffer from similar quality problems as DBpedia.
81
6. Semi-automated QualityAssessment of Linked Data
In this chapter, we describe the implementation of selected LD quality metrics thatwere identified as part of the survey we conducted (Chapter 3). This implementation wasdone by P. Westphal, C. Stadler, and J. Lehmann, who are colleagues from the AKSWgroup. This chapter is an excerpt from their technical report [Westphal et al., 2014],which implements several quality metrics – identified as part of the survey (as describedin Chapter 3) – and provides a tool, namely R2RLint, to perform semi-automated qualityassessment of LD. In particular, the technical details of the R2RLint1 tool is describedin this chapter, which builds upon the conceptual framework of the quality metrics toprovide users different means of assessing the quality of their linked dataset. Details of13 quality metrics belonging to seven quality dimensions (Section 6.1) are provided thatcan be used to assess the quality of Linked Data. The results of using this tool to assessthe quality of four datasets that are part of the use case are provided in Chapter 7.
6.1. Data Quality Metrics
Data quality assessment involves the measurement of quality dimensions or criteriathat are relevant to the consumer. A data quality assessment metric or measure is aprocedure for measuring a data quality dimension [Zaveri et al., 2015]. Thus, to assessthe quality of the four datasets, we selected a total of seven dimensions and 13 metrics,each of which we define in this section. For the actual metric definitions the followingsets are introduced:
• R containing all RDF resources
• B containing all blank nodes, with B ⊂R
• L containing all RDF literals, i.e. typed and plain literals
• N containing all RDF nodes, with N =R ∪ B ∪L
• T containing all triples, with T =R ×R ∖ B ×N
1https://github.com/AKSW/R2RLint
82
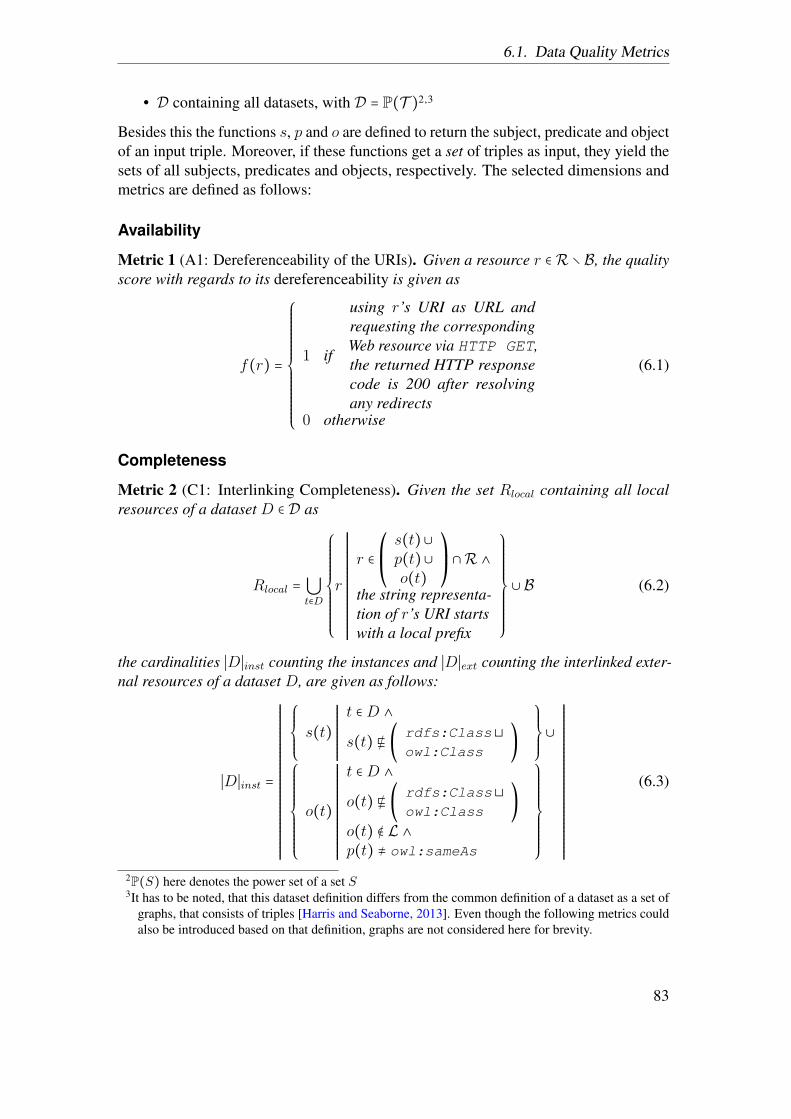
6.1. Data Quality Metrics
• D containing all datasets, with D = P(T )2,3
Besides this the functions s, p and o are defined to return the subject, predicate and objectof an input triple. Moreover, if these functions get a set of triples as input, they yield thesets of all subjects, predicates and objects, respectively. The selected dimensions andmetrics are defined as follows:
Availability
Metric 1 (A1: Dereferenceability of the URIs). Given a resource r ∈R ∖ B, the qualityscore with regards to its dereferenceability is given as
f(r) =
⎧⎪⎪⎪⎪⎪⎪⎪⎪⎪⎪⎪⎪⎨⎪⎪⎪⎪⎪⎪⎪⎪⎪⎪⎪⎪⎩
1 if
using r’s URI as URL andrequesting the correspondingWeb resource via HTTP GET,the returned HTTP responsecode is 200 after resolvingany redirects
0 otherwise
(6.1)
Completeness
Metric 2 (C1: Interlinking Completeness). Given the set Rlocal containing all localresources of a dataset D ∈ D as
Rlocal = ⋃t∈D
⎧⎪⎪⎪⎪⎪⎪⎪⎪⎪⎨⎪⎪⎪⎪⎪⎪⎪⎪⎪⎩
r
RRRRRRRRRRRRRRRRRRRRRRRRRRR
r ∈⎛⎜⎝
s(t)∪p(t)∪o(t)
⎞⎟⎠∩R ∧
the string representa-tion of r’s URI startswith a local prefix
⎫⎪⎪⎪⎪⎪⎪⎪⎪⎪⎬⎪⎪⎪⎪⎪⎪⎪⎪⎪⎭
∪ B (6.2)
the cardinalities ∣D∣inst counting the instances and ∣D∣ext counting the interlinked exter-nal resources of a dataset D, are given as follows:
∣D∣inst =
RRRRRRRRRRRRRRRRRRRRRRRRRRRRRRRRRRRRRRR
⎧⎪⎪⎪⎨⎪⎪⎪⎩s(t)RRRRRRRRRRRRRR
t ∈D ∧
s(t) ⋢ ( rdfs:Class⊔owl:Class
)
⎫⎪⎪⎪⎬⎪⎪⎪⎭∪
⎧⎪⎪⎪⎪⎪⎪⎪⎪⎨⎪⎪⎪⎪⎪⎪⎪⎪⎩
o(t)
RRRRRRRRRRRRRRRRRRRRRRRR
t ∈D ∧
o(t) ⋢ ( rdfs:Class⊔owl:Class
)
o(t) ∉ L ∧p(t) ≠ owl:sameAs
⎫⎪⎪⎪⎪⎪⎪⎪⎪⎬⎪⎪⎪⎪⎪⎪⎪⎪⎭
RRRRRRRRRRRRRRRRRRRRRRRRRRRRRRRRRRRRRRR
(6.3)
2P(S) here denotes the power set of a set S3It has to be noted, that this dataset definition differs from the common definition of a dataset as a set of
graphs, that consists of triples [Harris and Seaborne, 2013]. Even though the following metrics couldalso be introduced based on that definition, graphs are not considered here for brevity.
83
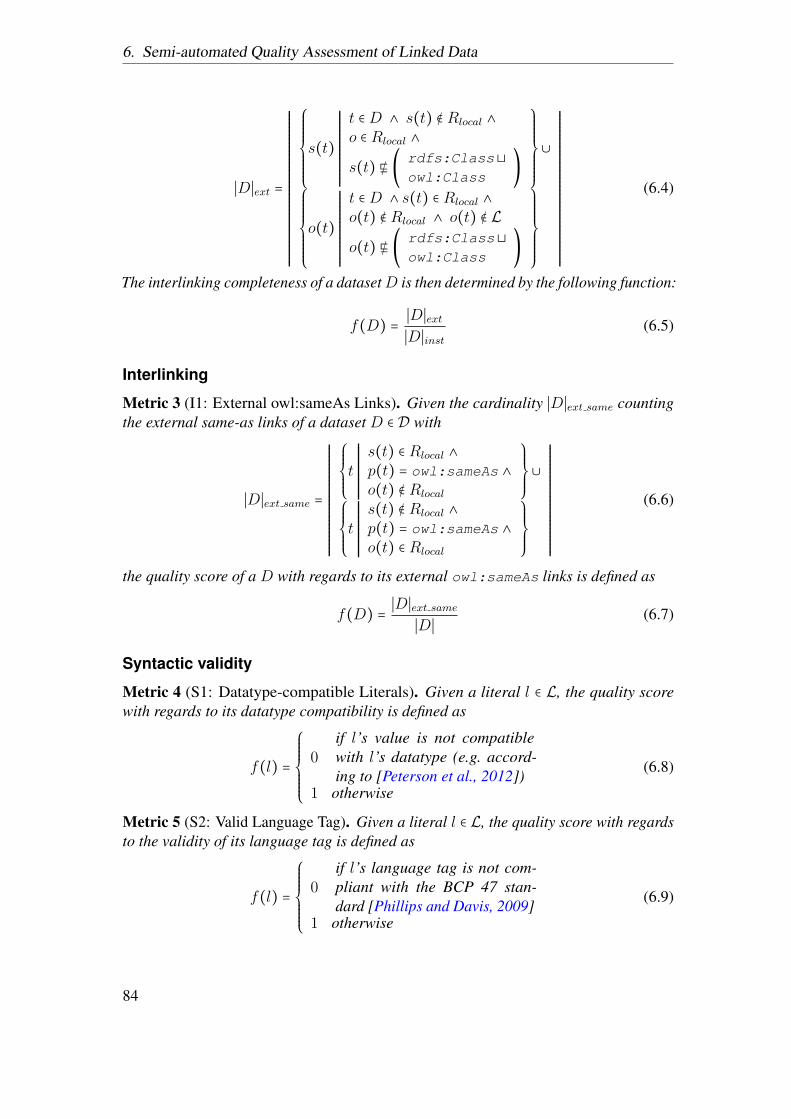
6. Semi-automated Quality Assessment of Linked Data
∣D∣ext =
RRRRRRRRRRRRRRRRRRRRRRRRRRRRRRRRRRRRRRR
⎧⎪⎪⎪⎪⎪⎪⎨⎪⎪⎪⎪⎪⎪⎩
s(t)
RRRRRRRRRRRRRRRRRRR
t ∈D ∧ s(t) ∉ Rlocal ∧o ∈ Rlocal ∧
s(t) ⋢ ( rdfs:Class⊔owl:Class
)
⎫⎪⎪⎪⎪⎪⎪⎬⎪⎪⎪⎪⎪⎪⎭
∪
⎧⎪⎪⎪⎪⎪⎪⎨⎪⎪⎪⎪⎪⎪⎩
o(t)
RRRRRRRRRRRRRRRRRRR
t ∈D ∧ s(t) ∈ Rlocal ∧o(t) ∉ Rlocal ∧ o(t) ∉ L
o(t) ⋢ ( rdfs:Class⊔owl:Class
)
⎫⎪⎪⎪⎪⎪⎪⎬⎪⎪⎪⎪⎪⎪⎭
RRRRRRRRRRRRRRRRRRRRRRRRRRRRRRRRRRRRRRR
(6.4)
The interlinking completeness of a datasetD is then determined by the following function:
f(D) = ∣D∣ext∣D∣inst(6.5)
Interlinking
Metric 3 (I1: External owl:sameAs Links). Given the cardinality ∣D∣ext same countingthe external same-as links of a dataset D ∈ D with
∣D∣ext same =
RRRRRRRRRRRRRRRRRRRRRRRRRRRR
⎧⎪⎪⎪⎨⎪⎪⎪⎩t
RRRRRRRRRRRRRR
s(t) ∈ Rlocal ∧p(t) = owl:sameAs ∧o(t) ∉ Rlocal
⎫⎪⎪⎪⎬⎪⎪⎪⎭∪
⎧⎪⎪⎪⎨⎪⎪⎪⎩t
RRRRRRRRRRRRRR
s(t) ∉ Rlocal ∧p(t) = owl:sameAs ∧o(t) ∈ Rlocal
⎫⎪⎪⎪⎬⎪⎪⎪⎭
RRRRRRRRRRRRRRRRRRRRRRRRRRRR
(6.6)
the quality score of a D with regards to its external owl:sameAs links is defined as
f(D) = ∣D∣ext same
∣D∣ (6.7)
Syntactic validity
Metric 4 (S1: Datatype-compatible Literals). Given a literal l ∈ L, the quality scorewith regards to its datatype compatibility is defined as
f(l) =
⎧⎪⎪⎪⎪⎪⎨⎪⎪⎪⎪⎪⎩
0if l’s value is not compatiblewith l’s datatype (e.g. accord-ing to [Peterson et al., 2012])
1 otherwise
(6.8)
Metric 5 (S2: Valid Language Tag). Given a literal l ∈ L, the quality score with regardsto the validity of its language tag is defined as
f(l) =
⎧⎪⎪⎪⎪⎪⎨⎪⎪⎪⎪⎪⎩
0if l’s language tag is not com-pliant with the BCP 47 stan-dard [Phillips and Davis, 2009]
1 otherwise
(6.9)
84
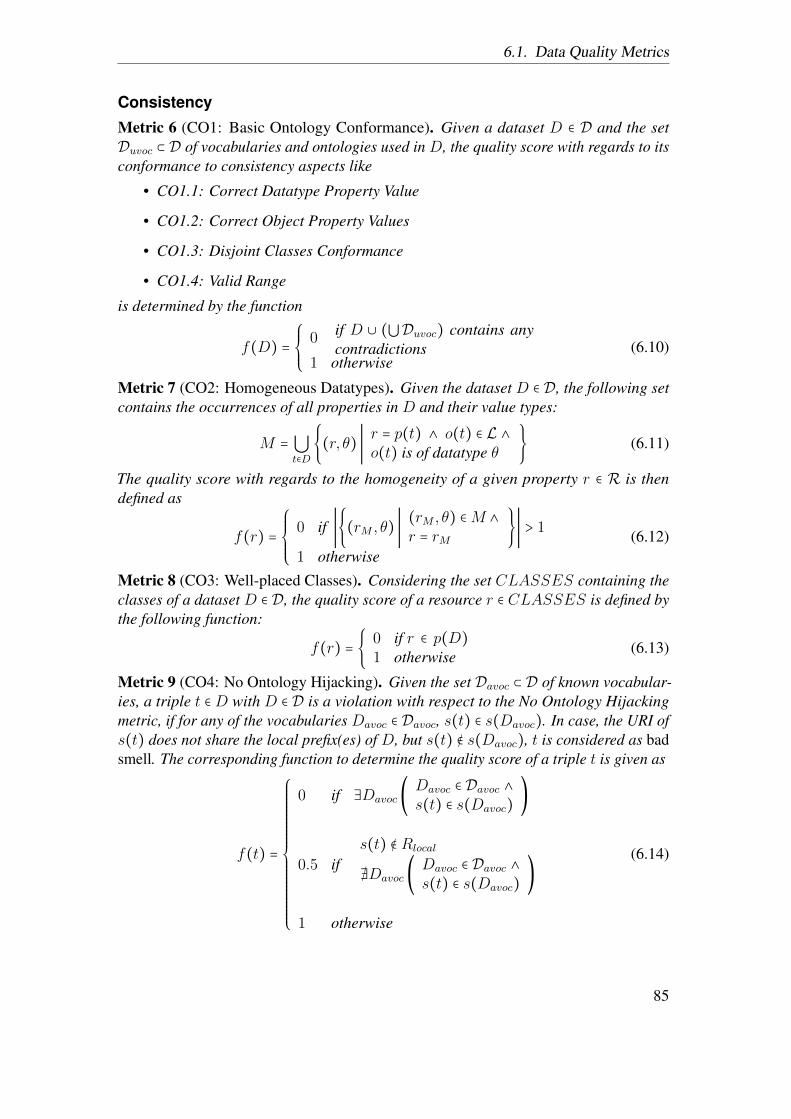
6.1. Data Quality Metrics
Consistency
Metric 6 (CO1: Basic Ontology Conformance). Given a dataset D ∈ D and the setDuvoc ⊂ D of vocabularies and ontologies used in D, the quality score with regards to itsconformance to consistency aspects like
• CO1.1: Correct Datatype Property Value
• CO1.2: Correct Object Property Values
• CO1.3: Disjoint Classes Conformance
• CO1.4: Valid Range
is determined by the function
f(D) =⎧⎪⎪⎨⎪⎪⎩
0 if D ∪ (⋃Duvoc) contains anycontradictions
1 otherwise(6.10)
Metric 7 (CO2: Homogeneous Datatypes). Given the dataset D ∈ D, the following setcontains the occurrences of all properties in D and their value types:
M = ⋃t∈D
{(r, θ) ∣ r = p(t) ∧ o(t) ∈ L ∧o(t) is of datatype θ } (6.11)
The quality score with regards to the homogeneity of a given property r ∈ R is thendefined as
f(r) =⎧⎪⎪⎪⎨⎪⎪⎪⎩
0 if ∣{(rM , θ) ∣(rM , θ) ∈M ∧r = rM
}∣ > 1
1 otherwise(6.12)
Metric 8 (CO3: Well-placed Classes). Considering the set CLASSES containing theclasses of a dataset D ∈ D, the quality score of a resource r ∈ CLASSES is defined bythe following function:
f(r) = { 0 if r ∈ p(D)1 otherwise (6.13)
Metric 9 (CO4: No Ontology Hijacking). Given the set Davoc ⊂ D of known vocabular-ies, a triple t ∈D with D ∈ D is a violation with respect to the No Ontology Hijackingmetric, if for any of the vocabularies Davoc ∈ Davoc, s(t) ∈ s(Davoc). In case, the URI ofs(t) does not share the local prefix(es) of D, but s(t) ∉ s(Davoc), t is considered as badsmell. The corresponding function to determine the quality score of a triple t is given as
f(t) =
⎧⎪⎪⎪⎪⎪⎪⎪⎪⎪⎪⎪⎪⎪⎪⎪⎨⎪⎪⎪⎪⎪⎪⎪⎪⎪⎪⎪⎪⎪⎪⎪⎩
0 if ∃Davoc (Davoc ∈ Davoc ∧s(t) ∈ s(Davoc)
)
0.5 ifs(t) ∉ Rlocal
∄Davoc (Davoc ∈ Davoc ∧s(t) ∈ s(Davoc)
)
1 otherwise
(6.14)
85
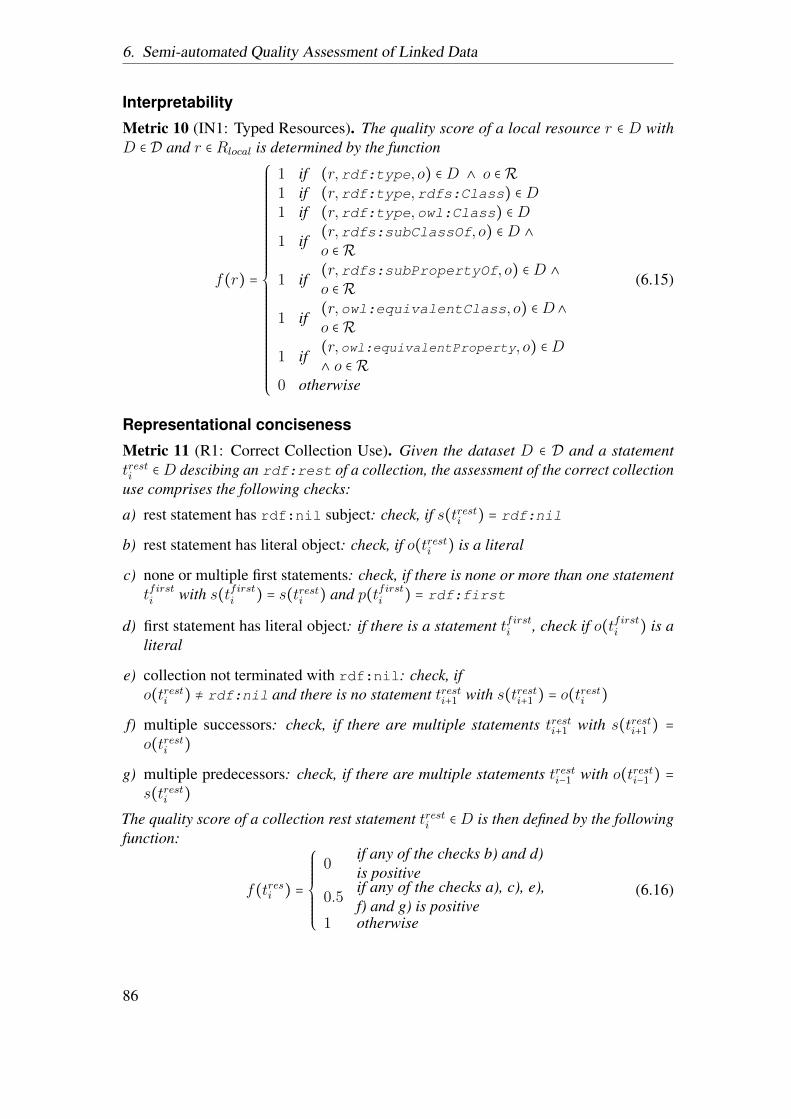
6. Semi-automated Quality Assessment of Linked Data
Interpretability
Metric 10 (IN1: Typed Resources). The quality score of a local resource r ∈ D withD ∈ D and r ∈ Rlocal is determined by the function
f(r) =
⎧⎪⎪⎪⎪⎪⎪⎪⎪⎪⎪⎪⎪⎪⎪⎪⎪⎪⎪⎪⎪⎪⎪⎪⎪⎪⎨⎪⎪⎪⎪⎪⎪⎪⎪⎪⎪⎪⎪⎪⎪⎪⎪⎪⎪⎪⎪⎪⎪⎪⎪⎪⎩
1 if (r,rdf:type, o) ∈D ∧ o ∈R1 if (r,rdf:type,rdfs:Class) ∈D1 if (r,rdf:type,owl:Class) ∈D
1 if(r,rdfs:subClassOf, o) ∈D ∧o ∈R
1 if(r,rdfs:subPropertyOf, o) ∈D ∧o ∈R
1 if(r,owl:equivalentClass, o) ∈D∧o ∈R
1 if(r,owl:equivalentProperty, o) ∈D∧ o ∈R
0 otherwise
(6.15)
Representational conciseness
Metric 11 (R1: Correct Collection Use). Given the dataset D ∈ D and a statementtresti ∈D descibing an rdf:rest of a collection, the assessment of the correct collectionuse comprises the following checks:
a) rest statement has rdf:nil subject: check, if s(tresti ) = rdf:nil
b) rest statement has literal object: check, if o(tresti ) is a literal
c) none or multiple first statements: check, if there is none or more than one statementtfirsti with s(tfirsti ) = s(tresti ) and p(tfirsti ) = rdf:first
d) first statement has literal object: if there is a statement tfirsti , check if o(tfirsti ) is aliteral
e) collection not terminated with rdf:nil: check, ifo(tresti ) ≠ rdf:nil and there is no statement tresti+1 with s(tresti+1 ) = o(tresti )
f) multiple successors: check, if there are multiple statements tresti+1 with s(tresti+1 ) =o(tresti )
g) multiple predecessors: check, if there are multiple statements tresti−1 with o(tresti−1 ) =s(tresti )
The quality score of a collection rest statement tresti ∈D is then defined by the followingfunction:
f(tresi ) =
⎧⎪⎪⎪⎪⎪⎪⎨⎪⎪⎪⎪⎪⎪⎩
0if any of the checks b) and d)is positive
0.5if any of the checks a), c), e),f) and g) is positive
1 otherwise
(6.16)
86
6.1. Data Quality Metrics
Metric 12 (R2: Correct Container Use). Given thedataset D ∈ D and a statement ti ∈ D having a container membership property onpredicate position, the assessment of the correct container use comprises the followingchecks:
a) container not typed: if p(ti) = rdf: 1, check if neither rdf:Bag, rdf:Seq, norrdf:Alt is assigned to s(ti) via rdf:type
b) literal objects: check, if o(ti) is a literal
c) multiple entries for one container membership property: check, if there is a statementti′ with s(ti′) = s(ti), p(ti′) = p(ti) and o(ti′) ≠ o(ti) (with p(ti′) ∈rdfs:ContainerMembershipProperty)
d) numbering gaps: check, if
• there is a statement ti+2 with s(ti+2) = s(ti) and the predicates of ti and ti+2are differing in two steps (with p(ti+2) being the bigger one),
• but no statement ti+1 with s(ti+1) = s(ti) and the predicates of ti and ti+1differing in one step (with p(ti+1) being the bigger one)
e) container starts at rdf: 0: check if there is a statement t0 with p(t0) = rdf: 0
f) container membership properties with leading zeros: check if there are statements tiwith p(ti) having leading zeros, e.g. rdf: 023
The quality score of a container statement ti ∈D is then defined by the following function:
f(ti) =
⎧⎪⎪⎪⎪⎪⎪⎨⎪⎪⎪⎪⎪⎪⎩
0if any of the checks b), e) andf) is positive
0.5if any of the checks a), c) andd) is positive
1 otherwise
(6.17)
Metric 13 (R3: Correct Reification Use). Given the dataset D ∈ D and a statementti ∈ D with either p(ti) ∈ {rdf:subject , rdf:predicate , rdf:object}, or tibeing typed as rdf:Statement, the assessment of the correct reification use comprisesthe following checks:
a) reification not typed properly: check, if s(ti) is not typed as rdf:Statement
b) none or multiple rdf:subject statements: check, if there is none or more than onestatement ts with s(ts) = s(ti) and p(ts) = rdf:subject
c) literal value of rdf:subject property: if ts exists, check if o(ts) is a literal
d) none or multiple rdf:predicate statements: check, if there is none or more thanone statement tp with s(tp) = s(ti) and p(tp) = rdf:predicate
87
6. Semi-automated Quality Assessment of Linked Data
e) literal or blank node value of rdf:predicate property: if tp exists, check if o(tp)is a literal or a blank node
f) none or multiple rdf:object statements: check, if there is none or more than onestatement to with s(to) = s(ti) and p(to) =rdf:object
6.2. Summary
In this chapter, we provided details of 13 quality metrics belonging to seven qualitydimensions that can be used to assess a Linked Data source. In particular, for eachdimension we provide different means of measuring it. These metrics are implementedas part of a tool, namely, R2RLint. This tool is employed to assess the quality of fourdatasets included in our use case and the results of this quality assessment are providedin Chapter 7.
88
7. Use Case Leveraging on DataQuality
7.1. Linked Data and Data Quality on the Web
With the recently LD paradigm [Heath and Bizer, 2011] emerging as a simplemechanism for employing the Web for data and knowledge integration, different com-munities are using Linked Data to provide and exchange information [Heath and Bizer,2011]. LD, in fact, allows us to build mashups which go beyond the interlinking of datafrom different sources to uncover meaningful and impactful relationships. However,in all these efforts, one crippling problem is the underlying data quality. Incomplete,inconsistent or inaccurate data may strongly affect the results, leading to unreliableconclusions.
The objective of this chapter is to show the advantage of utilizing Linked Data in aparticular use case i.e. to build the Health Economic Research (HER) Observatory, whichtakes into account the quality of the integrated datasets. In particular, the observatoryaims to assess the impact of Research and Development (R&D) on countries’ economicperformance and healthcare for which we use the Structural Equation Modeling (SEM)methodology. This chapter is based on [Zaveri et al., 2014b], where I have contributedin (i) converting and extracting data and the respective variables and (ii) analyzingand interpreting the results from the data quality assessment and the SEM. The maincontributions of this chapter are threefold:
• Show the usefulness of Linked Data to build the HER Observatory,
• Perform semi-automated quality assessment of the four datasets integrated intothe observatory by using the R2RLint tool (described in Chapter 6) and show theimportance of data quality,
• Apply Structural Equation Modeling on the datasets of the observatory to assessthe impact of R&D on economic performance and healthcare.
The chapter is structured as follows. In Section 7.2 we discuss previous effortsundertaken for analyzing societal progress indicators, which are the foundation of thisstudy, and formulate the main research question. In Section 7.3, we explain the SEMmethodology and provide details on the datasets, variables and data extraction performed.In Section 7.4,the results of the data quality and of the SEM assessment are reported.Section 7.5 concludes with directions to future work.
89
7. Use Case Leveraging on Data Quality
7.2. Background and Research Question
In this section, we first describe the previous works, which use LD for analyzingseveral societal progress indicators (Section 7.2.1). Thereafter, we discuss in detail thelimitations of these previous studies, proposing feasible solutions to overcome them(Section 7.2.2). We finally formulate the research questions we intend to answer in thischapter (Section 7.2.3).
7.2.1. Previous EffortsReDD-Observatory. The ReDD-Observatory is a project to evaluate the disparitybetween active areas of biomedical research and the global burden of disease using LDand data-driven discovery [Zaveri et al., 2011]. In particular, data from three datasets isused: (i) ClinicalTrials.gov, (ii) PubMed1 and (iii) Global Health Observatory (GHO)2
are obtained from their linked data sources (in case of ClinicalTrials.gov and PubMed),converted to linked data (in case of GHO) and interlinked to form an integrated dataset.This integrated dataset is then queried to answer questions in terms of how good orbad investments in terms of clinical trials or research have proved successful in curingillnesses. This is done by evaluating the disparity between the amount of research andburden of disease i.e. by querying the integrated datasets. The final aim of this effort isto provide policy makers with a set of well-informed reports. The idea is motivated bythe fact that policy makers, in particular in emerging regions, are unable to access suchinformation due to high costs of obtaining it. Therefore, they are unable to appropriatelyallocate resources, which in turn can negatively affect the quality of life of significantparts of the population.
Structural Equation Modeling. In a previous project [Zaveri et al., 2013d], theStructural Equation Modeling methodology was applied to publicly available LinkedData in an attempt to study the correlation between R&D activity and (i) economic, (ii)educational and (iii) healthcare performances in European countries. In particular, datafrom EuroStat and the World Bank (which were already available as LD) was extracted.Specific variables were selected from both datasets and following substantial analysis, amodel was identified that provided the best fit for our hypothesized model to reach thebest possible adequacy and theoretical reasoning. As a result, it was determined thatinvestments in R&D positively influences educational status, but curiously, does notdirectly influence economic performance. This project also supported the idea that LDcan facilitate these types of studies backed by robust statistical analysis.
Despite achieving meaningful results for these particular societal progress indicators,in both previous efforts, we encountered a number of limitations, which are discussed inthe following section.
1http://www.ncbi.nlm.nih.gov/pubmed2http://apps.who.int/gho/data/node.main
90
7.2. Background and Research Question
7.2.2. LimitationsThe main limitations that were encountered in the previous two studies are (i) data
quality problems such as unavailability, incompleteness, reliability, syntactic validity;(ii) inadequacy of the research indices to calculate specific societal progress indicators;(iii) insufficient coverage of the data to analyze results over several years, insufficientvariables and outdated data; all the three of them considerably affected the results. Wethus discuss each problem in detail along with the respective solution, to build a reliableand up-to-date observatory of societal progress.
L1: Data Quality. In both the previous efforts to analyzing the societal progressindicators, the results were severely affected due to several data quality problems.Problems such as unavailability and/or incompleteness of the data, which not onlyincludes data being unavailable to be queried but also not available for a particularcountry or year were major hindrances in acquiring reliable results. The unavailability ofdata may be due to the server being inaccessible at the time of querying. Incompletenessmay be due to the fact that certain developing countries do not have the standard means tocollect health-related information or they just do not have access to healthcare facilities.
Another data quality issue is the inadequate number of interlinks between thedatasets. The number of interlinks, which could be automatically discovered, werelimited as the datasets did not contain standardized identifiers for naming diseases,countries etc. For example, “AIDS” in LinkedCT3 could not automatically be matchedwith “Acquired Immunodeficiency Syndrome” in PubMed using basic string similarity.Although we attempted to address this limitation through the use of Unified MedicalLanguage System (UMLS)4 (in particular MeSH) for interlinking diseases, the linkswere still not complete. Moreover, there were a smaller number of diseases present inthe GHO dataset as compared to LinkedCT and PubMed (due to different levels of speci-ficity) indicating lower coverage or more general entries, thus further complicating theautomatic linking. In case of missing values, those particular countries with incompletedata had to be excluded in the SEM methodology.
Additionally, the syntactic validity, inconsistency of the dataset, problems in in-terpretability of the dataset as well as representational-conciseness were several otherproblems which hindered the achievement of reliable results. Moreover, trustworthinessof the datasets was an issue, which led to claims of the disparity as well as impact ofR&D on the economic and healthcare performances being debatable due to the ques-tionable reliability and provenance of the underlying datasets. Thus, in this chapter,we assess the quality of the four datasets used in the analysis and fix the problemsidentified before utilizing them in our usage scenario. In particular, we use the R2RLinttool Chapter 6 to perform the quality assessment. We choose this methodology over theother crowdsourcing quality assessments discussed earlier (Chapter 4 and Chapter 5)as those methodologies showed that the assessment was not only time-consuming andcostly but also error prone. In this semi-automatic assessment, the users are also involved
3http://linkedct.org4http://www.nlm.nih.gov/research/umls/
91
7. Use Case Leveraging on Data Quality
(as she can choose the metrics that apply to the use case) and is also provided withthe triples causing the errors so the results are interpretable. Moreover, the assessmentprocess is less error-prone and inexpensive to perform quality assessment over fourdatasets that are part of this use case.
L2: Methodology. The indices used in the ReDD-Observatory to calculate thedisparity suffered from lack of accuracy in evaluating the disparity between amount ofresearch performed on a particular disease and the burden of the disease. Moreover,it was difficult to interpret the results directly based on the output since the indicesused to measure the disparity did not directly represent the imbalance. That is, firstof all, the number of publications on a particular disease was not representative of thevalue of the information in the publications. Then, the direct comparison of the numberof publications with the burden of disease was not entirely reliable to calculate thedisparity. Therefore, we use the SEM methodology supported by Exploratory FactorAnalysis (EFA) to calculate the societal progress indicators. This output is thus muchmore reliable since it relies on statistical correlations between different variables andthus is easily interpretable.
L3: Coverage. Despite the exponential growth of data available on the Web, cov-erage is still a major issue. When integrating data and performing analysis on theintegrated dataset, the coverage of the base data is important. In our case, the GHO dataincluded reports for death and Disability Adjusted Life Years (DALY) measures only tillthe year 2004, thus limiting the overall coverage of our integrated substrate. Therefore,we now utilize the data from the WorldBank dataset, which reports the values for thetotal number of deaths per country per year for all diseases. Additionally, the LinkedCTdataset that we used in the ReDD-Observatory was from the 2010 RDF dump5. In thisnext iteration, we thus use the 2013 dump6. This dump contains up-to-date data aboutany new trials started as well as status of the current trials i.e. if they are completedalong with the results.
Moreover, we include several other indicators from different datasets such as UnitedStates Patent and Trademark Office (USPTO) patent data (as an indicator for innovation),country level publication statistics from the Scimago dataset (as an indicator of scientificperformance of countries) and WorldBank for several other indicators (discussed indetail in Section 7.3.2) to expand the coverage of the data analyzed. Additionally, in theprevious study, we only included European countries, whereas now we analyze data forall countries, thus expanding the coverage of the base data used for the analysis.
5http://www.cs.toronto.edu/˜oktie/linkedct/linkedct-dump-2010-02-10.tar.gz
6http://www.cs.toronto.edu/˜oktie/linkedct/linkedct-dump-2013-10-01.nt.bz2/
92
7.3. Methodology and Datasets
7.2.3. Research QuestionBesides healthcare, basic research and development (R&D) is a crucial important
driver for innovation, economic progress and social welfare [Adams, 1990, Hendersonet al., 1998]. Scientific production concerns especially basic research, but the results,which are generated are not only long-term ones but produce spillovers that have shortand medium term effects on industrial innovation [Mansfield, 1995]. This innovation-economic growth nexus has been a focal point of academic researchers and policy makersdue to the evidence of increase in economic growth in those countries that increasethe level of patenting activities [Hasan and Tucci, 2010]. For example, Europe as awhole has a high impact on the global biomedical literature, having contributed witha growing number of articles (210,433 publications in public health research [Larsenand von Ins, 2010]) and a significant citation impact [Lab, 2012]. The impact of Europeon broader healthcare and social welfare issues, however, is poorly understood. Inother words, we know little on whether the biomedical research currently producedin any country translates into better economic and healthcare conditions to the localpopulation. Although the credit goes to the university research for economic impact,there is no consensus on how to measure it [Bessette, 2003]. Measuring this impactposes a challenging endeavor, which involves the identification, gathering and analyzingof diverse data. Thus, the research question that we aim to address is:
• Can we link structured information to evaluate the impact of R&D on economicand healthcare performance in a country?
7.3. Methodology and Datasets
In this section, we first explain the methodology (Section 7.3.1) and then providedetails of the datasets and variables used along with the data extraction procedure(Section 7.3.2).
7.3.1. MethodologyIn order to address the problems identified regarding the methodology used in
previous studies (L2 Methodology − Section 7.2.2), we use the SEM methodology tocalculate the impact of R&D on health and economic performance of countries. Thus, inthis section we describe the various aspects related to SEM along with the steps applied.
7.3.1.1. Exploratory Data Analysis
Performing exploratory data analysis is essential to analyze the feasibility of the datato detect problematic variables, missing values, outliers and other descriptive informationabout the data to be included in the analysis. All the information from each of the 17variables (described in Section 7.3.2) about all the 196 countries was retrieved andanalyzed.
93
7. Use Case Leveraging on Data Quality
In particular, when there was a pattern of missing data (lacking the last three years,for instance) the country was excluded from the sample. Otherwise, if no pattern wasfound a multiple imputation method was applied to deal with the incompleteness [Schafer,2008]. Normality distribution was assessed through the Anderson-Darling normalitytest [Gross, 2012] to detect oscillations in the Gaussian distribution in order to ad-just the analytical methods to the appropriate distribution. We used the Mahalonobisdistance [Stats Package, 2013] to identify univariate and multivariate outliers and theMardia coefficient and multivariate kurtosis to identify multivariate normality [Korkmaz,2013]. Either univariate or multivariate analysis of the outliers or normality distributionis determinant to define which underlying methods (for e.g. extraction) will be appliedin the factor analytical process.
7.3.1.2. Theoretical Framework of the Model
The model was initially conceived in order to assess the predictor role of the latentvariable7 Research and Development (R&D) on countries’ economy and healthcare.Specifically, we hypothesized that R&D would have a direct effect over the Economy(GDP) and General Health indicators (birth rate, death rate, death rate, and immu-nization efforts). The relation between these variables has been separately reported ina number of studies [Bessette, 2003, Daraio et al., 2011, Hanushek and Woessmann,2010, Kilpelainen et al., 2012]. Therefore, we gathered a core set of variables (as de-scribed in Section 7.3.2) related to each of these factors, which represented the situationaffecting all countries. However, for our initial model we only kept the data displayed atthe country level, excluding other (although interesting) information at regional level.
7.3.1.3. Structural Equation Modeling
Structural Equation Modeling [Hox, 1998, Kline, 2011] is a method that has beenused in health sciences [Hays et al., 2005], economic research [Hair et al., 2012] tomodel causal relations among latent and observed variables. This method evaluates therelation between latent variables. For example, in this study we argue that the generalconcept of economic performance is only possible to explain through a latent variablespecified by other observed variables such as Gross Domestic Product (GDP) etc. Hence,we used SEM to test the outlined hypothesis of a conceptual model based on the effectof R&D on the economic and healthcare situation of countries all over the world.
Our SEM was tested by the jigsaw method [Bollen, 2000]. This procedure expectsthe adequacy of the measurement variables (latent variables that will enter the model)into isolated confirmatory factor analysis models. By doing this measurement beforethe structural equations, we are able to define the model’s identification with the latentvariables before testing. Therefore a two step strategy is defined to design a SEM [Kline,2011]:
7Latent variables are those that cannot be measured directly, but is an underlying concept involving otherobserved variables (variables measured directly).
94
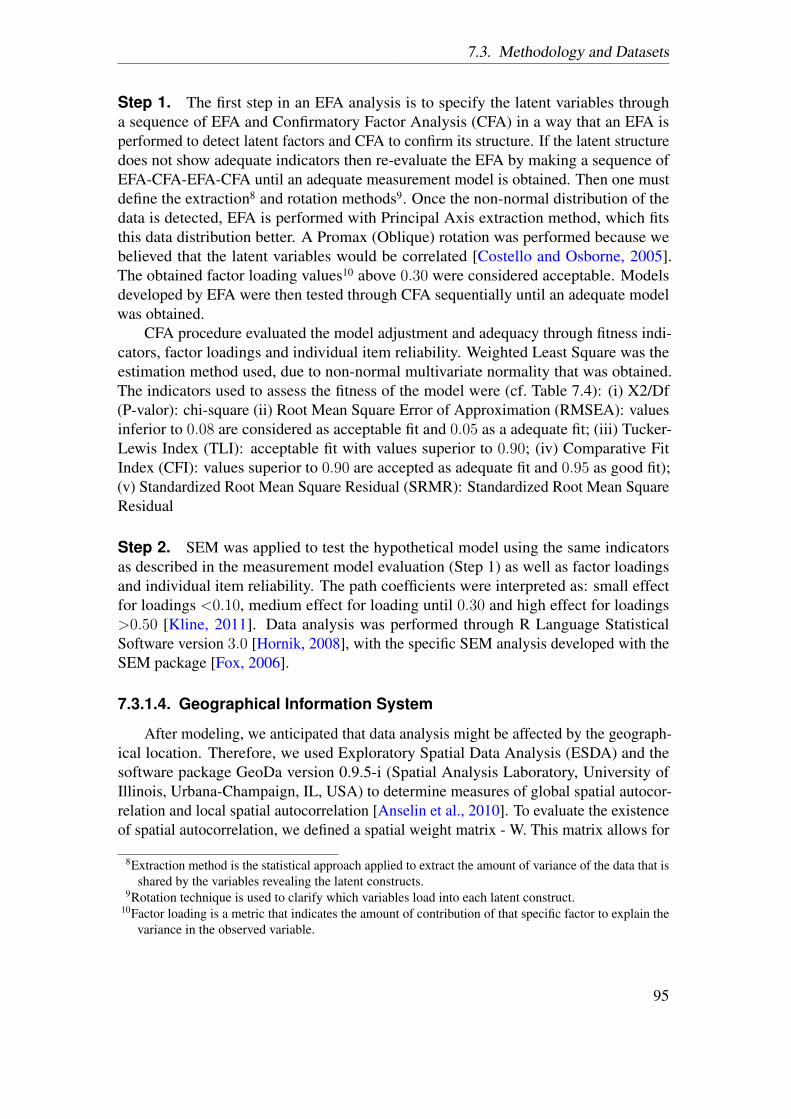
7.3. Methodology and Datasets
Step 1. The first step in an EFA analysis is to specify the latent variables througha sequence of EFA and Confirmatory Factor Analysis (CFA) in a way that an EFA isperformed to detect latent factors and CFA to confirm its structure. If the latent structuredoes not show adequate indicators then re-evaluate the EFA by making a sequence ofEFA-CFA-EFA-CFA until an adequate measurement model is obtained. Then one mustdefine the extraction8 and rotation methods9. Once the non-normal distribution of thedata is detected, EFA is performed with Principal Axis extraction method, which fitsthis data distribution better. A Promax (Oblique) rotation was performed because webelieved that the latent variables would be correlated [Costello and Osborne, 2005].The obtained factor loading values10 above 0.30 were considered acceptable. Modelsdeveloped by EFA were then tested through CFA sequentially until an adequate modelwas obtained.
CFA procedure evaluated the model adjustment and adequacy through fitness indi-cators, factor loadings and individual item reliability. Weighted Least Square was theestimation method used, due to non-normal multivariate normality that was obtained.The indicators used to assess the fitness of the model were (cf. Table 7.4): (i) X2/Df(P-valor): chi-square (ii) Root Mean Square Error of Approximation (RMSEA): valuesinferior to 0.08 are considered as acceptable fit and 0.05 as a adequate fit; (iii) Tucker-Lewis Index (TLI): acceptable fit with values superior to 0.90; (iv) Comparative FitIndex (CFI): values superior to 0.90 are accepted as adequate fit and 0.95 as good fit);(v) Standardized Root Mean Square Residual (SRMR): Standardized Root Mean SquareResidual
Step 2. SEM was applied to test the hypothetical model using the same indicatorsas described in the measurement model evaluation (Step 1) as well as factor loadingsand individual item reliability. The path coefficients were interpreted as: small effectfor loadings <0.10, medium effect for loading until 0.30 and high effect for loadings>0.50 [Kline, 2011]. Data analysis was performed through R Language StatisticalSoftware version 3.0 [Hornik, 2008], with the specific SEM analysis developed with theSEM package [Fox, 2006].
7.3.1.4. Geographical Information System
After modeling, we anticipated that data analysis might be affected by the geograph-ical location. Therefore, we used Exploratory Spatial Data Analysis (ESDA) and thesoftware package GeoDa version 0.9.5-i (Spatial Analysis Laboratory, University ofIllinois, Urbana-Champaign, IL, USA) to determine measures of global spatial autocor-relation and local spatial autocorrelation [Anselin et al., 2010]. To evaluate the existenceof spatial autocorrelation, we defined a spatial weight matrix - W. This matrix allows for
8Extraction method is the statistical approach applied to extract the amount of variance of the data that isshared by the variables revealing the latent constructs.
9Rotation technique is used to clarify which variables load into each latent construct.10Factor loading is a metric that indicates the amount of contribution of that specific factor to explain the
variance in the observed variable.
95
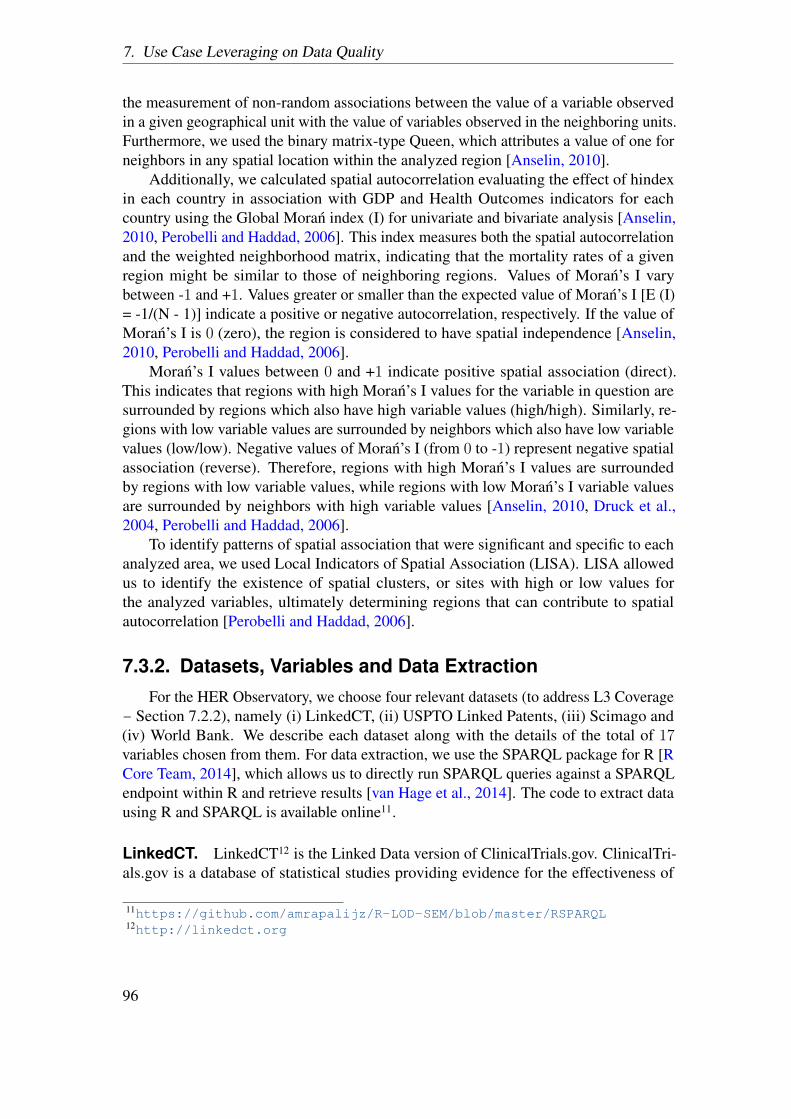
7. Use Case Leveraging on Data Quality
the measurement of non-random associations between the value of a variable observedin a given geographical unit with the value of variables observed in the neighboring units.Furthermore, we used the binary matrix-type Queen, which attributes a value of one forneighbors in any spatial location within the analyzed region [Anselin, 2010].
Additionally, we calculated spatial autocorrelation evaluating the effect of hindexin each country in association with GDP and Health Outcomes indicators for eachcountry using the Global Moran index (I) for univariate and bivariate analysis [Anselin,2010, Perobelli and Haddad, 2006]. This index measures both the spatial autocorrelationand the weighted neighborhood matrix, indicating that the mortality rates of a givenregion might be similar to those of neighboring regions. Values of Moran’s I varybetween -1 and +1. Values greater or smaller than the expected value of Moran’s I [E (I)= -1/(N - 1)] indicate a positive or negative autocorrelation, respectively. If the value ofMoran’s I is 0 (zero), the region is considered to have spatial independence [Anselin,2010, Perobelli and Haddad, 2006].
Moran’s I values between 0 and +1 indicate positive spatial association (direct).This indicates that regions with high Moran’s I values for the variable in question aresurrounded by regions which also have high variable values (high/high). Similarly, re-gions with low variable values are surrounded by neighbors which also have low variablevalues (low/low). Negative values of Moran’s I (from 0 to -1) represent negative spatialassociation (reverse). Therefore, regions with high Moran’s I values are surroundedby regions with low variable values, while regions with low Moran’s I variable valuesare surrounded by neighbors with high variable values [Anselin, 2010, Druck et al.,2004, Perobelli and Haddad, 2006].
To identify patterns of spatial association that were significant and specific to eachanalyzed area, we used Local Indicators of Spatial Association (LISA). LISA allowedus to identify the existence of spatial clusters, or sites with high or low values forthe analyzed variables, ultimately determining regions that can contribute to spatialautocorrelation [Perobelli and Haddad, 2006].
7.3.2. Datasets, Variables and Data ExtractionFor the HER Observatory, we choose four relevant datasets (to address L3 Coverage
− Section 7.2.2), namely (i) LinkedCT, (ii) USPTO Linked Patents, (iii) Scimago and(iv) World Bank. We describe each dataset along with the details of the total of 17variables chosen from them. For data extraction, we use the SPARQL package for R [RCore Team, 2014], which allows us to directly run SPARQL queries against a SPARQLendpoint within R and retrieve results [van Hage et al., 2014]. The code to extract datausing R and SPARQL is available online11.
LinkedCT. LinkedCT12 is the Linked Data version of ClinicalTrials.gov. ClinicalTri-als.gov is a database of statistical studies providing evidence for the effectiveness of
11https://github.com/amrapalijz/R-LOD-SEM/blob/master/RSPARQL12http://linkedct.org
96
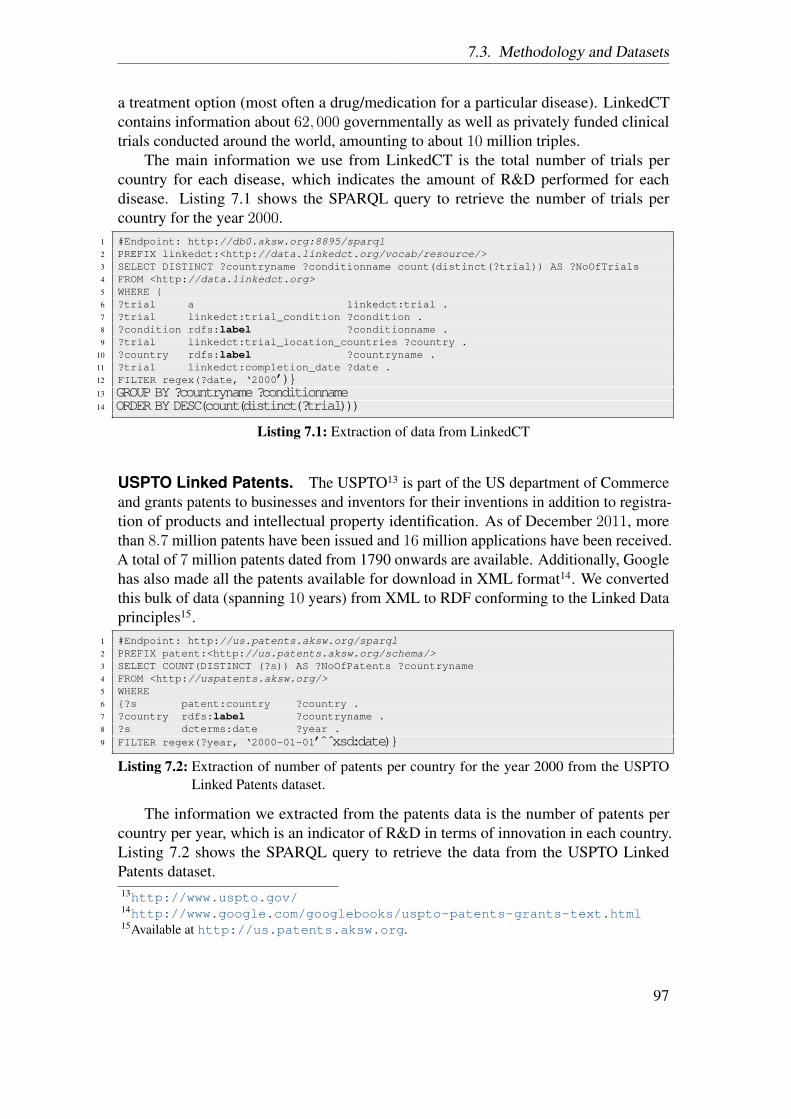
7.3. Methodology and Datasets
a treatment option (most often a drug/medication for a particular disease). LinkedCTcontains information about 62,000 governmentally as well as privately funded clinicaltrials conducted around the world, amounting to about 10 million triples.
The main information we use from LinkedCT is the total number of trials percountry for each disease, which indicates the amount of R&D performed for eachdisease. Listing 7.1 shows the SPARQL query to retrieve the number of trials percountry for the year 2000.
1 #Endpoint: http://db0.aksw.org:8895/sparql2 PREFIX linkedct:<http://data.linkedct.org/vocab/resource/>3 SELECT DISTINCT ?countryname ?conditionname count(distinct(?trial)) AS ?NoOfTrials4 FROM <http://data.linkedct.org>5 WHERE {6 ?trial a linkedct:trial .7 ?trial linkedct:trial_condition ?condition .8 ?condition rdfs:label ?conditionname .9 ?trial linkedct:trial_location_countries ?country .
10 ?country rdfs:label ?countryname .11 ?trial linkedct:completion_date ?date .12 FILTER regex(?date, ‘2000’)}13 GROUP BY ?countryname ?conditionname14 ORDER BY DESC(count(distinct(?trial)))
Listing 7.1: Extraction of data from LinkedCT
USPTO Linked Patents. The USPTO13 is part of the US department of Commerceand grants patents to businesses and inventors for their inventions in addition to registra-tion of products and intellectual property identification. As of December 2011, morethan 8.7 million patents have been issued and 16 million applications have been received.A total of 7 million patents dated from 1790 onwards are available. Additionally, Googlehas also made all the patents available for download in XML format14. We convertedthis bulk of data (spanning 10 years) from XML to RDF conforming to the Linked Dataprinciples15.
1 #Endpoint: http://us.patents.aksw.org/sparql2 PREFIX patent:<http://us.patents.aksw.org/schema/>3 SELECT COUNT(DISTINCT (?s)) AS ?NoOfPatents ?countryname4 FROM <http://uspatents.aksw.org/>5 WHERE6 {?s patent:country ?country .7 ?country rdfs:label ?countryname .8 ?s dcterms:date ?year .9 FILTER regex(?year, ‘2000-01-01’ xsd:date)}
Listing 7.2: Extraction of number of patents per country for the year 2000 from the USPTOLinked Patents dataset.
The information we extracted from the patents data is the number of patents percountry per year, which is an indicator of R&D in terms of innovation in each country.Listing 7.2 shows the SPARQL query to retrieve the data from the USPTO LinkedPatents dataset.13http://www.uspto.gov/14http://www.google.com/googlebooks/uspto-patents-grants-text.html15Available at http://us.patents.aksw.org.
97
7. Use Case Leveraging on Data Quality
Scimago. The SCImago Journal & Country Rank16 is a portal that reports on thejournals and country scientific indicators calculated from the information obtained fromthe Scopus database. In particular, the Global SCImago Institutions Rankings (SIR)report takes into account those organizations from any country, which has at least 100documents published each year.
1 #Endpoint: http://db0.aksw.org:8895/sparql2 PREFIX scimago:<http://scimago.org/>3 SELECT DISTINCT ?countryname ?year ?noOfDocs ?hindex4 FROM <http://scimago.org>5 WHERE {6 ?s rdf:type scimago:journalRanking .7 ?s scimago:country ?country .8 ?country rdfs:label ?countryname .9 ?s scimago:year ?year .
10 ?s scimago:docs ?noOfDocs .11 ?s scimago:hIndex ?hindex .12 FILTER (?year=<http://reference.data.gov.uk/id/year/2000>) }
Listing 7.3: Extraction of the number of documents and hindex per country for the year 2000from the Scimago dataset.
The variables we utilize from this dataset are:
• Total number of published documents per country per year (noD)
• hindex - country’s number of articles (h) that have received at least h citations(hindex)
Since this dataset was not already available as Linked Data, we converted the selectedinformation from CSV to RDF using LODRefine17. Listing 7.3 shows the SPARQLquery to retrieve the number of documents and hindex per country per year from theScimago dataset.
WorldBank. The World Bank18 is an international financial institution that collectsand processes large amounts of data on the basis of economic models and makesthem openly available19. The available data covers a wide variety of topics such asAgriculture and Rural Development, Education, Health, Public and Private Sector,Science and Technology etc. The World Bank data has been converted and published asLD and is available at http://worldbank.270a.info. In particular, the WorldDevelopment Indicators, which present the most current and accurate global developmentdata accessible, are available as RDF20. The variables we choose are:
• Adolescent Fertility Rate (AFR), which reports the number of births per 1,000women aged 15−19 (code: SP.ADO.TFRT).
16http://www.scimagojr.com/countryrank.php17http://code.zemanta.com/sparkica/18http://www.worldbank.org/19http://data.worldbank.org/20http://worldbank.270a.info/classification/indicator.html
98
7.3. Methodology and Datasets
• Birth Rate (BR), which indicates the crude birth rate i.e. the number of live birthsoccurring during the year per 1,000 population. This indicator is estimated at themiddle of the year (code: SP.DYN.CBRT.IN)21
• Death Rate (DR), which is the number of crude deaths occurring during the yearper 1,000 population also estimated at the middle of the year (code: SP.DYN.CDRT.IN).
• GDP, which is the sum of gross value added by all resident producers in theeconomy plus any product taxes and minus any subsidies not included in the valueof the product. Data is CD).
• Health Expenditure Public (HEP) (% of total expenditure) reports the recurrentand capital spending from government (both central as well as local) budgets,external borrowings and grants and social (or compulsory) health insurance funds.The total health expenditure is the sum of public and private health expenditure,which covers the provision of health services as mentioned in the indicator “Healthexpenditure per capita” (code: SH.XPD.PUBL).
• High-technology Export (HET) (% of manufactured exports) are the products withhigh R&D intensity, such as in aerospace, computers, pharmaceuticals, scientificinstruments, and electrical machinery (code:TX.VAL.TECH.MF.ZS).
• Immunization DPT (IDPT) (% of children ages 12−23 months) measures thepercentage of children between the ages of 12−23 months who have received vac-cinations before 12 months or at any time before the survey. After receiving threedoses of vaccine, a child is considered adequately immunized against diphtheria,pertussis (or whooping cough), and tetanus (DPT) (code: SH.IMM.IDPT).
• Immunization Measles (IM) (% of children ages 12 - 24 months) measures thepercentage of children between the ages of 12−23 months who have receivedvaccinations before 12 months or at any time before the survey. After receivingone dose of vaccine, a child is considered adequately immunized against measles(code: SH.IMM.MEAS).
• Incidence of Tuberculosis (ITB) (per 100,000 people) is the estimated number ofnew pulmonary, smear positive and extra-pulmonary tuberculosis cases, whichalso includes patients with HIV (code: SH.TBS.INCD).
• Mortality Rate (MR), infant (per 1,000 live births) is the number of infants dyingbefore reaching one year of age, per 1,000 live births in a given year (code:SP.DYN.IMRT.IN).
21The code is to be used when querying for the particular variables by replacing the value for the“indicator” property in the SPARQL query Listing 7.4.
99
7. Use Case Leveraging on Data Quality
• Public Spending on Education (PSE), total (% of govt expenditure) reports thetotal public education expenditure (current and capital) expressed as a percentageof total government expenditure for all sectors in a given financial year. Thispublic expenditure on education includes the government spending on educationalinstitutions, both public and private, education administration and subsidies forprivate entities such as students or households etc (code:SE.XPD.TOTL.GB.ZS).
• Research and Development Expenditure (RGDP) (% of GDP) reports the expendi-tures for research and development, which are the current and capital expendituresi.e. both public and private on creative work undertaken systematically to increaseknowledge. This work includes knowledge of humanity, culture, society as wellas the use of knowledge for new applications. R&D covers basic, applied andexperimental research and development (code: GB.XPD.RSDV.GD.ZS).
• Researchers in R&D (RRP) (per million) reports the number of professionals en-gaged in the conception or creation of new knowledge, products, processes, meth-ods, or systems and in the management of the projects (code: SP.POP.SCIE.RD.P6).
Listing 7.4 shows the SPARQL query to retrieve the variables from the World Bankdataset.
1 #Endpoint: http://worldbank.270a.info/sparql2 SELECT ?label ?obsValue ?year3 WHERE { ?observationURI4 property:indicator indicator:SP.ADO.TFRT;5 sdmx-dimension:refArea ?refAreaURI;6 sdmx-dimension:refPeriod ?year;7 sdmx-measure:obsValue ?obsValue .8 ?refAreaURI a dbo:Country .9 ?refAreaURI skos:prefLabel ?label .
10 FILTER (?year=<http://reference.data.gov.uk/id/year/2000>)}
Listing 7.4: Extraction of the Adolescent Fertility Rate variable from the World Bank dataset forthe year 2000.
7.4. Results
In this section, we report the results of the data quality assessment performed on thefour datasets (Section 7.4.1) and also results of applying the SEM methodology to thefour datasets (Section 7.4.2).
7.4.1. Data Quality AssessmentThe data quality assessment of the four datasets was performed using the R2RLint
tool (described in Chapter 6) with the 13 metrics (described in Section 6.1). The resultsare available online22 containing quality scores for the introduced metrics and referencesto the actual data that caused quality problems, thus enabling the user to locate and22http://pwestphal.aksw.org/dq/
100
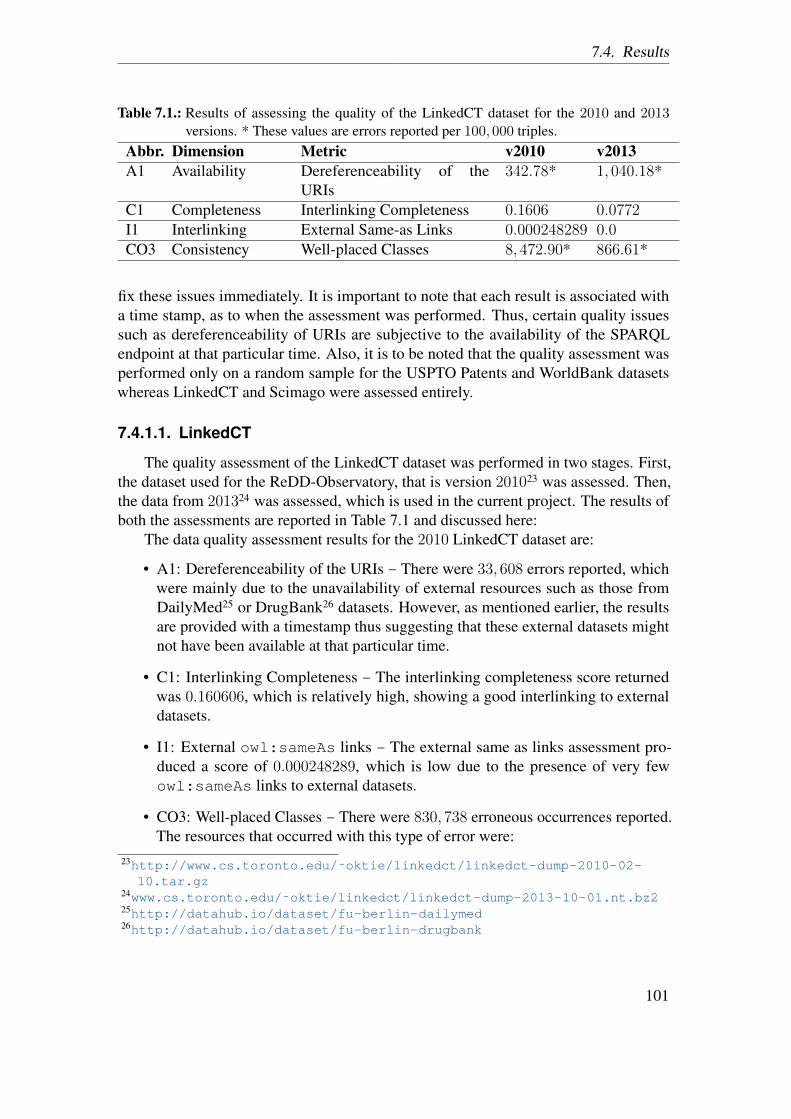
7.4. Results
Table 7.1.: Results of assessing the quality of the LinkedCT dataset for the 2010 and 2013versions. * These values are errors reported per 100,000 triples.
Abbr. Dimension Metric v2010 v2013A1 Availability Dereferenceability of the
URIs342.78* 1,040.18*
C1 Completeness Interlinking Completeness 0.1606 0.0772I1 Interlinking External Same-as Links 0.000248289 0.0CO3 Consistency Well-placed Classes 8,472.90* 866.61*
fix these issues immediately. It is important to note that each result is associated witha time stamp, as to when the assessment was performed. Thus, certain quality issuessuch as dereferenceability of URIs are subjective to the availability of the SPARQLendpoint at that particular time. Also, it is to be noted that the quality assessment wasperformed only on a random sample for the USPTO Patents and WorldBank datasetswhereas LinkedCT and Scimago were assessed entirely.
7.4.1.1. LinkedCT
The quality assessment of the LinkedCT dataset was performed in two stages. First,the dataset used for the ReDD-Observatory, that is version 201023 was assessed. Then,the data from 201324 was assessed, which is used in the current project. The results ofboth the assessments are reported in Table 7.1 and discussed here:
The data quality assessment results for the 2010 LinkedCT dataset are:
• A1: Dereferenceability of the URIs − There were 33,608 errors reported, whichwere mainly due to the unavailability of external resources such as those fromDailyMed25 or DrugBank26 datasets. However, as mentioned earlier, the resultsare provided with a timestamp thus suggesting that these external datasets mightnot have been available at that particular time.
• C1: Interlinking Completeness − The interlinking completeness score returnedwas 0.160606, which is relatively high, showing a good interlinking to externaldatasets.
• I1: External owl:sameAs links − The external same as links assessment pro-duced a score of 0.000248289, which is low due to the presence of very fewowl:sameAs links to external datasets.
• CO3: Well-placed Classes − There were 830,738 erroneous occurrences reported.The resources that occurred with this type of error were:
23http://www.cs.toronto.edu/˜oktie/linkedct/linkedct-dump-2010-02-10.tar.gz
24www.cs.toronto.edu/˜oktie/linkedct/linkedct-dump-2013-10-01.nt.bz225http://datahub.io/dataset/fu-berlin-dailymed26http://datahub.io/dataset/fu-berlin-drugbank
101
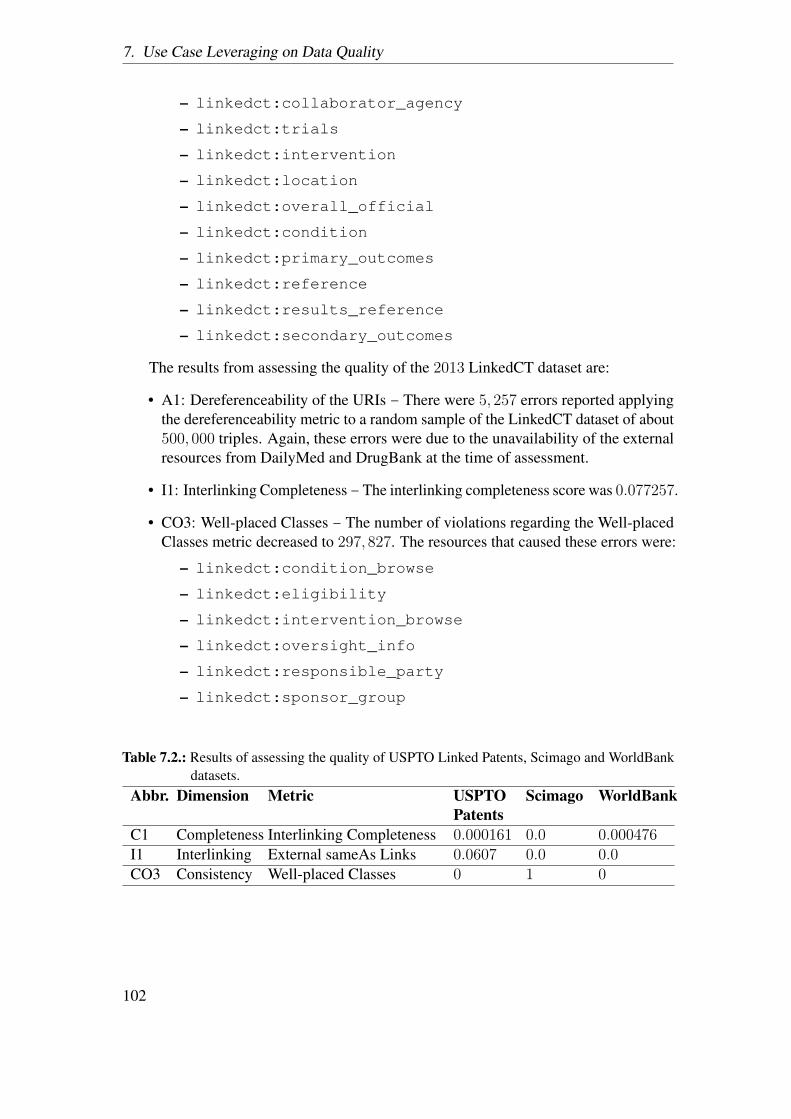
7. Use Case Leveraging on Data Quality
– linkedct:collaborator_agency
– linkedct:trials
– linkedct:intervention
– linkedct:location
– linkedct:overall_official
– linkedct:condition
– linkedct:primary_outcomes
– linkedct:reference
– linkedct:results_reference
– linkedct:secondary_outcomes
The results from assessing the quality of the 2013 LinkedCT dataset are:
• A1: Dereferenceability of the URIs − There were 5,257 errors reported applyingthe dereferenceability metric to a random sample of the LinkedCT dataset of about500,000 triples. Again, these errors were due to the unavailability of the externalresources from DailyMed and DrugBank at the time of assessment.
• I1: Interlinking Completeness − The interlinking completeness score was 0.077257.
• CO3: Well-placed Classes − The number of violations regarding the Well-placedClasses metric decreased to 297,827. The resources that caused these errors were:
– linkedct:condition_browse
– linkedct:eligibility
– linkedct:intervention_browse
– linkedct:oversight_info
– linkedct:responsible_party
– linkedct:sponsor_group
Table 7.2.: Results of assessing the quality of USPTO Linked Patents, Scimago and WorldBankdatasets.
Abbr. Dimension Metric USPTOPatents
Scimago WorldBank
C1 Completeness Interlinking Completeness 0.000161 0.0 0.000476I1 Interlinking External sameAs Links 0.0607 0.0 0.0CO3 Consistency Well-placed Classes 0 1 0
102
7.4. Results
7.4.1.2. USPTO Linked Patents
Results of assessing the USPTO Linked Patents dataset are:
• C1: Interlinking completeness score returned was 0.000161, which suggests thatthe dataset is interlinked with only a low number of external datasets.
• I1: External owl:sameAs links returned a score of 0.0607. Even though itsactual value is low, the score is considered to be medium (with regards to the defi-nition of the corresponding metric) thus indicating the presence of a considerablenumber of same as interlinks to external datasets.
7.4.1.3. Scimago
As a result of assessing the quality of the Scimago dataset, the only error that wasreturned was of defining the resource <http://scimago.org/country> as aclass (CO3). This was fixed before using this dataset in calculating the Observatoryresults.
7.4.1.4. WorldBank
The result of assessing the WorldBank dataset is:
• C1: Interlinking Completeness − The score returned was 0.0005, which is rel-atively low and suggests that the dataset is not well interlinked with externaldatasets.
The results of assessing the quality of the USPTO Linked Patents, Scimago andWorldBank datasets are reported in Table 7.2. After analyzing the table, it can beseen that the major issues lie in the interlinking completeness of the datasets whereasthere were no significant issues reported for the other quality metrics. In particular,the interlinking completeness for World Bank was higher than the USPTO Patentsdataset, even though the interlinking completeness score was low. However, there werea significantly large number of owl:sameAs links.
7.4.2. HER ObservatoryIn this section, we first describe the results of constructing the parts of the model,
in particular, determining the latent and observed variables. Then, we describe theprocess of choosing the best fit for the model to reach the best possible adequacy andtheoretical reasoning. The R script for this process is available at https://github.com/amrapalijz/R-LOD-SEM/blob/master/sem_script.R.
The first task was to integrate all the variables and as a result, from the original 196countries that entered the analysis, several were excluded due to data incompleteness.Thus, only 20 countries constituted the final sample. Also, after excluding the variablesthat contained data quality problems, a total of 11 variables (from the initial 17) were
103
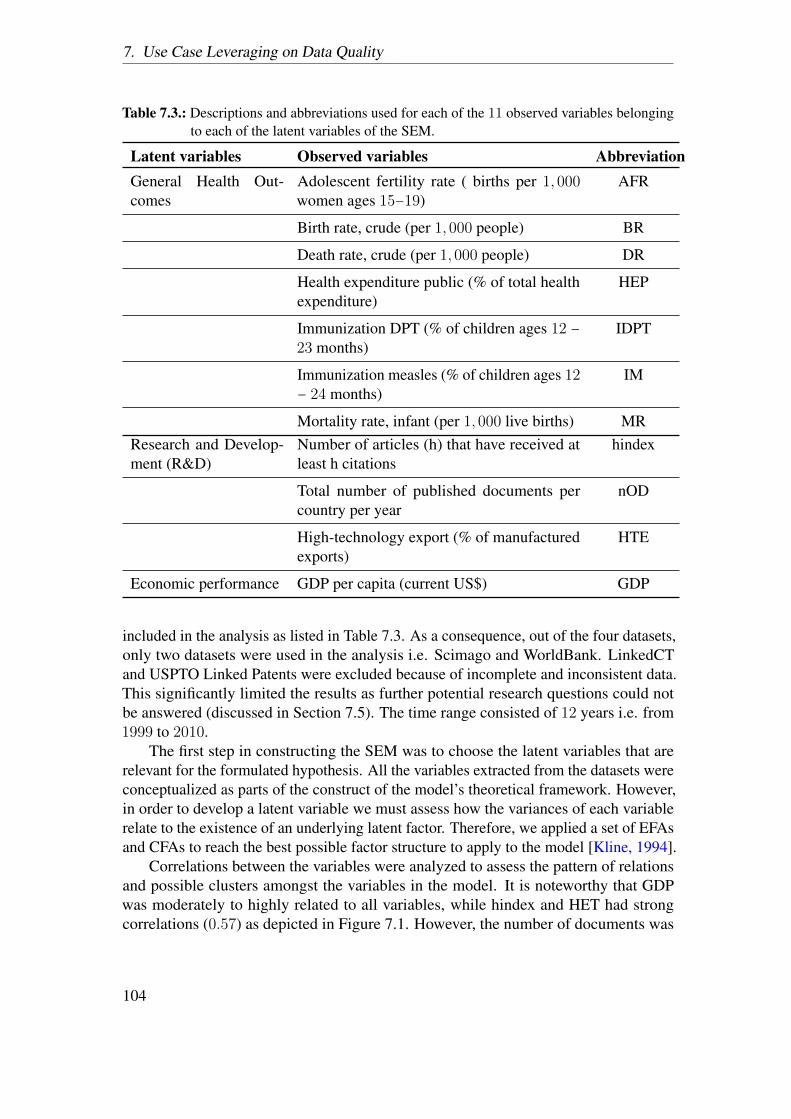
7. Use Case Leveraging on Data Quality
Table 7.3.: Descriptions and abbreviations used for each of the 11 observed variables belongingto each of the latent variables of the SEM.
Latent variables Observed variables AbbreviationGeneral Health Out-comes
Adolescent fertility rate ( births per 1,000women ages 15−19)
AFR
Birth rate, crude (per 1,000 people) BR
Death rate, crude (per 1,000 people) DR
Health expenditure public (% of total healthexpenditure)
HEP
Immunization DPT (% of children ages 12 −23 months)
IDPT
Immunization measles (% of children ages 12− 24 months)
IM
Mortality rate, infant (per 1,000 live births) MRResearch and Develop-ment (R&D)
Number of articles (h) that have received atleast h citations
hindex
Total number of published documents percountry per year
nOD
High-technology export (% of manufacturedexports)
HTE
Economic performance GDP per capita (current US$) GDP
included in the analysis as listed in Table 7.3. As a consequence, out of the four datasets,only two datasets were used in the analysis i.e. Scimago and WorldBank. LinkedCTand USPTO Linked Patents were excluded because of incomplete and inconsistent data.This significantly limited the results as further potential research questions could notbe answered (discussed in Section 7.5). The time range consisted of 12 years i.e. from1999 to 2010.
The first step in constructing the SEM was to choose the latent variables that arerelevant for the formulated hypothesis. All the variables extracted from the datasets wereconceptualized as parts of the construct of the model’s theoretical framework. However,in order to develop a latent variable we must assess how the variances of each variablerelate to the existence of an underlying latent factor. Therefore, we applied a set of EFAsand CFAs to reach the best possible factor structure to apply to the model [Kline, 1994].
Correlations between the variables were analyzed to assess the pattern of relationsand possible clusters amongst the variables in the model. It is noteworthy that GDPwas moderately to highly related to all variables, while hindex and HET had strongcorrelations (0.57) as depicted in Figure 7.1. However, the number of documents was
104
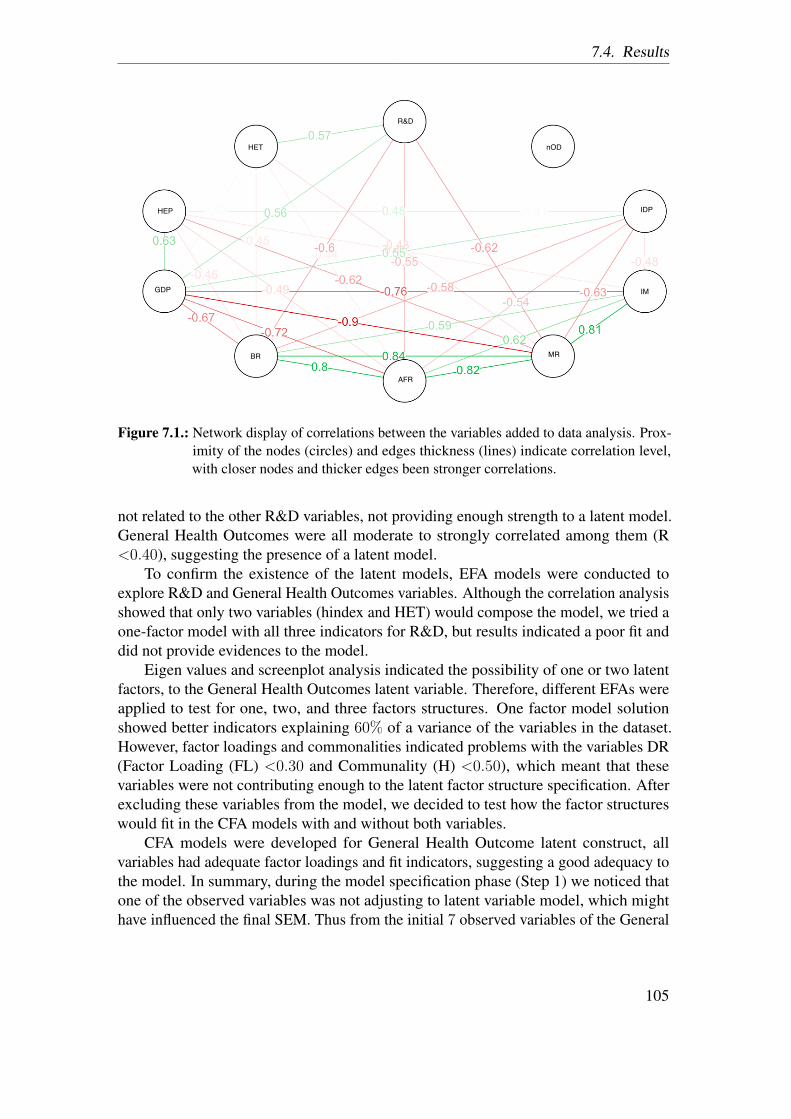
7.4. Results
HET
R&D
nOD
HEP
GDP
BR
AFR
MR
IM
IDP
Figure 7.1.: Network display of correlations between the variables added to data analysis. Prox-imity of the nodes (circles) and edges thickness (lines) indicate correlation level,with closer nodes and thicker edges been stronger correlations.
not related to the other R&D variables, not providing enough strength to a latent model.General Health Outcomes were all moderate to strongly correlated among them (R<0.40), suggesting the presence of a latent model.
To confirm the existence of the latent models, EFA models were conducted toexplore R&D and General Health Outcomes variables. Although the correlation analysisshowed that only two variables (hindex and HET) would compose the model, we tried aone-factor model with all three indicators for R&D, but results indicated a poor fit anddid not provide evidences to the model.
Eigen values and screenplot analysis indicated the possibility of one or two latentfactors, to the General Health Outcomes latent variable. Therefore, different EFAs wereapplied to test for one, two, and three factors structures. One factor model solutionshowed better indicators explaining 60% of a variance of the variables in the dataset.However, factor loadings and commonalities indicated problems with the variables DR(Factor Loading (FL) <0.30 and Communality (H) <0.50), which meant that thesevariables were not contributing enough to the latent factor structure specification. Afterexcluding these variables from the model, we decided to test how the factor structureswould fit in the CFA models with and without both variables.
CFA models were developed for General Health Outcome latent construct, allvariables had adequate factor loadings and fit indicators, suggesting a good adequacy tothe model. In summary, during the model specification phase (Step 1) we noticed thatone of the observed variables was not adjusting to latent variable model, which mighthave influenced the final SEM. Thus from the initial 7 observed variables of the General
105
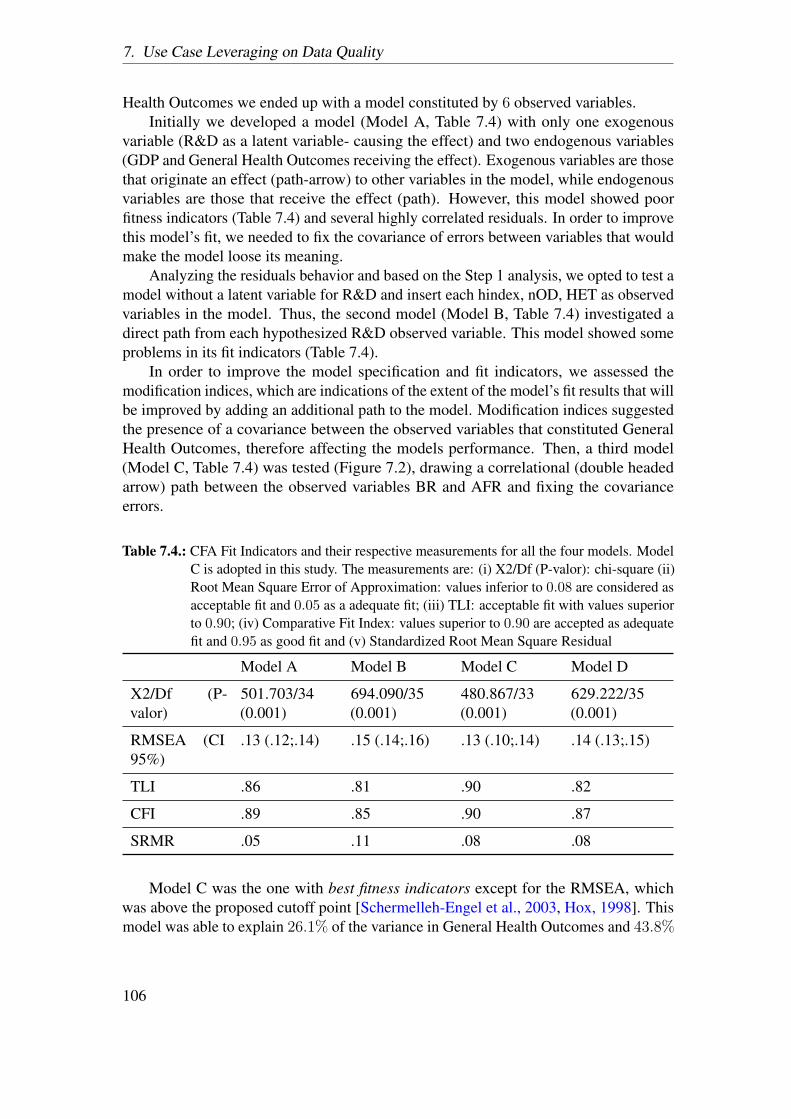
7. Use Case Leveraging on Data Quality
Health Outcomes we ended up with a model constituted by 6 observed variables.Initially we developed a model (Model A, Table 7.4) with only one exogenous
variable (R&D as a latent variable- causing the effect) and two endogenous variables(GDP and General Health Outcomes receiving the effect). Exogenous variables are thosethat originate an effect (path-arrow) to other variables in the model, while endogenousvariables are those that receive the effect (path). However, this model showed poorfitness indicators (Table 7.4) and several highly correlated residuals. In order to improvethis model’s fit, we needed to fix the covariance of errors between variables that wouldmake the model loose its meaning.
Analyzing the residuals behavior and based on the Step 1 analysis, we opted to test amodel without a latent variable for R&D and insert each hindex, nOD, HET as observedvariables in the model. Thus, the second model (Model B, Table 7.4) investigated adirect path from each hypothesized R&D observed variable. This model showed someproblems in its fit indicators (Table 7.4).
In order to improve the model specification and fit indicators, we assessed themodification indices, which are indications of the extent of the model’s fit results that willbe improved by adding an additional path to the model. Modification indices suggestedthe presence of a covariance between the observed variables that constituted GeneralHealth Outcomes, therefore affecting the models performance. Then, a third model(Model C, Table 7.4) was tested (Figure 7.2), drawing a correlational (double headedarrow) path between the observed variables BR and AFR and fixing the covarianceerrors.
Table 7.4.: CFA Fit Indicators and their respective measurements for all the four models. ModelC is adopted in this study. The measurements are: (i) X2/Df (P-valor): chi-square (ii)Root Mean Square Error of Approximation: values inferior to 0.08 are considered asacceptable fit and 0.05 as a adequate fit; (iii) TLI: acceptable fit with values superiorto 0.90; (iv) Comparative Fit Index: values superior to 0.90 are accepted as adequatefit and 0.95 as good fit and (v) Standardized Root Mean Square Residual
Model A Model B Model C Model D
X2/Df (P-valor)
501.703/34(0.001)
694.090/35(0.001)
480.867/33(0.001)
629.222/35(0.001)
RMSEA (CI95%)
.13 (.12;.14) .15 (.14;.16) .13 (.10;.14) .14 (.13;.15)
TLI .86 .81 .90 .82
CFI .89 .85 .90 .87
SRMR .05 .11 .08 .08
Model C was the one with best fitness indicators except for the RMSEA, whichwas above the proposed cutoff point [Schermelleh-Engel et al., 2003, Hox, 1998]. Thismodel was able to explain 26.1% of the variance in General Health Outcomes and 43.8%
106
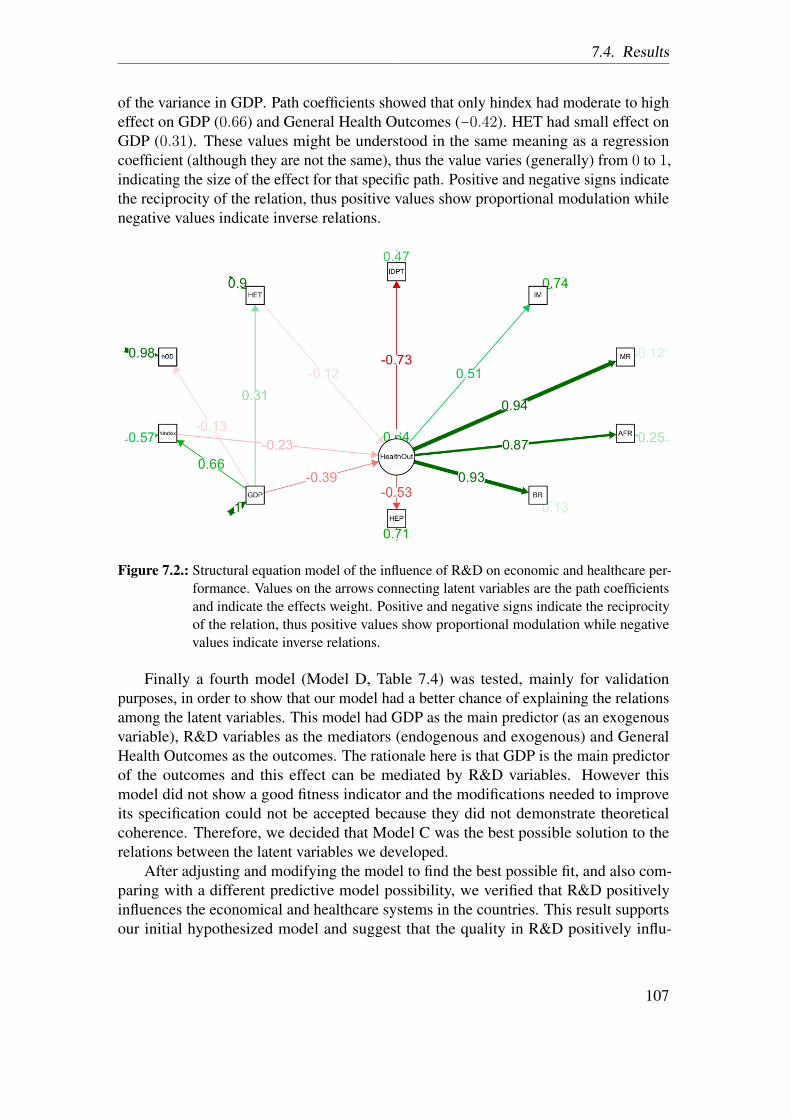
7.4. Results
of the variance in GDP. Path coefficients showed that only hindex had moderate to higheffect on GDP (0.66) and General Health Outcomes (−0.42). HET had small effect onGDP (0.31). These values might be understood in the same meaning as a regressioncoefficient (although they are not the same), thus the value varies (generally) from 0 to 1,indicating the size of the effect for that specific path. Positive and negative signs indicatethe reciprocity of the relation, thus positive values show proportional modulation whilenegative values indicate inverse relations.
Figure 7.2.: Structural equation model of the influence of R&D on economic and healthcare per-formance. Values on the arrows connecting latent variables are the path coefficientsand indicate the effects weight. Positive and negative signs indicate the reciprocityof the relation, thus positive values show proportional modulation while negativevalues indicate inverse relations.
Finally a fourth model (Model D, Table 7.4) was tested, mainly for validationpurposes, in order to show that our model had a better chance of explaining the relationsamong the latent variables. This model had GDP as the main predictor (as an exogenousvariable), R&D variables as the mediators (endogenous and exogenous) and GeneralHealth Outcomes as the outcomes. The rationale here is that GDP is the main predictorof the outcomes and this effect can be mediated by R&D variables. However thismodel did not show a good fitness indicator and the modifications needed to improveits specification could not be accepted because they did not demonstrate theoreticalcoherence. Therefore, we decided that Model C was the best possible solution to therelations between the latent variables we developed.
After adjusting and modifying the model to find the best possible fit, and also com-paring with a different predictive model possibility, we verified that R&D positivelyinfluences the economical and healthcare systems in the countries. This result supportsour initial hypothesized model and suggest that the quality in R&D positively influ-
107
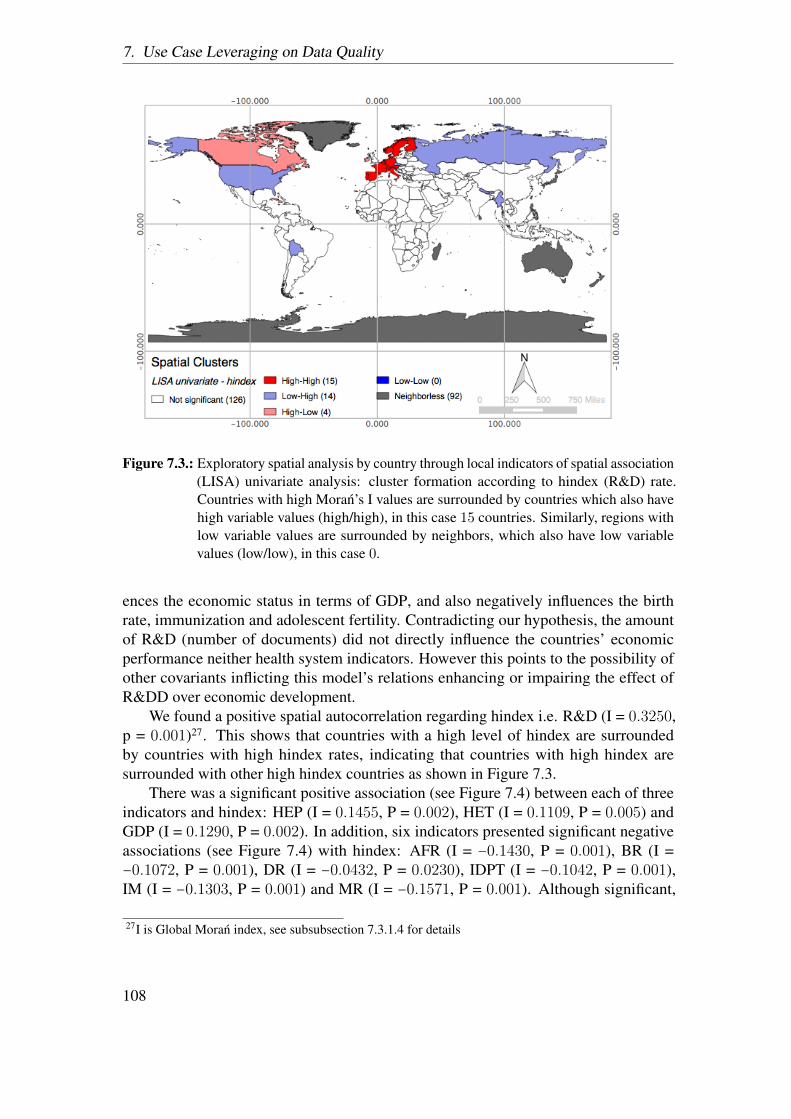
7. Use Case Leveraging on Data Quality
Figure 7.3.: Exploratory spatial analysis by country through local indicators of spatial association(LISA) univariate analysis: cluster formation according to hindex (R&D) rate.Countries with high Moran’s I values are surrounded by countries which also havehigh variable values (high/high), in this case 15 countries. Similarly, regions withlow variable values are surrounded by neighbors, which also have low variablevalues (low/low), in this case 0.
ences the economic status in terms of GDP, and also negatively influences the birthrate, immunization and adolescent fertility. Contradicting our hypothesis, the amountof R&D (number of documents) did not directly influence the countries’ economicperformance neither health system indicators. However this points to the possibility ofother covariants inflicting this model’s relations enhancing or impairing the effect ofR&DD over economic development.
We found a positive spatial autocorrelation regarding hindex i.e. R&D (I = 0.3250,p = 0.001)27. This shows that countries with a high level of hindex are surroundedby countries with high hindex rates, indicating that countries with high hindex aresurrounded with other high hindex countries as shown in Figure 7.3.
There was a significant positive association (see Figure 7.4) between each of threeindicators and hindex: HEP (I = 0.1455, P = 0.002), HET (I = 0.1109, P = 0.005) andGDP (I = 0.1290, P = 0.002). In addition, six indicators presented significant negativeassociations (see Figure 7.4) with hindex: AFR (I = −0.1430, P = 0.001), BR (I =−0.1072, P = 0.001), DR (I = −0.0432, P = 0.0230), IDPT (I = −0.1042, P = 0.001),IM (I = −0.1303, P = 0.001) and MR (I = −0.1571, P = 0.001). Although significant,
27I is Global Moran index, see subsubsection 7.3.1.4 for details
108
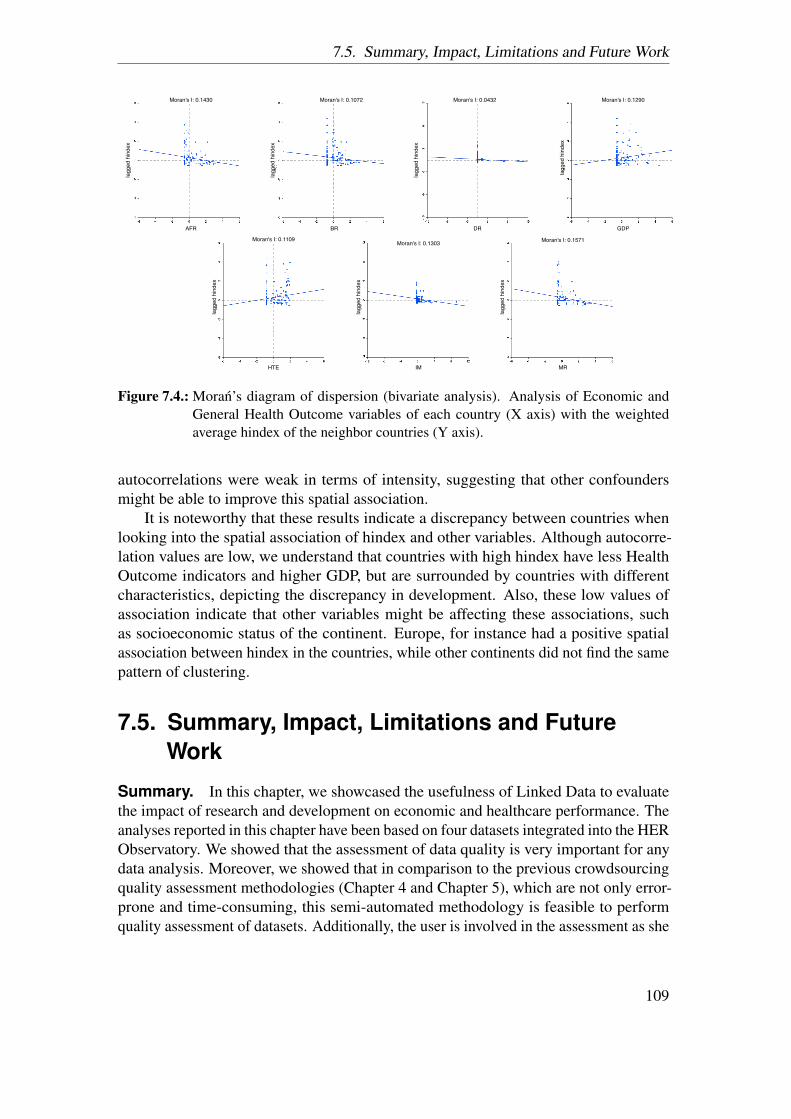
7.5. Summary, Impact, Limitations and Future Work
lagg
ed h
inde
x
lagg
ed h
inde
x
lagg
ed h
inde
x
lagg
ed h
inde
x
lagg
ed h
inde
x
lagg
ed h
inde
x
lagg
ed h
inde
x
Moran's I: 0.1430
AFR BR DR GDP
HTE IM MR
Moran's I: 0.1072 Moran's I: 0.0432 Moran's I: 0.1290
Moran's I: 0.1109Moran's I: 0.1303 Moran's I: 0.1571
Figure 7.4.: Moran’s diagram of dispersion (bivariate analysis). Analysis of Economic andGeneral Health Outcome variables of each country (X axis) with the weightedaverage hindex of the neighbor countries (Y axis).
autocorrelations were weak in terms of intensity, suggesting that other confoundersmight be able to improve this spatial association.
It is noteworthy that these results indicate a discrepancy between countries whenlooking into the spatial association of hindex and other variables. Although autocorre-lation values are low, we understand that countries with high hindex have less HealthOutcome indicators and higher GDP, but are surrounded by countries with differentcharacteristics, depicting the discrepancy in development. Also, these low values ofassociation indicate that other variables might be affecting these associations, suchas socioeconomic status of the continent. Europe, for instance had a positive spatialassociation between hindex in the countries, while other continents did not find the samepattern of clustering.
7.5. Summary, Impact, Limitations and FutureWork
Summary. In this chapter, we showcased the usefulness of Linked Data to evaluatethe impact of research and development on economic and healthcare performance. Theanalyses reported in this chapter have been based on four datasets integrated into the HERObservatory. We showed that the assessment of data quality is very important for anydata analysis. Moreover, we showed that in comparison to the previous crowdsourcingquality assessment methodologies (Chapter 4 and Chapter 5), which are not only error-prone and time-consuming, this semi-automated methodology is feasible to performquality assessment of datasets. Additionally, the user is involved in the assessment as she
109
7. Use Case Leveraging on Data Quality
can choose which metrics apply to her use case and also is provided with interpretableresults. By using Structural Equation Modeling, we showed that we can link structuredinformation to evaluate the impact of R&D on economic and healthcare performance atthe country level. Our results show that R&D positively influences countries’ economicand healthcare systems.
Impact. Measuring the economic and healthcare performance of countries permitspolicy makers to determine whether research strategies developed by countries arealigned with their respective healthcare needs. This information is critical for guiding andshaping policies that facilitate the destruction of inequalities, planning health systems,improve healthcare delivery, promote and sustain population welfare, allocating budgetsfor R&D (set spending priorities), monitor progress and evaluate what works and whatdoes not [Murray et al., 2004, Schlotthauer et al., 2008]. This analysis, in turn, helpsimprove the technology and methods for societal progress and motivates governments tocollect and analyze useful data and compare assessments of inputs, service delivery andachievements for economic and health outcomes. Revisiting our user scenario introducedin Section 1.2, Ms. Sharma can analyze and interpret the results from our use case andmeasure the healthcare performance of India. This allows her to determine whetherresearch strategies developed by India are aligned with the respective healthcare needs.
Limitations. We encountered several issues in our current approach. Firstly, therewas a minimal amount of post-processing required to unify the labels of the data, forexample, the dates are sometimes only provided as URIs. Secondly, the quality of thedatasets was a major hindrance, in particular we had to exclude several variables fromour analysis, for incompleteness and inconsistency issues. As a result, two (out ofthe four) datasets were not used for calculating the correlations among the indicators,leading to the loss of valuable information. In particular, due to the exclusion of theLinkedCT and USPTO Linked Patent datasets, interesting research questions, such asthe impact of R&D on the healthcare (in terms of clinical trials) and innovation (in termsof patents), have not been answered. Also, with the huge amount of variables involvedin the analysis, the analysis was computationally exhaustive.
110
8. Related Work
This chapter contains related work for four different areas that are part of this thesis:(i) Data Quality Dimensions, (ii) Data Quality Assessment Efforts, (iii) Data QualityAssessment Tools and (iv) Calculation of Societal Progress Indicators
8.1. Data Quality Dimensions
There are a number of studies, which have identified, defined and grouped dataquality dimensions into different classifications [Wang and Strong, 1996, Wand andWang, 1996, Redman, 1997, Naumann, 2002, Batini and Scannapieco, 2006, Jarke et al.,2010]. Recently, there are a number of data quality dimensions that have been identifiedrelevant to LD, namely, accuracy, timeliness, completeness, relevancy, conciseness,consistency [Bizer and Cyganiak, 2009]. Further quality criteria such as uniformity,versatility, comprehensibility, amount of data, validity, licensing, accessibility andperformance are also introduced as means of assessing the quality of LD [Flemming,2011]. The novel data quality aspects original to LD include, for example, coherencevia links to external datasets, data representation quality or consistency with regard toimplicit information. Furthermore, inference mechanisms for knowledge representationformalisms on the Web, such as OWL, usually follow an open world assumption, whereasdatabases usually adopt closed world semantics.
The research community is also still debating on the exact meaning of each dimen-sion. Means to measure each dimension i.e. metrics are also not clearly defined foreach dimension. Thus, in our study [Zaveri et al., 2015], we conducted a systematicliterature review to gather all the relevant articles on data quality assessments specificallyon LD, We qualitatively analyze the 30 identified studies and unify and formalize 18data quality dimensions along with an example and identify 69 metrics to assess thequality of LD. Also, an example alongside each dimension helps to gain a clear pictureof the dimension. Moreover, we provide several metrics from each dimension identifiedin the existing articles and also classify them into being either qualitatively (QL) orquantitatively (QN) assessed.
8.2. Data Quality Assessment Efforts
Web Data quality assessment frameworks. There are several efforts in devel-oping data quality assessment frameworks in order to assess the data quality of LOD.These efforts are semi-automated [Flemming, 2011], automated [Gueret et al., 2012b] or
111
8. Related Work
manual [Bizer and Cyganiak, 2009, Mendes et al., 2012b]. Other researchers analyzedthe quality of Web [Cafarella et al., 2008] and RDF [Hogan et al., 2010] data. Thesecond study focuses on errors occurred during the publication of Linked Data sets.Recently, a survey [Hogan et al., 2012] looked into four million RDF/XML documentsto analyse Linked Data conformance. Even though these frameworks introduce usefulmethodologies to assess the quality of a dataset, either the results are difficult to interpret,do not allow a user to choose the input dataset or require a considerable amount of userinvolvement. In our experiment [Acosta et al., 2013], we used crowdsourcing to performthe evaluation because (i) none of the frameworks provided the granularity of qualitycriteria that we identified to be quality problems in DBpedia resources and (ii) we wereinterested in whether it was possible to use crowdsourcing to assess and thus improvethe quality of a dataset.
An effort to assess the quality of web data was undertaken in 2008 [Cafarella et al.,2008], where 14.1 billion HTML tables from Google’s general-purpose web crawl wereanalyzed in order to retrieve those tables that have high-quality relations. Additionally,there have been studies focused on assessing the quality of RDF data [Hogan et al., 2010]to report the errors occurring while publishing RDF data and the effects and means toimprove the quality of structured data on the web. As part of an empirical study [Hoganet al., 2012] 4 million RDF/XML documents were analyzed, which provided insightsinto the level of conformance in these documents with respect to the LD guidelines.Even though these studies accessed a vast amount of web or RDF/XML data, most ofthe analysis was performed automatically and therefore the problems arising due tocontextual discrepancies were overlooked. Another study aimed to develop a frameworkfor the DBpedia quality assessment [Kreis, 2011]. In this study, particular problemsof the DBpedia extraction framework were taken into account and integrated in theframework. However, only a small sample (75 resources) was assessed in this caseand an older DBpedia version (2010) was analyzed. Considering that the DBpediaextraction framework was considerably enhanced since then, our efforts [Zaveri et al.,2013a, Acosta et al., 2013] shed light on the recent problems that hinder the quality ofDBpedia.
Crowdsourcing Linked Data management tasks. There are already a numberof efforts which use crowdsourcing focused on a specific type of task. For example,crowdsourcing is used for entity linking or resolution [Demartini et al., 2012], qualityassurance and resource management [Wang et al., 2012] or for enhancement of ontologyalignments [Sarasua et al., 2012] especially in Linked Data. However, in our case, we didnot submit tasks to the popular internet marketplaces such as Amazon Mechanical Turkor CrowdFlower1. Instead, we used the intelligence of a large number of researchers whowere particularly conversant with RDF to help assess the quality of one of the importantand most linked dataset, DBpedia.
Several important Linked Data publication initiatives like DBpedia [Lehmann et al.,
1http://crowdflower.com/
112
8.3. Data Quality Assessment Tools
2009] and contests have been organized, including challenges2 to the European DataInnovator Award3. At a technical level, specific LD management tasks have beensubject to human computation, including games with a purpose [Markotschi and Volker,2010, Thaler et al., 2011] and microtasks. For instance, microtasks have been used forentity linking [Demartini et al., 2012] quality assurance, resource management [Wanget al., 2012] and ontology alignment [Sarasua et al., 2012].
8.3. Data Quality Assessment Tools
Out of the 30 core articles identified in our survey, 12 provide tools for data qualityassessment. Thus, in this section, we compare these 12 tools based on eight differentattributes (see Table 8.1 and Table 8.2).
Accessibility/Availability. In the tables, only the tools marked with a 4are availableto be used for quality assessment. The other tools are either available only as a demo orscreencast (Trellis, ProLOD) or not available at all (TrustBot, WIQA, DaCura).
Licensing. Most of the tools are available using a particular software license, whichspecifies the restrictions with which they can be redistributed. The Trellis and LinkQAtools are open-source and as such by default they are protected by copyright, which is AllRights Reserved. Also, WIQA, Sieve, RDFUnit and TripleCheckMate are all availablewith open-source license: the Apache Version 2.04 and Apache licenses. tSPARQL isdistributed under the GPL v3 license5. However, no licensing information is availablefor TrustBot, ProLOD, Flemming’s tool, DaCura and LiQuate.
Automation. The automation of a system is the ability to automatically performits intended tasks thereby reducing the need for human intervention. In this context,we classify the 12 tools into semi-automated and automated approaches. As seenin Table 8.1 and Table 8.2, all the tools are semi-automated except for LinkQA, which iscompletely automated, as there is no user involvement. LinkQA automatically selectsa set of resources, information from the Web of Data (i.e. SPARQL endpoints and/ordereferenceable resources) and a set of triples as input and generates the respectivequality assessment reports.
On the other hand, the WIQA, Sieve and RDFUnit require a high degree of userinvolvement. Specifically in Sieve, the definition of metrics has to be done by creating anXML file, which contains specific configurations for a quality assessment task. In caseof RDFUnit, the user has to define SPARQL queries as constraints based on SPARQLquery templates, which are instantiated into concrete quality test queries. Although itgives the users the flexibility of tweaking the tool to match their needs, it requires muchtime for understanding the required XML file structure and specification as well as theSPARQL language.
2For example: Semantic Web Challenge http://challenge.semanticweb.org/3http://2013.data-forum.eu/tags/european-data-innovator-award4http://www.apache.org/licenses/LICENSE-2.05http://www.gnu.org/licenses/gpl-3.0.html
113

8. Related Work
Table 8.1.: Comparison of quality assessment tools according to several attributes.Trellis,Gil et al.,2002 [Giland Rat-nakar,2002]
TrustBot,Golbecket al.,2003 [Gol-beck et al.,2003]
tSPARQL,Hartig,2008 [Har-tig, 2008]
WIQA,Bizer et al.,2009 [Bizerand Cy-ganiak,2009]
ProLOD,Bohm et al.,2010 [Bohmet al., 2010]
Flemming,2010 [Flem-ming, 2011]
Accessibility − − 4 − − 4Licensing Open-
source− GPL v3 Apache v2 − −
Automation Semi-automated
Semi-automated
Semi-automated
Semi-automated
Semi-automated
Semi-automated
Collaboration Yes No No No No NoCustomizability 4 4 4 4 4 4Scalability − No Yes − − NoUsability 2 4 4 2 2 3Maintenance(Last updated)
2005 2003 2012 2006 2010 2010
Table 8.2.: Comparison of quality assessment tools according to several attributes.LinkQA,Gueretet al.,2012 [Gueretet al.,2012a]
Sieve,Mendeset al.,2012 [Mendeset al.,2012b]
RDFUnit,Kon-tokostas etal.,2014 [Kon-tokostaset al., 2014]
DaCura,Feeneyet al.,2014 [Feeneyet al., 2014]
TripleCheck-Mate, Za-veri et al.,2013 [Za-veri et al.,2013a]
LiQuate,Ruckhauset al.,2014 [Ruck-haus et al.,2014]
Accessibility 4 4 4 − 4 4Licensing Open-
sourceApache Apache − Apache −
Automation Automated Semi-automated
Semi-automated
Semi-automated
Semi-automated
Semi-automated
Collaboration No No No Yes Yes NoCustomizability No 4 4 4 4 NoScalability Yes Yes Yes No Yes NoUsability 2 4 3 1 5 1Maintenance(Last updated)
2011 2012 2014 2013 2013 2013
The other semi-automated tools, Trellis, TrurstBot, tSPARQL, ProLOD, Flemming’stool, DaCura, TripleCheckMate and LiQuate require a minimum amount of user in-volvement. TripleCheckMate provides evaluators with triples from each resource andthey are required to mark the triples, which are incorrect as well as map it to one of thepre-defined quality problem. Even though the user involvement here is higher than theother tools, the user-friendly interface allows a user to evaluate the triples and map themto corresponding problems efficiently.
For example, Flemming’s Data Quality Assessment Tool requires the user to answera few questions regarding the dataset (e.g. existence of a human-readable license) or theyhave to assign weights to each of the pre-defined data quality metrics via a form-basedinterface.
Collaboration. Collaboration is the ability of a system to support co-operation be-tween different users of the system. From all the tools, Trellis, DaCura and TripleCheck-Mate support collaboration between different users of the tool. The Trellis user interfaceallows several users to express their trust value for a data source. The tool allows the
114
8.3. Data Quality Assessment Tools
users to add and store their observations and conclusions. Decisions made by users ona particular source are stored as annotations, which can be used to analyze conflictinginformation or handle incomplete information.
In case of DaCura, the data-architect, domain expert, data harvester and consumercollaborate together to maintain a high-quality dataset. TripleCheckMate, allows multi-ple users to assess the same Linked Data resource and therefore allowing to calculate theinter-rater agreement to attain a final quality judgement.
Customizability. Customizability is the ability of a system to be configured accordingto the users’ needs and preferences. In this case, we measure the customizability of atool based on whether the tool can be used with any dataset that the user is interestedin. Only LinkQA and LiQuate cannot be customized since the user cannot add anydataset of her choice. The other ten tools can be customized according to the use case.For example, in TrustBot, which is an IRC bot that makes trust recommendations tousers (based on the trust network it builds), the users have the flexibility to submit theirown URIs to the bot at any time while incorporating the data into a graph. Similarly,Trellis, tSPARQL, WIQA, ProLOD, Flemming’s tool, Sieve, RDFUnit, DaCura andTripleCheckmate can be used with any dataset.
Scalability. Scalability is the ability of a system, network, or process to handle agrowing amount of work or its ability to be enlarged to accommodate that growth. Outof the 12 tools only five, the tSPARQL, LinkQA, Sieve, RDFUnit and TripleCheckMatetools are scalable, that is, they can be used with large datasets. Flemming’s tool andTrustBot are reportedly not scalable for large datasets [Flemming, 2011, Golbeck et al.,2003]. Flemming’s tool, on the one hand, performs analysis based on a sample of threeentities whereas TrustBot takes as input two email addresses to calculate the weightedaverage trust value. Trellis, WIQA, ProLOD, DaCura and LiQuate do not provide anyinformation on the scalability.
Usability/Documentation. Usability is the ease of use and learnability of a human-made object, in this case the quality assessment tool. We assess the usability of the toolsbased on the ease of use as well as the complete and precise documentation availablefor each of them thus enabling users to find help easily. We score them based on a scalefrom 1 (low usability) to 5 (high usability). TripleCheckMate is the easiest tool witha user-friendly interface and a screencast explaining its usage. Thereafter, TrustBot,tSPARQL and Sieve score high in terms of usability and documentation followed byFlemming’s tool and RDFUnit. Trellis, WIQA, ProLOD and LinkQA rank lower interms of ease of use since they do not contain useful documentation of how to use thetool. DaCura and LiQuate do not provide any documentation except for a description inthe paper.
Maintenance/Last updated. With regards to the current status of the tools, whileTrustBot, Trellis and WIQA have not been updated since they were first introduced in2003, 2005 and 2006 respectively, ProLOD and Flemming’s tool have been updatedin 2010. The recently updated tools are LinkQA (2011), tSRARQL and Sieve (2012),DaCura, TripleCheckMate, LiQuate (2013) and RDFUnit (2014) and are currently beingmaintained.
115
8. Related Work
8.4. Calculation of Societal Progress Indicators
There are several organizations which focus on calculating specific societal progressindicators for specific countries or globally. For example, the World Bank providesreports on several different areas of research such as Health, Nutrition and Population,Science and Technology Development, Education etc.6 for the 188 member countries.However, this data is not always up-to-date and needs to be manually analyzed thusbeing error-prone and time consuming.
Another organization is the Agency for Healthcare Research and Quality (AHRQ),which produces annual reports to measure trends in effectiveness of care, patient safety,timeliness and efficiency of care i.e. the latest available findings on quality of andaccess to health care. However, the organization only focuses on the US member states7.Additionally, a study devised 13 carefully calibrated performance indicators to composethe World University Rankings8, thus only focusing towards one of the societal progressindicators. On the other hand, a KOF Index of Globalization9 was proposed to measurethe economic, social and political dimensions of globalization. However, the data is onlyavailable until 2011.
Particularly for calculating the research-disease disparity, among the many possibili-ties is the generation of cross-sectional studies comparing estimates of disease-specificresearch productivity with different indices measuring the burden of disease [CaryP. Gross and Powe, 1999, Gillum et al., 2011]. Other methods include the use of suitablestatistical measures on samples of data to quantify the disparity [Bonito et al., 2005].These methods to calculate the disparity are not only cumbersome and time consumingbut also are limited in that they use a limited sample of the data for analysis as opposedto using entire datasets.
Although previous efforts have highlighted disparity issues between disease burdenand research efforts in a given country that are beginning to be addressed, we seemajor pending problems that we intended to address through this project. First, sinceall information has to be manually collected by experts, current methods to generatereports that evaluate Research-Disease Disparity are burdensome and expensive. Thisproblem is particularly pervasive in countries that need these evaluations the most,namely developing countries where the cost of such evaluations is prohibitive. As adirect consequence of this cost and expertise issue, current reports are not published asoften, thus decreasing the ability of policy makers to obtain a current perspective on themagnitude of these problems. Additionally, since reports are scarce, comparison withother countries are not possible, thus making it difficult to search for successful policymodels that could be used to level and decrease the disparity levels across nations.
6https://openknowledge.worldbank.org/7http://www.ahrq.gov/research/findings/nhqrdr/index.html8http://www.timeshighereducation.co.uk/world-university-rankings/2013-14/subject-ranking/subject/life-sciences/methodology
9http://globalization.kof.ethz.ch/
116
9. Conclusions and Future Work
This chapter provides an overview on the main contributions of this thesis alongwith the solutions to the research questions introduced in Chapter 1 (Section 1.4). It thendiscusses the future directions in which we intend to move further to extend and broadenthe research conducted in the specific areas.
9.1. Summary of Contributions
In this section, we revisit each research question and provide a summary of thesolution and the contributions provided by this thesis.
9.1.1. Descriptions of data quality dimensions and metricsThe research question we aimed to answer is:
• RQ1: What are the existing approaches to assess the quality of Linked Dataemploying a conceptual framework integrating prior approaches?
We further divided this RQ into the following:
• RQ1.1: What are the data quality problems that each approach assesses?
• RQ1.2: Which are the data quality dimensions and metrics supported by theproposed approaches?
To address this question, we conducted a systematic literature review and identified 30different approaches that propose a data quality assessment methodology, specificallyfor LD. We first identified the problems that each of the 30 approaches addressed(RQ1.1) and then mapped these problems to a particular data quality dimension. Wethen unified the definitions that each approach provides and formalized them (RQ1.2)in Chapter 3 for 18 identified dimensions. We explained each dimension with the helpof an example. Additionally, we provided a total of 69 metrics for these dimensions(RQ1.2). Furthermore, we classified each metric into being qualitatively or quantitativelyassessed. These dimensions and metrics formed the core of this thesis as they are usedin formulating the quality problem taxonomy (Chapter 4), which in turn is used to selectthe types of quality issues that are presented to the MTurk workers (Chapter 5). Also,specific metrics identified as a result of this survey are implemented as part of a tool andused to assess the quality of four datasets that are part of our use case (Chapter 7).
117
9. Conclusions and Future Work
9.1.2. User-driven data quality assessment methodologiesThe research question we aimed to answer is:
• RQ2: How can we address the quality of Linked Data using a user-driven method-ology?
We further divided this RQ into the following:
• RQ2.1 How feasible is it to employ LD experts to assess the quality issues of LD?
• RQ2.2 How feasible is it to use a combination of user-driven and semi-automatedmethodology to assess the quality of LD?
• RQ2.3 Is it possible to detect quality issues in LD datasets via crowdsourcingmechanisms?
• RQ2.4 What type of crowd is most suitable for each type of quality issues?
• RQ2.5 Which types of assessment errors are made by lay users and experts?
• RQ2.6 How can we semi-automatically assess the quality of datasets and providemeaningful results to the user?
In order to address these research questions, we presented three different data qualityassessment methodologies, which are user-driven and/or sensitive to a use case.
Firstly, we presented a user-driven methodology for assessing the quality of LDsources comprising of a manual and a semi-automatic process. In the manual process, thefirst phase includes the detection of common quality problems and their representationin a quality problem taxonomy. The second phase comprises of the evaluation of a largenumber of individual resources, according to the quality problem taxonomy, performedby users. This process is accompanied by a tool, namely TripleCheckMate, whereina user assesses an individual resource and evaluates each fact for correctness. In thiscase, the user is a LD expert who is conversant with RDF. The second methodology isa semi-automatic process, in which the first phase involves the detection of commonquality problems by the automatic creation of an extended schema for DBpedia. Thesecond phase involves the generation and manual verification of schema axioms.
As a result of our study, more than 500 resources of the DBpedia dataset wereanalyzed. We found that a substantial number of problems exist and the overall quality,with a 11.93% error rate, is moderate. Moreover, the semi-automatic analysis revealedmore than 200,000 violations of property characteristics. In addition to the qualityanalysis of DBpedia, we devised a generic methodology for LD quality analysis, deriveda comprehensive taxonomy of extraction quality problems and developed a tool, whichcan assist in the evaluation. All these contributions can be reused for analyzing anyother extracted dataset (by domain experts). In sum, we showed that the employment ofLinked Data experts to assess the quality issues of LD is feasible to a certain extent as itcan be time-consuming and costly. We illustrated that a combination of user-driven and
118
9.1. Summary of Contributions
semi-automated methodology to perform LD quality assessment is a feasible means ofperforming quality assessment.
Another means we employed for assessing the quality of linked data sets was viacrowdsourcing. We utilized the wisdom of the crowd, i.e. workers from the onlinecrowdsourcing platform MTurk, to assess the quality of DBpedia. In particular, we usedthe results from the previous user-driven assessment (performed by LD experts) and fedthem to MTurk. We then compared the two methodologies in order to determine the costand time feasibility of the approaches. We reported the results obtained by applying boththese methodologies to DBpedia in Chapter 5. As a result, we presented a methodologythat adjusts the crowdsourcing pattern Find-Fix-Verify to exploit the strengths of expertsand microtask workers. The Find stage was implemented using a contest-based formatto engage with a community of LD experts in discovering and classifying quality issuesof DBpedia resources. We selected a subset of the contributions obtained throughthis contest (referring to flawed object values, incorrect data types and missing links)and asked the MTurk crowd to Verify them. The evaluation showed that both types ofapproaches are feasible but limited; in particular, the microtask experiments revealed thatpeople with no expertise in Linked Data can be a useful resource to identify only veryspecific quality issues in an accurate and affordable manner, using the MTurk model. Weconsider our methodology to be applicable to RDF data sets, which are extracted fromother sources and, hence, are likely to suffer from similar quality problems as DBpedia.
The third assessment methodology we proposed is that which implements the dataquality metrics identified in our survey to provide a tool, namely R2RLint, to assess thequality of LD. This methodology is a combination of a semi-automated methodologyand user-driven quality assessment. The user is not only provided the results of theassessment but also specific entities that cause the errors, which help users understandthe quality issues and thus can fix them. We provided the specific dimensions along withdetailed explanations of the implementation of the metrics in Chapter 6. The results ofthe quality assessment of the four datasets, namely LinkedCT, USPTO, Scimago andWorldBank, using the R2RLint tool are reported in Chapter 7.
9.1.3. Consumption of Linked Data leveraging on dataquality
The research question we aimed to answer is:
• RQ3: How can we exploit Linked Data for a particular use case and ensure gooddata quality?
In response to this question, we designed a use case employing Linked Data to buildthe HER Observatory of societal progress indicators. We chose four linked datasets,namely LinkedCT, USPTO, Scimago and WorldBank and integrated them to determinethe impact of research and technology on health and economic performance of countriesper year. We performed this analysis using SEM and EFA methods, which producesreliable and interpretable results. In order to ensure good data quality of the datasets,
119
9. Conclusions and Future Work
we performed semi-automated quality assessment on all the four datasets involved inthe use case. We employed the semi-automated methodology, using the R2RLint toolto perform this assessment. Moreover, we showed that in comparison to the previouscrowdsourcing quality assessment methodologies (Chapter 4 and Chapter 5), which arenot only error-prone and time-consuming, this semi-automated methodology is feasibleto perform quality assessment of datasets. Additionally, the user is involved in theassessment as she can choose which metrics apply to her use case and also is providedwith interpretable results.
Thus, this RQ brought together both the challenges that this thesis addresses, that is,utilization of LD for a specific use case enhanced with the assessment of the quality ofthe datasets involved. We showed the importance of the role of data quality assessmentand improvement in such a use case since two, out of the four, datasets were not utilizedin calculating the results due to data quality problems. We provided details of the usecase, results of the data quality assessment and results of the use case in Chapter 7. Wealso described the advantages of using a combination of semi-automated and user-drivenquality assessment performed in this use case.
Revisiting our user scenario introduced in Section 1.2, Ms. Sharma can analyzeand interpret the results from our use case and measure the healthcare performance ofIndia. This allows her to determine whether research strategies developed by India arealigned with the respective healthcare needs for MDR-TB. This information is criticalfor guiding and shaping policies that facilitate the destruction of inequalities, planninghealth systems, improving healthcare delivery, promote and sustain population welfare,allocating budgets for R&D (set spending priorities), monitor progress and evaluatewhat works and what does not [Murray et al., 2004, Schlotthauer et al., 2008]. Thisanalysis, in turn, helps improve the technology and methods for societal progress andmotivates governments to collect and analyze useful data and compare assessments ofinputs, service delivery and achievements for economic and health outcomes.
9.2. Limitations and Future Work
In this section, we describe the limitations and future work with regards to the maincontributions of this thesis.
9.2.1. Quality Assessment Methodology for Linked DataWe introduced several methodologies that can be utilized to assess the quality of a
LD source. However, we showed the quality assessment methodology applicable onlyto the use case, thus we aim to evaluate the methodology in its application to assessthe quality of other datasets in different domains. We identified that one importantcomponent missing from these methodologies is the improvement of the datasets afterquality assessment. In case of performing the quality assessment of DBpedia usingLD experts, we aim to adopt an agile methodology to improve the quality in futureversions by regularly providing feedback to the DBpedia maintainers to fix the problems
120
9.2. Limitations and Future Work
identified. Moreover, we aim to perform quality analysis in regular intervals in order todemonstrate possible improvements.
In case of using the crowd as a means to assess the quality, future work will first focuson conducting new experiments to test the value of the crowd for further different types ofquality problems as well as for different LD sets from other knowledge domains. In thelonger term, our work will also look into how to optimally integrate crowd contributions– by implementing the Fix stage – into curation processes and tools, in particular withrespect to the trade-offs of costs and quality between manual and automatic approaches.Moreover, we plan to device a generic methodology for assessment of LD quality thatnot only takes the use case into account throughout the analysis but also includes theimprovement phase.
9.2.2. Quality Assessment Tools for Linked DataIn order to assess the quality of LD sources, there should be user-friendly tools
available so that even lay users are able to assess and interpret the results. Thus, we aimto improve the R2RLint tool to provide a user interface for assessment of quality andrepresentation of results in an accessible way. We also aim to further implement moremetrics that can be used to assess the quality of LD sources. Moreover, we plan to usethe tool to assess the quality of other datasets so as to find ways to improve its usabilityand assess its feasibility in all cases.
9.2.3. Consumption of Linked Data leveraging on DataQuality
In our use case, we encountered major information loss due to data quality problemsof the datasets involved. Thus, we aim to improve the quality of the included datasets sothat they can be used in the next calculations. Also as future work, we plan to streamlinethe process of acquiring, converting, quality assessment, integrating and analyzing datarelevant to the societal progress indicators. We intend to keep the HER Observatoryup-to-date by integrating new data as and when they will be available. We also intend toadd more relevant LD sources so as to answer even more relevant research questions.Our ultimate goal will be to offer a reliable system for policy makers to make informeddecisions on these indicators by ensuring good quality, which would benefit society as awhole in the long run.
121

A. Curriculum Vitae
Amrapali Zaveri
Email: [email protected]: http://aksw.org/AmrapaliZaveri
Personal DataName: Amrapali ZaveriBirth date: November 9th, 1984Birth place: Mumbai, IndiaNationality: Indian
Education2010 − PresentUniversity of Leipzig, GermanyPh.D., Faculty of Mathematics and Computer Science, Department of Computer ScienceThesis title: Linked Data Quality Assessment and its Application to Societal ProgressMeasurement
2007 − 2009Sikkim Manipal University of Health, Medical and Technological Sciences, IndiaM.Sc in BioinformaticsGrade A, Score: 177/200, 82.5%
2005 − 2007Fergusson College, University of Pune, IndiaB.Sc. in Zoology.
122
Grade: First class with distinction, 76.78%
2002 − 2005S.M. Choksey High School and Junior College, Pune, IndiaHigher Second School Certificate, Science stream.Grade: 1, 74.5%
2000St.Mary’s School, Pune, IndiaSecondary School Certiciate.Grade: 1 distinction, 84.16%
Work experience15 June, 2010 - 15 June 2011AKSW Research group, Universitat Leipzig, GermanyPosition: Research InternshipResponsibility: Preliminary work on ReDD-Observatory projecthttp://redd.aksw.org
2 Feb, 2009 - 15 May 2010National Neuroscience Institute, SingaporePosition: Senior Research AssistantResponsibility: Working on development of ontologies to standardize research reportingand creating a center for excellence in research reporting in neurosurgeryhttp://www.nni.com.sg/
2 Feb, 2009 - 15 May 2010Duke-NUS Graduate Medical School, SingaporePosition: Senior Research AssistantResponsibility: Working with the “Research on Research” group, co-ordinating peopleand projects involving use of ontologies and semantic web technology, also performingmeta-analysishttp://researchonresearch.duhs.duke.edu/site/
23 July, 2008 - 4 Aug 2008Tathapi, IndiaResponsibility: Created an annotated bibliography on Human Resource issues of HealthWorkers in Indiahttp://www.tathapi.org/
May, 2008 - July 2008DNS E-business ConsultancyResponsibility: Created an ASP page to display records from a MS SQL back-end
123
A. Curriculum Vitae
database
15 Sept, 2006 - 30 March 2008InSilico Consulting, Pune, IndiaPosition: Technical AssociateResponsibility: Written technical documentation, help files, manuals and training mate-rial for bioinformatics/cheminformatics data mining software called InforSense KDEwww.inforsense.com
Feb - May 2007M.Sc. dissertationProject: PubChem Datamining using a Chemical Ontology
April - June 2006M.Sc. first year projectProject: Secondary structure prediction from a given amino acid sequence
Research Interests
• Knowledge interlinking and fusion
• Data quality
• Biomedical data publishing
• Healthcare research
• Bioinformatics
Selected Publications
1. Crowdsourcing Linked Data quality assessment, In Proceedings of 12th Interna-tional Semantic Web Conference, 21-25 October 2013, Sydney, Australia (ISWC2013) [Acosta et al., 2013]
2. Using Linked Data to evaluate the impact of Research and Development in Europe:a Structural Equation Model, In Proceedings of 12th International Semantic WebConference, 21-25 October 2013, Sydney, Australia (ISWC 2013) [Zaveri et al.,2013d]
3. User-driven Quality Evaluation of DBpedia, In Proceedings of 9th InternationalConference on Semantic Systems, I-SEMANTICS ’13, Graz, Austria, September4-6, (I-Semantics 2013) [Zaveri et al., 2013a]
124
4. ReDD-Observatory: Using the Web of Data for Evaluating the Research-DiseaseDisparity, In Proceedings of the IEEE/WIC/ACM International Conference onWeb Intelligence (WI 2011) [Zaveri et al., 2011]
5. Using Linked Data to build an Observatory of societal progress indicators, Journalof Web Semantics (2014) [Zaveri et al., 2014b]
6. Publishing and Interlinking the USPTO Patent Data, Semantic Web Journal(2014) [Zaveri et al., 2014a]
7. Quality assessment methodologies for Linked Data: A Survey, Semantic WebJournal (2014) [Zaveri et al., 2015]
8. Publishing and Interlinking the Global Health Observatory Dataset, SemanticWeb Journal (2013) [Zaveri et al., 2013b]
9. Towards Biomedical Data Integration for Analyzing the Evolution of Cognition, InProceedings of Ontology and Data in Life Sciences Workshop (ODLS 2013) [Za-veri et al., 2013c]
10. TripleCheckMate: A Tool for Crowdsourcing the Quality Assessment of LinkedData, In Proceedings of the 4th conference on Knowledge Engineering and Se-mantic Web, October 7 - 9 (KESW 2013) [Kontokostas et al., 2013]
11. Evaluating the disparity between active areas of biomedical research and theglobal burden of disease employing Linked Data and data-driven discovery, InProceedings of Ontologies in Biomedicine and Life Sciences Workshop (OBML2010) [Zaveri et al., 2010b]
12. Achieving high research reporting quality through the use of computational on-tologies, Neuroinformatics Journal (2010) [Zaveri et al., 2010a]
13. Center for Excellence in Research Reporting in Neurosurgery (CERR-N) - Achiev-ing high quality through the use of computational ontologies, Journal of Neuro-trauma (2009) [Zaveri et al., 2009]
125
A. Curriculum Vitae
Technical and Programming Skills
• Semantic Web: RDF, SPARQL, OntoWiki
• Databases: Oracle 9i, MySQL
• OS: Linux (Red Hat Certified)
• Misc: Technical writing, Scientific writing
Projects
• ReDD-Observatory:Project to evaluate the disparity between active areas of biomedical research andthe global burden of disease using Linked Data and data-driven discovery.Available at http://aksw.org/Projects/ReDDObservatory.html.
• User-driven quality evaluation of DBpedia:Evaluating the quality of the resources present in DBpedia employing Linked Dataexperts.Available at http://aksw.org/Projects/DBpediaDQ.html.
• Crowdsourcing DBpedia Quality Assessment:Evaluating the quality of DBpedia using crowdsourcing platforms.Available at http://aksw.org/Projects/DBpediaDQCrowd.html.
• Publishing and Interlinking the Global Health Observatory Dataset:Converting, interlinking and publishing the Global Health Observatory data, pro-vided by WHO, as Linked Data.Available at http://aksw.org/Projects/GHO.html.
• Publishing and Interlinking the USPTO Patent Data:Converting, interlinking and publishing the USPTO Patent data, as Linked Data.Available at http://aksw.org/Projects/USPatents.html.
Research Community Service
• Guest co-editor for International Journal on Semantic Web and InformationSystems’ (IJSWIS) Special Issue on Web Data Qualityhttp://www.ijswis.org/?q=node/45
• Program Committee/Reviewer for:
– Conferences: International Semantic Web Conference (ISWC), InternationalConference on Web Engineering (ICWE), Knowledge Engineering and Se-mantic Web (KESW)
126
– Workshops: Linked Data on the Web (LDOW), Ontologies in Biomedicineand Life Sciences (OBML), International Workshop on Linked Science(LISC), Crowdsourcing the Semantic Web (CrowdSem), Human-SemanticWeb Interaction (HSWI), Linked Data Quality (LDQ)
– Journals: International Journal on Semantic Web and Information Systems(IJSWIS), Semantic Web Journal (SWJ), International Journal of Knowledgeand Learning (IJKL)
Presentations
• 2 SEPT 2014, LDQ Presentation on “Methodology for Assessment of Linked DataQuality: A Framework” http://www.slideshare.net/amrapalijz/ldq2014-dq-methodology
• 24 OCT 2013, ISWC Presentation on “Using Linked Data to evaluate the impactof Research and Development in Europe: a Structural Equation Model” http://www.slideshare.net/amrapalijz/iswc2013-az
• 8 OCT 2013, KESW CONFERENCE Presentation on “TripleCheckMate: Atool for Crowdsourcing the Quality Assessment of Linked Data” http://www.slideshare.net/amrapalijz/triplecheckmate
• 5 OCT 2013, RUSSIAN SCHOOL OF OPEN DATA Presentation on Linked Datahttp://opendataschool.ru/2013/09/third-lesson/
• 2 OCT 2013, KESW SCHOOL Lecture on basic and advanced SPARQL http://slidewiki.org/deck/750_semantic-data-web-lecture-series
• 16 SEPT 2013, ODLS Presentation on “Towards Biomedical Data Integrationfor Analyzing the Evolution of Cognition” http://www.slideshare.net/amrapalijz/cogevo-odls-presentation
• 5 SEPT 2013, I-SEMANTICS Presentation on “User-driven Quality Evaluation ofDBpedia” http://www.slideshare.net/amrapalijz/i-semantics-d-bpediadq
• 3 SEPT 2012, W3C HEALTH CARE LIFE SCIENCE GROUP Presentation onReDD-Observatory http://goo.gl/prSs9
• 27 AUG 2012, W3C HEALTH CARE LIFE SCIENCE GROUP Presentation onGlobal Health Observatory http://goo.gl/UUlJc
• 18 - 22 OCT 2010, BRAZILIAN CONGRESS ON HEALTH INFORMATICS Tutorialon Computational Ontologies and Linked Data http://researchonresearch.duhs.duke.edu/site/?page_id=4722
127
A. Curriculum Vitae
• 9 - 10 SEPT 2010, WORKSHOP ON ONTOLOGIES IN BIOMEDICINE AND LIFE
SCIENCES Evaluating the Disparity between Active Areas of Biomedical Re-search and the Global Burden of Disease Employing Linked Data and Data-driven Discovery https://wiki.imise.uni-leipzig.de/Gruppen/OBML/Workshops/2010en
• 1 SEPT 2010, W3C’S LINKED OPEN DRUG DATA GROUP Conversion of GHOdataset to RDF using SCOVO vocabulary http://esw.w3.org/images/8/89/Amrapali_Zaveri_PPT.pdf
• SEPT 2009, JOINT SYMPOSIUM OF INTERNATIONAL AND NATIONAL NEURO-TRAUMA SOCIETIES Poster titled “Center for Excellence in Research Reportingin Neurosurgery (CERR-N) – achieving high quality through the use of computa-tional ontologies” http://www.neurotrauma.org/2009/
• DEC 2006, INTERNATIONAL CONFERENCE ON BIOINFORMATICS (INCOB)Poster titled “TB Gateway – a comprehensive database on TB – achieving highquality through the use of computational ontologies” http://www.incob2006.in
Language Skills
• Gujrathi: Native
• English: Advanced
• German: Intermediate (Niveau stufe C1 Certified)
• Familiar with Hindi and Marathi.
128
List of Abbreviations
AFR Adolescent Fertility Rate, pp. 98, 100, 106, 108
MTurk Amazon Mechanical Turk, pp. IV, 7, 9, 21, 51, 66, 67, 69, 72, 112, 117, 119
BR Birth Rate, pp. 99, 106, 108
CFA Confirmatory Factor Analysis, pp. 95, 104–106, 132
CFI Comparative Fit Index, pp. 95, 106, 132
DALY Disability Adjusted Life Years, p. 92
DBMS Relational Database Management System, p. 20
DR Death Rate, pp. 99, 105, 108
EFA Exploratory Factor Analysis, pp. 92, 95, 104, 105, 119
ESDA Exploratory Spatial Data Analysis, p. 95
GDP Gross Domestic Product, pp. 94, 96, 99, 104, 106–108
GHO Global Health Observatory, pp. 90–92
HEP Health Expenditure Public, pp. 99, 108
HER Health Economic Research, pp. IV, 6, 8, 10, 89, 96, 109, 119
HET High-technology Export, pp. 99, 104–108
HIT Human Intelligent Tasks, pp. 51, 52, 67, 72, 74–77, 80
IDPT Immunization DPT, pp. 99, 108
IM Immunization Measles, pp. 99, 108
ITB Incidence of Tuberculosis, p. 99
LD Linked Data, pp. III, IV, VII–IX, 1–10, 21, 49, 51, 52, 54–56, 58–60, 62, 64–70, 72,74–78, 80–82, 84, 86, 88–90, 96, 98, 109, 111–113, 117–121, 131, 133
129
A. Curriculum Vitae
LISA Local Indicators of Spatial Association, p. 96
LOD Linked Open Data, pp. 61, 75, 111
MDR-TB Multi-drug-resistant tuberculosis, pp. 3, 120
MR Mortality Rate, pp. 99, 108
OWL Web Ontology Language, pp. 12, 18, 19
PSE Public Spending on Education, p. 100
RDF Resource Description Framework, pp. VII, 7, 8, 11–16, 18–20, 52, 55, 60, 66, 68,69, 72–74, 81, 92, 97, 98, 112, 119, 131, 133
RDFS Resource Description Framework Schema, pp. 18, 19
RGDP Research and Development Expenditure, p. 100
RMSEA Root Mean Square Error of Approximation, pp. 95, 106, 132
R&D Research and Development, pp. 89–91, 93, 94, 97, 105–108, 110, 134
RRP Researchers in R&D, p. 100
SEM Structural Equation Modeling, pp. 89–95, 100, 104, 110, 119
SIR SCImago Institutions Rankings, p. 98
SPARQL SPARQL Protocol and RDF Query Language, pp. 7, 8, 11, 19, 20, 53, 61,96–98, 101
SRMR Standardized Root Mean Square Residual, pp. 95, 106, 132
TLI Tucker-Lewis Index, pp. 95, 106, 132
UMLS Unified Medical Language System, p. 91
URI Uniform Resource Identifier, pp. 11, 12, 14, 15, 20, 73, 101, 110
URL Uniform Resource Locator, pp. 11, 12
USPTO United States Patent and Trademark Office, pp. 92, 96, 97, 101–104, 110, 119,132
W3C World Wide Web consortium, pp. 11, 18, 19
WHO World Health Organization, p. 3
WWW World Wide Web, p. 1
130
List of Tables
2.1. Sample RDF statements. . . . . . . . . . . . . . . . . . . . . . . . . . . . 14
3.1. List of the selected papers. . . . . . . . . . . . . . . . . . . . . . . . . . . 223.2. Data quality metrics related to accessibility dimensions (type QN refers
to a quantitative metric, QL to a qualitative one). . . . . . . . . . . . . . . 253.3. Data quality metrics related to intrinsic dimensions (type QN refers to a
quantitative metric, QL to a qualitative one). . . . . . . . . . . . . . . . . 313.4. Data quality metrics related to intrinsic dimensions (type QN refers to a
quantitative metric, QL to a qualitative one). . . . . . . . . . . . . . . . . 323.5. Data quality metrics related to contextual dimensions (type QN refers to
a quantitative metric, QL to a qualitative one). . . . . . . . . . . . . . . . 393.6. Data quality metrics related to contextual dimensions (continued) (type
QN refers to a quantitative metric, QL to a qualitative one). . . . . . . . 403.7. Data quality metrics related to representational dimensions (type QN
refers to a quantitative metric, QL to a qualitative one). . . . . . . . . . . 443.8. Occurrences of the 18 data quality dimensions in each of the included
approaches. . . . . . . . . . . . . . . . . . . . . . . . . . . . . . . . . . . . 50
4.1. Data quality dimensions, categories and sub-categories identified in theDBpedia resources. Detectable (column D) means problem detectioncan be automized. Fixable (column F) means the issue is solvable byamending either the extraction framework (E), the mappings wiki (M) orWikipedia (W). The last column marks the dataset specific subcategories. 58
4.2. Overview of the manual quality evaluation. . . . . . . . . . . . . . . . . . 624.3. Detected number of problem for each of the defined quality problems.
IT = Incorrect triples, DR = Distinct resources, AT = Affected triples. . 634.4. Results of the semi-automatic evaluation. The table shows the total
number of properties that have been suggested to have the given char-acteristic by Step I of the semi-automatic methodology, the numberof properties that would lead to at least one violation when applyingthe characteristic, the number of properties where the characteristic ismeaningful (manually evaluated) and some metrics for the number ofviolations. . . . . . . . . . . . . . . . . . . . . . . . . . . . . . . . . . . . . 64
5.1. Comparison between the proposed approaches to crowdsource LD qual-ity assessment. . . . . . . . . . . . . . . . . . . . . . . . . . . . . . . . . . 69
5.2. Overall results in each type of crowdsourcing approach. . . . . . . . . . 77
131
List of Tables
5.3. Inter-rater agreement and precision values achieved with the imple-mented approaches. . . . . . . . . . . . . . . . . . . . . . . . . . . . . . . 77
5.4. Frequency of data types in the crowdsourced triples. . . . . . . . . . . . 79
7.1. Results of assessing the quality of the LinkedCT dataset for the 2010and 2013 versions. * These values are errors reported per 100,000 triples.101
7.2. Results of assessing the quality of USPTO Linked Patents, Scimago andWorldBank datasets. . . . . . . . . . . . . . . . . . . . . . . . . . . . . . . 102
7.3. Descriptions and abbreviations used for each of the 11 observed variablesbelonging to each of the latent variables of the SEM. . . . . . . . . . . . 104
7.4. CFA Fit Indicators and their respective measurements for all the fourmodels. Model C is adopted in this study. The measurements are: (i)X2/Df (P-valor): chi-square (ii) Root Mean Square Error of Approxima-tion: values inferior to 0.08 are considered as acceptable fit and 0.05 asa adequate fit; (iii) TLI: acceptable fit with values superior to 0.90; (iv)Comparative Fit Index: values superior to 0.90 are accepted as adequatefit and 0.95 as good fit and (v) Standardized Root Mean Square Residual 106
8.1. Comparison of quality assessment tools according to several attributes. . 1148.2. Comparison of quality assessment tools according to several attributes. . 114
132

List of Figures
1.1. The life science Linked Data Web. . . . . . . . . . . . . . . . . . . . . . . 21.2. Overview of the thesis structure. . . . . . . . . . . . . . . . . . . . . . . . 9
2.1. RDF statement represented as a directed graph. . . . . . . . . . . . . . . 132.2. Small knowledge base about Amrapali Zaveri represented as a graph. . . 152.3. Sample N-Triples format. . . . . . . . . . . . . . . . . . . . . . . . . . . . 152.4. Sample RDF/XML format. . . . . . . . . . . . . . . . . . . . . . . . . . . 162.5. Sample N3 format. . . . . . . . . . . . . . . . . . . . . . . . . . . . . . . . 162.6. Excerpt of the DBpedia ontology. . . . . . . . . . . . . . . . . . . . . . . 172.7. OWL representation of a part of an ontology in N-Triples format. . . . . 192.8. SPARQL query to get the homepage of Amrapali Zaveri’s current project. 20
3.1. Linked Data quality dimensions and the relations between them. Thedimensions marked with ‘*’ are specific for Linked Data. . . . . . . . . . 48
4.1. Workflow of the data quality assessment methodology. . . . . . . . . . . 54
5.1. Workflow of the applied Linked Data quality assessment methodology. . 705.2. Screenshot of the TripleCheckMate crowdsourcing data quality assess-
ment tool. . . . . . . . . . . . . . . . . . . . . . . . . . . . . . . . . . . . . 715.3. Incorrect/incomplete object value: The crowd must compare the DB-
pedia and Wikipedia values and decide whether the DBpedia entry iscorrect or not for a given subject and predicate. . . . . . . . . . . . . . . 73
5.4. Incorrect link: The crowd must decide whether the content from anexternal web page is related to the subject. . . . . . . . . . . . . . . . . . 74
5.5. True positives (TP) and false positives (FP) per data type in each crowd-sourcing method. . . . . . . . . . . . . . . . . . . . . . . . . . . . . . . . . 79
5.6. Analysis of true and false positives in “Incorrect data type” task. . . . . 79
7.1. Network display of correlations between the variables added to dataanalysis. Proximity of the nodes (circles) and edges thickness (lines)indicate correlation level, with closer nodes and thicker edges beenstronger correlations. . . . . . . . . . . . . . . . . . . . . . . . . . . . . . . 105
133
List of Figures
7.2. Structural equation model of the influence of R&D on economic andhealthcare performance. Values on the arrows connecting latent variablesare the path coefficients and indicate the effects weight. Positive andnegative signs indicate the reciprocity of the relation, thus positive valuesshow proportional modulation while negative values indicate inverserelations. . . . . . . . . . . . . . . . . . . . . . . . . . . . . . . . . . . . . . 107
7.3. Exploratory spatial analysis by country through local indicators of spa-tial association (LISA) univariate analysis: cluster formation accordingto hindex (R&D) rate. Countries with high Moran’s I values are sur-rounded by countries which also have high variable values (high/high),in this case 15 countries. Similarly, regions with low variable values aresurrounded by neighbors, which also have low variable values (low/low),in this case 0. . . . . . . . . . . . . . . . . . . . . . . . . . . . . . . . . . . 108
7.4. Moran’s diagram of dispersion (bivariate analysis). Analysis of Eco-nomic and General Health Outcome variables of each country (X axis)with the weighted average hindex of the neighbor countries (Y axis). . . 109
134
Bibliography[Acosta et al., 2013] Acosta, M., Zaveri, A., Simperl, E., Kontokostas, D., Auer, S., and
Lehmann, J. (2013). Crowdsourcing linked data quality assessment. In Alani, H.,Kagal, L., Fokoue, A., Groth, P., Biemann, C., Parreira, J. X., Aroyo, L., Noy, N.,Welty, C., and Janowicz, K., editors, Proceedings of the 12th International SemanticWeb Conference, (ISWC), volume 8219 of Lecture Notes in Computer Science, pages260–276. Springer Berlin Heidelberg.
[Adams, 1990] Adams, J. D. (1990). Fundamental stocks of knowledge and productivitygrowth. Journal of Political Economy, 4:673–702.
[Albertoni and Perez, 2013] Albertoni, R. and Perez, A. G. (2013). Assessing linksetquality for complementing third-party datasets. In Guerrini, G., editor, Proceed-ings of the joint International Conference on Extending Database Technology andInternational Conference on Database Theory (EDBT/ICDT), pages 52–59. ACM.
[Anselin, 2010] Anselin, L. (2010). Geographical information systems: principles,techniques, management and applications - Chapter 17. Interactive techniques andexploratory spatial data analysis. Wiley: New York.
[Anselin et al., 2010] Anselin, L., Syabri, I., and Kho, Y. (2010). Geoda: An introduc-tion to spatial data analysis. In Fischer, M. M. and Getis, A., editors, Handbook ofApplied Spatial Analysis, pages 73–89. Springer Berlin Heidelberg.
[Auer and Lehmann, 2007] Auer, S. and Lehmann, J. (2007). What Have Innsbruckand Leipzig in Common? Extracting Semantics from Wiki Content. In Franconi, E.,Kifer, M., and May, W., editors, Proceedings of the 4th European conference on TheSemantic Web: Research and Applications (ESWC), volume 4519 of Lecture Notes inComputer Science, pages 503–517. Springer Berlin Heidelberg.
[Auer et al., 2010] Auer, S., Weidl, M., Lehmann, J., Zaveri, A., and Choi, K.-S. (2010).I18n of Semantic Web Applications. In The Semantic Web – ISWC 2010 (ISWC),volume 6497 of Lecture Notes in Computer Science, pages 1–16. Springer BerlinHeidelberg.
[Baader et al., 2003] Baader, F., Diageo, C., McGuinness, D., Nardi, D., and Patel-Schneider, P., editors (2003). The Description Logic Handbook: Theory, Implementa-tion and Applications. Cambridge University Press New York, NY, USA.
[Batini and Scannapieco, 2006] Batini, C. and Scannapieco, M. (2006). Data Quality:Concepts, Methodologies and Techniques. Springer-Verlag New York, Inc.
135
Bibliography
[Bechhofer et al., 2004] Bechhofer, S., van Harmelen, F., Hendler, J., Horrocks, I.,McGuinness, D. L., Patel-Schneider, P. F., and Stein, L. A. (2004). OWL WebOntology Language Reference. Technical report, World Wide Web Consortium.http://www.w3.org/TR/owl-ref/.
[Beckett, 2004] Beckett, D. (2004). RDF/XML syntax specification (revised). W3Crecommendation, World Wide Web Consortium. http://www.w3.org/TR/2004/REC-rdf-syntax-grammar-20040210/.
[Berners-Lee, 2006] Berners-Lee, T. (2006). Linked data - design issues.http://www.w3.org/DesignIssues/LinkedData.html.
[Berners-Lee and Connolly, 2011] Berners-Lee, T. and Connolly, D. (2011). Notation3(N3): A readable RDF syntax. Technical report, World Wide Web Consortium.http://www.w3.org/TeamSubmission/n3/.
[Berners-Lee et al., 2001] Berners-Lee, T., Hendler, J., and Lassila, O. (2001). TheSemantic Web. Scientific American, 284(5):34–43.
[Bernstein et al., 2010] Bernstein, M. S., Little, G., Miller, R. C., Hartmann, B., Acker-man, M. S., Karger, D. R., Crowell, D., and Panovich, K. (2010). Soylent: a wordprocessor with a crowd inside. In Proceedings of the 23nd annual ACM symposiumon User interface software and technology (UIST), pages 313–322, New York, NY,USA. ACM.
[Bessette, 2003] Bessette, R. W. (2003). Measuring the economic impact of university-based research. Journal of Technology Transfer, 28(3-4):355–361.
[Bishop et al., 2011] Bishop, B., Kiryakov, A., Ognyanoff, D., Peikov, I., Tashev, Z.,and Velkov, R. (2011). OWLIM: A family of scalable semantic repositories. SemanticWeb, 2(1):1–10.
[Bizer, 2007] Bizer, C. (2007). Quality-Driven Information Filtering in the Context ofWeb-Based Information Systems. PhD thesis, Freie Universitat Berlin.
[Bizer and Cyganiak, 2009] Bizer, C. and Cyganiak, R. (2009). Quality-driven infor-mation filtering using the WIQA policy framework. Journal of Web Semantics,7(1):1–10.
[Bleiholder and Naumann, 2008] Bleiholder, J. and Naumann, F. (2008). Data fusion.ACM Computing Surveys (CSUR), 41(1):1.
[Bohm et al., 2010] Bohm, C., Naumann, F., Abedjan, Z., Fenz, D., Grutze, T., Hefen-brock, D., Pohl, M., and Sonnabend, D. (2010). Profiling linked open data withProLOD. In IEEE International Conference on Data Engineering (ICDE), pages175–178. IEEE.
136
Bibliography
[Bollen, 2000] Bollen, K. A. (2000). Structural Equations with Latent Variables. WileySeries in Probability and Mathematical Statistics.
[Bonatti et al., 2011] Bonatti, P. A., Hogan, A., Polleres, A., and Sauro, L. (2011). Ro-bust and scalable linked data reasoning incorporating provenance and trust annotations.Journal of Web Semantics, 9(2):165–201.
[Bonito et al., 2005] Bonito, A. J., Eicheldinger, C. R., and Lenfestey, N. F. (2005).Health disparities: Measuring health care use and access for racial/ethnic populations.Technical report, RTI International.
[Boyce et al., 2014] Boyce, R. D., Ryan, P. B., Noren, G. N., Schuemie, M. J., Reich,C., Duke, J., Nicholas, and Tatonetti, P. (2014). Bridging islands of informationto establish an integrated knowledge base of drugs and health outcomes of interest.Drug Safety, 37(7).
[Brickley and Guha, 2004] Brickley, D. and Guha, R. V. (2004). RDF vocabulary de-scription language 1.0: RDF schema. Technical report, World Wide Web Consortium.http://www.w3.org/TR/2004/REC-rdf-schema-20040210/.
[Broekstra et al., 2002] Broekstra, J., Kampman, A., and van Harmelen, F. (2002).Sesame: A generic architecture for storing and querying RDF and RDF schema.In Horrocks, I. and Hendler, J., editors, The Semantic Web — ISWC 2002 (ISWC),volume 2342 of Lecture Notes in Computer Science, pages 54–68. Springer BerlinHeidelberg.
[Buhmann and Lehmann, 2012] Buhmann, L. and Lehmann, J. (2012). Universal OWLaxiom enrichment for large knowledge bases. In ten Teije, A., Volker, J., Handschuh,S., Stuckenschmidt, H., d’Acquin, M., Nikolov, A., Aussenac-Gilles, N., and Her-nandez, N., editors, Knowledge Engineering and Knowledge Management (EKAW),volume 7603 of Lecture Notes in Computer Science, pages 57–71. Springer BerlinHeidelberg.
[Cafarella et al., 2008] Cafarella, M. J., Halevy, A. Y., Wang, D. Z., Wu, E., and Zhang,Y. (2008). WebTables: exploring the power of tables on the web. Proceedings of theVLDB Endowment, 1(1):538–549.
[Carroll, 2003] Carroll, J. J. (2003). Signing RDF graphs. In Fensel, D., Sycara, K.,and Mylopoulos, J., editors, The Semantic Web - ISWC 2003 (ISWC), volume 2870 ofLecture Notes in Computer Science, pages 369–384. Springer Berlin Heidelberg.
[Cary P. Gross and Powe, 1999] Cary P. Gross, G. F. A. and Powe, N. R. (1999). TheRelation between Funding by the Ntaional Institute of Health and the Burden ofDiseases. The New England Journal of Medicine, 340(1881-1887).
[Chen and Garcia, 2010] Chen, P. and Garcia, W. (2010). Hypothesis generation anddata quality assessment through association mining. In 9th IEEE InternationalConference on Cognitive Informatics (ICCI), pages 659–666. IEEE.
137
Bibliography
[Clark et al., 2008] Clark, K. G., Feigenbaum, L., and Torres, E. (2008). SPARQLProtocol for RDF. World Wide Web Consortium, Recommendation REC-rdf-sparql-protocol-20080115. http://www.w3.org/TR/rdf-sparql-protocol/.
[Costello and Osborne, 2005] Costello, A. B. and Osborne, J. W. (2005). Best practicesin exploratory factor analysis: Four recommendations for getting the most from youranalysis. Practical Assessment Research and Evaluation, 10(7).
[Daraio et al., 2011] Daraio, C., Bonaccorsi, A., Geuna, A., Lepori, B., Bach, L.,Bogetoft, P., Cardoso, M. F., Castro-Martinez, E., Crespi, G., de Lucio, I. F., Fried,H., Garcia-Aracil, A., Inzelt, A., Jongbloed, B., Kempkes, G., Llerena, P., Matt, M.,Olivares, M., Pohl, C., Raty, T., Rosa, M. J., Sarrico, C. S., Simar, L., Slipersaeter,S., Teixeira, P. N., and Eeckaut, P. V. (2011). The european university landscape:A micro characterization based on evidence from the Aquameth project. ResearchPolicy, 40(1):148 – 164.
[Dave and Berners-Lee, 2011] Dave, D. and Berners-Lee, T. (2011). Turtle - TerseRDF Triple Language. Technical report, World Wide Web Consortium. http://www.w3.org/TeamSubmission/turtle/.
[Demartini et al., 2012] Demartini, G., Difallah, D., and Cudre-Mauroux, P. (2012).Zencrowd: Leveraging probabilistic reasoning and crowdsourcing techniques forlarge-scale entity linking. In 21st International Conference on World Wide Web(WWW), pages 469–478. ACM.
[Dezani-Ciancaglini et al., 2012] Dezani-Ciancaglini, M., Horne, R., and Sassone, V.(2012). Tracing where and who provenance in linked data: A calculus. TheoreticalComputer Science, 464:113–129.
[Ding and Finin, 2006] Ding, L. and Finin, T. (2006). Characterizing the semantic webon the web. In Cruz, I., Decker, S., Allemang, D., Priest, C., Schwabe, D., Mika,P., Uschold, M., and Aroyo, L., editors, The Semantic Web - ISWC 2006 (ISWC),volume 4273 of Lecture Notes in Computer Science, pages 242–257. Springer BerlinHeidelberg.
[Druck et al., 2004] Druck, S., Carvalho, M. S., Camara, G., and Monteiro, A. M. V.(2004). Spatial analysis of geographic data. EMBRAPA.
[Erling and Mikhailov, 2009] Erling, O. and Mikhailov, I. (2009). RDF support in thevirtuoso DBMS. In Pellegrini, T., Auer, S., Tochtermann, K., and Schaffert, S., editors,Networked Knowledge - Networked Media, volume 221 of Studies in ComputationalIntelligence, pages 7–24. Springer Berlin Heidelberg.
[Feeney et al., 2014] Feeney, K. C., O’Sullivan, D., Tai, W., and Brennan, R. (2014).Improving curated web-data quality with structured harvesting and assessment. Inter-national Journal on Semantic Web and Information Systems, 10(2):35–62.
138
Bibliography
[Flemming, 2011] Flemming, A. (2011). Qualitatsmerkmale von linked data-veroffentlichenden datenquellen. Master’s thesis, Humboldt-Universitat zu Berlin,Institut fur Informatik.
[Fox, 2006] Fox, J. (2006). Structural Equation Models. Technical report, R CRANPackages.
[Furber and Hepp, 2011] Furber, C. and Hepp, M. (2011). SWIQA - a semantic webinformation quality assessment framework. In Tuunainen, V. K., Rossi, M., and Nand-hakumar, J., editors, Proceedings of the 19th European Conference on InformationSystems (ECIS), volume 15, pages 19–30. IEEE Computer Society.
[Gamble and Goble, 2011] Gamble, M. and Goble, C. (2011). Quality, trust, and utilityof scientific data on the web: Towards a joint model. In Proceedings of the 3rdInternational Web Science Conference (WebSci), pages 1–8. ACM.
[Gil and Artz, 2007] Gil, Y. and Artz, D. (2007). Towards content trust of web resources.Web Semantics, 5(4):227 – 239.
[Gil and Ratnakar, 2002] Gil, Y. and Ratnakar, V. (2002). Trusting information sourcesone citizen at a time. In Proceedings of the First International Semantic Web Con-ference on The Semantic Web (ISWC), Lecture Notes in Computer Science, pages162–176. Springer Berlin Heidelberg.
[Gillum et al., 2011] Gillum, L. A., Gouveia, C., Dorsey, E. R., Pletcher, M., Mathers,C. D., McCulloch, C. E., and Johnston, S. C. (2011). NIH Disease Funding Levelsand Burden of Disease. PLoS One.
[Golbeck, 2006] Golbeck, J. (2006). Using trust and provenance for content filtering onthe semantic web. In Finin, T., Kagal, L., and Olmedilla, D., editors, Proceedings ofthe Workshop on Models of Trust on the Web, at the 15th World Wide Web conference(WWW).
[Golbeck et al., 2003] Golbeck, J., Parsia, B., and Hendler, J. (2003). Trust networkson the semantic web (cia). In Klusch, M., Omicini, A., Ossowski, S., and Laamanen,H., editors, Cooperative Information Agents VII, volume 2782 of Lecture Notes inComputer Science, pages 238–249. Springer Berlin Heidelberg.
[Grant and Beckett, 2004] Grant, J. and Beckett, D. (2004). RDF test cases. W3Crecommendation, World Wide Web Consortium. http://www.w3.org/TR/rdf-testcases/.
[Gross, 2012] Gross, J. (2012). nortest: Tests for normality. Technical report, R CRANPackages.
[Gueret et al., 2012a] Gueret, C., Groth, P., Stadler, C., and Lehmann, J. (2012a). As-sessing linked data mappings using network measures. In Simperl, E., Cimiano, P.,
139

Bibliography
Polleres, A., Corcho, O., and Presutti, V., editors, The Semantic Web: Research andApplications (ESWC), volume 7295 of Lecture Notes in Computer Science, pages87–102. Springer Berlin Heidelberg.
[Gueret et al., 2012b] Gueret, C., Groth, P. T., Stadler, C., and Lehmann, J. (2012b).Assessing linked data mappings using network measures. In Simperl, E., Cimiano,P., Polleres, A., Corcho, O., and Presutti, V., editors, The Semantic Web: Researchand Applications (ESWC), volume 7295 of Lecture Notes in Computer Science, pages87–102. Springer Berlin Heidelberg.
[Hair et al., 2012] Hair, J. F., Sarstedt, M., Ringle, C. M., and Mena, J. A. (2012).An assessment of the use of partial least squares structural equation modeling inmarketing research. Journal of the Academy of Marketing Science, 40(3):414–433.
[Halpin et al., 2010] Halpin, H., Hayes, P., McCusker, J. P., McGuinness, D., andThompson, H. S. (2010). When owl:sameAs isn’t the Same: An Analysis of Identityin Linked Data. In Patel-Schneider, P. F., Pan, Y., Hitzler, P., Mika, P., Zhang, L., Pan,J. Z., Horrocks, I., and Glimm, B., editors, The Semantic Web – ISWC 2010 (ISWC),volume 6496 of Lecture Notes in Computer Science, pages 305–320. Springer BerlinHeidelberg.
[Hanushek and Woessmann, 2010] Hanushek, E. and Woessmann, L. (2010). Educa-tion and economic growth. Elsevier.
[Harris and Seaborne, 2013] Harris, S. and Seaborne, A., editors (2013). SPARQL 1.1Query Language. World Wide Web Consortium. Available at http://www.w3.org/TR/2013/REC-sparql11-query-20130321/.
[Hartig, 2008] Hartig, O. (2008). Trustworthiness of data on the web. In STI Berlin andCSW PhD Workshop, Berlin, Germany.
[Hartig and Zhao, 2009] Hartig, O. and Zhao, J. (2009). Using web data provenancefor quality assessment. In Freire, J., Missier, P., and Sahoo, S. S., editors, Proceed-ings of the 1st International Workshop on the Role of Semantic Web in ProvenanceManagement (SWPM) at ISWC, volume 526 of CEUR Workshop Proceedings.
[Hasan and Tucci, 2010] Hasan, I. and Tucci, C. (2010). The innovation-economicgrowth nexus: Global evidence. Research Policy.
[Hays et al., 2005] Hays, R. D., Revicki, D., and Coyne, K. S. (2005). Applicationof Structural Equation Modeling to Health Outcomes Research. Eval Health Prof,28(3):295–309.
[Heath and Bizer, 2011] Heath, T. and Bizer, C. (2011). Linked Data: Evolving the Webinto a Global Data Space (1st edition). Synthesis Lectures on the Semantic Web:Theory and Technology. Morgan & Claypool.
140
Bibliography
[Heflin, 2004] Heflin, J. (2004). OWL Web Ontology Language Use Cases and Re-quirements. Technical report, World Wide Web Consortium. http://www.w3.org/TR/webont-req/.
[Henderson et al., 1998] Henderson, R., Jaffe, A., and Trajtenberg, M. (1998). Universi-ties as a source of commercial technology: a detailed analysis of university patenting,1965-1988. Review of Economics and Statistics, pages 119–127.
[Hogan et al., 2010] Hogan, A., Harth, A., Passant, A., Decker, S., and Polleres, A.(2010). Weaving the Pedantic Web. In Bizer, C., Heath, T., Berners-Lee, T., andHausenblas, M., editors, 3rd Linked Data on the Web (LDOW) Workshop at WWW,volume 628, Raleigh, North Carolina, USA. CEUR Workshop Proceedings.
[Hogan et al., 2012] Hogan, A., Umbrich, J., Harth, A., Cyganiak, R., Polleres, A., andDecker, S. (2012). An empirical survey of linked data conformance. Journal of WebSemantics, 14:14–44.
[Hornik, 2008] Hornik, K. (2008). The R project: A language and environment forstatistical computing. http://www.r-project.org/.
[Howe, 2006] Howe, J. (2006). The rise of crowdsourcing. Wired Magazine, 14(6).
[Hox, 1998] Hox, J. (1998). An intorduction to Structureal Equation Modeling. FamilyScience Review, 11:354–373.
[Jacobi et al., 2011] Jacobi, I., Kagal, L., and Khandelwal, A. (2011). Rule-based trustassessment on the semantic web. In Proceedings of the 5th international conferenceon Rule-based reasoning, programming, and applications (RuleML), pages 227–241.Springer Berlin Heidelberg.
[Jarke et al., 2010] Jarke, M., Lenzerini, M., Vassiliou, Y., and Vassiliadis, P. (2010).Fundamentals of Data Warehouses. Springer Publishing Company, 2nd edition.
[Jentzsch et al., 2009] Jentzsch, A., Hassanzadeh, O., Bizer, C., Andersson, B., andStephens, S. (2009). Enabling tailored therapeutics with linked data. In Proceedingsof the WWW workshop on Linked Data on the Web (LDOW).
[Juran, 1974] Juran, J. (1974). The Quality Control Handbook. McGraw-Hill, NewYork.
[Kilpelainen et al., 2012] Kilpelainen, K., Tuomi-Nikula, A., Thelen, J., Gissler, M.,Sihvonen, A.-P., kramers, P., and Aromaa, A. (2012). Health indicators in europe:availability and data needs. The European Journal of Public Health.
[Kitchenham, 2004] Kitchenham, B. (2004). Procedures for performing systematicreviews. Technical report, Joint Technical Report Keele University Technical ReportTR/SE-0401 and NICTA Technical Report 0400011T.1.
141
Bibliography
[Kline, 1994] Kline, P. (1994). An Easy Guide to Factor Analysis. Routledge, London.
[Kline, 2011] Kline, R. B. (2011). Principles and Practice of Structural EquationModeling. The Guilford Press, New York.
[Knuth et al., 2012] Knuth, M., Hercher, J., and Sack, H. (2012). Collaborativelypatching linked data. In Proceedings of the 2nd International Workshop on UsageAnalysis and the Web of Data (USEWOD).
[Kontokostas et al., 2014] Kontokostas, D., Westphal, P., Auer, S., Hellmann, S.,Lehmann, J., Cornelissen, R., and Zaveri, A. (2014). Test-driven Evaluation ofLinked Data Quality. In Proceedings of the 23rd International Conference on WorldWide Web (WWW), pages 747–758. ACM.
[Kontokostas et al., 2013] Kontokostas, D., Zaveri, A., Auer, S., and Lehmann, J.(2013). TripleCheckMate: A Tool for Crowdsourcing the Quality Assessment ofLinked Data. In Klinov, P. and Mouromtsev, D., editors, Knowledge Engineeringand the Semantic Web (KESW), volume 394 of Communications in Computer andInformation Science, pages 265–272. Springer Berlin Heidelberg.
[Korkmaz, 2013] Korkmaz, S. (2013). Multivariate normality tests. Technical report, RCRAN Packages.
[Kreis, 2011] Kreis, P. (2011). Design of a Quality Assessment Framework for theDBpedia Knowledge Base. Master’s thesis, Freie Universitat Berlin.
[Krejcie and Morgan, 1970] Krejcie and Morgan (1970). Determining sample size forresearch activities. Educational and Psycholoigcal Measurement, 30:607–610.
[Lab, 2012] Lab, S. (2012). SCImago institutions rankings. Technical report, SCImagoResearch Group.
[Labra Gayo et al., 2012] Labra Gayo, J. E., Kontokostas, D., and Auer, S. (2012).Multilingual linked open data patterns. Semantic Web Journal.
[Larsen and von Ins, 2010] Larsen, P. O. and von Ins, M. (2010). The rate of growth inscientific publication and the decline in coverage provided by Science Citation Index.Scientometrics, 84(3):575–603.
[Lehmann, 2009] Lehmann, J. (2009). DL-Learner: learning concepts in descriptionlogics. Journal of Machine Learning Research, 10:2639–2642.
[Lehmann et al., 2009] Lehmann, J., Bizer, C., Kobilarov, G., Auer, S., Becker, C.,Cyganiak, R., and Hellmann, S. (2009). DBpedia - a crystallization point for the webof data. Journal of Web Semantics, 7(3):154–165.
142
Bibliography
[Lehmann and Buhmann, 2010] Lehmann, J. and Buhmann, L. (2010). ORE - A Toolfor Repairing and Enriching Knowledge Bases. In Patel-Schneider, P. F., Pan, Y.,Hitzler, P., Mika, P., Zhang, L., Pan, J. Z., Horrocks, I., and Glimm, B., editors, TheSemantic Web – ISWC 2010 (ISWC), volume 6497 of Lecture Notes in ComputerScience, pages 177–193. Springer Berlin Heidelberg.
[Lehmann and Hitzler, 2010] Lehmann, J. and Hitzler, P. (2010). Concept learningin description logics using refinement operators. Machine Learning journal, 78(1-2):203–250.
[Lehmann et al., 2014] Lehmann, J., Isele, R., Jakob, M., Jentzsch, A., Kontokostas, D.,Mendes, P. N., Hellmann, S., Morsey, M., van Kleef, P., Auer, S., and Bizer, C. (2014).DBpedia - A Large-scale, Multilingual Knowledge Base Extracted from Wikipedia.Semantic Web Journal.
[Lei et al., 2007a] Lei, Y., Nikolov, A., Uren, V., and Motta, E. (2007a). DetectingQuality Problems in Semantic Metadata without the Presence of a Gold Standard. InWorkshop on “Evaluation of Ontologies for the Web” (EON) at the WWW, volume329 of CEUR Workshop Proceedings, pages 51–60.
[Lei et al., 2007b] Lei, Y., Uren, V., and Motta, E. (2007b). A framework for evaluatingsemantic metadata. In 4th International Conference on Knowledge Capture (KCAP),number 8 in K-CAP ’07, pages 135 – 142. ACM.
[Leo Pipino and Rybold, 2005] Leo Pipino, Ricahrd Wang, D. K. and Rybold, W.(2005). Developing Measurement Scales for Data-Quality Dimensions, volume 1.M.E. Sharpe, New York.
[Mansfield, 1995] Mansfield, E. (1995). Academic research underlying industrial inno-vations: sources, characteristics, and financing. Review of Economics and Statistics.
[Markotschi and Volker, 2010] Markotschi, T. and Volker, J. (2010). GuessWhat?! -Human Intelligence for Mining Linked Data. In Proceedings of the Workshop onKnowledge Injection into and Extraction from Linked Data (KIELD) at EKAW.
[Maynard et al., 2006] Maynard, D., Peters, W., and Li, Y. (2006). Metrics for eval-uation of ontology-based information extraction. In Workshop on “Evaluation ofOntologies for the Web” (EON) at WWW.
[Mendes et al., 2012a] Mendes, P., Bizer, C., Miklos, Z., Calbimonte, J.-P., Moraru, A.,and Flouris, G. (2012a). D2.1: Conceptual model and best practices for high-qualitymetadata publishing. Technical report, PlanetData Deliverable.
[Mendes et al., 2012b] Mendes, P., Muhleisen, H., and Bizer, C. (2012b). Sieve: Linkeddata quality assessment and fusion. In Proceedings of the joint International Confer-ence on Extending Database Technology and International Conference on DatabaseTheory (EDBT/ICDT) workshops, pages 116–123. ACM.
143
Bibliography
[Moher et al., 2009] Moher, D., Liberati, A., Tetzlaff, J., Altman, D. G., and PRISMAGroup (2009). Preferred reporting items for systematic reviews and meta-analyses:the PRISMA statement. PLoS medicine, 6(7).
[Morsey et al., 2012] Morsey, M., Lehmann, J., Auer, S., Stadler, C., and Hellmann,S. (2012). DBpedia and the Live Extraction of Structured Data from Wikipedia.Program: electronic library and information systems, 46:27.
[Mostafavi et al., 2004] Mostafavi, M., G., E., and Jeansoulin, R. (2004). Ontology-based method for quality assessment of spatial data bases. In International Symposiumon Spatial Data Quality (ISSDQ), volume 4, pages 49–66.
[Murray et al., 2004] Murray, C. J. L., Lopez, A. D., and Wibulpolprasert, S. (2004).Monitoring global health: time for new solutions. BMJ.
[Naumann, 2002] Naumann, F. (2002). Quality-Driven Query Answering for IntegratedInformation Systems, volume 2261 of Lecture Notes in Computer Science. Springer-Verlag.
[Orr, 1998] Orr, K. (1998). Data quality and systems theory. Communications of theACM, 41(2):66–71.
[Paulheim and Bizer, 2014] Paulheim, H. and Bizer, C. (2014). Improving the qualityof linked data using statistical distributions. International Journal on Semantic Weband Information Systems.
[Perobelli and Haddad, 2006] Perobelli, F. S. and Haddad, E. A. (2006). Inter-statecommerce patterns in brazil, 1985 to 1997. Rev Econ Contempo.
[Peterson et al., 2012] Peterson, D., Gao, S. S., Malhotra, A., Sperberg-McQueen,C. M., and Thompson, H. S., editors (2012). W3C XML Schema Definition Language(XSD) 1.1 Part 2: Datatypes. W3C Recommendation. World Wide Web Consortium.http://www.w3.org/TR/xmlschema11-2/.
[Phillips and Davis, 2009] Phillips, A. and Davis, M., editors (2009). Tags for Identify-ing Languages. Number 5646 in Request for Comments. Internet Engineering TaskForce. Available at http://tools.ietf.org/rfc/bcp/bcp47.txt.
[Pipino et al., 2002] Pipino, L. L., Lee, Y. W., and Wang, R. Y. (2002). Data qualityassessment. Communications of the ACM, 45(4):211–218.
[Prud’hommeaux and Seaborne, 2008] Prud’hommeaux, E. and Seaborne, A. (2008).SPARQL query language for RDF. W3C recommendation, World Wide Web Consor-tium. http://www.w3.org/TR/rdf-sparql-query/.
[R Core Team, 2014] R Core Team (2014). R: A Language and Environment for Statis-tical Computing. R Foundation for Statistical Computing, Vienna, Austria.
144

Bibliography
[Redman, 1997] Redman, T. C. (1997). Data Quality for the Information Age. ArtechHouse, 1st edition.
[Ruckhaus et al., 2014] Ruckhaus, E., Baldizan, O., and Vidal, M.-E. (2014). AnalyzingLinked Data Quality with LiQuate. In On the Move to Meaningful Internet Systems:(OTM) 2013 Workshops, volume 8186, pages 629–638. Lecture Notes in ComputerScience.
[Rula et al., 2012] Rula, A., Palmonari, M., and Maurino, A. (2012). Capturing the Ageof Linked Open Data: Towards a Dataset-independent Framework. In IEEE SixthInternational Conference on Semantic Computing (ICSC), pages 218–225. IEEEComputer Society.
[Sarasua et al., 2012] Sarasua, C., Simperl, E., and Noy, N. (2012). CrowdMap: Crowd-sourcing Ontology Alignment with Microtasks. In Cudre-Mauroux, P., Heflin, J.,Sirin, E., Tudorache, T., Euzenat, J., Hauswirth, M., Parreira, J. X., Hendler, J.,Schreiber, G., Bernsteina, A., and Blomqvist, E., editors, The Semantic Web – ISWC2012 (ISWC), volume 7649 of Lecture Notes in Computer Science, pages 525–541.Springer Berlin Heidelberg.
[Schafer, 2008] Schafer, J. L. (2008). Norm package for R, version 3. Technical report,The Methodology Center, The Pennsylvania State University.
[Schermelleh-Engel et al., 2003] Schermelleh-Engel, K., Moosbrugger, H., and Muller,H. (2003). Evaluating the fit of structural equation models: Test of significance anddescriptive goodness-of-fit measures. Methods of Psychological Research Online,8(2):23–74.
[Schlotthauer et al., 2008] Schlotthauer, A. E., Badler, A., Cook, S. C., Perez, D. J., andChin, M. H. (2008). Evaluating interventions to reduce health care disparities: anRWJF program. Health Affairs, 27:568–73.
[Shekarpour and Katebi, 2010] Shekarpour, S. and Katebi, S. (2010). Modeling andevaluation of trust with an extension in semantic web. Web Semantics: Science,Services and Agents on the World Wide Web, 8(1):26 – 36.
[Stats Package, 2013] Stats Package, T. R. (2013). Mahalanobis distance. Technicalreport, R Documentation.
[Thaler et al., 2011] Thaler, S., Siorpaes, K., and Simperl, E. (2011). SpotTheLink: AGame for Ontology Alignment. In Proceedings of the 2011 ACM Symposium onApplied Computing, pages 1711–1712. ACM.
[Tramp et al., 2010] Tramp, S., Heino, N., Auer, S., and Frischmuth, P. (2010). RDFau-thor: Employing RDFa for Collaborative Knowledge Engineering. In Cimiano, P. andPinto, H., editors, Knowledge Engineering and Management by the Masses (EKAW),volume 6317 of Lecture Notes in Computer Science, pages 90–104. Springer BerlinHeidelberg.
145
Bibliography
[van Hage et al., 2014] van Hage, W. R., Kauppinen, T., Graeler, B., Davis, C., Hoek-sema, J., Ruttenberg, A., and Bahls, D. (2014). SPARQL Package, v1.6. R Foundationfor Statistical Computing.
[Wand and Wang, 1996] Wand, Y. and Wang, R. Y. (1996). Anchoring data qualitydimensions in ontological foundations. Communications of the ACM, 39(11):86–95.
[Wang et al., 2012] Wang, J., Kraska, T., Franklin, M. J., and Feng, J. (2012). CrowdER:crowdsourcing entity resolution. Proceedings of the VLDB Endowment, 5(11):1483–1494.
[Wang and Strong, 1996] Wang, R. Y. and Strong, D. M. (1996). Beyond accuracy:what data quality means to data consumers. Journal of Management InformationSystems, 12(4):5–33.
[Westphal et al., 2014] Westphal, P., Stadler, C., and Lehmann, J. (2014). Qualityassurance of RDB2RDF mappings. Technical report, Department of ComputerScience, University of Leipzig. Available at http://svn.aksw.org/papers/2014/report_QA_RDB2RDF/public.pdf.
[Wienand and Paulheim, 2014] Wienand, D. and Paulheim, H. (2014). Detecting Incor-rect Numerical Data in DBpedia. In Presutti, V., d’Amato, C., Gandon, F., d’Acquin,M., Staab, S., and Tordai, A., editors, The Semantic Web: Trends and Challenges(ISWC), volume 8465 of Lecture Notes in Computer Science, pages 504–518. SpringerBerlin Heidelberg.
[Wikipedia, 2013] Wikipedia (2013). SPARQL — Wikipedia, The Free Encyclopedia.[Online; accessed 31-March-2013].
[Williams et al., 2012] Williams, A. J., Harland, L., Groth, P., Pettifer, S., Chichester,C., Willighagen, E. L., Evelo, C. T., Blomberg, N., Ecker, G., CaroleGoble, andMons, B. (2012). Open PHACTS: semantic interoperability for drug discovery. DrugDiscovery Today, 17(21-22):1188–1198.
[World Wide Web Consortium, 2004] World Wide Web Consortium (2004). ResourceDescription Framework (RDF). http://www.w3.org/RDF/.
[World Wide Web Consortium, 2009] World Wide Web Consortium (2009). W3C Se-mantic Web Activity. http://www.w3.org/2001/sw/.
[Yu, 2007] Yu, L. (2007). Introduction to Semantic Web and Semantic Web services.Chapman & Hall/CRC, Boca Raton, FL.
[Zaveri et al., 2010a] Zaveri, A., Cofiel, L., Shah, J., Pradhan, S., Chan, E., Dameron,O., Pietrobon, R., and Ang, B. T. (2010a). Achieving high research reporting qualitythrough the use of computational ontologies. Neuroinformatics, 8(4):261–271.
146
Bibliography
[Zaveri et al., 2014a] Zaveri, A., Hassan, M. M., Yousef, T., Auer, S., and Lehmann,J. (2014a). Publishing and Interlinking the USPTO Patent Data (Under review).Semantic Web Journal, http://www.semantic-web-journal.net/content/publishing-and-interlinking-uspto-patent-data.
[Zaveri et al., 2013a] Zaveri, A., Kontokostas, D., Sherif, M. A., Buhmann, L., Morsey,M., Auer, S., and Lehmann, J. (2013a). User-driven quality evaluation of DBpedia.In Sabou, M., Blomqvist, E., Noia, T. D., Sack, H., and Pellegrini, T., editors,Proceedings of the 9th International Conference on Semantic Systems (ICSS), pages97–104. ACM.
[Zaveri et al., 2013b] Zaveri, A., Lehmann, J., Auer, S., Hassan, M. M., Sherif, M. A.,and Martin, M. (2013b). Publishing and Interlinking the Global Health ObservatoryDataset. Semantic Web Journal, Special Call for Linked Dataset descriptions(3):315–322.
[Zaveri et al., 2013c] Zaveri, A., Nowick, K., and Lehmann, J. (2013c). TowardsBiomedical Data Integration for Analyzing the Evolution of Cognition. In GI-Jahrestagung’13, pages 1900–1907.
[Zaveri et al., 2011] Zaveri, A., Pietrobon, R., Auer, S., Lehmann, J., Martin, M., andErmilov, T. (2011). ReDD-Observatory: Using the Web of Data for Evaluating theResearch-Disease Disparity. In Boissier, O., Benatallah, B., Papazoglou, M. P., Ras,Z. W., and Hacid, M., editors, Proc. of the IEEE/WIC/ACM International Conferenceon Web Intelligence (ICWI), pages 178–185. IEEE Computer Society.
[Zaveri et al., 2010b] Zaveri, A., Pietrobon, R., Ermilov, T., Martin, M., Heino, N., andAuer, S. (2010b). Evaluating the disparity between active areas of biomedical researchand the global burden of disease employing linked data and data-driven discovery. InH.Herre, R.Hoehndorf, J.Kelso, and S.Schulz, editors, Ontologien in Biomedizin undLebenswissenschaften (OBML) 2010 Workshop Proceedings, Mannheim.
[Zaveri et al., 2015] Zaveri, A., Rula, A., Maurino, A., Pietrobon, R., Lehmann, J., andAuer, S. (2015). Quality Assessment Methodologies for Linked Data: A Survey.Semantic Web Journal.
[Zaveri et al., 2009] Zaveri, A., Shah, J., Pradhan, S., Ang, B. T., and Pietrobon, R.(2009). Center for Excellence in Research Reporting in Neurosurgery (CERR-N)- Achieving high quality through the use of computational ontologies. Journal ofNeurotrauma, 26(8).
[Zaveri et al., 2013d] Zaveri, A., Vissoci, J. R. N., Daraio, C., and Pietrobon, R. (2013d).Using Linked Data to Evaluate the Impact of Research and Development in Europe:A Structural Equation Model. In Alani, H., Kagal, L., Fokoue, A., Groth, P., Biemann,C., Parreira, J. X., Aroyo, L., Noy, N., Welty, C., and Janowicz, K., editors, 12thInternational Semantic Web Conference (ISWC), volume 8219 of Lecture Notes inComputer Science, pages 244–259. Springer Berlin Heidelberg.
147
Bibliography
[Zaveri et al., 2014b] Zaveri, A., Vissoci, J. R. N., Westphal, P., Junior, J. R. N., de An-drade, L., Daraio, C., and Lehmann, J. (2014b). Using Linked Data to Build anObservatory of Societal Progress indicators Leveraging on Data Quality (UnderReview). Journal of Web Semantics.
148
Selbstandigkeitserklarung
Hiermit erklare ich, die vorliegende Dissertation selbstandig und ohne unzulassigefremde Hilfe angefertigt zu haben. Ich habe keine anderen als die angefuhrten Quellenund Hilfsmittel benutzt und samtliche Textstellen, die wortlich oder sinngema ausveroffentlichten oder unveroffentlichten Schriften entnommen wurden, und alle Angaben,die auf mundlichen Auskunften beruhen, als solche kenntlich gemacht. Ebenfalls sindalle von anderen Personen bereitgestellten Materialien oder erbrachten Dienstleistungenals solche gekennzeichnet.
Leipzig, den 11.5.2015
Amrapali Zaveri
149