linking competitiveness with equity and sustainability
TRANSCRIPT

EUROPEAN RURAL DEVELOPMENT NETWORK
UNIVERSITY OF DEBRECEN
CENTRE OF AGRICULTURAL SCIENCES AND ENGINEERINGFACULTY OF AGRICULTURAL ECONOMICS AND RURAL DEVELOPMENT
Rural areas and development – vol. 7Editor Andrew Fieldsend
Linking competitiveness with equity and sustainability: new ideas for the socio-economic development of rural areas
WARSAW 2010
Meeting supported by:
Faculty of Applied Economics and Rural Development,University of Debrecen
Editor:
Andrew FieldsendUniversity of Debrecen Centre of Agricultural Sciences and Engineering (DE-AMTC)Böszörményi út 138.4032 Debrecen, Hungary
Reviewers:
Antal József, DebrecenAndrew Fieldsend, DebrecenZbigniew Florianczyk, WarsawKatonáné Kovács Judit, DebrecenNagy Géza, DebrecenJulia Neuwirth, ViennaVladimir Székely, BratislavaDan Marius Voicilas, BucharestKlaus Wagner, Vienna
PUBLISHED by the University of Debrecen Centre of Agricultural Sciences and Engineering and Institute of Agricultural and Food Economics - National Research Institute
COPYRIGHT by the University of Debrecen Centre of Agricultural Sciences and Engineering and Institute of Agricultural and Food Economics - National Research Institute
The opinions expressed in the individual papers are the sole responsibility of the authors
The book collects scientific papers presented during the conference “Linking competitiveness with equity and sustainability: new ideas for the socio-economic development of rural areas”, held on 29-30 October 2009 in Debrecen, organised by the University of Debrecen Centre of Agricultural Sciences and Engineering (DE-AMTC) in cooperation with ERDN. The conference was kindly supported by the International Visegrad Fund, the Ministry of Agriculture and Rural Development of the Republic of Hungary, the National Office for Research and Technology and the Faculty of Agricultural Economics and Rural Development of DE-AMTC.
Prepared for print byAndrew Fieldsend (DE-AMTC) Krzysztof Kossakowski (IAFE-NRI)
ISBN 978-83-7658-196-5Meeting supported by:
International Visegrad Fund
Meeting supported by:
Ministry of Agriculture and Rural Development, Hungary Meeting supported by:
National Office for Research and Technology

Contents
Introduction to the volume . . . . . . . . . . . . . . . . . . . . . . . . . . . . . . . . . . . .5
Johanna Schockemöhle, Kalmárné Hollósi Erika, Cser JánosRural Action Learning - promoting competences and strengthening participation . . . . . . . . . . . . . . . . . . . . . . . . . . . . . . . . . . . . . . . . . . . . 7
Konrad Ł. Czapiewski, Zbigniew Florianczyk, Krzysztof JancAgricultural knowledge and rural economy - analysis on micro and macro scales . . . . . . . . . . . . . . . . . . . . . . . . . . . . . . . . . . . . . . . . . . . 25
Krisztina Melinda Dobay, Ioan Sebastian Brumă, Lucian Tanasă, Camelia Apetroaie
Increasing community social capital in north-eastern rural Romania . . . . . . . . .. . . . . . . . . . . . . . . . . . . . . . . . . . . . . . . . . . . . . . 37
Toivo Muilu, Niina KotavaaraNetworking rural expertise. . . . . . . . . . . . . . . . . . . . . . . . . . . . . . . . .51
Monica Tudor, Marius VoicilasInnovation and real labour force in rural areas as a basis of future rural development . . . . . . . . . . . . . . . . . . . . . . . . . . . . . . . . . . . . . . . 67
Ryszard KamińskiInvestment in social infrastructure in rural areas – does it support the development of social capital? . . . . . . . . . . . . . . . . . . . . . . . . . . . . . 83
Antonin Vaishar, Milada Šťastná, Zdenka LipovskáPossibilities of development in regions after mining: restoration of ru-ral environment in the Czech-Saxon borderland. . . . . . . . . . . . . . . . 93
Vladimir SzékelyTourism clusters as a tool for the improvement of rural competitive-ness: first experiences from Slovakia . . . . . . . . . . . . . . . . . . . . . . . 119
Dorota Klepacka-KołodziejskaDoes Less Favoured Areas Measure support sustainability of Europe-an rurality? The Polish experience . . . . . . . . . . . . . . . . . . . . . . . . 121

Oksana KlebanProblems of effective use of physical capital in agricultural enterpris-es of Ukraine . . . . . . . . . . . . . . . . . . . . . . . . . . . . . . . . . . . . . . . . . 135
Pekka Jokinen, Marja Järvelä, Ari Paloviita, Antti PuupponenDo local food supply chains meet the targets of sustainable liveli-hood? A case study in Central Finland . . . . . . . . . . . . . . . . . . . . . . 141
Marta BłądPluriactivity of farming families - old phenomenon in new times. . 155
Marcin Żekało, Krysztof ZmarzłowskiDiversification of economic effects of milk production in selected group of organic and conventional farms in Poland in 2006-2007 . . . . . . . . . . . . . . . . . . . . . . . . . . . . . . . . . . . . . . . . . . . . . . . . . . . . . . . .167
Jan W. Owsinski, Marcin AndrzejewskiRural municipalities in Poland: development types, paths and per-spectives . . . . . . . . . . . . . . . . . . . . . . . . . . . . . . . . . . . . . . . . . . . . . 177
Monika Stannay, Adam CzarneckiLevel and determinants of sustainable rural development in the Re-gion of Green Lungs of Poland. . . . . . . . . . . . . . . . . . . . . . . . . . . . 197
Karl M. Ortner, Julia Neuwirth, Klaus WagnerEconomic effects of the Common Agricultural Policy on employment in Austria . . . . . . . . . . . . . . . . . . . . . . . . . . . . . . . . . . . . . . . . . . . . . 213
Ryszard Kata, Dariusz ZającThe impact of farmers’ relationships with the institutions on the in-come of agricultural holdings in Poland . . . . . . . . . . . . . . . . . . . . 225
Mudri György, Ligetvári Ferenc, Gyöngyössy KálmánThe role of networking in the rural economy. . . . . . . . . . . . . . . . . . . . . . . . . . . . . . . . . . . . . . . . . . . . . . . . . . . . . . . . . . . . . . . . . . . . . . . . . . .233
Matej Bedrač, Tomaž Cunder“Leader” approach and local development strategies in Slovenia . . . . . . . . . . . . . . . . . . . . .. . . . . . . . . . . . . . . . . . . . . . . . . . . . . . . . . . . . . 245
Pakurar Miklós, Olah JuditWhy do we need a more locally focused rural employment policy in the EU?. . . . . . . . . . . . . . . . . . . . . . . . . . . . . . . . . . . . . . . . . . . . . . 257

Introduction to the volume
The seventh volume within the series published by European Rural Develop-ment Network (ERDN) comprises the papers of the seventh ERDN confer-ence held in Debrecen in October 2009. The University of Debrecen Centre of Agricultural Sciences and Engineering, Faculty of Agricultural Economics and Rural Development – organised the conference. Researchers from Aus-tria, Czech Republic, Finland, Germany, Hungary, Poland, Romania, Slova-kia, Slovenia and Ukraine, representing several disciplines of rural develop-ment, presented the results of their recent studies.
The main topic of the conference was “Linking competitiveness with equity and sustainability: new ideas for the socio-economic development of rural areas”. It aimed at stimulating theoretical and empirical contributions to the various functions of agriculture and rural areas to picture the importance of multifunctionality. The broad range of different research fields and a great number of different regions and nations of participants provided an inspiring atmosphere offering new insights, ideas and collaborations. International co-operation is of utmost importance, because new ideas and common strategies needed for a more effective rural development can only be generated by mu-tual support and the exchange of knowledge and experiences across national borders.
Over the past decade of the second pillar of the EU’s Common Agricultural Policy a large number of specially tailored bundles of measures have been of-fered to address a wide variety of sector- and region-specific problems in rural areas. These measures include support for farmers to improve their commer-cial and competitive situation, environmental measures to protect the qual-ity of soil as well as ground and surface water resources, specialized nature protection measures and efforts to improve economic diversity in rural areas – beyond the focus on agricultural production.
The Conference was organised into four subtopics:• Assessment of multifunctionality• New alternatives of income in agriculture, forestry and rural areas• Sustainability in rural areas• Effects of rural development policy

Due to the high number of interested researchers, limited time and financial re-sources it was not possible to consider all received abstracts as paper presenta-tions. Therefore a poster section gave extended possibilities for contributions. We would like to take this opportunity to thank the authors for their efforts in preparing the articles presented during the conference, the referees for their contribution in evaluation and preparation of the volume and the audience for its valuable comments and discussion during the conference. Special thanks have to be given to the Polish ERDN team for guidance and advice in organ-ising the conference, publishing the volume and keeping ERDN lively and relevant as a researcher’s network.
The editor

Johanna Schockemöhle1, Kalmárné Hollósi Erika2, Cser János3
1 University of Vechta, Institute for Spatial Analysis and Planning in Areas of Intensive Agriculture (ISPA), Germany
[email protected] University of West-Hungary, Faculty of Agricultural and Food Sciences, Institute of Economic Sciences, Hungary
[email protected] University of West-Hungary, Faculty of Agricultural and Food Sciences, Institute of Advisory and Training, Hungary
Rural Action Learning – promoting competences and strengthening participationDevelopment, testing and evaluation of a new concept of out-of-school learning in the region
Abstract: On-site learning in the own region has a high educational potential, which should be utilised by promoting the participation of adults, young people and children at regional level. In order to reach this objective, the concept of Ru-ral Action Learning was developed, tested and evaluated in this research project. The evaluation results show that regional action-oriented learning promotes the identity formation and the acquisition of participatory competence. It contributes effectively to the participation at regional level with particular emphasis on an education for sustainable development. A two-group pre-test and post-test design was used to evaluate the effectiveness of Rural Action Learning. Participants in learning activities were asked to complete a questionnaire before and after the activity in order to detect changes in the characteristics of regional identity and participatory competence. In addition, interviews with organizers of learn-ing activities provided comprehensive data to identify factors that influence the effectiveness of these measures.
Keywords: regional learning; action learning; regional identity

Introduction
The motivation to develop, test and evaluate a new concept of regional learning outside normal school activity was based on two premises: on the one hand, the assumption that regional participation is necessary, and on the other, the conviction that participation must be promoted through education.
The first premise touches on the central idea of the concept of sustainable development. According to this, everybody should have the possibility of a fair share in material, natural and cultural goods - in both a narrow and gen-erational context. The implementation of this dual idea of fairness is tied to the preservation, improvement and re-establishment of natural fundamentals, for each of these forms the basis of a socioculturally equitable and economically secure existence, for both present and future generations. The realisation of this overall concept requires the involvement of all individuals in consider-ing and implementing innovative forms of living and working together. Such a participation in the sense of sustainable development needs to be understood in a multidimensional way: the participation cube makes clear the various stages, forms and areas (Figure 1). Thus, participation touches on both com-munity and individual actions, relates to societal as well as private life and encompasses various grades of involvement in the constitution of the living environment of the individual. The requirements for participation and for the results of such are democratic and constitutional structures which create space for self-determined thinking and action, as well as the acquirement of key competences (Rychen and Salganik 2003), which enable such self-determined thinking and action.
Figure 1. The participation cube: ways of individual participation in the constitution of the living environmentSource: Schockemöhle 2009, with reference to Abs
With regard to the second premise: unrestricted access to education and the orientation of education to the objective of enabling the participa-tion of each individual are indispensable steps towards sustainable de-
Johanna Schockem
öhle, Kalmárné H
ollósi Erika, Cser János

9velopment. Schools and universities represent as no other institutions the places of ‚public education‘ (Focali 2007, p. 153), in which hope for the improvement of both individual and collective circumstances is placed. At the same time, the objectives which schools in particular need to aspire towards are in many cases already formulated in the sense of Education for Sustainable Development (ESD) (c.f. DGFG 2007, KMK/DUK 2007, NAT 2003). However, there is often a lack of practical concepts which can deliver to both teachers and pupils the answers to the questions of ‘how’ and ‘what’ arising from the educational process.
In the field of research in environmental education, there has long been a discussion concerning tasks, contents and methods (Barrett et al. 2005, Harenberg and de Haan 1999, Jensen and Schnack 1997, Leal Filho 2005, Nagel et al. 2006, Reid et al. 2008, Rohwer 2000). The work presented in this paper is tied in with these aspects. Within this framework, a concept of education was developed, tested and evaluated which has the objective of pro-moting participation and which presents the necessary didactical tasks and challenges for its practical implementation.
The new concept carries the name ‘Rural Action Learning’. A central feature of the concept is the orientation towards action-oriented learning in the region which takes place outside the school. As regional places of learning, for exam-ple, agricultural or craft enterprises, locations on moorland, woodlands, water courses or business centres are used. The testing of Rural Action Learning takes place by means of various teaching goals which were developed based on the concept and were carried out at regional places of learning. Because the focus of the concept is on formal and non-formal learning, the teaching goals are set up with respect to children, young people and adults in schools and universities as well as other situations.
The evaluation study which follows on from the testing is intended to assess the effectiveness of the concept with regard to its objectives. In this case, participants in learning activities as well as the organizers of those measures (e.g. farmers, teachers, entrepreneurs) were questioned. The evaluation of the theoretically developed concept as an educational strategy for sustainable de-velopment was undertaken on the basis of these questionnaire results. The work presented here entered the field of empirical teaching and learning re-search with this remit. Because of its orientation towards the general principle of sustainable development, it is assigned to the research area of ESD.
Central features of Rural Action Learning
Rural Action Learning is an educational concept which was developed on the basis of regional learning in accordance with Salzmann et al. (1995) and ESD (Harenberg and de Haan 1999). The development, and the subsequent evalu-ation, was carried out using the following main criteria: objectives, contents, methods, original and medial encounter, didactical principles and organization
Rural Action Learning - prom
oting competences and strengthening participation

10
Johanna Schockem
öhle, Kalmárné H
ollósi Erika, Cser János
of the learning environment. The response of Rural Action Learning to these criteria is located in the field of tension between the conceptional differences and similarities of regional learning in accordance with Salzmann et al. (1995)on the one hand and ESD on the other.
Figure 2. Central features of Rural Action LearningSource: Schockemöhle 2009
The concept is aimed at promoting the regional identity and participatory competences of children, young people and adults. The conceptualisa-tion underlying these constructs is made clear through the model of the components of regional identity and participatory competence (Figure 2). Through the assignment to cognitive, affective and active levels, the components acquire a systematic relationship. The analytical definition of the concept of participatory competence reflected therein is oriented towards the corresponding competence model of Harenberg and de Haan (1999). In regard to the use of the term ‘regional identity’, it should be noted that this has already been the subject of a controversial discussion, particularly in the field of geography (Blotevogel et al. 1987, Danielzyk and Krüger 1990, Lalli 1989, Weichhart 1999). The work presented here interprets the term in the sense of spatially oriented identity as used by Weichhart (1990). In this way, it relates to one of the fundamental socio-psychological conceptions of identity, that is, personal identity or self-identity (Erikson 1989, Krappmann 1975). Regional identity is under-stood as a component of personal identity; it refers to the influence of spatial-physical circumstances on the development of identity and there-

11R
ural Action Learning - promoting com
petences and strengthening participationfore on knowledge, convictions, ways of thinking, values, norms, behav-iour patterns and actions which enable the individual to find orientation in social, ethical and physical space.
This focusing on the two main categories of participatory competence and regional identity can be justified in that taken together, they enable partici-pation (Harenberg and de Haan 1999, p. 20). A significant feature of Rural Action Learning now is that the acquisition of participatory competence and the building up of regional identity is not a precondition of successful par-ticipation. Rather, the concept is based on the assumption that both features develop and unfold only in regional participation, which can be integrated in various areas and forms as well as at different stages (Figure 1). Here it is as-sumed that there is a close interdependency between the creation of regional identity and the acquisition of participatory competence such that both factors mutually condition and strengthen each other in the process of regional par-ticipation. Thus, the building up of knowledge, conviction, ways of thinking, values and behavioural patterns, which according to Erikson (1989) constitute identity; imply as it were the acquisition of participatory competence. In addi-tion, participatory competence developed in such a way, along with regional identity, facilitates a continuation of the involvement in the formation of the individual‘s own local space (Figure 2). Therefore, Rural Action Learning promotes the testing of participation within the framework of learning activi-ties and in this way contributes to the future shaping of regions.
What are the consequences of the goals of Rural Action Learning on the relat-ed concept of the learning activities? In line with the main criteria for concept development referred to above, the following section will explore further the constitution and implementation of educational measures so that a picture of Rural Action Learning can be clearly sketched out.
In referring to Salzmann et al. (1995) and the central subject area of ESD, regional phenomena and characteristics relevant to sustainability invariably represent the starting point of the learning process. These can refer, for ex-ample, to subject areas such as regional materials and economic cycles, lo-cal transport, residential development and land use. The actual selection of contents is done by means of specific selection and control criteria (Figure 3).
In order to unfold the pedagogical potential of regional places of learning in out-of-school situations, action-oriented methods (beside the original en-counter and including problem, situational and system-oriented learning in an interdisciplinary context) are an indispensable element of Rural Action Learn-ing. To make this clear, the significant features of action-oriented learning according to Gudjons (2008) and Wöll (1998) are briefly listed here:
• Holistic learning;• Self-sufficiency and self-activity in learning;• Target-oriented and organised learning aligned to the creation of a
product of activity;

12
Johanna Schockem
öhle, Kalmárné H
ollósi Erika, Cser János
• Orientation to the experiences, interests and aptitudes of participants as well as their daily and future activity situations;
• Opening of the educational institution via learning to actual problem situations;
• Presentation and discussion of the product of activity in public or in the educational institution;
• Reflection over action goals, execution and consequences as well as their evaluation;
• Transfer of the achieved knowledge to situations in daily life or les-sons.
Regional set of problems as a starting point of the learning process
Criteria for the selection of contents Criteria for the
management of contents
Regionality and globality Are the contents suitable for demonstrating a relationship between regional and global conditions and processes?
Demonstrate the regional and global dimensions and their connection. The generality, in the sense of fundamental insights, must for regional specifics also be explicitly demonstrated, developed and carried over to new situations (at a global scale).
Time dimension Are the contents suitable for thematising outcomes of the past and present on future generations? Do the contents offer scope for various future perceptions?
Thematise future perceptions discussed in or relevant to society and stimulate personal debates over the future; discuss with regard to personal possibilities for participation. Make present and future significance transparent to the learner.
Ethical dimension Are the contents suitable for discussing the demands of equity in its regional and global significance? Are the contents suitable for thematising current lifestyles and their effects as well as generating new forms of living and working?
Critically question personal and societal values, norms and life styles; confront new and unusual ideals and ways of living and appraise them.
Dynamic dimension Are the contents suitable for showing the modification potential of an action field on the basis of changing needs? Do the contents offer access to open situations so that the value as well as the boundaries of scientific classification systems and understandings are observed?
Thematise changes to contents, the boundaries of scientific classification systems and changing needs based on changing life styles
Social, cultural, economic and ecological dimension Are the contents suitable for demonstrating for the four dimensions a sustainable development with respect to regional and societal interests, and for each, the competing and congruent interests of individual stakeholders?
Make the cross-linkage between the four dimensions relate to the contents in question. Reveal the differences and similarities in interests with respect to individual stakeholders and relate them to regional and societal interests. Thematise the main and secondary consequences of decisions or behaviour patterns.
Figure 3. Selection and management criteria with regard to the contents of Rural Action LearningSource: Schockemöhle 2009, referring to EDK 2007, p. 49
The action-oriented methods applied in Rural Action Learning are based on partner and group work as social forms and on various, for each target group properly selected forms of activity, such as exploration, project, learn-

13R
ural Action Learning - promoting com
petences and strengthening participationing stations, didactical games, experimentation or scenarios techniques. The implementation of the learning activity at the regional location such as a crafts enterprise or in a residential quarter of the town requires a duration of from three or four hours up to several days, plus time for preparation and follow-up processing.
The focus of Rural Action Learning on action-oriented methods has largely been mentioned and appraised by different authorities already as promising success and as being effective with respect to target setting (Dyment 2008, pp. 241 et seq., Hart 2008, pp. 19 et seq., Læssøe 2008, pp. 144 et seq., Nagel et al. 2006, p. 35; Schusler and Krasny 2008, pp. 268 et seq.). However, Meyer (2004, S. 80ff.) points out that the effectiveness of action-oriented learning has until now only been empirically investigated at a basic level. Within the framework of this project, therefore, empirically investigated statements on the effectiveness of action-orientation in Rural Action Learning will be made on the basis of the evaluation study.
Testing and evaluation of the concept
In order to test whether Rural Action Learning is able to effectively promote regional identity and participatory competence, there was a need for practical trialling. This took place within the EU project ‘ALICERA’ (Action Learning for Identity and Competence in European Rural Areas; Schockemöhle 2007, pp. 6-11) as a field trial, that is, in the practice of out-of-school regional learning. In the five participating European project regions - Brittany, Latvia, Lower Saxony, Tirol and West Hungary, learning activities were developed and carried out based on the didactical aims of the concept. The contents related to the subject of agriculture and food supply. The evaluation of randomly selected learning activities took place in the period of August 2006 to February 2007.
Underlying the evaluation was a complex evaluation design (Figure 4). The evaluation of effectiveness - the recording and assessment of data with regard to the effectiveness of learning activities - was carried out on the basis of a questionnaire study using a two-group pre-test and post-test plan. Participants in the learning activities were questioned immediately before an activity (point t1), immediately after the activity (t2) and then six months later (t3) using a questionnaire form in order to investigate changes at cognitive, affective and activity levels. The random selection of test persons was done by drawing them from a cluster sample, that is, in the participant project regions, a random selection of groups (e.g. school classes, recreational groups) was fully surveyed in the investigation period.
Because there were three different target groups for the survey - children (9-12 years), young people (13-16 years) and adults (17 years or older) - it was necessary in each case to design three age-specific questionnaires for the pre-

14 tests and post-tests. Additionally, experiment and control groups were set up for each age group. Here, participants in Rural Action Learning activities, characterised by a high degree of action orientation, made up the particular experiment groups. The control groups were recruited from participants in out-of-school regional learning projects with a very low level of action orientation. The groups were formed using the written information by the organizers of the educational measures in line with the central didactical guidelines which supported each evaluated measure in the form of a memo. In total, 2,134 participants were questioned.
Figure 4. Evaluation design of the evaluation studySource: Schockemöhle 2009, with reference to Bittner 2003
The questionnaire study also provided data for the concept evaluation. In this case, factors needed to be recorded and assessed which influenced the effectiveness of the activities. In order to get detailed and fundamental information on influencing factors, a parallel interview study was carried out. The interviews and the documentation were carried out by the author indicated on the first place; the evaluation of the data took place in adherence to intercoder reliability with two encoders.
The triangulative procedure was intended to produce data for the purpose of complementarity which would be mutually complementary and make a deeper interpretation possible. In all project regions, the organizers were questioned. The job of recruitment was facilitated through partner institutions
Johanna Schockem
öhle, Kalmárné H
ollósi Erika, Cser János
15R
ural Action Learning - promoting com
petences and strengthening participationwhich had good access to these groups via the offer of qualifications in the field of out-of-school, regional learning. In total, 18 people took part in the interview study.
Effectiveness of Rural Action Learning
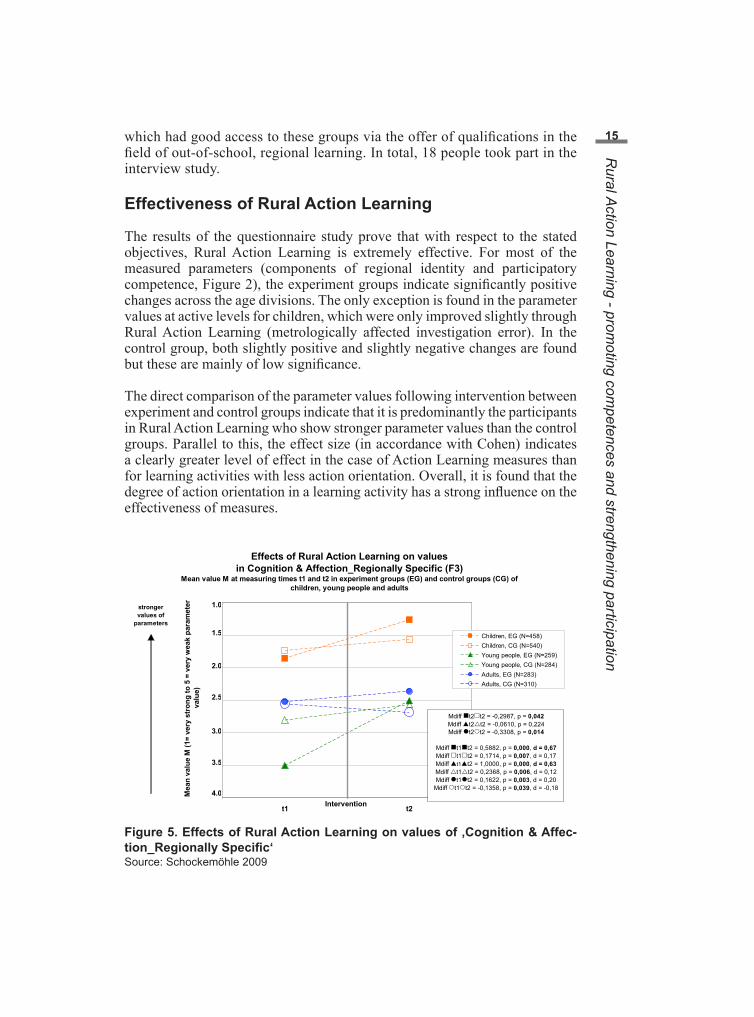
The results of the questionnaire study prove that with respect to the stated objectives, Rural Action Learning is extremely effective. For most of the measured parameters (components of regional identity and participatory competence, Figure 2), the experiment groups indicate significantly positive changes across the age divisions. The only exception is found in the parameter values at active levels for children, which were only improved slightly through Rural Action Learning (metrologically affected investigation error). In the control group, both slightly positive and slightly negative changes are found but these are mainly of low significance.
The direct comparison of the parameter values following intervention between experiment and control groups indicate that it is predominantly the participants in Rural Action Learning who show stronger parameter values than the control groups. Parallel to this, the effect size (in accordance with Cohen) indicates a clearly greater level of effect in the case of Action Learning measures than for learning activities with less action orientation. Overall, it is found that the degree of action orientation in a learning activity has a strong influence on the effectiveness of measures.
Effects of Rural Action Learning on valuesin Cognition & Affection_Regionally Specific (F3)
Mean value M at measuring times t1 and t2 in experiment groups (EG) and control groups (CG) of children, young people and adults
t1 t2
Mea
n va
lue
M (1
= ve
ry s
tron
g to
5 =
ver
y w
eak
para
met
er
valu
e)
Children, EG (N=458)Children, CG (N=540)Young people, EG (N=259)Young people, CG (N=284)Adults, EG (N=283)Adults, CG (N=310)
stronger values of
parameters
3.0
1.5
2.0
2.5
4.0
3.5
1.0
Intervention
Mdiff t2t2 = -0,2987, p = 0,042Mdiff pt2rt2 = -0,0610, p = 0,224Mdiff t2t2 = -0,3308, p = 0,014
Mdiff t1t2 = 0,5882, p = 0,000, d = 0,67Mdiff t1t2 = 0,1714, p = 0,007, d = 0,17Mdiff pt1pt2 = 1,0000, p = 0,000, d = 0,63Mdiff rt1rt2 = 0,2368, p = 0,006, d = 0,12Mdiff t1t2 = 0,1622, p = 0,003, d = 0,20
Mdiff t1t2 = -0,1358, p = 0,039, d = -0,18
Figure 5. Effects of Rural Action Learning on values of ‚Cognition & Affec-tion_Regionally Specific‘Source: Schockemöhle 2009

16 This statement will be substantiated using the example of the measured chang-es in the value of cognitive and affective parameters of regional identity (per-ception/recognition of the region, connection with the region; brought togeth-er in the test scale ’Cognition & Affection_Regionally Specific’, Cronbachs Alpha 0,860, 17 items) (Figure 5).
On the effectiveness of Rural Action Learning, the following hypothesis was stated: Effects hypothesis 1: Rural Action Learning brings about in the short-term stronger values in the parameter Cognition & Affection_Regionally Spe-cific than an out-of-school regional educational measure with a lower degree of action orientation (H1: M2 EG < M2 CG).
In describing the results according to Figure 3: the mean value (M) for chil-dren in the measuring period t2 was found in the experiment group (EG) to be M2 = 1.26 and in the control group (CG) to be M2 = 1.56. The difference amounts to Mdiff EG-CG = -0.2987 for an approximately equal starting value in the measuring period t1. This result is with probability p = 0.042 significant. The situation is different with the young people sample: with p = 0.224, no clear difference in the parameter values between experiment and control groups can be found. However, it should be noted here that there is no homo-geneity of variance between the experiment and control groups with regard to the variable. The Levene test is with p = 0.003 significant. The noticeably high standard deviation from SD = 1.28 in the experiment group and SD = 1.13 in the control group, plus the particularly high mean value difference in the measuring period t1 confirm similarly the variance heterogeneity. In order to be able to compare the extent of the effect of a measure from Rural Action Learning with an effect from a learning activity with less action orientation, the effect size d is calculated in accordance with Cohen. The results show that with d = 0.63, a large effect with Rural Action Learning in the case of young people can be proven, whereas in the control group, there was no appreciable effect with d = 0.12 (c.f. Bortz and Döring 2006, p. 627)..For the adult group, with p = 0.014 there is a significant mean value difference between the experiment group and the control group. It is striking here that in the control group, there is a higher mean value (M2 = 2.69) after the interven-tion compared to before the measures (M1 = 2.55), meaning that the educa-tional intervention had a counter-productive effect (interpreted as a negative attitude to the measure at the post-test in the period t2).
In summary, the effects hypothesis 1 can be accepted for participating children and adults, while for young people it must be rejected. For young people, a much greater effect can be established in the experiment group than in the control group.
Effects hypothesis 2: Participation in an educational measure under Rural Ac-tion Learning in the short term results in strong changes in the parameter Cog-nition & Affection_Regionally Specific (H1: M1 > M2).
Johanna Schockem
öhle, Kalmárné H
ollósi Erika, Cser János

17R
ural Action Learning - promoting com
petences and strengthening participationIn consideration of parameter changes in Cognition & Affection_Regionally Specific, highly significant results for the experiment groups can be proved in all samples: for children, the mean value changes from M1 = 1.8529 to M2 = 1.2647 (p = 0.000) and for young people, the mean value decreases from M1 = 3.5079 to M2 = 2.5079 (p = 0.000). For adults, the initial mean value of M1 = 2.5226 decreases to M2 = 2.3604 (p = 0.003). In all three target groups, therefore, Rural Action Learning results in stronger values in perception of the region and in regional connectedness. The effects hypothesis 2 is therefore accepted. In particular, the young people group responds especially well to the measures: with Mdiff = 1.00, this group shows the greatest parameter changes, although it should be noted that the parameter values prior to the measures were particularly weak. Here, the essential differences in the answer behav-iour before and after a learning activity, measured on the answer frequency per scale point, are found especially in the cognitive area. That is, in reference to statements about knowledge of the region, more answers move along the scale in the desired direction after the measures than in the case of statements about connectedness with the region. This is also true for the answer behav-iour of children and adults. In the affective segment, desired changes can also be achieved but these are at a lower level than in the cognitive area.
The influence of personal preconceptions
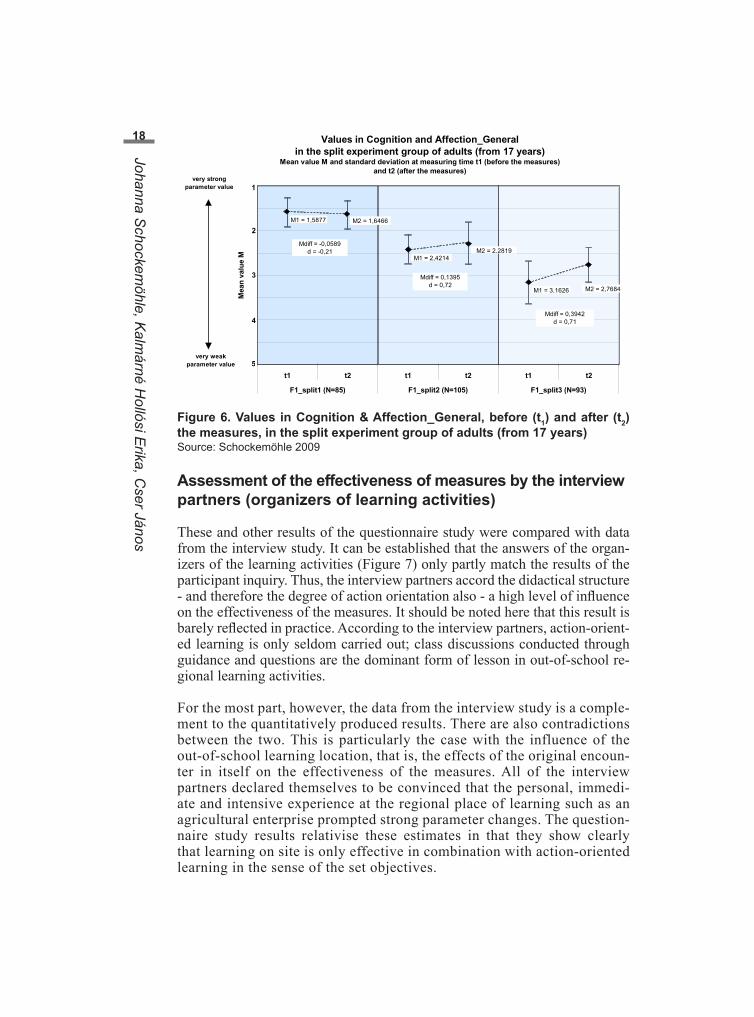
The personal preconceptions of the test subjects with reference to participa-tory competence and regional identity were recorded immediately before the measure in order to test whether the extent of the parameter values prior to the learning activity had an influence on the effectiveness of the measures. For this purpose, in each age group, the auxiliary variables X_split1, X_split2 and X_split3 are created. These variables are based on a frequency analysis. The splits have a threefold graduation and each contain the lower, middle and upper tercile of the particular experiment and control group, subject to a weak (split 3), middle (split 2) or strong (split 1) value in the corresponding variable on the part of the test subject. The quantitatively produced data stock clearly indicates that the strength of the parameter values which the participants show prior to a measure will exert a strong influence on the effectiveness of Action Learning activities. Thus, participants with middle to weak parameter values are far more effectively supported than participants who before the measures were already marked by a high participatory competence and strong regional identity. This relatively unsuccessful response from the ‚competent‘ partici-pants indicates that in this particular category of persons, only very minor positive parameter changes can be established following the measures and even negative parameter changes may be found (Figure 6). While it cannot be assumed that the educational measures themselves cause the loss or forfeiture of abilities, skills, attitudes etc. and with that, the weaker parameter values which were measured here, it is more likely that the measures induced bore-dom, discontentment and rejection by participants with the stronger values; this was reflected in the answer behaviour during the written inquiry.
18 Values in Cognition and Affection_Generalin the split experiment group of adults (from 17 years)
Mean value M and standard deviation at measuring time t1 (before the measures)and t2 (after the measures)
t1 t2 t1 t2 t1 t2
F1_split1 (N=85) F1_split2 (N=105) F1_split3 (N=93)
Mea
n va
lue
M
very weak parameter value
very strong parameter value
5
2
3
4
1
M1 = 3,1626
M1 = 2,4214
M1 = 1,5877
M2 = 2,7684
M2 = 2,2819
M2 = 1,6466
Mdiff = 0,3942d = 0,71
Mdiff = 0,1395d = 0,72
Mdiff = -0,0589d = -0,21
Figure 6. Values in Cognition & Affection_General, before (t1) and after (t2) the measures, in the split experiment group of adults (from 17 years)Source: Schockemöhle 2009
Assessment of the effectiveness of measures by the interview partners (organizers of learning activities)
These and other results of the questionnaire study were compared with data from the interview study. It can be established that the answers of the organ-izers of the learning activities (Figure 7) only partly match the results of the participant inquiry. Thus, the interview partners accord the didactical structure - and therefore the degree of action orientation also - a high level of influence on the effectiveness of the measures. It should be noted here that this result is barely reflected in practice. According to the interview partners, action-orient-ed learning is only seldom carried out; class discussions conducted through guidance and questions are the dominant form of lesson in out-of-school re-gional learning activities.
For the most part, however, the data from the interview study is a comple-ment to the quantitatively produced results. There are also contradictions between the two. This is particularly the case with the influence of the out-of-school learning location, that is, the effects of the original encoun-ter in itself on the effectiveness of the measures. All of the interview partners declared themselves to be convinced that the personal, immedi-ate and intensive experience at the regional place of learning such as an agricultural enterprise prompted strong parameter changes. The question-naire study results relativise these estimates in that they show clearly that learning on site is only effective in combination with action-oriented learning in the sense of the set objectives.
Johanna Schockem
öhle, Kalmárné H
ollósi Erika, Cser János

19R
ural Action Learning - promoting com
petences and strengthening participation
Figure 7. Factors which exert influence on the effectiveness of measures ac-cording to statements from interview partnersSource: Schockemöhle 2009, referring to EDK 2007, p. 49
Evaluation of the concept Rural Action Learning
On the basis of the evaluation results and with the aid of the criteria for con-cept development, an evaluation of the concept is presented here. Statements will be made as to whether the theoretically conceived concept can be con-firmed or must, at least in part, be modified. In this section, only a selection of the acquired knowledge can be presented.
Evaluation of the aims: learning activities which were developed based on the concept of Rural Action Learning successfully enable the promotion of par-ticipatory competence and regional identity in those who take part and at all age levels. Younger participants tend to show stronger parameter changes than adult participants. In addition, the concept of the close interaction between regional identity forming and the acquisition of participatory competence is empirically confirmed by correlation tests. In consideration of the influence of personal preconceptions about the achievement of objectives, it can be estab-lished that until now, the concept does not sufficiently take into account the differentiated requirements of the participants. Corresponding detailed defini-tions need to be made in order to give ideas for differentiations, for example, with regard to objectives, contents and methods.
Evaluation of the methods: the theoretical focus on action-oriented methods has proved to be justified. The degree of action-orientation exerts a very high influence on the success of the measures. The discrepancy seen in this relation-

20 ship between theory and practice must not lead to a weakening of the concept but should instead result in greater efforts carried out to give action-oriented learning more weight in the practice of out-of-school regional learning.
Evaluation of the significance of the original encounter: the original encoun-ter is overestimated in the concept as an influencing factor. The evaluation results clearly show that the immediate, personal experience is connected in its intensity with an active self-acquisition and therefore can only unfold its potential in combination with action-oriented learning. A modification of the concept is needed in which the necessity for the targeted design of the original encounter is emphasised. The development and propagation of teaching and learning material which among other things would encourage self-motivated and independent on-site learning appears sensible.
Rural Action Learning supports the acquistion of participatory competence and regional identity formation, when ...
… on-site learning is set up towards the didactical-methodological principles of action and problem orientation as well as system and situation orientation learning.
… within the learning activity, large and small action-oriented forms such as projects, station learning, learning games or experiments are applied.
… the original encounter is complemented through the use of media and materials so that independent learning is enabled.
… participants are supported at different levels in accordance with their existing values of participatory competence and regional identity.
… participants visit regional places of learning, not just once but repeatedly over several subsequent days and/or over a longer period.
… learning activities are restricted to not just the on-site performance but are also prepared and followed up. In particular, the articulation and reflection of the results through presentation and follow-up work are significant steps in the process of reaching the objective.
… there is close cooperation with regional partners in training and education, and on the other hand, a vital educational network with diverse offers for life-long learning in the region can be established.
… cooperation with partners in both formal and non-formal areas can be established. … life-long learning can be realised by the organizers of learning activities themselves, for
example through access to professional and further training on the subject of 'Learning in the Region'.
… quality criteria for the work of the organizers are established and accepted by them. … evaluation of the measures is constantly carried out with respect to objectives and
quality criteria and the results are used for the further development of the concept and its practical implementation.
Figure 8. Guidelines on Rural Action LearningSource: Schockemöhle 2009
Future prospects
These and further evaluations lead into a process of pooling and consolidation of propositional guidelines for Rural Action Learning containing the functions of quality criteria (see overview in Figure 8). They are available above all for
Johanna Schockem
öhle, Kalmárné H
ollósi Erika, Cser János

21the dissemination of the understandings gained in this work to out-of-school regional learning in practice. Together with other teaching and learning mate-rial yet to be developed which will specifically take up the aspects of differ-entiation and action-orientation, along with measuring instruments which will enable the self-evaluation of learning activities, the guidelines will develop into a tool-box which organizers can use for particular learning activities. In this way, the transfer of the results will be supported in practice.
With regard to the significance of the understandings gained for future empiri-cal teaching and learning research, there are several implications for contents and methods. Above all, it would appear necessary to research more thor-oughly into the dimensions and value stages of the components of regional identity and participatory competence in order that more precise statements on the targeted support of participants can be made.
References
Barrett M. J., Hart R., Nolan K. and Sammel A., 2005, Challenges in Imple-menting Action oriented Sustainability Education, in: Leal Filho W. (Ed.), Handbook of Sustainability Research, Frankfurt a.M., pp. 505-534.
Bittner A., 2003, Außerschulische Umweltbildung in der Evaluation. Wirkun-gen kurzzeitpädagogischer Maßnahmen auf Umwelt- und Naturschutzinter-essen von Schülerinnen und Schüler der Sekundarstufe I, Hamburg.
Bortz J. and Döring N., 2006, Forschungsmethoden und Evaluation für Hu-man- und Sozialwissenschaftler, Heidelberg.
Blotevogel H. H., Heinritz G. and Popp H., 1987, Regionalbewusstsein – Überlegungen zu einer geographisch-landeskundlichen Forschungsinitia-tive, in: Informationen zur Raumentwicklung, no 7/8, pp. 409-418.
Blotevogel H., 1996, Auf dem Weg zu einer ‚Theorie der Regionalität’: Die Region als Forschungsobjekt der Geographie, in: Brunn G. (Ed): Region und Regionsbildung in Europa, Baden-Baden, pp. 44-68.
Danielzyk R. and Krüger R., 1990, Ostfriesland: Regionalbewusstsein und Lebensformen. Ein Forschungskonzept und seine Begründung, Oldenburg.
DGFG - Deutsche Gesellschaft für Geographie (Ed.) 2007, Bildungsstandards im Fach Geographie für den Mittleren Bildungsabschluss, Berlin.
Dyment J. E., 2008, Student Participation in School Ground Greening Initia-tives in Canada: Reflections on Research Design, Decisions and Key Find-ings, in: Reid A., Jensen B. B., Nikel J. & Simovska V. (Ed.): Participation and Learning. Perspectives on Education and the Environment, Health and Sustainability, Dordrecht, pp. 241-255.
EDK – Schweizerische Konferenz der kantonalen Erziehungsdirektoren (Ed.) 2007, Bildung für nachhaltige Entwicklung in der Schule. Schlussbericht zum Expertenmandat der EDK: Nachhaltige in der Grundschulausbildung – Begriffserklärung und Adaption, http://www.edk.ch/PDF_Downloads/BNE/BNE_Schlussbericht_ 2007_d.pdf [22.06.2007].
Erikson E. H., 1989, Identität und Lebenszyklus, Frankfurt am Main.
Rural Action Learning - prom
oting competences and strengthening participation

22 Flath M., 2007, Der didaktisch-methodische Ansatz des „Rural Action Learn-ing“, in: Institut für Strukturforschung und Planung in agrarischen Inten-sivgebieten (ISPA), Hochschule Vechta (Ed.), Regionales Lernen in ländli-chen Räumen Europas, pp. 31-42.
Focali E., 2007, Pädagogik in der globalisierten Moderne. Ziele, Aufgaben und Funktion von Pädagogik im Spannungsfeld von Globalisierung und Regionalisierung, Münster.
Gudjons H., 2008, Handlungsorientiert lehren und lernen. Schüleraktivierung, Selbsttätigkeit, Projektarbeit, Bad Heilbrunn.
Harenberg D. and Haan G., de 1999, Bildung für eine nachhaltige Entwick-lung. Gutachten zum Programm von Gerhard de Haan und Dorothee Haren-berg, FU Berlin, in: Bund-Länder-Kommission für Bildungsplanung und Forschungsförderung (Ed.), Materialien zur Bildungsplanung und Forsc-hungsförderung, no 72, Bonn.
Hart R. A., 2008, Stepping back from ‘The Ladder’: Reflections on a Model of Participatory Work with Children, in: Reid A., Jensen B. B., Nikel J. & Simovska V. (Ed.), Participation and Learning. Perspectives on Education and the Environment, Health and Sustainability, Dordrecht, pp. 19-31.
Jensen B. B. and Schnack K., 1997, The action competence approach in en-vironmental education, in: Environmental Education Research 2, no 3, pp. 163-178.
KMK/DUK - Ständigen Konferenz der Kultusminister der Länder in der Bun-desrepublik Deutschland (KMK) und der Deutschen UNESCO-Kommis-sion (DUK) 2007, Bildung für nachhaltige Entwicklung in der Schule, http://www.bne-portal.de/coremedia/generator/unesco/de/03_Aktuelles/07_Mel-dungen/Meldungen__national/KMK__Empfehlung.html [20.11.2007].
Krappmann, L. 1975, Soziologische Dimension der Identität. Strukturelle Bedingungen für die Teilnahme an Interaktionsprozessen, Stuttgart.
Lalli M., 1989, Stadtbezogene Identität. Theoretische Präzisierung und em-pirische Operationalisierung, Darmstadt.
Læssøe J., 2008, Participation and Sustainable Development: The Role and Challenges of Mediating Agents, in: Reid A., Jensen B. B., Nikel J. & Si-movska V. (Ed.), Participation and Learning. Perspectives on Education and the Environment, Health and Sustainability, Dordrecht, pp. 144-158.
Leal Filho W., (Ed.) 2005, Handbook of Sustainability Research, Frankfurt a.M.Lude A. ,2005, Naturerfahrung und Umwelthandeln: neue Ergebnisse aus Un-
tersuchungen mit Jugendlichen, in: Unterbrunner, U. & Forum Umwelt-bildung (Ed.), Natur erleben: Neues aus Forschung und Praxis der Natur-erfahrung, Wien, pp. 65-84.
Meyer H., 2004, Was ist guter Unterricht? Berlin.Nagel U., Kern W. and Schwarz V., 2006, Beiträge zur Festlegung von Kom-
petenzen und Standards für die Bildung für Nachhaltige Entwicklung – unter den Aspekten Umweltbildung, Gesundheitsbildung und Globales Lernen. Schlussbericht, http://www.phzh.ch/dotnetscripts /ForschungsDB/Files/167/BNE_ Schlussbericht.pdf [23.06.2008].
NAT – Nemzeti Alaptanterv (National Basic Curricula), 2003, Ministry of Education, Hungary.
Johanna Schockem
öhle, Kalmárné H
ollósi Erika, Cser János

23R
ural Action Learning - promoting com
petences and strengthening participationReid A., Jensen B. B., Nikel J. and Simovska V., (Ed.) 2008, Participation
and Learning. Perspectives on Education and the Environment, Health and Sustainability, Dordrecht.
Rode H., Bolscho D., Dempsey R. and Rost J., 2001, Zwischen Anspruch und Wirklichkeit. Ergebnisse einer empirischen Studie zur Wirkung außer-schulischer Umwelterziehung, Opladen.
Rohwer G., 2000, Agenda 21 im Erdkundeunterricht. Die Zukunft denken – die Gegenwart gestalten, in: Geographie heute 21 no 180, pp. 2-7.
Rost J., 2002, Umweltbildung – Bildung für eine nachhaltige Entwicklung. Was macht den Unterschied? in: Zeitschrift für internationale Bildungsfor-schung und Entwicklungspädagogik 25, no 1, pp. 7-12.
Russel C. and Hodson D., 2002, Whalewatching as critical science education? in: Canadian Journal of Science, Mathematics and Technology Education 2, no 4, pp. 485-504.
Rychen D. S. and Salganik L. H., (Ed.) 2003, Key competencies for a success-ful life and a well-functioning society, Cambridge, Mass.
Salzmann Ch., Mayer C. and Baeumer H., 1995, Theorie und Praxis des re-gionalen Lernens. Umweltpädagogische Impulse für außerschulisches Lernen. Das Beispiel des regionalen Umweltbildungszentrums Lernstan-dort Noller Schlucht, Frankfurt a.M..
Schockemöhle J., 2007, Das Project ALICERA – Ziele, Methoden, Ergeb-nisse, in: Institut für Strukturforschung und Planung in agrarischen Inten-sivgebieten (ISPA), Hochschule Vechta (Ed.): Regionales Lernen in ländli-chen Räumen Europas, pp. 6-14.
Schockemöhle J., 2009, Partizipation in Regionen durch Bildung fördern. Entwicklung und Evaluierung des Konzeptes Regionales Lernen „21+“ als Bildungsstrategie für eine nachhaltige Entwicklung, Nürnberg (in prepara-tion).
Schusler T. M.; Krasny M. E., 2008, Youth Participation in Local Environ-mental Action: An Avenue for Science and Civic Learning? in: Reid A., Jensen B. B., Nikel J. and Simovska V. (Ed.), Participation and Learning. Perspectives on Education and the Environment, Health and Sustainability. Dordrecht, pp. 268-284.
Weichhart P., 1990, Raumbezogene Identität. Bausteine zu einer Theorie räumlich-sozialer Kognition und Identifikation, Stuttgart.
Weichhart P., 1999, Die Räume zwischen den Welten und die Welt der Räume. Zur Konzeption eines Schlüsselbegriffs der Geographie, in: Meusburger P. (Ed.), Handlungszentrierte Sozialgeographie. Benno Werlens Entwurf in kritischer Diskussion. Stuttgart, pp. 67-94.
Wöll G., 1998, Handeln. Lernen durch Erfahrung, Baltmannsweiler.


25Konrad Ł. Czapiewski1, Zbigniew Floriańczyk2, Krzysztof Janc3
1 Institute of Geography and Spatial Organization PAS, Warsaw, Poland [email protected] Institute of Agricultural and Food Economics NRI, Warsaw, Poland [email protected] Inst. of Geography and Regional Development UWr, Wrocław, Poland [email protected]
Agricultural knowledge and rural economy – analysis on micro and macro scales
Abstract: In this paper agricultural knowledge and economic activity of farms are analysed from different perspectives. The research on the role of knowledge in stimulating agricultural and rural development was conducted with the main fo-cus on the EU agricultural rural policies. The authors provide a scientific proce-dure that delimitates rural areas of Poland according to their potential to expand agricultural activity versus multifunctionality of rural areas.
Keywords: knowledge transfer; rural policy; multidimensional analysis; education
Knowledge in agricultural and rural development from the perspective of the New Member States
Despite its diminishing role in the economy, agriculture retains its position as primary sector. That reflects the superiority of demand for food over the other human economic activity products. The superiority of food production resulted in extraordinary efforts to maintain agricultural activity even if it is not economically justified. Therefore agricultural activity can be observed even on areas that are not suitable for food production. European agriculture is a particular example of such a phenomenon with heavy spending of public money on agricultural subsidies. On the other hand, agriculture is recognised as a part of the rural environment with conservation of the countryside and social functions. These have a public goods nature and are seldom directly valued by market (Ruttan, 1994). Achievement of food security in developed countries accompanied with globalisation resulted in a changing paradigm of rural and agricultural development toward improvement of competitiveness

26 (Coleman et al., 2004). However, in the case of Europe the multifunctional concept of development has prevailed stressing different functions of agricu-lture and still unexploited possibilities of diversification of the rural economy (Van Huylenbroeck and Durand, 2003). Multifunctional rural development does not contradict the privileged position of agriculture in rural areas pointing out its role in providing public goods and the importance of other sectors of the rural economy. However it is necessary to improve productivity of agriculture to become competitive on the global food market. This concept is based on knowledge of agronomy and ability of a farmer to recognise and adopt most the promising technologies as well as to gain the knowledge necessary for running a non-agricultural business.
Coexistence of the above mentioned two directions of development causes certain problems related to utilisation of rural areas. For example improve-ment in competitiveness of agricultural production is based on economy of scale and know-how transfer. In practice farms tend to increase their size and implement new technologies. On the contrary, the multifunctional concept of rural development requires the conservation of agricultural land and an incre-ase of its utilisation for non–agricultural activities. As a result, the competition for land is growing.
There are some possibilities to overcome problems resulting from the many-sided directions of rural development which are connected with knowledge transfer and implementation of innovations (Floriańczyk at al., 2009). From one side the competitive farms desire highly specialised technologies whi-le according to the multifunctional rural development concept the needs are more related to knowledge of non-agricultural possibilities. Both ways of de-velopment are strongly interrelated while knowledge transfer demanded.
The role of knowledge transfer in rural and agricultural development is widely recognised and stressed in regional development policies. In the case of Euro-pean Union (EU) training programmes for farmers as well as the programmes aiming for the implementation of modern agricultural technologies are inclu-ded in the Common Agricultural Policy (CAP). However, the general trend of a decreasing number of full time farmers indicates that only some of the be-neficiaries of these programmes take full advantage of their knowledge in ag-riculture. That indicates the growing competition for agricultural knowledge capital between different sectors of the economy. The growing possibilities of employment in non-agricultural sectors can lead to withdrawal of human ca-pital from farms which are not able to provide satisfactory incomes. In such a case the increase of agricultural type of knowledge instead of providing a base for development of farms has an opposite effect. This phenomenon can be described as a two-layer inefficiency. The first results from unnecessary public spending on such a knowledge increase that is only partly taken advantage of. The second level of inefficiency is related with failure to provide rural areas with non-agricultural knowledge that is more appropriated to multifunctional development.
Konrad Czapiew
ski, Zbigniew Floriańczyk, K
rzysztof Janc

27The problem of adequate knowledge transfer in Europe is likely to be more often observed in regions with large numbers of subsistence farms. They are characterised by traditional transfer of knowledge that favours informal rather than formal type of knowledge. The first one is based on succession and own experience. In the light of knowledge base economy informal type of know-ledge in most cases rejects recent research and development achievements and is of secondary importance in rural development. Taking advantage of the latest technologies requires intensification of formal knowledge transfer (Klepacki, 2005).
The accession of Poland to the EU created new challenges and opportunities for agriculture and rural development (Zegar and Floriańczyk, 2003). Chal-lenges are mostly related to the transformation of peasant type of farming into family farms that are able to compete in the EU market. Taking into account the multifunctional concept of development the most promising path of de-velopment of these farms is linked with exploration of non-agricultural rural opportunities. This transformation can be supported in different ways through rural development programmes co-financed by the EU budget including in-struments aiming for knowledge transfer.
In this paper the relationship between agricultural knowledge level and farm performance from the Polish perspective is investigated. Regions of high potential of withdrawal of human knowledge from the agriculture sector are identified. On this basis a model of farms that are likely to effectively take advantage of knowledge will be proposed. Finally results of the research will support the process of programming rural policies directed at human capital improvement in rural areas. Different research approaches are examined to give scientific added value, thanks to its complementary. Starting from an EU perspective, through detailed analysis at the farm level, into the spatial approach, complex and multidisciplinary investigation is provided. A very de-tailed level of spatial analysis (over 2000 units) should give much information about human resources (human capital) in rural areas in respect to its functio-nal features.
Agricultural knowledge level from EU perspective
The EU from the spatial perspective can be characterised as highly diverse in almost all spheres of socio-economic development. Similar disparities among EU regions concerning level of education of farm operators and farm size are easy to recognise (Figure 1). The highest share of farmers with agricultural education can be observed in northern part of France, in Germany and the Benelux countries. Near those countries are located regions characterised by the average values of the analysed indicator, including regions of Poland. On the other side, the regions of southern Spain, Italy and Greece together with the whole territory of Bulgaria and Romania have low shares of farmers with agricultural education.
Agricultural know
ledge and rural economy - analysis on m
icro and macro scales

28 Similarly the highest averages of economic size are observed for farms in German and Dutch regions – among 14 regions with the average value hig-her than 100 ESU, nine German regions and Dutch regions were presented (Economic Size Unit is used for expressing the economic size of farms by Farm Accountancy Data Network www.fadn.pl). The lowest values of average economic size of farms were observed in New Member States i.e. Romania, Bulgaria and southern part of Poland with small number of farms of economic size higher than 100 ESU.
Figure 1. Share of farms operators with agricultural education (A) and average economic size of farms in ESU (B) in European Union regions in 2005Source: elaborated on the basis of DG AGRI data
The FADN data for EU regions (NUTS3 level) are characterised by strong corre-lation (r=0.69) between the level of education of farmers and the economic size of farms (Figure 2). Polish regions as compared with EU ones can be characterised by the average level of farmer education and lower economic size of farms. This suggests that knowledge capital in Polish agriculture is less effective than expected in terms of transferring it into farm development. Indeed, quantified model of trans-formation knowledge at EU level proves the unsatisfactory effectiveness of Polish farmers. According to the regression model Polish farmers could operate farms that are almost ten times larger than observed (39 ESU instead of 4 ESU). Assuming that the relationship between analysed data is non linear, Polish farms are characte-rised as being five times smaller than expected considering average economic size (average of expected value from the model 22 ESU). The most important factor that affects such results is incompatible agrarian structure in Polish agriculture – the average farm area is only 8 ha.
The study shows a high potential for multifunctional development of Polish (and New Member States) rural regions. Higher level of education accompa-nied with low economic potential of farms suggest that the economic situati-
Konrad Czapiew
ski, Zbigniew Floriańczyk, K
rzysztof Janc

29on of rural areas of Poland could be significantly improved while more rural knowledge resources are utilised outside of agriculture.
0 1 3 7 2 0 5 5 1 4 8 4 0 3A
0
2 0
4 0
6 0
8 0
1 0 0
BE U
P o la n d
R = 0 ,6 9
Figure 2. Interdependencies between the average economic size of farm in ESU (logarithmic scale) (A) and the average level of agricultural education of farm operators (B) for 2005Source: elaborated on the basis of DG AGRI data
Microeconomic analysis of interdependencies between knowledge and agricultural performance
The analysis of microeconomic interdependencies between the level of far-mers’ knowledge and economic performance of the farms is based on Farm Accountancy Data Network data. In the case of Poland the FADN sample includes about 12 thousand farms, which represent 750 thousand farms, that is nearly all farms that participate in the agricultural market (More informati-on about Polish FADN is available at http://www.fadn.pl/index.php?id=156). Microeconomic data analysis proves interdependency between the level of education of the farm operator and the economic size of the farm. The group of farms run by farmers with tertiary agricultural education includes more than 25% farms of economic size higher than 20 ESU (Figure 3). On the other hand more than 75% farms operated by farmers with primary education do not exceed 20 ESU. These differences are of greater importance while taking into account that farms run by an operator educated at primary level never exceeded the level of 50 ESU, which was observed in more than 10% of farms whose holders were educated at tertiary level.
Agricultural know
ledge and rural economy - analysis on m
icro and macro scales

30
0
2 0
4 0
6 0
8 0
1 0 0
Far
m s
ize
in E
SU
prim
ary
voca
tiona
l non
-agr
icul
tura
l
voca
tiona
l agr
icul
tura
l
seco
ndar
y no
n-ag
ricul
tura
l
seco
ndar
y ag
ricul
tura
l
tert
iary
non
-agr
icul
tura
l
tert
iary
agr
icul
tura
l
le v e l o f e d u c a t io n
9 5 %7 5 %5 0 %2 5 %
p e rc e n t ile s
Figure 3. Interdependencies between level of education of farm operators and value of production per 1 AWUSource: elaborated on the basis of FADN data for 2006
A similar analysis of dependency between level of education of farm operator and level of incomes from non-agricultural activities shows the better positi-on of farmers with higher level of education. Farmers in this group are cha-racterised by more than twice as high non-agricultural incomes as in the other groups. This suggests that farmers with tertiary education can be also regarded as leaders of multifunctional rural development (Figure 4).
0
2 0 0 0
4 0 0 0
6 0 0 0
8 0 0 0
Inco
mes
from
non
-agr
icul
tura
l act
ivity
(P
LN)
prim
ary
voca
tiona
l non
-agr
icul
tura
l
voca
tiona
l agr
icul
tura
l
seco
ndar
y no
n-ag
ricul
tura
l
seco
ndar
y ag
ricul
tura
l
tert
iary
non
-agr
icul
tura
l
tert
iary
agr
icul
tura
l
le v e l o f e d u c a tio n
Figure 4. Interdependencies between level of education of farm operators and incomes from non-agricultural activities (PLN per farm)Source: elaborated on the basis of FADN data for 2006
Konrad Czapiew
ski, Zbigniew Floriańczyk, K
rzysztof Janc

31These microeconomic studies indicate that only some, mostly those run by farmers with a high level of knowledge, farms in Poland fit the EU level know-ledge/economic size of farm model. However this group is also rather heavily engaged in non-agricultural activities. On the other side, the relatively higher level of education of Polish farmers stresses problems with non-agricultural knowledge transfer. This directly effects their ability to utilise scarce farm resources in other activities.
Spatial analysis of farmers’ level of knowledge and economic performance of farms
Delimitation of rural areas of Poland according to two basic elements: know-ledge and productivity (e.g. high knowledge with high productivity) was con-ducted. Thanks to this, it was possible to point out areas with a future per-spective of agriculture function and areas where because of high “brain drain” agriculture development is highly questionable.
Human resources, particularly their quality, play the key role in regional deve-lopment. Depending on the quantity and quality of these resources, they can constitute either an essential barrier or a stimulator of development (see, e.g. de la Fuente and Ciccone, 2003; Lee et al., 2004; Tondl and Vuksic, 2003). An important aspect of the contemporary socio-economic processes is constituted by their close association with concrete location and the features shaped by it – the local, unrepeatable resources. A strictly localized in space, partly immo-bile, social system influences the development capacities of an area. In other words, according to theory of new economic geography – “location matters” (Fujita et al., 1999).
Particularly nowadays, the existing coefficient between efficiency of agricu-lture production and the level of education plays a more and more important role. The adjusting to greater requirements in relation to quality of agricultural production, carrying out the modernization of agriculture as well as absorbing a bigger amount of external funds, can be particularly difficult in areas cha-racterized by a high share of farmers with low levels of education and skills (Bański, 2007).
Table 1. Structure (%) of people working in Polish towns and in rural areas (in agriculture and beyond), 2006
Rural areas
Level of education Towns Individual agriculture
Outside agriculture
Tertiary 29.7 2.2 14.7 Secondary 42.4 22.5 35.6 Vocational 23.5 43.8 39.9 Primary 4.4 31.5 9.8
Source: Own calculations based on data from Central Statistical Office
Agricultural know
ledge and rural economy - analysis on m
icro and macro scales

32 A clear difference in the educational level of people working in rural areas in agriculture and in non-agricultural activities can be shown (Table 1). In 2006 over half the people working in non-agricultural sectors of the economy had secondary or tertiary education while in agriculture only ¼ of farmers. The differentiation results both from the later rise and development of system of agrarian education in relation to different professional groups as well as the traditional perception of agricultural sector.
The level of education of farmers reached the highest values in the central part of the Wielkopolska Region and south-western Kujawsko-Pomorskie Region, as well as in the majority of cities and their suburban zones (e.g. Wrocław, Gdańsk). Moreover, high values were noted in the whole Silesia region, the remaining areas of Wielkopolska and the Kujawy, the Vistula Delta and Pome-rania as well as in the suburban zone of Warsaw (Figure 5). The least desirable situation was observed in rural areas of eight regions in the eastern part of country (except for suburban zones and some areas with intensive agricultural production).
Figure 5. Share of farmers with higher than basic general educational level in 2002Source: Own calculations based on data from Central Statistical Office
In case of agricultural education, from among almost 1.6 million farmers, only 1.3% have tertiary agricultural education and more than 19% possessed secon-dary or vocational agricultural education. Almost 800 thousand farmers did not possess any professional education. Again Wielkopolska, Kujawy regions and the Vistula Delta were characterized by good structure of the farmers‘ agricultural education. Such spatial differentiation is closely related with qua-litative features of agriculture. The areas with domination of intensive agri-culture have also higher shares of farmers with agricultural education. For
Konrad Czapiew
ski, Zbigniew Floriańczyk, K
rzysztof Janc

33areas of south-eastern Poland non-market oriented agricultural production (semi-subsistence) and unfavourable structure of the farmers‘ education are characteristic (Figure 6).
Figure 6. Share of farmers with higher than basic agricultural education in 2002Source: Own calculations based on data from Central Statistical Office
In case of spatial analysis, the economic performance of agricultural farms was described by the level of productivity of private agriculture. It is defined as the value of production sold on the market expressed in Polish zloty (PLN) per one hectare of farm (Kulikowski, 2003). The highest values of that measu-re were observed in Wielkopolska Region (pig breeding, intensive plant culti-vation), Kujawy Region (industrial crops), south-western of Warsaw suburban zone (orchards), western Podlasie (cattle breeding) and among Vistula Valley (vegetables) (Figure 7).
After describing the spatial diversification of educational level and level of farm productivity, it is important to show the global dependency between agri-cultural knowledge and the rural economy. For this purpose the spatial typolo-gy of areas according to these two elements was created. Thanks to that, it was possible to delimitate areas with high perspective for developing agriculture function – there are mostly communes delimitated to I class (31% of total communes). There were mainly Wielkopolska Region, Kujawsko-Pomorskie Region, Vistula Delta, northern part of Łódzkie Region and north-western of Mazovia Region (Figure 8).
Agricultural know
ledge and rural economy - analysis on m
icro and macro scales

34
Figure 7. Value of commercial agricultural production in PLN per 1 ha, 2002Source: Own calculations based on data from Central Statistical Office
Figure 8. Spatial typology of communes according to level of agricultural productivity (A) and agricultural education of farmers (B)Source: Own work
These rural areas have the perspective to base their development on market oriented agriculture. By contrast, there are 42% of communes (IV class) which have to find other ways for development because both investigated characte-ristics (endogenous potential expressed by educational level and productivity
Konrad Czapiew
ski, Zbigniew Floriańczyk, K
rzysztof Janc
35of agriculture) were above average values. What is interesting is that there are a few communes delimitated to transitory classes (II and III class – 17%). Ha-ving in mind the importance of such factors as agrarian structure, type of land use, environmental conditions for agricultural production and physical size of farms for farm’s economic condition, it has to be emphasised that nowadays knowledge is a key factor in spatial differentiation of agricultural productivity and farmers’ income.
Discussion
Application of three different research approaches allowed the delimitation of Polish regions according to their farmers knowledge – economic potential characteristics. The EU dimension model demonstrated lower than expected efficiency of Polish farmers in transferring their knowledge in farm develop-ment. The relatively higher level of education of farmers was accompanied by several times lower farm sizes than predicted by the model for EU agriculture. That is a result of the relatively slow transformation of farm structures as com-pared with most EU countries. This phenomenon leads to the conclusion that human resources in Polish agricultural sector are not properly utilised. The-refore the hypothesis of high possibilities of improvement of rural economy through multifunctional development could be in force. However, the micro-economic analysis showed that only a limited number of farms in Poland are operated by highly educated farmers. What is important is that these farmers are also the most active in non-agricultural rural businesses. Combining the outcomes of research conducted on EU and Polish dimensions pointed out that currently only a some of the biggest farms in Poland have an adequate human resources level to stimulate multifunctional development of rural areas. The-refore, first of all, there is a high demand for non-agricultural knowledge in rural areas. This can increase the human capital available in small farms that are unable to compete in the food market and should connect their future with non-agricultural sectors of the economy.
Spatial analysis helps to distinguish at the commune level regions that are of high potential for further expansion of agriculture production and multifunc-tional development. Namely Wielkopolska Region, Kujawsko-Pomorskie Re-gion, Vistula Delta, northern part of Łódzkie Region and north-western of Mazovia Region could be recognised as agricultural. On the other hand, the development of the rural areas of south-eastern part of Poland should be asso-ciated with implementation of multifunctional concept but requires intensifi-cation of non-agricultural knowledge transfers.
These research outcomes should be directly used for programming policies aiming at improvement of human capital and rural economy. It allows for pre-cise formulation of policy instruments in order to increase their efficiency and finally ensure sustainability of rural development. It should be emphasised that knowledge in any dimension (spatial and microeconomic) is crucial in the development of the rural economy. But, knowledge that is practically utilised
Agricultural know
ledge and rural economy - analysis on m
icro and macro scales

36 is a characteristic of “a few” farmers. We suppose that the efficiency of rural areas of Poland (also other parts of Europe) could be significantly improved by creating a professional system of formal education. Such a system will transform a number of well-educated farmers from “a few” to “a lot”.
References
Bański J., 2007, Geografia rolnictwa Polski (Geography of Polish agriculture), PWE, Warszawa, 249 pp.
Coleman W., Grant W., Josling T., 2004, Agriculture in the New Global Eco-nomy, Edward Elgar, Cheltenham.
Floriańczyk Z., Czapiewski K., Stawicka E., 2009, New paradigm of rural development – New challenges for extension services, in Multifunctional Territories: Importance of Rural Areas beyond Food Production, Rural Are-as and Development vol. 6, ERDN.
Fuente de la A., Ciccone A., 2003, Human Capital in a Global and Know-ledge–based Economy, European Commission, Paris, 121 pp.
Fujita M., Krugman P., Venables A.J., 1999, The Spatial Economy. Cities, Re-gions and International Trade, The MIT Press, Cambridge.
Van Huylenbroeck G., Durand G., 2003, Multifunctional Agriculture. A New paradigm for European Rural Agriculture and Rural Development, Ashgate.
Klepacki B., 2005, Wykształcenie jako czynnik różnicujący zasoby, organizację i wyniki ekonomiczne gospodarstw rolniczych (Education as a factor that differentiate the assets, organization and economic results of individual farms), Roczniki Naukowe SERiA, VII(1).
Kulikowski R., 2003, Syntetyczne metody badań produktywności i towarowości rolnictwa. Zastosowania w badaniach geograficznych w Pol-sce (Synthetic methods of research of agricultural productivity and com-mercialization), Prace Geograficzne, 187, IGiPZ PAN, Warszawa.
Lee S.Y., Florida R., Acs Z., 2004, Creativity and Entrepreneurship: a Regio-nal Analysis of New Form Formation, Discussion Papers on Entrepreneur-ship, Growth and Public Policy, Max Planck Institute, Jena, 24 pp.
Ruttan W. V, 1994, Agriculture, environment, and health: sustainable develop-ment in the 21st century, University of Minnesota.
Tondl G., Vuksic G., 2003, What Makes Regions in Eastern Europe Catching Up? The Role of Foreign Investment, Human Resources and Geography, Working Paper, B12, ZEI, Bonn, 53 pp.
Zegar S. J., Floriańczyk Z., 2003, Main problems of agriculture and rural are-as in Poland in the period of transformation and integration with European Union in Alternatives for European Rural Areas, Rural Areas and Develop-ment vol. 1, ERDN.
Konrad Czapiew
ski, Zbigniew Floriańczyk, K
rzysztof Janc

37Krisztina Melinda Dobay1, Ioan Sebastian Brumă1, Lucian Tanasă1, Camelia Apetroaie2
1 Romanian Academy, Iaşi Branch, Economic and Social Research Institute “Gheorghe Zane”, Rural Economy Department, Codrescu Str. no. 2, Iaşi, 700481, Romania
[email protected]; [email protected]; [email protected]
2 Iaşi County Office for Agricultural Consultancy, Ştefan cel Mare şi Sfânt Bd., no. 47-49, Iaşi, 700064, Romania
Increasing community social capital in north-eastern rural Romania
Abstract: The aim of this paper is to present tangible forms of knowledge ge-nerated by analyzing regional/local experiences, during more than ten years of synergetic cooperation between scientific researchers and public consultants in providing “public goods” for rural development in Romania. In this regards, the article contains a theoretical approach of the key concepts and a practical ap-proach referring to the major steps undertaken in order to adjust, at least locally, the “classical triangle” to the new rural paradigm.
Keywords: public goods, knowledge and information systems; National Agricultural Consultancy Agency; County Office for Agricultural Consultancy
Introduction
Development is a continuous adaptation for maximizing the permanently changing wellbeing, and not a simple movement towards a fixed goal. It is, in fact, a process of continuous adaptation, problem-solving and opportunity exploiting under pressure, searching for wellbeing (Chambers, 1993).
People’s wellbeing depends on two types of goods: private goods that are ex-pected to be obtained through the market, mostly by using own resources, and public goods, various things that usually are generated by the public domain. One main public good might be considered knowledge as it is a non-rival good par excellence and one that in the longer run is difficult to maintain in an excludable form. The knowledge is a dynamic human process of “justifying

38 personal beliefs as a part of the aspiration for truth” (Brožová et al., 2008). Knowledge can be seen as the basic mean through which we understand and give meaning to the world around us.
The tangible form of knowledge is the information. Human actions and prac-tices can be seen also as tangible expression of knowledge. We are speaking nowadays about knowledge and information systems defined as set of actors, networks and/or organizations, expected or managed to work in synergy to support knowledge processes (Leeuwis and Van den Ban 2004).
Methodology
The article contains a theoretical approach and a practical approach. In the first part of the article we are starting by presenting the concept of Agricultural Knowledge and Information System and by describing the Romanian public extension service. We analyze the country coverage of the extension offices and the type of activities provided. In the second part of the article we present the way how the accumulation of social capital is taking place at local/regional level through the quality learning interactions.
Agricultural knowledge and information system for rural development
The idea of Agricultural Knowledge and Information System (AKIS) was the-orized in detail by the Wageningen scholar Röling who described it as “a set of agricultural organizations and/or persons, and the links and interactions bet-ween them, engaged in such processes of the generation, transformation, sto-rage, retrieval, integration, diffusion and utilization of knowledge and infor-mation, with the purpose of working in synergy to support decision making, problem solving and innovation in a given country’s agriculture or domain thereof”(Röling, 1989).
FAO and The World Bank describes AKIS for Rural Development, known also as “the knowledge triangle”, as a system which “links people and institutions to promote mutual learning and generate, share and utilize agriculture-related technology, knowledge and information” and “integrates farmers, agricultural educators, researchers, various sources for better farming and improved liveli-hoods” (FAO and World Bank, 2000). Within the knowledge triangle, agricu-ltural extension receives relevant information from the agricultural education system and feeds back field observations to this system. The education system provides also agents who work in extension. The knowledge that agricultural extension transfers is usually generated by agricultural research through ap-plied and adaptive agricultural research development.
“When agricultural extension is combined with rural extension goals, the ex-tension function ranges even more widely in its purposes” (Rivera at al., 2001).
Krisztina M
elinda Dobay, Ioan S
ebastian Brum
ă, Lucian Tanasă, Cam
elia Apetroaie

39
Figure 1. The knowledge triangleSource: FAO & World Bank, 2000
Social and economic trends within the rural areas necessitate more highly trained, specialized and technically competent workers. In this context, the extension specialists, known in the 19th century also as “Lord Clarendon’s practical instructors in husbandry” (Swanson et al., 1998), are becoming more likely socio-economic community workers.
Agricultural extension in Romania
In Romania, the extension services are mainly provided by the ministry-based general extension service. The National Agricultural Consultancy Agency (NACA) was created through the Governmental Decision no. 676/1998, mo-dified by no. 676/1999. The Agency is a public institution, with legal persona-lity, financed from the State budget and which is directly coordinated by the Ministry of Agriculture and Rural Development.
NACA, by its organizational structure and by the activities developed in the territory, performs the transfer of knowledge to the farmers. The need of con-sulting for farmers is amplified during the process of development, diversi-fication, and specialization of the agricultural production and the transition from the subsistence farm to the commercial farm. At the same time, the level and quality of the consulting services and the consulting activity is more and more oriented towards the market. NACA addresses to all private farmers, regardless their legal status, provides consulting, extension, information and professional training in order to increase the managing performance at the farm level in the market economy conditions.
NACA has 41 local offices in each county, named County Office for Agricu-ltural Consultancy (COAC), whose personnel are advisors and trainers in the territory, offering consultancy regarding issues of agriculture and rural deve-
Increasing comm
unity social capital in north-eastern rural Rom
ania

40 lopment. At the level of towns and communes operates 546 Local Centres for Agricultural Consultancy (LCAC). In the North-East Region for instance, the coverage of the LCAC is presented in Table 1.
Table 1. LCAC in the North-East Development Region of Romania
County LCAC (number)
Localities covered
(number)
Total number of communes
Real coverage from the
total number of communes
(%)
Average number of communes
/LCAC from
statistical estimation
Bacău 13 83 85 97.65 6 Botoşani 8 53 71 74.64 9
Iaşi 16 37 93 39.78 6 Neamţ 13 39 78 50.00 6
Suceava 23 23 98 23.47 4 Vaslui 10 35 81 43.20 8 Total 83 270 506 53.35 6
Source: own calculations based on data from INS (2009) and the information from http://www.consultantaagricola.ro/info_zonale.php
We can conclude that the number of existing LCAC is not sufficient to cover the total number of existing rural communities in most of the counties.
But how efficient is this system? In order to answer to this question, we start by citing NACA evaluation mentioned in the report provided under the CEEC AGRI POLICY Project “Agro economic policy analysis of the new member states, the candidate states and the countries of the western Balkan”, the report “Rural Tech-nology Transfer in Transition Economies in Romania”(Reman et al., 2007). This SWOT analysis of the training provision of NACA is presented in Table 2.
From the extension and advisory activities point of view, in the same document (the CEEC AGRIPOLICY Report), the mentioned strengths of the NACA/COAC are:
• the capacity to identify the needs at local level;• sufficient number of personnel specialized in different fields;• high demand for professional qualification of farmers;• services are provided to specific groups of beneficiaries (professional
associations, farmers‘ organizations).As weaknesses there are mentioned:
• the lack of financial funds for expenditure;• difficult & rigid communication between consultant and beneficiary;• no feedback to the central institutions responsible for developing the
agricultural policies;• insufficiency or even lack of communications equipment;• legal constraints to stimulate local consultants;• lack of solid strategy to attract additional funds.
Krisztina M
elinda Dobay, Ioan S
ebastian Brum
ă, Lucian Tanasă, Cam
elia Apetroaie

41Table 2. SWOT analysis of the NACA - training provision Strengths Weaknesses
- increasing tendency in demand for continuous professional training activity in agriculture;
- diversification of agricultural fields where training is provided;
- implementation of externally financed programs (PHARE, World Bank, SAPARD etc.) regarding employment, information and training start showing their results;
- the increasing beneficiaries’ consciousness intensifies the implication and participation of all training providers.
- a rather unstable and incoherent legislation system in the last 10 years;
- lack of continuous training programs for adults in agriculture and rural development;
- lack of financial resources to run the agricultural training programs;
- lack of specific material, logistics and of a well prepared human capital;
- difficult access to external financial resources for agricultural and rural development;
- lack of infrastructure in the rural areas led to increased difficulties to beneficiaries in accessing different training programs.
Opportunities Threats - accessing EU funds for improving
professional education level in agriculture and rural development;
- increasing the number of beneficiaries by organizing trainings in the remote areas as well;
- increasing the involvement of universities in organizing trainings in collaboration with NACA;
- using the experiences collected as a result of the cooperation with international institutions.
- lack of proper infrastructure in order to provide trainings in communes, villages (remote areas);
- risk of lacking the new techniques and equipment necessary for the implementation of the practical issues of the training courses.
Source: Report - Agenţia Naţională de Consultanţă Agricolă , 2006, cited by Reman et al., 2007
Besides these issues, we mention some disadvantages of the ministry-based general extension from those identified by Swanson, Bentz and Sofranko (1998), which we consider that are valid for the case of Romania:
1) the contradictory nature of established goals (securing subsistence production and promoting cash crops for export; reaching the mass of rural households and serving the needs of specific groups; extending assistance to high potential and disadvantaged producers);
2) due to the hierarchical and highly bureaucratic way of organization, the system does not foster critical upward communication (priority setting for research is rarely based on extension field evaluations);
3) the way in which knowledge is transformed into field messages fre-quently leads to distorted and outdated information;
4) extension has never been a purely educational activity as the ministry required the “diversification” of the activities in a wide range (statisti-cal data collection, attending foreign visitors etc.);
Increasing comm
unity social capital in north-eastern rural Rom
ania

42 5) financial constraints have produced a strong pressure to reduce staff, and the field level has been hit hardest; under these conditions, many extension workers select the more responsive section of their clientele;
6) adequate and location-specific answers to a farmer’s problem are often not available because it has not been a research concern or the solution has simply not reached the field.
With all the difficulties that are facing with, NACA and COACs manage to obtain results. For instance, in 2008, there were organized (ANCA, 2008):
• 551 qualification courses in fields like agriculture, horticulture, animal husbandry, mechanization in agriculture, food industry, fishery, fore-stry, agro-tourism for 16,173 people;
• 2,356 training courses for 70,754 participants with topics regarding technologies, economics and juridical aspects (continuing and better improving the farmers’ professional education);
• 185 courses for 551 specialists from different activities related agricu-lture and rural development;
• training trainers in agricultural advisory and extension services within the MAKIS project “Improving extension services” – six series with 120 graduates in total;
• 1,149 demonstrative plots in crop cultures and 254 in livestock;• 94 fairies, 121 exhibitions, 169 contests, 47 festivals, 366 conferences,
585 workshops, 1,200 round table meetings and 7,223 meetings;• publishing and distribution of brochures, leaflets, magazines etc.;• 596 radio broadcasted and 309 TV talk shows• 24,106 practical demonstrations on field for farmers.
Other activities were:• identification of 130 model farms;• consulting during the elaboration of 220 projects (European Fund for
Agriculture and Rural Development) and consulting during imple-mentation for the 74 projects funded (9,165,516 Euro);
• identification of 1,637 potential beneficiaries of Measure 1.2.1 Farm modernization;
• data collection on market prices for the main agricultural products – data base posted on the web site;
• up dating data bases with input suppliers for agriculture, storing faci-lities and processing units, research institutes, agricultural education units, private consultancy companies etc.
Reducing inequalities
We might analyze inequalities at different levels, but the most relevant is to com-pare some regional data. For the snapshot view on the regional development in Romania we present in Table 3 some indicators from the Regional Operational Programme “Regional Development” 2007-2013 (MDLPL, 2007). All the data re-fer to the national average which is considered to be the reference (100%).
Krisztina M
elinda Dobay, Ioan S
ebastian Brum
ă, Lucian Tanasă, Cam
elia Apetroaie

43Table 3. Regional development indicators in Romania (national average = 100%)
Region GDP per capita
Unemployment rate
Direct Foreign
Investments per capita
SME’s per inhabitant
Rural population
1998 2004 1998 2005 1998 2005 1998 2005 1998 2005North-East 79.8 69.2 133.6 115.2 15.3 7.7 71.3 64.5 123.9 125.5 South-East 100.1 90.7 112.5 108.5 42.7 63.8 101.4 91.4 94.7 98.7
South 85.8 83.4 97.1 123.7 65.5 41.2 77.0 67.7 129.0 129.3 South-West 90.0 83.3 104.8 125.4 11.9 31.9 85.9 70.2 120.8 116.4
West 100.9 114.7 101.9 86.4 99.1 76.3 91.2 105.7 83.8 80.7 North-West 95.5 97.2 84.6 67.8 41.9 45.4 106.5 109.0 104.9 104.0
Centre 105.9 104.2 98.1 123.7 87.7 62.9 101.1 105.7 87.1 88.9 Bucureşti-Ilfov 162.2 191.5 47.1 40.7 598.3 593.5 194.1 228.2 24.8 21.1
Source: MDLPL, 2007
We can notice that the highest percentage of rural population is in South Region, and North - East Region. If we look to the GDP per capita, the unemployment, SME’s per capita and Direct Foreign Investments per ca-pita we notice that the North – East Region is the poorest one. In absolute figures, in the North-East Region we speak about 2,108,094 people living in 2,414 villages, respective 506 communes (INS, 2009). Only 83 LCACs offer services to the highest number of rural population from all of the eight regions.
The need for agricultural and rural information services is intensifying. “Ru-ral populations will undoubtedly be progressively better educated, while their exposure to the mass media will continue to reduce their isolation and detach-ment from information, ideas, and an awareness of their situation within a na-tional and international context” (Swanson at al., 1998). More knowledgeable farming population requires different kinds of extension services.
The best way of overcoming the disadvantages generated within the existing agricultural extension service and to face with the new challenges is to act together with the other “actors” from the AKIS/RD more efficiently in order to accomplish the common goals.
Quality learning interactions
It is widely agreed that social capital facilitates “mutually beneficial collective action” (Hobbs, 2000). Falk and Kilpatrick (2000) argue that the accumulation of social capital is the outcome of the process of “learning interactions” (lear-ning event). A precondition to building social capital is considered to be the existence of a sufficient quantity and quality learning interactions.How does it work?
To show how the accumulation of social capital takes place in practice we present the history of the cooperation between the researchers from
Increasing comm
unity social capital in north-eastern rural Rom
ania

44 the Rural Economy Department, Economic and Social Research Institute “Gh. Zane”, Romanian Academy, Iaşi Branch and the public consultants (agricultural extension specialists) from Iaşi County Office for Agricul-tural Consultancy.
This cooperation started in the early years since COAC Iaşi was established and the first activities were related to organization of conferences, seminars, workshops and round tables. The closer cooperation started with the participa-tion in different projects and programs. The main projects, important from the impact point of view, were (Dobay, 2009):
“The Promotion of Marketing Associations in Agriculture”, Romanian Agri-business Development Activity Project, funded by USAID (2000-2002).
Main objectives: • organizing an international workshop in Iaşi;• creating a staff of specialized consultants in marketing associa-
tions by training trainers (in each county of Romania);• elaborating the draft law for agricultural cooperation.
The major impact was the facilitation of establishing the first associations long before the establishing of different forms of associations has became one of the top priorities for the NACA.COACs involved: 41 (all the country), plus NACA Bucharest.
“Promoting Organic Farming in the North-Eastern Romania”, funded by the World Bank and MARD (2002-2004).
Activities performed:• elaborating brochures and books on organic farming (technologies,
legal framework, management and marketing); • organizing the training of trainers and farmers on specific technolo-
gies and on marketing organic products;• disseminating information to farmers;• organizing demonstrative plots and experience exchanges for farmers
interested in organic farming.Impact: this was an extension type project and constituted the very first promotion of the organic farming at three county level (Iaşi, Bacău and Neamţ), in the North-East Region of Romania, in a systematic way.COACs involved: 3 (Iaşi, Bacău and Neamţ).
“Elaborating and Implementing Local Economic Development Strategy in Periurban Communities (Metropolitan Area of Iaşi)”, funded by GRASP/USAID (2003-2004).
The main objective of the project was to assist a targeted community (Aro-neanu commune) in learning how to elaborate a local economic develop-ment strategy in participative way.Achievements:• The SWOT analysis was done for each village in a participative way.• The establishment of the consultative group of the community.
Krisztina M
elinda Dobay, Ioan S
ebastian Brum
ă, Lucian Tanasă, Cam
elia Apetroaie

45• It was the first real LEADER approach in the North-East Romania.Impact: COAC Iaşi disseminated at county level the brochures and the book elaborated within the project and managed, in 2006, together with other “actors” active in rural areas (World Vision, Pro Women Foundati-on, Hope Foundation, Elmol Foundation, Wine Growers’ Association, The Centre for Economic Development – CDE, elementary schools, local pu-blic administrations) to mobilize rural people and to support the establish-ment of the first partnerships for the Local Action Groups in the county.COACs involved: 1 (Iaşi).
“The Rural Finance Leader Development Project (RFLD)”, funded by USAID/USDA and coordinated by Iowa State University, Centre for Interna-tional Agricultural Finance (2004-2006).
The project provided team building and technical assistance with the aim to improve credit access in rural regions of Romania. Through this project there were established regional informal networks of public and private consultants, financers, companies from agriculture in all the 6 counties of the region.Main achievements:• improving the skills of public and private consultants in the elaborati-
on of business plans for agriculture and non-agricultural activities in rural areas;
• strengthening the relationships between consultants and the bankers and increasing the chances of farmers to obtain credit from commer-cial banks and access SAPARD funds.
Impact: in the North-East Region there are 786 SAPARD funded projects (MARD, 2009), the highest number of projects from all the regions, out of which 100 projects were assisted by the RFLD consultants. COACs involved from the North – East Region: 6 out of which 3 (Iaşi, Vaslui and Botoşani) managed to obtain tangible results (funded projects).
“Rural Leadership Development Project” funded by USAID/USDA and co-ordinated by CEED Romania (Centre for Entrepreneurship and Executive De-velopment) (2006-2007).
The project continued to foster the rural network established to assist the attraction of financial resources in the rural area. The project had three main objectives (CEED, 2007):1. to develop the rural businesses;2. to improve business knowledge and skills;3. to achieve regional and national integration.Main activities performed:• identifying local leaders and young consultants and training them
about how to establish partnerships and to access the EU funds;• tutoring project proposals;• assisting the establishment of local partnerships in targeted areas.Results at COAC level:
Increasing comm
unity social capital in north-eastern rural Rom
ania
46 • 10 public consultants participated in the training courses organized with the main topic related to the elaboration of projects to obtain EU funds (from the 6 concept papers that were elaborated during the training sessions, one project idea regarding the dissemination of in-formation about CAP to the rural people was funded);
• 2 consultants participated in the study tour organized in Ireland and had the chance to get in contact with LEADER companies, projects, and main institutions dealing with rural development.
COACs involved: 1 (Iaşi).
Conclusions
The implication level of the consultants/extension workers (from COAC and LCAC) in implementing different types of projects in different regions, coun-ties and areas is different. Even under the same circumstances, with the same given opportunities, the implication level is different. What makes the diffe-rence? We may state that all the achievements depend, pretty much, on the willingness of the public consultants to help the communities to improve their livelihood. This goes beyond the formal duties. Is more about being “the gui-de, philosopher and friend of the existing farmers” (Plunkett, 1901) and that means vocation for the extension worker profession.
Social capital resides in people’s mind, although is manifested in the rela-tions among people. “The roles that people recognize, accept, and perform and the norms, values, attitudes, and beliefs they hold structure people’s relationship with each other” (Grotaert and Van Bastelaer, 2002). The ex-tent to which the members of a community can work together effectively represents, according to Mattessich and Monsey (1997), the “social capa-city of the community”.
Can we state without any doubt that the learning interactions conduct to the accumulation of social capital? In order to answer to this question we start by presenting some of the non-typical projects implemented nowadays in the North – East Region in Romania with the participation of the public consul-tants (Table 4).
These examples highlight the fact that there is a real cooperation between the main actors involved in rural development in their attempt to help the farmers and the rural communities from the North – East Region of Romania to im-prove their livelihood.
We believe that the examples presented in the article show how the lear-ning interactions clearly generate accumulation of social capital, and that we can speak nowadays about the social capacity of a community, respec-tively, in extended meaning, about the social capacity of an area, county or region.
Krisztina M
elinda Dobay, Ioan S
ebastian Brum
ă, Lucian Tanasă, Cam
elia Apetroaie

47Table 4. Projects implemented in the North – East Region (2006-2009)with the participation of public consultants
Project Actors (type) COAC’s involved
Role of COAC’s
www.agra.ro web site Ltd. Company Agronomic University Agricultural high school Assoc. of businessmen Foreign consulting co.
1 (Iaşi) - identified the needs of potential beneficiaries - provided information about products, markets, input suppliers
Revival of 2 farmer markets in Iaşi Municipality
County Office of the MARD Local public administration County Council
1 (Iaşi) - identified the farmers’ needs and promoted the idea of offering the possibility for them to sell their products in farmer markets without paying any taxes
Promoting traditional agricultural products
Agronomic university Private foundation County Office of MARD Partners from Moldova Republic
2 (Iaşi and Vaslui)
- disseminated information about the legal steps for certifying traditional products
Promoting regional product brand
Agronomic university Private foundation County Office of MARD Partners from Moldova Republic
3 (Iaşi, Botoşani and Vaslui)
- supported farmers in establishing producer groups and to protect product brands against non-loyal competition
Tele-centre in the school from Şipote village (Iaşi County)
High school Local public administration
1 (Iaşi) - elaborated the project
Supporting the establishment of agricultural and rural development associations in five communities from Iaşi County
World Vision Iaşi 1 (Iaşi) - presented the advantages of establishing associations and the legal framework
Celebration of World Rural Women’s Day
Private association 1 (Iaşi) - organized seminars on topics regarding the role of women in developing rural communities
Improving the skills of rural people in writing projects in order to obtain funding from EU
Private association Foreign experts
1 (Iaşi) - selected the 20 beneficiaries
Disseminating info. about CAP policy
LCAC from Iaşi County 1 (Iaşi) - elaborated and implemented the project
Centre of information about rural development strategies
School inspectorate 1 (Iaşi) - elaborated the guide regarding agricultural consultancy
Cross-border pilot centre for organic products
Agronomic university 1 (Iaşi) - trainings farmers about organic farming
Source: Apetroaie, 2008, 2009
Increasing comm
unity social capital in north-eastern rural Rom
ania
48 References
ANCA (Agenţia Naţională de Consultanţă Agricolă), Raport de activitate al Agenţiei Naţionale de Consultanţă Agricolă pe anul 2008, http://www.con-sultantaagricola.ro/info_publice.php?id_info_publice=72, [Last accessed: 27.01.10].
Apetroaie C., 2008, Rolul consultanţei ieşene în dezvoltarea rurală, In: Bohatereţ V. M. (ed.) Studii şi cercetări de economie rurală. Tomul VII. Relaţia cercetare ştiinţifică – extensie - consultanţă, factor de potenţare a reţelelor de dezvoltare rurală, Academia Română, Filiala Iaşi, Institutul de Cercetări Economice şi Sociale „Gh. Zane”, Colectivul de Economie Rurală, Editura „Terra Nostra”, Iaşi, 135-143.
Apetroaie C., 2009, Impactul atragerii fondurilor europene de către consultanţa agricolă ieşeană, In: Studii şi cercetări de economie rurală. Tomul VIII. Experienţe în proiectele de cercetare pentru agricultură şi dezvoltare rurală”, Academia Română, Filiala Iaşi, Institutul de Cercetări Economice şi Sociale „Gh. Zane”, Colectivul de Economie Rurală, Editura „Terra Nostra”, Iaşi, 153-155.
Brožová H., Šubrt T, Bartoška J., 2008, Knowledge Maps in Agriculture and Rural Development, In: Agricultural Economics – Czech, 54, 2008 (11), http://www.journals.uzpi.cz/uniqueFiles/02781.pdf [Last accessed: 27.01.10].
CEED (Center for Entrepreneurship and Executive Development), 2007, Lea-ding Rural Romania from Challenge to Change. 2003-2007, http://www.en.ceed-romania.org/web/ProjectSites/USDA-USAIDProgramme/Pages/Project/default.aspx, [Last accessed: 28.01.10].
Chambers R., 1993, Challenging the Professions. Frontiers for rural develop-ment, ITDG Publishing, London, UK.
Dobay K. M., 2009, Rolul capitalului social în implementarea proiectelor de dez-voltare rurală, In: Studii şi cercetări de economie rurală. Tomul VIII. Experienţe în proiectele de cercetare pentru agricultură şi dezvoltare rurală”, Academia Română, Filiala Iaşi, Institutul de Cercetări Economice şi Sociale „Gh. Zane”, Colectivul de Economie Rurală, Editura „Terra Nostra”, Iaşi, 82-99.
Falk I., Kilpatrick S., 2000, What is Social Capital? A Study of Interaction in a Rural Community, In: Sociologia Ruralis, 40 (1), 87-110.
FAO & World Bank, 2000, Agricultural Knowledge and Information Systems for Rural Development. Strategic Vision and Guiding Principle, http://www.fao.org/sd/exdirect/exre0027.htm [Last accessed: 27.01.10].
Grootaert C., Van Bastelaer T., 2002, The Role of Social Capital in Develop-ment. An Empirical Assessment, Cambridge University Press.
Hobbs G., 2000, What is Social Capital? A Brief Literature Overview, Econo-mic and Social Research Foundation, Caledonia. http://www.caledonia.org.uk/soc_cap/htm [Last accessed: 27.01.10].
INS (Institutul Naţional de Statistică), 2009, Repere economice şi sociale regi-onale. Statistica teritorială (Territorial Statistics), CD ROM.
Leeuwis C., Van den Ban A., 2004, Communication for Rural Innovation. Re-thinking Agricultural Extension, 3rd Edition, Blackwell Publishing Ltd.
Krisztina M
elinda Dobay, Ioan S
ebastian Brum
ă, Lucian Tanasă, Cam
elia Apetroaie

49MARD (Ministry of Agriculture and Rural Development), 2009, Annual Re-port on SAPARD Programme Implementation in Romania in 2008, http://www.madr.ro/pages/page.php?self=03&sub=0301&tz=030103, [Last ac-cessed: 27.01.10].
Mattesich P., Monsey B., 1997, Community Building: What Makes It Work: A Review of Factors Influencing Successful Community Building, Fieldstone Alliance.
MDLPL (Ministerul Dezvoltării, Lucrărilor Publice şi Locuinţelor), 2007, Programul Operaţional Regional “Dezvoltare regională” 2007-2013, http://mdrl.ro/_documente/POR/POR_august_07.pdf [Last accessed: 27.01.10].
Plunkett H., 1901, Agricultural Education for Ireland, Department of Agricu-lture and Technical Instruction for Ireland, Journal, 2 (1).
Reman Gh., Vincze M., Kölcsey A., Kerekes K., 2007, Rural Technology Transfer in Transition Economies in Romania, CEEC AGRI POLICY Pro-ject Agro economic policy analysis of the new member states, the candidate states and the countries of the western Balkan, D12-3 Fourth 6 – month-ly report, http://www.euroqualityfiles.net/cecap/Report%204/Section%202%20country%20report/CEECAP%20report%204%20section%202%20ROMANIA.pdf, [Last accessed: 27.01.10].
Rivera W. M., Quamar M. K., Van Crowder L., 2001, Agricultural and Rural Extension Worldwide: Options for Institutional Reform in the Developing Countries, FAO, Rome, http://www.fao.org/docrep/fao/004/y2709e.pdf, [Last accessed: 27.01.10].
Röling N. G., 1989, The Agricultural Research-technology Transfer Interface: A Knowledge Systems Perspectives, International Service for National Ag-riculture Research (ISNAR), The Hague.
Swanson B. E., Bentz R. P., Sofranko A. J., 1998, Improving Agricultural Extension. A Reference Manual, FAO, Rome, http://www.fao.org/docrep/W5830E/w5830e00.htm, [Last accessed: 27.01.10].
Increasing comm
unity social capital in north-eastern rural Rom
ania


51Toivo Muilu, Niina Kotavaara1 Department of Geography, P.O. Box 3000, University of Oulu, Finland, FI-90014 [email protected]; [email protected]
Networking rural expertise
Abstract: The aim of this paper is to analyse emergence of rural expert net-works and their function on the basis of an example network. The case study concerns the European Rural Development Network (ERDN). Networking has been regarded as a central model of action during this century for most of fields of society and economy. The European Union emphasizes the role of coopera-tion between the Member States, organizations and regions. In addition, the EU research framework programmes are based on existing or project-based research networks in most cases. The number of rural networks has risen rapidly during the last years at regional, national as well as international level. In countries dominated by rural areas, especially in those with small population and sparse population structure, the need for networking has been highlighted because of low and scattered number of rural development actors and experts. There is a need to unite the limited resources. Networking is also expected to create new in-novations, increase productivity and save public resources. The ERDN originates from Poland in 2002, and since then, the network has expanded such that in 2009 it aggregated rural researchers from around 20 European countries. The em-pirical material of this paper consists of a web survey directed at participants of ERDN. The survey was carried out in the spring of 2009. The results suggest that the hard-core group of actors is rather small, but they have managed to create and maintain an alive and innovative network of rural researchers. Involvement among the participants seems to have increased during the years, although there are many of those who just “visit” the meetings only once. So far, the network has been relative easy to manage due to the relatively small number of participants but, however, the possible expansion of the network may lead to a need for a new kind of organizational structure. According to opinions of ERDN participants, the greatest future challenges for the network are connected to ideas on even more profound forms of international research cooperation and accomplishment of re-search applications and proposals.
Keywords: European Rural Development Network; ERDN; networks; rural exper-tise, rural research; social capital

52 Introduction
The idea of networking is probably as old as the mankind: by doing together, more can be achieved. Academic activities also have always been based on different networks and partnerships, which have stimulated creation and de-livery of new ideas between actors and organizations. The European Union is based on networks from its starting point. Furthermore, research framework programmes are in most cases based on existing or case-specific networks of researchers. During the last few decades, new, electronic communication technologies have facilitated and consolidated implementation of networks. So, at the beginning of the new millennium, there was both push and pull for new ideas and forms of networking.
Networks and networking have been a research theme in many disciplines for several decades. Recently in economics and its neighbouring disciplines, for example, several extensive compilations have been published on the network economy and social networks (Grabher–Powell 2004; Casson–Della Giusta 2008). Networks are emphasized as one of the key factors also in rural devel-opment research at international, national and regional levels (Murdoch 2000; Green 2007). Several rural expert networks or other networks have been set up in different countries and at international level. In fact, the Google search “rural network” gives tens of thousands hits (in September 2009). One of the most important “official” rural networks in Europe is the European Network for Rural Development (ENRD, http://ec.europa.eu/agriculture/rurdev/enrd/index_en.htm), coordinated by the EC. In each EU country, there are national rural networks, such as the Rural Network of Finland (http://www.maaseutu.fi/fi/index/maaseutuverkosto.html), which cooperate with and through ENRD.
Another aspect for rural networking are voluntary-based expert networks, from which there are also a lot of examples at both international and national level, such as the International Rural Network (http://www.international-rural-network.org/) and the Nordic–Scottish University Network for Rural and Re-gional Development (Rennie 2004). The Rural Studies Network (Muilu 2007) and the Rural Policy Committee (http://www.ruralpolicy.fi/en/; OECD Rural Policy Reviews Finland, 2008) are national examples from Finland.
Contrary to the administrative and official rural networks, voluntary-based networks rely more strongly on social capital (e.g. Bourdieu 1986; Latour 1987; Carter 1996). Importance and meaning of social capital and relations for rural networking have been emphasized in several recent studies and publica-tions. For example, Lee et al. (2005) have analysed networking in context of social capital and identities in European rural development in six case study areas in six countries. Lockie (2006) studied the complex social networks be-tween different actors of agri-environmental policy in Australia. In many vol-untary rural networks, there are indeed many kinds of demands and tensions inside the triangle of researchers, developers and policy-makers, which all have different expectations towards rural research (Moseley 2003, p. 89–105;
Toivo Muilu, N
iina Kotavaara

53Muilu 2010, p. 79). Several articles in an international compilation book on rural governance, edited by Cheshire et al. (2007), touch social capital and networks. McAreavey (2009) also highlights the central role of community participation, involvement, social capital and trust in rural development. The classic theory of diffusion of innovations is a useful tool for understanding how ideas in networks spread out (Rogers, 2003; Jones and Miller, 2007).
The theoretic idea of social capital as a resource for rural networks is an im-portant background idea also in this article, although the viewpoint is em-pirical. We analyse here one rural expert network from an insider’s point of view, or the actor level. The case study concerns the European Rural Develop-ment Network, hereinafter ERDN (not to be confused with ENRD of the EU). ERDN was established in Poland in 2002 based on an idea which emerged from discussions with the Institute for Applied Systems Analysis (IIASA) in Austria. On the web site of the ERDN (http://www.erdn.eu/), its main objec-tives are described as follows:
• establishing the wide basis for the co-operation of Polish and Euro-pean scientific units in the framework of the extending EU, devoted to the analysis of the state, perspectives and strategies of action with respect to the development of rural areas in Poland and in Europe;
• integration of efforts and competencies of various Polish and Euro-pean research institutions in the jointly conducted work in the area of rural development;
• exchange and promotion of scientific experiences and achievements of the participants of the Network in the area of the issue analysed;
• forwarding the international scientific co-operation in the scope of ru-ral development and farming, in particular undertaking steps devoted to preparation of the applications for co-financing of the scientific re-search within the 6th Framework Programme of the EU,
• undertaking initiatives for establishment of an all-European network.
There were six founding member organizations of ERDN in Poland and key associated institutions from Austria, Lithuania, the Czech Republic, Romania, and the Slovak Republic. The most important event of ERDN are the annual meetings, which have been organized in Poland (several times), Romania, Austria and Hungary from 2002 onwards. People from several countries have participated in the meetings, and the total number of partner countries is near 20. Most of the papers presented in the meetings have been published as annu-al volumes, which also are available from the web site of ERDN. Furthermore, some proposals for joint research projects have been drawn up and submitted to the EU and other organizations (http://www.erdn.waw.pl/, Voicilaş 2008).
The aim of the paper is to analyze at the individual actor level, which factors were behind each actor’s participation in ERDN in the first place, why do peo-ple still continue to participate in the operation of the network, what kind of challenges and problems have they met, and how do they perceive the future of ERDN. Finally, a typology of the respondents is made.
Netw
orking rural expertise

54 Methodology
The Webropol web survey (http://www.webropol.com/) was organized for the actors and participants of ERDN in April–May 2009. The aim was to reach as many people as possible of those who have taken part in ERDN meetings or other activities since the establishment of the network in 2002. E-mail ad-dresses of the target group were kindly delivered by two Polish promoters of ERDN, Konrad Czapiewski and Zbigniew Florianczyk. The addresses were also searched for and cross-checked from the authors’ old e-mails concerning the meetings since 2004.
The first e-mail inviting the target group to answer the survey was sent on 22 April 2009, and it included in total 118 e-mail addresses. It soon turned out that there were some technical problems in the implementation of the inter-national web survey, e.g. 41 of the addresses were “boomeranged” and some respondents were unable to open the Webropol programme partly due to fire-walls in the computer systems both at the authors’ home university and in different countries. The final number of accepted answers was 47, after two request e-mails to all addresses and several individual messages. This would give a response rate of 39.8% if calculated from the original number of e-mails sent (118). However, it was not possible to check precisely how many of the e-mails were actually received successfully and therefore the response rate is probably somewhat higher, i.e. clearly more than 40%. The response rate can be assessed to be quite normal for an international web survey, and the number of respondents is sufficient for this study.
The questionnaire was divided into four main sections: (1) background infor-mation of the respondents, (2) background and motivation for participating in ERDN, (3) evaluation of action and effects of ERDN, and (4) challenges and proposals for development of ERDN. The key idea was to keep the survey as easy as possible to answer, and therefore the five-level Likert scale statements (Likert 1932) and open questions were utilised.
However, some limitations of the data must be acknowledged: the number of respondents is quite small (n=47), which means that the data gathered does not necessarily represent evenly all the actors of the ERDN. Especially, it must be taken into account that a significant proportion of the respondents have partici-pated in the network meetings only once and within the past couple of years.
Results
Background information of the respondents
The average age of the respondents was 41.5, even though the range was very wide, between 27 and 65 years of age. In addition, most of the respondents (72%) had a post-graduate qualification. The network seems to be only slight-ly male-dominated: a little over half of the respondents (57%) were male.
Toivo Muilu, N
iina Kotavaara

55
Figure 1. Countries of the present posts of the respondentsSource: Webropol survey, April–May 2009
Answers were received in total from 14 different countries, mainly from east-ern central Europe, which is natural when considering the origins of the net-work (Figure 1). The two most represented individual fields were (agricul-tural) economics (43% of the respondents) and geography (26%). The rest of the respondents represented other human, planning and methodological sci-ences (around 21%) or physical sciences (around 15%). The majority of the respondents seem to work at a research organization other than university.
Usually a respondent had taken more than one role in the network. Most of the respondents had acted as a speaker in an ERDN meeting (76%) or participated in a meeting without a paper or a poster (37%,), and only few of them were founding members (16%) or had organized network meetings (15%).
Background and motivation for participating in ERDN activities
The hard-core group of the ERDN actors seems to be relatively small, and ma-jority of the actors are actually quite new to the network. This is, of course, not too surprising since we deal with a relatively new network. More than every third (36%) respondent had heard of the ERDN or participated in an ERDN meeting for the first time within the past couple of years (2008–09) and nearly two-thirds (60%) of the respondents had participated in an ERDN meeting only once. Most of the respondents had heard of the network or participated in a meeting for the first time in 2005–07, and only every fifth (21%) in the early years (2004 or before) of the network action.
It seems that most of the ERDN actors participate in local ERDN meetings and, in most cases, it does not lead to any greater commitment to the net-work. That is probably one of the greatest challenges of the ERDN, because,
Netw
orking rural expertise

56 naturally, the network cannot work without committed actors. Good news is, however, that the network has the potential to regenerate continuously with new members that come in every year. In the last couple of meetings also more papers have been submitted than it was possible to accept for presentation.
In an unstructured and informal network, such as the ERDN, participation is mainly voluntary, and, as shown before, therefore sometimes quite occasional. In addition, information about the network spreads mainly through personal rela-tions. Nearly four out of five respondents (79%) heard about ERDN first through a personal contact, such as a colleague, and only about tenth (11 %) through the Internet or an e-mail bulletin. In addition, almost all respondents (85%) had par-ticipated in the network mainly voluntarily, and only a small group (11%) due to a request or a command of a boss or a background organization.
At the general level, the motivations for participating in the ERDN ac-tivities can be divided in three categories: (1) own will/personal interest, (2) a command of a boss or a background organization, and (3) a request by the network. Usually respondents did not mention just one, but several motiva-tions for participating. The most common of them was exchanging knowledge and/or experiences (mentioned by 49% of respondents), getting new contacts (40%) and looking for cooperation, e.g. new projects or research opportuni-ties (30%). Many were interested also in the topical issues discussed in the network, development of the research area, or participating in conferences and other network activities.
“… to present the results of my work to an European audience, to widen the network activities of my institute, to find potential project partners, to learn about research activities in other countries, to get personal connections to other researchers in my fields of work…”
Especially for those who have been members of the network for some time now, motivations have changed in the course of time, resulting, among other things, from the transformation of the network itself.
“The idea of scientific network organization was very interesting and promis-ing. In the beginning of 2002 there was a lot of discussion about advantages of forming scientific networks. Generally one group of arguments was related to professional knowledge enrichment and the second with better position to have an access to finance resources. In may case on the very beginning I was motivated mainly by the first group of arguments. While the Network became strong I was more focus on the opportunities of being in network to have an easier access to EU research funds. More recently the “professional knowl-edge exchange” is more important. It might be partly explained with rather indirect successes of the Network in organizing EU funds for research. Be-cause of the ERDN member relation and the atmosphere during the meetings I fell very comfortable to present my research during meetings. There is no classification that some papers are “cutting edge” and others falling behind. That makes the platform that in truth links the scientists across the EU.”
Toivo Muilu, N
iina Kotavaara

57Activities and effects of ERDN
Conceptions of the present structure, activities and effects of ERDN were in-quired through eight “positive” statements. The respondents had also an op-portunity to state grounds to their opinions in free form, but only less than a half provided additional information. The themes of the statements con-cerned general and internal matters of ERDN and personal views (Figure 2).
Figure 2. Opinions on the action and effects of ERDNSource: Webropol survey, April–May 2009
The respondents were generally quite favourable for the present form of ERDN since they agreed or fully agreed with five out of eight statements. On the other hand, as regards three statements, the largest group of respondents neither agreed nor disagreed with them (category 3, illustrated in white in Figure 2). This is prob-ably linked to the finding that most of the respondents had participated in ERDN meetings only once, which means that they were not yet very familiar with the network at the time of the survey. This is evident especially for the statement “The present structure of the ERDN is functional and effective”, in which 41% of re-spondents selected category 3, even though in this statement also almost a half of the respondents agreed or fully agreed with the statement.
The most positive responses concerned the statement on that the actors of ERDN are equal and there are no tensions between them. As many as 68% of the respondents either agreed or fully agreed with this statement. In addition, of a total of 18 open answers, none were critical.
“As far as I can judge after 2 years of participation the scientific platform is beyond any type of discrimination.”
“This is largely a freewill endeavour and so there are little, if any tensions, but the lead is with those who wish to and do contribute.”
Netw
orking rural expertise

58 “No discriminations based on gender, age, nationality, religion, culture was ever recognised.”
The second highest number of “I fully agree” responses was provided to the statement that ERDN has been personally important to the respond-ent. The network is voluntary-based and most of the participants are seek-ing for professional connections among similar colleagues from different countries. The few critical answers to the question on the personal impor-tance of ERDN were, for example, “it is not crucial” or “not so much”, and most of the open answers were positive. The statement saying that ERDN has brought additional value to the respondents’ background organizations received somewhat more critical responses although the majority (52%) agreed with the statement.
“Monitoring ERDN activities is among most important duties and I utilize the knowledge gained during meetings directly in my professional work.”
“Now I have the chance to get international recognition for my work and also the possibility to measure the quality and level of my scientific products (arti-cles, presentations etc.). Also is very important for any researcher to publish articles abroad in important scientific publications/volumes. Now I have this chance (since 2007). For the local networks is an open gate for getting in touch with other practitioners as the ERDN participants can facilitate this.“
“I appreciate constant and recurring personal contacts with international researchers for discussions and information exchange. Some members have become friends. Presentations and publications for an international audience are necessary for my career.”
“My background organisation is now known among some researchers and developers in this network.”
“…international contacts, cooperations with other institutes, joint project applications, host of conference, invitations to international conferences for-warded by ERDN participants.”
“Most of my organisation is not interested in international link.”
ERDN seems to have succeeded very well in creating rural networking pos-sibilities (74% agreed or fully agreed) and social capital (66%) among the participants. This is a promising result since it is closely connected to the very idea of the ERDN. Many said that the network is still small and in its early stage, but they were trustful about the future.
“Surely because it makes the networking easy during the seminars. However I think ERDN is not very well known in public.”
“ERDN contributes to networking, but it seems to have a small reach only (just a few research institutes are involved).”
Toivo Muilu, N
iina Kotavaara
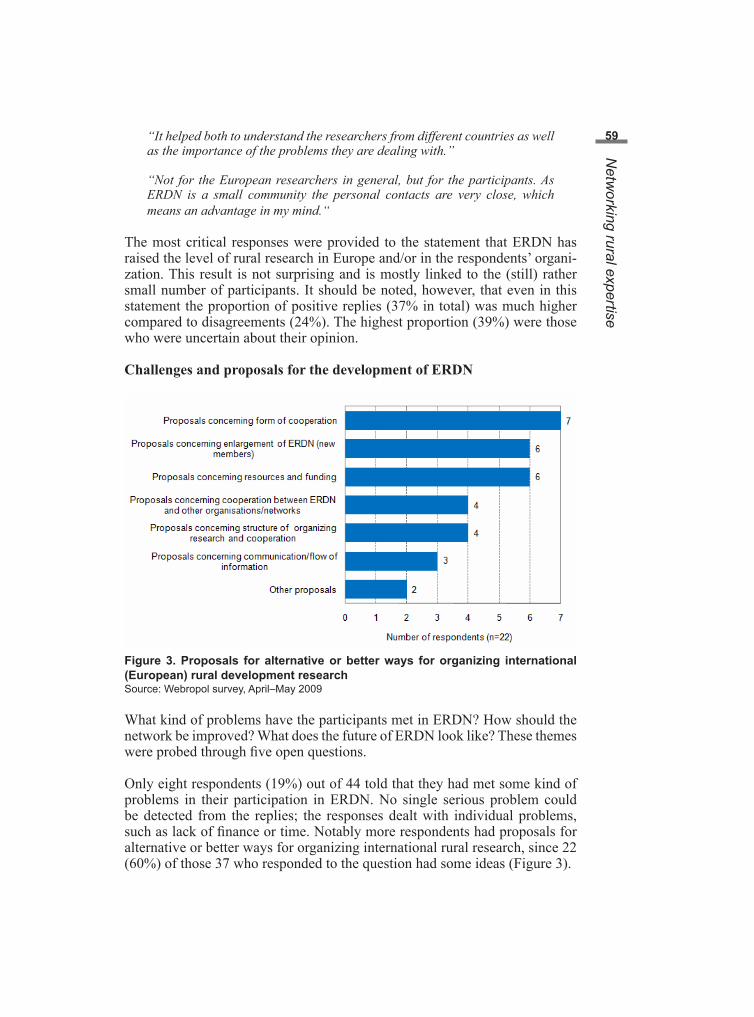
59“It helped both to understand the researchers from different countries as well as the importance of the problems they are dealing with.”
“Not for the European researchers in general, but for the participants. As ERDN is a small community the personal contacts are very close, which means an advantage in my mind.“
The most critical responses were provided to the statement that ERDN has raised the level of rural research in Europe and/or in the respondents’ organi-zation. This result is not surprising and is mostly linked to the (still) rather small number of participants. It should be noted, however, that even in this statement the proportion of positive replies (37% in total) was much higher compared to disagreements (24%). The highest proportion (39%) were those who were uncertain about their opinion.
Challenges and proposals for the development of ERDN
Figure 3. Proposals for alternative or better ways for organizing international (European) rural development researchSource: Webropol survey, April–May 2009
What kind of problems have the participants met in ERDN? How should the network be improved? What does the future of ERDN look like? These themes were probed through five open questions.
Only eight respondents (19%) out of 44 told that they had met some kind of problems in their participation in ERDN. No single serious problem could be detected from the replies; the responses dealt with individual problems, such as lack of finance or time. Notably more respondents had proposals for alternative or better ways for organizing international rural research, since 22 (60%) of those 37 who responded to the question had some ideas (Figure 3).
Netw
orking rural expertise

60 Some of the replies were very general, but also some, more concrete sugges-tions were made.
“Regular workshops (4 per year) with topics agreed upon at the previous an-nual meeting, e.g. evaluation of individual measures of the RDP.”
“Strengthening of cooperation between the older and new member states of the EU would probably influence positively the effectiveness of the ERDN activities. My impression is that participants from new member states (+Aus-tria) are stronger engaged in the activities. However, in my opinion ERDN could benefit from information and experience exchange and any deeper re-search cooperation with organisations from other older EU member states. One reason is that research institutions in EU-15 are more experienced as the Eastern European ones, with regard to research (i.e. applying and developing recent economic theories and research methods), research transfer (publica-tions in recognised journals, etc.) and applying for research funding. Thus, stronger research cooperation between “West” and “East” Countries within ERDN could be a win-win situation for both sides.”
“I would opt for a somewhat broader and deeper collaboration within ERDN, involving, e.g., a symbolic institutional fee, so that “members” would partici-pate in events on “membership” conditions, and some obligations could be entrusted with them.”
“Maybe affiliation and organization of meetings with other European net-works.”
A great majority agreed with the idea of increasing cooperation at national and international level with research networks in the field of rural, urban and regional research (82% of those 34 who responded). Almost as many (81% of 37 respondents) would like to see more cooperation in research applications between ERDN partners. Many did, however, have doubts about practical im-plementation of these good ideas. There always seems to be a lack of active coordinators or “primus motors” in real research cooperation, for example. Also the threat for increasing bureaucracy and other administrative barriers were highlighted.
“Cooperation is always good but there are limits because of time consuming and overview, until now ERDN works with a minimum of personnel and finan-cial input and is somehow friendly and like a big family. When it should get larger more organisational work and bureaucracy is necessary, the “nice” “friendship” appearance could get lost.”
“It is important to have a clear objective for such cooperation(s); e.g. iden-tifying a research problem, looking for collaboration partners (with shared interests) and joint work on a research application is one example of such an objective. Strengthening of cooperation between networks without having an overall and clear defined objective or strategy does not work in reality.”
Toivo Muilu, N
iina Kotavaara

61“The inter-institutional scientific cooperation and networking (on the base level) is one of the most important problems in my country. The institutions are more, unfortunately, in the position of competitors. Everything is about people. It is necessary to go from step to step. From the national network to the international one, from the monodiscipline network to multidiscipline one. And, it is very important to find the optimal size of networks.”
“The network of ERDN gives a good basis and I think there should be more cooperation in international research. Again the question is capacity, carry out a good research needs time!”
“It is hard to answer as I really don‘t know what is the track record of the ERDN as umbrella organization. From my point of view there are different barriers: – bureaucracy at organizational level – differences in national ac-counting systems –- influencing project financial management aspects – lack of time for dealing with project writing and implementation as researchers – lack of experience in project management at international level.”
“Yes. I should welcome it. But, it is very important to find the leader of the po-tential project. The participants (institutions) of ERDN have a very different (not only personal) power. Some institutions are represented only by one or two persons with interest in rural development. It is very difficult to imagine these institutions in the position of the project leader.”
Types of respondents
Based on the research data, it is possible to formulate a general picture of the actors participating in the ERDN. Categorization of the respondents is based on careful analysis of the research material with adequate statistical methods, for example, cross tabulation, χ2 test and cluster analysis. The respondents are categorized into four different groups according the level and intensity of their commitment to the ERDN. The level of commitment has been divided in two categories, personal level and organisational level, based on whether the major motivation for participating in the network is personal interest or the participant’s home organization’s interest. Also the intensity of commit-ment to the network has been divided in two categories: strong and weak. The four groups represent the extreme types of respondents, and a significant share of the respondents are placed somewhere in between these groups. Each respondent can belong to more than one group at the same time (Table 1).
Almost a half (49%) of the respondents are so called ”visitors”, who have partici-pated in ERDN meetings only once and the participation has not led, at least yet, to any greater commitment to the network. “Visitors” have participated in the network meeting, however, out of their own free will and they have had personal moti-vation for participating; most commonly, exchanging knowledge and/or experi-ences (43%), getting new contacts (30%), and seeking possibilities for cooperation (30%). Some of the “visitors” have even very precise goals for their participation. Most (70%) of them have acted as a speaker in an ERDN meeting, and a third (30%) of them have participated in a meeting without a paper or a poster. Usually
Netw
orking rural expertise

62 they had heard of ERDN or participated a meeting within the past couple of years. Almost half (43%) of the “visitors” think that participating in ERDN has been per-sonally important to her/him and/or to her/his career.
Table 1. Extreme types of actors of the ERDN categorized by the level and intensity of their commitment to the network. A significant share of the actors are placed somewhere in between these groups. Percentage values stand for the shares of respondents that belong to the group. Each respondent can belong to more than one group at the same time
INTENSITY OF COMMITMENT TO ERDN weak commitment strong commitment
pers
onal
leve
l
”VISITORS ”
49% of respondents “I wanted to look at this kind of R&D seminar which was unknown to me before that. I was
also looking for new contacts and networks in the area of development of rural livelihoods”.
“… One of my research topics are analyses of agric. markets in Poland and Romania in the
last time. […] Thus, one motivation for participating at ERDN conference in
Sinaia/Predeal (2007) was to get insights in the research of the Romanian colleges and learn the
opinions and expertise of the representative from other sectors (business, government, NGO) especially on challenges and opportunities for the Romanian agric. market and rural areas. -
Establishing or strengthening contacts, especially with Romanian colleagues - First time visit to Romania (= desire to experience
the Romanian countryside)“
“ACTIVE USERS OF THE NETWORK”
19% of respondents
“I believe this is a useful vehicle for (a) networking, (b) improving my own knowledge
and (c) generating knowledge for the wider good.”
“ to have alive contact with the other people
from different countries - to get more knowledge about rural areas in the other countries - To
change information’s about my country and the other countries - To learn more about the way to solve some problems with the methods of an
expertise’s to the government or to the EU rural commission“
LEV
EL O
F C
OM
MIT
MEN
T TO
ER
DN
orga
nisa
tiona
l lev
el
“COMMANDED BY BOSS OR
BACKGROUND ORGANIZATION”
11% of respondents
“Firstly, I substituted my colleague at the ERDN meeting due to his absence. After that I considered to participate in the next meeting of ERDN but due to working requirement it was
not possible.”
“first motivation was request second was interest for the themes and value for my work”
“DEVELOPERS OF RESEARCH AREA”
9% of respondents
“Basically, I find international networks necessary for the development of research work (and this certainly applies in the case of Finnish rural studies!). I’ve been active in the European
Society for Rural Sociology (ESRS) for some fifteen years and find now that the ERDN is a
novel (and in a way, an additional) platform for cooperation.”
“I trust in this idea. I consider that such a
network is necessary on European level. ERDN meetings and activities are a good opportunity
to extend the research area, meet people, exchange the experience, makes the distances
shorter and the cooperation faster.”
Source: Webropol survey, April–May 2009
Almost a fifth (19%) of the respondents can be seen as “active users of the network”. They participate in the network activities mainly out of their own interest. They have several personal motivations for participating and goals
Toivo Muilu, N
iina Kotavaara

63they want to achieve by using the network. The “active users of the network” have participated in ERDN meetings at least twice, some of them even six times, since the early years or the middle period of the network’s existence. They have also had several roles in the network: some of them are founding members, over half of them have organized ERDN meetings, and almost all of them have acted as a speaker in a meeting. So it is fair to say that their com-mitment to the network is quite strong. Except for one respondent, all of them (89%) think participating in ERDN has been personally important to her/him and/or to her/his career.
Actors “commanded by boss or background organization” (11% of respond-ents) have not participated in the ERDN out of their own free will initially, instead, their boss or background organization has requested or commanded them to participate in the network. They all have participated in ERDN meet-ings only once, usually as a speaker in a meeting, and only one respondent ex-pressed his willingness to participate again. Their commitment to the network is therefore quite weak, although some of them had also personal interest in participating. Over half of them (60%) think that participating in ERDN has brought additional value to her/his background organization, and over half of them (60%) think that participating has not been personally important to her/him and/or to her/his career.
The last, and the smallest group, of actors are called “developers of the research area” (9% of respondents). These people often have both organizational and personal motivation for participating in the ERDN. Usually development of the research area is their main goal, or at least one of the goals. Some of them are founding members or organizers of meetings and have participated in the network action several times since its early years. Some of the people in this group are new to the network and have participated in meetings only once so far. However, because of the nature of their motivation, their commitment to the network can be seen quite strong.
Discussion
Networks are probably here to stay also in rural development and research. At the regional, national and international levels, the rapidly increasing number of networks has led us to think about the European Rural Develop-ment Network as an international example of rural expertise networks from the actor or participant point of view. At least five major interrelated conclu-sions can be drawn from this study.
Firstly, the importance of “primus motors” in the early stages of network-ing cannot be overemphasized. In contrast to top-down, official networks, voluntary-based networks are not created on administrative decisions and commands. Voluntary networks are born out of nowhere either, but they need someone with a good idea and a like-minded group of colleagues around who share this idea. The role of social capital is crucial in this stage, since as Lee
Netw
orking rural expertise

64 et al. (2005, p. 281) state, „Good networks are inclusive, facilitating collec-tive learning, allowing sharing of success and generating wider social accept-ance.“ A new network can be seen as an innovation which needs to be diffused among potential partners. In the innovation adoption curve by Rogers (2003), the group of innovators forms only 2.5% of all the adopters of innovations. In international voluntary networks such as ERDN, the role of innovators is especially important since cooperation across administrative, mental and physical borders and language barriers is never an easy task. ERDN is (so far) a small-scale success story in this sense, thanks to the sustainability of the original ideas and involved coordinators and organizers of the meetings.
Secondly, the next stage of a network’s development is critical. In ERDN, the core, and the most active group, of innovators is small, and almost a half of the participants are “visitors”. In Rogers’ (2003, p. 272) model they are classified to early adopters and early majority. This imbalance of adopters is probably the case in many, or at least in the most similar, networks and societies, and may be seen as a general challenge for the future of voluntary networks. In any case, there is a need to think over whether the present structure and size of the network is sufficient or whether there is a need for further expansion. In the latter case, potential new participants may be found both via national contacts of present participants and by sending targeted invitations to new countries.
The third conclusion is closely connected to the previous ones. In some open answers in our survey, some concerns were expressed towards the possible problems which might emerge if the ERDN expanded, although naturally no exact limits for the growth were given. The network is mostly based on vol-untary involvement and work, and financing granted from national sources is limited. Would ERDN lose something from its’ present informality and social relations between the actors if it expanded towards a larger structure? Is there a threat of bureaucracy? Who has time and resources to coordinate the ex-panding network? These were some questions raised by the respondents.
Fourthly, young network actors are, naturally, essential to continuance of any network. In the beginning, a network needs an experienced group of actors or innovators with good relations with other potential network actors. According to our survey this was perhaps the most important single background factor in the creation of ERDN: the core group had good knowledge about each other. However, in the long term, young actors are a precondition for development and regeneration of the network. At the moment, the situation in ERDN is quite promising: the actors of the network seem to be quite experienced peo-ple, but there are already a significant number of young people involved.
Finally, some expectations and prospects for the future of ERDN were for-mulated in the replies. Most of the participants were fairly satisfied with their experiences in the network and would like to see even more profound forms of international research cooperation, not only inside the present ERDN but also with other networks of researchers. The most desired activity was increas-
Toivo Muilu, N
iina Kotavaara

65ing the number of joint research applications and proposals submitted to, for example, the European Union framework programmes. ERDN has proved to be a functional platform for international cooperation in rural development research, and there is already evidence that the problem of finding willing coordinators to research projects is not an insolvable question.
This study pointed out that ERDN has successfully gone through a path from a small group of rural experts to a relative wide and vital international rural expert network. The actors are quite satisfied with the present structure and results achieved so far. In the future, however, the network may face chal-lenges connected to e.g. increasing competition of financial resources directed to rural development research both at national and international level, and also to proliferating number of other rural networks. More and more demands are placed on international research cooperation, and in this sense, we may con-clude that ERDN is on the course to deepening cooperation.
Acknowledgements
The authors wish to thank the Academy of Finland (project 124800) and the Thule Institute of the University of Oulu for providing financing for this study. Thanks are due also to the respondents of our web survey.
References
Bourdieu P., 1986, The Forms of Capital, [in] Richardson J.G. (ed.), Hand-book of Theory and Research for the Sociology of Education, 241–258, Greenwood Press, Westport.
Carter S., 1996, The Indigenous Rural Enterprise: Characteristics and Change in the British Farm Sector, Entrepreneurship & Regional Development 8, 345-358.
Casson M., Della Giusta M. (eds.), 2008, The Economics of Networks, The International Library of Critical Writings in Economics 221, An Elgar Ref-erence Collection.
Cheshire L., Higgins V., Lawrence G. (eds.), 2007, Rural Governance – Inter-national Perspectives, Routledge Studies in Human Geography.
European Network for Rural Development (ENRD), http://ec.europa.eu/agri-culture/rurdev/enrd/index_ en.htm (as in 1st October, 2009).
European Rural Development Network (ERDN), http://www.erdn.waw.pl/ (as in 1st October, 2009).
Grabher G., Powell W. W. (eds.), 2004, Networks, Cheltenham, UK, Edwar Elgar.
Green G. P., 2007, Workforce Development Networks in Rural Areas, Chel-tenham, UK, Edward Elgar.
International Rural Network, http://www.international-rural-network.org/ (as in 1st October, 2009).
Jones B., Miller B., 2007, Innovation Diffusion in the New Economy: the Tacit Component, London, Routledge.
Netw
orking rural expertise

66 Latour B., 1987, Science in Action – How to Follow Scientists and Engineers Through Society, Cambridge, Massachusetts, Howard University Press.
Lee J., Árnason A., Nightingale A., Shucksmith M., 2005, Networking: Social Capital and Identities in European Rural Development, Sociologia Ruralis Vol 45:4, 269-283.
Likert R., 1932, A Technique for the Measurement of Attitudes, Archives of Psychology 140, 1–55.
Lockie S., 2006, Networks of Agri-Environmental Action: Temporality, Spa-tiality and Identity in Agricultural Environments, Sociologia Ruralis Vol 46:1, 22-39.
McAreavey R., 2009, Rural Development Theory and Practice, Routledge Studies in Development and Society 19.
Moseley M. J., 2003, Rural Development - Principles and Practice, SAGE Publications.
Muilu T., 2007, Rural Studies Network of Finland – a National Approach to Networking Rural Expertise, [in] Voicilas D.M., Tudor M. (eds.), Values and Challenges in Designing the European Rural Structures – Research Net-work Experience, 21–31, Rural areas and development vol. 5, European Ru-ral Development Network, Institute of Agricultural Economics Romanian Academy, Institute of Agricultural and Food Economics, National Research Institute.
Muilu T., 2010, Needs for Rural Research in the Northern Finland Context, Journal of Rural Studies 26, 73-80.
Murdoch, J., 2000, Networks – a New Paradigm of Rural Development?, Journal of Rural Studies 16, 407-419.
OECD Rural Policy Reviews Finland 2008, Paris.Rennie F. (ed.), 2004, The Nordic–Scottish University Network for Rural and
Regional Development, Proceedings of the 2003 Annual Conference, Inver-ness, Scotland.
Rogers E. M., 2003, Diffusion of Innovations, Free Press, New York.Rural Network of Finland (in Finnish), http://www.maaseutu.fi/fi/index/maa-
seutuverkosto.html (as in 1st October, 2009).Rural Policy Committee, http://www.ruralpolicy.fi/en/ (as in 1st October,
2009).Voicilaş D. M., 2008, The Experience of the European Rural Development
Network (ERDN): from Idea to Practice, Agricultural and Rural Develop-ment, Year V, no.1-2, 39-44, Institute of Agricultural Economics, Romanian Academy.
Webropol, http://www.webropol.com/ (as in 1st October, 2009).
Toivo Muilu, N
iina Kotavaara

67Monica Tudor, Dan Marius Voicilas1 Romanian Academy-Institute of Agricultural Economics, Macroeconomics Department, Calea 13 Septembrie 13, sector 5, 050711, Bucharest, Romania
[email protected]; [email protected]
Innovation and real labour force in rural areas as a basis of future rural development
Abstract: The common West European problems are the following: population ageing and proportional (and often also absolute) decline of the labour force. These deficits are partially covered by the East-West migration flows for work, but these labour force movements generate similar problems on the labour markets in the origin countries. The external migration flows for jobs from CEE countries to West European countries are motivated, on one hand, by the lack of occupati-onal alternatives in the origin countries, and on the other hand by the significant differences between the labour remuneration in the origin countries and the West-European countries, as main destinations of the circulatory migration flows. The job deficit in the CEE countries is much stronger in the rural areas, so that the pressure upon the occupational migration is greater for the active population in these areas. The rural entrepreneurship capacity to bring an active contribution to sustainable economic growth, to provide jobs and to contribute to the general welfare increase has an optimizing trend when: the total number of entrepreneurs is great and increasing; the share of employers in the employed population is on the rise; the young people are well represented in the age structure of employers. The main question that remains is the following: what is the innovation level and who will be the innovators in the rural area in the CEE countries as long as the migration level to the West-European countries remains high? As a consequence, the following question arises: what is the real available labour force in the rural area on which the economy can rely in the CEE countries, both in statistical and practical terms?As a result of this study, the approximate determination of the innovation level, of the real labour force in the rural area and of the interde-pendencies between these two indicators is expected, under the conditions of a strong migration phenomenon.
Keywords: real labour force; rural area; entrepreneurship; Romania

68 Introduction
In the last decades, the debates quite often focused upon the entrepreneurial economy and entrepreneurial capitalism (Baumol et al. 2007), the researchers demonstrating that the high levels of entrepreneurial activity can have positive effects upon job creation and economic growth (Lafuente, Driga 2007). The en-trepreneurship became an instrument for the economic development in the rural areas. The European Union and the member states of the Organization for Eco-nomic Cooperation and Development (OECD) introduced policies in the last ten years that use entrepreneurship as a main instrument for the development of the rural areas (EU -Lisbon Declaration of March 2000; Vaillant, Lafuente, 2007). In the context of its rural area development, the European Union has increa-singly focused upon Pillar II – Rural Development, where the shift moves from agriculture to the diversification of the production base of the rural area (EC - RDP 2007-2013). At the same time, there has been an increased interest for the stimulation of new business initiation as a key element in the process of de-velopment and revitalization of the less-favoured EU areas (EC FP 7 program). OECD included the endogenous economic growth and the entrepreneurship among the main targets of the New Rural Paradigm Program (OECD 2006).
The new private entrepreneurial initiatives become extremely important in the context of transition, as they have been less influenced by the economic context in which the state companies evolved (Estrin et al. 2006:693) turning into the engines of the economic and social progress.
For the Romanian economy, in general, and for the rural area, in particular, the entrepreneurship development represents a significant component the dyna-mics and structure of which depend on the sustainable economic growth rate. By their characteristics: innovation, close links with the community, high dy-namics, optimum use of local resources, job creation, the small and medium-sized enterprises influence development, mainly at local and regional levels (Işfănescu, 2008).
A successful private initiative depends not only upon the entrepreneurs’ in-novating capacity but also upon the available zonal labour force, whose cha-racteristics: age, professional training, experience, availability can become an opportunity or a risk for a successful private initiative. The available labour re-present a support of entrepreneurial development when, owing to its characte-ristics, it can be immediately and efficiently mobilized in a rural business; or it can become a constraint to private business initiative development if it is an old-aged, poorly trained labour force, it does not have the necessary skills for the new business development and/or it is not available on the local market. The common West European problems are the following: population ageing and proportional (and often also absolute) decline of the labour force. These deficits are partially covered by the East-West migration flows for work, but these labour force movements generate similar problems on the labour mar-
Monica Tudor, D
an Marius Voicilas

69kets in the origin countries. From this perspective, it seems imperiously neces-sary to determine the actual available labour force in a certain area, namely the number and structure of the people who are effectively available to contribute to the labour supply on the micro-regional labour market.
Methodology
The theoretical and practical evidence reveals that the development perspec-tives of a given area depend on the bi-univocal relation between the size and dynamics of the entrepreneurial initiative, o none hand, and the characteristics of the labour force that is effectively available on the labour market, on the other hand. The main characteristics of the rural entrepreneurship that enable us to evaluate the stage and development dynamics of the business initiative envisage four main aspects:
Firstly, the capacity of rural population from a certain area to perceive the opportunities of business development and the extent to which it assumes the risks of business initiation and continuation; this is expressed by the dyna-mics number of employers as a measure of the extent in which the rural area benefit from a favourable economic and social context, which is stimulating for the initiation of new business and the development of the already existing business activities. A positive dynamics expresses the capacity of the existing entrepreneurs to stay into business and a stimulating environment for new entrepreneurial initiatives. On the contrary, a decreasing dynamics highlights the failure of entrepreneurs and it is a direct consequence of the deficient ori-entation with regard to business opportunities (for example, the initiation of too many businesses with the same object of activity in a small area can lead to the bankruptcy of those poorly capitalized, to the diminution of the success possibilities of a business generated by the change of the economic and social context in which a certain enterprise evolves (for example, a generalized eco-nomic crisis (for example, a generalized economic crisis influences the con-sumers’ purchasing power, these narrowing the solvent demand of goods and services, which negatively impacts their possibility ton sell their products for the small niche businesses or those that do not supply strict necessity goods).
Secondly, the incidence of entrepreneurial concerns in the employed popu-lation that expresses the propensity of economically active people to fructify their initiatives and to become independent from the constraints imposed on the labour market; this characteristic is expressed by the indicator: share of emplo-yees in the employed population of a given rural area and a higher value of this is associated to a more favourable perception of the successful opportunities of a private business in a given area. The evaluation of the success opportunities in a new business initiation largely depends on the capacity of this initiative funding; this capacity depends on the development level of the rural area. The OECD Report 2006 draws the attention on the fact that the rural firms have to suffer from the poor finance opportunities. It is estimated that funding the esta-blishment or enlargement of the activity of a private rural firm takes place on the
Innovation and real labour force in rural areas as a basis of future rural development

70 basis of funds coming from the entrepreneurs’ own resources, from the family members and from friends. In the poor regions, the potential entrepreneurs and their closest persons are more prone to the risk of having lower incomes and/or savings. For them, funding the business initiatives becomes a difficult mission and the opportunities to initiate a new business are lower.
Thirdly, the measure of the entrepreneurship capacity in a rural area to be open, to understand, internalize and even generate innovating models is put into direct correlation with the age of people who initiate a self-employed activity. The structure by age of employers reflect the share that each age ca-tegory has in total employed population with employer status; this structure provides significant signals with regard to the potential innovating capacity of the employers in a given area. Thus, an age structure of employers where the young people have a greater importance, is associated to greater opportunities to accept innovation, to internalize new ideas of business management, new technical and technological procedures and to generate innovatory ideas duet o a larger opening towards risk assumption, which is associated to younger age. The opening to innovation also stems from the fact that usually young people have a higher educational capital compared to older people and their social independence permits them a much higher mobility.
Finally, the measure of diversification of fields where the entrepreneurial in-itiative is manifested reflects the entrepreneurs’ innovating capacity expressed by seizing and fructification of the new business opportunities at local level. The diversification of the local rural business environment is the symbol of creation of a new stable and sustainable economic structure, which should consolidate a viable economic tissue. The balanced distribution of investments in business in all the activity sectors is a guarantee to the operability of the local economic tissue and to a more efficient use of local resources. On the other hand, the diversification of the rural business environment implies the increase of off-farm job opportunities and the diminution of the rural popula-tions’ incomes dependency on the primary sector of the economy.
The human capital characteristics that enable us to evaluate the stage and de-velopment dynamics of the active implication on labour market envisage five main aspects:
Firstly, the population ageing reflects the demographic regeneration potential at the rural level and it is expressed by the population ageing index (calcula-ted as a ratio of the number of persons over 65 to those up to 14 years old). The values larger than one of this index induce great risks of decreasing the number of the population in the rural area, which is similar to a contraction of the demand on the local markets for goods and services, making the micro regions less attractive for investments.
Secondly, the labour renewal index - calculated as ratio of the population aged 15-29 years to that aged 33-44 years. As it compares the young labour force
Monica Tudor, D
an Marius Voicilas

71volume, at the very beginning of active life, to the volume of adult labour, this index highlights the trend in the evolution of labour available for the future. A ratio larger than one reveals the growth opportunity of the young labour force available on the rural market, which favours the attraction of investments in alternative economic activities. By contrast, the more the ratio tends to zero, the higher the contraction risk of the available labour at rural level.
Thirdly, structural modification of rural employed population - indicated by the modification of the employed labour by the three main economic activities (agriculture, industry - constructions and services). This indicator is (partially) the result of the diversification of the fields where the entrepreneurial initiative is manifested. On the other hand, the variation of the rural occupational struc-ture by age groups reveals the intersectoral occupational mobility trends of the different age categories and their access opportunities on the labour market.
Fourthly, the educational structure of the rural labour force becomes very important as it reflects the distribution by different educational levels of the rural population and reveals whether the professional training of labour repre-sents an opportunity or a risk for the development of non-agricultural entre-preneurial initiatives. The implementation of economic activities that require a higher training level can be facilitated when the persons with a higher edu-cational level prevail in the labour force; on the contrary, it can be constrained when the educational level is low as the low educational level is associated to the risk of being reluctant to innovation in the occupational behaviour.
Finally, the size and characteristics of the circulatory migration for work, both internal and mainly to foreign countries, have an impact upon the real available labour, i.e. upon the volume and structure by age, gender and ed-ucational levels of the population that is effectively available on the labour market. There is a mutual inter-conditionality relation between the circula-tory migration flows for work, on one hand, and the development of entre-preneurial initiatives, on the other. Thus, the circulatory migration size is determined by the lack of job opportunities in the rural area stemming from a poor development of the small entrepreneurial initiatives. The rural active population mobilization in the circulatory migration flows to work consi-derably diminishes the effectively available labour force on the rural labour market. Furthermore, considering that the most dynamic labour suppliers are the young and better-trained, the characteristics of the effectively available labour force in the rural area tend to worsen (accelerated ageing, poor educa-tional and training level).
The conclusions of the present study are a result of a qualitative and quan-titative analysis based on secondary data supplied by the National Institute for Statistics (NIS) and the primary data resulting from a field survey in four representative communes from the aspect of the experience in migration1.
1 Capacities Project – DALFI 2008/2010, coordinator IEA (field surveys in four representative communes from the point of view of the experience in migration abroad – September 2009
Innovation and real labour force in rural areas as a basis of future rural development

72 Entrepreneurship in rural Romania - evolutions and trends
The rural entrepreneurship capacity to actively contribute to sustainable eco-nomic growth, to provide jobs and to contribute to the general welfare increase tends to optimization when:
• The total number of entrepreneurs is high and increasing• The share of employers in the employed population is increasing • Young people are well represented in the age structure of employers• The structure of fields where the entrepreneurial initiative is mani-
fested is diversified.
The extent to which the active population of the Romanian rural area percei-ves the opportunities of business development and it is able to assume the risks of business initiation and continuation had a general increasing trend in the period 2005 – first quarter 2009, the number of employers increasing by 15.7%, with a more accelerated growth rate in the first quarter 2009 compared to previous years (Figure 1). Although it seems contradictory in a period of economic crisis, this increase in the number of entrepreneurs in rural Romania is the result of the stimulating action of the structural funds devoted to support the small private initiatives (start-up included). As a result, the capacity to seize and fructify the local business opportunities seems to increase, the pre-vious argument being strengthened by the fact that the number of employers constantly increased in the period 2005-2009, by a steady and also sustainable rate (by more than 10% per year).
0
10000
20000
30000
40000
50000
2005 2006 2007 2008 I quarter 2009
no. e
mpl
oyer
s
0.0
0.2
0.4
0.6
0.8
1.0
1.2
% in
occ
upie
d po
pula
tion
no. employers % of employers in total employment
Figure 1. Entrepreneurship dynamics in rural RomaniaSource: NIS, tempo on-line, www.insse.ro
With 13.5 employers/commune in 2009, the number of private rural busi-nesses is still far to be sufficiently high so as to determine a steady and sustai-nable economic growth in the long run. Consequently active measures should be taken to support the private initiative so as to speed up the development of entrepreneurial activities, the more as the general population’s attitude is favourable to private business development.
Monica Tudor, D
an Marius Voicilas
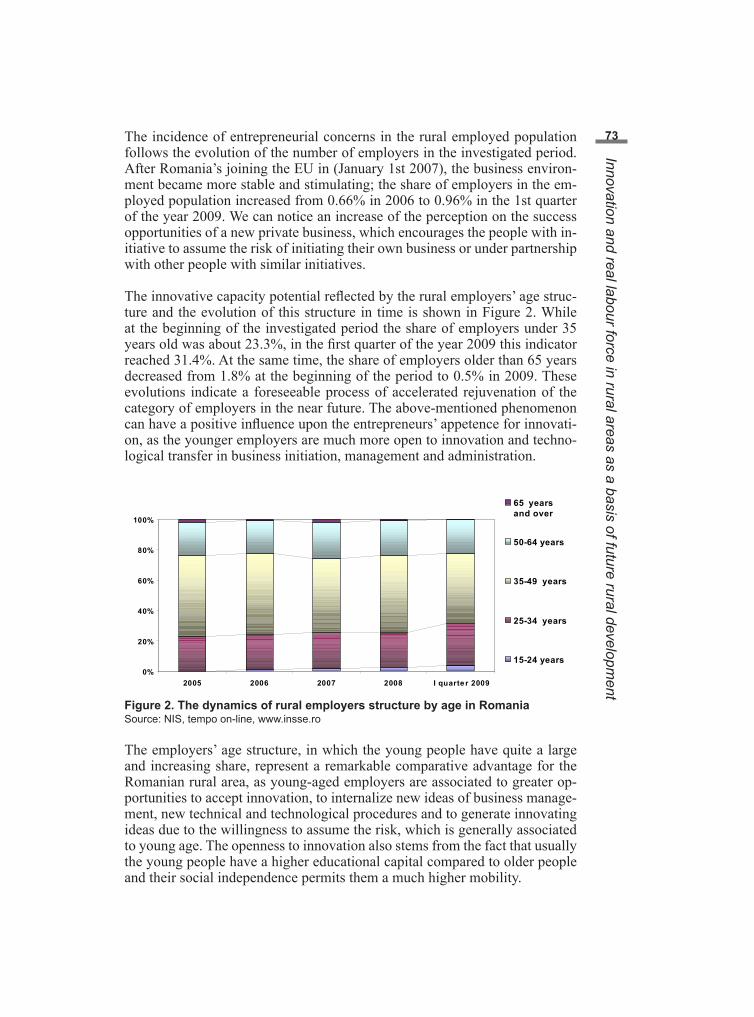
73The incidence of entrepreneurial concerns in the rural employed population follows the evolution of the number of employers in the investigated period. After Romania’s joining the EU in (January 1st 2007), the business environ-ment became more stable and stimulating; the share of employers in the em-ployed population increased from 0.66% in 2006 to 0.96% in the 1st quarter of the year 2009. We can notice an increase of the perception on the success opportunities of a new private business, which encourages the people with in-itiative to assume the risk of initiating their own business or under partnership with other people with similar initiatives.
The innovative capacity potential reflected by the rural employers’ age struc-ture and the evolution of this structure in time is shown in Figure 2. While at the beginning of the investigated period the share of employers under 35 years old was about 23.3%, in the first quarter of the year 2009 this indicator reached 31.4%. At the same time, the share of employers older than 65 years decreased from 1.8% at the beginning of the period to 0.5% in 2009. These evolutions indicate a foreseeable process of accelerated rejuvenation of the category of employers in the near future. The above-mentioned phenomenon can have a positive influence upon the entrepreneurs’ appetence for innovati-on, as the younger employers are much more open to innovation and techno-logical transfer in business initiation, management and administration.
0%
20%
40%
60%
80%
100%
2005 2006 2007 2008 I quarte r 2009
65 yearsand over
50-64 years
35-49 years
25-34 years
15-24 years
Figure 2. The dynamics of rural employers structure by age in RomaniaSource: NIS, tempo on-line, www.insse.ro
The employers’ age structure, in which the young people have quite a large and increasing share, represent a remarkable comparative advantage for the Romanian rural area, as young-aged employers are associated to greater op-portunities to accept innovation, to internalize new ideas of business manage-ment, new technical and technological procedures and to generate innovating ideas due to the willingness to assume the risk, which is generally associated to young age. The openness to innovation also stems from the fact that usually the young people have a higher educational capital compared to older people and their social independence permits them a much higher mobility.
Innovation and real labour force in rural areas as a basis of future rural development
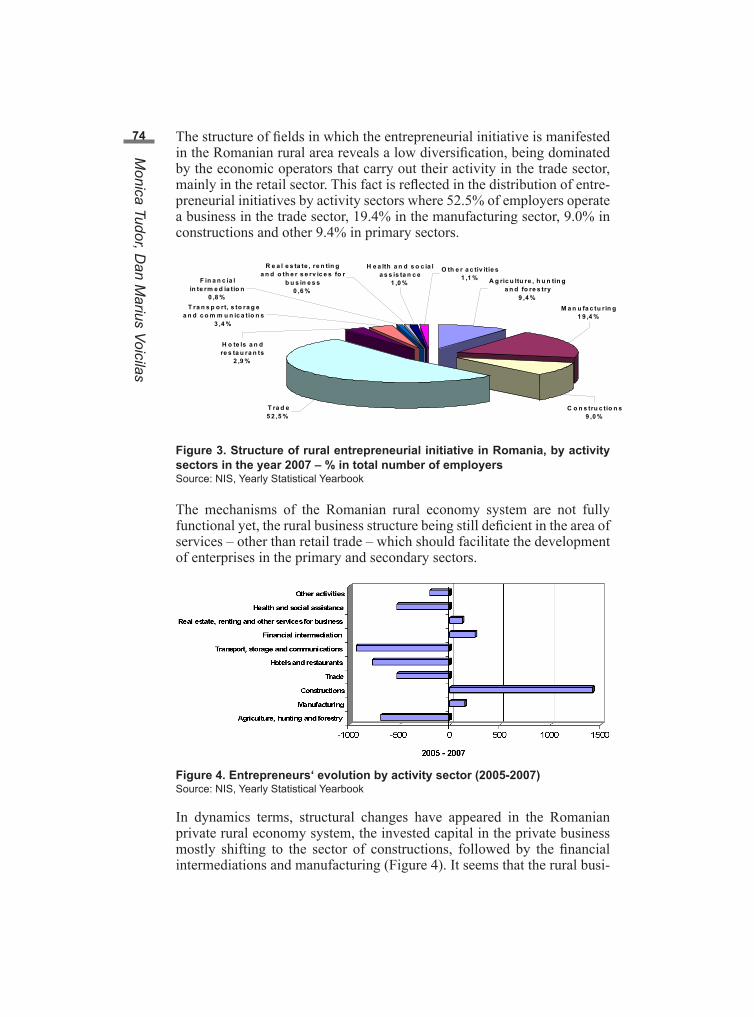
74 The structure of fields in which the entrepreneurial initiative is manifested in the Romanian rural area reveals a low diversification, being dominated by the economic operators that carry out their activity in the trade sector, mainly in the retail sector. This fact is reflected in the distribution of entre-preneurial initiatives by activity sectors where 52.5% of employers operate a business in the trade sector, 19.4% in the manufacturing sector, 9.0% in constructions and other 9.4% in primary sectors.
T ra d e5 2 ,5 %
M a n u fa c tu r in g1 9 ,4 %
A g ric u ltu re , h u n tin g a n d fo re s try
9 ,4 %
F in a n c ia l in te rm e d ia tio n
0 ,8 %
H e a lth a n d s o c ia l a s s is ta n c e
1 ,0 %
O th e r a c tiv itie s1 ,1 %
T ra n s p o rt, s to ra g e a n d c o m m u n ic a tio n s
3 ,4 %
H o te ls a n d re s ta u ra n ts
2 ,9 %
C o n s tru c tio n s9 ,0 %
R e a l e s ta te , re n tin g a n d o th e r s e rv ic e s fo r
b u s in e s s 0 ,6 %
Figure 3. Structure of rural entrepreneurial initiative in Romania, by activity sectors in the year 2007 – % in total number of employersSource: NIS, Yearly Statistical Yearbook
The mechanisms of the Romanian rural economy system are not fully functional yet, the rural business structure being still deficient in the area of services – other than retail trade – which should facilitate the development of enterprises in the primary and secondary sectors.
Figure 4. Entrepreneurs‘ evolution by activity sector (2005-2007)Source: NIS, Yearly Statistical Yearbook
In dynamics terms, structural changes have appeared in the Romanian private rural economy system, the invested capital in the private business mostly shifting to the sector of constructions, followed by the financial intermediations and manufacturing (Figure 4). It seems that the rural busi-
Monica Tudor, D
an Marius Voicilas

75ness environment is not capable yet to build up and support structurally ba-lanced development, providing insufficient business success opportunities in the fields of: Transport, storage and communications; Agriculture, hunting and forestry; Hotels and restaurants, etc., the number of which decreased in the period 2005-2007.
The development of the constructions sector is largely determined by an in-creasing demand from the part of the population that invests in the renovation or building up of dwellings and less in building up of support technical infra-structure for business development. What endangers the long-term sustainabi-lity of the rural economic system and its capacity to provide job opportunities is the significant diminution of the number of entrepreneurs activating in the sectors of transport and storage; agriculture; hotels and restaurants.
The diminution of the number of private firms having as activity object the transport and storage is a critical issue, as the main problem in the marketing of rural products is the missing link that should connect the di-rect producers to processors and/or final consumers. The disappearance or diminution of the number of those that provide these services in the rural communities will make the situation more difficult for the product flows from producers to market, and will increase the selling costs of products for the direct producers. The small business in the sector of hotels and restau-rants (where the rural boarding houses are included) seems to suffer from the poor promotion and advertising of Romania’s tourism, landscape and traditional rural cuisine.
The rural entrepreneurship capacity to have an active contribution to su-stainable economic growth, to provide jobs and contribute to the general welfare increase has an optimizing trend because: the total number of entre-preneurs is increasing; the share of employers in the employed population is on the rise. Entrepreneurs’ innovating capacity is increasing in Romanian rural area because the share of young people increased in the age structure of employers.
Labour force in rural Romania - demo-occupational trends
After 1990, Romania’s rural population experienced a moderate tendency of population ageing, which affects the demographic regeneration capacity. The direct effect of demographic ageing is the decrease of the rural population number, which is also amplified by other demographic and occupational fac-tors, such as the rural population migration to the urban areas or to foreign countries. In the last twenty years, Romania’s rural population decreased by 10%, the rural area depopulation generating a contraction of demand of goods and services in the rural areas, which makes this area less attractive for the new entrepreneurial initiatives, mainly in the rural areas where the ageing and depopulation phenomena are more pregnant.
Innovation and real labour force in rural areas as a basis of future rural development

76
0 , 8 5
0 , 9 0
0 , 9 5
1 , 0 0
1 , 0 5
1 , 1 0
D e m o g r a p h i c a g e i n g( + 6 5 / 0 - 1 4 y e a r s )
L a b o u r f o r c e r e n e w a l( 1 5 - 2 9 / 3 0 - 4 4 y e a r s )
2 0 0 52 0 0 62 0 0 72 0 0 8
Figure 5. The evolution of the rural demographySource: NIS, tempo on-line, www.insse.ro
The labour renewal resources are exhausted in the Romanian rural area; the ratio of the population at the beginning of the active period (age group 15-29 years) to the population in the middle of active life (30-44 years) experienced an accelerated decreasing trend in the period 2005-2008 and it became less than one in the last year of the investigated period. This evolution will deter-mine an accelerated ageing of labour force itself, as in the age structure of the active population, the young people will have an increasingly lower share, while the share of the mature and old population will increase. Active popula-tion ageing has a negative impact upon the population dynamics on the rural labour market. Labour force ageing is accompanied by the decrease of the labour force innovating capacity, occupational mobility and of the capacity to assume the risk of occupational status change. All these represent risks for the implementation of new entrepreneurial initiatives in the rural area.
The rural population’s occupational mobility, in general, followed an ascen-ding trend, the number of people employed in the primary sector of the rural economy decreasing by 4.1% in the period 2005-2007, in favour of the em-ployment increase in the secondary (+7.4%) and tertiary (+10.5%) sectors. In spite of this, over 60% continues to be employed in agriculture, due to the lack of off-farm employment opportunities in other activities of rural economy and the low educational level.
The occupational mobility analysis by age groups reveals significant dispari-ties with regard to the occupational behaviours, namely:
• The largest part of those who give up farming activity are the young people, less than 34 years old;
• The young active population is not included in an ascending occupa-tional mobility process; most of those who give up the agricultural business do not find a job in the secondary and tertiary sectors;
• Private entrepreneurs in the rural area who have a business in industry, constructions or services sectors prefer to hire labour from the cate-gory of mature active life (35-44 years) or even older, maybe taking into consideration the work experience accumulated by these groups.
Monica Tudor, D
an Marius Voicilas

77
-120-100
-80-60-40-20
020406080
thou
. per
sons
popocupata
totala
15-24 25-34 35-44 45-54 55-64 >65
Agricultura Industrie si constructii ServiciiAgriculture Indistriy and constructions Services
Total emplyment
Figure 6. Structural modification of rural employed population by age, by activities 2007-2005Source: NIS, tempo on-line, www.insse.ro
Although the young labour force is ready to accept an ascending occupational mobility, the weak development of the Romanian non-agricultural rural eco-nomy system results in low occupational opportunities; furthermore, the rural population’s training is also a factor that constrains the ascending occupatio-nal mobility. of the rural population. Thus, more than 45 % of the employed population continues to have a low educational training in rural Romania.
As the development stage of the rural economy does not provide sufficient occupational alternatives for its active population, intra-rural occupational mobility is substituted by searching for a job in the urban area and/or abroad.
Figure 7. Educational structure of employed rural populationSource: NIS, tempo on-line, www.insse.ro
Real labour force in rural areas
The external migration flows for jobs from CEE countries to West European countries are motivated, on one hand, by the lack of occupational alternatives in the origin countries, and on the other hand by the significant differences
Innovation and real labour force in rural areas as a basis of future rural development

78 between the labour remuneration in the origin countries and the West-Euro-pean countries, as main destinations of the circulating migration flows. The job deficit in the CEE countries is much stronger in the rural areas, so that the pressure upon the occupational migration is greater with the active population in these areas. For instance, while officially 1.2 million Romanians left abroad for working on contract basis, the estimations of the specialty studies reveal that in reality their number is at least double, as here those people are included who are working abroad without being registered at the labour force migration offices. As a result, about 2.5 million Romanian people are working abroad. Out of these, the studies indicate that 50% (Dumitru, Diminescu, Lazea 2004; Migration Office) come from rural area. About 4.5 million active people are living in the rural areas. Hence about 1/3 of these people left for work abroad.
In the areas of origin of the migratory flows, the dislocation of the labour force generates a diminution - temporary diminution or for variable periods of time – of the disposable labour force; in the areas of destination, it results in an increase of the available labour force. That fact shifts the equilibrium point on the labour markets in both regions mentioned above. In the structure of rural population involved in circulatory migration to foreign countries, it is the young active population that prevails, the largest part of those who leave to work abroad having an educational level above the rural average.
05
1015202530354045
%
<15years
15-24 25-34 35-44 45-54 55-64 >65
ag e g ro u ps
Figure 8. The structure of rural population involved in circulatory migration to foreign countries (a) by age and (b) by educational levelSource: Capacities Project – DALFI 2008/2010, coordinator IEA (field surveys in 4 representative communes from the point of view of the experience in migration abroad – September 2009)
Monica Tudor, D
an Marius Voicilas

79The data from the field survey conducted in September 2009 on certain repre-sentative samples of holdings in four Romanian communes reveal the fact that the access on the labour markets of other countries substitutes the employment in agriculture of the rural active population belonging to the age groups 15-34 years. The rural population’s reaction to the low job supply in the rural area is the territorial mobility of the labour supply to those areas where the business environment is more developed and the labour market is functional. The men and the women from the rural active population are equally included in the migration flows to work abroad.
The size of the circulatory migration phenomenon for work – both in Roma-nia and abroad – results in a significant decrease of the active population that effectively supports the labour force supply at a certain moment, in a certain rural area. A simple estimation of the real available active population on the basis of the data from the survey conducted in September 2009 under the pro-ject DALFI2 reveals that in total active population with the domicile in the four communes from the sample, only 37.7% is permanently present in the commu-ne and thus supports the labour force supply at commune level (Table 1).
Table 1. Structure of active population and the real available active population at community level
Active population with the domicile in the households included in sample, out of which:
- % of active persons permanently present in the commune 37.7 37.7 37.7 - % of persons working in another commune 4.0 4.0 - - % of persons working in another town 26.4 26.4 - - % of persons working in a foreign country under occupational arrangements shorter than 6 months 4.6 4.6 - - % of persons working in a foreign country under occupational arrangements longer than 6 months 27.3 - -
Active population with the domicile in the households included in sample
100
out of which:
Total active population according to LFS definitions 72.7 Real available active population at commune level according to DALFI 37.7
Source: Capacities Project – DALFI 2008/2010, coordinator IEA (field surveys in 4 representative communes from the point of view of the experience in migration abroad – September 2009)
At the same time, the other 30.4 % of the active population domiciled in the inve-stigated communes is working in other localities in the country, being included on a large scale in the daily commuting flows. The share of rural active popula-tion included in the circulatory migration flows to work abroad reaches 31.9%, the largest part having occupational arrangements longer than six months.
The analysis of the active population structure on the basis of the data from the field survey highlights the need to revise the statistical indicators regarding the calculation of labour force indicators in the European Union Labour Force Survey (EU-LFS) due to the impact that the circulatory migration to work has upon the real available labour force.2 Capacities Project – DALFI 2008/2010 (Coordinator: IAE, Bucharest; Partners: ICES “Gh. Zane” Iasi; USAMVB, Timisoara; Pitesti University)
Innovation and real labour force in rural areas as a basis of future rural development
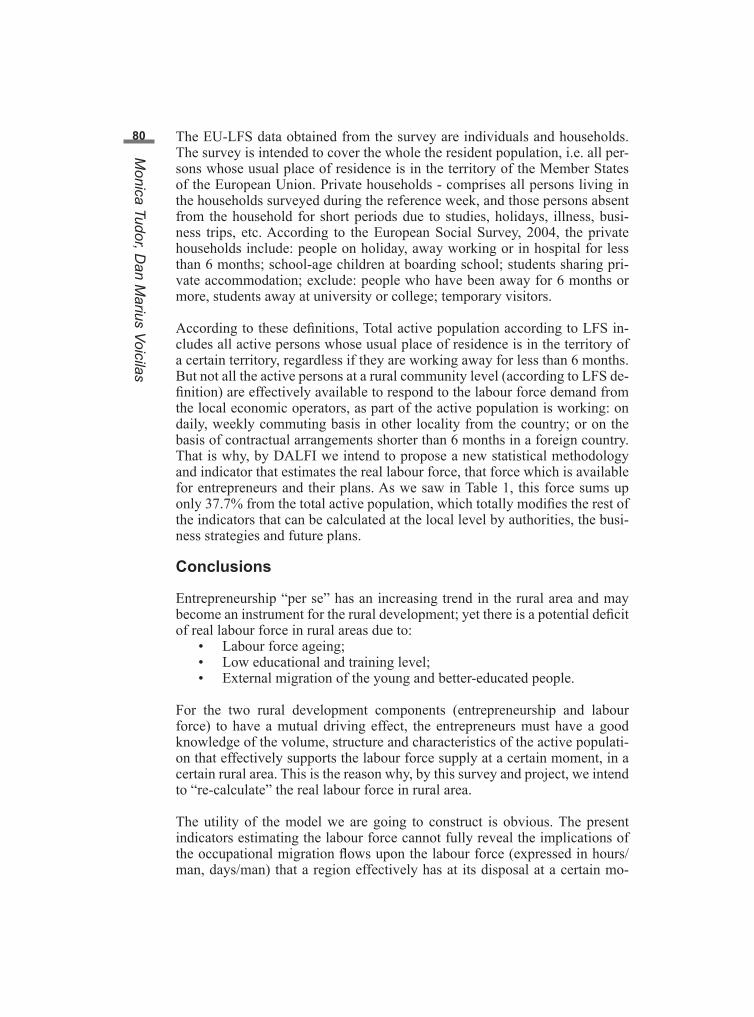
80 The EU-LFS data obtained from the survey are individuals and households. The survey is intended to cover the whole the resident population, i.e. all per-sons whose usual place of residence is in the territory of the Member States of the European Union. Private households - comprises all persons living in the households surveyed during the reference week, and those persons absent from the household for short periods due to studies, holidays, illness, busi-ness trips, etc. According to the European Social Survey, 2004, the private households include: people on holiday, away working or in hospital for less than 6 months; school-age children at boarding school; students sharing pri-vate accommodation; exclude: people who have been away for 6 months or more, students away at university or college; temporary visitors.
According to these definitions, Total active population according to LFS in-cludes all active persons whose usual place of residence is in the territory of a certain territory, regardless if they are working away for less than 6 months. But not all the active persons at a rural community level (according to LFS de-finition) are effectively available to respond to the labour force demand from the local economic operators, as part of the active population is working: on daily, weekly commuting basis in other locality from the country; or on the basis of contractual arrangements shorter than 6 months in a foreign country. That is why, by DALFI we intend to propose a new statistical methodology and indicator that estimates the real labour force, that force which is available for entrepreneurs and their plans. As we saw in Table 1, this force sums up only 37.7% from the total active population, which totally modifies the rest of the indicators that can be calculated at the local level by authorities, the busi-ness strategies and future plans.
Conclusions
Entrepreneurship “per se” has an increasing trend in the rural area and may become an instrument for the rural development; yet there is a potential deficit of real labour force in rural areas due to:
• Labour force ageing;• Low educational and training level;• External migration of the young and better-educated people.
For the two rural development components (entrepreneurship and labour force) to have a mutual driving effect, the entrepreneurs must have a good knowledge of the volume, structure and characteristics of the active populati-on that effectively supports the labour force supply at a certain moment, in a certain rural area. This is the reason why, by this survey and project, we intend to “re-calculate” the real labour force in rural area.
The utility of the model we are going to construct is obvious. The present indicators estimating the labour force cannot fully reveal the implications of the occupational migration flows upon the labour force (expressed in hours/man, days/man) that a region effectively has at its disposal at a certain mo-
Monica Tudor, D
an Marius Voicilas

81ment. There are two main parts involved in this calculation: the country of origin and the country of destination. In the areas of origin of the migratory flows, the dislocation of the labour force generates a diminution - temporary diminution or for variable periods of time – of the disposable labour force; in the areas of destination, it results in an increase of the available labour force. That fact shifts the equilibrium point on the labour markets in both regions mentioned above.
Our partial results, after the survey conducted in four communes, underline the hypothesis that the reality is different than in statistics. The discrepancies between the data available from EU-LFS, the data available from ESS-2004 and the results of the survey done under the DALFI Project are huge. That is why the estimation of the real labour force is necessary and the present stati-stics must be updated with new indicators and methods.
References
Baumol W., Litan R., Schramm C., (2007). ‘Good Capitalism, Bad Capita-lism, and the Economics Growth and Prosperity’, Yale University Press.
Lafuente E., Driga O., (2007). ‘1st Report on Entrepreneurial Activities in Romania. Center for Entrepreneurship & Business Research.’ CEBR wor-king paper series, WP 01/2007. -http://www.kfacts.com/uploads/File/WP012007.pdf.
Vaillant Y., Lafuente E., (2007). ‘Do Different Institutional Frameworks Con-dition the Influence of Local Fear of Failure and Entrepreneurial Examples over Entrepreneurial Activity?’ Rutledge Taylor and Francis Group, Volume 19, Issue 4 July 2007, Entrepreneurship & Regional Development, pages 313 – 337, Rutledge Taylor and Francis Group.
European Commission – ‘Rural Development Policy 2007-2013’, http://ec.europa.eu/agriculture/rurdev/index_en.htm.
European Commission - ‘Seventh Framework Programme’.OECD (2006). ‘The New Rural Paradigm: Policies And Governance’.Estrin S., Meyer K. E. and Bytchkova M., (2006). ‘Entrepreneurship in Tran-
sition Economies’, in Casson M., Yeung B., Basu A. and Wadeson N. (eds), The Oxford Handbook of Entrepreneurship. Oxford: Oxford University Press: 693-725.
Işfănescu Ramona (2008). ‘Rolul iniţiativei antreprenoriale în organizarea spaţiului geografic din Banat’, teza de doctorat, Bucureşti 2008.
*** Capacities Project – DALFI 2008/2010 (Coordinator: IAE, Bucharest; Partners: ICES “Gh. Zane” Iasi; USAMVB, Timisoara; Pitesti University)
*** NIS, tempo on-line, www.insse.ro.*** NIS 2009, Yearly Statistical Yearbook.
Innovation and real labour force in rural areas as a basis of future rural development


83Ryszard Kamiński1 Polish Academy of Sciences, Institute of Rural and Agricultural Development, Warsaw, Poland
Investment in social infrastructure in rural areas – does it support the development of social capital?
Abstract: The state of rural social infrastructure and its impact on the quality of life and functioning of rural communities are traditionally seen as marginal to the “mainstream” development activities. The low quality of social infrastructure is, however, an important factor in the marginalization of rural areas. In the period 2007-2013 there is a possibility to implement thousands of projects related to ru-ral social infrastructure. The main question is: in view of the large financial scope of the projects implemented from EU funds, will there be enough commitment and common sense to ensure appropriate impact on social capital?
Keywords: rural development; social infrastructure; social capital in rural areas; quality of life in rural areas
Rural, not necessarily agricultural landscape
The implementation of the Common Agricultural Policy fulfilled its objective, i.e. to achieve self-sufficiency in food production for the member states of the European Economic Community. In time, the continuation of this policy turned out to be a factor unfavourable for the rural areas themselves. The permanent increase in production intensity led already in the 1970’s to serious and costly food surpluses. Industrialisation of the agricultural production re-sulted in imbalances in the environment as well as disintegration of local com-munities. The number of farms was dramatically reduced, as was agricultural employment, which – in turn – resulted in the liquidation of schools, offices, shops, public transportation and other facilities. These phenomena were ac-companied by a process of distrust in the food produced by industrial methods and increasing attention paid to the quality and safety of food production. In many publications of the 1980’s we find the remarks of several authors (e.g. Kaleta, 1992) who pointed out to the fact that rural life is suspended between

84 the traditional “rurality” and the urbanised, supra-local “neither rural nor ur-ban” character. Seamus O’Reilly, when describing the development of Irish agriculture and rural areas, said that the Common Agricultural Policy of the EU turned out simply to be incapable of creating the capacity for endogenous socio-economic development (O’Reilly, 1998) within rural communities.
In the on-going discussions about the European model of agriculture it is gen-erally assumed that it is necessary to ensure the viability of rural areas, includ-ing the traditional values of rural life. The concept of sustainable rural devel-opment should take into account several functions of rural areas, including food production, maintaining the natural environment, including landscape, and ensuring attractive conditions for living and recreation in rural areas. Ru-ral areas should become a good place to live, with high value natural envi-ronment and preserved cultural heritage. In order to make this happen it is necessary to ensure not only external support, but also the full utilisation of the endogenous resources. In section 46 of the preamble to EU Regulation 1698/2005 we find the following statement: “There is a need to accompany changes in rural areas by helping them to diversify farming activities towards non-agricultural activities and develop non-agricultural sectors, promote em-ployment, improve basic services, including local access to Information and Communication Technologies (ICTs) and carry out investments making rural areas more attractive in order to reverse trends towards economic and social decline and depopulation of the countryside. An effort to enhance the human potential in this respect is also necessary”.
The situation of rural areas in Poland several years after EU accession has undergone very dynamic changes. Transformation which has taken decades in other parts of Europe is taking place in Poland at a higher speed. For the last 20 years various authors have mentioned that there are more than 2 million farms in Poland. However, if one takes into account those farms which apply for EU direct payments, for which all farms are in principle eligible, it turns out that in 2007 there were only 1.468 thousand farms. According to the estimates of the Institute of Agricultural and Food Economics, there are 750.000 farms which produce as much as 90% of the agricultural value added. Some authors go even further, indicating an even smaller group of 220 thousand farms which operate according to rules similar to those applying to companies in other branches of the economy. Farmers in this group have similar efficiency as their peers in EU-15 and their farms provide 63% of the total volume of production, and cover almost 50% of all utilised agricultural area (Józwiak 2008).
Officially there are almost 2 million people employed in the Polish agricul-tural sector, i.e. a little more than 15% of the total employment. On the aver-age, there are 12.2 persons employed per 100 ha of UAA (Statistical yearbook Warsaw 2008). Only one out of three rural inhabitants lives in a family which owns a farm of more than 1 ha. Poland has a ratio of rural inhabitants (38.6%) close to that of other new EU member states, as well as such “old” MS as Ireland, Finland, Portugal or Greece. At the same time 11% of all rural inhabit-
Ryszard Kam
iński

85ants of EU-27 live in Poland (Frenkel 2008). For the last few years the migra-tion balance to rural areas has been positive. At present there are 14.756.000 inhabitants, i.e. 0.4% more than in 2004, but it should be borne in mind that rural areas cover everything beyond administrative borders of cities, which certainly affects the presented data. Apart from the natural growth of rural populations, all opinion polls, research results and observations show that in most rural families, migrations to other countries or at least to the neighbour-ing big cities, are a common phenomenon.
Some years after EU accession, the Polish rural areas are losing their exclu-sively agricultural character and are beginning to fit the definition of J.D. Van der Ploeg, who in 2000 (Van der Ploeg, 2000) said that “rural areas are no longer the monopoly of farmers”. In Poland there are thus 1.5 million farms and in future only 15% of them may be able to survive. There is a danger that the Polish countryside will become depopulated, if most of those people who do not have a chance to remain farmers decide to leave their area. Even if new inhabitants come to rural areas, their expectations concerning rural life will be very different. All of this will have enormous consequences for rural communities, their internal relationships and changes occurring in them. Improvement of rural infrastructure has been mentioned as one of the major objectives of the Rural Development Programme 2007-2013 as well as of the regional programmes financed from the European Regional Development Fund. Is there a chance that such significant investment in elements defined as “social infrastructure” could improve the state of social capital? How do the inevitable changes inside rural communities affect the needs concerning technical infrastructure and its impact on the social capital?
Social infrastructure – millions of Euro and people
The state of rural social infrastructure and its impact on the quality of life and functioning of rural communities are traditionally seen as marginal to the “main-stream” development activities. The low quality of social infrastructure is, how-ever, an important factor in the marginalisation of rural areas. In the first pro-gramming documents after Poland’s accession to the EU the following diagnosis is presented: social infrastructure in rural areas is under-invested and does not correspond to needs. In particular, cultural and tourist establishments as well as schools and health care centres are insufficiently developed. Since the year 2004, the most important programme to finance investments in social infrastructure is the village renewal programme, which had an allocation of EUR 112.5 million in the Sectoral Operational Programme for Agriculture and Rural Development 2004-2006, and within the Rural Development Programme for the years 2007-2013 this allocation is even more significant and is expected to reach EUR 589.6 million. Approximately 17.000 investment projects in 4.840 villages are expected to be implemented. More than 50% of all village renewal funds for the year 2004-2006 were used to modernise village halls and the so-called “other public meeting places”. Of course one can ask the question: how can such “financial injection” into social infrastructure affect the life of rural communities?
Investment in social infrastructure in rural areas – does it support the developm
ent of social capital?

86 Previous research by the author (Kamiński , 2008) shows that village halls are, according to the answers of village leaders, used primarily as playing ground for children. Other functions are mentioned less frequently, such as: organisation of meetings, trainings, family events. Children’s activities are not organised on a regular basis and the village halls often remain unused because of lack of personnel, e.g. someone to take care of the children or other organi-sational obstacles. In the municipal budgets it is increasingly difficult to find resources for village hall personnel, and most village leaders have been strug-gling for years for funds for running costs, heating, small-scale equipment etc. While EU funds can result in the physical renovation of thousands of village halls, the question of how these establishments will function remains open. How will the running costs be financed?
The answers should be found in the delivery mechanisms of the programmes. The best examples are two models of implementation of village renewal, a method used in Poland already ten years before EU accession.
Two faces of the Polish village renewal
Before EU accession – genuine bottom-up initiatives of village leaders supported by local authorities
Activities undertaken in Poland within the village renewal approach in mid-1990 are primarily concentrated in the Opolskie voivodship (region). It was as-sumed at that time that the most important element of village renewal is to pre-pare the Renewal Plan of the village (sometimes called the Village Development Plan), the starting point of which was a kind of resource audit carried out by the inhabitants themselves and involving the inhabitants’ realisation of the value of their village and surrounding areas in view of the changes going on in the global perspective. Although village renewal happens in a rural community (village, settlement), the model of practical action developed first in the Opolskie region and later repeated in several other voivodships assumed the creation of a certain structure which would support the village, which does not have a legal entity in Poland. In addition to the individual villages, the decision to take part in the programme was taken by the municipal authorities, who appointed a coordina-tor – a person responsible for the programme and cooperating with the village leaders. On the other hand, at village level a group should be formed, called “the village renewal group”, which could be an informal group but in many cases this role was taken by the village council, and sometimes another legal entity, e.g. an association. The task of this village renewal group was to carry out a number of meetings with inhabitants, leading to the development of a village renewal plan. After consultations with the municipality and other entities this plan was public-ly approved (in a village meeting) and the inhabitants undertook a commitment to implement it, sharing tasks between themselves. In this model the municipal authorities defined the scope and amount of eligible support, and on some occa-sions they took the role of investor or donor, and sometimes they would transfer the necessary assets or tasks and funding to the village community.
Ryszard Kam
iński

87An important element of the regional programme (implemented primarily in the Opolskie and Pomorskie voivodships before Poland’s accession to the EU) was the creation of a support programme by the regional authorities. Or-ganisation of sophisticated training programmes, workshops and conferences for village leaders involved in the village renewal programme was certainly an important motivation for many rural communities to become involved in the programme. Before EU accession the financial transfers for starting the implementation of village plans were quite small. In the most generous edi-tions of the Pomorskie village renewal programme they reached PLN 60,000 (around EUR 15,000) per project, and in Opolskie they were usually between PLN 10,000 and 20,000. In the pilot village renewal programme of the Naklo powiat (county) they did not exceed PLN 5,000 (EUR 1,000-2,000) for one operation. However, the funding was always provided for projects of which the rural inhabitants were the initiators and they took responsibility for every-thing included in the renewal plan.
Village renewal from EU funds – a rather bureaucratic programme for small investments by municipalities
After 2004 village renewal became one of the measures financed from EU funds for rural development, which resulted in a totally different model of its implementation. Funding from this programme became suddenly available for almost all Polish municipalities. Unfortunately, most of them treated the fund-ing for “Village renewal” as one more source of financing their small-scale investments. If there was a formal requirement to develop a village renewal plan, a municipal official was appointed to be responsible for its development. In this way the original methodology of village renewal, involving a bottom-up process of developing a village plan and integrating the inhabitants around its implementation, was in many cases lost.
Due to the supposed difficulty in objective selection of projects, already at the stage of programming the Sectoral Operational Programme 2004-2006 any qualitative criteria for project evaluation were disregarded. The selection of projects (i.e. villages) where village halls were to be renovated or sports centres, playgrounds, tourist or heritage centres created, was carried out on the basis of tax income of the whole municipality, unemployment and tour-ist attractiveness measured by the number of tourist facilities entered into the records of the given municipality (not the village concerned!). A certain opportunity to introduce qualitative evaluation was created by the so-called “regional criterion” which could be defined by the regional authorities. The mandatory village renewal plan and its relationship to the planned investment were not evaluated at all in the process of project selection. In 99% of cases the investor was the municipality which implemented projects allocated by the regional authorities. The inhabitants of the village, who before accession were not only the authors of the village renewal programme, but also the persons responsible for the development and implementation of most activities, this time for procedural reasons were practically banned from the implementation
Investment in social infrastructure in rural areas – does it support the developm
ent of social capital?

88 of EU-funded projects. It was the municipality which selected, in the process of public procurement, the contractor – a company which carried out all the investment work. Quite apart from the fact that such procedure significantly increased the cost of the operation, we return here to the disastrous model of relationships where village inhabitants are “serviced” by the municipal office, and it is this office which takes final decisions concerning tasks implemented in a given village. In the original approach to village renewal these relation-ships were completely different.
One should add here that the lack of involvement of the beneficiaries is not the result of “EU bureaucracy”, since there are many examples of projects from all over Europe where rural inhabitants themselves carried out most of the work and their involvement was adequately valued (Mosley, 2000). Even in Poland, in operations carried out at the same time (between 2004 and 2006), financed from the European Social Fund, the possibility to involve and value the work of volunteers was envisaged. It is to be feared that in many cases the idealistic principles of village renewal will be reduced to a programme of small-scale municipal investment financed from EU funds. Many facilities needed for rural areas will be created in this way, but will they be accompanied everywhere by the necessary development of self-organisation and involve-ment of rural inhabitants? The experience with investment from EU funds in many countries shows that while it may be difficult to obtain funding to build a village hall, sports centre or culture house, it is even more difficult to maintain them in operation! Without a considerable involvement of the in-habitants, a sense of ownership and responsibility by the local community for what happens with the acquired assets, one can easily imagine how huge are the costs which would be involved in the maintenance of such facilities. Managing a village hall and organisation of an internet cafe there, organisa-tion of afternoon activities for children, youth and adults, running a sports club, festivals, taking care of the local food products, crafts classes, cleaning up of the playground or village square: all of these services can be provided by the inhabitants themselves. Can be provided – if the municipal, voivodship and other authorities will perceive these activities as a comprehensive action towards improving the quality of life, carried out jointly with the rural inhabit-ants. Then it is possible to “gain” an additional extremely important asset of the rural community – social capital.
The above described dissociation of investment projects from the local com-munity in Poland is related to the administrative system in which the indi-vidual villages do not have a legal entity, a separate budget and cannot indi-vidually apply for funds. In this way the local communities numbering several hundreds, sometime more than a thousand inhabitants, are entirely dependent on the municipality as the higher-level administrative unit. Recently an at-tempt has been made to at least partly improve this situation. In 2009 the law about village fund has come into effect, which gives certain funds to the local villages (in the range of EUR 1-5 thousand) to be used for small-scale opera-tions at the village level.
Ryszard Kam
iński

89Social infrastructure can have a significant impact on preventing the erosion of social capital. However, this process must empower local communities, which must have a sense of ownership and take responsibility for the function-ing of the village hall. It is clear that this element was missing in the design of the Polish development programmes. Thus, investment in social infrastructure may not always lead to the strengthening of rural social capital.
Transferring responsibility for rural life to the inhabitants
In many descriptions of the Polish situation after the 1989 changes rural areas are often shown as the place with lower degree of self-organisation and lower social capital. This is confirmed by the so-called “social diagnosis” carried out regularly in subsequent years, by data of organisations monitoring the official activity of NGOs (Herbst, 2006) as well as by a report describing the situation of the Polish rural areas (Report, Gorlach, 2000). The voices defending the image of rural areas as a place for civic initiative did not find significant support until the period 2006-2008. At that time, in the biannual report “Rural Poland 2008”, Jan Herbst mentions as many as 43.5 thousand organisations making up the rural “third sector”. This number is composed of 27 thousand associations, including 16.5 thousand voluntary fire brigades, 700 foundations as well as 3.5 thousands of rural professional or economic organisations, in particular women’s centres, producer organisations, around 3,500 organisations of professional and econom-ic self-government, such as agricultural circles and producer organisations, 900 other organisations such as hunting units or mutual support groups, 1,300 trade unions – non-agricultural, as stressed by the author, since the agricultural ones do not have a legal entity, 4,000 agricultural cooperatives, 8,000 organisational units of the Catholic Church and other churches, as well as other entities such as water companies, flood wall unions, soil and forest communities. According to a previous work by J. Herbst, the frequently quoted results of Social Diagnosis, including research by the European Social Fund carried out in 2006, which refer to the passive attitudes of rural inhabitants “do not apply the same measure to the voluntary and charity organisations doing work in the Polish rural areas. In the rural environment most of the joint activity is not catalysed by institutions, but by informal networks of cooperation and mutual aid, which are not easy to capture at the statistical level” (Ibidem, p. 166). This phenomenon is quite obvi-ous to people dealing with rural communities, but they are rather important from the point of view of the level of rural knowledge by a wider group of researchers. Kurczewski (2006) wrote that “in the rural area the existence of any organisation is difficult to establish due to the lack of distinction between social and neigh-bourhood links and organisational relationships”. Jeremy Rifkin reminds us that the railway, the steam engine, automobile, airplane, wireless, telephone, and later radio and television helped to reduce time and space. A hundred years ago one could get to know several hundreds of people in the whole lifetime, while at the end of the 20th century one can meet as many people within less than a week (Rifkin, 2000). All of this affects the personality and quality of human relation-ships. The contemporary rural communities have certainly much in common with the traditional forms (not all of their members meet hundreds of new peo-
Investment in social infrastructure in rural areas – does it support the developm
ent of social capital?

90 ple each week), but a new factor has appeared which significantly changes the human relations, i.e. the general accessibility of the external world through the media. According to Herbst (2008), who quotes the European official statistics, the Polish people less frequently than others look into the socio-political press, but they are no different from other Europeans in the use of radio and television to follow the current events. One can risk the conclusion that it is this practically unlimited access to radio and television, and recently also to the internet, which results in a serious modification of the functioning of traditional rural communi-ties, their willingness to meet, spend time together etc.
It is therefore not enough to build a village hall to make the place full of life and noise made by the old and the young. One should ask the question whether a given community has some bottom-up initiative, a group, an organisation or association which would like to benefit from this possibility to spend time together. Walzer (1999) wrote that many people today look at civil society in the hope that it can solve the problems which used to be the domain of the state – first of all the prob-lems of poverty, unemployment and exclusion. One should not expect that civil so-ciety organisations will solve today all the problems of rural areas, but without rural organisations one cannot dream of solving any problems of rural communities.
Associations to save rural schools – an example of bottom-up civic initiative
An example of a bottom-up initiative is the creation in many Polish villages of non-public schools run by community associations. It was a spontaneous reaction of many rural societies to the closing down of their village school. The way in which the national school network was reformed by transferring the decision as to the nature of such schools to local self-governments, caused many local economic and social conflicts concerning the existence of such schools in small areas. On the one hand, the low educational subventions and demographic trends have forced self-governments to economize. On the other hand, the closing down of rural schools will cause irreversible losses for village communities. The idea to solve the conflict concerning rural schools for village families and inhabitants is to establish local associations. These associations would act as founding bodies for the local schools. The establishment of an association for the development of rural areas leads to creating schools that are more active and more economical at the same time. It also helps to integrate lo-cal communities. According to the estimates of the Federation for Educational Initiatives (Komorowska, Radwański 2002), 400 private schools (with public status) were established in Poland between the years 1998-2008. Additionally, 300 local communities are threatened by school closures every year.
There is evidence that many rural associations implement cultural activities and take up actions in the sphere of social services, health care and care for the disa-bled. Sport and tourist activity involves children and teenagers as well as adult inhabitants. The direct commitment of parents and pupils as well as the creation of a “family atmosphere” facilitates the process of solving pupils’ behavioural prob-
Ryszard Kam
iński

91lems. Some associations also carry out a variety of business activities, active-career teaching and other forms of adult education for village inhabitants. Such institu-tions are open all day, throughout the whole year, serving as the heart of village life.
The LEADER approach – will it fill the gaps left by other programmes?
The significant changes described above concerning the structure of rural com-munities, sources of income and the way of life of rural inhabitants, as well as the newly emerging possibilities of investment support – mainly from EU funds – require great care and in-depth analysis. Decisions about investment directions in rural areas should be based on reliable analysis and should be de-volved as much as possible to the lowest levels of decision-making. In Europe, a well-established method of doing this seems to be the wide application of the bottom-up territorial development implemented by the local actors, i.e. the LEADER approach. In the period 2007-2013 over 300 Local Action Groups will implement their development plans over most areas of Poland. Although many municipal authorities treat the LAG as an additional source of financ-ing rural investments, the mechanism of partnership in the implementation of the local development strategies allows us to hope for a better integration and co-existence between the various actions than has been hitherto possible. In addition, as a result of lobbying by the Polish NGOs, certain elements have been introduced to the LEADER approach that strengthens the bottom-up civic initiatives. Among the project types eligible for the LAG funding, in addition to investments in rural infrastructure under village renewal, measures for micro-enterprises and diversification towards non-farming activities, there are also the so-called “small projects”. These are small grants of up to EUR 5.000 which should support bottom-up rural initiatives; in particular they can serve to “re-vive” the larger investments into social infrastructure.
One of the questions that should be asked now is: in view of the large financial scope of the projects implemented from EU funds, will there be enough com-mitment and common sense to ensure appropriate impact on social capital? Will the bureaucracy related to EU programmes permit a widespread sup-port to local communities, enabling a synergy effect between investment and bottom-up capacity building?Generally, even large amounts of funding from a variety of sources to finance investments do not guarantee the “viability” of rural areas. It is certainly not only a matter of building facilities that improve the quality of life which is a decisive factor whether a given area will be a “living countryside”.
References
Council Regulation No. 1698/2005 of 20 September 2005, Official Journal of the European Union.
Final declaration, Congress of European Agriculture – Verona 1999.Final declaration, Rural Development Conference Salzburg 2003.
Investment in social infrastructure in rural areas – does it support the developm
ent of social capital?

92 Frenkel I,. Ludność Wiejska, Polska wieś 2008 (Rural population 2008) in: Raport o stanie wsi (Rural Poland 2008), Foundation for the Development of Polish Agriculture, Warsaw 2008.
Gumkowska M., and J. Herbst. Podstawowe fakty o organizacjach pozarza-dowych – raport z badania 2005 (Basic facts about NGOs – reports from studies), Klon/Jawor Association, Warsaw 2006.
Herbst J., Wieś Obywatelska (Civic Rural Areas) in: Rural Poland 2008. A report on rural situation, edited by J. Wilkin and I. Nurzynska. FDPA, War-saw 2008.
Jozwiak W., Nowe warunki rozwoju rolnictwa (New conditions of agriculture development) in: Wyzwania przed obszarami wiejskimi i rolnictwem w per-spektywie lat 2014-2020 (Challenges for rural areas and agriculture in the perspective of years 2014-2020), ed. M. Klodzinski, IRWiR PAN 2008.
Kaleta A, Podstawowe założenia odnowy obszarów wiejskich Europy (The Basics of Renewal of Europe’s Rural Areas) in: Odnowa wsi. Miedzy mitem a nadzieja (Village renewal. Between myth and hope) edited by Maria Wieruszewska, Polish Academy of Sciences, Institute for Agricultural and Rural Development, Warsaw 1992.
Kaminski R., How local organisations support rural residents in the reality of the EU, in: Polish Rural Areas and Agriculture in the European Union, ed. Drygas M. and Rosner A., Institute of Rural and Agricultural Development (IRWiR), Polish Academy of Sciences, Warsaw 2008.
Komorowska A. M., Radwanski P., How to set up an association and direct a small school, The Federation for Educational Initiatives, Warsaw 2002.
Kurczewski J. Lokalne społeczeństwa obywatelskie (Local civic societies) in: Local civic communities, ed. J. Kurczewski, Warsaw 2003.
Mosley M., Research project of Cheltenham and Gloucester College for „Ru-ral Development Programme in Dorset from 1994-98“ in: Leader+ „Dorset Chalk and Cheese“ Local Action Group Development Plan, Dorset 2000.
O’Reilly S. Rural areas and the EU, the case of Ireland, in: Rozwój obszarów wiejskich w perspektywie integracji z Unia Europejska (Rural development in the perspective of EU integration), Andrzej Kaleta (ed.), Institute of So-ciology, Nicolaus Copernicus University, Torun 1998.
Report on social development, Poland 2000. Rural development, 2000. Ed. K. Gorlach, UNDP, Warsaw 2000.
Rifkin J. The Age of Access: How the Shift from Ownership to Access is Transforming Modern Life, London: Penguin Books 2000.
Social diagnosis (Diagnoza społeczna): Living conditions and quality of life in Poland – cyclical investigation carried out under the supervision of Prof. Janusz Czapinski and Tomasz Panek. Published by the High School of Fi-nance and Management in Warsaw, 2002.
Statistical yearbook, Central Statistical Office (GUS), Warsaw 2008.The Cork Declaration, Rural Europe – Future Perspectives, Cork 1996.Van der Ploeg J. D., Rural Development: from practices and policies towards
theory. Sociologia Ruralis, 4(40).Walzer M., Soss J., Welfare Provision, Civil Society and Democracy in the
United States, June 1999.
Ryszard Kam
iński

93Antonín Vaishar, Milada Šťastná, Zdenka Lipovská1 Mendel University of Agriculture and Forestry Brno, Zemědělská 1, 61300 Brno, Czech Republic
[email protected]; [email protected], [email protected]
Possibilities for development of regions after mining: restoration of rural environment in the Czech-Saxon borderland
Abstract: The paper discusses whether it is possible to turn a region after mining activities back to its rural substance. The micro-region Sokolov-East (Northwest Bohemia) was chosen as an example. The region was dramatically impacted by opencast coal mining after WWII. Also the settlement structure was modified. The mining activity still continues. Original state mines were privatised into the arms of local entrepreneurs. Thus, the mining company is interested in support of the local development. It shows that the landscape rehabilitation although very exacting and expensive is the minor problem which could be solved by the colla-boration between mining company and regional and local bodies. Social rehabi-litation seems to be much more difficult with respect to the special education and psychology of (from a big part immigrant) people and their weak relation to the landscape and localities. Also the improvement of a negative image of the region is a question of big importance.
Keywords: mining region; landscape reclamation; post-mining transformation; image; Northwest Bohemia
Introduction
The period of industrial society is associated with intense exploitation of na-tural resources. Opencast coal-mining presents one of the most aggressive influences on the landscape; usually it was accompanied by the development of energy sector and the related heavy industry, primarily chemical. Whilst coal mining was destroying vast areas of landscape, the related industry was degrading the natural environment by solid, liquid as well as gaseous wastes. Changes in the social structure of the stricken areas were also very intense.

94 Regions with small towns as centres, originally rural, became urbanized and industrialized. The decisive workforce, differing from the original inhabitants in a number of criteria, immigrated from other regions. They did not have, and in many cases they did not even form their relations to the area, soil, lands-cape, towns and villages. A specific social situation arose.
Post-industrial period has brought major changes. A number of deposits were nearly depleted, or mining ceased to be economically effective. Economic but also political conditions have changed. The value of the environment has increased. This has led to a gradual restriction of mining up to closing of in-dividual mines. A part of mine employees lost their jobs; nevertheless their qualification and social structure poses limits to the possibilities of their re-qualification. The specific social situation continues, albeit with other atten-dant phenomena and consequences.
The case territory is the area of Sokolov-East microregion. The special cha-racteristics of this microregion are given by the existence of a microregional union as a voluntary union of municipalities, the continued mining by the So-kolovská uhelná a.s. Company with the perspective of termination only in the years to follow, and also by the location of the region within the Czech-Saxon borderland with all consequences of post-war exchange of inhabitants.
The question is, by what means it is possible to reclaim the devastated lands-cape and environment, how to solve the social problems of after-mining regi-ons. Moreover there is the formulation of the problem of a potential possibility to use cross-border cooperation with the Saxon part. We even dare to question whether it is possible to at least partly restore the rural character of the origi-nally country regions. The initial analysis and discussion are the goal of the presented paper.
The works follow up with the international ReSOURCE project of INTER-REG III programme, and the Interests of Development in Border Regions pro-ject No. 2D06001 of the National research programme II by the Ministry of Education, Youth and Sports of the Czech Republic.
Theory and methodology
European mining regions gradually undergo inevitable restructuring changes (basically from West to East) (Haas and Neumair, 2005). The problems of Eu-ropean opencast mining regions may be divided into the following groups:
• Irreversible interventions into the landscape, its relief, geological sub-stratum, water regime, soils;
• Transformation of the original rural area into a territory of a usually polycentric character urbanized in a specific manner;
• Creation of a specific social structure of inhabitants with a great share of immigrants who have no relation to the area, and with a specific qualification structure.
Antonín Vaishar, M
ilada Šťastná, Zdenka Lipovská

95In relation to the gradual termination of mining or after mining it is usually necessary to solve the following issues:
• Is it better to try and restore the landscape to a state more or less similar as before mining, or to make use of the reality formed by mi-ning to create a new landscape? What should the character of this new landscape be like?
• Does the created settlement structure provide a basis for a further de-velopment? Is there a centre which could take on a responsibility for the entire region by an installation of the relevant tertiary functions? To what direction and on what impulses should such centre develop?
• What is the manner of solving the accumulated social problems in the spheres of employment rate, qualification, emigration and motivati-on? To what extent is the social system capable of restructuring, and how can its relative stability in the future be secured? How to solve the issue of a negative industrial and mining image of the region?
In the circumstances of the Czech mining regions there is another fact on top of these issues: a number of these regions are situated in the northern border-land. In the Middle Ages these regions were largely colonized by German settlers considered to be experts in mining. Owing to the events before, during and after World War II the German inhabitants were compulsorily transferred and replaced by new people with no relation to the local traditions. The que-stions may be extended by further ones:
• In this situation, does the borderland position present a barrier, or an opportunity? Would it be possible to compensate for the peripheral position from the national perspective by cross-border cooperation?
• Is it possible to restore a mining region to the state prior to commen-cing the intensive opencast mining, i.e. to a rural way of life? To this issue it would be suitable to discuss the difference between urban and rural.
It is fairly typical that the majority of articles in journals primarily deal with the influences of mining on the environment, and with changes and reclamati-on of the landscape. Social problems are sometimes conceived as a reaction to environmental degradation after mining (Turnock, 2001; Szabó et al., 2008).
So far analyses of social issues practically do not occur. Nevertheless from the angle of the future prosperity of regions after mining the solution of social system, qualification structure of mining and heavy industry workers, nega-tive image of the landscape and their implications is much more important, and mainly more challenging and long-term. Westermann (2008) mentions a formation of the so-called social regions. In the Czech literature the hither-to works mainly relate to the Ostrava-Karviná mining district (e.g. Vaishar, 2006). The issue of employment rate is frequently dealt with (Riley and Tko-cz, 1999); however this is not only a result of an absolute decrease of job op-portunities, but also a difficult re-qualification of the existing workforce.
Possibilities for development of regions after m
ining

96 From the methodological point of view the authors will use methods of re-gional geography including the study of literature and sources, statistic data analysis, field research, behavioural geography. Research of this type will be enhanced by sociological methods of structured conversation. From the appli-cation point of view the work is directed to the sphere of regional politics (c.f. Baeten et al., 1999).
It may be hypothetically assumed that carrying out of landscape modifica-tions is easiest, starting of new economic development is more complicated, and a very long-term and difficult to solve task will be the solution of social problems including the possibilities to use cross-border cooperation and to establish a new image of the region (Gwosdz, 2001 on the example of Up-per Silesia). As far as the revival of the rural way of life is concerned, this should be an attempt to create a multi-functional country with small towns as its centres, and with maintaining the achieved level of civilization. A question emerges whether it would be even possible to talk about a specific geography of miner (micro)regions (Wirth and Lintz, 2006).
Some experience of German regions is available concerning the after-mining revitalization. They come both from Ruhr as well as from Saxony (e.g. Dürr, 1993; Hüttl and Weber, 2001; Ganser, 2001; Krajewski et al.; 2006, Dickmann and Dickmann-Boubaker 2008). The majority are directed to the problems of landscape change and the creation of free-time activities. Also EU projects such as REKULA or READY (http://www.cadses.net/en/projects/apprpro.html?projectId=1522&topic=projects/apprpro) were directed preliminary to the landscape changes. In general, big cities in post-mining regions are looking for new prospects in the development of the service sector. But much less at-tention has been paid to the rural regions after mining activities until now.
The research is implemented in close cooperation with local self government bodies represented mainly by the union of Sokolov-East municipalities with the head office in Královské Poříčí, and the local Sokolovsko action group.
The Sokolov-East microregion
The fertile soil of the Ohře River basin was originally cultivated by the Slavs. During the German colonization in the 12th and 13th centuries an important role was played by the monastery in Waldsassen. Apart form agriculture the colonists also developed ore mining. Until the Thirty Years‘ War the admini-strative centre of the area and the support of central power were the fortified castle and the town of Loket. Sokolov remained a small serf town until the 18th century.
The 18th century saw a development of crafts (e.g. construction of organs) and also hop-growing. Although the existence of coal was known, originally it was rather pyrites and shales to be extracted at bed outcrops. In Staré Sedlo alum, vitriol and sulphuric acid were produced since the 16th century. Brown coal
Antonín Vaishar, M
ilada Šťastná, Zdenka Lipovská

97mining (initially underground at the sites of the richest beds) was developed in the 18th century as well. The sales possibilities improved first through an imperial road from Karlovy Vary to Cheb in the 1830s and by an extension of the Buštěhrad Railway from Chomutov to Cheb in 1880. Coal mining was followed by industrial production and Sokolov gained an industrial character. Since 1810 production of china has developed in Chodov with mechanical en-gineering, glassmaking and constructional production following later. In Loket pottery has been produced since 1815. By contrast, the last hop field closed in 1880, more or less terminating the agricultural character of the area.
Figure 1. Sokolov-East: the situationSource: mapy.cz
Job opportunities caused an immigration of Czech families from the interior, and a powerful Czech minority emerged in the region. Construction works were on the increase, public buildings – schools and ecclesiastical buildings - included. The more or less correct relations between the Czechs and the Germans lasted until World War I. A majority of the Germans took the break-up of Austria-Hun-gary negatively and were involved in the preparations for the Deutsch-Böhmen province. Easing of the situation came as late as in the latter half of the 1920s.
In the Sokolov region, world depression had a more marked effect than inland. Unemployment soared and societal tension increased, augmented after Hitler seized power in Germany. In a few years Henlein party took control over both the town and the district. Prior to the occupation by the German Empire in
Possibilities for development of regions after m
ining

98 1938 Czechs, German anti-fascists and Jews left Sokolov. After the war 25 % of the town was destroyed by bombing. The number of compulsorily trans-ferred Germans is estimated at 8,000. There were even intents not to renew Sokolov any more, and let the entire town make way for coal mining.
The post-war economy was characterized by a precipitant industrialization. In the 1950s and 1960s there was a mass-scale construction of new prefabri-cated blocks of flats for employees of industrial enterprises. Chemical plants in Sokolov and Vřesová emerged in the mining district. The energy sector is represented by enterprises in Vřesová and Tisová. Starý Chodov was al-most eliminated to give way to housing development for the workers of fuel processing plant in Vřesová and Chodos engineering company, a producer of presses for the rubber industry. The agricultural character of Březová was changed by a vast housing development for glass-making factories and mines in Dolní Rychnov. Coal mining and manufacture of glass and china also mar-kedly changed the character of Nové Sedlo.
The territory consists of a basin filled mostly with acid sands and clays, with a number of waterlogged sites, and with biota considerably disturbed by open-cast mining. Most of the bioregion area was cleared, in the existing forest stands secondary wood plant composition prevails (spruce, pine). Formerly meadows and pastures were widely represented, in the recent past their tracts were greatly decreased. The territory is characterized by anthropogenic shapes (opencast mines, mine dumps, settling pits).
The local climate is moderately warm and relatively dry due to mild rain sha-dow. Especially during winter months it is influenced by strong regional tem-perature inversions. The Ohře River valley has exposure climate and stronger valley inversions (Culek 1996). Average yearly temperature is around 7°C, average annual precipitation amount is 700 mm (Tomášek, 2008). The area of interest falls into the Ohře River basin. There are ponds in many places; some are used for fish rearing. In the surroundings of industrial zones sedimentation basins occur quite often. In the past decade water has been used for reclamati-on of areas stricken by opencast mining activities.
The landscape of the Sokolov region is largely influenced by anthropogenic ac-tivity. The most distinctive negative influences are exerted by opencast brown coal mining. The beginnings of a more systematic brown coal exploitation in the Sokolov region fall into the half of the 18th century. After 1945 there was a gradual transition from underground to more effective quarry exploitation that was gaining importance in the 1950s. At the beginning of the 1990s this acti-vity has concentrated into three state enterprises, out of which the Sokolovská uhelná, a. s. Company emerged on 1 January 1994 (Frouz et al., 2007).
The area under study is defined by the boundaries of the Sokolov-East mi-croregion (Figure 1). It is a result of a voluntary union of municipalities for the purpose of a joint solution of the arising problems. This delimitation has
Antonín Vaishar, M
ilada Šťastná, Zdenka Lipovská

99been chosen as we would like to stress the human capital, which is, inter alia, expressed by activities coming from below. The microregion is situated within the territory of the Sokolov and Karlovy Vary districts and is overlapped by the territory of the local Sokolovsko action group.
The natural axis of the microregion is the Ohře River valley the southern part of which is delimited by Slavkovský les. The I/6 road passing through the val-ley in a southwest – northeast direction connects Cheb and Prague, a railway track links Cheb and Ústí nad Labem. The centre of the Sokolov microregion is 18 km away from the regional metropolis of Karlovy Vary, but it directly borders on this city through the Hory municipality. Nevertheless Karlovy Vary is among the weakest Czech district centres although there are undoubtedly certain suburbanization tendencies in their surroundings.
The position of the microregion towards German states is more interesting. Saxony, bordering upon the Sokolov region by its Vogtland district, is about 35 km distant from Sokolov, but this is through the Ore Mountains. Moreover, Saxon centres are approximately other 30 to 40 km distant from the border. The same holds for the 35 km distant Bavarian border, although without na-tural barriers. The German A93 highway connecting to a number of important centres is accessible in a 15 km distance form the border.
The centre of the microregion is a medium-sized town Sokolov (24,488 in-habitants as of 1 January 2008). The territory also includes cadastral areas of small towns Březová (2,729), Chodov (14,321), Loket (3,174), and Nové Sedlo (2,704). With the exception of historical Loket all these towns have un-dergone an extreme development after World War II. Březová and a great part of Nové Sedlo had to give ground to mining, whilst old Chodov was almost entirely demolished with housing development built in its place in relation to the construction and operation of Vřesová processing plant. The territory of the microregion also includes large rural communities of Dolní Rychnov (1,424 inhabitants), Lomnice (1,164), and Vintířov (1,177), medium-sized ru-ral communities of Jenišov (588), Královské Poříčí (820), and Staré Sedlo (797), and small rural communities of Hory (206), Mírové (246), and Šabiny (296 inhabitants). Thus the microregion has 54,134 permanent residents.
The demographic structure of the population is quite favourable. With the ex-ception of Březová the average age of the residents in the individual villages is lower that the national average. Vintířov has the average age of 34.1, i.e. more than six years lower than the entire Czech Republic. Dolní Rychnov and Jenišov also count among very young municipalities as does the town Loket with the average of 36 years. It may be assumed that this is the demonstration of the reproducing young population base from the period of high immigration caused by the post-war exchange of population and industrialization.The current demographic development in the microregion‘s municipalities, according to data from the population balances. Czech Statistical Office, Prague, is particularly interesting (Table 1). The microregion as a whole had
Possibilities for development of regions after m
ining

100 a slight increase of inhabitants amounting to 87 people. However the re-dis-tribution of inhabitants is noteworthy. Only the three largest towns have seen a decrease in numbers of inhabitants in the mentioned period; this was due to a migration decrease. Five municipalities had a natural decrease, all three smallest villages included, but it was balanced by a higher immigration.
Some of the rural communities have recorded very high migration increases. This is primarily Jenišov, where almost 40% inhabitants have accrued du-ring the recent five years. The municipality is a typical suburb of Karlovy Vary, where districts of new, mainly typified family houses of urban type are constructed. More than 10% accruals were manifested also in Královské Poříčí and Dolní Rychnov. To a lesser extent suburbanization tendencies are also ma-nifested in Hory. All the three small communities have grown by 8% in five years. This development differs from the assumptions known from other post-mining regions. In Jenišov and some other communities of the microregion‘s eastern part the suburbanization of Karlovy Vary might have manifested itself. The natural movement was understandably influenced by the entry of strong age groups of the 1970s into the process of reproduction. However the overall devastation of the landscape and its negative image has by no means justified an assumption of a positive demographic development. This situation should be a subject of further monitoring.
Table 1. Demographic development in the Sokolov-East microregion‘s municipalities in 2003-2007 (persons)
Municipality
NM MB TD ‰
Sokolov 141 -652 -511 -21 Chodov 194 -332 -138 -10 Loket 50 -98 -48 -15 Bøezová -48 72 24 9 Nové Sedlo 2 45 47 17 Dolní Rychnov 27 118 145 102 Vintíøov 24 43 67 57 Lomnice -11 62 51 44 Královské Poøíèí 16 93 109 133 Staré Sedlo 3 49 52 65 Jenišov 23 204 227 386 Šabina -1 25 24 81 Mírová -10 31 21 85 Hory -1 18 17 83
Note: NM = natural movement balance; MB = migration balance; TD = total development of inha-bitants; ‰ = relative development with regard to the number of inhabitants in ‰
Nevertheless the microregion is affected by above-average unemployment that already reflects the current depression. In the majority of municipalities (according to data sourced from the integrated portal of the Ministry of Labour and Social Affairs of the CR are as of April, 2009) unemployment exceeds 10%, culminating in Vintířov (18.8%), Nové Sedlo (18.7%), Dolní Rychnov (17.5%) and Královské Poříčí (17.0%). As regards unemployment, Šabina is
Antonín Vaishar, M
ilada Šťastná, Zdenka Lipovská

101exceptional with this indicator amounting to just 3.2%. The values of unem-ployment indicator by no means correspond with migration activities. This indeed is a general phenomenon in the Czech Republic. Moreover, this indi-cator has to be assessed in the context of the microregion, where centres show a lower level of this indicator (Sokolov 9.6%, Karlovy Vary 8.1%), although it is above average from the national perspective.
The quality of human capital expressed by formal qualification poses a major problem. The qualification gravity centre of the microregion‘s inhabitants (Ta-ble 2) consists of people with completed apprenticeships (including secondary vocational schools without general certificate of education) and of people with a basic education (including incomplete). The share of people with no educa-tion is slightly above average. The highest share of skilled workers is a traditio-nally strong segment of the Czech labour market. It should be noted, however, that the current manufacturing technologies on the one hand, and the transfer of workforce from the industrial to service sector in Europe on the other, require a different education. Contrary to the national situation the share of people with completed secondary, vocational and university education is below average. The situation in Sokolov as the microregion‘s centre is only a little better (25% inha-bitants with GCE, 3% advanced vocational training, 5% universities).
Table 2. Education structure of population 15 years and older
Education level Sokolov-East [%] Czech Republic [%]
No education 1 1
Basic education 31 23
Completed apprenticeship 39 38
General certificate of education 22 25
Advanced vocational training 2 4
University 5 9
Total 100 100 Source: according to the population census 2001, Czech statistical office Prague
The course and issues of landscape restructuring
The Sokolovská uhelná Company systematically effaces the mining activity influences, and on a long-term basis transforms the territories thus renewed into valuable landscape units, both from the perspective of creating biolo-gically valuable ecosystems and from creating conditions for recreation ac-tivities. There is primarily silvicultural, agricultural and water reclamation performed in the Sokolov district, but also other activities (see also Zborník, 2006). Silvicultural reclamation is mostly carried out on slopes, and the op-tions out of hardwood are mainly grey and black alder, sycamore maple, com-mon ash, durmast and pedunculate oak and mountain ash; out of softwood these are Scots pine, Norway spruce and European larch. Domestic shrubs,
Possibilities for development of regions after m
ining

102 primarily fructiferous, are also planted. Agricultural reclamation is either car-ried out using topsoil removed with appropriation of land in a 35 cm layer, or without topsoil, directly on cypris clays that form the majority of the local mine dumps. A part of reclamation is also the creation of suitable biotopes for protected plant and animal species.
Accomplished reclamations
To provide information about ecological specifications of mine dumps and patterns of their natural development, in 1995 the so-called „Ježkova“ nature trail was built above Lomnice municipality in the area of the Podkrušnohorská mine dump. In the close vicinity of Sokolov (near the new grammar school) a vast arboretum was created at the Antonín mine dump.
Figure 2. The satellite image shows the impact of mining on the landscape.Source: mapy.cz
Reclamations aimed at a creation of new water reservoirs for various purposes occur quite often (c.f. Berkner, 2001). Two smaller water bodies of 15 ha area emerged at the Boden quarry, ca 300 m from Habartov town, where a part of residual pit has undergone water reclamation. The smaller reservoir has 5 ha, 75,000 m3 volume, and 4 m maximum depth, and is used for fishing purposes. The bigger one has 10 ha area, 328,000 m3 volume, and 6.5 m maximum depth and is used during summer season for recreation of the town dwellers and the immediate vicinity. The nearby territory is being afforested and grassed.
Another water body emerged in the area of Michal mine. Bathing pool Michal with an area of 29 ha is so far the largest recreation water reservoir in the vicinity of Sokolov. It was established in 2002 and its operation for recreation started in
Antonín Vaishar, M
ilada Šťastná, Zdenka Lipovská
1032004. Its volume amounts to 800,000 m3, it has 5.6 m maximum depth and 2.85 m average depth. The maximum water stage in the reservoir is 452.00 m above sea level. Sports and recreation grounds built on the northern slopes of the water reservoir have enhanced its usage. The grounds consist of a sandy beach, grassed surfaces planted with full-grown wood plants, on which facilities like a restau-rant, cloakrooms and showers were constructed including utility lines and an access road with a large parking area. The structures also include a big toboggan, a chute, floating piers, a boathouse and a mini-golf course. Forest reclamations are under way in the remaining part of the former Michal quarry. Landscape planning documentation has made the reservoir a part of Sokolov suburban zone.
Between Vřesová village and Chodov town there is Smolnická mine dump, on the margin of which “Bílá voda” water body extends (Figure 2). At its eastern side Sokolovská uhelná Company has built a sandy beach for the public that is used during summer season for recreational and sports activities. The adjacent areas around the reservoir have undergone forest reclamation and grassing.
In the eastern part of the Silvestr locality near Dolní Rychnov village a golf course consisting of 18 holes was built on an area of almost 100 ha. Reclama-tion works consisting of rough ground shaping, draining with the creation of seven small-sized water bodies, and silvicultural and agricultural reclamation were carried out from the funds for redevelopment and reclamation. The re-maining final works like facilities for golf-players, irrigation equipment, final shaping of the golf course, grassing, development of greens and teeing grounds were settled from the own means of Sokolovská uhelná, legal assignee, a.s.
Current reclamations
Currently the reclamation of residual pits area of the former Medard – Libík, Lítov – Boden, and Gustav quarries is under way. The future Medard - Libík Lake should be filled with water by 2012. The total area will exceed 485 ha and the maximum depth will be 50 m. The eastern part of this area should be used for recreation related to the water body – water sports, sports centre, and holiday accommodation of various forms. The western part should be de-voted to culture and fine arts in relation to the St. Mary‘s pilgrimage church in Chlum, to education, science, research, a golf course and recreation.
Planned reclamations
In the next stage of the planned works between Březová town and Dolní Rych-nov reclamation of the Silvestr II.A mine dump will be carried out, also on an area of almost 100 ha. The goal is to build a zoopark, a forest park, a bio-centre, geological and ecological nature trails with the necessary facilities.
The last large residual pit that will emerge with the termination of coal mining in the Sokolov region in the Jiří and Družba quarries after 2036 is determined for flooding. A lake with 1,322 ha area, 515 million m3 water volume, 93 m
Possibilities for development of regions after m
ining

104 maximum depth and a 40 m average depth should thus come into existence. Both of these large waterworks are intended to be flooded by the water of the Ohře River.
Economic and social re-structuring and the role of local and regional institutions
The success of re-structuring largely depends on the so-called human capital and its capability to create a vision and to secure its implementation. From the perspective of state administration the territory falls within the Karlovarsko Administrative Region, and within this it is a relatively important part (18% inhabitants). For statistical purposes it is a part of the Severozápad Cohesion Region together with Ústecko Administrative Region. After the disestablish-ment of district councils (albeit a number of other authorities at the district level have remained) the state administration is based on the system of muni-cipalities with extended powers (in this case Sokolov) and authorised munici-pal offices (in this case Chodov).
In the sphere of self-administration municipalities form voluntary unions at various levels. In this case it is the Sokolov-East union of municipalities with the head office in Královské Poříčí, the territory of which is the subject of this study. In a broader frame the local action group Sokolovsko, o.p.s. with the head office at Březová has functioned since 2006. It seems that both unions are backed up by a similar group of people, who are the driving force of the entire microregion‘s development. The Sokolovsko local action group (LAG) has accepted an integrated development strategy that defines the main develop-ment goals of the microregion. The main priorities are: quality of life, restora-tion of monuments and development of tourist business, human resources and employment, and a support of partnership. The territory of the LAG is indeed markedly larger than the microregion under study.
The Karlovarsko Administrative Region is an important subject of regional development. In the documents under elaboration the Sokolov area is deli-mited as a specific microregion important from the perspective of mineral raw materials extraction and its consequences – by the side of microregions important for balneology, protection of nature, agriculture and urbanization (Koubek et al., 2008). Diversification of functions of the Karlovarsko territory is another significant fact that has to be considered with the development po-tential analyses. The most important Czech balneal places but also territories with an intense protection of nature are located at a minimum distance from the “moonscape” following opencast mining.
From the perspective of cross-border cooperation the Sokolov district, toge-ther with other three districts in the Czech Republic (Karlovy Vary, Cheb, Tachov) and the relevant territorial units of Saxony and Bavaria, is a part of Eeuroregion Egrensis. So far it does not seem, however, that this partnership has an important effect. For establishing of contacts, exchange of experience
Antonín Vaishar, M
ilada Šťastná, Zdenka Lipovská

105and getting to know the neighbours a direct cooperation between partnering towns or municipalities (e.g. Chodov and Oelsnitz/Erzgebirge) may be more beneficial, although even this cooperation so far apparently does not bring di-rect economic effects. Körner (2007) assumes that not even direct neighbours in this area (Kraslice – Klingenthal) can be expected to significantly directly cooperate in the sense of strengthening of centres.
The most important economic subject of the microregion – the Sokolovská uhelná a.s. Company – should not be forgotten either. Although its job de-scription does not include regional or territorial control, its interventions into the landscape are most significant. The company has elaborated a material called „Creation of a new landscape in the Sokolov region“, in which it de-fines its main priorities in this respect. It has to be stressed that the company is legally responsible for the reclamation of landscape but not for the related and consequent effects in the social sphere. In spite of this, nowadays the Compa-ny activity within the territory is taken in positively and it is appreciated that during privatization the Company has got into hands of people who have their roots in the region, and thus a personal interest in improving the situation.
Discussion
If we want to answer the question whether rural character will be successfully restored in the landscape of the Sokolov-East microregion, we should make clear what its present character is and what desirable changes it should go through. So far rural has been defined as an opposite to urban. Village used to be something that was not a town. But is this the case even today, at the time of suburbanization and counterurbanization, transfer of industrial manufacturing plants from cities to their surroundings, concentration of hypermarkets near highway crossings, and multifunctional development of the country?
A landscape with vast opencast mines is by no means agricultural. More likely it can be labelled as industrial, but nowadays this division does not precisely testify to the relation between urban and rural. Local inhabitants are primarily employed in mining, industry and services. However because a great number of people commute to work, this rather relates to lifestyle than to the character of the area. Incidentally, the city and country way of life are getting closer to each other very fast. What would then be the criteria we should use to define this issue?
If we ensue from the character of settlement, a country landscape should con-sist of country habitations and small towns as their centres. This is true by and large; the only question to be left is the role of Sokolov, which - according to our criteria - belongs to medium-sized towns by the number of its inhabitants on the one hand, and by its function of a district town on the other hand. It may be questioned to what extent these small towns adequately fulfil their function of rural background centres. In this respect the situation is not too favourable, as the entire structure of small towns has been re-modelled by mining. Thus one of
Possibilities for development of regions after m
ining

106 the goals of rural landscape restoration should be to restore the function of small towns. This should not necessarily concern all small towns within the microre-gion – after the loss of central functions and parts of their physical structure that had to give ground to mining some of them might become country habitations.
As far as landscape is concerned, a mark of a country landscape is a preva-lence of agricultural and forest land in combination with water bodies and small habitations. Recently the share of land devoted to recreation also incre-ases. The microregion so far does not fulfil this characteristic; however most of reclamation measures are directed towards this utilization. But Rothbauer et al. (2004) bring forward that agricultural businesses in the territory under study are not competitive in the conditions of the unified European market. The disparity between the production of permanent grassland and the number of livestock is not sustainable even with the aid of subsidies. The future then can rather be seen in a prevailingly subsidised polyfunctional agriculture ai-med more at landscaping and maintenance of landscape, non-food production, special products, afforestation, agrotourism and complementary activity.
As usual, people are the biggest issue. If we perceive country inhabitants as identified with their municipality, land and microregion, the inhabitants of the Sokolov-East microregion are definitely not rural and do not even come any-where near such characteristics. This fact is primarily a consequence of the post-war ethnic exchange of population, intense immigration caused by the industrialization of the socialist period, but also vast changes of the lands-cape. The above processes have broken the integrity of both inhabitants and landscape; they apparently present the main problem from the perspective of considering a possible restoration of rurality in the area in a relatively near-by time horizon. Even if the creation of a new landscape and the stabilization of inhabitants are successful, it will probably take some decades before it will be possible to realistically reflect on the return to country roots. Woodland management has a better economic perspective, even if at the beginning it will also have non-producing functions: soil conservation, ameliorative, hydrolo-gical, hygienic, climatic and esthetical.
However the stabilization of inhabitants itself presents a grave future problem. Mining will obviously be terminated within the 2020 horizon. It may be assu-med that landscape reclamations will be carried out in an appropriate quality. The main task, though, will be the substitution of roughly ten thousand job opportunities in mining and the induced activities. The direction of efforts is quite obvious: to establish a diversified structure of small and medium-sized businesses in traditional industries, service and tourist industry, so that the new structure is relatively resistant even to market swings affecting the indi-vidual industries.
However the question arises to what extent is the qualification structure and mentality of mining, energy and chemical sectors employees suitable and pre-pared for these necessary changes. The suburbanization tendencies of Karlovy
Antonín Vaishar, M
ilada Šťastná, Zdenka Lipovská

107Vary as manifested in the eastern part of the microregion will have to be taken into account. Because of a small distance from the state border transformed in the Schengen Area the solution has another variable coming into play - the fu-ture cross-border influences, i.e. possibilities of cooperation on the one hand, and opening to international competition on the other hand.
The image of the microregion will no doubt play its role in the entire pro-cess. It appears that a change of image is a more long-term issue than the re-moval of environmental damage and improvement of social situation alone. On the other hand, at the level of the region, municipalities, microregional unions and other subjects a lot of active measures can be taken to improve the image.
Therefore it is possible to assume that while the reclamations of landscape, incidentally already started, will lead to the transformation of the microregion into a rural one relatively faster, changes of the social system will be rather of a long-term character, will have to struggle with a range of problems and their outcome is uncertain. Moreover, the situation will be influenced by some ex-ternal factors that are not easy to predict. For this reason, it will be appropriate to continue to monitor the development.
References
Baeten G., Swyngedouw E., Albrechts L. (1999): Politics, institutions and re-gional restructuring processes: From managed growth to planned fragmen-tation in the reconversion of Belgium‘s last coal mining region. Regional Studies 33 (3), 247-258.
Berkner A. (2001): Von der Tagebau- Zur Seenlandschaft. Geographische Rundschau 53 (9), 11-18.
Culek M. (1996): Biogeografické členění České republiky. Praha: Enigma. 347 pp.
Dickmann F., Dickmann-Boubaker N. (2008): Freizeit am Wasser: Entwick-lung stadtbezogener Revitalisierungsprojekte im Ruhrgebiet. Standort 32 (2), 51-55.
Dürr H., ed. (1993): Erneuerung des Ruhrgebiets: regionales Erbe und Gestal-tung für die Zukunft. Padeborn: Schöningh, 206 pp.
Frouz J., Popperl J., Přikryl I., Štrudl J. (2007): Tvorba nové krajiny na Soko-lovsku. Sokolov: Sokolovská uhelná, právní nástupce a.s. 26 pp.
Ganser K. (2001): IBA Emscher Park in der Rückschau – Beitrag zur nach-haltigen Entwicklung. Petermanns Geographische Mitteilungen 145 (5), 18-25.
Gwosdz K. (2001): Postrzeganie regionu tradycyjnego przemysłu w okresie transformacji: Przypadek Górnego Śla̧ska. Czasopismo geograficzne 72 (3- -4), 283-300.
Haas H.-D, Neumair S.-M. (2005): Die Europäische Montanindustrie - Regi-onaler Strukturwandel als Folge international veränderter Wettbewerbsbe-dingungen. Geographische Rundschau 57, 38-45.
Possibilities for development of regions after m
ining
108 Hüttl R. F., Weber E. (2001): Forest ecosystem development in post-mining landscape: a case study of the Lusatian lignite district. Naturwissenschaften 88 (8), 322-329.
Körner M. (2008): Nová role „příhraničních“ center ve „sjednocené“ střední Evropě. Urbanismus a územní rozvoj 11 (1), 39-44.
Koubek P., Veselý V., Jelínek J. (2008): Specifické oblasti v zásadách územ-ního rozvoje Karlovarského kraje. Urbanismus a územní rozvoj 11 (5), 6-11.
Krajewski C., Reuber P., Wolkersdorfer G. (2006): Das Ruhrgebiet als post-moderner Freizeitraum. Geographische Rundschau 58 (1), 20-27.
Riley R., Tkocz M. (1999): Local responses to changed circumstances: Coal-mining in the market economy in Upper Silesia, Poland. GeoJournal 48 (4), 279-290.
Rothbauer I. et al. (2004): Územní prognóza území dotčeného těžbou hnědého uhlí na Sokolovsku. Ateliér T-plan, s.r.o. Praha, 107 pp.
Szabó G., Braun M., Koi R., Szabó S., Szegedi S. (2008): Environmental im-pacts of an opencast mine. In: Plit, J. and Andreychouk, V. (eds.): Methods of landscape research. Sosnowiec: Commission on Cultural Landscape of Polish Geographical Society, 113-126.
Tomášek J. (2008): Dokumentace k záměru Obalovna živičných směsí Cho-dov HERKUL a.s. a Vodohospodářské stavby, společnost s ručením ome-zeným. Mníšek pod Brdy.
Turnock D. (2001): Environmental problems and policies in East Central Eu-rope: A changing agenda. GeoJournal 54(2-4), 485-505.
Vaishar A. (2006): Demographic prognosis for some seats in the Ostrava regi-on. Moravian Geographical Reports 14(2), 16-26.
Westermann A. (2008): Von der Montanregion zur Sozialregion. Zur gesell-schaftsgeschichtlichen Dimension von „Region“ in der Montanwirtschaft der frühen Neuzeit. Vierteljahresschrift für Sozial- und Wirtschaftsge-schichte, 95 (2), 175-184.
Wirth P., Lintz G. (2006): Rehabilitation and development of mining regions in eastern Germany - Strategies and outcomes. Moravian Geographical Re-ports 14 (2), 69-82.
Zborník J. (2006): Sokolovsko – „nový příběh“ začíná. Urbanismus a územní rozvoj 9 (4), 15-19.
Antonín Vaishar, M
ilada Šťastná, Zdenka Lipovská

109Vladimír Székely1 Institute of Geography, Slovak Academy of Sciences, Štefánikova 49, 814 73 Bratislava, Slovak Republic
Tourism clusters as a tool for the improvement of rural competitiveness:first experiences from Slovakia
Abstract: Slovakia is the country with unusually appropriate conditions for de-velopment of tourism. Therefore the governmental programmes with economic development of rural area as one of their priorities emphasise diversification of economic activities including creation of new work opportunities in the sphere of tourism. In connection with development of tourism and rural areas there ap-pear some studies based on concept of clusters. The aim of paper is to describe potential benefits of cluster concept application not only on tourism development in rural areas, but also on general local and regional development. On the other side, in the context of the overestimation of assets from application of cluster concept for individual players and region, we are trying to stress the attention on some dangers for involved companies and own rural development. In the second part of paper we introduce the first attempt of Slovak tourism cluster establish-ment. Organization “Cluster Liptov“ (name of the historical Slovak region) is a result of agreement between crucial public and private players who decided to cooperate with aim to increase the visit rate of region and to achieve individual successes by common prosperity.
Keywords: concept of clusters; tourism; rural areas; Liptov region; Slovakia
Introduction
Localities and regions boast their developmental potential relying on the physical-geographical conditions, relative geographical position or individu-als that possess appropriate capacities (skills) and are associated in local com-munities. Such potential though, is not the same for all economic activities. It depends both on time and the changes in time. The conditions in differ-ent stages of the historic development suitable for instance for agriculture, for industry or leisure and recreation branch of the economy are not always

110 comparable. Humans choose individual localities and regions for realization of their activities depending on of the society’s and knowledge levels, ap-plying both rational and irrational reasons for their decisions. Geographical research which focused in the past more on description of the existing spatial differentiation of material manifestations of human activities is now trying to find answer to the questions why this spatial differentiation exists and under what conditions it transforms; why some localities and regions attract people to reside, work, invest or to relax there more than other places or why some localities and regions are less attractive for them. Answers to these questions may help comprehension of the developmental dynamics of the existing dif-ferences in population distribution and economic activities.
Slovakia is the country with unusually appropriate conditions for development of tourism. However, its inner differentiation in terms of prerequisites neces-sary for the development of tourism is often emphasised. Attractive regions alternate with those that are not capable of attracting visitors. The problem occurs both in cities and rural areas that undergo great functional changes. At present, the governmental programmes of the socio-economic development for the rural areas put great stress on diversification of economic activities and generation of new jobs beyond agriculture (mainly in the sector of tourism). Tourism is also often uncritically considered as a key segment of the rural eco-nomic development strategy. This is the reason why possibilities to develop tourism and the rural areas are sought in terms of their economic growth often in spite of the declared interest in sustainable development of rural tourism. (Economic) competitiveness became the central concept of the development of economic subjects, branches and spatial units. The success of applied strat-egies is assessed almost exclusively on the basis of quantitative values of the selected economic indicators (visiting rate, proceeds and profit). This is the reason why the approach based on concept of clusters is now so popular in plans for the development of tourism and regions/localities.
The aim of paper is to describe potential benefits of cluster concept application not only on tourism development in rural areas, but also on general local and regional development. On the other side, in the context of the overestimation of assets from application of cluster concept for individual players and region, we are trying to stress the attention on some dangers for involved companies and own rural development. In the second part of paper we introduce the first attempt of Slovak tourism cluster establishment.
Concept of clusters
The term “cluster” is used in scientific and technical literature for the strong tendency to network economical activities and for their spatial (geographical) concentration. The term “cluster” was introduced by the American economist M. Porter, who described it not only as an analytical concept but also as a po-litical tool for achieving the competitiveness of various economical branches (particularly in manufacturing) and spatial units. Porter defines clusters as
Vladim
ír Székely

111“geographic concentrations of interconnected companies, specialized suppli-ers, service providers, firms in related industries, and associated institutions (universities, standards agencies, and trade associations) in particular fields that compete but also cooperate” (Porter, 1998). Contracting supply-demand relationships, joint technologies, common purchasers or distribution channels or even the common labour market are the factors that unite cluster into one unit. But it can be also various training or research initiatives, joint market-ing and lobbying (Nordin, 2003). Existence of the relationships between the participating actors is clearly accented. The second but not less important characteristics of the cluster is the geographical proximity of the groups of interlinked companies as a precondition of intensive intercompany and inter-personal contacts (Porter, 1998). Although Porter’s work is manly focused on the manufacturing industry, it has also been extended and applied to service industries, such as tourism.
Porter (1990), in his primary study devoted to the national competitive ad-vantages and international competitiveness develops the idea that the success of export companies (competitiveness of companies is connected with their success in export area) depends on the “competitive diamond” of four sets of factors (adapted to tourism):
1. Strategy and structure of companies and the intensity of the domes-tic competition between rivals (for instance, high degree of rivalry in a sector of tourism influences introduction of new products and improvement of service quality),
2. Factor input conditions (relative geographical position, available la-bour forces, capital, natural resources and infrastructure in the terri-tory + a lot of specialized, unique factors),
3. Demand conditions (size and demandingness of market expressed by behaviour of consumers and their specific demands),
4. Presence and quality of locally based supporting industries related to tour-ism (accommodation and catering facilities, transport service, etc.)
These sets of factors interact. The more developed and more intensive are interactions between these four sets of factors, the higher will be the produc-tivity of companies that enter these relationships. It is supposed that precisely the geographical proximity may help the existence and development of an interaction beneficial for all participating partners. Porter saw the cluster (and clustering) as a geographically localized grouping of interlinked businesses as one of the possibilities how to increase their competitiveness, improve the productivity and through them to increase the economic well-being of popula-tion living in the concerned territories.
Networks and active participation of the individual players (municipalities, firms, etc.) of these networks are particularly important for the tourism sector, which is represented by the groups of organizations trying cluster together to form a destination context (Novelli, Schmitz, Spencer, 2006). Tourism clus-ters are the result of the co-location of complementary firms, which may not necessarily be involved in the same sector, but may benefit by pre-existing
Tourism clusters as a tool for the im
provement of rural com
petitiveness: first experiences from S
lovakia

112 network membership and alliances´ dynamics. Networks of created and func-tional clusters provide approach to knowledge, resources, markets, or tech-nologies for individual firms. They also make it possible for actors to partici-pate in the co-development of tourism products or services and spillover of theoretical and practical knowledge: one member of the network (cluster) is affected by the experience of another.
General geographical characteristic of the region of Liptov
Liptov as one of historic regions of Slovakia is situated in the north of Slo-vakia and its north-eastern part is in contact with the Slovak-Polish frontier. It is included in the administrative region of Žilina. It consists of two former districts of Ružomberok and Liptovský Mikuláš (Figure 1) with total area of 1,970 km2.
Figure 1. Geographical position of the region of Liptov in Slovakia
From the geographical point of view, Liptov is almost an ideal example of the natural and socio-economic unit of ellipsoid form with its longer axis stretching in the west-east direction (Lehotský, Székely, 1995). Important mountain ranges of Slovakia surround its central part, the Liptovská Basin (Liptovská kotlina). District boundaries run alone the ridges of the following mountains: Nízke Tatry and Kozie chrbty (south), Západné Tatry, Chočské vrchy (north), and Veľká Fatra (west). The Nízke Tatry, Veľká Fatra and Západné Tatry mountain ranges were designated the territories under the top level of nature and landscape conservation, as National Parks or parts of National Parks due to their extraordinary landscape value. Liptov is relatively open to the Popradská Basin (Popradská kotlina) in the east (Figure 2).
Vladim
ír Székely

113
Figure 2. General geographical map of LiptovSource: http://www.liptov.sk/predaj/mapa.html
Conspicuous and typical for the region of Liptov is the vertical differentiation of the territory. Sea level altitude moves between 420 m (north-western part of the territory) and 2,043 m (Ďumbier, the tallest peak of the Nízke Tatry Mts.). Distinct differences in sea level altitudes between the central lower situated part of Liptov and its ring of mountains determine the specific climate, which is the case of the vertical soil-vegetation zonality. The lower part of Liptov (conditions suitable for swimming and water sports) is in moderately warm climatic zone with the mean July temperatures around 16°C and the January temperature around -3°C. Number of summer days, i.e. days with temperature exceeding 25°C, is higher than 30 round the year. Precipitation average, an important part of which is produced during summer, is about 600-700 mm.
The climatic antipode is represented by the marginal and higher situated parts of Liptov - they belong to the cool climatic zone. Along with the year round use, some of them are suitable for the skiing and winter sports. The mean July temperature depending on sea level altitude oscillates between 10°C and 16°C. In January, the coldest month of the year, the mean temperature is between -4°C and -7°C, and reaches -10°C in the top parts of mountain ranges. The value of precipitation is higher compared to the lower positions of Liptov (up to 1,600 mm). According to Kollár (1999), number of days with snow cover in these higher parts of Liptov is 160 to 180 (November - April).
Liptov is a closed unit in terms of hydrogeography. All streams that spring in the territory of the region mouth to the longest Slovak river Váh (catchment of the Black Sea). The Váh River is the central 80 km long stream of the whole Liptov. It mouths to the water reservoir of Liptovská Mara, built in 1970-1975. Its original
Tourism clusters as a tool for the im
provement of rural com
petitiveness: first experiences from S
lovakia

114 function was the production of power and protection against floods. But its recreational function has been recently increasing. Estimating by the volume of the retained water, Liptovská Mara is the biggest water reservoir in Slovakia. The area of its water surface is 21.6 km2. Numerous mineral springs use of which led to the foundation of several spas (for instance Lúčky, Korytnica) and water parks (Bešeňová, Liptovský Mikuláš) are also important for the development of tourism in the Liptov region.
Historic development and natural conditions are the causes why that Liptov is not among the most populous regions of Slovakia. According to the last Census in 2001, in the territory of the former districts Ružomberok and Liptovský Mikuláš in three towns and 78 rural municipalities more than 133 thousand inhabitants lived. They represented only about 2.5% of total Slovakia’s population (Table 1). Liptov is distinctly homogeneous in terms of ethnicity - almost 98% of its population declared affiliation to the Slovak ethnicity. Population density (68 inhabitants/km2) in Liptov is distinctly lower than the Slovak average; that is 110 inhabitants/km2. Population concentrates in the valley of the Váh River in the central part of the region. Higher situated marginal parts are either not settled or very scarcely settled. The majority of Liptov’s population (almost 72 thousand = 53.7%) live in three towns (Liptovský Mikuláš, Ružomberok and Liptovský Hrádok). The biggest town in terms of population number in the region is Liptovský Mikuláš (33 thousand), which along with Ružomberok (almost 31 thousand) ranks among the medium-sized towns of Slovakia. Liptovský Hrádok is a smaller town and ranks lower in the settlement hierarchy. Its population amounted 8.2 thousand in time of the last Census. However, rural municipalities prevail while almost half of the total (48.1%) of settlements are small villages with population up to 500 inhabitants. More than three thousand inhabitants lived in only two rural municipalities (Liptovská Lúžna and Liptovské Sliače).
Table 1. Size categories of municipalities in Liptov region
Size category of municipality
(number of inhabitants)
Number of municipalities
% Total number of inhabitants
%
< 200 12 14.8 1,585 1.2 201-500 27 33.3 9,174 6.9
501-1 000 16 19.8 11,024 8.3 1 001-2 000 17 21.0 23,276 17.4 2 001-3 000 4 4.9 9,837 7.4
> 3 000 5 6.2 78,508 58.8 Total 81 100.0 133,404 100.0
Source: Own calculations based on the data from the Central Statistic Office of the Slovak Republic
Vladim
ír Székely

115The OECD has developed a classification of rural areas based on the per-centage of the population of a country living in rural municipalities (typical descriptive definition). Three broad classes of rural areas or regions have been distinguished: predominantly rural (over 50 % of the population living in rural municipalities), significantly rural or intermediate areas (15%-50% of the pop-ulation living in rural municipalities) and predominantly urban (less than 15 % of the population living in rural municipalities). Pursuing this classification, the territory of Liptov is a “significantly rural or intermediate area”. Territory of the region is not homogeneous - its western part (district of Ružomberok) is a “predominantly rural area” and the eastern part (district of Liptovský Mikuláš) is a “significantly rural or intermediate area” (Székely, 2003).
At present, the nature of Liptov is combined industrial and agricultural while industry concentrates in the towns, centres of the economic life. However, in the last time, the significance of services, above all tourism, increases in terms of the number of employees, as Liptov possesses ideal conditions and prereq-uisities for this industry. Population of Slovakia perceives Liptov above all as a region with an extraordinary high natural and landscape value (national parks, folk architecture and conserved folk traditions), and as the region of origin of the Slovak gastronomic speciality “bryndzové halušky” and as the region connected with the life of the legendary Slovak robber and national hero Juraj Jánošík (1668-1713).
Good transport accessibility contributed to the popularity of the region. The main road and railway communications run through its centre in the west-east direction. International roads cutting the mountainous barrier cross the region in the north-south direction as well.
Interaction of all relevant factors makes Liptov the region with above average potential for the development of tourism. Marketing activities initiated by the local and regional self-administrations in coordination and cooperation with the local business group are oriented to the exploitation of this potential. The fragmental romantic picture, so spread in the past, and the present marketing of Liptov’s recreational facilities which substantially contributed to its high visiting rate should be now complemented by an overall view of Liptov and its subsequent promotion. Presumably, the targeted regional marketing will support the interest of both the domestic and international clientele in visiting and cognition this part of Slovakia.
Cluster “Liptov” – 1. tourism cluster in Slovakia
The emphasis on competitiveness, prosperity and sustainable development of member countries and their regions declared by the EU has led the representa-tives of the Žilina’s regional self-administration (with co-operation with local University and partner´s institutions) in 2005 to work on the project Innova-tion Policy of Žilina (part of the Regional Innovation Strategy for the Region of Žilina). Its aim was to create an environment stimulating regional innova-
Tourism clusters as a tool for the im
provement of rural com
petitiveness: first experiences from S
lovakia

116 tion potential, cooperation between the existing institutions and organizations, and to prepare a developmental frame in order to activate the companies so that they introduce further innovations. One of the projects supporting the building of innovation infrastructure (as a part of RIS) is the project Clusters and Partnerships (Dado et al, 2006). Implementation of this project is ex-pected to support not only the cooperation of companies but also to increase their international competitiveness. As the real result of the quoted activities is introduced the first tourism cluster not only in the region of Žilina but also in Slovakia. In April 2008, organization of “Liptov cluster - tourism associa-tion” has been established. Its web site (http://www.klasterliptov.sk/) declares that it is “the first organization of destination management (DMO) in Slovakia and the joint marketing centre of the destination of Liptov”. It associates the entities of the private and public sectors and the aim is the joint promotion of the region of Liptov as the unique “green” region for an “attractive leisure full of agreeable experiences”. Founders of the organization with the name con-taining the word cluster are the three towns of the region (Liptovský Mikuláš, Ružomberok and Liptovský Hrádok) and four important tourism centres with supraregional significance: Aquapark Tatralandia, Thermal Park Bešeňová, Jasná Nízke Tatry, and Ski Park Ružomberok. The founders financially sup-port the newly established organization as its strategic objective is to double the current visitor rate of Liptov up to 2013. The ambition of Liptov cluster is to: “incorporate Liptov to the map of sought out European tourist destinations, to present Liptov as a unified brand both at home and at abroad, to generate competitive products in the sector of tourism, and to promote the active co-operation in the region”. Activities of cluster “Liptov” should be directed to professional coordination of tourism development in the Liptov region.
The individual towns, founders of this organization, have been mentioned above. Representatives of the towns appreciate that in addition to of cultural and historic monuments which they possess, their greatest asset for their visit is the proximity of attractive tourism centres (they are also founders of tour-ism cluster “Liptov”) represented by the private business sector (together with towns they constitute an example of something like public-private-partnership) and their activities complement each other. Aquapark Tatralandia, located in the territory administered by Liptovský Mikuláš with its 11 swimming pools and toboggans is the biggest year-round open water park not only in Slovakia but also in Czech Republic and Poland. It exploits the local thermal springs (60.7°C), which were the base for building a combination of different services offering the complete physical and mental relaxation of visitors. The Thermal Park Bešeňová was built with the same objective and on the same basis. It is located in administrative territory of the village situated 12 km away from Ružomberok. Both companies may as well stand for the typical example of horizontal competitive-cooperative interlinks of established cluster.
Centres focused on winter sports, Jasná Nízke Tatry and Skipark Ružomberok, represent a considerably less balanced couple. The first of them is located near Liptovský Mikuláš on the territory of several rural municipalities and the
Vladim
ír Székely

117National park of Nízke Tatry. It is the most sought out and the biggest win-ter sport centre in Slovakia. However, the declared ambition of the manage-ment is further expansion. Plans exist to make not only the centre the biggest ski resort in Eastern Europe, but also to diversify activities in order to reach the balanced year-round operation. The result should include the increased visiting rate, proceeds and profit. The centre has been classified under the top category of tourism facilities with international significance. The Skipark Ružomberok has been also included in this category. Its natural potential and the ensuing prospect of spatial expansion though, are much more limited than in case of Jasná. However, in spite of being a smaller ski centre, it is one among ski centres in Slovakia with the top evaluation. It is situated in the territory administered by the town of Ružomberok (including also some typi-cal rural settlements) and in the territory of the National Park of Veľká Fatra. Managers of the centre adopted the same strategy for the future development as those at Jasná: they try to diversify activities in order to reach a more bal-anced visiting rate during the whole year. Like in case of regional centres of Liptov exploiting the hot springs, regional ski centres can be also considered entities participating in the horizontal competitive-cooperative interlinks of established cluster.
Declared advantages of firms co-location (declared advantages firm´s presence in cluster)
In case of clusters, it is manifestation of firms co-location, which brings cer-tain greater advantages to the participating individual firms than in the case of their isolated locations. According to Marshall (1890) who is considered the author of the idea about geographically concentrated clusters, advantages concerned reduction of cost in three areas. The first of them is the use of cer-tain common sources, for instance a specialized infrastructure where cost of its building and maintenance are shared (it means reduction of total cost for each firm) among more firms. A typical example can is perhaps the specialized school system, building of which is normally interesting for all companies competing in the same sector. The second area is the local labour market char-acterized by a high specialization of labour forces and jobs (demand and sup-ply on a spatially confined labour market) which, accompanied by the reduced cost, makes it possible to meet the interests both of employees and employers. The third area concerns reduction of intercompany transactions and trade cost due to the short distance between actors. It manifests itself above all in case of a vertically integrated manufacturing system, i.e. the system based on the relationships between suppliers and consumers.
As obvious from the most recent literature involved with the subject, assess-ing the advantages from spatial concentration of companies does not only consider those ensuing from cost reduction. Malmberg a Maskell (2002) even stress that no theory explaining existence of cluster can be based exclusively on mere reduction of interaction cost. This is the reason why to the quoted three types of advantages from the co-location of companies, also the factor
Tourism clusters as a tool for the im
provement of rural com
petitiveness: first experiences from S
lovakia

118 of forming the special local (regional) conditions is included. Such conditions create the special local (regional) milieu that may facilitate the “knowledge spillovers and stimulate various forms of adaptation, learning, and innova-tion” in favourable circumstances. Dynamic processes of mutual learning, ac-cumulation of knowledge and innovation production are possible. A specific local/regional culture and climate (local or regional milieu) are created and facilitate not only formal but also ever more important intuitive (tacit), region-ally locked knowledge between the participants of the networked cluster. All these processes lead to increased competitiveness of not only participating economic actors but also the region where they are acting.
Specific conditions of localities and regions as the determi-nants of their competitiveness
At present, the creation of exclusively positive image of clusters (clusters are described by high productivity, by growth of entrepreneurial activities, as an important means for support of competitiveness and innovations, by knowl-edge formation and way to progressive knowledge economy) is under the scrutiny (for instance Martin and Sunley, 2003). The main reason is connected with the discrepancy between the theoretical ideas and results of empirical research which were expected to definitely confirm and support the idea of advantages of co-located companies in, in terms of higher competitiveness reached by the reduction of cost and easier adoption of progressive technolo-gies and innovation. Confrontation of the theory with the reality has shown that the results of the company and regional performances (as indicators of their competitiveness) are as a rule determined by the local (regional) spe-cificity, which reflects the character and power of the competitive and coop-erating environment formed by the participating economic actors and their representatives. The knowledge gained, inherited and acquired capacities, in-novation and other positive personal properties contribute to the formation of a unique entrepreneur environment in a particular territory and in particular time (Feldman et al. 2005).
Quality of the regional management, their enthusiasm, openness, progressive-ness and purposeful movement to the set aims also plays an important role in formation of the regional specificity. The existing quality of human capital and “culture” that are unique in region is something that cannot be simply reproduced in another region. In the consequence of these facts, it is not pos-sible to apply any simplified or mechanic generalizations (generated only by the empirics of “successful” companies from “successful clusters”) about the increased competitiveness of companies and regions where clusters exist. The practice gained by the individual states, however, proves that the politicians do not accept this piece of knowledge when formulating regional policies (see for instance Hospers and Beugelsdijk, 2002, and Lepawski, 2009). In spite of the fact that uniqueness of local and regional factors increasingly determines the economic success of companies and regions, the efforts of politicians to copy and apply the “best practice” of successful regions (regardless the evi-
Vladim
ír Székely

119dent differences in specific regional features) are frequent in a very question-able process of the new cluster formation. Special rules which are politically motivated are introduced and they often reflect the effort to maintain power of the concrete political representation.
Conclusion
Opinion on suitability of cluster concept and its exploitation in the develop-ment of any economic branch and any spatial units is now very disparate. On the one side, the origins, existence and functioning as well as the effects of clusters on economic performance and competitiveness of companies and consequently the regional/local economic growth are accompanied by uncer-tainties which lead to an unsatisfactory situation in formation of theoretical constructions regarding this phenomenon. On the other side, the reality is that the concept of clusters as an avenue to the economic prosperity and well-being gained (because of extremely successful marketing strategy) popularity among the decision makers on all hierarchical levels (national, regional, local). The result is the dichotomy of opinion between scientists and politicians. It also is the cause that unconventional terms appear in literature involved with clus-ters. Martin and Sunley (2003) talk about the “cluster brand”, or the “Porter brand” built in connection with positive associations. These positive associa-tions markedly help promotion of the cluster concept as the developmental strategy in competition with other theoretical and applied constructions.
In case of clusters in the sphere of tourism something more is necessary than a common marketing strategy. The real cluster should not be only represented by a common brand and trademark for the organization that introduces the word ”cluster” in its name and sells the regional material and non-material products. It is above all the tourism cluster that should be a phenomenon based on existence and gradual perfection of horizontal and vertical relationships between the participating actors. The result in time of economic prosperity should then be not only an adequate profit of the whole and the individual members but also a functioning regional economy.
An important note is necessary to add here: economic development supported by clusters is based on local and regional specialization. In the consequence of empirically observed and theoretically justified alternation of economic prosperity and economic decline (the present global financial and economic crisis) it represents a very risky strategy of the regional development. Indi-vidual economic entities heavily depend on each other in functional clusters. If one is threatened, other members are threatened as well. This fact can, but does not necessarily have to, revise the exaggerated expectations of the deci-sive actors of local and regional economies about the permanent quantitative economic growth.
Tourism clusters as a tool for the im
provement of rural com
petitiveness: first experiences from S
lovakia

120 Acknowledgements
This article was translated by H.Contrerasová. It was prepared as part of the Project No. 2/0096/09 „Regional „winners“ and regional „losers“ - identifica-tion of successful and less successful localities and regions in Slovakia“, fund-ed by the Slovak VEGA Grant Agency. The author thanks H.Contrerasová for translation, and the Slovak VEGA Grant Agency for its financial support.
References
Dado M. et al (2006). Rámcová stratégia Žilinského regiónu pre oblasť inovačného rozvoja. Žilina, Žilinská univerzita (http://www.zip.utc.sk/).
Feldmann M. P., Francis J., Bercovitz J. (2005). Creating a cluster while build-ing a firm: entrepreneurs and the formation of industrial clusters. Regional Studies, 39, 129-141.
Hospers G. J., Beugelsdijk S. (2002). Regional cluster policies: learning by com-paring? KYKLOS: International Review for Social Sciences, 55, 381-402.
Klaster Liptov – 1.slovenská organizácia destinačného manažmentu (DMO) (http://www.klasterliptov.sk/).
Kollár D. (1999). Liptov. Bratislava, Dajama. 136 p.Lehotský M., Székely V. (1995). Okres Liptovský Mikuláš - okres s
najprírodnejšou hranicou Slovenska. Geografia, 3, 120-122.Lepawsky J. (2009). Clustering as anti-politics machine? Situating the politics
of regional economic development and Malaysia´s Multimedia Super Cor-ridor. Regional Studies, 43, 463-478.
Nordin S., (2003). Tourism clustering and innovations, no.14, ETOUR Mid-Sweden University, Östersund.
Novelli M., Schmitz B., Spencer T. (2006). Networks, clusters and innovation in tourism: A UK experience. Tourism Management, 27, 1141-1152.
Malberg A., Maskell P. (2002). The elusive concept of localization economies: towards a knowledge-based theory of spatial clustering. Environment and Planning A, 34, 429–449.
Marshall, A. (1890). Principles of Economics. London: Macmillan. (http://www.econlib.org/library/Marshall).
Martin, R., Sunley, P. (2003). Deconstructing clusters: chaotic concept or pol-icy panacea? Journal of Economic Geography, 3, 5-35.
Porter, M. (1990). The Competitive Advantage of Nations. New York: The Free Press.
Porter M. (1998). On Competition. Boston, Harvard Business School Press.Székely V. (2003). Tourism in rural areas of Slovakia: economic development
and/or sustainable development? Geopolitical Studies, 11 – Eastern dimen-sion of European Union, 251-264.
Vladim
ír Székely

121Dorota Klepacka-Kołodziejska1 Institute of Rural and Agricultural Development, Polish Academy of Sciences, Nowy Świat 72, str, 00-330 Warsaw, Poland
Does Less Favoured Areas Measure support sustainability of European rurality? The Polish experience
Abstract: The article presents some of findings of research on less favoured areas in the European Union, with a special focus on Poland. The author conducted three types of studies and analyses. Firstly, the paper presents the conclusion of the farm accountancy data analysis what gives the view of the economic situation of LFA and non-LFA farms in Poland. Secondly, by means of interview questi-onnaires, the LFA farmers’ attitude to continuing agricultural activity in these areas, which is one of the objectives of the instrument were investigated. Thirdly, the author analysed foreign statistics and literature to compare LFA support in Poland and other EU member states. Basing on the above mentioned research the author tries to answer does the measure supporting less favoured areas support sustainable development of rural areas in Europe.
Keywords: the Common Agriculture Policy instrument; support for less favoured areas (LFA); compensatory allowances for LFA; sustainable development; rurality
Introduction
For many years there has been discussion in the European Union on how the importance of rural areas and agriculture for European society and economy should be reflected in the EU’s development policies and budgetary spending. There is a general consensus that rural areas have many unique assets – fresh air, open space, nature, landscape, clean waters, relatively uncontaminated soils, rural cultural heritage and so on – which constitute a public good valu-able to society and future generations. At the same time, compared to cities, rural areas are generally less populated, have poorly developed infrastructure, are peripheral, many of them have unfavourable natural conditions for far-ming and features that are not conducive to social change. Farmers tend to be seen as a poor class, one less educated and less able to adapt to social and eco-

122 nomic change than other social classes, while farming is perceived as hard and unprofitable work on the land. In this context, farming is becoming a rather unattractive source of income. As a result, many people may be persuaded to give up farming, consequently, contributing to the depopulation of rural areas, a process which is highly undesirable.
This situation requires action on the part of the state, whose role is to inter-vene in socially important spheres by means of relevant policies. By working on the land and living in rural areas, farmers are “guardians” of the country-side and provide a link between policy pursued by the state and the condition of the countryside. Therefore, they are indispensable if rural areas are to be preserved. The state influences the social, economic and environmental deve-lopment of rural areas through instruments targeted at these areas directly or indirectly by agricultural, rural, environmental, regional and social policies. All agree that the instruments should support sustainable development of rural areas. What is sustainable development then? There are plenty of definitions concerning different levels of sustainability. Having them in mind the author uses following own for the purpose of the research:
1. Balanced management of certain economic, social and environmental resources;
2. Considering long-term, medium and short-term effects of contem-porary actions for next generations;
3. Considering the effects of our decisions and actions for not only local area but also for neighbour area and region.
Among the instruments targeted at rural areas is support scheme for farmers in less favoured areas (LFA). By compensating the farmers for lower income they derive from farming, the schemes are designed to maintain agriculture and population levels in rural areas. There are a few reasons which make re-search on quality of less favoured areas scheme regarding sustainability advis-able. Firstly, LFA support schemes account for a major proportion of funds set aside from the EU and national budgets for rural areas. Secondly, opponents of the LFA measure argue that objectives set to it are too broad and vague, something which gives member states too much freedom in interpreting the objectives and makes reliable evaluation and verification of the measure dif-ficult [Special…2003 ]. Thirdly, LFA schemes, like most measures aimed to support rural development, are planned at the EU-27 level but are intended for countries which differ greatly in economic and environmental terms. There-fore, it is important to find out how the measure addresses the needs of Polish rural areas.
Methodology
Given the controversial nature of this instrument, the author decided to set three goals to her research:
1. Analysis of the LFA support concept as an instrument designed to support sustainable development of rural areas;
Dorota K
lepacka-Kołodziejska

1232. Attempt to assess whether the LFA support concept is in conformity with the principles of the functioning of this instrument;
3. Analysis of how well the instrument in its existing form suits Polish conditions.
In the course of the research, the author used the Polish Farm Accountan-cy Data Network (quantitative part of the research), conducted field studies (qualitative part), examined the Polish and foreign literature on the subject and collected a general statistical data base. The analysis of the situation of LFAs in other than Poland EU members concerned 15 countries (until 2003). The quantitative research was based on 2005 FADN data. By identifying dif-ferences in the resources and organisation of farms located in individual LFA areas and non-LFA farms, the author was able to make an attempt to assess the legitimacy of compensatory allowances in individual areas.
The author used FADN notional categories. The size of the FADN sample in Poland – the author considered the whole population of FADN farms in the first full year of Poland’s membership of the EU, i.e. 2005 - differed for indi-vidual LFA categories and regions (Table 1). The FADN farms were analysed according to location: in lowland LFAs, mountain LFAs and in non-LFA areas. With the data available, it is impossible to distinguish LFAs I and II and LFAs with specific handicaps. As a result, they were all treated as lowland LFAs. In line with FADN principles, the author assumed the division of Poland into four SGM (the farm classification is based on Standard Gross Margins (SGM) “2000” for the year 2005) regions presented in Table 1.
Table 1. Number of farms in the Polish FADN sample in 2005
Number of farms in region
Specification Total
Pomorze and Mazury (north and north-east)
Wielkopolska and Slask (west and south-west)
Mazowsze and Podlasie (central-east and east)
Ma³opolska and Pogórze (south and south-east)
Symbol A B C D
Number of farms in sample: - non LFA - mountain LFA - lowland LFA
6078 109 5562
1000 -
513
1712 23 2193
3015 -
1872
351 86 984
Source: Author’s own compilation on the basis of FADN data
The second part of the research project was field studies focused on social problems. Research on farmers’ views and attitudes is important because the views and attitudes determine farmers’ decisions to continue or discontinue agricultural activity and consequently have an impact on the extent to which the LFA measure achieves its objectives. The purpose of the field research was to learn about farm operators’ attitude to the new farming conditions, especial-ly EU support, and the associated benefits and disadvantages, and about their
Does Less Favoured A
reas Measure support sustainability of European rurality? The Polish experience

124 views on continuing agricultural activity, developing their farms and living in rural areas. The research is not representative. Its findings were only meant to help deepen the analysis and make it easier to draw conclusions.
The field research was conducted from 1 April to 3 June 2006 in six communes located in four Polish regions. The regions selected for the research are loca-ted at the four opposite ends of the country (regions with the most peripheral location in Poland). Conditions in these regions are characteristic of a given LFA type. Additionally, the author also took into considerations areas which, for various reasons, are discussed in literature as having special problems: mountain and hill areas, the eastern part of Poland and areas whose agricul-ture had been dominated in the past by large state-owned farms. From 19 to 24 interviews were conducted in each region. The total number of interviews was 88. The sample selection was targeted and was made in consultation with agricultural advisory centres in relevant counties. Interviews were conducted with farm operators. The research was qualitative in nature and the author conducted the interviews on her own with the use of a specially designed que-stionnaire. Most of the questions were in open format.
Less favoured areas in the EU-15
The idea to support farms located in areas with unfavourable natural condi-tions for agricultural activity has originated in England. Under The Hill Far-ming Act of 1946, cattle and sheep producers in mountain and hill areas recei-ved compensatory allowances to offset their lower incomes. The share of the allowances in the total income of family farms which received the assistance was quite considerable [Draft..., 2004]. After its entry to the European Com-munities in 1972, the UK asked for introducing the system of compensatory allowances for farmers in disadvantaged areas in all member states.
In 1975 the Council Directive 75/268 of 28 April 1975 on mountain and hill farming and farming in certain less-favoured areas was adopted, authorising member states to introduce a system of compensatory allowances for farmers in areas with relatively poor natural conditions for farming to offset higher production costs. Compared to the English system, the scope of support to be provided under the Council Directive was expanded to include lowland areas. The Council Directive was supplemented by Explanatory Memoran-dum (COM(74) 2222), which provided member states with guidelines for the implementation of the programme.
The assumptions of the Council Directive 75/268 provided the basis for fur-ther legislation to regulate the system of compensatory allowances, including the Council Regulation (EC) No. 1257/1999 of 17 May 1999 on support for rural development from the European Agricultural Guidance and Guarantee Fund (EAGGF) in the years 2000-2006 and the Council Regulation (EC) 1698/2005, which regulates development programmes for 2007-2013.
Dorota K
lepacka-Kołodziejska

125The main objectives behind compensating farmers for lower incomes derived from farming in LFAs are as follows: to ensure continued agricultural land use, maintain rural populations at viable levels and protect rural landscape in these areas. Member states were authorised to introduce the LFA measure to encourage farmers to continue agricultural activity by compensating them for the income deficit due to their farming in disadvantaged areas, which conse-quently meant raising the farmers’ incomes.
Three types of disadvantaged rural areas, each with varying degrees of han-dicap affecting farming, were designated. The first type, one with the grea-test natural handicaps, was mountain areas (Article 3(3) of Council Directive 75/268/EEC). Farming in these areas was deemed necessary to prevent water and wind erosion, maintain rural landscapes and preserve the areas’ attractive-ness for tourists. The degree of handicap is measured by conditions existing at individual altitudes. The European Commission decided that such natural conditions can be found at altitudes ranging from 600 to 800 metres and/or in areas with slopes of at least 20% [Explanatory Memorandum, 1975]. Farms located in mountain areas produce lower yields owing to lower temperatures, poorer soil quality and short growing seasons. Land slope, which makes work in the fields more difficult or requires using expensive special machinery, was taken into account for lower altitudes. [Explanatory Memorandum, 1975].
The second type was areas in danger of depopulation, something which had an adverse impact on the viability of local communities and rural landscape protection (Article 3(4) of Council Directive 75/268/EEC). The areas had to be homogenous in terms of natural conditions for farming and had to meet the following criteria:
• presence of soils not suitable for crop production or intensification wi-thout incurring high costs - soils intended mainly for extensive cattle production;
• poor soil quality, or low population density and farming as the main source of livelihood.
These conditions meant that member states were required to adopt indices for three types of phenomena occurring in these areas: economic indices, popula-tion density and the production index [Explanatory Memorandum, 1975].
The third LFA type is small areas with specific handicaps where continued ag-ricultural activity was deemed necessary to preserve rural landscape, maintain the tourist potential of the area or protect the coastline. The Memorandum complemented these characteristics with poor soils, unfavourable water con-ditions, excessive salinity in coastal areas and small islands. The share of the-se areas in any of the EU member states was not to exceed 2.5% of all less favoured areas [Explanatory Memorandum, 1975].
The most recent expansion of the less favoured areas in the EU-15 took place in 1998. Therefore, the data for the years 2000-2003 presented below are still
Does Less Favoured A
reas Measure support sustainability of European rurality? The Polish experience

126 relevant. In the years 1975-2000, the share of less favoured areas in the EU-15 increased by 20% (Figure 1). The largest increase was recorded in Italy, Ireland, Germany and France. [Special..., 2003].
0
20
40
60
1975 1985 1990 2000
year
perc
enta
ge
Figure 1. Share of less favoured areas in the EU-15 in 1975-2000Source: Special Report No 4/2003 Concerning Rural Development: Support For Less-Favoured Areas, Together With The Commission’s Replies. Court Of Auditors (Pursuant to Article 248(4), Second Subparagraph of The EC Treaty) (2003/C 151/01) OJ C 151, 27.6.2003
In both EU-15 and EU-27 the second LFA group was the largest. The reason was that this category was the most wide-ranging as it described three indices: economic, demographic or production ones. The smallest category was type 3, i.e. costal areas, islands and other (Figure 2).
mountain areas35%
specific (small) LFA4%
other LFA61%
Figure 2. Structure of the areas of particular types/groups of LFASource: Special Report No 4/2003 Concerning Rural Development: Support For Less-Favoured Areas, Together With The Commission’s Replies. Court Of Auditors (Pursuant to Article 248(4), Second Subparagraph of The EC Treaty) (2003/C 151/01) OJ C 151, 27.6.2003
Member states were given the right to expand the LFA objectives and guide-lines included in the EC Regulation, and to introduce additional conditions and eligibility criteria. The additional objectives included supporting a rise in farmer incomes, counteracting depopulation in rural areas, enhancing the competitiveness of rural areas, supporting employment in rural areas, protec-ting the farm structure adapted to local conditions, supporting small family farms, and rewarding services for the public. The introduction of the addi-
Dorota K
lepacka-Kołodziejska

127tional LFA objectives indicates that individual member states have different needs and different expectations of CAP measures. Additionally, it makes the measure quite difficult to assess and its effects difficult to compare.
The first group were countries, for example France, Finland and Austria, which suffered from severe depopulation in rural areas and needed to maintain small and medium-sized family farms. In these countries, compensatory allowances were an important form of farm support. Some countries, for example Finland, set aside additional funds from their national budgets to support these areas.
Another group were countries with a large number of economically relatively weak farms with lower ESU levels and smaller size (Greece, Spain and Por-tugal) where a significant number of farms received relatively low payments. One example is the Spanish rural development programme, which incorpora-ted almost all available measures. As a result, the programme lacked orien-tation and unit payments were low. Compensatory allowances were of little significance in small countries (Denmark, Belgium and Holland).
The objectives set to the LFA measure, delimitation indices, degressive pay-ments, additional requirements set to beneficiaries and payment rates indicate which policy the member state has chosen: a policy aimed to aggregate sup-port amounts for smaller areas or to set aside small amounts for numerous beneficiaries. It also reflects to some extent the member state’s attitude to LFA – showing whether the state treats the LFA measure as a way to easily transfer money to rural areas or as a real tool for supporting rural development.
The LFA measure is flexible. It gives member states much freedom in adju-sting LFA support to their specific needs and conditions. At the same time, the measure is difficult to assess while its imprecise objectives and varied as-sumptions give countries too much freedom in interpreting the rules of action. However, this situation is beneficial to member states because a thorough as-sessment of the assumptions and mechanisms of the LFA measure could lead to a reduction in the total LFA area and stir up controversies within the World Trade Organisation (WTO).
The Court of Auditors points out that the European Commission does not have data which would enable an in-depth evaluation of the LFA measure and its updating [Special… 2003]. There are two reasons for this. The first one is the strong lobby of large member states and farmer groups, which successfully defend in Brussels transfers for their members. This means creating a political rent, as a result of which EU farmers’ incomes depend to a large extent on pressure exerted on decision-makers rather than the actual situation on the market [Wilkin, 2005].
The second reason is that the legitimacy of LFA compensatory allowances, despite some reservations, can be justified quite easily at the WTO. The LFA measure assumes that the farmer has to continue operating his farm for five
Does Less Favoured A
reas Measure support sustainability of European rurality? The Polish experience

128 years since receiving the first compensatory allowance and has to hold agricu-ltural land. This is understandable given the purpose of the measure, which is to ensure that agricultural activity is continued in order to help maintain viable rural communities. However, for the measure to qualify for the “green basket” as decoupled according to paragraph 6e annex 2 to the The Uruguay Round Agreements Act (URAA) one of the criteria has to be met, i.e. “payment should not be dependent on production” [Cardwell after Swinbank, 2005]. Since 2001 LFA compensatory allowances have met this condition.
Less favoured areas measure in Poland
The measure discussed above had the largest share (26%) in the Rural Deve-lopment Plan 2004-2006. The second largest measure was early retirement and the third one was the agri-environment support.
LFAs of the first type are mountain areas disadvantaged due to their climatic conditions, terrain features and soil quality. In Poland, communes and geodetic districts where more than half of all agricultural land is at an altitude of at least 500 metres have been designated as mountain LFAs (In the EU-15, the altitude has to be at least 600 metres. The reason is that climatic and plant conditions in the Carpathians and Sudetes at an altitude of 650 metres are comparable with conditions found in the Alps at an altitude of 920 metres) [Plan..., 2004].
The second type of less favoured areas are lowland LFAs. They are divided into lowland LFAs I (less disadvantaged) and lowland LFAs II (more disad-vantaged). The Land Quality Index (LQI) together with population density and the share of population engaged in agriculture have been used in order to designate lowland LFAs in Poland. The LQI is an aggregated indicator based on the assessment of the following factors: soil quality; climate; land relief; soil soil moisture index. Areas with LQI values of over 52 points (60.9 points on average) were classified as LFA I. It was estimated that from the total popu-lation of model farms, the following shares of farms belonged to this group:
• 5% of intensive farms with good soils;• 35% of intensive farms with medium soils;• 15% of extensive farms with good soils;• 40% of extensive farms with medium soils;• 60% of extensive farms with poor soils.
These farms, situated in 750 gminas, would represent around 37.9% of the total farmland area in Poland. Only extensive farms with poor soils (40% of such farms) were classified as LFA II (LQI below 52 points – 47.6 points on average); such farms represent about 13.15% of the total farmland area in Po-land in around 270 gminas. (Plan 2004).
This division corresponds with the one used by England and Ireland, where less and more disadvantaged land categories have been designated within the second LFA type, and the one used by France, where piedmont (areas
Dorota K
lepacka-Kołodziejska

129included in the second LFA type and defined as mountain areas, however with less severe climatic and topographical conditions) and simple LFAs have been delimited.
According to Council Regulation (EC) 1257/1999, lowland LFAs have to meet three criteria: low productivity, limited production potential and disa-dvantaged demographic situation. The Land Quality Index (LQI) is used to measure productivity in less favoured areas. It takes into account soil quali-ty, climatic conditions, water conditions and topographic factors (Soil quality accounted for around 80% of the index). The same index is used to measure production potential because its value is highly correlated with yields. The demographic index enables determining population density, which in the se-cond LFA type must not exceed 75 persons per square kilometre at county and commune level. In line with Explanatory Memorandum COM (784) 2222, in both categories of LFAs account was taken of communes where the share of farming population is at least 15%.
In 2004, the share of LFAs in the total area of agricultural land was 54.2%, with 52.6% qualified for payments (0.7% of agricultural land in LFAs is in farms smaller than 1 hectare what exclude them from the support). 2.06% of these areas were mountain areas, 89.16% were lowland areas and 8.78% were areas with specific handicaps. The LFAs were delimited with the use of the LQI developed by the Institute of Soil Science and Plant Cultivation in Puławy. The European Commission approved this delimitation criterion due to the similarity between Polish and German delimitation. Thanks to the existence of the index, Poland was able to effectively defend its position and include over 50% of the country’s area to LFA. If data based on LQI had been absent Poland would have had to adopt the Commission’s criteria, as a result of which only 13% of areas qualified for LFA would have been eligible for payments [Kukuła, 2006].
In Poland, the LFA measure is widely accessible for beneficiaries because the criteria that are in force are easy to meet. In practice, they are limited to the criteria defined by the Commission. An additional criterion is minimum farm size, but its introduction is associated more with the need to provide a defini-tion of farm than an attempt to limit access to the measure or make the criteria more stringent. A member state’s approach to the criteria is determined by its strategy for using the funds from this measure. Poland has clearly given prefe-rence to supporting the largest possible number of beneficiaries with smaller amounts of money. This is in contrast to France, for instance, where numerous criteria have been introduced, including the farmer’s age, place of residence and income from farming as well as additional subdivisions of LFA types. Po-land should not be explicitly criticised for its approach to LFA. For a country like Poland it is more important to absorb the funds available than to achieve additional advanced goals, which may only be realised if the country’s deve-lopment level is on a par with most of the old EU countries.
Does Less Favoured A
reas Measure support sustainability of European rurality? The Polish experience

130 Economic situation of farms in less favoured areas in Poland
Data on the organisation and output of the farms analysed indicate the impor-tance of extensive animal production in mountain areas, the presence of poor natural conditions and poorer economic results. In devising a system to sup-port farms in these areas, it would be desirable to strengthen different forms of support for activities associated with animal production, i.e. production typi-cal of mountain regions, including forms of support aimed at preserving tradi-tional mountain breeds, sheep grazing in national parks, supporting traditional animal products, and the region’s culture and identity.
According to the broad FADN data analysis there are only small differences in the resources and economic situation of farms in lowland LFAs and non-LFAs farms. For instance net income per capita was about 5% higher in lowland LFA and non-LFA areas. The instrument should be assessed for individual LFA types. The research conducted shows there is overcompensation in lowland LFAs and undercompensation in mountain LFAs. Farms in the Małopolska and Pogórze (mountain and hilly) region have much worse indices for all LFA types than the remaining regions. Net income per capita in the mountain areas was about 36% lower than in lowland LFA and about 32% lower than in non-LFA. This shows the need to enhance regional support for these areas.
A correlation was found between the extent to which agri-environment pro-grammes are used and farm size and location. Small mountain farms were found to have the highest participation levels in these programmes. The reason is that for small farms with poor soils it is easier and more profitable to use agri-environment programmes than to intensify production.
Natural conditions determining farmers’ participation in individual structural programmes shows once again the need to strengthen the support for farms si-tuated in areas with the worst natural conditions in aiming to remove develop-ment disparities between EU regions and enhance socio-economic cohesion. Diversify forms of support for mentioned areas seems to be important.
Investment programmes contribute to increasing the value of fixed assets, an ex-ample being the SAPARD programme. Most of the investment made as part of this programme was in machines and equipment, especially tractors, while the value of production did not increase. Compensatory allowances may be and are to a large extent set aside for working capital. They also contribute to using more fertilisers and better livestock feeding. However, this problem requires research.
Farmers’ views on LFA support and their attitudes to continuing agricu-ltural activity
Finding out about farmers’ views on conditions for farming after Poland’s entry to the European Union is important because these views influence mea-sures taken by farmers on their farms. These measures, in turn, determine the
Dorota K
lepacka-Kołodziejska

131farms’ condition and their survival prospects. Whether or not LFA objectives - such as continued farming, and the protection of the environment and lands-cape - will be achieved depends to a large extent on this.
On the basis of the interviews with farmers, the author assess that the LFA measure in Poland may strengthen the polarisation of farms due to excessive, in farmers’ view, phytosanitary requirements, which farms have to meet in a relatively short time, something which involves high costs (e.g. manure pads). Research showed that farmers holding medium-sized animal farms located close to cities were most sceptical about investing to comply with the EU requirements, and hence staying in agriculture. Paradoxically, small farms, which in many cases have no alternative, are more likely to survive. A que-stion arises whether the LFA payments associated with environmental requi-rements have a positive impact in some areas on decisions to continue agri-cultural activity and therefore encourage structural changes. More in-depth research into this problem is needed. On the other hand, LFA payments offer the greatest chance to medium-sized farms, which have resources to be able to access the funds (own contribution) and at the same time still suffer from underinvestment. EU funds also offer an opportunity to catch up with farms which so far have been regarded as the best in the village, something which often gives farmers much motivation.
According to farmers, subsidies are a factor of marginal significance in their taking decisions to continue agricultural activity. Those with large farms or the small farms which have no alternative have it easier to take such decisions. Although in the case of better farms, payments encourage successors to take over, the decisive factor is the economic strength of the farm and good role models of farmers as successful entrepreneurs growing their business.
According to most farmers, in 2005 their income from farming was lower than the average annual income in the years 2000-2004. Farmers equate Poland’s entry to the European Union with a drop in purchase prices for agricultural pro-duce and a rise in production costs. However, these views do not correspond with data on profitability in agriculture. According to the Central Statistical Office (GUS), the average monthly disposable income per farming household increased by around 16% in 2000-2004, by around 26% in 2000-2005 and by around 12% in 2004-2005 while the average income per private family farm rose by 17%, 20% and 4% respectively. According to Poczta [2006], in the years 2000-2005 the income of agricultural producers increased by 44% in current prices if calculated using accrual-basis accounting and by 55% if calculated using cash-basis accounting. Thus the farmers opinion should be treated very carefully, having in mind that farmers are the working group with the tendency to present their income situation in an unfavourable light.
The author did not find any correlation between farmers’ views and attitudes to continuing agricultural activity and location in individual LFA types. But there is correlation between farmers’ attitudes and the economic strength of
Does Less Favoured A
reas Measure support sustainability of European rurality? The Polish experience

132 their farms. In communes where the largest share of farms produced “for the market,” farmers’ willingness to stay in agriculture was the strongest, irrespec-tive of the payments.
Farmers do not distinguish between payment types: it does not matter to them whether the money they get is LFA payments or other payments, they treat them as a single whole. Most farmers say they use the payments to buy ferti-lisers, plant protection chemicals, seeds and fuel, which makes it possible for them to avoid working-capital loans. Farmers say the subsidies have enabled them to use more fertilisers, which has contributed to higher yields and hig-her incomes.
Conclusions
1. Considerable funds have been set aside from the Guarantee Section of the European Agricultural Guidance and Guarantee Fund and from national bud-gets for support to less favoured areas. The system of support to less favoured areas is designed in a way which enables directing the funds towards different objectives. The first objective is to increase farmer incomes and use the LFA measure mainly as an easy way to transfer funds to rural areas. The second is to counteract the depopulation of rural areas. Countries with small farms and weaker agricultural sectors limit themselves to minimal requirements: those imposed by the European Commission. As a result, the subsidies get “diluted” because they go to too many beneficiaries.
The member states which have more developed agricultural sectors, larger far-ms and better infrastructure have introduced many additional stipulations. As a result, the LFA measure in these countries is something more than support to farmer incomes. Among the additional criteria are those aimed to improve environmental quality, which supports the “greening CAP” principle intro-duced under Agenda 2000. Another goal is to improve the farming structure through the introduction of additional criteria, like for example farm size and the age of the beneficiary. Poland belongs to the first category of countries. The support of LFA is contemporary. It has no more influence if the payment are stoped. There is no long term influence in the development of the area. The condition of sustainability is hard to gain then.
2. As member states have much freedom in adjusting LFA support to their specific needs, each country is guided by different rules. The right to adjust LFA support has good points but the drawback is that it makes evaluation impossible and does not provide a strong rationale for change. Over the 30 years since it was established the LFA measure has never been thoroughly assessed; it has only been expanded. This shows that LFA is to a large extent a political measure and is now very difficult to reform. LFA objectives are too wide-ranging and not precise. If the goal is to maintain viable rural com-munities social policy measures may be more suitable. For the protecting the environment and preserving rural areas the agri-environment measures are
Dorota K
lepacka-Kołodziejska

133much more effective. And farmer incomes may be supported through direct payments for land. All these instruments exist and are used as direct mea-sures. Therefore, LFA support looks like the “hybrid” of other measures for which a special philosophy has been developed. However, LFA is a “conve-nient” measure to support agriculture and rural areas and is easy to justify at the WTO.
3. One should not forget that measures under the Rural Development Pro-gramme 2004-2006 in Poland, including the LFA measure, were the first in-struments of support for rural areas after its entry to the European Union. This means that both the administration and the beneficiaries were only learning to use this form of support. It is natural that a priority for those responsible for the Rural Development Programme was to absorb the funds set aside for the programme while the high share of funds earmarked for the LFA measure was expected to help achieve this goal. Poland has set its farmers minimal require-ments and has not introduced any additional stipulations. As a result, the mea-sure works in Poland as an easy way to transfer financial means to rural areas. However, it would be advisable to consider whether more money should not be set aside in the next programming periods for creating additional jobs in rural areas, education, improvement of the farming structure and income di-versification. Perhaps LFA payments should become only an additional, com-plementary, form of support to improving farmers’ financial condition and, consequently, their share in the total budget of rural development programmes should be reduced.
References
Cardwell M. (2005): The European Model of Agriculture. Oxford Studies of Law. Oxford University Press, Oxford.
Draft note on severely disadvantaged land, maszynopis, materiały otrzymane w trakcie konsultacji w Londynie, 2004.
Explanatory Memorandum COM (74) 2222, maszynopis (draft).Kukuła S. (2006): Instytut Uprawy Nawożenia i Gleboznawstwa - PIB
w Puławach wspiera realizację koncepcji rozwoju zrównoważonego (Insti-tute of Soil Science and Plant Cultivation State Research Institute supports conception of sustainable development), internet publication www.iung.pulawy.pl/Aktualnosci/pdfy/Rozwoj_zrownowazony.pdf.
Plan Rozwoju Obszarów Wiejskich dla Polski na lata 2004-2006 (Rural Deve-lopment Plan for Poland 2004-2006) (2004), Ministerstwo Rolnictwa i Ro-zwoju Wsi (Ministry of Agriculture and Rural Development), Warszawa.
Poczta W. (2006): Przemiany w rolnictwie (Transformation in agriculture) [w:] „Polska wieś 2006. Raport o stanie wsi” (in: Rural Poland 2006. Report on the Condition of Rural Areas) pod red. (ed.) J. Wilkina. FDPA, Warszawa.
Rural Development in the European Union Statistical and Economic Informa-tion Report 2006, European Commission Directorate-General for Agricul-ture and Rural Development, www.eu.int.
Does Less Favoured A
reas Measure support sustainability of European rurality? The Polish experience

134 Special Report No 4/2003 Concerning Rural Development: Support For Less-Favoured Areas, Together With The Commission’s Replies. Court Of Audi-tors (Pursuant to Article 248(4), Second Subparagraph of The EC Treaty) (2003/C 151/01) OJ C 151, 27.6.2003.
Wilkin J., red. (ed.), (2005): Teoria wyboru publicznego. Wstęp do analizy po-lityki i funkcjonowania sfery publicznej (Public choice theory. The entrance to the analysis of policy and functioning the public sphere). Wydawnictwo Naukowe SCHOLAR, Warszawa.
Dorota K
lepacka-Kołodziejska

135Oksana Kleban1 Department of Marketing, Faculty of Economics and Management, Lviv National University of Veterinary Medicine and Biotechnologies, named after S. Z. Gzhytskyi, Ukraine
Problems of effective use of physical capital in agricultural enterprises of Ukraine
Abstract: Our primary focus is to analyse the dynamics and structure of physical capital in agricultural enterprises of Lviv region (Ukraine). Conceptual, logical, normative and simplex methods have been used with a view to carrying out the research. The results of the study can be taken into consideration by agricultural enterprises while planning physical capital requirements and forming the optimal structure of physical capital. Also, the results can be used while elaborating and implementing state activities, relative to increasing the economic effectiveness of physical capital usage in agricultural enterprises. The effective use of physical capital is possible under condition of forecasting of the market situation and dis-semination of this information among all producers of agricultural products.
Keywords: physical capital; agricultural enterprises; economic effectiveness; mar-ket situation; Ukraine
Introduction
The problems of effective use of physical capital are always relevant. From the beginning of 1991, Ukrainian agrarian reforms have been directed to increasing the effective usage of resource potential of agriculture. These reforms were ba-sed on the transformation of government property to private and rejection of the administrative command system. It was considered that the business initiative of private owners would automatically ensure targeted results. But the course of events in the following years confirmed the mistake of this opinion
Many Ukrainian economists researched problems of effective physical capital usage at agricultural enterprises. But still, there is no single viewpoint concer-ning ways of forming the optimal structure of physical capital and supporting

136 effective use of it. There are different approaches concerning the definition of economic effectiveness of physical capital usage in the economic literature. S. Ishchuk considers economic effectiveness as a ratio of results to resources used in obtaining these results. However, the author lays the stress on the importance of timely enterprises reacting to changes in the market situation (Ishchuk 2006). The business competition stimulates producers to use their physical capital in the most reasonable way. Hence, Shnypko (2005) defines economic effectiveness as a combination of resources that provide maximal output with minimum expenses. Other researches define economic effective-ness of physical capital usage as a possibility of enterprises to raise output from existing means of production (Cramon-Taubadel 2004).
The aim of this paper is to explore practical questions of forming and effective use of physical capital in agricultural enterprises under changeable market conditions. Our research has been conducted in accordance with current prin-ciples of market economy, namely when resources (including physical capital) are limited and they have to be used in the most expedient way. If there is no demand for the product or the output does not satisfy some needs, this kind of product cannot be used for measuring the level of effectiveness of physical capital usage. The value of this product is equal to zero until it is sold. Market pricing depends on the product value for customers. Manufacturing expenses of the enterprise are considered as lost abilities to produce other kinds of pro-ducts. The excess price indicates the effective use of all resources including physical capital. So, in our opinion, economic effectiveness of physical capital usage is considered as the possibility of the enterprise to turn the maximum profit per unit of used physical capital. Therefore, the main index of effective-ness of physical capital usage is the profit per unit of its value.
Methodology
The principles of Ukrainian and foreign economic science concerning physi-cal capital usage are the theoretical and methodological background for this research. In order to carry out the study, we used following methods: concep-tual and logical – for summing up the theoretical tendencies and substantiating ways of effective physical capital usage; normative – for calculation of physi-cal capital requirements according to the market situation; simplex – to deter-mine the optimal structure of physical capital of the agricultural enterprise.
Results
Lviv region was the first area where the agrarian reform was started. However, the legislative basis was extensive in time. It did not facilitate to save integral property complexes and it had a negative influence on property. Nowadays, it is problematic to secure effective use of physical capital which has been priva-tized in such a way. Many agricultural enterprises do not have their own physi-cal capital that can be used in production process. Thus, they take some types of physical capital on a lease for a short-term period of time. Accordingly, it
Oksana K
leban

137is not possible to make long-term economic plans directed at effective use of physical capital of agricultural enterprise. In 2002-2008 a downward tendency of the value of physical capital used in agricultural enterprises, can be obser-ved (Table 1).
Table 1. Physical capital of agricultural enterprises of Lviv region according to types of economic activities (in initial value)
Physical capital according to types of economic activities 2002 2004 2006 2007 2008
2008 vs. 2002 (in
%) Physical capital – grand total (UAH*) 2314.0 1795.3 1852.5 1821.4 1810.9 78.3
including physical capital used in: agriculture 2091.9 1609.0 1657.7 1616.9 1582.4 75.6
industry 68.9 76.7 109.4 132.8 152.1 220.8 construction 1.4 1.4 0.9 1.2 1.2 85.7 wholesale and retail trade 7.5 2.9 2.0 2.2 2.5 33.3 transport and communications 67.6 34.1 30.3 27.6 35.5 52.5 real estate operations, leasing and services for entities 57.3 47.9 29.3 13.8 25.5 44.5 other types of economic activities 19.4 23.3 22.9 26.9 11.7 60.3
*UAH: Ukrainian hryvnia
The value of physical capital used in agricultural production declined by 24.4%. It can be explained that agriculture is a less profitable sector than others. Therefore, the rate of profit is a determinant factor in attracting invest-ments in general, including physical capital investments. As we can see from Table 1, the share of the value of physical capital used in industry increased by 120.8%. It can be explained that agricultural enterprises give specific at-tention to forming physical capital of manufacturing industry exactly. In this way, producers try to reduce the negative impact of monopolistic trends from purveying centres and processing enterprises. Thus, many farms buy mainly non-agricultural physical capital. In this way, they try to diversify their econo-mic activity. As it is generally known, the possibilities of enterprises concer-ning production efficiency are determined by many factors. One of them is the procurement of physical capital. To illustrate this impact, we have classified agricultural enterprises of the Yavoriv district (Lviv region).
The highest index of effectiveness of physical capital usage is evident in those enterprises where there is the least value of physical capital. This contradicts conventional approaches. A lot of physical capital cannot be used in the pro-duction process because of high level of physical depreciation. Some types of physical capital are used only in separate agricultural production, e.g. grain
Problems of effective use of physical capital in agricultural enterprises of U
kraine

138 combine harvester. Besides, many fixed assets cannot be used at all, for exam-ple livestock houses, because of decreasing of agricultural land in enterprises. These are the main problems and particularity of physical capital usage in ag-ricultural enterprises of Ukraine. Farms with a lower value of physical capital can use it more flexibly and quickly adapt to the market conditions. According to this, they can earn the highest level of profit per 100 UAH of physical ca-pital value. Large-scale enterprises with high value of fixed capital have an advantage due to scale effect. Even in the conditions of an unfavourable mar-ket situation, they can secure profitability of physical capital use by reduction in production costs. According to the data in Table 2, the profit of large-scale farms per 100 UAH of physical capital value is lower than in the group of enterprises with the lowest similar index. It means that large-scale enterprises do not realise their production potential to any great extent.
Table 2. Classification of agricultural enterprises of Yavoriv district of Lviv region according to physical capital value per 100 hectares of households
Classified enterprises according to physical capital value per 100 hectares of
households (ths UAH) I - II - III - IV - Indexes
Less than 100 100-299 300-499 500+
Average
Number of agricultural enterprises 8 9 5 3 25
Average value of physical capital – grand total (ths UAH) 168.6 561.2 1719.3 2386.6 886.2
Average value of physical capital per 100 hectares of households (ths UAH)
55.5 171.6 409.4 2081.5 249.9
Income (+), loss (-) at an average per an enterprise (ths UAH) +32.8 +26.2 -22.4 +15.4 +17.3
Income (+), loss (-) per 100 UAH of physical capital value (UAH)
+44.5 +6.9 -1.6 +1.2 +16.5
The most significant reason for low economic efficiency of physical capital use is dynamical agrarian market conditions, which are not prognosticated. Producers of agricultural products are deprived of the information about the expected market situation. Enterprises take decisions concerning reasonable ways of using physical capital according to the information from previous market periods. As a rule, in the following year producers usually raise the out-put of such products that were profitable in previous year. The supply of some agricultural products increases by joint action of many producers. Hereupon, prices of those products decrease and farms cannot get the expected profit. So, it leads to ineffective physical capital usage.
A lot of physical capital in agriculture is specific and can be used only for production of definite products. That is why this physical capital cannot be
Oksana K
leban
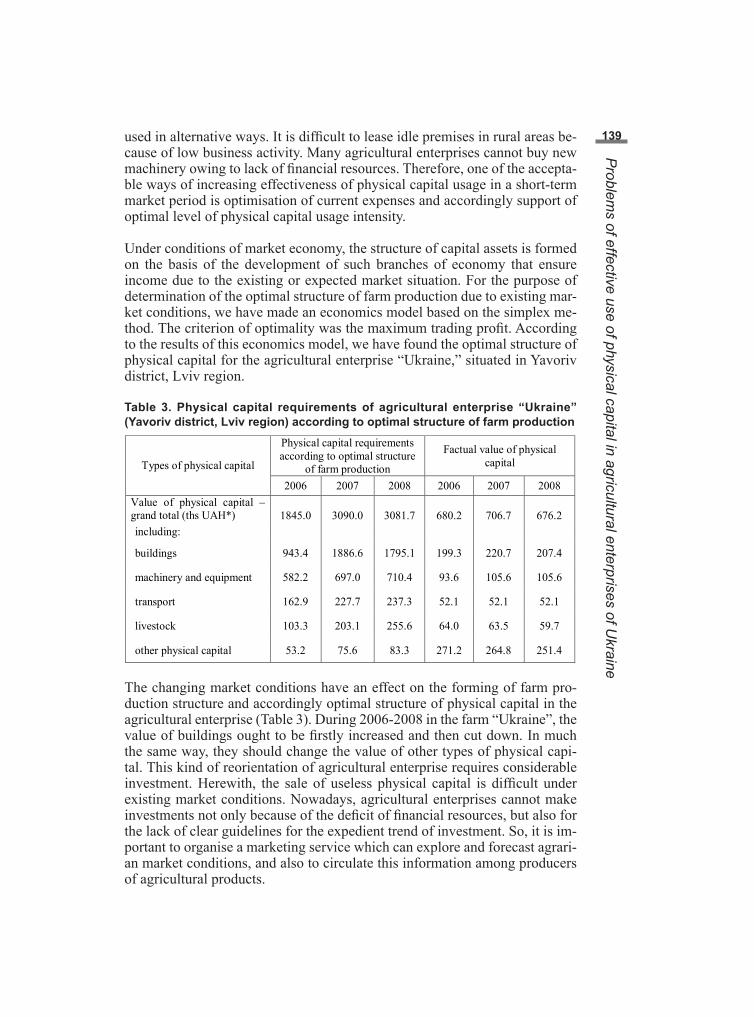
139used in alternative ways. It is difficult to lease idle premises in rural areas be-cause of low business activity. Many agricultural enterprises cannot buy new machinery owing to lack of financial resources. Therefore, one of the accepta-ble ways of increasing effectiveness of physical capital usage in a short-term market period is optimisation of current expenses and accordingly support of optimal level of physical capital usage intensity.
Under conditions of market economy, the structure of capital assets is formed on the basis of the development of such branches of economy that ensure income due to the existing or expected market situation. For the purpose of determination of the optimal structure of farm production due to existing mar-ket conditions, we have made an economics model based on the simplex me-thod. The criterion of optimality was the maximum trading profit. According to the results of this economics model, we have found the optimal structure of physical capital for the agricultural enterprise “Ukraine,” situated in Yavoriv district, Lviv region.
Table 3. Physical capital requirements of agricultural enterprise “Ukraine” (Yavoriv district, Lviv region) according to optimal structure of farm production
Physical capital requirements according to optimal structure
of farm production
Factual value of physical capital Types of physical capital
2006 2007 2008 2006 2007 2008 Value of physical capital – grand total (ths UAH*) 1845.0 3090.0 3081.7 680.2 706.7 676.2 including:
buildings 943.4 1886.6 1795.1 199.3 220.7 207.4
machinery and equipment 582.2 697.0 710.4 93.6 105.6 105.6
transport 162.9 227.7 237.3 52.1 52.1 52.1
livestock 103.3 203.1 255.6 64.0 63.5 59.7
other physical capital 53.2 75.6 83.3 271.2 264.8 251.4
The changing market conditions have an effect on the forming of farm pro-duction structure and accordingly optimal structure of physical capital in the agricultural enterprise (Table 3). During 2006-2008 in the farm “Ukraine”, the value of buildings ought to be firstly increased and then cut down. In much the same way, they should change the value of other types of physical capi-tal. This kind of reorientation of agricultural enterprise requires considerable investment. Herewith, the sale of useless physical capital is difficult under existing market conditions. Nowadays, agricultural enterprises cannot make investments not only because of the deficit of financial resources, but also for the lack of clear guidelines for the expedient trend of investment. So, it is im-portant to organise a marketing service which can explore and forecast agrari-an market conditions, and also to circulate this information among producers of agricultural products.
Problems of effective use of physical capital in agricultural enterprises of U
kraine

140 Conclusions
In the transitional period, the market infrastructure is not yet formed. It is hard to make either strategic plans, or present corporate development plans under existing trends in prices. Therefore, the government regulation that is current in many countries with developed market economy is necessary. This kind of regulation supports effects of market regulator that facilitates econo-mic stabilisation. Small-scale enterprises with small physical capital value are more manoeuvrable according to changes of market conditions. Large-scale enterprises cannot so flexibly reorient their production process by changing the structure of physical capital. In unfavourable years, government aid to large-scale agricultural enterprises is necessary. The existing system of sup-port leads to dissipation of funds and does not provide a promotional and regulating effect.
References
Іщук С. О., Виробничий потенціал промислових підприємств: проблеми формування і розвитку: Монографія. – Львів: ІРД НАН України, 2006. – 278 с. (Ishchuk S. Production potential of industrial enterprises: problems of forming and development. – Lviv, 2006. – 278 p.)
Сільське господарство України: криза та відновлення / За ред. Ш. фон Крамона-Таубаделя, С. Дем’яненка, А. Куна. – К.: КНЕУ, 2004. – 207 с. (Agriculture of Ukraine: crisis and renovation / Edited by S. Cramon-Taubadel. – Kyiv, 2004. – 207 p.)
Шнипко О., Нагромадження основного капіталу як фактор конкурентоспроможності економіки // Економіка України. – 2005. – № 7. – С. 23-35. (Shnypko O. Accumulation of capital assets as a factor of competitive ability of economy // Economy of Ukraine. – 2005. – № 7. – P. 23-35.)
Oksana K
leban

141Pekka Jokinen1, Marja Järvelä2, Ari Paloviita3, Antti Puupponen3
1 University of Eastern Finland, Department of Historical and Geographical Studies, 80101, Joensuu, Finland
[email protected] University of Jyväskylä, Department of Social Sciences and Philosophy, 40014, Jyväskylä, Finland
[email protected], [email protected] University of Jyväskylä, School of Business and Economics, 40014, Jyväskylä, Finland
Do local food supply chains meet the targets of sustainable livelihood? A case study in Central Finland
Abstract: Community resilience refers to a community’s capacity to actively ad-apt and evolve by balancing internal and external driving forces in a sustainable way. In this paper, emerging local food supply networks are analysed in terms of social capital and community resilience. Firstly, the links embodying trust or the lack of trust in the local food networks are studied. Secondly, we examine how social resilience is created at the community level. Our empirical case study on Central Finland combines quantitative and qualitative approaches. The core data are drawn from the survey exploring farmers’ collaboration and networks and from in-depth interviews with four local stakeholder groups representing dif-ferent positions in the local food chain. It is concluded that in Central Finland the community resilience is advancing with slow steps of adaptation to external challenges. Yet, there are several peculiar challenges in the Northern Model of local food system.
Keywords: social resilience; rural sustainability; local food production; small scale entrepreneurship; food networks; central Finland
Introduction
Food, community and the place are intertwined in our lived worlds and across time (Feagan 2007). During the last two decades, food systems have been emphatically politicized in high consumption societies through differentiated

142 consumers demand and also through regional initiatives to secure local food supply or to produce quality food to the more demanding consumers (Renting et al. 2003). Local food has been introduced as a means to endorse farm live-lihood and rural sustainability (e.g. Marsden and Smith 2005). Local food is also conceived to imply improved food security and decreasing the ecological footprint of the food system (e.g. Brunori 2007).
However, conceptualizing the local food networks and their relationship to the conventional food supply chains should not be oversimplified (Higgins et al 2008). Local social interactions do not automatically correspond to desirable forms of social and environmental relations (DuPuis and Goodman 2005). Further, in order to make success on the markets, local producers often have to penetrate through a considerable thicket of societal preconditions that may vary from state to state and from region to region (Schmid and Sinabell 2007). Also natural circumstances differ greatly when considering what is feasible in terms of local agricultural production.
In this paper, emerging food supply networks are analysed in terms of social capital and community resilience. The analysis is focused on northern Europe, more specifically on the case of Finland. Community resilience refers to a community’s capacity to actively adapt and evolve by balancing internal and external driving forces in a sustainable way, which resonates with the needs and aims of the local actors (e.g. Adger 2000; Folke et al. 2002; Langridge et al 2006). Local actors are the major social resources at their constituencies and, therefore, we expect that they perform an important role in launching initiatives in order to improve measures for attaining sustainable livelihood. A rural community with agricultural enterprises is not isolated from the external world and, importantly, the outside influences are not only bringing new risks and demands but also options and facilities for improved livelihood.
The modernisation of Finnish society has resulted in quite late but then rapid transition of the industrial structure into a service-dominated society and also in the depopulation of rural areas. Finland has experienced two waves of rural-urban migrations since World War II which have affected essentially the liveli-hoods and socio-cultural patterns of rural communities (Katajamäki, 1999; Jo-kinen et al. 2008). The first rural depopulation, which intensified in the 1960s and early 1970s, was connected to the revolutionised technological working methods in forestry and agriculture. This phase, in which numerous small far-ms closed their production and entire villages were deserted, has been defined even the fastest rural depopulation among the western industrial countries. The second wave of Finnish rural depopulation in the 1990s was based on the rise of information technologies and the globalisation of mass production.
As Finland joined the EU in 1995, a major impact appeared not only on do-mestic agriculture but also on the market forces and public institutional norms affecting rural livelihoods. Tykkyläinen (2005) identified two major factors dominating recent rural restructuring in Finland: both the decline in primary
Pekka Jokinen, Marja Järvelä, A
ri Paloviita, Antti Puupponen

143sector employment and the re-organisation of the public service sector are pushing people out of the countryside. Counter forces such as the emergence of small rural enterprises are not strong enough yet. However, the current rural development has also encouraged local stakeholders to look for new alterna-tives of rural production and local livelihood. In a way, rural communities are at present subjected to a resilience test where both the individual performance and the community support to novel entrepreneurship do matter.
This paper addresses the links embodying trust or the lack of trust in the local food networks. We also examine how social resilience is created at the com-munity level. Thus, what kind of internal and external driving forces and ad-option mechanisms do the local farmers and other stakeholders identify? What is the contribution of different actors to the social resilience of the territorial order? To what extent do the new food production activities reflect genuinely improved community resilience? The empirical case study carried out in Cen-tral Finland is presented in chapter 3.
Community resilience and territorial order
In the era of globalisation, people become increasingly aware that they are in competition with other places for highly mobile capital, productive assets and even for cultural resources (Harvey 1996; Castells 2000; Urry 2000). Con-sequently, ‘selling of place’ becomes a target that is expected to support the social resilience of the community and to help its members to prosper. Simul-taneously, the ‘monopoly power’ inherent in place is much reduced, and in a globalising society communities can rarely be self-sufficient (Harvey 1996; Feagan 2007). Yet, the general circumstances experienced by traditional com-munities may encourage stakeholders to give priority to local cooperation in-stead of mutual competition over territorial resources, even if it depends on a range of socio-economic and socio-cultural factors.
Besides a site of competition or cooperation, the territory can be understood in terms of local or sub-regional needs, which sums up individual needs of the population residing in the area. However, social needs can also be understood as reciprocal social capabilities, which refer to community resilience covering the developmental aspect of future livelihoods and coping with the change in community (Westlund 2003; Lebel et al. 2006). Moreover, local needs can be contrasted to global needs or needs of any external unit. The more the risk is realised as an exclusion from the benefits of globalisation, the more likely the community’s spokespersons will underline the comprehensive needs of the threatened community.
Thus, local communities make a sub-region, which includes both independent action and multiplied interaction with external powers. Besides of needs, the sub-region can be discussed in terms of responsibilities. In order to meet the target of sustainable livelihood, the development must adopt a sustainable way of using natural resources and other goods and assets at disposal. These assets
Do local food supply chains m
eet the targets of sustainable livelihood? A case study in central Finland
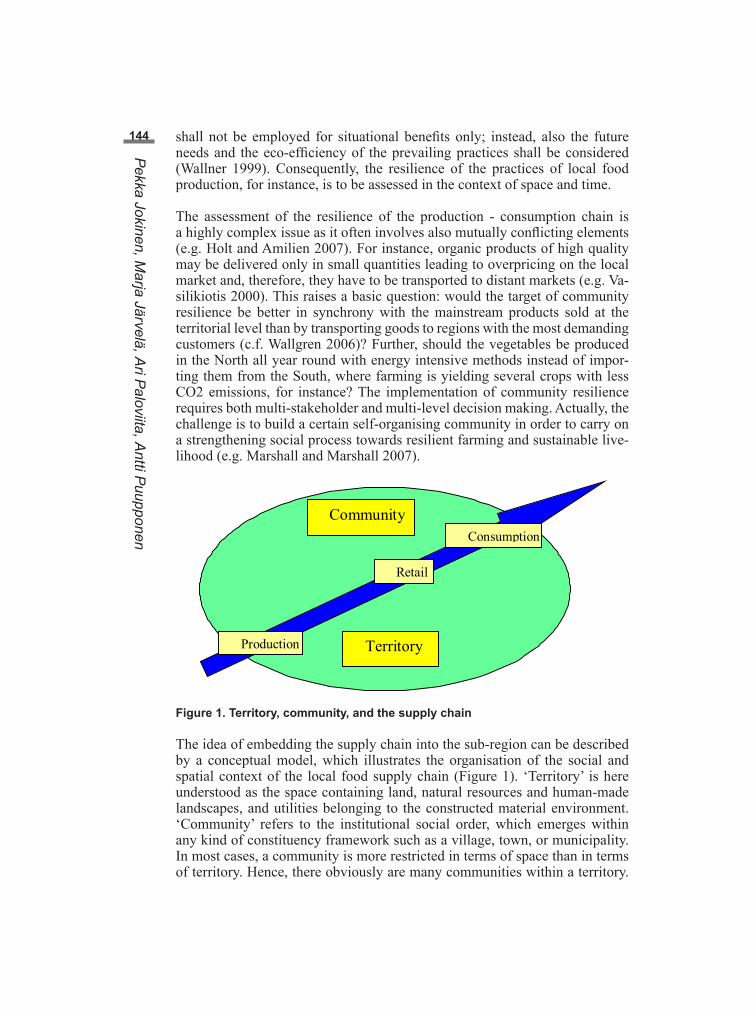
144 shall not be employed for situational benefits only; instead, also the future needs and the eco-efficiency of the prevailing practices shall be considered (Wallner 1999). Consequently, the resilience of the practices of local food production, for instance, is to be assessed in the context of space and time.
The assessment of the resilience of the production - consumption chain is a highly complex issue as it often involves also mutually conflicting elements (e.g. Holt and Amilien 2007). For instance, organic products of high quality may be delivered only in small quantities leading to overpricing on the local market and, therefore, they have to be transported to distant markets (e.g. Va-silikiotis 2000). This raises a basic question: would the target of community resilience be better in synchrony with the mainstream products sold at the territorial level than by transporting goods to regions with the most demanding customers (c.f. Wallgren 2006)? Further, should the vegetables be produced in the North all year round with energy intensive methods instead of impor-ting them from the South, where farming is yielding several crops with less CO2 emissions, for instance? The implementation of community resilience requires both multi-stakeholder and multi-level decision making. Actually, the challenge is to build a certain self-organising community in order to carry on a strengthening social process towards resilient farming and sustainable live-lihood (e.g. Marshall and Marshall 2007).
Territory
Community
Productionon
Retail
Consumption
Figure 1. Territory, community, and the supply chain
The idea of embedding the supply chain into the sub-region can be described by a conceptual model, which illustrates the organisation of the social and spatial context of the local food supply chain (Figure 1). ‘Territory’ is here understood as the space containing land, natural resources and human-made landscapes, and utilities belonging to the constructed material environment. ‘Community’ refers to the institutional social order, which emerges within any kind of constituency framework such as a village, town, or municipality. In most cases, a community is more restricted in terms of space than in terms of territory. Hence, there obviously are many communities within a territory.
Pekka Jokinen, Marja Järvelä, A
ri Paloviita, Antti Puupponen

145The interesting question is how the community is embedded in the territory and how their reciprocal relationship is positioned. An unsustainable social entity is illustrated by a community using the natural resources of its territory into depletion. Such a case would be particularly dramatic for farmers since their assets cannot be easily transferred to other locations. Territory is also the location of territorial heritage, which is an essential part of the socio-economic and socio-cultural assets involved in local food activity (e.g. Battaglini 2005).
The local implementation of sustainable development means that develop-ment is translated into action guaranteeing livelihood for local actors (Järvelä et al. 2009). The analytical distinction between the community and territory in regard to sustainable development and resilience then appears crucial. Com-munity resilience can be discussed as the capacity for action of the community actors and institutions (Gibbs 2000). We can also examine the contribution of different actors to the social resilience of a territorial order. Certainly, these two aspects are often linked. However, this is not necessarily the case as far-mers may organise the production in a way, which does not affect the commu-nity directly but still has considerable impacts on the resilience of the territory. For instance, a farm selling its entire production outside the community, even outside the territory, still leaves its foot print on the local environment – per-haps without much value added to its local constituency.
The case study: data and analysis
The strong re-structuration of the Finnish countryside has resulted in the rise of the number of passive farms. On the other hand, production activities have also become more heterogeneous. The number of diversified farms, which are running not only agriculture and forestry but also other, non-agricultural businesses, is increasing steadily, and nowadays a third of all Finnish farms count as diversified farms.
Our empirical case study focuses on Central Finland with approximately 260,000 inhabitants. Its capital is Jyväskylä and the population and business have centred in the Jyväskylä region with 133,000 inhabitants. As in whole Finland, the number of farms is decreasing but the average size of production units is increasing. At moment, there are approximately 3,500 active farms in Central Finland, and primary production contributes five per cent to the employment which is about the same share as the average of the whole coun-try. In Central Finland, the strong factors of agriculture include large forest resources, a good level of pluriactivity, and co-operative practices between farms. On the other, the scattered field structure and the still low average size of farms may be considered weaknesses at the regional scale. More than a half of the 3,500 farms are livestock farms and over a third are dairy farms. The average field area is 29 hectares and the average forest area is 66 hectares per farm. The latter figure means that forestry is still a foremost farming activity in terms of economic viability. Around half of the farms in the area have other entrepreneurial activities besides agriculture and forestry.
Do local food supply chains m
eet the targets of sustainable livelihood? A case study in central Finland

146 Our empirical study combines quantitative and qualitative approaches. First-ly, the survey aims to explore farmers’ collaboration and networks as well as various sustainability issues associated with the farms. The survey was admi-nistered with a mailed questionnaire. Within the 3,557 farms, a systematic ran-dom sampling was applied picking every third element. Based on the response rate of 45 %, the final sample is considered a representative sample. Secondly, we conducted a qualitative case study including interviews with major sta-keholders. In-depth interviews were made with twenty-seven farmers, eight representatives of food industry, eleven managers from local retails, and fif-teen rural development managers working with local food projects (Figure 2). The results of the qualitative study are based on thematic analysis which means identifying, firstly, the basic themes and organising themes in stories on local food, and, secondly, finding patterns of living and thinking. We use some direct quotes taken from the conversation data in order to illustrate the interpretations which have been made
Figure 2. Local stakeholder map and the number of persons interviewed
Community resilience and sub-regional incentives to local food production in central Finland
Network activity in local food business
When Finland entered the common European agricultural market, the basic parameters of domestic food production changed immediately. The market prices of agricultural products fell on average by 40% of the 1994 level, which was followed by the pressures for farmers to expand and intensify their pro-duction (Niemi and Ahlstedt 2008). Our survey study (Figure 3) confirms that the actor, which the farmers consider the most influential in the economic sen-se, is the European Union. The forest companies, which in practice are inter-
Pekka Jokinen, Marja Järvelä, A
ri Paloviita, Antti Puupponen

147national actors, rank the second. These results thus suggest that the strongest external pressures on farms are caused by actors, which are operating solely beyond the local and regional levels.
1 1,5 2 2,5 3 3,5 4
Production input suppliers (n = 456)
Local farmers (n = 466)
Local enterprises (n = 450)
Wholesalers and retailers (n = 454)
Municipal rural authorities (n = 467)
Consumers (n = 441)
TE development centre (n = 458)
Forest Management Association (n = 478)
Forestry Centre (n = 456)
Forest industry companies (n = 471)
Energy companies (n = 448)
Food refiners (n = 448)
European Union (n = 460)
Finance and insurance companies (n = 459)
Education and advisor organizations (n = 455)
Domestic environmental authorities (n = 459)
Mean
Figure 3. The effect of various actors on the farms’ economic success (in means, 1 = no influence; 5 = extensive influence)
As a potential counter-force for the power of supra-local actors, there seems to be increasing interest for cooperation among and between the stakeholder groups of local food business. Our survey tells that 55% of the farmers have collaboration with other local farms or rural enterprises. What purposes do the active networks serve in local food business? According to our results, the farmers think that isolation is dangerous in the present food business.
“Yes, obviously we need to network, since there are so many different branches to be mastered as part of the entire business. The rural entrepreneurship to-day requires diversity and versatile skills. One must lay hands on so many different tasks in so many sectors - actually quite distant from one another - starting from the calculations and accounting. Today you really need to have a modern office with the ICT facilities and all. And you have to master everything by yourself.” (Interview, Farmer 15).
Farmers could surely be outsourcing some of these tasks. However, they sel-dom do since the basic cultural model of business is the Finnish family farm, where most tasks are taken care of. However, the farmers we interviewed give high priority to horizontal cooperation in order to secure steady delivery. The cooperation related to the small scaled business is actually the point where reciprocity comes in and community spirits starts to feature.
Also the other groups we interviewed favour cooperation among local food producers. Yet, the industrial stakeholders are somewhat sceptical towards lo-cal networking as they suppose that within the highly chained retail business decisions are, in practice, made in the capital region (i.e. Helsinki region). This will, it was argued, result in the standardised food supply over the whole country. The rural developers are more optimistic about the networking.
Do local food supply chains m
eet the targets of sustainable livelihood? A case study in central Finland

148 It was reminded, for instance, that if something goes wrong at individual far-ms, a cooperative or some other form of network can provide replacements for the supply shortages on a temporary basis.
Cooperation implies trust which can be seen as an essential element constructing local social capital. The survey study shows that the actors, which the farmers re-gard as the most trustworthy, are local by nature: the municipal rural authorities are ranked the first and the local farmers the second (Figure 4). On the other hand, the actors considered the least trustworthy are national/supra-national such as the EU, the domestic environmental authorities, and the energy companies.
1 1,5 2 2,5 3 3,5 4 4,5
Production input suppliers (n = 453)
Local farmers (n = 454)
Local enterprises (n = 439)
Wholesalers and retailers (n = 441)
Municipal rural authorities (n = 464)
Consumers (n = 436)
TE Development Centre (n = 456)
Forest Management Association (n = 473)
Forestry Centre (n = 447)
Forest industry companies (n = 466)
Energy companies (n = 437)
Food refiners (n = 431)
European Union (n = 457)
Finance and insurance companies (n = 455)
Education and advisor organizations (n = 448)
Domestic environmental authorities (n = 456)
Mean
Figure 4. Trustworthiness of various stakeholders perceived by the farmers (means, 1 = very untrustworthy; 5 = very trustworthy)
Social capital and trust is embedded into local activities
The out-migration, depopulation, and closing of small farms in recent decades have resulted in the isolation of Finnish farms. They have also contributed to the considerable break in the tradition of reciprocal help, which actually was quite common still after the WWII. To what extent can the recent forms of horizontal and vertical cooperation be regarded as entirely novel social pat-terns? Alternatively, do we simply recognize some traditional form of recipro-city coming back? According to our survey study, mechanical contracting and farm work are the most typical forms of collaboration followed by the joint ownership of machines. The cooperation usually starts from the actual need for external resources following the economic situation of the farm. Thus, the main motivation for collaboration seems to be related to economic factors such as cost savings. However, also the convenience of collaborative work and the social benefits seem to be motivating to the cooperation.
On the basis of the in-depth interviews, we can observe that the dominant form of cooperation is still a single farm linkage with both upstream and down-stream links indispensable for the main business. There are cases of the most
Pekka Jokinen, Marja Järvelä, A
ri Paloviita, Antti Puupponen

149traditional cooperation with the confirmed experience of mutual trust mainly looking at the upstream supply chain.
“We have cooperated for decades with a hatchery delivering fish fry. And now they have started all this fuss about networks… And we have also other similar long-term business partners throughout the country delivering dif-ferent products. We have always worked together with them but any signed agreements have never been made. The way we do is almost automatic, say, with the fishermen delivering vendace.” (Interview, Farmer 4)
The downstream examples seem to entail also more complex, more institutio-nalized and more technology mediated patterns of cooperation: there the trust is by no means ‘automatic’. For the farmer, there is a double challenge when she or he tries to secure the path downstream to the retail business and even to local food industry. One part of the challenge is to provide the right kind of supply just on time in order to secure the deal with a single buyer. The other is to simultaneously try to standardise the supply and to make it ready to be codified for sale, in principle, to any buyer at the national level. Thus, the trust is mediated through fixed codes, which essentially transform the professional work of the food supplier.
“If you want to make sure that your products meet the requirement of compe-tition with the mass production, you need to have very nice labels, an EAN-code and an effective quality check mechanism. Nothing else would do.” (In-terview, Farmer 6)
Food security control appears, somewhat surprisingly, an ambivalent issue. Several farmers consider it overwhelming, but the picture is changing when attention is paid to other stakeholders. The retailers see health security control as one of the main reasons why the Finns indeed prioritize domestic food against imported food. In other words, the retailers basically reduce the issue of trust to consumer perceptions.
“Indeed, Finland is a very patronizing society. Therefore, the check system of health impacts and other similar procedures are driven to extremes with the consequence that the customers and people in general become manic in their demand for domestic meat. All other food is perceived as inferior.” (Interview, Retailer 2)
In the upstream supply chain, trust still seems to entail many of the old day characteristics including traditional social reciprocity. Instead, when going downstream, farmers actually encounter another kind of food system, where the old elements of trust lose their value and are replaced by technically orga-nized systems. Thus, the globalising economic system makes the place of the small entrepreneur unclear.
Overall, the situation of local farmers is characterized by two potential stalemates of the food system. Firstly, the horizontal networks among farmers are a relatively big challenge as the cooperation at community level has once been deteriorated.
Do local food supply chains m
eet the targets of sustainable livelihood? A case study in central Finland

150 Both the farmers and other stakeholders have some doubts on the impact of hori-zontal networking as the food system is increasingly globalized and standardized. Yet, according to our survey, there seems to be no single major barrier to local col-laboration. As expected, the lack of potential partners is a common barrier since the number of active farms has decreased. Also the farmers’ attitudes to collaboration and the desire for independency can be seen as minor obstacles to local coope-ration. The results actually suggest that the farmers’ networks are driven more by survival strategies focusing on production methods and less by competitive strategies focusing on markets. This is simply because cutting costs is prioritized against value adding activities. Secondly, it is not clear how the access to the entire supply chain could be guaranteed to the producers of local food. This is-sue is particularly related to the different socio-economic and socio-cultural logics of action prevailing at the different stages of the supply chain.
Strengthening resilience through local initiatives
In improving the sustainable rural livelihood, farmers are obviously the key actors. It can be presumed that without their initiatives, the rural landscape and community would not be conserved and prospered.
“Indeed, the countryside will be deserted if we don’t do something of this type … If you really want to live here, you should start something yourself. Most new initiatives are related to food production. Or something you can do with your own hands. Certainly, it is the lifeblood of rural area that we take such action here…” (Interview, Farmer 10).
Table 1. Farmers’ perceptions on opportunities and threats to farming (5= very promising opportunity; 1 = very serious threat)
N Mean Median S.D. Increasing interest on local food 457 3,9 4 0,763 Increasing share of renewable energy 455 3,8 4 0,780 Discussion on food safety 459 3,5 3 0,926 Increasing consumer pressure 457 3,2 3 0,865 Agricultural loading on water systems 458 2,8 3 0,825 Opening up of new markets 448 2,8 3 0,914 Climate change 464 2,6 3 1,015 Increasing amount of waste 465 2,5 3 0,794 Increasing control 468 2,5 3 0,914 GMO Food 467 2,4 2 0,981 Stricter environmental legislation 467 2,4 2 0,982 Increasing requirements for reporting 457 2,3 2 0,865 Consumers' low agricultural knowledge 460 2,2 2 0,910 Food chains controlled by big retailers 450 2,2 2 0,803 Monopoly of energy markets 451 2,1 2 0,797
As comes to novel business ideas, local food is clearly recognized by the far-mers. Table 1 shows that in our survey study the increasing interest on local food was perceived as the strongest opportunity for the farms. It was followed
Pekka Jokinen, Marja Järvelä, A
ri Paloviita, Antti Puupponen
151by the increasing share of renewable energy. On the other hand, ‘monopoly of energy markets’ and ‘food chains controlled by big retailers’ were seen as the worst threats for farms. Thus, the farmers tend to recognize the opportunities at local level but feel themselves threatened by national and supranational actors. It also seems that the external pressure through market forces is con-sidered even a stronger threat than the pressure through the command and control policies.
Thus, the rural space as the site of farmers’ own initiatives is of crucial impor-tance. Local farmers seem to be rather confident if only the bottlenecks of the downstream food chain (foremost a more flexible delivery) can be solved. Ho-wever, there are even more perplexing aspects which are related to multilevel governance and to the control of the small scale refining on farms. From the farmer’s view point, public policy does not encourage business initiatives for the local refining of farm products. One interviewee refers to European expe-rience and claims that only some exceptions have successfully initiated a si-milar rural brand product in Central Finland as the local cheese made on farm:
“In Finland, this kind of entrepreneurship (small scale refinery on farm) re-sults in entangling to overwhelming bureaucracy, and that is by no means easy… It has not been any priority among authorities to support this kind of activity. If public authorities could clarify the rules of the game and make the things less complicated, I’m sure that there would be more people entering this kind of business. And this, for sure, would empower rural areas. And it would also help to diversify the livelihood. In the long run, the advan-ced processing of food in small refineries may add a great deal to the local assets.”(Interview, Farmer15).
It is often understood that the food processing enhances primarily the eco-nomic capacity at the farm level. However, the rural developers emphasised also other variegated beneficial impacts of the traditional crop cultivation in-cluding the increase in ecological and cultural resilience. Indeed, sustainable development is seen as a challenge of balancing many different aspects of human activities and the rural environment. The identification of a long term vision plays an important role in increasing the social resilience at the commu-nity level. Actually, we found some ‘visioning’ on this, yet not so much with the local food producers than with the other stakeholders. It is rather clear that the trajectory of a rural community towards enhanced sustainability and social resilience is based on a successful combination of private entrepreneurship and community assets. These assets refer to the local incentives and networks and to the support to local food processing and branding culture. Such a sub-regional structure of rural-urban transactions and transfer may be understood as the main focus of development. This brings back the idea of territory which was, interestingly, elaborated by one of the rural developers:
“It is most important to keep the countryside inhabited. And this cannot be done without effective farms keeping the fields under cultivation. In fact, we need a network that would, in a sense, feed a local main farm. Imagine a big
Do local food supply chains m
eet the targets of sustainable livelihood? A case study in central Finland

152 farm at the centre and around it we would find small farms feeding this big one. This would have the benefit that all the farms did not need to grow bigger yielding a huge crop. Yet, there would be one single farm qualifying as the centre of local supply.” (Interview, Rural Development Professional 9)
Discussion
We have found that, despite the strong agricultural transition in Finland, the stakeholders have a rather strong conception that the countryside should fol-low an agricultural trajectory solving the current development problems. The territory is essential for local food production at individual farms but also for encouraging the networking and transaction within a specific area. Also the community as a social entity belongs to the notion of local sustainability. Yet it is rather unclear how the communities in Central Finland should get organised in order to encourage local food initiatives. The policy-makers have not taken any meaningful role in enhancing social resilience through local food initiati-ves, and for the local food producers the policies appear more like an element of control than a source of support and incentives. Yet, the rural developers should not be accused for the lack of visions on regional development. Ano-ther basic question is how, in practice, the food chain should be reorganised in order to encourage resilient rural development.
We conclude that in Central Finland the community resilience is advancing with slow steps of adaptation to external challenges and by aiming to over-come the internal rigidities of social organisation and the conventions of the food market. The adoption of new technologies in production and sales is an essential part of this agenda. Yet, there are several peculiar challenges in the Northern Model of local food system. The local stakeholders we interviewed underlined the low density of population, the difficult access to the market, and the lack of lucidity on profitable specialisation and branding.
Moreover, there seems to be a gap between the farmers’ reality and the public policy discourse on the community and local food conceptions. Therefore, it is difficult to specify the effective incentives for organizing the present sporadic initiatives on farms and at the community level. However, it is obvious that an improved communication and cooperation between stakeholders can clarify the local food conception and open the way to enhanced production and su-stainable livelihood and, finally, to the improved community resilience.
References
Adger WN. Social and ecological resilience: are they related? Progress in Hu-man Geography 2000; 24:347-364.
Battaglini E., Enhancing local sustainability: the role of social capital in the “value attribution” of a territory. In: Järvelä M., Jokinen P. and Puupponen A., eds. Local Sustainability Networks. Jyväskylä: University of Jyväskylä; 2005.
Castells M., Materials for an exploratory theory of the network society. British Journal of Sociology 2000; 51:5–24.
Pekka Jokinen, Marja Järvelä, A
ri Paloviita, Antti Puupponen

153Gianluca B., Local food and alternative food networks: a communication per-spective. Anthropology of Food [online] 2007. URL : http://aof.revues.org/index430.html.
DuPuis M. and Goodman D., Should we go “home” to eat? Toward a reflexive politics of localism. Journal of Rural Studies 2005; 21:359-371.
Feagan R., The place of food: mapping out the “locals” in local food systems. Progress in Human Geography 2007; 31:23–42.
Folke C., Carpenter S., Elmqvist T., Gunderson L., Holling C. S. and Walker B., Resilience and sustainable development: building adaptive capacity in a world of Transformations. Ambio 2002; 31:437-440.
Gibbs D., Ecological modernisation, regional economic development and re-gional development agencies. Geoforum 2000; 31:9-19.
Harvey D., Justice, Nature and the Geography of Difference. Oxford: Black-well, 1996.
Holt G. and Amilien V., Introduction: from local food to localised food. An-thropology of Food [online] 2007. URL : http://aof.revues.org/index405.html
Higgins V., Dibden J. and Cocklin C., Building alternative agri-food networks: Certification, embeddedness and agri-environmental governance. Journal of Rural Studies 2008; 24:15-27.
Jokinen P., Järvelä M., Huttunen S. and Puupponen A., Experiments of su-stainable rural livelihood in Finland. International Journal of Agricultural Resources, Governance and Ecology 2008; 8:211-228.
Järvelä M., Jokinen P., Huttunen S. and Puupponen A., Local food and renew-able energy as emerging new alternatives of rural sustainability in Finland. European Countryside 2009; 1:113-124.
Katajamäki H., Historical transformations of rural Finland. New Rural Policy 1999; 7:11-21.
Langridge R., Christian-Smith J. and Lohse K. A., Access and resilience: ana-lysing the construction of social resilience to the threat of water scarcity. Ecology and Society 2006; 11 [online] URL: http://www.ecologyandsocie-ty.org/vol11/iss2/art18/.
Lebel L., Anderies J. M., Campbell B., Folke C., Hatfield-Dodds S., Hughes T. B. and Wilson J., Governance and the capacity to manage resilience in regional socio-ecological systems. Ecology and Society 2006; 12 [online] URL: http://www.ecologyandsociety.org/vol11/iss1/art19/.
Marshall N. A. and Marshall P. A., Conceptualizing and operationalizing so-cial resilience within commercial fisheries in Northern Australia. Ecology and Society 2007; 12 [online] URL: http://www.ecologyandsociety.org/vol12/iss1/art1/.
Marsden T. and Smith E., Ecological entrepreneurship: Sustainable develop-ment in local communities through quality food production and local bran-ding. Geoforum 2005; 36:440-451.
Niemi J. and Ahlstedt J., Finnish agriculture and rural industries. Helsinki: Agrifood Research Finland; 2008.
Renting H., Marsden T. and Banks J., Understanding alternative food net-works: exploring the role of short food supply chains in rural development. Environment and Planning A 2003; 35:393-411.
Do local food supply chains m
eet the targets of sustainable livelihood? A case study in central Finland

154 Schmid E. and Sinabell F., On the choice of farm management practices after the reform of the Common Agricultural Policy in 2003. Journal of Environ-mental Management 2007; 82:332-340.
Tykkyläinen M., Spatial restructuring of rural Finland. In: Schmied D., ed. Winning and Losing, The Changing Geography of Europe’s Rural Areas. Aldershot: Ashgate; 2005:265-280.
Urry J., Mobile sociology. British Journal of Sociology 2000; 51:185-203.Vasilikiotis C., Can organic farming “Feed the world”? 2001 [online] URL: http://
nature.berkeley.edu/~christos/espm118/articles/organic_feed_world.pdfWallgren C., Local or global food markets: A comparison of energy use for
transport. Local Environment 2006; 11:233–251.Wallner H. P., Towards sustainable development of industry: networking,
complexity and eco-clusters. Journal of Cleaner Production 1999; 7:49-58.Westlund H., Implications of social capital for business to in the in-
formation society, Theoretical considerations. Swedish Institute for Growth Policy Studies 2003. [online] URL: http://www.esri.go.jp/en/workshop/030325/030325paper4-e.pdf.
Pekka Jokinen, Marja Järvelä, A
ri Paloviita, Antti Puupponen

155Marta Błąd1 Institute of Rural and Agricultural Development, Polish Academy of Sciences, Nowy Świat 72, str, 00-330 Warsaw, Poland
Pluriactivity of farming families – old phenomenon in new times
Abstract: The article is devoted to the pluriactivity of farmers and farming fami-lies. It presents a historical outline of this phenomenon, and the conceptualisation of the term pluriactivity and the related term diversification. Then, the scale of pluriactivity in the EU is described on the basis of statistical data, with a special focus on Poland. At the end, the article presents the findings of the author’s own research on pluriactivity conducted in the Gródek district.
Keywords: pluriactivity of farming families; diversification of farms
Introduction
We know from economic history that farming was never the only occupation of rural people, although until the mid-20th century most of them relied main-ly on agriculture. The rural population was always involved in many different activities, which ensured their economic self-sufficiency. Historical sources describing non-agricultural economic activities in rural Poland in the late 16th century [Piekosiński 1896] provide a long list of occupations, of which many are now extinct, like for example: wheelwrights and sieve makers. Peasants used to take their surnames from their non-agricultural activities and some place names also come from these occupations. An example is the Polish surname Piekarz (Baker) and village name Piekary. Owing to the inefficient transport system of that time, rural economic activities were very local and diversified in nature. Rural people had to have the skills to produce everything they needed in their daily life in the home and on the farm. The peasants of that period can be called producer peasants and craftsman peasants.
This lifestyle changed with the start of industrialisation and urbanisation in the 19th century. Industrial development damaged the foundations for the existence of many small rural workshops. Rural areas became more agricul-tural in nature while peasants, now turned into narrow specialists producing

156 agricultural raw materials, were pushed into a new way of life, one which was quite new to them [Pevetz 1994]. This change did not lead to the disappea-rance of pluriactivity but turned it into a dual activity model. There emerged a new form of economic activity in which farming was combined with work in the industrial sector (part-time peasant farmers working in factories). In the European rural economic system, this phenomenon appeared on a large scale after World War II, with the development of rail and road transport. In Poland, the dual activity model was very widespread. It peaked in 1988, when the number of part-time farmers reached 28% of all people employed in agricul-ture [Bukraba – Rylska 2008].
The process of industrial restructuring which began in the early 1990s resulted in axing millions of jobs. Farmers were the first to be made redundant becau-se, as decision-makers argued, farmers losing a job in the industrial sector were losing only an “additional” source of income. The period marked the beginning of secondary pluriactivity and a search for new opportunities for other gainful activities. Pluriactivity of today differs from its earlier form in that farmers and members of their families have started to use a wider ran-ge of income opportunities, including those beyond farming and agricultural production. The new opportunities are largely associated with services and enterprise. Taking up other gainful activities offers farming families a chance to stay in the countryside, keep the farm, even if a small one, and generate an income high enough to enable them to fulfil their financial aspirations at least to some extent.
Pluriactivity and diversification – conceptualisation of terms
In world literature, there are two terms describing the practice of taking up other gainful activities by farmers and farming families: pluriactivity and di-versification. Durand and van Huylenbroeck [2003] define pluriactivity as the combination of agricultural and non-agricultural activities performed by the farmer or members of the farm household. In other words, there are non-agri-cultural sources of income. Meanwhile, they associate diversification with the workplace. It means that the scope of products and services produced and sold is enlarged. In most cases, diversification is done to give or ascribe value or validity to existing production factors such a labour, land, equipment, or to re-duce risk to existing products. Diversification can of course be accomplished by adding non-agricultural activities. In this case, diversification and pluriac-tivity are combined [Durand and van Huylenbroeck, 2003].
Knickel et al. [2003] also think that diversification is a term with a narrower meaning than pluriactivity. According to them, diversification means a new form of agricultural production, one oriented at non-food use. The typical sub-categories are energy crops, fibre crops, herbs for medicinal use, agro-forestry (for wood and biomass production), horse breeding, etc. Another kind of plu-riactivity are new on-farm activities, i.e. farm-based activities (industries, ser-vices) that are not related to food, agricultural production or tourism. Other
Marta B
łąd

157important forms are all sporting activities (not linked to tourism), equestrian activities (e.g. horse-breeding), hunting, fishing, bike rental, school farms, of-fering of workshops/courses, care farms, haulage, etc. Most researchers are agreed that diversification refers exclusively to activities undertaken on the farm or based on the farm’s land and capital resources. In this meaning, di-versification may be seen as a sub-group of pluriactivity, a wider term which covers all forms of generating non-agricultural income, i.e. both on-farm and off-farm activities.
Bessant [2006] presents an interesting description of the evolution of the term “pluriactivity.” He writes that the term “part-time farming” was initially used to refer to other gainful activities, both on farm and off farm. Part-time far-ming was associated with the “marginality” and “insufficiency” of agricultu-ral activity (at present, pluriactivity has become the norm). Part-time farming was (and still is) often associated with strategies for the survival of farming families and farms (strategies for coping with poverty), and treated as a way to secure farmers’ incomes and give them a sense of security.
In the wake of industrialisation and agricultural intensification - consolidation and specialisation – agriculture saw the emergence of very large commercial farms on the one hand and small part-time farms on the other. This gave sup-port to the opinion that pluriactivity is a phenomenon which concerns less pro-ductive, or inefficient, farms (pluriactivity as an antidote to the farms’ finan-cial problems). But after some time, there appeared a tendency to depart from this understanding of the term pluriactivity and instead regard it as “a stable component of the farm’s structure and a relatively well-established lifestyle,” which is shared also by farmers who have larger farms [Bessant, 2006].
In the 1980s researchers started to use the term “multiple jobholding,” which was later replaced by pluriactivity in order to accommodate a wider range of activities and income sources, for example off-farm wages or salaries, self-employment, work on other farms, on-farm activities (i.e. agricultural or non-agricultural) and investment income. Generally, pluriactivity is used to denote situations in which individuals or households combine farm and non-farm employment or revenue streams, regardless of their origin or location.
Pluriactivity in EU-27 with a special focus on Poland
Data collected by Farm Structure Survey (FSS) provide a rich source of in-formation on pluriactivity in the European Union. They cover other gainful activities, either at the level of the farmer or at the level of the holding. The Farm Structure Survey are the only source of harmonised information on the structure of agricultural holdings in the EU. According to the methodology of the Farm Structure Survey, a family farm manager is considered as pluriactive if he/she carries out activity other than farm work for remuneration. Other gain-ful activities are defined as every activity other than activity relating to farm work, carried out for remuneration. This corresponds roughly to three cases:
Pluriactivity of farm
ing families – old phenom
enon in new tim
es

158 the family farm manager is employed in a non-agricultural enterprise; is em-ployed on another agricultural holding; or has set up diversification activities that do not include any farm work (e.g. tourism, handicraft) on his/her holding.
Pluriactivity is assessed at the level of the farmer while farm diversification is assessed at the level of the holding. Diversification is understood as the creati-on of any gainful activities that do not include any farm work but are directly related to the holding, i.e. use its resources or products, and have an econo-mic impact on the holding. This concerns tourism, accommodation and other leisure activities, handicraft, processing of farm products, wood processing, aquaculture, production of renewable energy for the market, contractual work using equipment of the holding and so on.
The 2005 Farm Structure Survey found that 36% of the managers of EU fa-mily farms had another gainful activity, ranging from 17.1% in Belgium to 74.4% in Slovenia (for Poland this share was 39.0%) [Other gainful activi-ties…2008]. Overall, pluriactivity of farmers seems to be more widespread in the Northern and Eastern member States than in the Western and Southern ones. It is mainly managers of farms which are small in terms of their econo-mic potential who have other gainful activities. Namely, at EU-27 level, 44% of farmers with a farm of less than 1 ESU had another gainful activity. This share decreases when the economic size of the farm increases, which means that pluriactivity is mainly a feature of small farms. Looking only at spouses doing farm work on the holding, 35% had another gainful activity [Other gain-ful activities…2008].
One option for a farming household to generate non-agricultural income is to set up diversification activities on the farm. In 2005, 12% of EU-27 farms had a diversification activity. The share of farms with a diversification activity ranged from 1% in Lithuania to 29% in Finland (5.4% in Poland). Therefore, farm diversification is not so common. Generally, larger farms are proportio-nally more diversified than smaller ones. With farms with less than 5 ha repre-senting 69% of all farms with a diversification activity, small farms constitute the bulk of holdings with diversification. Nevertheless, the share of farms with diversification increases with the size of the farm: more than 20% of farms with a physical size of more than 100 ha have a diversification activity, against less than 10% of farms with less than 10 ha [Other gainful activities…2008]. So this trend is the opposite of the trend in pluriactivity. In every member state, small farmers tend to give preference to pluriactivity – not related to the holding – to complement their income whereas on larger holdings this goal is usually achieved through on-farm diversification.
Let us look now at the findings of the sample survey “Structure of agricultural holdings” conducted by the Central Statistical Office (GUS) across Poland in June 2007. This representative survey meets the national and EU needs in terms of the farm structure research the member states were obliged to carry out in line with the Eurostat calendar and requirements. According to the sur-
Marta B
łąd

159vey, the number of farms in Poland was 2,579,200, of which 2,387,200 were private family farms. The number of farms which conducted an on-farm non-agricultural activity, i.e. farms with diversification, was 115,200, or 4.8% of all farms conducting agricultural activity. The largest number of farms with a diversification activity (24,052) was in the group of farms of 1 ha or less; the smallest number (8,020) was in the group of farms of 100 ha or more. But the percentage of farms conducting a non-agricultural activity increased with the farm size - from 3.7% in the group of farms of 1 ha of agricultural land or less to 21.9% in the group of farms of 100 ha of agricultural land or more [Charakterystyka…2008].
In the survey “Structure of agricultural holdings”, on-farm non-agricultural activity is understood as activity directly associated with the holding, i.e. using its resources (labour force, land, buildings, machines, etc.). If labour force is the only resource used to carry out a non-agricultural activity such an activity is not regarded as on-farm activity. This means that the term on-farm non-agricultural activity used in Polish statistics is synonymous with diversi-fication in the understanding of the EU’s Farm Structure Survey. The largest number of farms conducting non-agricultural activities, i.e. diversified farms, was found in the following categories: other activities, including raising fur animals (52,506 or 45.6%), contractual work using equipment of the holding (33,168, or 28.8%), and aquaculture (11,464, or 9.6%). Interestingly, as much as 10% of all Polish farms with diversification – a percentage higher than in any EU country - are engaged in aquaculture [Charakterystyka…2008].
The survey “Structure of agricultural holdings” also provides information on private family farms by household income. The Central Statistical Office clas-sifies farms according to the following sources of income: agricultural acti-vity, non-agricultural activity, wage employment and social security benefits (old-age pensions, disability pensions and other non-earned sources). In 2005 the number of households deriving incomes from non-agricultural activity, including off-farm activity, amounted to 338,100, which accounted for 14.2% of all private family farms. The number of households deriving incomes from wage employment amounted to 1,229,648, or 51.5% of all private family farms. The percentage of households which derived over 50% of their total income from wage employment accounted for 61.4% of all farms deriving income from wage employment. And the percentage of households which de-rived over 50% of their total income from non-agricultural activity accounted for 34.8% of all farms engaged in such activity [Charakterystyka…2008].
Pluriactivity of Polish farming families – case study of Gró-dek district (commune)
In order to get an insight into problems of pluriactivity, the author conducted her own research in the Gródek district. Gródek is a rural district located in Podlasie province in eastern Poland. It borders on Belarus, which means it is situated on the eastern border of the EU. The choice of the district was
Pluriactivity of farm
ing families – old phenom
enon in new tim
es

160 due to the author’s participation in the project entitled “Socio-Economic Determinants of Sustainable Development in Rural Areas Covered by the Natura 2000 Network in the Green Lungs of Poland Region.” Gródek is an agricultural district wholly located in the Green Lungs region. Most of its farms are private family farms specialised in grain, potato and dairy cattle production. The district has experienced depopulation, with a steady decre-ase in the number of its residents – by 7.7% between 2000 and 2007 – owing to the exodus of young educated people who are unable to find here jobs meeting their aspirations and needs.
A special feature of the district is its peripheral location in one of the least developed Polish provinces. As a result, Gródek is not a typical district in terms of pluriactivity but it may provide an interesting case study. As part of the research, the author conducted 58 interviews using a questionnaire. The survey was targeted at the farming families in which at least one member was engaged in non-agricultural activity.
In the questionnaire, the respondents were asked about their occupational activity according to the following criteria: activity exclusively/mainly on the farm or exclusively/mainly off the farm. It turned out that 62.0% of the household heads surveyed were pluriactive, i.e. conducted both agricultural and non-agricultural activities. In this group, 53.4% of the respondents de-voted more time to off-farm than on-farm activities. Additionally, 38.3% of the spouses and 44.1% of the successive household members (members no. 1) were pluriactive. 36.4% of the surveyed spouses worked mainly off the farm (Table 1). Almost all of the respondents engaged in non-agricultural activity were going to continue it, with as much as 93.1% saying they regarded their off-farm jobs as permanent, rather than temporary, activity.
Table 1. Farmers’ perceptions on opportunities and threats to farming
Category Household head (%)
Spouse (%)
Member no. 1 (%)
Exclusively on the farm 20.7 23.6 8.8 Mainly on the farm 8.6 1.9 2.9 Exclusively off the farm 5.2 10.9 2.9 Mainly off the farm 53.4 36.4 41.2 Source: the author’s own research, 2009
In the breakdown by family members, the percentage of household heads en-gaged in off-farm activity was the highest - 67.2%. Generally, in the surveyed population, non-agricultural activity was conducted in the form of permanent gainful employment, with only 8.1% of the household heads doing seasonal jobs. An overwhelming majority were engaged in wage employment, with the percentage ranging from 64.7% to 80% (Table 2).
Marta B
łąd

161Table 2. Non-agricultural activity - wage employment and own account-work (%).
Household head Spouse Member no. 1 I. Percentage of people working off the farm
67.2 49.1 44.1
Of which: 1. permanent gainful employment
91.9 100 100
Of which: 1.2. wage employment 64.7 68 80 1.1. own-account work 35.3 32 20 Source: the author’s own research, 2009. n.b. in the calculations, the author took into account all
the working people rather than all surveyed people
As regards whole households, only 15.5% of them conducted own-account activity. This means that enterprise is not a distinctive feature of the surveyed population. The respondents stressed the advantage of wage employment for them was that the jobs had regular hours and did not require much responsibi-lity (almost none of those surveyed had a managerial post).
The research showed that insufficient farming incomes and the desire to achieve a higher living standard were the main motives for engaging in non-agricultural activity - 55.3% of all answers from respondents engaged in wage employment (Table 3) and 68% of all answers from those engaged in own-account activity. Interestingly, in the case of wage employment, 10% of all answers (half of the answers in the “other motives” category – Table 3) concerned cases in which non-agricultural activity had been taken up earlier than agricultural activity (work on the farm). These persons took over farms from their parents and for this reason, in a natural way, star-ted working in agriculture. It is noteworthy that none of the respondents engaged in wage employment indicated a desire to utilise his or her qua-lifications or fulfil his or her dreams or passions as a motive for taking up a non-agricultural job.
Table 3. Motives for taking up wage employment (percentage of all answers).Insufficient farming incomes 39.3
Desire to achieve a higher living standard 15.9
Closeness of the workplace 10.7
Desire to try one’s hand in a new situation 4.3
Desire to utilise qualifications 0.0
Desire to fulfil dreams or passions 0.0
Availability of free time 7.5
Other 22.3
Source: the author’s own research, 2009. n.b. respondents were allowed to give several an-swers
Pluriactivity of farm
ing families – old phenom
enon in new tim
es

162 As regards motives for taking up own-account activity, the author met only one person who responded that by taking up this activity he had wanted to utilise his qualifications and only two persons who said they had wanted to fulfil their dreams and passions. Among these two people was a farmer who engaged in a very untypical activity, i.e. designing and building innovative agricultural machines. This work is his passion. He said he saw his future in this activity and wanted to develop it, despite the fact that his business made a loss due to investment in the year when the survey was conducted.
Answers to questions about the motives for taking up other gainful activi-ties were compatible with those about the level of income derived from the respondent’s farm. As much as 93.1% of respondents said their farming in-come was too low; the remainder said their farming income was sufficient. No respondent said their farming income was high. Asked whether taking up other gainful activities was a necessity for them, 51.7% of respondents gave a positive answer (Table 4). This was similar to the percentage who said they had engaged in non-agricultural activity for economic reasons (Table 3).
Table 4. Other gainful activity: necessity or choice? (%)
% Onerous necessity 12.1 Necessity bringing satisfaction 39.6 Free choice 48.3 Source: the author’s own research, 2009
It is interesting why the farmers who think that farming does not generate suf-ficient income for them still continue agricultural activity. Almost one fourth of those surveyed said that the land had a sentimental value for them, that they were attached to the land because they had inherited it from their parents and that they would not give up working on the land, even despite of this activity being unprofitable. As much as 42.3% of all answers were in the category “other reasons.” In this category, the surveyed farmers indicated three main reasons for continuing agricultural activity: keeping land to receive payments from the European Union, farming in order to meet the household’s consump-tion needs, and agricultural activity as a hobby.
The first reason cited by those surveyed shows that direct payments from the EU have contributed significantly to raising farming households’ incomes and made some of them decide that the payments are a good argument to have a farm and conduct agricultural activity. However, this situation leads to preserving Poland’s unfavourable agricultural structure, with small and eco-nomically weak farms. It follows from the interviews conducted that some respondents thought they were entitled to direct payments, thought of them in association with the decrease in prices of agricultural products, especially grain, and regarded them as compensation.
Marta B
łąd

163The sense of entitlement was also evident in the fact that only 47% of the people using EU support (87.9% of the surveyed farming families receive di-rect payments for their farms) said EU assistance was of great importance for their farm. The remaining respondents assessed this assistance as moderate or small. It is puzzling that financial assistance (direct payments) provided wi-thout the need for the beneficiaries to meet any requirements, except for filling in an application form, may be regarded as small.
To conclude, let us look at the structure of the surveyed families’ incomes. The survey showed that non-agricultural activity occupies an important place in this structure, with 48.3% of the surveyed families deriving 50% or more of their total income - both earned and non-earned - from off-farm activity. 22.4% of the surveyed families derived up to 25% of their total income from non-agricultural activity. It is worth adding that the share of EU payments in farming families’ incomes is also significant. 40% of the surveyed families said they derived 20-45% of their total income from these payments.
Pluriactivity – saving the farm or saving the rural lifestyle
In every society, off-farm activity taken up by farmers is regarded as a natural part of agriculture. Pluriactivity among farmers is widespread even in deve-loped economies, like for example the United States. At the end of the 1990s work on the farm was the only source of income for less than 10% of U.S. farmers, despite the fact that the country’s agriculture was considered to be the most modern in the world (Tomczak, 2004). Pluriactivity has been gaining in importance in the European Union. At present, more than one third of EU-27 family farmers carry out another gainful activity.
The author thinks it is worthwhile not only to look at pluriactivity from a static or dynamic perspective but also to consider its development paths and try to answer the question whether taking up other gainful activities by farming families is a temporary or lasting trend. Quoting Barlett’s article [1998], this problem may be placed on three paths. Firstly, pluriactivity as an intermediate way between expanding the farm or quitting farming (to get big or get out). Se-condly, pluriactive farmers as enthusiasts of the rural lifestyle, which enables them to benefit both from the advantages of life in the countryside and the economic benefits of a permanent off-farm job. This often means keeping a non-commercial hobby farm and satisfying one’s need of living in the coun-tryside. This group also includes those who have a farm only because of tax breaks or in order to meet their own consumption needs. The third path is pluriactivity understood as a relatively stable element of the adjustment stra-tegy pursued by farming families – an additional activity taken up in order to increase the family’s income.
The research conducted by the author shows that pluriactivity is a perma-nent phenomenon – even not so much in terms of its scale but in terms of its persistence within farming families. The families which are engaged in
Pluriactivity of farm
ing families – old phenom
enon in new tim
es

164 other gainful activities regard them as a permanent part of their work and income strategy. More than 90% of those surveyed did not treat their non-agricultural work as a temporary activity and were going to continue it. The research also shows that more than half of the respondents took up non-agricultural activity out of necessity – because their farming income was insufficient. The gap is filled through non-agricultural activity, with around half of the surveyed families deriving over 50% of their total income from non-agricultural activity.
But the surveyed families were not going to quit farming. For one fourth of them, the land has a sentimental value and they are unable to get rid of it, even though it does not generate sufficient income for them. Additionally, many people said they worked on the farm not for profit but because this enabled them to meet their consumption needs. Some said EU payments were the rea-son why they would not like to get rid of the land. In this sense, EU payments do not stimulate development but support consumption, and preserve the exi-sting unfavourable agricultural structure.
Given that non-agricultural work is treated as permanent activity and that the-re are many reasons why pluriactive farmers do not want to get rid of the land and quit farming, none of these forms of activity tends to disappear. Therefore, the development path of pluriactivity is coexistence – the presence of both activities at the same time. The conclusion is that pluriactivity is not an inter-mediate way between expanding the farm or quitting farming. It is a way of keeping both forms of activity at the same time – both on farm and off farm. In the surveyed farming families, pluriactivity is a strategy they use to survive and earn a higher income. Pluriactivity is an interesting phenomenon - despite the global trend towards specialisation, there is a permanent trend in agricu-lture to combine various gainful activities. One may risk to say that reliance exclusively on farming is an untypical form of activity. Therefore, pluriactivi-ty turns out to be a universal feature of the agricultural sector, one which para-doxically gains in importance as the economy develops. An excellent example of this trend is the increase in pluriactivity of farmers and farming households in the European Union.
References
Barlett Peggy F. (1998): Rolnicy dwuzawodowi: zachowanie gospodarstwa czy wiejskiego stylu życia?, in: Krzysztof Gorlach (ed.): Socjologia wsi w Ameryce Północnej, Toruń, UMK.
Bessant Kenneth C. (2006): A Farm Household Conception of Pluriactivity in Canadian Agriculture: Motivation, Diversification and Livelihood, in: Canadian Review of Sociology and Anthropology, February 2006, vol. 43 issue 1.
Bukraba-Rylska I. (2008): Socjologia wsi polskiej, PWN, Warszawa.Charakterystyka gospodarstw rolnych w 2007 r. , Główny Urząd Statystyczny,
Warszawa 2008.
Marta B
łąd

165Durand Guy and Huylenbroeck Guido van (2003): Multifunctionality and Ru-ral Development: A General Framework, in: Guido van Huylenbroeck and Guy Durand: Multifunctional Agriculture. A new paradigm for European Ag-riculture and Rural Development. Ashgate Publishing Company, USA.
Knickel Karlheinz, van der Ploeg Jan Douwe and Renting Henk: (2003): Multifunktionalitat der Landwirtschaft und des landlichen Raumes: Welche Funktionen sind eigentlich gemeint und wie sind deren Einkommens – und Beschaftigungspotenziale einzuschatzen?, GEWISOLA – Tagung 2003 an der Universitata Hohenheim, Stuttgart.
Other Gainful Activities: Pluriactivity and Farm Diversification in EU-27, (2008) European Commission, Directorate – General For Agriculture and Rural Development, Brussels.
Pevetz Werner (1994): Nowe drogi wielozawodowości wiejskiej, in: Andrzej Kaleta (ed.): Socjologia wsi w Austrii, Toruń, UMK.
Piekosiński Franciszek (1896): Ludność wieśniacza w Polsce w drugiej połowie XVI wieku, Kraków.
Tomczak Franciszek (2004): Od rolnictwa do agrobiznesu. Transformacja gospodarki rolniczo- żywnościowej w Stanach Zjednoczonych Ameryki Północnej, Warszawa, SGH.
Pluriactivity of farm
ing families – old phenom
enon in new tim
es


167Krzysztof Zmarzłowski1,2, Marcin Żekało1
1 Institute of Agricultural and Food Economics-National Research Institute in Warsaw, Poland
2 Warsaw University of Life Sciences, Warsaw, Poland [email protected], [email protected]
Diversification of economic effects of milk production in selected group of organic and conventional farms in Poland in 2006-2007
Abstract: Apart from the social and environmental elements of development, an economic aspect of organic production proves to be very important. Strong and weak points of organic milk production can be identified on the basis of a detailed analysis of accounting data at farm and product (milk) level. The main objective of the study was to compare the competitiveness of cow’s milk production in orga-nic and conventional farms in the years 2006-2007. The results obtained do not prove significant intensification of milk production in the surveyed organic farms. In comparison with conventional holdings, milk yield per dairy cow was much lower, as well as the selling price for milk. It should be emphasised, however, that milk production in organic farms was a profitable activity, but with a very high share of subsidies in this income.
Keywords: economic results; organic milk production
Introduction
Poland’s accession to the European Union (EU) has had a significant effect on the development of organic agriculture. Due to legal and financial support granted under the common agricultural policy, the number of organic farms has increased dynamically. There are prospects for the development of mar-kets in certified organic products, particularly that the demand still exceeds the supply. The production of organic milk in Europe and in Poland continues to be limited. In 2006 the output of this product accounted for less than 2% of total milk output in Europe (Agra Europe 2007). The reasons for the limited production of organic milk in Poland include considerable dispersion of orga-nic farms, a small number of dairy cows as well as their low milk yield.
168 Methodology
The main objective of the study was to assess the economic and production si-tuation of organic farms. An important aspect was the examination of changes in prices and milk production in terms of quantity and value. Selected econo-mic indicators were also compared in organic and conventional farms.
The study was based on data from two compatible systems: the Polish FADN and the AGROKOSZTY system. The survey sample included organic and conventional family farms and covered the years 2006 and 2007. In 2006, 29 certified organic farms participated at the same time in collecting farm ac-countancy data in the AGROKOSZTY system and the Polish FADN, whereas in 2007 there were only 19 holdings, 63% of which participated in the survey again. Organic farms participating in the survey were located in two agricultu-ral regions: Mazowsze and Podlasie as well as Małopolska and Pogórze.
In order to present the economic situation of organic farms, they were com-pared with conventional holdings. The selection of the survey sample of con-ventional farms was conducted purposefully, on the basis of the following characteristics: the annual average number of animals (it ranged from 1 to 26 in 2006, and from 1 to 17 in 2007), the same economic size class, the same type of farming, location in the same poviat and FADN region. The selected sample included 69 conventional farms in 2006 and 56 in 2007.
In the survey of the activity “dairy cows”, conducted under the AGROKOSZ-TY system, the methodology used for calculating the standard gross margin was consistent with the EU rules (Augustynska, Goraj, Tarka, Pokrzywa, Skarżyńska 2000). It is the first income category, calculated by deducting from the value of production the corresponding specific costs. In the case of dairy cows, the production value was calculated per dairy cow. Annual average trans-action prices were used for determining the production value. Specific costs met three conditions: 1) they could be attributed to a given production activity without doubt, 2) their level was proportional to the scale of production, and 3) they had a direct effect on output (in terms of quantity and value). In the case of dairy cows, specific costs include the following: livestock replace-ment, feedingstuffs not produced on the farm, farm-produced feedingstuffs, rent paid for the use of forage area rented for less than one year, livestock in-surance, medicines and veterinary fees as well as special costs. Moreover, re-cords of unpaid and paid labour input related to the surveyed activity are kept in the AGROKOSZTY system, which allows to determine the corresponding labour input during the accounting year. The income from activity account is based on the Polish FADN information collected from the same farm (inter alia: indirect costs, the annual average number of animals).
Farm accounts were performed in line with the FADN methodology. Total costs, calculated according to the Polish FADN methodology, include the fol-lowing: specific costs, farming overheads, depreciation and the cost of external
Krzysztof Zm
arzłowski, M
arcin Żekało

169factors. These are costs corresponding to current operations of a given farm, related to the output of the accounting year. Furthermore, inputs of marketable products (seeds, seedlings, feed for grazing stock and granivores) produced on the farm and used during current operations – for production purposes – are also taken into account. It should be added that farm taxes and other dues and charges are excluded from total costs, but they are included in calculating the balances of subsidies and taxes on current operations and investments. Moreover, personal income taxes of the holder are not included in FADN profit and loss accounts. Family farm income is calculated by deducting the balance of subsidies and taxes on investments as well as the cost of external factors from the farm net value added. The production value, according to the FADN methodology, is the sum of crop, livestock and other production (IAFE-NRI 2004).
The survey of the activity “dairy cows” performed in organic farms concerned the production costs involved, the share of subsidies on forage land in income from activity and labour intensity. Apart from presenting the results in graphic and tabular form, several analytical methods were applied, mainly pertaining to ratio analysis and dynamics analysis. The first set of methods was used to compare the economic situation of organic and conventional farms. This ana-lysis covered the same group of organic farms surveyed in the Polish FADN and AGROKOSZTY system as well as using FADN data on conventional far-ms. The analysis of dynamics was aimed at determining changes in prices and output of organic milk. In the ratio analysis, the following were taken into consideration: the farm debt ratio as well as profitability and productivity ra-tios. Individual fixed-base indices were used for the analysis of dynamics, first of all individual indices of the average milk production as well as milk price indices. The main ratios included in the ratio analysis were as follows:
1. The equity-to-assets ratio (debt ratio-ETAR) calculated by the formula: equity-to-assets ratio = equity / total assets.
Equity is very important to a farm, if a given farm has none, then basically it has no possibility to raise a loan. As the ratio increases, so does the farm’s cre-ditworthiness as well as its financial independence, which allows the farmer to make independent high-risk economic decisions. The closer this ratio is to 1, the higher the farm’s capital potential.
2. The fixed assets turnover (FAT) is calculated by the formula: fixed assets turnover = production / fixed assets.
This ratio specifies the value of production/sales obtained from each zloty of fixed assets, in other words, their productivity. The higher the ratio, the bigger the share of production/sales in the value of fixed assets.
3. Return on assets (ROA) is calculated by the formula: return on assets = income from family farm / value of total assets.
Diversification of econom
ic effects of milk production in organic and conventional farm
s in Poland in 2006-2007
170 Return on assets specifies the family farm income derived from each zloty of farm assets. An increasing value of this ratio indicates an improvement in farm profitability.
4. The financial performance indicators (PPI and IPI), calculated by the for-mulas: production performance indicator = total costs / production, and in-come performance indicator = total costs / income from family farm.
These indicators measure the relation of costs to the production value and to family farm income (Goraj 2005, Bernstein, Wild 2000, Allred 1997).
In order to examine the dynamics of milk yield and of the selling price for milk in the two years in question, individual fixed-based indices were used. The analysis covered indices of the following: milk yield (quantity of milk / number of cows), the average selling price for milk and the value of milk pro-duction (yield x price). The formula presented below was used for calculating the above-mentioned indices:
;0
0 yyi t= (t= 1, 2, …, n);
where n is the number of periods in question, yt is the factor in question in period t, y0 is the factor in question in the initial period (Wysocki, Lira 2003, Luszniewicz 1996).
Results
In both years (2006–2007), the analysed organic farms kept a similar number of cows, an average of 7 and 6 in 2006 and 2007 respectively. However, a slightly higher milk yield was recorded in 2007 as compared to the previous year. The difference was 36 litres (Tables 1 and 2). The selling price for 1 litre of milk was also higher in 2007, by PLN 0.07 (Table 1). But the production and price results were unsatisfactory for organic farmers. In the group of con-ventional farms selected for comparison the milk yield was slightly better. In 2006 it amounted to 3,421 litres and in 2007 to 3,543 litres per dairy cow. Therefore, it was higher than in organic farms by 2% and 5% respectively. Compared to the average results for family farms in Poland, milk yield per dairy cow was higher in these units than in the surveyed organic farms by as much as 18% and 19% (GUS 2008, IAFE-NRI, AMA, MARD 2008).
The difference in the selling price for milk was also unfavourable for organic farms. In comparison with all family farms in Poland, it was lower by an ave-rage of PLN 0.07 per litre in 2006 and by PLN 0.14 per litre in 2007 (GUS 2008). It turned out, however, that in both years in question the selling price for milk in the selected group of conventional farms was lower than in organic farms by PLN 0.09.
Krzysztof Zm
arzłowski, M
arcin Żekało

171Table 1. Production, costs and income obtained in organic farms (per 1 dairy cow) in 2006-2007
Average in farms with dairy cows Specification
2006 2007
Number of analysed farms 29 19Average annual number of dairy cows [heads] 6.6 5.8Milk yield [litres] 3347 3383Sale price of milk [PLN/litre] 0.86 0.93 Per 1 dairy cow Total gross output [PLN] 3602 3799Total specific costs [PLN] 1014 1444Gross margin from activity without subsidies [PLN] 2588 2355General inputs linked to production a [PLN] 658 780Gross added value from activity [PLN] 1930 1575Depreciation [PLN] 545 610Net added value from activity [PLN] 1385 965Cost of external factors [PLN] 94 84Income from activity without subsidies [PLN] 1291 881Subsidies to forage area b [PLN] 493 729Income from activity [PLN] 1784 1610TOTAL COSTS [PLN] 2311 2918Forage area c [ha] 0.77 0.93Total labour input [hours] 259.3 324.4therein: unpaid labour input d [hours] 258.8 322.2
a General inputs linked to production without cost of external factors.b Subsidies include supplementary payment and so called animal payment with respect to forage area involved per 1 dairy cow.c Area allocated for production of own non-commercial feed.d Own labour input for handling livestock and production of own non-commercial feed.Source: Own compilation based on the AGROKOSZTY data
In 2007, organic farms achieved a ca. 6% higher production value per dairy cow compared to 2006 (Tables 1 and 2). It was primarily due to the selling price for milk, higher by 8%. In the years in question, milk yield per dairy cow did not change significantly as in 2007 it only increased by 1% on 2006.
Table 2. Individual fixed base indices for organic farmsYear
Specification 2006 2007 Indices Percentage growth
Milk yield of dairy cows [litre] 3347.48 3383.18 1.01 1.1%Sale price of milk [PLN/litre] 0.86 0.93 1.08 7.9%Value of produced milk [PLN] 2882.18 3142.97 1.09 9.0%
Source: Own compilation based on the AGROKOSZTY data
Diversification of econom
ic effects of milk production in organic and conventional farm
s in Poland in 2006-2007

172Graph 1. Structure of total direct costs of milk production in organic farms in 2006 and 2007
Herd replacement
31%
Feed from outside a farm
4%Owncommercial
feed49%
Own noncommercial
feed3%
Other13%
2006Herd
replacement20%
Feed from outside a farm
12%
Own commercial feed 51%
Own noncommercial
feed3%
Other14%
2007
Source: Own compilation based on the AGROKOSZTY data Figure 1. Structure of total direct costs of milk production in organic farms in 2006 and 2007Source: Own compilation based on the AGROKOSZTY data
Total costs per dairy cow were 25% higher in 2007 than in the previous year. A particularly rapid growth concerned specific costs, 48% higher in 2007 than in 2006. It was due to the increase in costs of purchased feedingstuffs (resul-ting from a rise in cereal prices in the market); as a consequence, the share of these costs in specific costs went up three times (Figure 1).
An increase in specific costs resulted in a fall in income from activity by PLN 174 in 2007 in comparison with 2006. Subsidies on forage area played an im-portant role in generating this income. They constituted 28% of income from activity in 2006 and as much as 45% in 2007 (Figure 2). It can be concluded that subsidies had a considerable impact on the level of income obtained.
Income from
agricultural activity without subsidies
72%
Subsidies28%
2006
Income from
agricultural activity without subsidies
55%
Subsidies45%
2007
Figure 2. Share of subsidies in the income from activity in organic farms in 2006-2007Source: Own compilation based on the AGROKOSZTY data
Krzysztof Zm
arzłowski, M
arcin Żekało

173Considering labour input (Table 1), it can be observed that farmers from the analysed holdings allocated a total of 259 hours of work per dairy cow in 2006, i.e. 65 hours less than in 2007. Income from activity per hour of family labour amounted to almost PLN 5 in 2007, and was PLN 1.9 lower than in the previous year.
When analysing the selected economic indicators, it is worth noting that, in both 2006 and 2007, the equity-to-assets ratios (ETAR) were very high and ranged from 0.96 for conventional farms to 0.98 for organic farms (Figures 3 and 4). It means that for the majority of the farms in question equity repre-sented the main source of financing assets, therefore, these units used exter-nal sources of funding only occasionally. In both years fixed assets turnover (FAT) was slightly higher for conventional farms. It means that conventional farms were able to generate a higher production value per PLN of fixed assets than organic farms, by PLN 0.02 in 2006 and by PLN 0.08 in 2007. On the other hand, return on assets (ROA) clearly showed that there was a decrease in income from organic farms in relation to the total value of assets. A some-what different situation was observed in conventional farms where the ratio of income to total assets slightly increased. As regards production performance (PPI), it can be noted that in organic farms the value of total costs incurred in 2007 was higher than in 2006. At the same time, the share of total costs in total production decreased in conventional farms. A rather alarming develop-ment was the 60% rise in the ratio of total costs to family farm income (IPI) in organic farms in 2007. In conventional farms, the ratio of costs to income also exceeded 1.
Figure 3. Selected economic indices in organic and conventional farms in 2006.Source: Own compilation based on the Polish FADN data
Diversification of econom
ic effects of milk production in organic and conventional farm
s in Poland in 2006-2007

174
Figure 4. Selected economic indices in organic and conventional farms in 2007Source: Own compilation based on the Polish FADN data
Conclusions
The prime objective of presenting the results obtained in 2006-2007 was to show the production and economic situation of the surveyed organic farms specialised in dairy farming. Since the group in question was small, their per-formance should not be directly translated into average production efficiency of Polish organic farms. However, the results presented undoubtedly indicate general trends in organic farming in Poland. The findings from the analyses conducted allowed to observe the following trends:
1. In the years in question (2006-2007) there was no significant intensi-fication of organic milk production, as can be concluded indirectly on the basis of a similar annual average number of dairy cows kept in the surveyed holdings.
2. Lower production results in organic farms were mainly due to lower milk yield of dairy cows. Only a minor increase in milk yield of orga-nic cows was observed in the years in question. However, it was more important that the selling price for milk went up, resulting in a rise in the value of milk production in 2007.
3. In 2007 total costs increased on the previous year. Consequently, the farms in question obtained lower income from activity.
4. The share of subsidies in income from organic milk production – per dairy cow – increased from 28% in 2006 to 45% in 2007.
5. The selected economic and financial indicators (ETAR, FAT, ROA, PPI, IPI) were at similar levels in organic and conventional farms. Ho-wever, taking into consideration production capacities, conventional farms achieved slightly better results.
Krzysztof Zm
arzłowski, M
arcin Żekało

175In recent years organic farming has been steadily developing in Poland. Ho-wever, despite the improving performance of such units, it is not reflected in the intensification of organic milk production. It is difficult to increase the number of dairy cows in organic farms with the current structure of agricul-tural land. Assuming a rise in the number of organic farms with dairy cows, it would be possible to increase the concentration of organic milk production.
References
Agra Europe, 2007, No 2264, p. M/4.Allred J. K., 1997, Looking at the Return on Assets. Modern Materials
Handling.Augustyńska-Grzymek I., Goraj L., Tarka S., Pokrzywa T., Skarżyńska A.,
2000, Metodyka liczenia nadwyżki bezpośredniej i zasady typologii gospo-darstw rolniczych (Methodology of gross margin calculation and typology of agricultural holdings), FAPA, Warszawa.
Bernstein L. A., Wild J. J., 2000, Analysis of Financial Statements. New York: McGraw-Hill.
GUS, 2008, Skup i ceny produktów rolnych w 2007 r. (Purchase and prices of agricultural products in 2007), Warszawa.
Goraj L., 2007, Analiza porównawcza gospodarstw rolnych pod względem głównych parametrów techniczno-ekonomicznych (Analysis of agricultural holdings regarding main technical and economical parameters). Polska na tle innych krajów UE, ALMAMER University of Economics, Warszawa.
IAFE-NRI, 2004, Wyniki uzyskane przez indywidualne gospodarstwa rolne prowadzące rachunkowość w 2002 roku (The results obtained by individual agricultural holdings conducting accountancy in 2002), Warszawa.
IAFE-NRI, AMA, MARD, 2008, Rynek mleka nr 34, Warszawa.Luszniewicz A., Słaby T., 1996, Statystyka stosowana. PWE, Warszawa.Strzetelski J., Bilik K., Niwińska B., Szyndler J., 2004, Chów bydła mleczne-
go metodami ekologicznymi. KCRE-RCDRRiOW, Radom.Wysocki F., Lira J., 2003, Statystyka opisowa, AR Publishing House in
Poznań, Poznań.
Diversification of econom
ic effects of milk production in organic and conventional farm
s in Poland in 2006-2007


177Jan W.Owsiński1, Marcin Andrzejewski2
1 Systems Research Institute, Polish Academy of Sciences, Newelska 6, 01-447 Warszawa, Poland
[email protected] Warsaw School of Information Technology, Newelska 6, 01-447 Warszawa, Poland [email protected]
Rural municipalities in Poland: development types, paths and perspectives1
Preliminary results – the spatial aspect
Abstract: The report presents the results from the analysis of the population of Polish rural municipalities. The analysis was related to broadly conceived “su-stained development”. An essential aspect was also associated with “compari-son” (yielding “development quality”), necessitating establishment of “types” (“development types” or “paths”), within which comparison would be justified. A number of techniques were used in the study, ranging from correlation analy-sis, through simple linear regression and factor analysis down to cluster analy-sis. Based on the results from application of these techniques, a series of initial hypotheses, concerning the classification of Polish rural municipalities, could be verified. The analyses, referring to a large extent to the spatial aspect of the population of Polish rural municipalities, enabled also visual verification of the hypotheses mentioned. Likewise, the types established refer to a large extent to the spatial position of the municipalities and the structures thereof. Given the characteristics of the types, their validity for policy making in terms of potenti-al future developments and their consequences, could also be established. This refers in a special manner to the processes, leading to excess congestion and disorderly urbanisation, to spatial segregation, as well as marginalisation and socio-economic collapse. Of particular importance is the capacity of assessing, in addition to the spatial aspect, the current and potential dimensions of these phenomena.
Keywords: rural municipalities, types of development, spatial structures, migration, employment, regression models, congestion, spatial segregation, marginalisation
1 The research reported was partly carried out in the framework of the Polish project ANAGMIS, N11400/31/1404, and the 6FP project FARO EU, Polish supporting grant 215/6.PR UE/2007/7. In particu-lar, development of the mapping application used was partly funded by these projects.

178 Introduction
The paper presents the results from the analysis of the population of Polish rural municipalities, this analysis being a continuation of the work, whose output was presented in Owsiński (2009) – see also Owsiński (2008a,b,c), for a broader perspective on the study, including the methodological one. The analysis reported was carried out in the framework of two different projects, and so its purposes were multiple, although in each case related to “sustained development”. An essential aspect has been, as well, associated with “compa-rison” (yielding “development quality”), which necessitated establishment of “types”, within which comparison would be justified. Thus, one would have to deal with “development types”, strictly linked with “development paths”, and therefore also with “perspectives” (hypothetical futures), especially if definite ergodicity can be assumed. The latter would, roughly, mean that evolutions over time are represented in a single point in time by various units, appropri-ately (conform to a “theory”) distributed in space (e.g. at increasing distances from an urban core). A number of techniques were used in the analysis, ran-ging from correlation analysis, through simple linear regression and factor analysis down to cluster analysis.
Polish municipalities (NUTS 5 or LAU 2), altogether more than 2500 units, are purely formally classified into three categories: urban municipalities (309), rural municipalities (close to 1600), and urban-rural municipalities (around 600). At the NUTS 4 (LAU 1) level the municipalities, or communes, form counties, of which there are altogether 385. Most of county seats are located in urban communes, only few in urban-rural ones. The urban-rural communes are formed when the urban unit is small enough to warrant joint administrati-on with the surrounding rural unit. The study reported encompassed not only formally rural, but also urban-rural municipalities, in view of significant over-lapping of their essential characteristics.
Hence, it must be emphasised that we do not address here the “rural areas” in the sense of the substance-based definitions adopted, e.g. by OECD, or by other bodies (or more refined ones, like those developed for purposes of the FARO EU 6FP project, see www.faro-eu.org ), but the formally rural muni-cipalities in the sense of Polish administrative regulations. This is justified by two main reasons: 1. one of the ultimate objectives is to define policies, which would in any case address administrative units rather than any other constructs; 2. all sorts of “objective” definitions of rural, urban etc. areas have to recur to some arbitrary choice (e.g. of the “resolution level”), so that inter-nal consistency and data problems may arise.
The analysis accounted for more than 20 variables, based on the data provided by the Central Statistical Office (GUS) in the form of the Regional Data Bank (BDR), for all the municipalities in Poland, over the period 2003-2007. These data suffer from a number of serious shortcomings, as explained in Owsiński (2009). Still, they are the most reliable source of information on the lowest
Jan W.O
wsiński, M
arcin Andrzejew
ski

179level of administrative breakdown. The shortcomings of these statistics are essentially related to what the policies try to aim at, namely local economic activity, employment outside farming and unemployment. In brief, they are related to the following issues:
• employment statistics do not account for employment on family farms;• farmers running farms beyond 2 ha cannot register as unemployed;• employment (outside of family farming) is registered and shown per
location of the enterprise, and not the residence of the employed per-sons;
• petty businesses, run on a farm (a small repair shop, a service outlet) do not have to register at all, unless they exceed a certain turnover threshold.
If we add to the above all kinds of phenomena, associated with the shadow or black economy, then the potential error margin becomes truly formidable. Yet, as said, these statistics are routinely gathered on the annual basis, and find indirect matching counterparts within a broad spectrum of data gathered simultaneously (e.g. on demographic processes).
The working hypothesis
For purposes of this paper, we shall report from a vein in the study that at-tempted to grasp the diversity of municipal situations that could be telling for the potential future evolution(s), and focus on the spatial aspect. Even though we disposed of data for a series of years (2003-2007), we neither thought they are sufficient for any dynamic model, nor could we afford truly sufficient time series, since there was a serious break in the shape of administrative division of the country in 1999. Hence, we decided to identify static models that would display adequate stability over time, at least in qualitative terms. Thereby, we hoped to establish “types” or “development paths”, in relation to such models of crucial variables, selected as indicators, or symptomatic quantities.
Thus, after the first, preliminary stage of analysis, a very rough leading wor-king hypothesis was formulated concerning the classification of rural munici-palities in Poland, namely those:
1. with high and increasing population densities, located within or at the fringes of large urban agglomerations, usually featuring high levels of economic activity (outside agriculture), as expressed through the numbers of persons employed outside of family farming, number of businesses per 1 000 inhabitants, structure of revenue of the municipal budgets (tax-related revenues) and the budget revenues per capita;
2. with high and increasing population densities, located close to smaller urban centres, or in areas with low urbanisation indices, characterised by a wide variety of variable values, but differing from those characte-ristic for the vast majority of rural areas, this meaning, in particular, that an important part of actually occuring socio-economic processes in these areas goes officially unnoticed (employment, revenues);
Rural m
unicipalities in Poland: development types, paths and perspectives

180 3. endowed with definite positive location rent, first of all associated with tourism and recreation, especially along the seaside, in some of the lake districts, and in some mountain areas; these are mainly distinct through economic variables, similarly as the two previous categories;
4. endowed with a location rent, associated with economic activity – par-ticularly location of an important business or a number of businesses, often dating yet from the socialist period, and frequently, though not exclusively, from the mining and energy sector; at least some of the-se should be well visible through the number of registered employed outside of family farming per 1 000 inhabitants;
5. truly “rural” and “agricultural”, in which farming seems to really play an important economic and social role, as seen through employment and tax revenue data;
6. “rural”, but “marginal” rather than “agricultural” in the sense of ac-tivity levels and budget revenues; this category might be subdivided into (a) the ones, in which agriculture plays a lesser role due to “ob-jective” factors (forest areas, mountains, etc.), and (b) where there is simply serious depopulation and abandonment of agricultural activi-ties, usually situated far from urban centres.
The study aimed at verification of this rough hypothesis, and its validity in terms of numbers of municipalities in particular categories (if any), as well as identification of potential significant sub-categories, and their more detailed characteristics. In accordance with the “ergodic” meta-hypothesis, an impor-tant aspect was constituted by the spatial pattern of distribution of municipa-lities displaying characteristics allowing for classification in the above cate-gories. Thereby, at least preliminary conclusions might have been drawn as to the future fate of these units. The conclusions would include the development perspectives, as implied by (i) dynamics to date within a given (sub-)catego-ry and the neighbouring ones; and (ii) the specific characteristics, especially related to the socio-economic activity levels and the robustness of the local systems, as measured, in particular, through variables pertaining to human capital (e.g. personal income tax per capita, number of employed per business, presence and importance of post-primary education).
Given the limited space of this paper, attention was mostly focused on the spa-tial aspect of the considerations, of essential importance, as indicated above, for the more general leading meta-hypothesis.
Models of net migration
Internal migrations are treated among the most important processes, both indi-cative of the more general phenomena, social and economic, and conditioning definite further developments (e.g. depopulation and ageing of remote rural areas, or increasing congestion in some urban areas). We have indicated in Owsiński (2009) that the polarisation and urban sprawl processes are indeed taking place in Poland, with significant implications for rural areas. Identified
Jan W.O
wsiński, M
arcin Andrzejew
ski
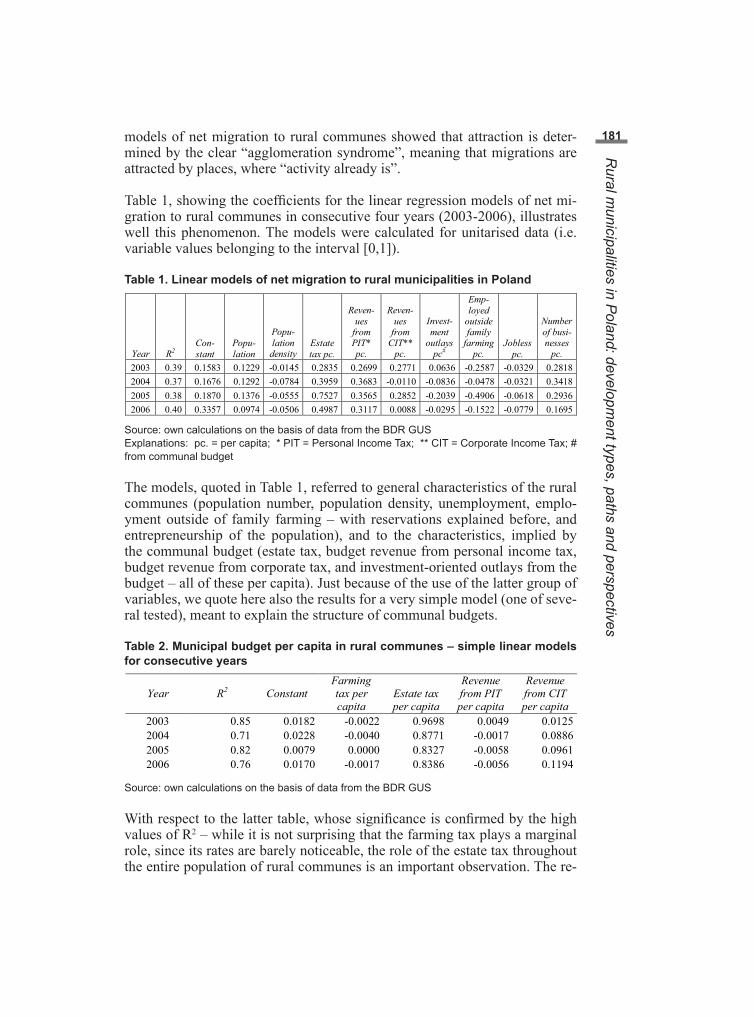
181models of net migration to rural communes showed that attraction is deter-mined by the clear “agglomeration syndrome”, meaning that migrations are attracted by places, where “activity already is”.
Table 1, showing the coefficients for the linear regression models of net mi-gration to rural communes in consecutive four years (2003-2006), illustrates well this phenomenon. The models were calculated for unitarised data (i.e. variable values belonging to the interval [0,1]).
Table 1. Linear models of net migration to rural municipalities in Poland
Year R2 Con-stant
Popu-lation
Popu-lation
density Estate tax pc.
Reven-ues
from PIT* pc.
Reven-ues
from CIT**
pc.
Invest-ment
outlays pc#
Emp-loyed
outside family
farming pc.
Jobless pc.
Number of busi-nesses
pc.
2003 0.39 0.1583 0.1229 -0.0145 0.2835 0.2699 0.2771 0.0636 -0.2587 -0.0329 0.2818 2004 0.37 0.1676 0.1292 -0.0784 0.3959 0.3683 -0.0110 -0.0836 -0.0478 -0.0321 0.3418 2005 0.38 0.1870 0.1376 -0.0555 0.7527 0.3565 0.2852 -0.2039 -0.4906 -0.0618 0.2936 2006 0.40 0.3357 0.0974 -0.0506 0.4987 0.3117 0.0088 -0.0295 -0.1522 -0.0779 0.1695
Source: own calculations on the basis of data from the BDR GUSExplanations: pc. = per capita; * PIT = Personal Income Tax; ** CIT = Corporate Income Tax; # from communal budget
The models, quoted in Table 1, referred to general characteristics of the rural communes (population number, population density, unemployment, emplo-yment outside of family farming – with reservations explained before, and entrepreneurship of the population), and to the characteristics, implied by the communal budget (estate tax, budget revenue from personal income tax, budget revenue from corporate tax, and investment-oriented outlays from the budget – all of these per capita). Just because of the use of the latter group of variables, we quote here also the results for a very simple model (one of seve-ral tested), meant to explain the structure of communal budgets.
Table 2. Municipal budget per capita in rural communes – simple linear models for consecutive years
Year
R2
Constant
Farming tax per capita
Estate tax per capita
Revenue from PIT per capita
Revenue from CIT per capita
2003 0.85 0.0182 -0.0022 0.9698 0.0049 0.0125 2004 0.71 0.0228 -0.0040 0.8771 -0.0017 0.0886 2005 0.82 0.0079 0.0000 0.8327 -0.0058 0.0961 2006 0.76 0.0170 -0.0017 0.8386 -0.0056 0.1194
Source: own calculations on the basis of data from the BDR GUS
With respect to the latter table, whose significance is confirmed by the high values of R2 – while it is not surprising that the farming tax plays a marginal role, since its rates are barely noticeable, the role of the estate tax throughout the entire population of rural communes is an important observation. The re-
Rural m
unicipalities in Poland: development types, paths and perspectives

182 venues from CIT are much more significant in urban communes, and so are those from PIT, but there exist a whole class of rural communes, in which revenue from PIT is also quite important (actually, in quite a share of rural communes this revenue is as important as that from the estate tax). The overall nature of dependence of the net migration flows upon the PIT-based revenue in the recipient communes is well illustrated by Figure 1.
Figure 1. Net migration (vertical axis) vs. PIT-based revenue per capita (horizon-tal axis) for rural communes in Poland in 2006. The bordering straight lines are added for emphasisSource: own calculations on the basis of data from the BDR GUS
Against this background the fact that in Table 1, where migration models are shown, the revenue from PIT ranks second in importance, just after the estate tax, and before the number of businesses, comes out as an important observation. (As a footnote: in these models, population number took over the effect that was shown in the previous paper, Owsiński, 2009, for the population density. Actually, if only population density is accounted for out of the two variables, it turns out to have positive and significant, though not very pronounced coefficients in the model).
Table 3. A migration model for rural communes, 2003R2 Con-
stant Popu-lation density
Reve-nue from PIT pc.
Reve-nue from CIT pc.
Estate tax pc.
Invest-ment outlays pc.
Busi-nesses pc.
Em-ployed outside family farming pc.
Unem-ployed pc.
0.35 0.144 0.070 0.307 0.312 0.229 0.038 0.290 -0.221 -0.030 Source: own calculations on the basis of data from the BDR GUS
Jan W.O
wsiński, M
arcin Andrzejew
ski

183Table 3 largely confirms the previous results, for a different choice of variables. Now, if these models “filter out” a definite class of rural communes, it is interesting to know the respective spatial pattern. It is shown in Figure 2.
colour codes, corresponding to classes, defined by standard deviation from the average
Figure 2. Rural communes in Poland according to categories of net migration values in 2006. Grey colour denotes communes that are not rural (urban and urban-rural)Source: own calculations on the basis of data from the BDR GUS
It can be very easily be seen from Figure 2 that the communes with net migration values bigger by at least one standard deviation than the average (dark blue and blue) cluster, first of all, around and near large urban centres (i.e. actually enter their metropolitan areas or broadly conceived agglomerations). This applies in a particular manner to Warsaw, Poznań, Wrocław, the twin agglomeration of Bydgoszcz and Toruń, Lublin, Olsztyn, the Tri-City of Gdańsk, Gdynia and Sopot, Lodz, as well as smaller centres, like Gorzów and Zielona Góra. The image is perturbed by the low number of rural communes in the vicinity of Cracow and in the Upper Silesian conurbation. Most of
Rural m
unicipalities in Poland: development types, paths and perspectives

184 the remaining communes with high net migration are associated with other centres, of regional or purely local character.
The situation is not as simple with the communes, featuring high outmigration (pink and [one] red in Figure 2). The most pronounced spatial characteristic is their location in north-eastern part of Poland (although here, again, the image is distorted by the fact that vast areas in the West of Poland are dominated by urban-rural communes). In any case, they represent, with just few exceptions, the definitely rural and peripheral areas (including those adjacent to the Polish-Russian border).
As we are primarily interested in the processes or modes of behaviour, which can be the basis for conclusions, concerning future developments and their paths in general, we propose to look at a similar map (Figure 3) of the errors of model from Table 1.
colour codes, corresponding to classes, defined by standard deviation from the average
Figure 3. Rural communes in Poland in 2006 according to the errors in the regression model from Table 1. Colour codes as in Figure 2 denote migrations higher (blue) and lower (pink and red) than expected from the modelSource: own elaboration
Jan W.O
wsiński, M
arcin Andrzejew
ski

185This map shows – as expected – a different image from that of Figure 1. Let us remind that here, red and pink colours denote units where migration is lower than expected from the model, while blue and dark blue – where it is higher than “predicted”. Now, the suburban areas look no longer that uniform and distinct. One can easily see among the suburban (formally rural) communes the ones, in which, despite the existence of the model-determined conditions for high in-migration, it does not actually take place. They neighbour upon the ones in which in-migration continues at a pace beyond that expected from the model (see the surroundings of Warsaw and Poznań). On the other hand, there are plenty of far-off rural municipalities, where in-migration is higher than expected from the model. These include, in particular, but not exclusively, the ones located in areas attractive in terms of tourism and leisure.
Figure 4. Scatterplot of net migration vs. migration model errors (unitarised data) for Polish rural communes in 2006Source: own elaboration
Yet, it must be admitted that while the image of Figure 1 is relatively stable in time, the one of Figure 2 is not: the colours move from year to year among the communes very distinctly. This is not to say that one cannot draw definite conclusions from these maps of model errors. Namely, even though the colours move, the general spatial locations of the respective “coloured” units remain largely similar, or even the same. This applies in a particular manner to (a) suburban communes, (b) communes located in tourism and leisure areas, and (c) some “deeply” rural areas throughout Poland. Three kinds of conclusions can be drawn therefrom, namely:
1. migration at the commune level has to be analysed over a longer time horizon, even if to a detriment for the possibility of assessing some dynamic features;
Rural m
unicipalities in Poland: development types, paths and perspectives

186 2. there are definite areas, where the intensity of both the phenomena, conditioning migration processes, and migration flows themselves, is distinctly higher, even though volatile, than elsewhere; and
3. there are relatively vast areas of rural communes, where the outmigration (and, apparently, also depopulation) either does not take place, or does this at a pace much slower than determined with the model.
Figure 4, showing net migration vs. model error for 2006, i.e. corresponding to Figures 2 and 3, illustrates well the statement of the relative and specific “stability” of model results. Namely, for all years the image of Figure 4 is the same, displaying a two-way bias in the model: the bigger net migration (in-migration), the bigger the error, both ways, meaning that for high outmigration there might be also high negative error. The bias is, though, decidedly on the positive side, emphasising the role of the most important in-migration sinks.
Models of employment outside of family farming
One of the apparently strange phenomena, observed in Tables 1 and 3 was the role played by employment outside of family farming in the local society. It would seem that the communities with ampler job opportunities outside of agriculture (family farming accounts for virtually entire agricultural workforce in Poland) would be more attractive for in-migrants. Yet, this is not the case (and it may even seem to be on the contrary…). While unemployment appears to be a deterrent, employment (by itself) is not an attractor. Yet, employment (outside agriculture) is treated as a cornerstone of assessment of the current and potential development, also for such units as municipalities. That is why the analysis was extended to, in particular, the models and spatial patterns of employment outside of agriculture in rural communes.
Table 4. Models of employment outside of family farming per 1,000 inhabitants in rural communes of Poland, 2003-2006, for unitarised variables (first type).
Year R2 Constant Population Population density
Businesses pc.
Employment per business
2003 0.90 -0.0596 0.0107 0.0142 0.4104 0.9749 2004 0.90 -0.0478 0.0113 0.0064 0.4081 0.9673 2005 0.90 -0.0492 0.0150 0.0065 0.4555 0.9946 2006 0.91 -0.0505 0.0158 0.0084 0.4684 0.9758
Source: own elaboration
It must be added that models of Tables 4 and 5 were calculated without an outlier of just one commune (out of the total of close to 1,600), where the number of persons employed outside of family farming per 1,000 inhabitants has been close to 5,000, due to the manner in which these data are collected and shown, mentioned before.
Jan W.O
wsiński, M
arcin Andrzejew
ski

187Table 5. Models of employment outside of family farming per 1,000 inhabitants in rural communes of Poland, 2003-2006, for unitarised variables (second type)
Year R2 Con-stant
Popu-lation
Popu-lation density
Busi-nesses pc.
Employ -ment per busi-ness
Com-munal budget pc.
Invest-ment outlays pc.
Unem-ployed pc.
2003 0.90 -0.0537 0.0112 0.0085 0.4077 0.9721 0.0119 -0.0104 -0.0170 2004 0.91 -0.0417 0.0120 0.0004 0.3886 0.9522 0.0423 -0.0047 -0.0121 2005 0.90 -0.0441 0.0153 -0.0008 0.4458 0.9890 0.0076 0.0135 -0.0138 2006 0.91 -0.0446 0.0157 0.0023 0.4558 0.9682 0.0285 -0.0076 -0.0184 Source: own elaboration
colour codes depending upon intervals related to the standard deviation from the mean
Figure 5. Employment outside of family farming in rural communes in Poland in 2006, according to the categories defined by standard deviationSource: own elaboration
Rural m
unicipalities in Poland: development types, paths and perspectives

188 In the light of Tables 4 and 5 it turns out obvious what is the real driving force of employment (known, anyway, very well to any local authority officer): it is the location of a true-to-life employer, rather than any disembodied “community enterprise spirit”, and even more so than the “endeavours of the local authorities”. No wonder, therefore, that also the mechanism of attraction of migrations had little to do with the number of employed, but, instead, with the more general “wealth & activity” syndrome. Indeed, a factory in a village is rarely an element of attraction by itself, if it is not accompanied by other desired features.
Figure 6. The numbers of rural communes against employment outside of family farming per 1,000 inhabitants in 2006Source: own elaboration
Figure 5 shows, as in Figure 2, the categories of rural communes in 2006 according to the distribution of values of employment outside of family farming per 1,000 inhabitants, these categories referring to the intervals, defined by standard deviation. Figure 5 appears as striking in that it shows no communes with values of the variable below the mean minus one standard deviation (no red or pink units). The very simple explanation, associated with the distribution of this variable, is shown in Figure 6, and it indicates that, indeed, there is virtually no room available for variable values well below the mean. Yet, in distinction from the bias in the distribution, the models might err on both positive and negative sides – although, given their very high R2, there should be not much error. For the model of Table 4 this is shown in Figure 7, and for the one in Table 5 – in Figure 8.
Indeed, the vast majority of communes fall into the category of error contained between minus standard deviation and plus standard deviation from the mean. When reading Figure 7 one should remember that model error is defined here as difference: true value-model predicted value. Hence, in communes shown in blue, the actual employment is higher than expected from the model, while in those shown in pink and red – it is lower than model-determined.
Jan W.O
wsiński, M
arcin Andrzejew
ski

189
colour codes depending upon intervals related to the standard deviation from the mean
Figure 7. Error categories for rural communes for the model of employment outside of family farming of Table 4 in 2006Source: own elaboration
Given that the value of employment per business registered is the dominating variable in both models here considered, it might be presumed that the pink and red colours in rural areas often mean that the number of (official) businesses there is low, or very low, even if the number of employed is also low. Again, the peri-urban communes are mostly those, where models underestimated the employment, meaning that the agglomeration syndrome is at work there.
The model error maps for the two models and for consecutive years are very highly similar, especially for the same years (in three out of four cases they are identical!), and so we show here, as Figure 7, the map that differs somewhat at least from Figure 8, while, definitely, preserving all of its essential features.
At the end of this presentation of individual spatial images and particular models, to which they refer, let us note that, obviously, most of the rural communes on the maps, are contained within the interval [mean-standard deviation; mean+standard deviation] (white colour). It is usual, for distributions
Rural m
unicipalities in Poland: development types, paths and perspectives

190 mapped, that 10-20% of communes appear as coloured. Yet, if we consider several distributions and maps, “telling” classification encompasses much more important portion of the population.
Thus, in the next section of the paper we shall describe the approach to verification of the initial rough hypothesis and provide an illustration for a map that comes closer to being directly useful in such verification.
colour codes depending upon intervals related to the standard deviation from the mean
Figure 8. Error categories of rural communes for model of employment outside of family farming of Table 5 in 2004Source: own elaboration
Synthetic patterns and images
Let us first emphasise that it was by no means the goal of the study to somehow “classify” the municipalities in the strict sense of the word, i.e. to define classes (corresponding to “types”) and assign each municipality to a class. Rather, the initial hypothesis was conceived as generic, i.e. leading, after verification, refinement, further distinctions etc., to establishment of the municipality classes as dimensions, similarly as it is often done with functional distinctions
Jan W.O
wsiński, M
arcin Andrzejew
ski

191(see, e.g. Bański and Stola, 2002, or Bański, 2003), and development measures (as, e.g., in Bański, 2008). In a somewhat different perspective, one could determine fuzzy assignments to classes, so that a commune could belong to various classes with various degrees of membership. Both these approaches can be facilitated by the direct use of the standard-deviation-based categories, which we referred to in the preceding sections.
The two kinds of formalisation could, then, take the forms shown below, where we assume that xik ϵ [0,1] denotes the value taken by the characteristic k, k = 1, 2, 3,…, for the municipality i, and that the characteristics considered arise from the variables here accounted for (migration, employment, budget,…) and the statistical properties, related to them (e.g. categories, defined with respect to mean and standard deviation).
Thus, in each case we would be dealing with k = 1, 2, …, 6 types of characteristics, as in the initial hypothesis, in the first formalisation treated simply as dimensions:
xi = (xi1,…,xi6), with xik ∈ [0,1], (1)
so that we deal with points xi in a multidimensional unitary cube, the coordinates xik possibly taking just a few discrete values, like in the maps presented. In the second case, of fuzzy representation, an additional limitation would have to be introduced, namely:
xi = (xi1,…,xi6), with xik ∈ [0,1], and Σkxik = 1 ∀i, (2)
the latter condition meaning that a municipality has to be “distributed” among the fuzzy classes so as to form ultimately a whole.
With such a procedure in mind, a number of increasingly “synthetic” maps were produced, aiming at (i) a better representation of the classes or types mentioned in the initial hypothesis, which are by definition not unidimensional, and so have to be reflected through more comprehensive measures, and (ii) more exhaustive enumeration of communes than in the preceding maps, where mainly the extremes were made explicit. An example is shown in Figure 9, resulting from models of migration and employment (Tables 1 and 4).
The categories, appearing in Figure 9, were defined in the following manner: like in Figures 3 and 7, respective model error values were quantified according to the mean and standard deviation, i.e. (μ denotes the mean, and σ denotes the standard deviation):
Value of error: < μ -3σ ∈ [μ -3σ, μ -σ] ∈ [μ -σ, μ +σ] ∈ [μ +σ, μ +3σ] > μ +3σ “Score”: -2 -1 0 +1 +2
Rural m
unicipalities in Poland: development types, paths and perspectives

192
colour codes depending upon intervals related to the standard deviation from the mean
Figure 9. Standard-deviation-based superposed categories for errors of models from Tables 1 and 4. General scale of colours as before (see detailed explanations in the text)Source: own elaboration
and these “scores” were simply added. Thus, the potential scale ranging from -4 = -2 -2 up to +4 = +2 +2, arose. The “statistics” of communes corresponding to particular values on this scale are shown in Table 6.
So, the “neutral” group (0 score), which can be considered to comprise the candidates to class 5 (“true rural communes, with viable, but not outstanding agriculture”) is still predominant (more than 70% of rural communes). Yet, the “lower end” (peripheral, marginal, and problem areas, mainly, but not exclusively, candidates to class 6) becomes quite visible, with 10-15% of units, as well as the “density end”, with close to 20% of units (candidates to classes 1 through 4).
The image of Figure 9 is more comprehensive in terms of both content, as resulting from two models, and composition of categories shown. In particular, it can easily be seen that with respect to both variables considered
Jan W.O
wsiński, M
arcin Andrzejew
ski

193(net migration and employment outside of family farming) the “recreational” municipalities rarely fare “better than expected” (see the coastal areas, the lakelands, as well as mountains). At the same time, the previous observations, concerning peri-urban communes remain valid (including diversification), and there are indeed plenty of rural communes outside of urbanising areas, which tend to fare “better than expected”.
On the basis of a series of similar exercises it is hoped that the complex (fuzzy) classifications of the kind illustrated by formula (2) will be ultimately established, including the dynamic aspect of characteristics, even if with a number of reservations, concerning the source data, the period of study and the simplifications introduced.
Table 6. Numbers of communes, corresponding to the particular values of com-pound real value deviations and model error scale for migration and employ-ment models of Tables 1 and 4, year 2006
Sums of scores
Deviations of dependent variable values from the mean
Model errors
-4 0 0 -3 0 3 -2 1 21 -1 79 210 0 1279 1177 +1 179 148 +2 37 22 +3 12 5 +4 2 3
Some preliminary conclusions
Within the direction of work here considered, some preliminary conclusions, concerning the hypothesis initially forwarded, could be formulated, even though with utmost care. It must be added that, for the sake of limited space of the paper, we do not quote here, e.g. the classifications of communes based on joint consideration of several variables and model results (“synthetic classifications”), like the one directly associated to Figure 9. Actually, even though quite informative, they tend to be much less intuitive and legible than the images and tables here provided.
Table 7 sums up the findings, some of which are clearly visible from the material here shown, and some other are the consequence of additional information, resulting from the study reported. As can be noticed, there are several places where conclusions point out, actually, the directions of future work.
The descriptions under the heading of “Initial hypothesis” in a way complement the one, given in Section 2 of the paper, with additional insights. Then,
Rural m
unicipalities in Poland: development types, paths and perspectives

194 “Observations” contain mainly the observed differences with respect to the initial suppositions, or specific findings, which make the image more concrete.
Table 7. The initial hypothesis and the preliminary findings.
Commune “type” Initial hypothesis Observations 1. metropolitan / suburban
High and increasing density of population and activity; bordering upon large cities
Some metropolitan areas are very highly pronounced, some are much less; their shapes differ; so does, quite distinctly, the situation of particular communes, both in space – with regard to the same urban centre, and in time
2. urbanising High and increasing population; activity level higher than average; location close to local centres or within broader urbanisation zones
Much less pronounced, but visible and relatively extensive areas; some of them developed virtually without urban centres; situation distinctly differs across them
3. tourism & leisure areas
Incomes and jobs not necessarily registered; other symptoms of activity present, including, potentially, immigration
Not all supposedly benefitting areas visible (grey economy without secondary effects); some give mixed signals, both positive and negative (the latter might, again be the artificial effect of grey economy)
4. local resource & factory communes
High levels of employment, not always accompanied by other activity indicator values
Very few visible (single communes); also giving mixed (positive and negative) signals
5. agricultural Relatively low activity indicators, but not excessively low (net migration negative, but within middle limits)
Major part of rural communes, with somewhat differentiated, but not anyhow extreme characteristics; outmigration within middle limits, some immigration; an important share of communes with positive “balance”
6. peripheral / marginal
Very low values of indicators, with high outmigration and extremely low employment
Visible, but not necessarily only in negative sense; mixed signals from many of them
Source: own elaboration
Further investigations should especially be oriented at these groups of units, which are referred to here as transmitting “mixed signals” or featuring, within a given group, high differentiation (like, e.g., in “type” no. 1).
Concerning potential policy design, attention ought to be paid to the “types” of communes (and their internal differentiation), but this does not necessarily mean that the policy instruments must be “tailor-made”. First, the consequences of the application (or lack thereof) of these instruments to different types of communes ought to be analysed.
References
Bański J., (2003) Transforming the functional structure of Poland’s rural are-as. In: J. Bański and J. W. Owsiński, eds., Alternatives for European Rural Areas. ERDN 1, IERiGŻ & IGiPZ PAN, Warsaw, 19-37.
Bański J., (2008) Wiejskie obszary sukcesu gospodarczego (Economically successful rural areas; in Polish). Studia Obszarów Wiejskich XIV, PTG & IGiPZ PAN, Warsaw.
Jan W.O
wsiński, M
arcin Andrzejew
ski

195Bański J. and Stola W., (2002), Przemiany struktury przestrzennej i funkc-jonalnej obszarów wejskich w Polsce (Transformations of the spatial and functional structure of rural areas in Poland; in Polish). Studia Obszarów Wiejskich III, PTG & IGiPZ PAN, Warsaw.
Owsiński J. W. (2008a), On measurement of sustainability and life quality in Polish municipalities. In: O. Hryniewicz, A. Straszak, J. Studziński, eds., Badania operacyjne i systemowe: środowisko naturalne, przestrzeń, op-tymalizacja. Badania Systemowe, 63. Instytut Badań Systemowych PAN, Warszawa, 185-195.
Owsiński J. W. (2008b), How can we read out life quality assessments from the official socio-economic data on Polish municipalities? In: W. Ostasiewi-cz, ed., Quality of Life Improvement Through Social Cohesion. Proc. of the 4th International Conference. Wrocław University of Economics, Depart-ment of Statistics, 2008, 140-155.
Owsiński J. W. (2008c), Ranking and ordering: some practical issues with a bearing on methodological and technical requirements. In: Owsiński J. W., Brüggemann R., eds., Multicriteria Ordering and Ranking: Partial Orders, Ambiguities and Applied Issues. Systems Research Institute, Polish Acade-my of Sciences, Warszawa, ISBN 83-894-7521-9, 253-269.
Owsiński J. W. (2009), Polish Rural Municipalities: Can We Say What Do People Do There On the Basis of the Official Data? In: J. Neuwirth & Klaus Wagner, eds.: Multifunctional Territories: Importance of Rural Areas be-yond Food Production. Rural areas and development, vol. 6, ERDN, Fe-deral Institute of Agricultural Economics (AWI)and Institute of Agricultural and Food Economics – National Research Institute (IERiGŻ – PIB), War-saw 2009, 187-206.
Rural m
unicipalities in Poland: development types, paths and perspectives


197Monika Stanny, Adam Czarnecki1 Institute of Rural and Agricultural Development, Polish Academy of Sciences, Nowy Świat 72, str, 00-330 Warsaw, Poland
[email protected]; [email protected]
Level and determinants of sustainable rural development in the Region of Green Lungs of Poland1
Abstract: The research was composed of two parts. In the first one, an attempt was made to determine spatial variations in the level of sustainable development of rural areas in the region of Green Lungs of Poland by means of taxonomic ana-lysis. The level of sustainable development was presented as a meta-feature made up of three components: environmental, economic and social. The environmental component, which was the most difficult one to operationalise, was defined with the use of the typical pressure-state-response framework. The economic compo-nent was understood as characteristics of the agricultural and non-agricultural sectors, economic activity characteristics, and the level of affluence (budgets) of rural communes. The social component was described by demographic structure, educational characteristics, social activity and living standards. The second part of the research project was designed to identify factors determining the current picture (level) of sustainable rural development within the region of Green Lungs of Poland. The main rationale for conducting the research, in the context of ob-jectives and methods used in its first stage, was to verify the hypotheses proposed, select partial variables, and supplement the analysis with some important content to allow a more valid interpretation of research findings.
Keywords: sustainable development; level of development; rural areas; the Green Lungs of Poland
Introduction
Defining the level of sustainable development is a certain idea which lacks reliable (unambiguous, typical) reference in literature. Sustainable develop-ment still remains not measurable enough. The possibilities of addressing this 1 This research was made within the national scientific project on “Social and Economic Preconditions of the Sustainable Development of the Green Lungs of Poland Rural Areas in the NATURA2000 Network”. The project was financed by the Ministry of Science and Higher Education.

198 idea in a measurable way are quite limited. This is why, in this study, endea-vors have been made to translate ‘the language of theory’ into ‘the language of empiricism’. Such an approach calls for the use of certain simplifications (especially in terms of interpretation). Thus, this analysis is, first and foremost, based on arbitrary decisions of the investigators, which have been supported by professional comments of a group of theoreticians as well as practicians who are unquestionable experts in the subject concerned. The innovativeness of this study manifests itself by:
1. dual methodological approach involving (1) a multi-criteria analysis of sustainable development level components and (2) factor analysis.
2. spatial scope of the analysis, which includes a homogeneous area of the Green Lungs of Poland (341 administrative units), at NUTS5 le-vel, excluding urban areas. The selection of variables which could well describe the issue under investigation for such an area, was quite a difficult task (although not impossible!), mostly due to the fact that data to be included in the study and concerning all units, had to be collected in an identical way, i.e. using the same methodology. Com-parativeness turned to be a problematic issue, even in the case of data obtained from Central Statistical Office of Poland.
Definition of sustainable development
Sustainable development involves the development of three realms ensuring fair living conditions. They include: natural capital, material and financial ca-pital, as well as social and human capital. To pursue this type of development is to ensure a durable improvement of life quality through integrating and de-termining adequate proportions among the three types of capital in question. Sustainable development being defined in this way, the above mentioned fields of development have been assigned three mutually integrating domains, i.e. environmental, economic and the social one. It is necessary to highlight that we did not use the strict definition of the sustainable development. It was rather a theoretical construct that was made only for a purpose of this research.
Region of the research
In the beginning The Green Lungs of Poland were an idea that was born in 1983. It was based on the integration between environmental protection and economic development along with civilization progress in the north-eastern part of the country. The agreement concerning complex environmental protec-tion and sustainable development of regions was signed by regional represen-tatives in 1988. Polish parliament declared a statement in 1994, saying that the Green Lungs of Poland was the region where the sustainability idea should be consistently applied and observed.
The region of the research was an area of the Green Lungs of Poland loca-ted in the north-eastern part of the country (Figure 1), in the entire podlaskie region, in 98% of the communes total number of the warmińsko-mazurskie
Monika S
tanny, Adam
Czarnecki

199region, near 37% located in the north-eastern part of mazowieckie, 24% loca-ted in eastern part of kujawsko-pomorskie and only 4% of pomorskie region communes. The Green Lungs of Poland consists of the relatively ecologically clean and unspoiled areas. Presently, their total size is nearly 61 000 square ki-lometres or over 19% of the whole country area, which is inhabited by almost 10% of population. The Green Lungs of Poland include the largest environ-mental protection areas of the country: 4 National Parks, 13 Landscape Parks and over 260 nature reserves. Around 40% of the Green Lungs of Poland area is under the legal environmental protection of different forms.
Figure 1. Area of the Green Lungs of Poland and the regional division of the countrySource: own study
Spatial diversity of sustainable development level
This analysis presents the issue of spatial diversity in the level of sustainable development . The main goal of the analysis was to define a synthetic index for the evaluation of sustainable development components. Basic issues under analysis have been streamlined to the following questions:
• What is the spatial distribution of synthetic evaluation of sustainable development components?
• Is there a statistical relationship between sustainable development components?
Level and determinants of sustainable rural developm
ent in the Region of G
reen Lungs of Poland

200 The study was conducted in rural areas of the Green Lungs of Poland, i.e. in 341 rural communes (excluding urban areas). This analysis is exhaustive and static. In this research we used data mostly from year 2006, but some of them originated from previous years, even from 2002, for example Census. This situation was due to a limited access to certain data for 2006 for the NTS5 level, for example regarding inhabitants income sources, economic activity and agricultural issues.
Assumptions
Empirical approach to the issue calls for extremely precise translation of the term ‘sustainable development level’ into the language of empirical indexes, by means of which an evaluation of the level shall be made in spatial dimensi-on. Since definitions are not unequivocal it was decided that a term ‘synthetic evaluation index of sustainable development level components’ shall be used as a synonym for the level of sustainable development. It was presented as a meta-characteristic constituting three components: environmental, economic and social (Figure 1). Environmental component, i.e. the most difficult one to be measured, has been defined using Pressure-State-Response model. It was defined by means of variables describing pressure on natural environment, the level of environmental attractiveness, as well as environmental protection. Economic component was understood as characteristics of agricultural and non-agricultural sectors, characteristics of economic activity (i.e. job market attractiveness) and the amount of commune resources (i.e. management of funds by a territorial unit). Social component was defined by demographic structure, characteristics of education system, social viability (involving also local government animation) as well as living conditions (where infrastructure has been taken account of).
Each of the above mentioned aggregates was defined by several empirical in-dicators. The selection of variables was deliberate as it took account of multi-aspect and complex character of sustainable development along with the ac-cess (often quite restricted) to adequate statistics (especially in the case of the first component). Time-consuming and multi-stage selection conducted by a number of experts resulted in the choice of 49 basic variables for the purposes of the main analysis (Table 1). These basic variables were grouped into eleven subcomponents such as Economic activity, Budget of communes, Agriculture, Non-agricultural activities, Demography, Education, Social activity, Living Conditions, Pressure on environment, Natural attractiveness, Environmental protection. These subcomponents in effect, made up three components: eco-nomic, social and environmental (Figure 2).
The result of such an analysis always depends on the type of indicators used and the way of using these indicators. In any case, the selection of indicators is the resultant of data availability and arbitrary decisions of investigators.
Monika S
tanny, Adam
Czarnecki

201Table 1. List of 49 basic variables concerning the sustainable development
Nº Name of Variable
Component: ECONOMYSubcomponent: Economic activity
1.1 Registered unemployment per 100 persons at working age1.2 Persons employed only or mainly in agriculture1.3 Non-agricultural employment ratio (employees in non-agricultural activities vs. employees in agriculture1.4 Employment rate (share of employees in the total population at working age)
Subcomponent: Agriculture2.1 Share of private farms (more than 1 ha) producing mainly for the market2.2 Share of private farms managed by persons with secondary, post secondary and higher agricultural education2.3 Average size of the private farm2.4 Share of private farms with non-agricultural economic activity2.5 Number of supported farms financed from the RDP (Activities II, III and IX) from years 2004-2006 per 100 farms
Subcomponent: Non-agricultural activities3.1 Share of persons employed in services (tertialization of the local economy)3.2 Share of households without any holder of private farm + plots3.3 Register private firms per 1000 persons at working age3.4 Ratio of private firms and public entities from the public services' sector
Subcomponent: Budget o communes (local self-government entities)4.1 Own revenue of local self-government entities per capita4.2 Revenue of the local self-government entities from personal income tax and corporation tax per capita4.3 Funds for additional financing of commune tasks from non-budgetary sources4.4 Share of investment expenditures in the total expenditures of the local self-government entities
Component: SOCIETYSubcomponent: Demography
5.1 Share of population at working age5.2 Demographic dependency ratio5.3 Feminization ratio (females at reproductive age per 1000 males)5.4 Internal migration attractiveness ratio5.5 Natural increase per 1000 inhabitants
Subcomponent: Education6.1 Gross education ratio for people between 18 and 24 years6.2 Share of population with secondary, post-secondary and tertiary level of education6.3 Average score at the final exam of primary school
Subcomponent: Social activity7.1 Attendance in parliamentary elections in 20067.2 Share of communes' councilors with secondary, post-secondary and tertiary level of education7.3 Number of NGOs per 1000 inhabitants7.4 Number of cultural events per 1000 inhabitants7.5 Expenditures for culture and national heritage by local self-government entities per capita7.6 Value of donation from the SAPARD Program Activity III from year 2002 per capita
Subcomponent: Living conditions8.1 Share of new built dwellings (years 1989-2002) in total inhabited dwellings8.2 Expenditures for social welfare by local self-government entities per capita8.3 Share of population maintained from non-earned sources of income in total population8.4 Average usable floor space of dwellings per capita (m2)8.5 Share of dwellings fitted with water-line system in total inhabited dwellings
Level and determinants of sustainable rural developm
ent in the Region of G
reen Lungs of Poland

202 Component: NATURAL ENVIRONMENTSubcomponent: Pressing on environment
9.1 Not segregated municipal waste collected per 100 inhabitants (in tons)9.2 Livestock in terms of large heads per 100 ha of agricultural area9.3 Percentage of population serviced by municipal waste water treatment plants9.4 Percentage of dwellings fitted with central heating system of total inhabited dwellings
Subcomponent: Natural attractiveness10.1 Share of forest lands in total area10.2 Share of meadows and pastures in total agricultural land area10.3 Tourists attractiveness of the terrain's relief10.4 Tourists accommodated per 1000 inhabitants
Subcomponent: Environmental protection11.1 Number of decisions given out for donation (Activity IV of the RDP for Poland)
from years 2004-2006 per 100 farms11.2 Share of protection areas in total area11.3 Investments outlays for environmental protection by the local self-government entities per capita11.4 Expenditures for environmental protection by local self-government entities per capita11.5 Share of the NATURA2000 area in total area
Source: own elaboration
Figure 2. Structure of sustainable development analysis which was applied in the studySource: own studies
Method of analysis
Analysis of components of sustainable development level features a very wide cognitive spectrum, including conditions governing in particular do-mains. For this reason the use of multi-criteria taxonomy is well justified. The proposed procedure of analysis includes conducting a separate taxono-mic analysis and defining particular values of a composite measure for each criterion (subcomponent) separately. Based on this, a general evaluation of the phenomenon under investigation may follow. Figure 3 shows subsequent
Monika S
tanny, Adam
Czarnecki

203phases of generalization of results. Due to limited editorial capacity the aut-hors shall present only the results of statistical analysis which contributed to the definition of spatial diversity of the level of sustainable rural deve-lopment of the region known as the Green Lungs of Poland, i.e. the highest level of generalization.
Figure 3. Measure generalization stagesSource: own studies
For the purpose of assessing the level of development a nonstandard method was applied, i.e. Perkal’s index (Chojnicki, Czyż 1991). This method features simplicity as well as little loss of information during aggregation, and involves a construction of a synthetic index which is a sum of standardized values of partial indicators. In our analysis the index has been constructed on the assumption that all factors (characteristics) are equivalent. Similarly, the same weighs have been used for groups of variables of higher levels of aggregation (components and synthetic indicator) which were taken account of in the calculation. The synthetic Perkal’s index is calculated based on the following formula:
11
=∑=
I
iim
11
'∑=
=m
jijnii zm
ns
where z’ij - standardized value of jth characteristics in ith object, following the exchange of destimulants for stimulants, n - number of objects, mi - weight coefficient of i-numbered characteristic, and:
11
=∑=
I
iim
11
'∑=
=m
jijnii zm
ns
Level and determinants of sustainable rural developm
ent in the Region of G
reen Lungs of Poland

204 Synthetic measure of evaluation of sustainable development components
The analysis of the development level of particular sustainable development domains was the starting point for its synthetic characterization. Sustainable development level, or strictly speaking – synthetic evaluation index of sustainable rural development level of communes referred to as the Green Lungs of Poland was treated as a resultant of three components: environmental characterization, economic characterization and social characterization. Each of these components is an aggregate of characteristics which describe factors influencing rural development. One can thus assume that particular development fields and their characterizations (sets of empirical features) are interrelated, however, they are of independent character in general (Majewski 2008, Zróżnicowanie poziomu … 2007, Wskaźniki zrównoważonego … 2005, Bołtromiuk 2003).
The resulting multi-criteria classification enables general evaluation of the phenomenon subject to analysis. For graphic evaluation of spatial distribution of the synthetic measure for the evaluation of components of sustainable development of rural communes located in the Green Lungs of Poland groups were formed using quintile algorithm, i.e. by dividing a set of communes into five equal classes (á 20% units each, i.e. approx. 68 communes). The groups feature very low (quintile 1), low (2), average (3), high (4) and very high (5) development level.
Figure 4. Classes of measure assessing sustainable development componentsSource: own studies
Monika S
tanny, Adam
Czarnecki

205The use of Perkal’s method (Figure 4) resulted in a strongly diversified picture of spatial distribution of communes with different development levels. This picture refers, at least to a certain degree, to some evaluations concerning regional development analyses (Węcławowicz 2002, Dutkowski 2001). The best developed communes are concentrated mostly within quasi-metropolitan areas around main urban centers of the Green Lungs of Poland: Olsztyn and Białystok. Also, the influence of Elbląg, Suwałki, Toruń and Warszawa becomes noticeable. High indexes were also noted in communes having specific, structured economies, mainly based on tourism. This group comprises communes which feature many tourist attractions, such as: Mikołajki, Ruciane Nida, Giżycko. This group also comprises the so called ‘transformation success’ communes which successfully managed to achieve multi-functional development. These communes are located around a dozen small towns and localities.
The system of the best developed rural areas extends spatially onto the zones demonstrating a high degree of development (communes grouped in quintile 4). Generally speaking, they are usually communes neighboring the best developed communes. Some of them are also located along traditional transportation routes: Warsaw – Olsztyn, Warsaw – Białystok.
On the other hand, relatively worst developed communes (classified in quintile 1) present a considerable contrast to the system of very well developed communes, described above. These least developed units are located in the vast peripheral zones of the Green Lungs of Poland. These include peripheral communes located on the very border of provinces as well as those located near the borderline. Special attention should be paid to complexes of communes featuring poor and very poor development level. They are mostly mono-functional peripheral units (in terms of regional and national peripheries) located in distant areas which are difficult to reach by a public transport, and have been suffering from different problems (Bański, Stola 2004, Stola 1991). The map of the least developed communes overlaps with the map of mono-functional agricultural regions featuring low level of agricultural management, demographic problems (depopulation, migration), social problems (prevalence of elderly persons and women) and low level of investment.
In order to investigate a relationship between the components of sustainable development the chi-square test for independence was used. The chi-square test tests whether variables, according to which statistical population was divided, are independent. This is a chi-square distribution statistics with d-p-1 degrees of freedom. Zero hypothesis, which is verified by us in this case, provides that: N-element random sample originates from such a general population, in which variables feature stochastic independence. Zero hypothesis is rejected if the so called theoretical statistics value chi-square is smaller than chi-square empirical value of statistics established by means of a relevant formula
Level and determinants of sustainable rural developm
ent in the Region of G
reen Lungs of Poland

206 (Kędelski, Roeske-Słomka 1995). Theoretical value of chi-square statistics can be read in the table of critical values distribution for this test.Empirical value of this test for the classification of communes by social component and economic component equaled 93.7 (theoretical value = 26.3). This allowed for rejecting the hypothesis on independence at the level of significance equaling 0.05, which confirms statistically significant relationship between the variables according by which communes were divided. The conclusion, thus, is that (at 95% degree of trust) there is a proof of relationship between the spatial distribution of the synthetic measure of economic component and the analogous social component. This relationship is quite strong, which can be demonstrated by the value of the adjusted contingence index: 0.68.
The hypothesis concerned has also been verified as for the relationship of the environmental component with economic component for the development level, and later, with social component. This time the chi-square test did not confirm the relationship between environmental and economic components, or between environmental and social components. Empirical value of this test in the case of environment-economy relationship equaled 20.1, and the environment-society relationship – 15.9 and did not exceed a critical value at the significance level 0.05, which equals 26.2. Thus, we cannot prove current relationship between the variables analyzed.
Summary
The most important generalizations resulting from the above analysis:• There is no statistical relationship between the level of environmental
development and the levels of economic or social development.• A high level of economic development is statistically strongly related
with the high level of social development.• The highest level of economic and social development is the feature of
rural areas located near urban centers.
However, the relationships presented above should not be treated as universal, especially in terms of their degree of influence; they should be treated as true with respect to the analyzed set of communes.
Determinants of sustainable development of rural areas located in the Green Lungs of Poland
The second stage of the analysis focused entirely on two goals concerning:1. Identification of factors which are key determinants of general level
of sustainable development (sustainable development determinants) – this was the main goal of this analysis.
2. Definition of the character of the selected factors, i.e. giving the names to those factors, which complements the main goal and which was in-separable and crucial procedure of factor analysis – the basic method used in this analysis.
Monika S
tanny, Adam
Czarnecki

207Methodology
Economic, social and environmental development, and most of all – sustaina-ble development called (due to its specificity, i.e. diverse and complex pheno-mena and processes of its description) for the selection of the most effective ways possible to establish their real effect on contemporary rural areas. Fac-tor analysis – one of fundamental methods of multidimensional analysis, was acknowledged as the one which fulfils these conditions to a great degree.
The starting point for factor analysis was an identical set of partial variables selected for the analysis of sustainable development level analyzed at the first stage. A high complexity of the sustainable development, but mainly environ-mental component, revealed itself in the significant number of often poorly correlated variables. This situation made us to look for a proper method of factors’ selection. Principal component method - the one which is most often used for this purpose - proved useless, because its results were difficult to in-terpret. Thus, it was necessary to use an alternative method, which is called as of the most reliable factors - factors having the highest explanatory value. In addition, each of the factors was subjected to rotation, in order to end up with the so called simple factor structure. It means the structure of factor loadings, which is relatively uncomplicated to interpret (Czyż 1971). The number of factors selected for further analysis depended chiefly on the percentage of va-riance brought in by these factors. In other words, these factors could explain the relatively greatest degree of variance. Thus, they could be called decisive determinants.
Results
Varimax rotation served to choose four main factors. They were a subject to further, detailed analysis and interpretation. The total variance explained by the 4 factors was in this case close to 43% (forty three). It proved that the structure of the factor loadings was relatively set in order. Moreover, it was a sign that we dealt with a diversified level of the three components.
Factor 1 (F1) – accounting for over 18% of the differentiation of the whole popula-tion – has been called Income Sources Factor, because it exhibited a strongly posi-tive correlation with employment rate (0.83), people employed only or mainly in agriculture (0.79) and the share of new built dwellings (-0.72), and a strongly nega-tive relationship with the share of population maintained from non-earned sources of income (-0.90), expenditures for social welfare by local self-government entities per capita (-0.67), registered unemployment rate (-0.65), average size of the private farm (-0.65) and non-agricultural households and plots of agricultural land (of the areas smaller than 1 ha) (-0.66).
Thus, Factor 1 has been affected by two opposite groups of demographic and economic phenomena and processes. On the one hand, we have a considerable workforce resources used in agriculture, which – to some extent - make up
Level and determinants of sustainable rural developm
ent in the Region of G
reen Lungs of Poland

208 a hidden unemployment. In fact, it significantly increases the level of employ-ment. In the second group we can find the elements of the share of population maintained from non-earned sources of income, this is: the registered unem-ployment, which defines the amount of social needs, and the expenditures for social welfare by local self-government entities, which indicate the amount of aid. The employment rate, as it was mentioned before, also depends on the average size of farm (that is the workforces’ needs) and the household cha-racter (related to agriculture or not).
The spatial distribution of values for Factor 1 revealed a clear division of the research region into two types of areas from the income sources point of view. The first type we can find in mazowieckie region and mostly in podlaskie region, where employment (mainly in agriculture, in family farms) was the main source of income. In effect, it was reflected in a high level of the total employment. The second type was represented by communes of warmińsko-mazurskie region, with a prevalence of non-earned sources of income this is social welfare in this case and in south-eastern part of podlaskie region, with a high rate of the elderly - maintained from pensions in this case.
The Factor 2 explained as much as 11% of the variance. Moreover, it re-vealed a strong positive correlation with the non-agricultural employment ratio (0.84), share of people employed in services (0.85), income of the lo-cal self-government entities from personal income and corporation tax per capita (0.72), as well as the internal migration attractiveness ratio (0.64) and the share of population with secondary and the higher levels of education (0.60). This is why Factor 2 was called the Entrepreneurship Factor, I mean non-agricultural entrepreneurship. Significant number and concentration of non-agricultural businesses leads to a high level of non-agricultural emplo-yment, for example in high specialized services, which are characteristic for urban economy. An important contribution to this trend is that some part of rural population is employed in industry and services in the towns and cities nearby.
The concentration of diversified economic non-agricultural activities results in a relatively high incomes of the local self-government entities from perso-nal income and corporation tax. This is typical of suburban zones of the larger cities (Białystok and Olsztyn, this is capitals of regions), subregional centres (Elbląg, Łomża, Ostrołęka and Suwałki, I mean capitals of former voivodship, before the administrative reform), as well as communes located within the peri-urban zone of Warsaw and areas with the highest tourist attractiveness (Great Lakes of Masuria, Białowieska and Augustowska Primeval Forrest, Nadbużański Landscape Park and others). In other words, a high intensity of entrepreneurship prevails in areas where the possibilities of using the ad-vantage of the location rent are the greatest - I mean - within the influence of the largest cities, most important communication routes, border crossings or regions famous for tourist attractions.
Monika S
tanny, Adam
Czarnecki

209Table 2. Part of the factorial loadings table for sustainable development (the strongest correlations)Nº Name of variable F1 F2 F3 F4
„IncomeSource Factor”
„Entrepreneurship Factor”
„DemographicPotentialFactor”
„Green Area Factor”
Component: ENVIRONMENT1.1 Share of forests and forest lands -0.06694 0.242629 -0.104389 0.7811131.2 Share of meadows and pastures 0.068524 -0.117837 -0.074311 0.5732022.4 Share of inhabitated dwellings by heating system -0.026805 0.354258 0.629662 -0.3332863.5 Share of area under the NATURA 2000 network -0.071648 0.114698 -0.030892 0.62404
Component: ECONOMY4.1 Register unemployment rate -0.651403 0.017974 0.460965 0.1139044.2 Employed only or mainly in agriculture (at working age) 0.787954 -0.233752 -0.111301 -0.0764294.3 Employed in non-agricultural activities rate -0.167429 0.837973 0.280426 0.0373164.4 Employment ratio (at working age) 0.831373 -0.273462 -0.398759 -0.127825.1 Share of private farms producing mainly for the market 0.254924 -0.645459 0.119009 -0.5370545.3 Average size of private farm -0.653871 -0.297988 0.342849 -0.2743546.1 Share of employed in services -0.180617 0.854266 0.275093 0.101362
6.2Share of households without any holder of private agricultural farm (holding) + plots -0.6598 0.527158 0.433148 -0.063341
7.2Own revenue of communes (personal ioncome tax, corporation tax) per capita 0.057706 0.719648 -0.023505 0.094481
Component: SOCIETY8.1 Share of population at working age -0.292746 0.488886 0.716182 -0.0496038.2 Demographic dependency ratio -0.014611 -0.089915 -0.955514 0.0152768.4 Migration attractiveness ratio 0.185394 0.634522 0.15113 0.1154858.5 Natural increase per 1000 population -0.120294 0.10179 0.890285 -0.019905
9.2Share of population with the high and medium level of education 0.101181 0.602942 0.013223 0.024938
11.1 Share of new built dwellings (years 1989 - 2002) 0.71635 0.349268 0.093816 0.05937511.2 Expenditures of communes for social welfare per capita -0.666414 0.040515 0.246676 0.052468
11.3Population maintained from non-earned sources of income -0.900276 0.066313 -0.265103 0.119844
11.4 Average usable floor space of dwellings per capita (m²) 0.304379 0.18678 -0.722445 0.086474Share of factors in explaining the variance 18.21619 10.82582 9.70853 4.1525
Source: own studies
What is more, intensive suburbanization processes have been taking place in the closest zones of the larger cities for the recent dozen years. One of their symptoms is the immigration of urban population. It has changed demogra-phic structures, including education structure and of course the average wealth level. This is why factorial values of the Factor 2 are so high in this type of areas located in the Green Lungs of Poland.
Factor 3 explained almost 10% of variance and was called as a Demographic Potential Factor. Its structure has been determined mostly by strong relation-ship with the demographic dependency ratio (-0.96), natural increase per 1000 inhabitants (0.89), and the share of population at working age (0.72). There was also a strong correlation with the average usable floor space of dwellings per capita (-0.72), but we should suppose that in this case the high values in podlaskie region were mostly affected by low population density, resulted from the intensive depopulation processes.
We can find relatively high values of Factor 3 in communes located in warmińsko-mazurskie region, this is in the areas commonly regarded as demographically ‘young’. Thus, the demographic dependency level wasn’t there so high. Additionally, majority of inhabitants living in the northern
Level and determinants of sustainable rural developm
ent in the Region of G
reen Lungs of Poland

210 part of the research region had a wider access to the basic infrastructure networks, central heating for example, than in podlaskie and mazowieckie region. On the other hand, communes with low factorial values were con-centrated in podlaskie and eastern part of mazowieckie region. But there, the percentage of ‘old’ population is the highest not only within the Green Lungs of Poland, but also in the country. We firmly believe that the deformation of population age structure was mostly the result of increased migration of the ‘young’ to the urban areas and due to evident decrease in birth rate. We can highlight that the intensive depopulation process is a large-scale problem in the eastern part of Poland.
The Factor 4 explained only 4.2% of the whole variance. It was called the Green Area Factor, due to a strong correlation with the share of forest lands (0.78) and the share of the NATURA 2000 area in total area of communes (0.62). The analysis also revealed relations (but, to a smaller extent) with the share of meadows and pastures (0.57). The highest factorial values in this case were found mostly in areas covered with great, primeval forests (Augustowska, Biała, Białowieska, Knyszyńska and Piska) and with con-centration of grassland and meadows (in the western part of Kurpiowska and Romincka Forest).
Multi-factor analysis that takes into account factorial values for each of the four factors using the Perkal’s index enables us to identify the general level of sustainable development. A significant concentration of communes with a high level of the phenomenon was revealed in suburban zones of larger cities that is Białystok, Olsztyn and Warsaw and the regions touristically attractive. It can be a confirmation of a strong influence of variables of economic and social components. As it was mentioned before, two factors accounted for nearly 30% of the whole variance. The influence of environmental component variables ap-pears more clearly in the last factor selected, which accounts for less than 5%.
Relatively low values appeared mostly in peripheral areas of warmińsko-mazurskie region (in the communes with former state farms), as well as in peripheral areas of podlaskie region (due to the intensive depopulation pro-cess). General characteristic of these areas was determined by the high level of social needs of local population, with numerous inhabitants maintained from non-earned sources of income, low internal migration attractiveness rate and low population growth.
Summary
This study enabled us to identify the key determinants of sustainable rural deve-lopment within the area of the Green Lungs of Poland. The analysis revealed the greatest influence of the factors concerning income sources, entrepreneurship, demographic potential and “green areas”, but with a significant prevalence of social and economic domains. The influence of environmental component was stronger only in the last, fourth factor, which explained less than 5% of vari-
Monika S
tanny, Adam
Czarnecki
211ance. This meant that sustainable rural development of the Green Lungs of Po-land was mostly determined by social and economic phenomena and processes. It was affected directly not only by the relatively uncomplicated structure of economic and social components’ variables, but also by the complex struc-ture of environmental component, resulting chiefly from a relatively poor cor-relation between its basic indicators. In addition, the so-called high complexity of the environmental component was affected by the highest dispersion and asym-metry of values among three components, the situation when the phenomenon or process didn’t exist (magnitude zero) and relatively low number of envi-ronmental variables. Moreover, disparities between environmental and socio-economic issues, concerning the general statistics quality and availability, were probably of a negative influence. At the NUTS5 level we can find much more categories concerning social, demographic and economic phenomena and pro-cesses, than those connected with environmental domain.
Furthermore, we can point out other specific difficulties resulting from the contextual character of natural environment. It’s necessary to underline that the social and economic issues are much more uncomplicated to be evaluated as positive or negative ones, than the issues concerning natural environment. We can point out two types of equivocal indicators. The non-segregated muni-cipal waste collected per 100 inhabitants can be the example of the first type. It can’t be stated definitely that the relatively high value is positive or negative in this case. In reality it depends on what is important for evaluators. The fact that waste was collected could be a positive action, while the fact that it wasn’t segregated - negative. The second type of indicators may for example concern the livestock per 100 ha of agricultural area, and in this situation the evaluati-on depends on the point of view. The high indicator value could be recognized as positive by farmers, but not necessarily by tourists or ecologists, because of the livestock strong pressure on the natural environment.
Finally, there exists a strong necessity to obtain much more detailed statistical data regarding environmental issues. Moreover, it can be difficult to make a research on sustainable development without finding a statistical method, which will enable us to recognize a real character of environmental phenome-na. Furthermore, in the future, quantitative research concerning sustainable development, it should be considered weighting of each variable and, con-sequently, of each component in order to minimize the prevalence of socio-economic domains over environmental ones, which results from the different access to statistical data.
References
Bański J., Stola W., 2004: Przemiany struktury przestrzennej i funkcjonal-nej obszarów wiejskich w Polsce [Changes of the Spatial and Functional Structures In Rural Areas of Poland]. „Studia Obszarów Wiejskich”, t. 3. Komisja Obszarów Wiejskich PTG, Instytut Geografii i Przestrzennego Za-gospodarowania PAN, Warszawa.
Level and determinants of sustainable rural developm
ent in the Region of G
reen Lungs of Poland

212 Bołtromiuk A., 2003: Ekonomiczne aspekty funkcjonowania obszarów chro-nionych [Economic Aspects of the Protected Areas Existence]. Wyd. Uni-wersytetu w Białymstoku, Białystok.
Chojnicki Z., Czyż T., 1991: Zróżnicowanie przestrzenne poziomu i warunków życia ludności [Spatial Differentiation of the Level and Living Conditions]. „Biuletyn KPZK PAN”, nr 153, Warszawa.
Czyż T., 1971: Zastosowanie metody analizy czynnikowej do badań ekonomi-cznej struktury regionalnej Polski [Using the Factor Analysis Method In the Research of the Regional Polish Economic Structure]. Prace Geograficzne Instytutu Geografii PAN, nr 92, Warszawa.
Dutkowski M., 2001: Typologia polskich regionów [Typology of the Po-lish Regions] [w:] Polityka regionalna państwa pośród uwikłań instytuc-jonalnych i regulacyjnych [Regional Policy Among the Institutional and Control Entangles]. Ed. by J. Szomburg. Instytut Badań nad Gospodarką Rynkową, Gdańsk.
Kędelski M., Roeske-Słomka I., 1995: Statystyka [Statistics]. Wydawnictwo Akademii Ekonomicznej w Poznaniu, Poznań.
Majewski E., 2008: Trwały rozwój i trwałe rolnictwo – teoria i praktyka gos-podarstw rolniczych [Sustainable Development and Sustainable Agriculture – Farms’ Theory and Practices]. SGGW, Warszawa 2008.
Norcliffe G. B., 1986: Statystyka dla geografów [Statistics for Geographers]. Wprowadzenie. PWN, Warszawa.
Stola W., 1991: Zróżnicowanie funkcjonalne gmin Polski [Polish Communes’ Functional Differentiation]. „Przegląd Geograficzny”, t. 63, z. 3-4.
Węcławowicz G., 2002: Przestrzeń i społeczeństwo współczesnej Polski [Space and Society of the Contemporary Poland]. PWN, Warszawa.
Wskaźniki zrównoważonego rozwoju [Sustainable Development Indicators]. Ed. by T. Borys. Wyd. Ekonomia i Środowisko, Warszawa-Białystok, 2005.
Zróżnicowanie poziomu rozwoju społeczno-gospodarczego obszarów wie-jskich a zróżnicowanie dynamiki przemian [Differentiation in the Level of Socio-Economic Development of Rural Areas in Poland in Comparison to the Differentiation in Transformation Dynamics]. Ed. by A. Rosner. Instytut Rozwoju Wsi i Rolnictwa PAN, Warszawa, 2007.
Monika S
tanny, Adam
Czarnecki

213Julia Neuwirth, Karl Ortner, Klaus Wagner1 Federal Institute of Agricultural Economics, Marxergasse 2, A-1030 Vienna, Austria [email protected]; [email protected]; [email protected]
Economic effects of the Common Agricultural Policy on employment in Austria
Abstract: The paper estimates the effects of public payments in agriculture on em-ployment in two ways. A partial analysis of FADN-data concentrating on the agri-cultural sector shows a preservation of 45,000 to 57,000 jobs for the year 2004 in agriculture because of public payments but without taking into account effects of and interdependencies to other sectors. As a second step an input-output analysis estimates the employment effects of a hypothetical redistribution of agricultural subsidies to other sectors. The results show a decrease of 45,000 work places in the primary sector and an increase of 12,000 jobs in other sectors. But in all a decrease of 33,000 work places would be the result under the assumption of a constant volume of overall production. Due to the low income level in the pri-mary sector public payments for agriculture seem to be a relatively cheep pos-sibility to reach the highest possible level of employment with the side effects of keeping settlement in peripheral regions and maintaining the landscape.
Keywords: rural development; employment effects; CAP
Introduction
Rural areas are threatened by migration and the abandonment of agricultu-ral land. The Austrian Rural Development Programme 2000-2006 aimed at – among other more detailed targets – the maintenance of sustainable, competi-tive and multifunctional agriculture and forestry within a functioning and vital rural area. The Austrian agricultural policy advocates the view that agriculture in general and family farms in particular contribute substantially to the quality of life, the preservation of the cultural landscape, the permanent settlement of rural areas and to food security.

214 The existence of employment possibilities is indispensable for the mainte-nance of spread-out settlements in remote rural areas. Although farming of-fers these possibilities, the impact of agricultural subsidies on employment have thus far hardly been investigated or estimated in Austria. Obviously, not all the measures within the Austrian Rural Development Programme have as their main objective to create employment. For instance, the Austrian Agri-Environmental Programme (ÖPUL) and the compensatory allowance scheme are the highest endowed measures in Austria, yet their impact on the level and stability of income, and thus on employment, are merely side effects of the actual policy measures. Moreover, support for vocational training, the impro-ved processing and marketing of agricultural and forestry products, as well as other subsidies are likely to contribute to a higher employment rate than would exist in the absence of financial support.
Ultimately, the aim of this paper is to estimate the employment effects of the Austrian agricultural subsidies. Towards this end, we shall use two approaches which firstly focus on the income and employment effects of subsidies in the primary sector and secondly on the macroeconomic employment effects of a redistribution of public monies.
Employment in the Austrian primary sector
In Austria, 3.744m persons were employed in 2004, 5% thereof in agriculture and forestry (see Table 1). 47% of all agriculture and forestry employees were women, with 79% of them employed full time. The percentage of full-time employees among the male labour force in agriculture and forestry stood at 94.2%. In the primary sector, 81% of the labour force was self-employed, i.e. so-called family labour.
Table 1. Number of employees in Austria by economic sectors
Source: Statistics Austria, Arbeitskräfteerhebung 2004 (ISIS database)
A comparison of the population census results for the period 1991 to 2001 shows a decline in the share of employees working in agriculture and forestry, from 6.2% to 4.1%, as well as a reduction in total jobs within the primary sec-tor, by roughly 30% (Statistics Austria 1991, 2001; see Figure 1). A downward trend was also evident in the secondary sector (the number of jobs declined by 17%, while the share of overall employment diminished from 35% to 27.9%). In contrast, the service sector grew (its share of overall employment rose from 58.8% to 68%, while the number of jobs increased by 7% in public services and 36% in private services).
Julia Neuw
irth, Karl Ortner, K
laus Wagner

215
Changes 1991 – 2001 in %0.0 % and more
-10.0 % to less than 0.0%
-20.0% to less than -10.0%
-30.0% to less than -20.0%
less than -30.0%
ViennaChanges 1991 – 2001 in %0.0 % and more
-10.0 % to less than 0.0%
-20.0% to less than -10.0%
-30.0% to less than -20.0%
less than -30.0%
Vienna
Figure 1. Change in workforce numbers in the primary sector, 1991-2001Source: ÖROK Atlas 2004
The last survey of work force in agriculture and forestry was carried out in 2003. In total nearly 440,000 self-employed and family work units worked in agriculture and forestry with different levels of employment, which means about 160,900 annual working units (AWU) (Table 2). In all 84% of the total amount of 191,239 AWUs in agriculture and forestry was family labour.
Table 2. Labour input of family labour in agriculture and forestry in 2003.
Level of employment 100% 75-99% 50-74% 25-49% 1-24% Total Farm manager 66,522 12,419 26,020 30,246 47,883 183,090 Family member 19,040 10,313 24,793 57,970 144,393 256,509 Total 85,562 22,732 50,813 88,216 192,276 439,599 AWU 85,562 19,891 26,931 24,700 3,846 160,930
Source: Statistics Austria, Survey of work force in agriculture and forestry
According to estimates by Statistics Austria and forecasts by the Federal Institute of Agricultural Economics, in 2004 the number of AWU in agriculture and forestry was nearly 190,000; and 84% thereof were self-employed and family work units. However, since 1976 labour input in the primary sector has dropped by 50%.
The Austrian Rural Development Programme
During the 2000-2006 period a total amount of € 15.2 bn public monies have been spent to subsidise the primary sector. This means an annual average of the agricultural budget of € 2.2 bn whereof 56% stem from the EU budget, 21% of national sources and 23% from the Austrian Federal States. The se-cond pillar of the CAP is vitally important for Austrian agriculture and fore-stry, as, for example, 63% of the total national agricultural budget was allo-cated to Rural Development, while only 34% went towards market regulation (Figure 2). In comparison, only 21% of the total EU agricultural budget was allocated to rural development in 2006 (BMLFUW 2008).
Economic effects of the C
omm
on Agricultural Policy on em
ployment in Austria

216
€ 741
€ 1,053
€ 299
€ 73
0%
10%
20%
30%
40%
50%
60%
70%
80%
90%
100%
1
Aver
age
annu
al s
ubsi
dies
in m
€ a
nd in
%
Other measuresRural development (national)Rural development (2nd pillar)Market organisation (1st pillar)
63%
34%
Figure 2. Average annual use of agricultural budget in the period 2000-2006Source: AWI 2009; own calculation
Payments of the Austrian Rural Development Programme (RDP) of the whole period 2000-2006 amount to € 7 bn, the main share (61%) of these payments was spent on the Austrian Agri-Environmental Programme (ÖPUL) and ano-ther 26% on compensatory allowances for less favoured areas. Through such measures as “investment aids,” “improvement of processing and marketing of agricultural products,” “adaptation and development of rural areas,” “setting-up of new farmers” and others, total investments in the amount of € 3.75 bn were induced by the RDP. Overall, some 73,400 jobs have been secured and more than 1,000 new jobs have been created by these measures (Table 3).
Table 3. Selected results of the update for the mid-term evaluation (without ob-jective 1 region “Burgenland”)
Measure Public subsidies in m €
Induced investments in m €
Number of jobs safed
Number of jobs created
Investment aid 293.8 1,832.6 53,777 0Installation of young farmers 86.6 357,5 * 7.276 * 0Vocational training 45.5 85.9 x xCompensatoy allowance for less-favoured areas 1,830.7 x x xAgri-environmental measures (ÖPUL) 4,303.1 x x xProcessing and marketing of agricultural products 90.0 722.9 x xForestry 125.6 226.4 x xAdaption and development of rural areas 233.7 525.8 12,362 1,092Total 7,009.1 3,751.1 73,415 1,092* These values are results of the update of the mid-term evaluation (BMLFUW 2005a)x … no information available
Source: BMLFUW 2005a and 2008; own calculation
Methodology
Since the literature provides no guidance regarding what outcome might be expected for our form of analysis, we have applied two completely different approaches for estimating the employment effects of agricultural subsidies as a means of increasing confidence in the results. The two approaches can be summarised in terms of the following two scenarios.
Julia Neuw
irth, Karl Ortner, K
laus Wagner

217In Scenario 1, we investigate the effect of reduced income for primary sector enterprises as a result of abandoning all direct agricultural and forestry sub-sidies, with all other factors remaining constant. Lower income will render a higher share of primary sector labour below the break-even point, resul-ting in this share no longer being competitive and leaving the sector in the long run. The share is estimated under the assumption that no adjustment in the economy occurs, i.e. that neither farms nor firms in other sectors have the time to reallocate their resources. In this scenario, the resulting subsidy monies not spent on agriculture and forestry are not reapportioned to other sectors or distributed to consumers and taxpayers, whereas they may be used to pay off government debt. The latter would thus reduce interest payments, however we do not take this factor into account for the purposes of the sce-nario. This scenario represents a shock to the primary sector in the form of a cancellation of agricultural subsidies; the reactions by the various sectors of the economy to this shock remain unconsidered.
The corresponding partial analysis is based on the income distribution according to data of the FADN (Farm Accountancy Data Network). Detailed accounting data are available for 2,296 enterprises which employed some 3,500 unpaid labour units; these data are a representative sample of 112,435 enterprises and 152,000 unpaid labour units. Farms in the FADN represent enterprises with a standard gross margin (SGM = revenue minus variable costs) of between € 6,000 and 120,000 with less than 200 ha of land or forest and which are not managed by legal entities. These farms account for 88% of ara-ble land and at least 93% of livestock in the agricultural sector of Austria (BMLFUW 2005).
Scenario 2 takes into account the possibility that subsidies not spent on the primary sector can be spent elsewhere in the economy, resulting in a cor-responding impact there. Alternative ways to redirect these subsidy monies include: dissemination to all private sectors or to sectors other than agricu-lture and forestry, spending by the government to improve public services, leaving the benefit to taxpayers in the form of reduced tax rates, or dispen-sing the monies to consumers and thus increasing disposable income and consumption. We chose the first alternative, assuming that the savings are spent in proportion to the value of production of the various sectors in the overall economy.
Starting with an illustration of the interdependence between the primary sec-tor and its upstream and downstream sectors, we next derive the employment effects in all sectors resulting from a change in demand for agriculture and forestry products. On the basis of an input-output-table of the Austrian eco-nomy, this analysis can be extended to show to what extent a redistribution of funding will be reflected by a redistribution of jobs in the various sectors and, incidentally, a loss of jobs overall.
Economic effects of the C
omm
on Agricultural Policy on em
ployment in Austria

218 Under the strict assumption of a fixed technology coefficient, an input-output-analysis allows for an estimation of the effects on employment in different sectors that result from a change in demand for domestic products. A change in demand is implemented in the model through a redistribution of agricultu-ral subsidies across all sectors in proportion to the production value of each sector. This change in final demand induces accumulative structural changes in the economy to yield new levels of production and employment after an infinite number of adjustment steps have occurred. The resulting changes in employment are a measure of the impact of agricultural subsidies on employ-ment in individual sectors and in the macro economy as a whole.
Input-output tables and the corresponding constant input and employment co-efficients have been developed by Statistik Austria (2004); the data set inclu-des information on production, intermediate consumption, input coefficients of domestic production, final demand for domestically produced goods, cumu-lative input coefficients of domestic production and long-run multipliers.
Results
Results of the partial analysis
In 2004, farm enterprises participating in the FADN received € 15,677 in sub-sidies on average. This sum includes market organisation payments (€ 5,978), agri-environmental payments (€ 6,481) and compensatory allowances (CA). The latter are only paid in disadvantaged areas and amount to € 2,576 on average for all farms in the FADN (BMLFUW 2005b, 223). Farm income in 2004 averaged € 19,381 per enterprise, which translates to € 14,341 per unpaid labour unit.
Because public subsidies are a supplement to the revenues from market sales, they can be spent on inputs for ongoing production processes. Inasmuch as they do so, they are linked with production; however, the incentive to use them in this way has decreased as market organisation payments have been largely decoupled from production since 2005. Nevertheless, in our analysis we assume these payments to fully impact farm viability as a portion of farm revenues.
Direct payments make up in average 81% of the revenues of farms who parti-cipate in the FADN in 2004. If farms lose these subsidies while their costs re-main constant, the number of farms missing their break-even point (i.e. whose revenues fall short of their costs) will go up, as will the number of unpaid AWUs who fall short of the required threshold income. The number of AWUs thus affected can be inferred from the distribution of farm incomes with and without direct payments (Figure 3).
Julia Neuw
irth, Karl Ortner, K
laus Wagner

219 Verteilung der Einkommen je Arbeitskraft 2004
-60,000
-40,000
-20,000
-
20,000
40,000
60,000
80,000
100,000
- 10 20 30 40 50 60 70 80 90 100%
€
Einkünfte aus LFw je nAK
Einkünfte aus LFw je nAK ohneöffentliche Gelder
09,660
14,000
-35 percentage points
-38 percentage points
-30 percentage points
Agricultural and forestry income per unpaid AWU with subsidies
Agricultural and forestry income per unpaid AWU without subsidies
Distribution of income per unpaid AWU in 2004Verteilung der Einkommen je Arbeitskraft 2004
-60,000
-40,000
-20,000
-
20,000
40,000
60,000
80,000
100,000
- 10 20 30 40 50 60 70 80 90 100%
€
Einkünfte aus LFw je nAK
Einkünfte aus LFw je nAK ohneöffentliche Gelder
09,660
14,000
-35 percentage points
-38 percentage points
-30 percentage points
Agricultural and forestry income per unpaid AWU with subsidies
Agricultural and forestry income per unpaid AWU without subsidies
Verteilung der Einkommen je Arbeitskraft 2004
-60,000
-40,000
-20,000
-
20,000
40,000
60,000
80,000
100,000
- 10 20 30 40 50 60 70 80 90 100%
€
Einkünfte aus LFw je nAK
Einkünfte aus LFw je nAK ohneöffentliche Gelder
09,660
14,000
-35 percentage points
-38 percentage points
-30 percentage points
Verteilung der Einkommen je Arbeitskraft 2004
-60,000
-40,000
-20,000
-
20,000
40,000
60,000
80,000
100,000
- 10 20 30 40 50 60 70 80 90 100%
€
Einkünfte aus LFw je nAK
Einkünfte aus LFw je nAK ohneöffentliche Gelder
09,660
14,00014,000
-35 percentage points
-38 percentage points
-30 percentage points
Agricultural and forestry income per unpaid AWU with subsidies
Agricultural and forestry income per unpaid AWU without subsidies
Distribution of income per unpaid AWU in 2004
Figure 3. Distribution of income from agricultural and forestry activities per unpaid AWU with and without direct payments, 2004
The share of unpaid farm workers who earn negative incomes is about 7%, this share increases to 42% in the absence of farm subsidies. Accordingly, 35% or 52,500 of unpaid farm workers depend on direct payments for a positive income. If we take the poverty line with € 9,660 per year as a benchmark for the minimum value of farm labour, public payments support 38% or 57,100 of AWUs to yield a revenue above poverty level.
If we consider a monthly income of € 1,000 (€ 14,000 per year in Austria) to be the required income for securing a job in agriculture, 88% of AWUs would be beneath this level without subsidies. Public monies can reduce this share by 30 percentage points to a share of 58%. In the case of this benchmark, direct payments moved 45,300 unpaid AWUs above the necessary income level, and thus “saved” this number of jobs (Table 4).
The strong impact of direct payments on employment in agriculture and fo-restry in Austria is due to the rather flat distribution of income in the portion of this sector which is covered by FADN. As the data in Table 4 demonstrate, 83% of unpaid AWUs (126,300) earned less than the average income in Aus-tria, and 58% earned less than € 1,000 per month. Without subsidies, these shares would increase to 96% and 88%, respectively.
In summary, it can be stated that farm subsidies boost employment by some 45,000 to 57,000 unpaid AWUs in the short run, a number which amounts to approximately one third of the self-employed labour force in the sector. Since most of these subsidies are uncoupled from production, and even more so sin-ce 2005, they are certainly not responsible for an equal share of agricultural
Economic effects of the C
omm
on Agricultural Policy on em
ployment in Austria

220 production but contribute substantially to environmental objectives and the maintenance of farmland and settlements in disadvantaged rural areas.
Table 4. Number of unpaid AWUs in agriculture and forestry and the effects of subsidies on their minimum income
per month per yearnegative < 0 63,100 10,600 -52,500 42 7 -35< 690 * < 9,660 119,600 62,500 -57,100 79 41 -38< 1,000 < 14,000 133,600 88,300 -45,300 88 58 -30< 1,200 < 16,800 137,600 99,100 -38,500 91 68 -23Average income ** < 24,400 145,700 126,300 -19,400 96 83 -13Total - 152,000 152,000 - 100 100 -
* as a benchmark of poverty in 2005 (Obinger & Tálos 2006, p. 191 et seq.)** according to income tax statistics
Share (in %) of total number of unpaid AWUswithout direct
paymentswith direct payments
Differencewithout directpayments
with direct payments
Number of unpaid AWUs
Difference
Income for agricultural and forestry activities per unpaid AWU in €
A loss of subsidies would kick-start a chain reaction in the sector. Far-mers would have to adapt by lowering expenditures for variable inputs, capital investments and labour. A reduction of labour input would in turn reduce the number of AWUs, who must depend on the enterprises’ profits to meet their living costs. Importantly, these adjustments will additionally cause a reduction of production, and thus a further reduction of reve-nues and income. The following scenario takes account of these long-term adjustments.
Results of the analysis of macro economic effects
The Economic Accounts for Agriculture in 2000 show that 52% of the total production value of agriculture at cost prices (i.e. producer prices + goods subsidies – taxes on goods, as opposed to simply basic prices) was spent for intermediate inputs, while another 25% was used to buy investment goods and support jobs in this sector. Since agriculture produces and supplies inputs to the food industry, it supports even more jobs there. A detailed illustration of the interrelations among the different up- and down-stream branches of the Austrian national economy is provided by the input-output-table at cost prices for 2000 (Statistics Austria 2004). This table is either a “goods by goods” or “sector by sector” matrix and shows the input structures which correspond with the production of a good (or sector).
Employment created by primary sector demand. The highest amounts spent by agriculture and forestry flow to the sectors “production of real assets” (€ 636 m, or 45%), “trade” (€ 362 m, or 26%) and “health care and social secu-rity” (€ 90 m, or 6%). Overall, the “use” of the primary sector amounts to the spending of € 1,419 m. In the short run, this demand for inputs by the primary sector is met by the employment of approximately 12,000 Annual Work Units (AWUs) who produce inputs to agriculture and approx. 1,000 AWUs who sup-ply inputs to forestry. In sum, 13,058 AWUs (0.4% of all AWUs) depend on primary sector demand for intermediate inputs.
Julia Neuw
irth, Karl Ortner, K
laus Wagner

221Employment created by primary sector supply. The major portion (90%) of primary production value flows to the goods sector (€ 2,856 m), 8% to the accommodation and restaurant industry (€ 244 m) and 2% are dedicated to the health care and social system (€ 54 m). The value of primary products sup-plied to downstream industries amounted to € 3,220 m. In total, approximately 30,200 AWUs in the processing and marketing of agricultural and forestry products depend on supplies from the domestic primary sector. 88% of these AWUs directly depend on agricultural supply.
Direct employment effects of the primary sector. Summing up the direct em-ployment effects of primary sector supply and demand on other sectors of the economy yields a total of some 42,600 AWUs (1.31% of all AWUs) who di-rectly depend on agriculture and forestry. In absolute numbers, the goods pro-duction sector, the accommodation and restaurant industry and trade are the most dependent branches. However, in relation to overall production within these sectors, agriculture and forestry are most important to the goods pro-duction sector, the accommodation and restaurant industry and the energy and water supply sector (Table 5).
Table 5. Direct employment effects of supply and demand in the primary sector
AWU Sector number number in % of sector number in % of sector number in % of sector
B Fishery 265 0 0.00 0 0.00 0 0.00 C Mining 7,564 20 0.26 5 0.07 25 0.33 D Production of real assets 641,591 25,277 3.94 3,175 0.49 28,452 4.43 E Energy and water supply 30,555 222 0.73 197 0.64 419 1.37 F Construction industry 284,202 614 0.22 363 0.13 977 0.34 G Trade 549,242 4,025 0.73 52 0.01 4,077 0.74 H Hotel and restaurant industry 215,877 3,938 1.82 182 0.08 4,120 1.91 I Transport and information transmission 242,430 710 0.29 18 0.01 728 0.30 J Credit system and insurance industry 109,543 158 0.14 97 0.09 255 0.23 K Real estate business, services for companies 302,321 414 0.14 0 0.00 414 0.14 L Public administration 232,021 83 0.04 41 0.02 124 0.05 M Educational system 185,781 195 0.10 0 0.00 195 0.10 N Health care and social system 293,757 2,779 0.95 0 0.00 2,779 0.95 O Other public and private services 159,430 74 0.05 10 0.01 84 0.05 P Private households 5,795 0 0.00 0 0.00 0 0.00
Total 3,260,374 38,509 1.18 4,140 0.13 42,649 1.31
AWU induced by agriculture AWU induced by forestry AWU induced by primary sector
Source: Statistics Austria 2004; own calculations
Table 6. Number of AWUs, production value and employment coefficients of different sectors
Agriculture 135,858 4,710 28.85Forestry 18,033 1,740 10.37Fishery 265 18 14.72Total primary sector 154,156 6,468 23.83Total other sectors 3,260,109 356,323 9.15Total 3,414,265 362,791 9.41
No. of AWUs (domestic production)Sector Production value at
basic prices (m €)Direct employment
coefficient
Source: Statistics Austria 2004; own calculations
Employment effects of a redistribution of agricultural subsidies to other sectors. In order to calculate the employment effects of a redistribution of subsidies to other sectors firstly the sectoral employment coefficients have to
Economic effects of the C
omm
on Agricultural Policy on em
ployment in Austria

222 be identified (Table 6). Agriculture stands out for having the highest direct em-ployment coefficient of all sectors: it uses almost 29 AWUs for the production of € 1m. A similarly high employment coefficient applies to “other services”, “retail” and “health” follow with 19 AWUs/€ 1m. Due to low labour producti-vity the employment effect of agriculture is three times higher than the mean of all other sectors.
Table 7. Changes in employment and production caused by the aliquot redistribution of agricultural subsidies for the year 2000
Change of employment New output value Former output value Change of output valuein 1,000 AWUs in bn € in bn € in bn €
Agriculture -44.2 3.2 4.7 -1.5Food industry -2.9 11.4 11.7 -0.3Forestry -0.5 1.7 1.7 0Total of shrinking sectors -47.6 18.9 20.8 -1.9Credit system 1.3 14.1 13.9 0.2Real estate business 0.3 24.6 24.5 0.1Services for companies 1.5 17.3 17.2 0.1Building industry 1.1 29.3 29.2 0.1Public administration 1.1 16.9 16.8 0.1Information transmission 0.5 8.4 8.3 0.1Education 0.8 11.5 11.4 0.1Wholesale trade 0.4 21.8 21.7 0.1Total of all sectors -33.2 362.7 362.8 -0.1
Sectors
Source: Statistics Austria 2004; own calculations
A decrease of agricultural subsidies makes money available for redistribution to other sectors. In the following scenario, the subsidies withheld from agri-culture in the amount of € 1.6 bn are allocated to all sectors in proportion to their value of production. We used the average values for 2004 and 2005 for: area, animal and product premiums (€ 630 m), agri-environmental payments (€ 670 m), compensatory allowances (€ 300 m). This added up to € 1.6 m in agriculture-related subsidies. The forestry related subsidies amounted to € 0.03 m on average (BMLFUW 2005b, 242).
Table 7 shows the long-term effects of this scenario. Here we used the ave-rage values for 2004 and 2005 for: area, animal and product premiums (€ 630 m), agri-environmental payments (€ 670 m), compensatory allowances (€ 300 m). This added up to € 1.6 m in agriculture-related subsidies. The fo-restry related subsidies amounted to € 0.03 m on average (BMLFUW 2005b, 242). The strongest decline occurs in the primary sector, which loses some 45,000 full-time jobs. Another 3,000 jobs, approximately, are lost in the food industry (goods sector). On the other hand, there are sectors in which the number of jobs increases, albeit only marginally. Overall, only a quarter of those who lose their jobs find employment in a different sector. The net effect on employment in the macro economy is negative: The total number of AWUs drops by approximately 33,000, while the value of overall output declines slightly.
Julia Neuw
irth, Karl Ortner, K
laus Wagner

223Conclusions
Our study has evaluated the effects of direct payments to agriculture and fore-stry on employment in Austria. For this purpose we have conducted a partial analysis of the effects on agriculture and forestry on the one hand, and, on the other, an analysis of the national economy, in order to evaluate the overall effects on the employment structure in Austria.
The partial analysis reveals that subsidies save 40,000 to 50,000 AWUs in Austria’s primary sector. The national investigation using input-output analy-sis shows that, if an amount equal to that spent for agricultural subsidies were to be disseminated among all sectors, 45,000 AWUs in the primary sector would be lost. At the same time, the employment rate in other sectors would increase, however a total of 33,000 jobs would still be lost.
We thus conclude that subsidies for agriculture and forestry are a better use of the monies in question, in terms of Austria’s national economy reaching the highest possible level of employment and at the same time achieving other aims such as keeping settlement in peripheral regions and maintaining the landscape also for the advantage of other sectors (e.g. tourism). Certainly, one reason for the relatively high absorption capacity of the primary sector is the low income level as compared to other sectors. Future political endeavours should attempt to find possibilities for shifting agricultural workers to jobs with higher remuneration. However, a reduction in agricultural subsidies cannot be the solution, as the living conditions of many peo-ple already living at or below the poverty level would only worsen further.
References
AWI - Federal Institute of Agricultural Economics (2009): Green Report table 5.1.4. - First and second pillar of the Austrian agricultural budget according to the CAP 2000-2008. In: www.agraroekonomik.at/fileadmin/tabellen/Tab_50104_Auszahlungen_Saeulenmodell.xls.
BMLFUW - Federal Ministry of Agriculture, Forestry, Environment and Water Ma-nagement (2005a): Evaluierungsbericht 2005 (Evaluation Report 2005). Vienna.
BMLFUW - Federal Ministry of Agriculture, Forestry, Environment and Water Management (2005b): Grüner Bericht 2005 (Green Report 2005). Vienna.
BMLFUW - Federal Ministry of Agriculture, Forestry, Environment and Wa-ter Management (2008): Evaluierungsbericht 2008 - Ex-post-Evaluierung des Österreichischen Programms für die Entwicklung des ländlichen Raums (Evaluation Report 2008). Vienna.
Obinger H.; Tálos, E. (2006): Sozialstaat Österreich zwischen Kontinuität und Umbau. Verlag für Sozialwissenschaft. Wiesbaden.
ÖROK - Österreichische Raumordnungskonferenz 2004 (Austrian Confe-rence on Spatial Planning 2004): 2004 - 1 Atlas, Vienna.
Statistics Austria (1991, 2001): Population Cencus 1991, 2001.Statistics Austria (2004): Die Input-Output-Tabelle 2000 (The Input-Output
Table 2000). Verlag Österreich, Vienna.
Economic effects of the C
omm
on Agricultural Policy on em
ployment in Austria


225Ryszard Kata, Dariusz Zając1 University of Rzeszow, Faculty of Economics, ul. M. Ćwiklińskiej 2, 35-601, Poland [email protected]; [email protected]
The impact of farmers’ relationships with the institutions on the income of agricultural holdings in Poland
Abstract: The article presents results of the survey on farmers relations with insti-tutions in Poland. The main purpose of this study is to outline correlation between agricultural holdings income and their relationships with the institutional envi-ronment. Findings showed that accessing the European Union by Poland contrib-uted to the intensification of farmers’ relations with institutional surroundings. A considerable and growing participation of the state aid is being recorded in agricultural holdings’ income, mainly in the form of European Union subsidies. The conducted research showed that the level and intensity of the farmers’ rela-tion with the institutions influence income of agricultural farms.
Keywords: income of agricultural holdings; institutions; farmers
Introduction
Providing Polish farming with the union’s common agricultural policy (CAP) exerted a positive effect on farmers’ incomes in Poland. In 2004 they grew 2.1 times comparing to the average from the years 2001-2003, and in next years had also indicated a slight upturn. It was first of all an effect of the rise in subsidies. Their share in the income of farms rose around a little bit over 9% to almost 39% in 2004, and to 52% in 2006. In the structure of subsidies, the European Union (EU) subsidies constitute the straight majority.
However, the statistical data shows that income benefits from the union sup-port are not allocated evenly, but in the large degree concern agricultural holdings which are of big areas and are strong economically, having also the long-lasting relations with the market (ARiMR 2007). It should be also assumed that the level of farmers’ participation in supporting the income is a consequence of their activity in relations with the institutional surroundings. Using relief programmes requires considerable knowledge; especially finan-

226 cial, legal, technological or ecological. Unaided from the side of institutional surroundings, farmers are not able to manage with all requirements associated with the European Union financing (Kata 2008).
Farmers through the relations with institutions can therefore reap benefits on account of the political pension (through subsidies, subventions or market pro-tectionism), but also benefits from the title of the economic pension, through the efficiency increase of the business activity, as the result of the institutional support in the area of implementing innovation, processes of cooperation and integration in the farming, or within the scope of sale and marketing.
Methodology
The primary goal of the study is to determine the relation between profits of agricultural farms and their relations with institutions. The thesis that income from agricultural holdings is increasingly dependent on the relations of farm-ers with institutions will be verified. These institutions are understood here as formal organizations.
A questionnaire survey conducted in the form of the questionnaire interview with farmers from the region of south-east Poland will be the source of the em-pirical data. The survey was carried out in the first half of 2007 on a randomly chosen sample of 856 farmers - owners of individual farms.
For the purpose of the research, the synthetic coefficient of intensity of the farmers’ relation with institutions (Wi) was introduced. Construction of this parameter is based on a point scale used to evaluate farmers’ relations with in-stitutions. For each institution a farmer had a relation with 1 point was graded, additionally points from 1 to 5 were awarded according to frequency of such relations (1 point - occasional; 5 points - regular). Next, standardization of obtained point values was carried out, i.e. the biggest value of a measuring instrument within the observation under research was given the value of 1, afterwards, the values of the other observations were divided into the biggest value of the measuring instrument (the one with 1) and as result the Wi coef-ficient was possible to be presented in a scale from 0 to 1. Value 0 - meaning lack of any relations with institutions and 1 - maximum, in a researched com-munity, intensity level of relations with institutions.
Results
856 individual agricultural holdings took part in the questionnaire survey, they were selected by means of the quota sampling method so that the research trial reflected the structure of the entire community of farms in the macro-region of the fragmented farming. For the base of the selection an area of agricultural lands was accepted, dividing in this way the sample into three groups, i.e. farms up to the area of 5 ha of agricultural land (AL), farms from 5 to 10 ha and farms above 10 ha. Additionally, at the stage of the selection of individuals
Ryszard Kata, D
ariusz Zając

227for the sample, also a group of agricultural holdings not using direct payments from the EU was distinguished. These are individual agricultural holdings, which “statistically” are being classified as agricultural holdings, but in fact they are “inanimate” in the aspect of conducting agricultural production for the purposes of market. Out of the examined community of agricultural hold-ings, these holdings demonstrate the weakest economic strength (expressed in ESU) and the smallest average area of agricultural land (Table 1).
Table 1. The characteristics of the examined agricultural holdings (the state for end 2006)
The examined agricultural holdings* Z Specification
In total N I II III Number of agricultural holdings 856 136 329 248 143 Average economic size of farms in
ESU (European Size Unit) 8.0 0,8 4.4 9.4 20.8
Average area of agricultural land (ha) 7.9 2,0 3.7 7.7 23.6 *Commentary to the table: N - agricultural holdings not using the EU direct subsidies, Z- agricultural holdings using direct payments from the EU, including the area groups:
I- from 1 up to 5 ha (AL), II – 5 - 10 ha, III – above 10 ha.
Source: questionnaire survey
Agricultural holdings examined in the questionnaire survey are strongly di-versified in terms of the value of market output (Table 2). The value of market output in a farm on the whole and per 1 full-time employee (1 AWU - Annual Work Units), visibly grows at the same time with the increase in economic power and the area of an agricultural holding. It is definitely lowest in the group of agricultural holdings not using the EU direct subsidies (weakest eco-nomically and of smallest area). However, it is the highest in the group of agricultural holdings above 10 ha, i.e. strongest economically and of biggest area (Table 2).
The consequence of differences in the value of market output, proving the production potential of an agricultural holding and its connection with the market, there are differences in income coming from an agricultural holding (Table 2). Its level, calculated per one full-time employed person in a farm, is definitely the lowest in the group of agricultural holdings not using the EU direct payments. In groups of agricultural holdings using subsidies it is much higher, but it significantly increases together with the increase of an agricul-tural holding’s area, achieving the definitely high level in the group of units above 10 ha (of AL). It is also interesting that along with the growth of the agricultural holding’s area the percentage of units which recorded a loss on account of the agricultural activity is reducing. On the other hand, the increase can be noticed when the participation of union subsidies in the structure of agricultural holdings’ income is concerned (Table 2).
The impact of farm
ers’ relationships with the institutions on the incom
e of agricultural holdings in Poland

228 Table 2. The market output and income of agricultural holdings in 2006 (in PLN)Examined agricultural holdings *
Z Specification In total N I II III 1. Value of goods production on the whole (in PLN) - per 1 agricultural holding 49 106.6 3 947.6 23 172.8 54 803.6 141 840.9 - per 1 ha of AL 6 154.9 1 988.1 6 277.5 7 149.4 5 889.4 - per 1 full-time employed
person (AWU) 35 116.6 4 511.6 17 715.5 33 876.6 82 295.0 2. Income from an agricultural holding - per 1 agricultural holding 25 753.0 179.9 11 748.6 29 041.3 76 591.5 - per 1 ha of AL 2 615.1 90.6 3 179.5 3 788.6 3 180.2 - per 1 full-time employed
person (AWU) 19 254.3 202.2 8 878.6 17 907.1 44 437.8 3. Percentage of agricultural
holdings with the loss 20.6 61.8 17.9 10.5 4.9 4. Participation of the EU
subsidies in agricultural holding’s income
44.4
0.0
47.3
50.0
66.5
*Comments as in Table 1Source: questionnaire survey
Presented results suggest that a positive relation appears between the income from an agricultural holding and such features of farms as: value of market output, area of a farm and economic strength expressed in ESU. This issue will be a subject to the statistical verification further. Apart from that, also interest-ing may appear establishing the interrelation between the analyzed economic parameter and the relations of farmers with institutional surroundings.
Results of the questionnaire survey show the empirical distribution of the ex-amined community of agricultural holdings in the aspect of the number and kind of institutions with which farmers were in contact (Table 3), and fre-quency of these relations - from occasional to permanent (having character of the long-lasting cooperation). Majority of farmers (ca. 90%) cultivate their relations with the agricultural consulting and banks. The high percentage of farmers also holds relations with the local government, especially with a self-government of the commune (87.9%), whereas less than 80% with Agency for Restructuring and Modernisation of Agriculture (ARMA). For nearly 60% of farmers relations with the bank have the character of permanent contacts, however permanent contacts from Agricultural Advisory Centre (on differ-ent levels of consulting) declared 51.8% of agricultural holdings’ users (table 3). Relations with the remaining agricultural agencies: Agricultural Market Agency (AMA) and Agricultural Property Agency (APA) holds appropriately 31.3% and 15.2% of farmers, but permanent relations (more often than once per three months) holds a very little percentage of farmers. The similar situa-tion concerns the relation of farmers with employment offices, with farmer’s fair (with wholesale market), with associations or trade organizations, with which every tenth farmer is in contact with, but in the straight majority this contact is occasional (incidental).
Ryszard Kata, D
ariusz Zając

229Table 3. The structure of agricultural holdings according to the frequency of relations with the institutions
Institution Percentage of farmers declaring the relations Institution Percentage of farmers
declaring the relations In total permanent In total permanent Agricultural Advisory Centre
90.5 51.8 District Employment Office
12.6 1.9
Bank 90.0 58.6 Agricultural fair (wholesale market)
10.7 2.3
Self-government of the commune
87.9 31.1 Associations 9.9 4.1
Agency for Restructuring and Modernisation of Agriculture (ARMA)
78.4 17.6 Trade organizations 7.7 1.3
Self-government of the district
55.1 4.0 Research and development centres
6.8 0.6
Agricultural chamber 48.8 1.4 Centres of supporting the entrepreneurship
6.5 0.2
Agricultural Market Agency (AMA)
31.3 2.9 Trade union of farmers 6 0.6
Source: questionnaire survey
Generally, there is a very low level of the participation of farmers in rela-tions with organizations associating farmers and rural inhabitants, as well as with research institutions and special institutions of certification and control of the quality of production, supporting the transfer of new technologies and the HRD (Human Resources Development) in the country. Also, the relations with institutions from the sphere of market are weak, including financial and insurance institutions. Admittedly, the relations with the bank declared 90% of farmers, but only every third of them uses loan products (including 17.3% of the investment credits).
Analysis of the structure of agricultural holdings within the scope of forms of assistance of institutions (Table 4) clearly shows that holdings applying for di-rect payments used first of all the support in gaining the financial means from the EU. Many farmers used also the consulting and trainings which often con-cerned the EU funds. There were no important differences in the mentioned spheres among groups of farms applying for direct payments. However, dif-ferences in favor of bigger agricultural holdings concerned the other forms of assistance of institutions.
Users of agricultural holdings with the area above 10 ha of agricultural land much more often than farmers from the remaining groups used help by ap-plying for EU funds for financing investments, as well as from other external financial supplies and the support in the sale and marketing, also introducing innovations.
Farms not applying for direct payments, having very weak and occasional contact with institutions, practically did not use any of the forms of assistance. Only 14% representatives of this group gaining support in the aspect of con-sulting and trainings, mainly connected with the career advice.
The impact of farm
ers’ relationships with the institutions on the incom
e of agricultural holdings in Poland

230 Table 4. The percentage of agricultural holdings using various forms of assistance from the institutions
% of agricultural holdings according to groups * Z No. The form of the support N
I II III 1. Help in acquiring financial means from
the EU 3.7 75.1 82.7 87.5 2. Consulting, consultancy, trainings 14.0 74.8 80.5 82.1 3. Preparing investment projects,
development plans of farms, etc. 3.7 31.6 48.7 62.8 4. Financial assistance (credit, loan) 2.2 28.9 43.2 65.9 5. Implementing new technologies,
products, services 2.9 21.0 32.4 42.9 6. Help in preparing the loan application 1.5 19.3 23.7 46.4 7. Help in sale and marketing (promotion,
integration supporting and cooperation) 2.2 10.3 18.0 27.4 8. Planning, organization and managing
the agricultural or non-agricultural production 0.7 5.3 15.1 22.1
9. Certificating, control systems and providing the quality 0.0 3.9 8.2 10.1
10. Other (e.g. help in enlarging an agricultural holding) 1.2 2.2 1.9 4.2
*Comments as in Table 1Source: questionnaire survey
For illustrating the interrelation between farmers relations with institutions and income from the agricultural holdings, a synthetic coefficient of intensity of the farmers’ relations with institutions was compiled (Wi). The value of this parameter is located in a range from 0 to 1. The average value of this synthetic coefficient for the whole community (0.41) shows low level of intensity of farmers‘ relations with institutions along with moderate level of diversity of the community under research in this respect (variation coefficient 46.4).
Table 5. The statistics of the coefficient of intensity of the farmers’ relation with institutions (Wi)
Coefficient Wi Specification Arithmetic mean Standard deviation Coefficient of
variation (V) 1. Farmers in total 0.41 0.19 46.4 2. Area groups of agricultural holdings*
N 0.20 0.13 65.7 I 0.40 0.17 41.7 II 0.47 0.16 34.1 III 0.55 0.17 31.7
3. Groups according to economic size (ESU) <2 0.27 0.16 62.2 2-<4 0.42 0.16 38.4 4-<8 0.46 0.15 32.9 8-<16 0.51 0.18 34.3 >16 0.57 0.16 28.6
*Comments as in Table 1Source: questionnaire survey
Ryszard Kata, D
ariusz Zając

231The analysis of the coefficient Wi in the cross-section of the area groups of holdings and the cross-section of their economic strength confirms the earlier observed tendencies that the more increase in agricultural land and economic size of the farm, the more intensive relations of farmers with institutions will be (Table 5). Differences in this respect among groups of farms and the di-versity inside groups measured with the coefficient of variation are distinct but not very great. In this respect, the only group that differs is a group of so called “inanimate” agricultural holdings, which is almost completely located in an aspect of economic size in the group of agricultural holdings to 2 of ESU. These agricultural holdings have 2−3 times lower level of intensity of the relations with institutions than the agricultural holdings from the remain-ing groups (Table 5).
Table 6. The parameters of the linear multiple regression determining dependence of income from an agricultural holding on the series of independent variables (function calculated for farms with direct payments, n = 720)
Independent variables BETA Statistical
error BETA
B Statistical error B t (692) level p
W. Free -22221.4 8365.16 -2.6564 0.0080 X1 The EU payments supporting
development of agricultural farms (in PLN)
0.2993
0.0268
0.4
0.03
11.1433
0.0000
X2 Market output (in PLN) 0.7313 0.0320 7.8 0.34 22.8374 0.0000 X3 Area in the ha (of agricultural
land) 0.5238 0.1839 2840.2 997.30 2.8374 0.0045 X4 ? Costs on 1 ha of agricultural
land (in PLN) -0.4346 0.0321 -8.7 0.64 -13.5221 0.0000 X5 ? Economic size in ESU 0.0755 0.0266 307.9 108.5 2.8374 0.0046 X6 ? Coefficient of the intensity of
relations with institutions Wi
0.0465
0.02345
21647.3
10912.0
1.9838
0.0476 R = 0.8014, R2 = 0.6371, Se = 41854, F (10; 692) = 124.2719 p <0.000000
Source: questionnaire survey
Statistical analysis of variables correlation was used to determine the cor-relation between farm earnings and the intensity of farmers‘ relations with institutions. The coefficient of farmers‘ relations with institutions as operand was accompanied by other operands which can influence the dependent value, i.e. farm earnings. Evaluation of correlation mechanism between the results of farmer’s business activity and independent variables was carried out with the use of multiple linear regression. The regression function was estimated for “live” farms which deal with agricultural production (Table 6).
Procedure of progressing stepwise regression was used in order to determine the form of equation, which meant, consecutively, including in the list of in-dependent variables – as provided in a model - the ones that had the biggest impact on the operand (Krysicki 1998). At the same time, purposefulness of including other variables already present in the equation is examined. The F-test statistic value (Fisher-Snedector test) as compared to critical values of F given a suitable number of degrees of freedom and determined level of signifi-cance - in this paper agreed to α = 0.05, is the criterion of obligatory presence
The impact of farm
ers’ relationships with the institutions on the incom
e of agricultural holdings in Poland

232 of variables in the equation. The above described procedure secures presence of only independent variables in the equation, i.e. the ones whose impact on operand is statistically relevant. The linear regression function of shaping in-come of agricultural holdings we can describe as follows:
ŷi = -22221.4 + 0,4 x1i + 7.8 x2i + 2840.2 x3i – 8.7 x4i + 307.9 x5i + 21647.3 x6i
Matching of outlined function to empirical data equals 64.2%, which is the percentage of farm earnings formed by six variables (included in Table 6) whose impact proved to be statistically significant (test p-values lower than 0.05). Intensity coefficient of farmers‘ relations with institutions is also among the variables which are statistically combined with farm earnings. The param-eter also shows statistical significance in a regression model calculated for agricultural holdings of economic strength of 4 ESU.
Conclusions
1. Accessing the European Union by Poland contributed to the intensifi-cation of farmers’ relations with institutional surroundings. It concerns especially the financial and advisory institutions and government ag-ricultural agencies being an element of the institutional system of the Common Agricultural Policy.
2. The conducted research showed that there is positive, statistically es-sential interdependence between agricultural holdings’ income and the level and intensity of the farmers’ relation with the institutional surroundings.
3. A considerable and growing participation of the state aid is being re-corded in agricultural holdings’ income, mainly in the form of direct subsidies.
4. As a consequence, farmers show the greatest activity in the aspect of seeking and maintaining the relation with these institutions which are favorable to the absorption of EU funds by agricultural holdings.
References
ARiMR, 2007, ARiMR - Trzy lata po akcesji (Agency for Restructuring and Modernization of Agriculture, Three years after accession), Warszawa.
Kata R., 2008, Relacje rolników z otoczeniem instytucjonalnym (Farmers’ realations with institutions), In: Czudec A., Kata R. (ed.), Rola lokalnych instytucji w przekształceniach rolnictwa o rozdrobnionej strukturze gospo-darstw (Function of local institutions in restructuring of dispersed farming), Wyd. Uniwersytetu Rzeszowskiego, Rzeszów.
Krysicki W. (ed.), 1998, Rachunek prawdopodobieństwa i statystyka matem-atyczna w zadaniach (Probability and mathematical statistics: workbook), Wydawnictwo Naukowe PWN, Warszawa.
Ryszard Kata, D
ariusz Zając

233Mudri György1, Ligetvári Ferenc2, Gyöngyössy Kálmán3
1 Hungarian National Rural Network, Budapest, 4555 Levelek, Rákóczi út 9, Hungary [email protected] Szent István University, Institute of Environmental Sciences, 2103 Gödöllő, POB 303, Hungary
[email protected] Institute for Rural Development, Education and Advisory of the Ministry of Agriculture and Rural Development, 2131 Gödöllő, Kerekerdő köz 3, Hungary
The role of networking in the rural economy
Abstract: The rural life will have a new aspect within the European Union. The paper deals with the general term of ‘network’ which can refer to any intercon-nected group or system. It shows the lessons, experiences and the main obsta-cle of the networking activity, implemented is the former programming period, i.e. 2000-2006, and so for the current programming period, i.e. 2007-2013. It introduces the steps and structures to the Hungarian National Rural Network (HNRN), as an example. Officially the Article 68 of the Regulation 1698/2005/EC contains provisions as to the establishment of the National Rural Network, which aims at (a) identifying and analysing the best practises on rural development, providing information about them and organizing exchanges of experiences and know-how, and (b) preparing training programmes for local action groups in the process of formation and giving technical assistance for inter-territorial and trans-national cooperation between LAGs. Networking activity is looked upon as a permanent, improvable tool that can assist in developing the rural quality and economy. The paper introduces an evaluation on the willingness for coo-peration on international field, which analysis was launched June 2009 among the Hungarian Local Action Groups (LAGs) by the HNRN. It shows that the successful adaptation to persistent rural acts will depend on many elements, as a result mainly on good practices and experiences. It is visible, that Hungary is also on the way of learning, and it has to draw the conclusion from time to time, the process of network building is drawn from the rural stakeholders and the wi-der rural economy point of view.
Keywords: National Rural Networks; rural networking;Leader, rural economy

234 Introduction
The network concept has become widely utilised in socioeconomic studies of rural life. Networks may have particular utility in understanding diverse forms of rural development. The paper highlights more features of networks: both vertical and horizontal aspects are occurring. It is argued that rural deve-lopment strategies must take heed of network forms in both domains and that rural policy should be recast in network terms. In general, the term ‘network’ can refer to any interconnected group or system. More specifically, a network is any method of sharing information between systems.
The focus groups are the network of LAGs and the HNRN, which represent a complex mix of the rural stakeholders. Moreover the rural life has got a new aspect inside the European Union. Officially the Article 68 of the Regulation 1698/2005/EC contains provisions to the establishment of the National Rural Network, which aims at (a) identifying and analysing the best practises on rural development, providing information about them and organizing exchanges of experiences and know-how, and (b) preparing training programmes for local action groups in the process of formation and giving technical assistance for inter-territorial and trans-national cooperation between LAGs. The national network can be funded by the technical assistance within the Rural Develop-ment Programmes 2007-2013. However, there is a possibility to fund it from the national budget if a Member State chooses to do so.
Networking activity in Hungary
LEADER, 2004-2006
The networking of the 2000-2006 programming period had been strongly fo-cused on Leader programme and comprised the LAGs in the Member States. The LEADER – as a special network – has been in operation in Hungary since 2004. The preparation process was as follows: national and regional prepa-ration sessions of one or two days were organised for people with an interest in Leader. The selection of LAGs was realised in two steps (2005-2006). 186 applicant LAGs were registered, from which 108 LAGs were successful in the first round and there were 70 selected as successful LAGs at the end of the process (Figure 1). The colours are indicating the territories covered by the LAGs 2004-2006 (MARD Managing Authority, 2006).
In the implementation phase between 2006-2008 local tendering procedures were realised, about 3600 local project ideas submitted to LAGs. The project selection was made by local assessment and monitoring committees, the final decisions were taken by the Managing Authority. The realised projects and payments were finished following the plans until 1 September 2008, but there were some delay in paying out. The programme fulfilled partially its goals; all the participants have gained useful experience and have started a new way of
Mudri G
yörgy, Ligetvári Ferenc, Gyöngyössy Kálm
án
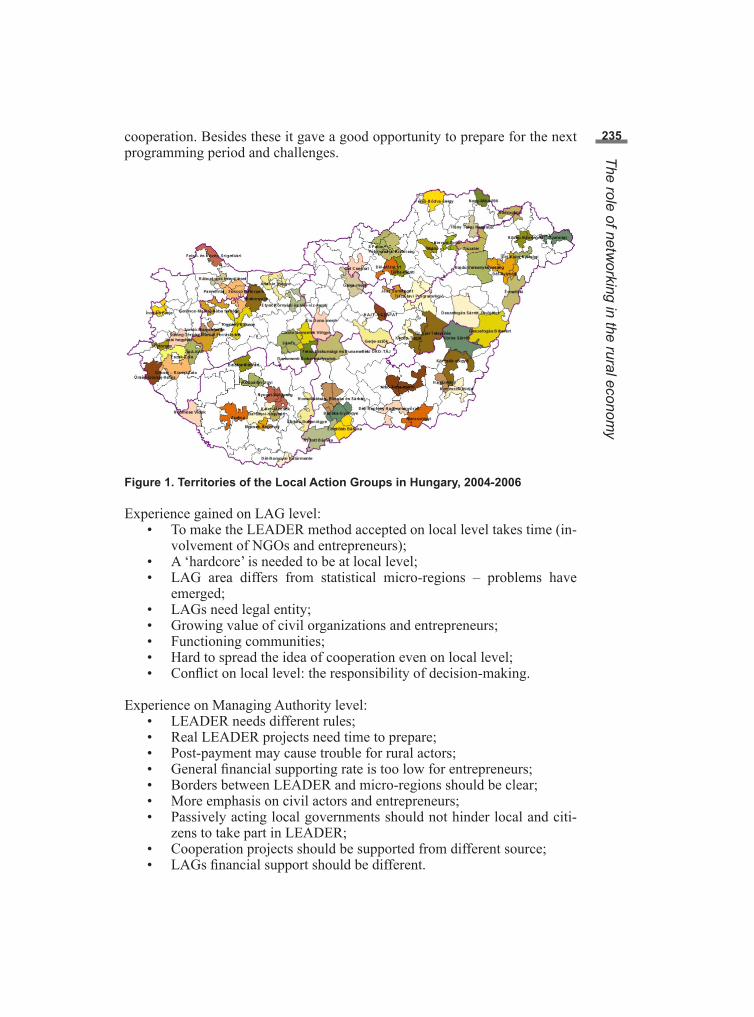
235cooperation. Besides these it gave a good opportunity to prepare for the next programming period and challenges.
Figure 1. Territories of the Local Action Groups in Hungary, 2004-2006
Experience gained on LAG level:• To make the LEADER method accepted on local level takes time (in-
volvement of NGOs and entrepreneurs);• A ‘hardcore’ is needed to be at local level;• LAG area differs from statistical micro-regions – problems have
emerged;• LAGs need legal entity;• Growing value of civil organizations and entrepreneurs; • Functioning communities;• Hard to spread the idea of cooperation even on local level;• Conflict on local level: the responsibility of decision-making.
Experience on Managing Authority level:• LEADER needs different rules;• Real LEADER projects need time to prepare;• Post-payment may cause trouble for rural actors; • General financial supporting rate is too low for entrepreneurs;• Borders between LEADER and micro-regions should be clear;• More emphasis on civil actors and entrepreneurs;• Passively acting local governments should not hinder local and citi-
zens to take part in LEADER;• Cooperation projects should be supported from different source;• LAGs financial support should be different.
The role of networking in the rural econom
y

236 LEADER, 2007-2013
For the current programming period, i.e. 2007-2013, the networking activity, mixed both the top-down and the bottom-up approach, and the Leader ele-ments are extended and comprises all the organisations, public bodies, private companies, etc., which have a word to say in the rural development process. A Leader registration process has started in September 2007, creating 96 Lo-cal Action Groups, which created their Local Action Plans. All the Hungarian rural territory is covered now by the Leader program, the colours are indica-ting the territories covered by the LAGs 2007- 2013 (Figure 2, MARD Mana-ging Authority, 2008).
Figure 2. Territories of the Local Action Groups in Hungary, 2007-2013
Other types of bottom-up rural networks over LEADER
There have been more initiatives in Hungary by the tendencies of the wide range rural policy. NGOs, research institutions and different organisations have started cooperation for better understanding (Parliament of the Rural Areas (Vidék parlamentje), Dialogue for the countryside (Párbeszéd a vidé-kért), Rural College (Népfőiskola), OECD-LEAD programme, etc.). These experiences are strengthening the transformation of the way of thinking not only the rural society but the authorities as well. There are also initiatives on European level (e.g. European Rural Development Network, CEJA), targeting specific needs of the stakeholders.
Mudri G
yörgy, Ligetvári Ferenc, Gyöngyössy Kálm
án

237The structure of the Hungarian National Rural Network
In line with the provisions, the Hungarian National Rural Network (HNRN) has started its work. The HNRN as a new approach is to be an open forum for all the actors involved in rural development by setting up an information and co-operation network. The HNRN is an umbrella network of already existing private and public networks, agricultural and rural development advisory net-works and the network of independent civil actors and organisations dealing with rural development or related issues. In the course of setting up the net-work, strong emphasis was put on building a network of the LEADER Local Action Groups (LAGs) and network of the Local Rural Development Offices (LRDO) (Figure 3).
Figure 3. The structure of the Hungarian National Rural Network, 2008
A number of already existing networks – connected to the various ministries and institutions, dealing with rural actors – are available in Hungary, but some kind of synergy building is needed: Village Guardian Network, Village Agro-nomist Network, Chamber of Agriculture, Agricultural Advisory System, Coordination Network of the Micro- regions, Multi- task Force Association for the Micro- Regions, Roma Integration Council, National Regional Deve-lopment Council, Council for Elderly Issues, National Maintainable Deve-lopment Council, National Sport Council, National Environmental Protection Council, National Scientific and Student Council, National Vocational and Adult Educational Council, Life-career Orientation Council.
The network’s qualitative target is simple to give useful and maintainable ser-vices and to reach as many rural stakeholders as possible through network registration; no quantitative targets are currently available. Trans-National Cooperation activities will involve database development, organisation of seminars and the preparation of guidelines. The Network is organising pro-
The role of networking in the rural econom
y

238 grammes of thematic events and will provide relevant thematic information. Suggestions for thematic events arise from Council members, the Presidency, cooperative partners and registered users of the Network. The Permanent Se-cretariat collects needs and presents these for approval to the Secretary-Gene-ral and to the Managing Authority. The primary goal of the Network is to sup-port the implementation of the New Hungary Rural Development Programme (NHRDP) with a particular focus on the social integration and reconciliation, respectively economic development of rural areas. Such a system should en-hance the rural knowledge base and facilitate the development of social capital through developing connections between rural stakeholders.
The organising function of HNRN is performed by the Managing Authority. The Managing Authority is responsible for the elaboration of the founding document, legal basis of the HNRN. The main managing, coordinative body is the Permanent Secretariat of the HNRN (Governing Unit) operates within the Ministry of Agriculture and Ru-ral Development. Network services will be provided by the Permanent Secre-tary, the Institute of Rural Development, Education and Advisory (a constitu-ent Institute of the HNRN) and by contracted external service provider(s). The Permanent Secretariat of the HNRN is led by the Secretary General.
The Council of 173 participants is representing the membership of the Net-work and the governmental bodies, headed by the President. The members of the Council are; the President, the Secretary-General, representatives from the 96 LAGs, the Agricultural and Rural Development Reconciliation Committee, NHRDP Monitoring Committee, Representatives of six ministries related to Rural Development, Paying Agency, other supporting institutions and existing networks. The activity of the Council is managed by the Governing Unit; the Councils main task is to articulate opinions about national and EU level Rural Development policies and trends. The Presidency of the Council runs the dai-ly work of the Council cases and mediates the interest of them. The Presidency forms opinion and takes a position on professional issues.
The Local Rural Development Offices (LRDO) are established in every mi-cro-region of Hungary across 173 local offices. The task of the offices was the animation of rural communities during Local Action Group establishment, and then the creation of LAG’s Local Rural Development Strategies. Local Rural Development Offices and the LAG activities are coordinated by a group of regional coordinators with one coordinator for each of seven regions.
Registration for HNRN membership is open to anyone, involved or in-terested in agriculture and rural development, including local government, micro-regional associations, medium-, small and micro-businesses, regi-stered societies, social and interest groups, higher education institutes, pro-fessional and commercial chambers and legally registered religious groups. There is no membership fee and no obligations arise from registration. It
Mudri G
yörgy, Ligetvári Ferenc, Gyöngyössy Kálm
án
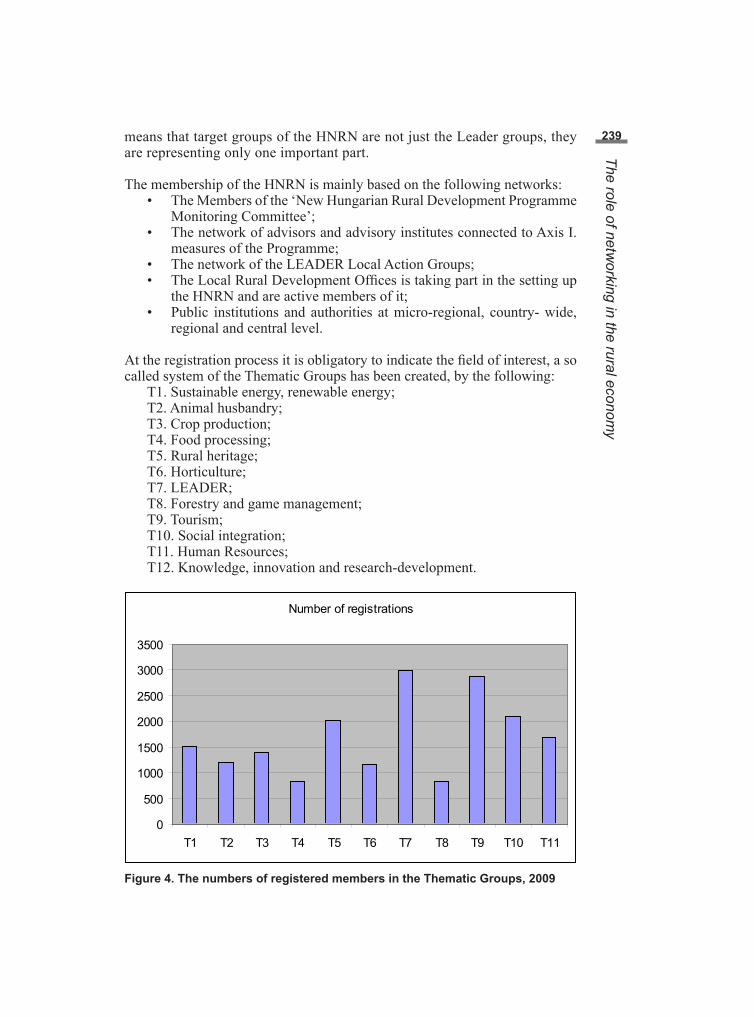
239means that target groups of the HNRN are not just the Leader groups, they are representing only one important part.
The membership of the HNRN is mainly based on the following networks:• The Members of the ‘New Hungarian Rural Development Programme
Monitoring Committee’;• The network of advisors and advisory institutes connected to Axis I.
measures of the Programme;• The network of the LEADER Local Action Groups;• The Local Rural Development Offices is taking part in the setting up
the HNRN and are active members of it;• Public institutions and authorities at micro-regional, country- wide,
regional and central level.
At the registration process it is obligatory to indicate the field of interest, a so called system of the Thematic Groups has been created, by the following:
T1. Sustainable energy, renewable energy;T2. Animal husbandry;T3. Crop production;T4. Food processing;T5. Rural heritage;T6. Horticulture;T7. LEADER;T8. Forestry and game management;T9. Tourism;T10. Social integration;T11. Human Resources;T12. Knowledge, innovation and research-development.
Number of registrations
0
500
1000
1500
2000
2500
3000
3500
T1 T2 T3 T4 T5 T6 T7 T8 T9 T10 T11
Figure 4. The numbers of registered members in the Thematic Groups, 2009
The role of networking in the rural econom
y

240 Figure 4 shows the numbers of the registered members in the Thematic Groups of the HNRN (HNRN Permanent Secretariat, 2009). 5063 private person and organization have registered till October 2009, which number is changing dy-namically (Figure 5, HNRN Permanent Secretariat, 2009).
0
10002000
3000
4000
50006000
7000
Janu
ary
Februa
ryMarc
hApri
lMay
June Ju
ly
Augus
t
Septem
ber
Octobe
r
Number of registrations-2009
Figure 5. The numbers of the registered members in the Hungarian National Rural Network, 2009
Development of the activity (HNRN)
• Social reconciliation in which we involved NGOs, entrepreneurs, mu-nicipalities and governmental actors.
• The Ministry of Agriculture and Rural Development (MARD) has es-tablished the network of the LRDOs on micro- region level.
• The legal base of the Network - 1030/2008 governmental decree and the 131/2008 MARD decree – was elaborated and accepted.
• The Secretary General of the HNRN, was pointed out by the Minister of the MARD (02. October 2008).
• The Permanent Secretary of the HNRN was created. • The registration procedure has been started, the contents and the lay-
out of the webpage is elaborated.• The Council and the Presidency of the HNRN has started its work, and
elected its President, (02. December 2008).• Launching the webpage, brochures, and the work of Thematic Groups
(2009. I. semester).• Launching the work by the Secretariat of Presidency, preparing the
Presidency meetings and professional papers.• Organising and participating on events, informing the participants
about our activities which is involved into the Action Plan.
The Action Plan is a list of the tasks/activities that structure needs to carry out in order to achieve the objective. This was drawn up by the Managing Autho-rity, the Council and the Permanent Secretariat, according to Article 68 (2) of
Mudri G
yörgy, Ligetvári Ferenc, Gyöngyössy Kálm
án

241Regulation (EC) No. 1698/2005. Following the regulation it should contain at least the following elements:
• Transfer of knowledge, information, best practices;• Network management;• Training (the preparation of training programmes for local action
groups in the process of formation);• Technical assistance for inter territorial and trans-national cooperation.
Through these obligations, the HNRN follows its action plan the main struc-ture shown in Table 1 (HNRN Permanent Secretariat, 2009). The calendar of the organised events and publications are available for all participants and those with interest on the HNRN website (www.mnvh.eu).
Table 1. The structure of the HNRN’s activity, 2009.
I. Information and advisory services I.1. Establishment of contact points in the rural areas I.2. Securing the exchange of the professional experiences and know- hows,
dissemination of relevant experiences practices, creating and maintenance of the database of the international good practices
I.3. Survey of needs on the New Hungary Rural Development Program’s Axis III-IV. I.4. Professional and advisory tasks related to the NHRDP I.5. Professional seminars of the Network’s Sections I.6. Management of the thematic fields I.7. Exchange of information and information sharing II. Communicational tasks II.1. General references on the NHRDP’s measures II.2. Operation of the Network’s electronic surfaces II.3. The establishment and maintenance of the printed publications of the Network
(library, newsletters) II.4. PR and marketing tasks II.5. Organisation of national and local forums II.6. Establishment and award of prizes III. Inter-territorial and international relations III.1. Technical assistance on territorial, international and local cooperation III.2. Organisation of international study trips, conferences and trainings III.3. Assistance in establishment of cooperation, cooperative networks for different
stakeholders III.4. Information sharing about the international development funds and opportunities III.5. The implementation of the common tools of the HNRN and the European Rural
Development Network III.6. International partner search tools
The obstacles of networking activities and the Leader approach
The main obstacle is the introduction of the approach, the introduction of a new way of thinking of the stakeholders. It means, that not only the “rural stakeholders” but the administration has to change their way of thinking. This is a long process, which has not ended yet. We have to admit that the task is
The role of networking in the rural econom
y

242 hard considering the steps from the planning till e.g. the changes of the paying out system. A further obstacle of the Leader implementation – from the rural stakeholders’ point of view – is the timing. The local level needs time to intro-duce all the requirements, communication and preparation.
An evaluation was launched among the LAGs in June 2009, which showed a stronger volume of international cooperation willingness compared to the 2004- 2006 experiences. A questionnaire was send out to the 96 Lags in which the main focus was put on the future plans about the international cooperation. The basic assumption stated that the LAGs’ international cooperation willing-ness depends on their advanced state of structure. 37.5% (36) from the total number of 96 LAGs have indicated that they are planning this kind of activity with exact details, additional 8.3% (8) have confirmed that they are interested in it later on. The majority answers indicated that the most important task for the Hungarian LAGs is to implement the measures of the Axis III- IV, even for the experienced LAGs. The positive answers indicated the willingness for cooperation with the neighbourhood countries, mostly through general project issues. The most frequented field of cooperation were: tourism, renewable en-ergies, local products, exchanging of experiences and good practices.
The low interest and the lack of exact issues indicated that the LAGs need to meet with good European projects and that the groups still have problems with the establishment of the management. That is why the additional coaching of these groups is needed; even basic coherences need to be highlighted. In this process the role of the horizontal and vertical networking activities are elemental. In contempt of the efforts, the “all-in budget” of the HNRN is not accepted yet, we are the activities are launched through program financing. This causes difficulty, to implementation of HNRN program needs financial sources.
Conclusion- The role of the Rural Networks in Hungary
Networking activity is looked upon as a permanent, improvable tool that can assist in developing the rural quality and economy. The successful adaptation to persistent rural acts will depend on our willingness and ability to adopt new way of thinking, new technologies change our development patterns, adopt appropriate institutional arrangements, and secure financing for local initiati-ves. Through the activity of the HNRN, some new tools are introduced:
As previously described, thematic groups have been selected and network staff will help registered users to find out more about good practices in related professional areas, both at home and abroad (newsletters, brochures, seminars, etc). The HNRN creates a unique opportunity for exchange of thematic infor-mation, issuing the most urging needs. Local planning is an important feature of the operation of Leader and the network activity. The appearance of the local needs – Local Rural Development Strategies, HNRN Action Plan – gives a legal base for providing services.
Mudri G
yörgy, Ligetvári Ferenc, Gyöngyössy Kálm
án

243Local programmes can be implemented by involving innovative ideas and tools. This is helped by the selection of best/good examples. The selection of these practices can be based on different indicators, but we have to avoid the exaggerated administration. Having regarded that the projects have specific environmental effects, those determines its judgement from the goals or suc-cess point of view.
The Network enhances both the national and transnational cooperation in which we are using the experiences of the previous programming periods. The willingness for cooperation was quite low, from the international cooperation point of view. The LAGs restricted themselves to larger initiatives (e.g. Oxan- weg, Tisza valley cooperation), which have been reached more countries and they could participate in cooperation with more Hungarian LAGs. Even the cross- boarder cooperation has been realised as a successful tool. The activi-ties of the “pilot-period” were focusing on structural questions, in the new period more LAGs have looked at cooperation as an important instrument. There are further steps toward integration of additional themes, e.g. research and development in the name of cooperation and harmonization.
The Network is working with a close cooperation with the scientific sphere, which helps to elaborate positions on a wider level in strategic questions. In order to monitor the activities of the network, the indicators on progress within CMEF could be introduced, preferably by an independent body (e.g., output indicator - number of the network‘s members divided by sector / topic; number of seminars organized in total and by topic; number of studies carried out, etc).
Networking activity is an important and useful tool, with its all difficulties. Neither the SWOT analysis of the New Hungary Rural Development Pro-gramme is dealing deeply with the importance of this issue, although the ana-lysis could be summarised as the following:
The greatest weakness is the lack of cooperation willingness in Hungary on the level of administration and on the level of different stakeholders either. The strength of the networking in Hungary is that many different top-down net-works are already existing, which can be transformed to a network which re-flects to the synergy. These steps can be realised under the work of the HNRN, which institutional framework gives a good opportunity. More weight should be put on the economical development issues in the frame of networking, the main threat may occur in case of fierce political argues.
Rural development policy and governmental politics are close to each others, every government has to consider its worth. The new member states are also on the way of learning, and it has to draw the conclusion from time to time.
The role of networking in the rural econom
y

244 References
DG AGRI (2008): Comparative analysis of the National Rural Networks in EU Member States (http://enrd.ec.europa.eu/app_templates/filedownload.cfm?id=CE1C9B7E-97C9-A044-8851-1FE0CA17E3F1).
New Hungary Rural Development Networks Program 2007-2013 (http://www.fvm.hu/main.php?folderID=2104).
Report 2007-Rural Development in EU (Statistical and Economic Informati-on, Table 2.2.1 Rural development funding, pg 22, http://ec.europa.eu/agri-culture/agrista/rurdev2007/index_en.htm).
Survey Leader+ Contact Point 2007 (Leader axis in the Rural Development Draft Programmes – survey results, http://ec.europa.eu/agriculture/rur/lea-derplus/steercom/31012007_en.htm).
Muilu, Toivo (2007). Rural Studies network of Finland - a national approach to networking rural expertise.
Jonathan Murdoch (28 September 2000.) - Networks - a new paradigm of rural development?
Jim Woodhill (August 2004) - Facilitating Complex Multi-Stakeholder Pro-cesses.
Mudri G
yörgy, Ligetvári Ferenc, Gyöngyössy Kálm
án
245Matej Bedrac, Tomaž Cunder1 Agricultural Institute of Slovenia, Department of Agricultural Economics, Hacquetova 17, Ljubljana
[email protected]; [email protected]
“Leader” approach and local development strategies in Slovenia
Abstract: LEADER axis presents a novelty in the Slovenian agricultural policy. The main object of the current paper is to describe the implementation process of the 4th axis of Rural Development Programme of Slovenia in the period 2007-2013 and analysis of the Annual Implementation Plans for the year 2008 and 2009. In this programming period 33 Local Action Groups will operate. They cover 97% of rural areas and 94% of rural population in Slovenia. The analysis of local development strategies and annual implementation plans shows on the willingness of local citizens to take an active part in the development of rural areas in Slovenia.
Keywords: LEADER approach; local development strategies; annual implementa-tion plans
Introduction
The Acronym LEADER (Liaison Entre Actions de Developpement Rural) means links between actions for the development of the rural economy and represents innovative approach in the implementation of rural development policy (EC 2006). The main objectives of LEADER approach are local capa-city building, new employment opportunities, diversification of activities in rural areas, stimulation of endogenous development, improving the manage-ment in rural areas and extension of innovation. The seven key features which discern LEADER approach from classical measures of rural development po-licy are: area based local development strategies, bottom-up approach, local public private partnerships, integrated and multisectoral actions, innovation, cooperation and networking.
From 2007-2013 programming period on the LEADER approach has been mainstreamed within overall EU rural development policy. This means that LEADER is included in the National and Regional Rural Development Pro-

246 grammes supported by the EU, alongside a range of other rural development axes. For the implementation of “LEADER axis” old member states must allo-cate a minimum of 5% of EU funding and new member states at least 2.5%.
The 4th development axis of Rural Development Programme 2007-2013 is the LEADER axis which presents a novelty in the Slovenian agricultural policy. In January 2009, Slovenia finished the procedure for selection and confirma-tion of Local Action Groups. In this programming period Slovenia will have 33 Local Action Groups, which cover 97% of the rural area and 94% of the rural population.
Methodology
The paper briefly outlines theoretical arguments for introducing of LEADER approach and examines its implementation in Slovenian rural development policy. It’s based on desk research drawing from literature, legislation docu-ments and available research studies. No modelling work was elaborated in the framework of the analyses. Critical evaluation is carried out in alignment with generally used and known policy evaluation techniques.
The paper is divided into three parts. In the first part, general characteristics of LEADER approach and measures which are carried out in Rural Development Programme 2007-2013 are presented. In the second part, an analysis of 33 Local Action Groups is described. The main focus is given to spatial-demo-graphic characteristics, structure of partnership and organisation of decision making body. The paper completes with an analysis of 33 Local Development Strategies. We analysed to what extent the strategic goals and priority tasks of Local Development Strategies follow the economic, social and spatial-envi-ronmental component of sustainable development. Latter on we have made a comparative analysis of all Annual Implementation Plans for 14 Local Action Groups in 2008 and 20 Local Action Groups in 2009 which were confirmed by the end of September 2009.
Results
Integrated rural development programmes which are prepared with active involvement of local citizens have a long tradition in Slovenia. In the period 1991-2006, Slovenia introduced “Programmes of Integrated Rural Develop-ment and Village Renewal” and “Development Programmes for Rural Are-as” which were quite similar with the LEADER+ initiative in the European Union (EC 2007).
The programme for Integrated Rural Development and Village renewal in the period 1991 – 2002 was nationally funded with 14.6 millions € and available to all rural areas in Slovenia. It provided support for the following activities: preparation phase (analyzing development needs, elaborating the develop-ment programme, establishing partnerships, organizing training workshops);
Matej B
edrac, Tomaž C
under

247promotion of rural areas; village renewal; tourist and farm infrastructure; and developing and establishing trade marks for local products. The programme was destined for municipalities selected through a public tender published by the Ministry of Agriculture, Forestry and Food. It resulted in 140 municipali-ties benefiting from the financing of 290 projects.
The second important national measure was Development Programmes for Rural Areas in the period 1996-2006. With a budget amounting to 2.500.000 EUR it provided assistance for: establishing partnerships and the selection of managers; animation of local areas; and the preparation of development stra-tegies. Funding was available for groups of municipalities who were intending to start partnerships, and this applied to all rural areas in Slovenia which had similar development needs and opportunities.
By the end of October 2006, 31 rural development strategies were developed and the same number of partnerships started with support from the programme. Each partnership covered at least three municipalities. These partnerships re-presented 172 out of the existing 210 Slovenian municipalities. Currently the-se existing partnerships are being transformed into LAG structures.
From 2007-2013 programming period the LEADER approach has been main-streamed within overall EU rural development policy. This means that LEA-DER is included in national and regional rural development programmes sup-ported by the EU, alongside a range of other rural development axes. In the Rural Development Programme for Slovenia are under Axis 4 (LEADER) the following measures [3]:
• Running local action groups (LAG), skills acquisition and animating the territory;
• Implementing local development strategies;• Promoting inter-territorial and transnational cooperation.
First measure: Running local action groups (LAG), skills acquisition and animating the territory aims at animating rural population to join the local action groups and qualification for running local action groups. The animation activity aims at promoting the LEADER approach, local action groups, and local development strategies in the selected area. Maximum aid rate for the running of LAGs, skills acquisition and animation of the territory amounts up to 50 percent of the value of eligible costs and may not exceed 20 percent of the total public expenditure of the local development strategy.
The second measure: Implementing local development strategies aims at the implementation of the projects under the LEADER principles based on the local development potentials and reflects the needs of the local population as well as contributes to the improved quality of life and job creation in the countryside. The innovative projects which are compliant with the local de-velopment strategy implemented in those areas where an operating local ac-tion group exists will be selected. Eligible for support under this measure are
“Leader” approach and local development strategies in S
lovenia
248 local development strategies which were confirmed in a public tender. Only a LAG with confirmed local development strategy signs a contract with the MAFF setting out mutual relations and indicative resources for all purposes of the measures under axis 4. On about 80% of the territory approximately 20 LAGs will operate. The projects based on their own standards and criteria set by the LAG or its decision-making body will be selected and submitted to the LEADER Office for confirmation. The LEADER Office checks whether the selected projects are compliant with the local development strategy and within the amount of allocated financial resources for each LAG. The projects must contribute to at least one of the priorities of the RDP 2007-2013. In addition to that, the implementation and financing of the projects must also involve private partners. Eligible costs are: the material costs, costs of obtaining the documentation and approvals, project promotion costs and other general costs directly related to preparation and implementation of projects. If the projects match the measures under other three axes of the RDP 2007-2013 they will be implemented under the conditions and in a manner set for these measures.
Beneficiaries under this measure are operating LAGs implementing local de-velopment strategies and having a confirmed annual implementation plan. Mi-nimum aid amount for each project is 2.000 €, and maximum 70.000 €. It is expected that during the whole period 650 projects will be carried out.
Promoting inter-territorial and transnational cooperation is the last measure under the 4th axis and it aims at grouping rural areas with similar development opportunities and needs to jointly implement development projects, exchange the knowledge and experience and thus contribute to a more effective im-plementation of the local development strategies. Eligible costs are: material costs arising from the implementation of the cooperation projects, experience exchange and information actions between the cooperating LAGs. Support will be granted only for expenses related to areas within the Community.
Allocation of financial resources for LEADER axis
Nearly 34 million € of public funds will be spent for the implementation of LEADER measures in the period 2007-2013. 20% of funds are devoted to Running Local Action Groups and 80% to implementation of the projects. An-nual entitlement spending of financial resources for each LAG depends on:
• Number of inhabitants of the LAG area;• Surface of the area (km2);• Development Deficiency Index of the region (UMAR 2006);• Assessment of local development strategy.
The Development Deficiency Index is a composite index which is used as the basis for allocating direct and indirect regional incentives. According to this index Slovenian statistical regions are classified in four classes. Less develo-ped regions are in the 4th class and they are entitled to 15% more resources per km2 and per capita than the most developed regions.
Matej B
edrac, Tomaž C
under

249Resources for Running Local Action Groups are distributed among each LAG on the basis of the area and number of inhabitants of the LAG area, both with the consideration of Development Deficiency Index of the region. Resources for the implementation of the projects for each LAG are distribut-ed as follows:
• 30% on the basis of the area (km2) with consideration of Development Deficiency Index of the region;
• 30% on the basis of the number of inhabitants with consideration of Development Deficiency Index of the region;
• 40% on the basis of assessment of local development strategies.
The local development strategies were evaluated for their innovation, feasibi-lity, sustainable stance and consistency with other development programmes. The contribution of the strategy to creation of new jobs and the integration of the marginal rural population groups (women, young people, elderly people) into the drawing up and implementation of the strategy were also evaluated. Every local development strategy had to achieve at least 75% of the maximum number of points to be confirmed. The average mark for local development strategies were 84 points. One local development strategy achieved 75 points, and two local development strategies reached the highest mark of 98 points.
Local Action Groups
The main reason for setting up public-private partnership, known as Local Action Groups, is to identify and implement local development strategies. At the local level it is the lack of interest and above all knowledge which deter the local population from taking an active part in the preparation and implementa-tion of local development strategies. LAGs are set up at homogenous, socially cohesive rural territory with common historical and natural characteristics. The chosen area must have enough critical mass in terms of human, financial and economic resources for an efficient implementation of local development strategy. The population of LAG area must be between 5.000 and 150.000 inhabitants. LAGs could be established on the whole territory of the country with the exemption of the settlements with more than 10.000 inhabitants.
LAGs operate on the basis of tripartite partnership. The partnership consists of representatives from public institutions, economic sector and interested civil society. Representatives of the economic sector and civil society must have at least 50% of votes at the decision making level. The most common members of LAGs are professional organizations, farmers associations, micro-enterpri-ses, representatives of local self-government, research and education institu-tions, environmental organizations, cultural and community service providers, women’s associations, young people, farmers and other interested persons.
The LAG selects a manager who designs the LAG operation, animates the lo-cal population, collects project ideas, provides education for the local popula-tion, prepares reports and performs other tasks entrusted to him by the LAG.
“Leader” approach and local development strategies in S
lovenia

250 The procedure of establishment, methods of operation and administrative or-ganization are not prescribed. The LAGs just have to prove that they are ca-pable of managing public funds. Tasks and activities of a LAG are (Bedrac, Cunder 2008):
• It prepares and elaborates a local development strategy and is respon-sible for its implementation;
• It appoints a decision making body, selects manager, administrator and all necessary authorities/structures of LAG;
• It establishes an efficient and transparent system for the assessment and selection of development projects.
Every LAG selects a decision making body which must follow the tripartite principle. The main task of the decision making body is to ensure:
• Transparent operating procedures;• Clear rules for appointment or election of the members and their duties;• Clear mechanism which enables any interested actor or group to par-
ticipate in the preparation of projects and decision-making process;• Efficient and ongoing consultation with all interested members of
LAG;• Clear procedures and rules for the selection of the most appropriate
individuals for implementation of the particular tasks and activities;• Efficient way for the transfer of information and information of all
interested parties on further actions;• Procedures of monitoring and self-evaluation.
Figure 1. Geographical position of analysed LAGs in SloveniaSource: Ministry of Agriculture, Forestry and Food
Matej B
edrac, Tomaž C
under

251Geographical characteristics of LAGs
Figure 1 shows the area of local action groups which respond to Invitation to Tender for Selection and Confirmation of Local Action Groups Eligible for Implementation of LEADER Approach. The first tender was published at the end of February 2008 and 14 Local Action Groups with draw up Local Deve-lopment Strategies applied by the end of May 2008. The second tender was published in September 2008 and it was closed with confirmation of another 19 LAGs in the end of January 2009. The final number of LAGs in Slovenia in programming period 2007 – 2013 is therefore 33 and they are covering an area of 19.739 km2 with 1.269.308 inhabitants in 199 municipalities, which comprise 95% of all municipalities in Slovenia. The number of municipalities in each LAG varies between 1 and 14 (MAFF). The average area of a LAG is 586 km2 and it has 38.464 of inhabitants. The biggest LAG has 1.812 km2 and the smallest LAG has only 65 km2. The biggest LAG in terms of population has 106.220 inhabitants while the smallest one has only 4.587.
Structure of partnership
The legal form of the LAGs is quite different (IMAD 2006). The most fre-quent form is Contract of establishment of LAG (16), followed by Association (8), Consortium contract (3), Co-operative (3), Memorandum of Association (1) and Public Institute (1). The type of organisation depends widely on the local environment, previous experiences and already established organisatio-nal structures in the area [6].
0%
10%
20%
30%
40%
50%
60%
70%
80%
90%
100%
LA
G 1
LA
G 2
LA
G 3
LA
G 4
LA
G 5
LA
G 6
LA
G 7
LA
G 8
LA
G 9
LA
G 1
0L
AG
11
LA
G 1
2L
AG
13
LA
G 1
4L
AG
15
LA
G 1
6L
AG
17
LA
G 1
8L
AG
19
LA
G 2
0L
AG
21
LA
G 2
2L
AG
23
LA
G 2
4L
AG
25
LA
G 2
6L
AG
27
LA
G 2
8L
AG
29
LA
G 3
0L
AG
31
LA
G 3
2L
AG
33
Tota
l
Public sector Economic sector Private sector and NGO
Figure 2. Structure of partnership of analysed LAGsSource: Local development strategies
“Leader” approach and local development strategies in S
lovenia

252 The structure of partnership varies widely between LAGs (Figure 2). The ave-rage partnership has 33% of public sector, 29% of economic sector and 39% of private sector. The number of partners is between 14 and 129. Municipalities still have a predominant role in the public sector (50%). Other institutions from the public sector are: Agricultural Extension Service, development agen-cies, schools, Social Work Centres etc. Agricultural enterprises and farms re-present 40% of partners from economic sector. Other 60% represent different companies that are active in the area of the LAGs. The private sector is the most heterogeneous. It combines individuals, different associations and nong-overnmental organizations (NGOs). The most common groups are Farm Wo-men Associations, Rural Youth Associations and different tourist and cultural associations. Five LAGs do not have any individuals in their partnership.
Decision making body
The composition of the decision making body (Administrative Board) in ana-lysed LAGs differs from LAG to LAG. The number of the members of the Ad-ministrative Board varies from 7 to 26. They can be elected or appointed for the term of 2 to 7 years. Private partners and associations have at least 50% of votes at the decision-making level; in some LAGs this share is even higher. Some LAGs have written in their operating rules and procedures that women and young people must be members of the decision making body.
Local development strategy (LDS) is based on endogenous development po-tentials of the selected area. The main goal of the strategy is to create long term development policies (at least for the whole programming period 2007-2013). In the LDS, development problems and potentials which are based on detailed analysis of situation in the area must be clearly identified. Every LDS must contain [4]:
• Characteristics of the area (geographic, economic, demographic, so-ciologic, description of previous actions);
• SWOT analysis (development potential of the area);• Development vision of the area (chosen theme and goals, priorities,
target groups, expected results);• Operating strategy (bottom-up approach, time schedule, innovative
actions, transferability of the actions and activities, sustainability of the strategy);
• Harmonisation with other development programmes;
Strategic goals of local development strategies
It is important that strategic goals contribute to the solution of development problems by emphasising strengths and opportunities of the LAG area. Stra-tegic goals must be sustainably oriented, which means that they must follow economic, social and spatial-environmental aspect of development. The eco-nomic aspects are the most representative (Figure 3). Nearly half of the goals are directed predominantly towards promoting of economic development.
Matej B
edrac, Tomaž C
under
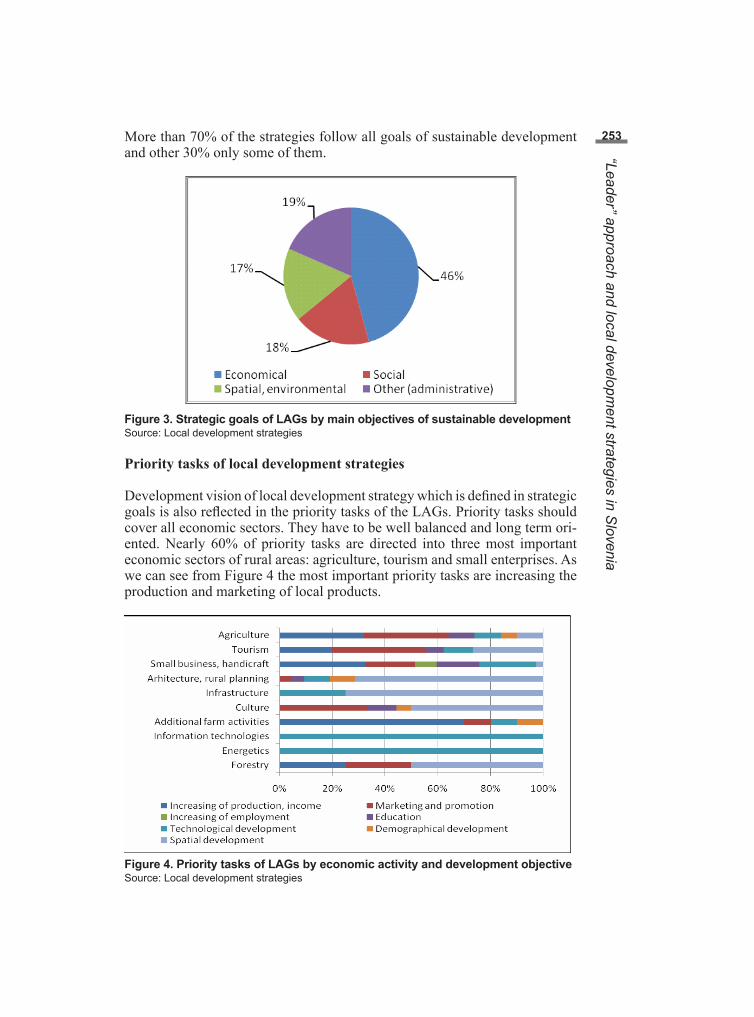
253More than 70% of the strategies follow all goals of sustainable development and other 30% only some of them.
Figure 3. Strategic goals of LAGs by main objectives of sustainable developmentSource: Local development strategies
Priority tasks of local development strategies
Development vision of local development strategy which is defined in strategic goals is also reflected in the priority tasks of the LAGs. Priority tasks should cover all economic sectors. They have to be well balanced and long term ori-ented. Nearly 60% of priority tasks are directed into three most important economic sectors of rural areas: agriculture, tourism and small enterprises. As we can see from Figure 4 the most important priority tasks are increasing the production and marketing of local products.
Figure 4. Priority tasks of LAGs by economic activity and development objectiveSource: Local development strategies
“Leader” approach and local development strategies in S
lovenia

254 Annual Implementation Plans
Every LAG has to prepare Annual Implementation Plan where according on its own standards and selection procedures select projects and submit them to the Managing Authority (LEADER office) for confirmation. The LEADER office checks if the projects are compliant with the Local Development Stra-tegy and the amount of financial entitlement for each LAG. The projects must contribute to at least one of the priorities (axis) of the Rural Development Programme 2007-2013. The implementation and financing of the projects must involve also private partners. In this chapter are analysed 14 Annual Implementation Plans which were confirmed for the year 2008 and 20 Annual Implementation Plans which are so far confirmed for the year 2009.
In 2008 and 2009 were approved 282 projects in the total amount over 8.7 million € [8]. The average amount for the project is almost 31.000 € and the average co-.financing rate from the European Rural Development Fund is 47.7%. The number of projects among the LAGs varies between 2 and 19. There are only two projects which promote inter-territorial and transnational cooperation. One third of the projects are about improvement in the field of tourism, followed by agriculture and culture with around 15%. Projects in the field of forestry, energy and information technologies are still lagging behind. Detailed figures are presented in Table 1. Almost two thirds of funds are allo-cated into three most important economic sectors of rural areas: agriculture, tourism and small enterprises. There is still a lack of interest for investments in information technologies, energy and forestry sector. The highest share of co-financing has the projects in the field of culture with an average rate of 58%. The lowest share show the investments in infrastructure with 35%.
Table 1. The number and value of projects, by activity and share of co-financing
Activity Number of
projects
Share (%)
Value of projects
(€)
Share of co-financing
(%) Agriculture 46 16.3 1,240,263 50.5Tourism 94 33.3 3,291,067 47.4Small business and handcraft 33 11.7 1,239,267 38.5Architecture and rural planning 17 6.0 655,649 46.6Infrastructure 17 6.0 369,834 35.0Culture 44 15.6 1,215,699 58.5Additional farm activities 11 3.9 207,228 48.2Information technologies 11 3.9 198,537 48.5Energetics 5 1.8 121,920 53.6Forestry 4 1.4 226,296 51.3Total 282 100.0 8,765,760 47.7 Source: Annual Implementation Plans 2008, 2009
Around 80% of the projects contribute to Axis 3, Improving of quality of life and diversification of rural economy, 15% of the projects contribute to im-
Matej B
edrac, Tomaž C
under

255proving competitiveness of the agricultural and forestry sector and 5% of the projects improve the environment on the countryside.
Figure 5. The LEADER projects by economic activity and development objectiveSource: Local development strategies
Almost one third of projects directly contribute to demographic development, 18% to marketing and promotion and 13% to education of local citizens (Fi-gure 5). Only four projects directly increase the employment but a lot of pro-jects indirectly encourage employment and increase the income. All target groups are involved in the implementation of projects and a lot of attention is given to marginal groups such as youth, farmwomen and elderly people.
Discussion and conclusions
The established LAGs are very heterogeneous in the matter of size, struc-ture of partnership and administration. All LAGs strictly take into account the “bottom- up approach”, although some of them do not involve individual persons into their partnerships. Municipalities still represent the majority of public institutions in partnerships which is understandable, because they have gained a lot of experience with similar programs in the previous years.
An analysis of strategic objectives in the local development strategies shows that development of micro enterprises and tourism represents the greatest op-portunity for a quicker restructuring and economic growth of rural areas. Stra-tegic objectives in the field of agriculture are still mainly oriented towards the improvement of production (especially in the production of safe and quality food) and marketing of agricultural products. Great importance is also given to development of agricultural infrastructure and protection of the environ-ment in rural areas.
“Leader” approach and local development strategies in S
lovenia

256 A comprehensive analysis of 33 Local Development Strategies indicates a great diversity of Slovenian countryside. In the frame of defined strategic ob-jectives and priority tasks they consider all aspects of sustainable develop-ment. On the level of priority tasks more attention should be given to social and spatial issues according to the general Leader objectives.
The number of projects in the first two years of implementation shows that Slovenia will exceed the objectives set in the rural development programme. Since Slovenia is one of the most forested countries in Europe more attention should be given to projects in the field of forestry and the production of renew-able sources of energy. Greater emphasis should be given to the projects which promoting inter-territorial and transnational cooperation.
At the end we may conclude that local capacity building; available funds for the implementation of local development strategies and cross-sectoral partner-ships represent new development opportunity for rural areas in Slovenia.
References
1. European Communities, The LEADER approach – a basic guide, 2006, Eu-ropean Commission, Luxembourg, 23 p.
2. European Communities, LEADER+ type activities in Slovenia, 2007, LEA-DER+ observatory contact point, http://ec.europa.eu/agriculture/rur/leader-plus/memberstates/slovenia.htm (20.8.2009).
3. MAFF, Rural Development Program of the Republic of Slovenia 2007-2013, 2007, Ministry of Agriculture, Forestry and Food, Ljubljana, 323 p.
4. MAFF; Bedrač; Cunder, Smernice in priporočila za izvajanje pristopa LEADER v Republiki Sloveniji v Programskem obdobju 2007-2013, (Gui-delines and recommendations for implantation of LEADER approach in Republic of Slovenia in 2007-2013 programming period), 2008, Ministry of Agriculture, Forestry and Food, Ljubljana, 43 p.
5. MAFF, Nacionalni strateški načrt razvoja podeželja 2007-2013, (National Strategy plan for rural development 2007-2013), 2007, Ministry of Agricu-lture, Forestry and Food, Ljubljana, 51 p.
6. IMAD, Metodologija izračuna indeksa razvojne ogroženosti za obdobje od 2007-2013, (Methodology For Calculating the Development Deficiency In-dex For the Period 2007-2013), 2006, Institute for macroeconomic annaly-sis and devevelopment , 64 p.
7. MAFF,33 Local Development Strategies, Ministry of Agriculture, Forestry and Food.
8. MAFF,14 Annual Implementation Plans 2008, Ministry of Agriculture, Fo-restry and Food.
Matej B
edrac, Tomaž C
under

257Pakurár Miklós, Oláh Judit1 University of Debrecen, 4032 Debrecen, Böszörményi út. 138, Hungary [email protected]; [email protected]
Why do we need a more locally focused rural employment policy in the EU?
Abstract: In practice the EU suggestions are translated mechanically to national and regional policies, in many instances, without taking into account the real interests and needs of the inhabitants at different regional levels. This way the capitalization of EU policies and funds is not as efficient as it should be since the endogen potentials of localities are not utilized properly. Our hypothesis is that the rural areas of the EU are so diverse that the significant differences in employ-ment, economic, social, educational and infrastructural features of rural regions necessitates a more locally focused policy which could be supported by analyse statistical data. The analysis is based on the Eurostat General and Regional da-tabase and on national statistical databases. What are the reasons that one size fits all solutions has to be avoided and has to be changed with locally adapted policies? Probably this question can be answered partly by the facts of statisti-cal data with which the differences, in some cases extremely huge alterations amongst territorial features, can be demonstrated. Differences based on ruralty are a common topic of rural policies and rural science in EU countries however the differences in rural features of different countries may be notably important. Analysing the employment-unemployment indicators and those indicators that closely related to employment we found that in many instances the major differ-ences are between the post-socialist new member states (NMS) and the EU 15 countries.
Keywords: rural; employment; local policy
Introduction
Rest on the Lisbon Strategy European Employment Strategy helps to solve the problems of unemployment and creates competitive jobs for EU citizens. Employment Guidelines, National reform Programmes, Joint Employment Report, Recommendations, and EU annual progress report are the bases of the

258 European Employment Strategy. Eurostat indicators are used for assessment of the performance of European Employment Strategy with the cooperation of DG Employment, Social Affairs and Equal Opportunities (1).
The European Council announced its decision to increase the employment rate to 70% by 2010 (Lisbon European Council 2000). However the Commission of the European Communities expressed in 2004 that it was clear that the EU would not reach the intermediate employment rate target of 67% for 2005 and some other important indexes (labour productivity growth, quality in work, and inclusive labour markets) were also at lower level than expected (2).
The European Employment Policy based on the Treaty establishing the Euro-pean Community and it is adapted continuously to the changing conditions. High level of employment (Article 2) is a main priority of the Treaty. European Social Fund was established „to render the employment of workers easier and to increase their geographical and occupational mobility within the Commu-nity, and to facilitate their adaptation to industrial changes and to changes in production systems, in particular through vocational training and retraining” (Article 123). The Community enhances the cooperation of Member States and improvement of the knowledge (Article 128) (3).
The European Council focused first time entirely on the issue of employment in a meeting (Extraordinary Meeting on Employment) in Luxemburg, on 20 and 21 of November in 1997. There was announced that every effort would be made to reduce unemployment which was a threat to the cohesion of the Union’s societies (4).
As a result of previous efforts to combat unemployment and increase em-ployment in the European Union Employment Guidelines were worked out and accepted by the Council in 1998. The Guidelines facilitated actions of four areas: to improve employability, to develop entrepreneurship, encour-age adaptability of businesses and employees, and strengthen the policies for equal opportunities. Detailed employment guidelines were accepted based on the above mentioned four areas. The Council encouraged Member States to apply comparable statistics using common indicators for monitoring and as-sessment of employment policies taking into account the individual situations of different regions. Member States were urged to develop their first employ-ment plan by 1998 based on the guidelines of the Council (5).
Strategic goals of employment, economic reform and social cohesion were set by the Council in Lisbon in 2000. Building knowledge infrastructures, promot-ing innovation and economic reform, and modernising social welfare systems were announced at the meeting as the new challenges of the Union. The Coun-cil assessed the Union’s strengths and weaknesses. Excellent macro-economic outlook, generally well-educated workforce and a developed social protection system were found the most important strengths of the Union regarding of employment issues. High level of unemployment (15 million Europeans out
Pakurár Miklós, O
láh Judit

259of work), too low employment rate, with low level of participation of women and older workers, long term structural unemployment, and regional unem-ployment imbalances were stated to be as main weaknesses of the time being. The areas of telecommunication, the Internet were having problems of under-development and these areas had unfilled jobs because of the lack of skilled people. On the Lisbon meeting new strategic goal was set for the following ten years “to become the most competitive and dynamic knowledge-based economy in the world capable of sustainable economic growth with more and better jobs and greater social cohesion”. To reach the strategic goal the fol-lowing main tasks were aimed: preparing the transition to a knowledge-based economy, modernizing the European social model, and sustaining the healthy economic outlook and favorable growth prospects. The European Council set the goal of full employment in the European Union. The Counsel opined that an average growth rate of 3% was a realistic prospect for the following years. Decision was made to increase employment rate from an average of 61% (2000) to as close as possible to 70 % by 2010 and to increase the employment rate of women from 51% to more than 60% by 2010. A new “open method of coordination” was suggested as a mean to facilitate the implementation of Union’s strategic goal. The open method of coordination was planned to fix guidelines with timetables, to establish quantitative and qualitative indicators and benchmarks, to use European guidelines to form national and regional policies, and to monitor and evaluate the process periodically. Preparation of an annual synthesis report was recommended for Member States to follow up the implementation of the strategy (6).
In December 2000 the rate of economic growth was on a ten years high. Un-employment rate was 8.7% after four years of decrease. In the same three years the employment rate increased from 60.7% to 62.1%. The European Council noted that the Commission proposal on the employment guidelines for 2001 made improvements by increasing the quantified objectives (7). Eco-nomic growth had been experienced for four years it was about 3.5% in 2000, employment increased (2.5 million new jobs) mainly due to jobs taken up by women, and unemployment was on the lowest level for ten years. Intermedi-ate targets of employment rates were set by the Council for January 2005 at 67% overall and 57% for women. Employment rate target was also agreed for elder people (55-64) to increase to 50% by 2010. The Council issued that there was an opportunity to solve the demographic challenge of the ageing Com-munity by rising employment rates (8).
The Barcelona European Council evaluated the European Employment Strat-egy and found that the Luxembourg Employment Strategy had helped to solve the problems of employment and unemployment in the Union. Evaluating the achievements of European Employment Strategy, involving the targets and goals issued in Lisbon, the Council suggested changes in the Employment Strategy (reinforced Employment Strategy). First of all the Employment Strategy had to be simplified by reducing the number of guidelines. Before the Lisbon deadline of 2010 an intermediate evaluation was suggested in 2006.
Why do w
e need a more locally focused rural em
ployment policy in the EU
?

260 The role of social partners was reinforced in realization and monitoring of guidelines. Increasing employability and removing obstacles to have a job were suggested as means of creating higher level of employment. Improve-ments in the areas of lifelong learning, quality in work, and gender equality were advised to enhance employability. The decrease of the tax load on low-wage earners and creation of tax and benefit system to make work pay and support people to find a job were addressed. Differences in productivity and skills should affect the evolution of wages. To increase the employment rate of women disincentives should be removed and childcare capacity should be increased. Target was set to provide child care by 2010 to at least 90% of chil-dren between three years old and the mandatory school age and at least 33% of children under three years of age. It was agreed that early retirement should not be promoted and the effective average age at which people stop working should be increased by five years by 2010. The Council suggested measures to remove barriers of labour market in the European Union by 2005 (9).
The European Council announced that the gap between education and training and the employment market was an obstacle to occupational and geograph-ic mobility. Lifelong learning was introduced as a promoter of mobility and means to reduce unemployment. Increasing investment in education and train-ing, cooperation of mutual recognition of qualifications, and enhancement of coordinated strategies in training were the Council’s proposals. Member States were addressed to monitor geographic mobility and skill gaps to help uncover the trends in time (10).
At Brussels European council, March 2003 a slowdown in growth and job creation was announced and short-term recovery seemed to be uncertain. The unemployment had declined by two million people since the start of the Lis-bon strategy. Sustainable growth and continuously increasing employment were in the centre of the Union’s politics. Enlargement of the European Union was mentioned as a potential for growth and an increased possibility to reach the Lisbon goals. The European Council determined the priorities of reforms for the following period. Four priorities were agreed: raising employment and social cohesion, giving priority to innovation and entrepreneurship, connect-ing Europe and strengthening the internal market, and providing environmen-tal protection for growth and jobs.
Methodology
The analysis is based on the NUTS 2 and NUTS 3 regional data of the Euro-stat. The Eurostat data from the general and regional statistics was chosen to have comparable data of regions however the big ratio of missing data makes the analysis cumbersome and in some instances the EU level analysis is sim-ply impossible. The examined time period was from 2000 to 2006, the end was determined by the availability of data on the Eurostat database when the report was prepared. Tendencies were evaluated by comparing the data of the first year and the last year of the examined period. NUTS 3 levels were preferred in
Pakurár Miklós, O
láh Judit

261index selection however a big number of important indexes are available only on NUTS 2 level in the Eurostat general and regional statistics. In some cases the indicators are not available on NUTS2 or NUTS3 levels but if there are major differences at country level, we would anticipate, major differences that this probably also applies at (rural) regional level. The selection of indexes are based on the results of EU and national research projects (11, 12, 13, 14, 15, 16, 17, 18, 19, 20, 21, 22, 23, 24, and 25) and the available data from the Eurostat general and regional database (26). Taking into account rurality the regions were divided into three groups: predominantly urban regions (PU), intermediate regions (IR) and predominantly rural regions (PR). The categori-sation of rurality based on the methodology of the Organisation for Economic Co-operation and Development which method uses population density as the criteria of rurality.
Results and discussion
Area and population characteristics
Area and population characteristics of a region greatly influence the formation of a locally focused rural employment policy. Regions having relatively low rural population face fewer difficulties in financing and executing rural de-velopment policies than regions where the portion of rural population is more significant. The population density affects employment many ways mainly through the accessibility and the cost of infrastructure.
The area and the population data of regions have had an outstanding impor-tance in the typology of regions especially to determine the rural and urban areas since the most widely applied OECD typology uses population density to distinguish rural and urban areas. Although many typologies have been developed to determine rural and urban areas the population density indicator remained indispensable in the definition of regions. The population is deter-mined by the number of birth and death of a region and the migration charac-teristics of the area.
The average areas of PU, IR and PR regions were 921 km2, 3464 km2 and 5757 km2 respectively. Since the population density increases in opposite direction transportation time and cost is the highest in PR regions and the quality of transportation infrastructure affects greatly the prospects of the rural popula-tion. The average area of PU, IR and PR regions change was small from 2001 to 2006. More than half of the EU area (53.6%) is predominantly rural 37.1% of the land is intermediately rural area and only 9.3% of the area is predomi-nantly urban. Most countries have PU, IR, and PR regions, two countries have two types of regions and three have only one type of regions on NUTS3 level. The average areas of similar types of regions differ greatly country by country. The average sizes of PU regions are smaller in every country than the average size of IR and PR regions with two exceptions of Belgium and Greece.
Why do w
e need a more locally focused rural em
ployment policy in the EU
?

262 In studying the complex determinants of human fertility, social scientists have given little attention to population density, although reproduction has been shown to be density-dependent for a wide variety of other species (Lutz et al., 2006). Using fixed effects models on the time series of 145 countries and controlling for key social and economic variables, we find a consistent and significant negative relationship between human fertility and population den-sity. Moreover, we find that individual fertility preferences also decline with population density. These findings suggest that population density should be included as a variable in future studies of fertility determinants.
The population density of former socialist countries (Bulgaria, Latvia, Lithuania, Hungary, Poland, Romania, Slovenia and Slovakia) decreased in PR regions and it decreased also in the majority of PU and IR regions. In other countries the population density increased in all region types except in PR regions of Denmark, Germany, Greece, Netherlands and Portugal. The concentration of the population continued in the examined period PU and PR regions’ population increased and the source of the increase was partly from PR areas.
0,00
500,00
1000,00
1500,00
2000,00
2500,00
3000,00
3500,00
4000,00
be bg cz dk de ee ie gr es fr it cy lv lt lu hu mt nl at pl pt ro si sk fi se uk
Hea
d/sq
uare
km
PUIRPR
Figure 1. Population density (head/ square km) NUTS 3, 2006Source: Eurostat General and regional statistics
The average of population density was the highest in PU (1216.0 heads per km2) and the lowest in PR (59.9 heads per km2) regions in NUTS3 regions of the EU (Figure 1) in 2006 and the ratio of population density of PR, IR, and PU regions was 1:2.5:21. On NUTS 3 level PU regions had greatly higher population density than IR and PR regions. The differences between the popu-lation density of IR and PR regions were smaller in each country than the dif-ferences between PU regions and IR or PR regions.
Pakurár Miklós, O
láh Judit

263Results and discussion
Differences in economic activities by ruralityEconomic development is generally characterised by the measure of national income and output of a country or region. In the most common method Gross Domestic Product is equal with the sum of consumption, gross investment, government spending and the difference of exports and imports (exports mi-nus imports). Kranendonk and Verbruggen (2008) suggested using an alterna-tive methodology to calculate GDP in which imports were allocated to all ex-penditure categories. With this method “the contributions of the expenditure categories to GDP growth provide a better understanding of why GDP growth decelerates or accelerates”. In international relations GDP comparisons are commonly made on current currency exchange rate or on purchasing power parity exchange rate.
GDP is a general measure of the economic development however Filc and Se-hovic (2006) cautioned that the high level of national deficit would jeopardise the economic stability and advised to work out appropriate policy initiatives to correct the USA’s external imbalances. There are other methods than com-parison of GDP values when people’s wellbeing is analysed. Murias et al. (2006) estimated synthetic economic wellbeing index with Data Envelopment Analysis. Assessing the synthetic economic wellbeing index of fifty Spanish provinces it was found that the ranking of provinces was similar with the rank-ing on per capita income but notable differences were experienced.
A permanent question in regional development is what activities to improve to enhance the economy of the area. A viable answer is to improve the most pro-ductive businesses which will increase the wellbeing of the region. Regional economic performance was evaluated in association with economic structure, employee training and technology adaptation, and transport infrastructure by Deichmann et al. (2004). They established that micro enterprises with low productivity were dominated in the Southern Mexico which structure differed greatly from the rest of the country. The econometric analysis diagnosed that employee training, technology adaptation and improvement of transport infra-structure to get easy access to urban areas positively affected productivity.
Regional development, level of education in a region and demography are related factors of population economics. In geographically favourable regions parents invest relatively more in the education of their children that results in a more educated population of these regions that ensure the circumstance of sustainable economic growth (Iyigun 2005).
Transformation of the economy to a more competitive direction and knowl-edge as a driving force are in a plausible relationship however capitalization of this correspondence in less developed areas is an arduous task. Ylä-Anttila and Palmberg (2007) assessed the new industrial policies of Finland. In the 1990’s the main focus of policy making started to be on education, R&D and
Why do w
e need a more locally focused rural em
ployment policy in the EU
?

264 innovation and these changes lead to high rankings of young people’s learning skills and educational attainment according to OECD’s PISA studies.Gross domestic product per inhabitant at current market prices increased con-tinuously by 17.9% from 18995,9 euro in 2000 to 22400,2 euro in the EU27 in 2005. GDP per inhabitant in percentage of the EU average was the highest in PU regions (129.2%), in IR (84.4%) and in PR (76.4%) regions an inhabitant contributed less to the EU GDP in 2005.
The contribution of inhabitants to the GDP dynamically increased in the former communist, eastern EU countries in the period of 2000-2005. The de-velopment was especially high in Romania, Bulgaria, Slovakia, Estonia, Hun-gary, Latvia and Lithuania however the GDP per capita values were the lowest in the beginning of the period and even with these intensive tendencies these countries have a long way to get closer to the EU average.
0,00
50,00
100,00
150,00
200,00
250,00
300,00
350,00
be bg cz dk de ee ie gr es fr it cy lv lt lu hu mt nl at pl pt ro si sk fi se uk
%
PU 2000 IR 2000 PR 2000 PU 2005 IR 2005 PR 2005 Figure 2. Euro per inhabitant in percentage of the EU average. Gross domestic product (GDP) at current market prices at NUTS level 3, 2000- 2005Source: Eurostat General and regional statistics
The ten countries that accessed the EU in 2004, Bulgaria and Romania had the lowest level of GDP per inhabitant in percentage of the EU average in 2000 and in 2005 (Figure 2) where the euro per inhabitant in percentage of the EU average ratio was lower than 100% in each PU, IR and PR region averagely. Euro per inhabitant in percentage of the EU average developed most inten-sively in less developed countries the ratio of development was generally the most intensive in PU regions, lower in IR and PR regions. In the economically most developed countries the contribution of the inhabitants to the GDP stag-nated or slightly decreased except in Ireland and Luxemburg where significant increases were realised.
The disposable income of households grew notably in PU, IR and PR regions during the examined time period. The disposable income of households per inhabitant was more than the highest in PU (15010 euro) and IR (11095 euro) regions than in PR (10295 euro) regions in 2006. From the point of view of PR
Pakurár Miklós, O
láh Judit

265inhabitants the tendencies were unfavourable since the differences between the income of PR, IR, and IR areas increased.Disposable income of households in euro per inhabitant increased similarly in PU (13.5%), IR (15.8%) and in PR (15.44%) regions. Generally the for-merly communist Eastern European countries experienced the highest rates of increase in disposable income of households being the most intensive in predominantly urban area of Romania (96.3%). Based on the income of households European countries can be divided into two groups, the group of the EU15 with a relatively high income per inhabitant and mainly the previ-ously communist countries with a moderate income (Figure 3). In spite of the missing countries the difference in disposable incomes are enormous, e.g. the disposable income of households was 9.68 times higher in the IR region of Austria than in the IR regions of Romania.
The economic position of an area calls for different regional policies. In a rela-tively high income society the distance they can afford to travel to work is longer than it is in a low income area. A part time job can be a suitable choice for a mother with young children in a high income region however this solu-tion is not for mothers of a low income area since even the full job does not provide enough income to live on.
0
2000
4000
6000
8000
10000
12000
14000
16000
18000
20000
be bg cz dk de ee ie gr es fr it cy lv lt lu hu mt nl at pl pt ro si sk fi se uk
Euro
per
inha
bita
nt
PUIRPR
Figure 3. Income of households at NUTS level 2, Disposable income, net (uses), Euro per inhabitantSource: Eurostat General and regional statistics
Features of employment-unemployment in different region types
There are many preconditions of employment development. Labour market mobility was greatly related to institutional developments in Great Britain for two decades previous to 2002 nevertheless employment had been increasingly tied to economic development (Hillmert 2002). Studying the regions of the EU to compare the employment of economically advanced and underdevel-oped areas similar conclusion can be drown since prosperous regions have higher employment status than economically stranded areas.
Why do w
e need a more locally focused rural em
ployment policy in the EU
?

266 Falzone (2000) states part time employment as a transition between non-em-ployment and full-time employment or as an alternative to full employment. Part time employment can be a viable solution for married women with young children to build a carrier and to be a devoted family member.
Women’s employment is becoming growingly important the reason is not only to reach the desirable equal work – equal payment idea but there are many practical issues as well that force females to be employed. Holst and Schupp (2001) found that employment of women in Germany has become more impor-tant recently because of more singe-person households and high divorce rates. Even in married-couple households women’s earning is a significant part of the family budget in many German families. It was difficult for women to get a job in the well developed Western regions but the situation was “persistently precarious” for women of economically less developed Eastern regions.
0
20
40
60
80
100
120
140
160
180
200
PU-2000 IR-2000 PR-2000 PU-2005 IR-2005 PR-2005
Empl
oym
ent (
1000
)
Agriculture, hunting, forestry and fishing Industry Services
Figure 4. Total Employment, EU 27, at NUTS levels 3, average of PU, IR and PR regionsSource: Eurostat General and regional statistics
Employment (as average of NUTS3 regions) in agriculture, hunting, forestry and fishing was the lowest in PU regions, more people was employed in IR regions and the higher number of inhabitants was employed in PR regions in the EU (Figure 4). Employment in the industry and services showed an opposite tendency than em-ployment in agriculture, hunting, forestry and fishing since the most people were employed in PU regions and the smallest number of employees worked in PR re-gions. The structure of economic activity was different in an average PU, IR and PR region. Comparing the ratio of employment in services, in agriculture, hunting, forestry and fishing and in industry it was found that the ratio of people employed in services PU or IR regions was significantly higher than it was in PR regions. This huge difference in employment in services suggests that rural people’s access to various services is very limited in comparison with the possibilities of inhabitants in PU and IR areas which is an important disadvantage of the rural life. Enhanced service activities may directly increase the employment and may provide a more attractive situation in rural regions
Pakurár Miklós, O
láh Judit

267One possibility to decrease unemployment in a locality is to use employment services by the individuals of the area. Joassart-Marcelli and Giordano (2006) analysing the unemployment through employment services (One-Stop Career Centers) in Southern California stated that access to employment services de-creased unemployment mainly in areas with limited employment possibilities.
Age, economic disparities and unemployment
An important aspect of regional disparities in unemployment is urban rural differences. Buettner (2007) diagnosed essential regional disparities in unem-ployment for pre-accession and accession EU member countries. However the accession countries had more flexible regional wages and less persistent unemployment disparities which peculiarities enable them a greater adapta-tion to changes.
Youth unemployment rates are generally higher in every region than prime-age unemployment rates therefore a notable part of the potential of the most active group of the workforce is not utilized. Riphahn (2002) studied some features of youth unemployment and established that youth unemployment was centered partly in high unemployment states.
Examining unemployment trends from the point of view of rural develop-ment, a disadvantageous process has been realised recently in many countries. The trends are that the difference in unemployment rates between developed regions and less developed regions have increased, getting lower in developed regions and increasing in less developed regions. Similar tendencies were published, by López-Bazo et al., (2002), establishing that spatial dependence of the distribution of regional unemployment rates increased in Spain in the decade of pre-2002.
Adequate wages for employees’ qualification would be an ideal condition on the labour market. However unemployed people can not have the possibility to ap-ply for a job witch adequate to their qualification and the wage is appropriate to the qualification. Ahn and Gracía-Pérez (2002) found that the willingness to work for reduced wages increases when the duration of unemployment increases and people do not have access to unemployment benefits. Young and less educated unemployed workers are more willing to accept reduced wages.
Unemployment rates was higher in the age group of 15-24 years than in the age groups of 25 years and over in PU, IR and PR regions on EU level in 2000 and in 2006 (Figure 5). Unemployment rate of the age group between 15 and 24 years ranged from 12.9% (PR) to 25.5% (IR) in 2000 that slightly decreased to 2006. Unemployment rates of age group of 25 years and over were notably higher than in the age group of 15-24 years in each region type. Unemployment rate was the lowest in the age group of 15-24 years and the highest in the age group of 25 years and over in predominantly rural areas. The gap between the younger and older age groups was significantly smaller in PR regions than in IR and PU regions.
Why do w
e need a more locally focused rural em
ployment policy in the EU
?
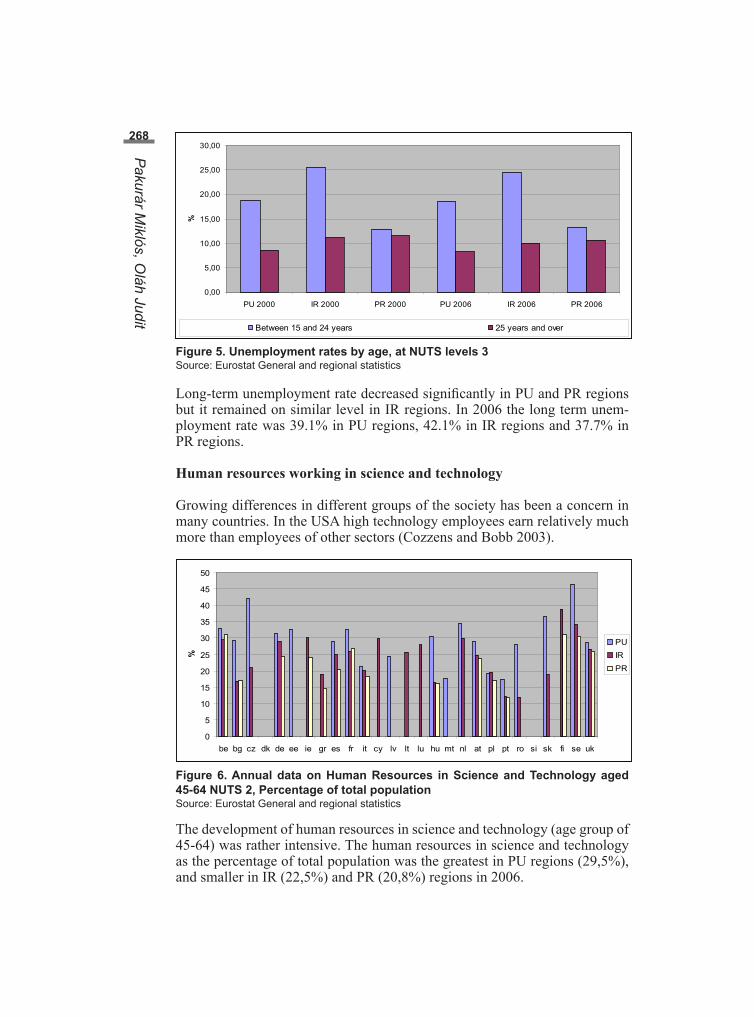
268
0,00
5,00
10,00
15,00
20,00
25,00
30,00
PU 2000 IR 2000 PR 2000 PU 2006 IR 2006 PR 2006
%
Between 15 and 24 years 25 years and over
Figure 5. Unemployment rates by age, at NUTS levels 3Source: Eurostat General and regional statistics
Long-term unemployment rate decreased significantly in PU and PR regions but it remained on similar level in IR regions. In 2006 the long term unem-ployment rate was 39.1% in PU regions, 42.1% in IR regions and 37.7% in PR regions.
Human resources working in science and technology
Growing differences in different groups of the society has been a concern in many countries. In the USA high technology employees earn relatively much more than employees of other sectors (Cozzens and Bobb 2003).
0
5
10
15
20
25
30
35
40
45
50
be bg cz dk de ee ie gr es fr it cy lv lt lu hu mt nl at pl pt ro si sk fi se uk
%
PUIRPR
Figure 6. Annual data on Human Resources in Science and Technology aged 45-64 NUTS 2, Percentage of total populationSource: Eurostat General and regional statistics
The development of human resources in science and technology (age group of 45-64) was rather intensive. The human resources in science and technology as the percentage of total population was the greatest in PU regions (29,5%), and smaller in IR (22,5%) and PR (20,8%) regions in 2006.
Pakurár Miklós, O
láh Judit

269There were notable differences between countries in human resources in sci-ence and technology (HRST) as a percentage of total population (Figure 6). The smallest ratio of 11.9% was found in the PR region of Portugal and high-est of 46.3% in the PU region of Sweden. The rate of HRS was the lowest in PR regions than in PU or IR regions with two exceptions of Belgium and Bulgaria. In former socialist countries, except Poland, PU regions had much more higher rate of HRST than IR and PR regions mainly as a consequence of the centralised economy, they inherited.
Main reasons for a more locally focused rural employment policy in the EU
The main reason that a more focused rural employment policy is needed in the EU is that, as the statistical datada show, the position of rural areas worsened and the differences between rural and urban areas increased which suggests that without a more targeted policy this trend will not change.
Analysing employment and employment related data it was pointed out that indicators of EU localities differs greatly in many instances. Economic indi-cators like GDP and income of households showed great fluctuations from region to region, the income of households was nine times higher in the high-est income NUTS2 IR region than in the lowest income NUTS2 region. Long term unemployment was about seven times higher in a PR region than in an-other PR region on NUTS2 level. Three times more people was in human resources in science and technology as a percentage of total population in the leading PR NUTS2 region than in the lagging PR NUTS2 region.
Some significant proves of deteriorating circumstances in rural areas that af-fect rural employment are as follows:
• The tendency of natural population change increased the disadvanta-geous position of rural areas. The urbanisation process continued and the gap in population density increased between PR and PU regions and between PR and IR regions. The ratio of females became more significant mainly because the longer life expectancy of women.
• Employment had been increasingly tied to economic development and the economically leading regions have higher employment rates than economically disadvantaged regions.
• Women’s employment has become a must even in many economi-cally well developed countries, because of the growing number of single-person households and high divorce rates. Furthermore even in married-couple households women’s earning is a significant part of the family budget.
• Rural people’s access to various services is very limited in compari-son with the possibilities of inhabitants of PU and IR areas which are an important disadvantage of the rural life. The employment increase in the service sector was generally the most intensive increase in PR areas.
Why do w
e need a more locally focused rural em
ployment policy in the EU
?

270 • Total employment generally increased in PU, IR and slightly de-creased in PR regions in the EU from 2000 to 2005. The ratio of em-ployees was the highest in PU regions and the lowest in PR regions in 2000 and also in 2006.
• Further decrease of employment in agriculture, changes the structure of employment in rural areas rapidly. Employment in agriculture, hunt-ing, forestry and fishing decreased greatly in PU, IR and PR regions of the EU the most significant decline happened in PR regions.
• The unemployment gap between rural and urban areas increased since unemployment rates getting lower in developed regions and increas-ing in less developed regions.
• The economy was more developed in urban areas than in rural regions since the GDP euro per inhabitant in percentage of the EU average was the highest in PU regions, less in IR and the lowest in PR regions.
• Comparing the European PU, IR and PR regions the less disposable income of households in euro per inhabitant was earned by the in-habitants of rural population and the relative position of rural regions decreased in the examined period.
• The ratio of human resources in science and technology was the low-est in rural areas. The development of human resources in science and technology was rather intensive.
• Comparing the three region types based on the selected indexes it was found that in the majority of cases PU regions differs more greatly from IR and PR regions than IR regions differ from PR regions which was proved by the results of the analysis.
• The most significant differences between EU-15 and post-socialist NMS were in population density, contribution of inhabitants to the GDP, increase of output in total GVA, productivity of agriculture, and increase in disposable income rate of HRST.
References
Ahn N. and García-Pérez J. I., Unemployment duration and workers‘ wage aspirations in Spain Spanish Economic Review, Volume 4, Number 2 / June, 2002, 103-118.
Buettner T., Unemployment disparities and regional wage flexibility: com-paring EU members and EU-accession countries, Empirica, Volume 34, Number 4 / September, 2007, 287-297.
Cozzens S. E. and Bobb K. Measuring the relationship between high tech-nology development strategies and wage inequality Scientometrics, Volume 58, Number 2 / October, 2003, 351-368.
Deichmann U., Fay M., Koo J. and Lall S. V., Economic structure, productiv-ity, and infrastructure quality in Southern Mexico The Annals of Regional Science, Volume 38, Number 3 / September, 2004, 361-385.
Falzone J. S., Labor market decisions of married women: With emphasis on part-time employment International Advances in Economic Research, Vol-ume 6, Number 4 / November, 2000, 662-671.
Pakurár Miklós, O
láh Judit

271Filc W. and Šehovic K. The US Current Account Deficit: Stocktaking and Remedies Intereconomics, Volume 41, Number 2 / March, 2006, 108-114.
Hillmert S., Deregulation of the labor market and chances of employment in Great Britain , International Advances in Economic Research, Volume 8, Number 1 / February, 2002, 1-9.
Holst E. and Schupp J., Employment Behaviour Among Women in Germany: Differences between East and West Persist Economic Bulletin, Volume 38, Number 11 / November, 2001, 377-384.
Iyigun M., Geography, demography, and early development, Journal of Popu-lation Economics, Volume 18, Number 2 / June, 2005, 301-321.
Joassart-Marcelli P. and Giordano A., Does local access to employment serv-ices reduce unemployment? A GIS analysis of One-Stop Career Centers Policy Sciences, Volume 39, Number 4 / December, 2006 335-359.
Kranendonk H. and Verbruggen J., Decomposition of GDP Growth in Some European Countries and the United States De Economist, Volume 156, Number 3 / September, 2008, 295-306.
López-Bazo E., Del Barrio T. and Artis M., The regional distribution of Span-ish unemployment: A spatial analysis Papers in Regional Science, Volume 81, Number 3 / July, 2002, 365-389.
Lutz W., Testa M. R. and Penn D. J., Population Density is a Key Factor in Declining Human Fertility Population & Environment, Volume 28, Number 2 / November, 2006, 69-81.
Murias P., Martinez F. and De Miguel C., An Economic Wellbeing Index for the Spanish Provinces: A Data Envelopment Analysis Approach Social In-dicators Research, Volume 77, Number 3 / July, 2006, 395-417,
Riphahn R. T., Residential location and youth unemployment: The economic geography of school-to-work transitions Journal of Population Economics, Volume 15, Number 1 / January, 2002, 115-135,
Yla-Anttila P. and Palmberg C., Economic and Industrial Policy Transfor-mations in Finland Journal of Industry, Competition and Trade, Volume 7, Numbers 3-4 / December, 2007, 169-187.
Internet
1. European Employment Strategy http://ec.europa.eu/employment_social/employment_strategy/index_en.htm.
2. Communication from the Commission: Strengthening the implementation of the European Employment Strategy Brussels, 7.4.2004 COM(2004) 239 final, 2004/0082 (CNS).
3. Treaty establishing the European Community (Consolidated version 1997). Official Journal C 340 of 10 November 1997 http://eur-lex.europa.eu/en/treaties/index.htm.
4. Conclusions of the Extraordinary European Council Meeting on Employ-ment (Luxembourg, 20 and 21 November 1997) http://www.ena.lu/con-clusions_extraordinary_european_council_meeting_employment_luxem-bourg_november_1997-020002699.html.
Why do w
e need a more locally focused rural em
ployment policy in the EU
?

272 5. The 1998 Employment Guidelines Council Resolution of 15 December 1997 http://www.google.hu/search?hl=hu&q=Council+Resolution+of+15+December+1997+employment&meta.
6. European Council Lisbon Conclusions of the Presidency 23 and 24 March 2000, Employment, economic reform and social cohesion http://www.eu-roparl.europa.eu/bulletins/pdf/1s2000en.pdf.
7. Presidency Conclusions, Nice European Council Meeting 7, 8 and 9 De-cember 2000 http://ec.europa.eu/employment_social/gender_equality/docs/2000/euro_council_nice_en.pdf.
8. Presidency Conclusions Stockholm European Council 23 and 24 March 2001 http://consilium.europa.eu/ueDocs/cms_Data/docs/pressData/en/ec/00100-r1.%20ann-r1.en1.html.
9. Presidency Conclusions Barcelona European Council 15 and 16 March 2002 http://www.fondazionecrui.it/eracareers/documents/research_poli-cy/Barcelona%20EUCouncil%202002.pdf.
10. Council Resolution of 3 June 2002 on skills and mobility [Official Journal C 162 of 06.07.2002]. http://europa.eu/scadplus/leg/en/cha/c11060.htm.
11. Rural Employment in the context of Rural Development http://www.eu-ropartnersearch.net/agri-policy/.
12. The Impact of CAP Reform on the Employment Levels in Rural Areas http://www.eng.auth.gr/mattas/carera.htm.
13. Determinants of Relative Economic Performance of Rural Areas http://www.defra.gov.uk/rural/pdfs/research/drep/contents_exec_summ.pdf.
14. The Territorial Impact of CAP and Rural Development Policy http://www.espon.eu/mmp/online/website/content/projects/243/277/index_EN.html.
15. Potentials for a Spatial Development under the Aspects of Declinehttp://www.hinterland-info.net/index.php.
16. Strategy for Integrated Development and Rural Areas in CEE Countries http://www.agp.uni-bonn.de/agpo/rsrch/idara/idara_e.htm.
17. The role of small and medium-sized towns in rural development http://ec.europa.eu/research/agriculture/projects/qlrt_2000_01923_en.htm.
18. Rural Employment and Agricultural Perspective in the Balkan Applicant Countries http://www.reapbalk.unian.it.
19. Agriculture and Employment in the rural regions of the EU http://www.lei.wur.nl/uk/zoek.htm?ft=ruremplo&ct=this.
20. Study on Employment in Rural Areas (Study on Employment in Rural Ar-eas (demographic and employment trends - in particular for young people and women - and typologies of rural areas) http://www.sac.ac.uk/research/projects/landeconomy/featured/sera/.
21. Nonprofit organisations and volunteers – motivations of organisational types and those carrying out voluntary activities http://www.ofa.hu/index.php?WG_NODE=WebPalyazatok&CAT=ARCHIVE&WG_OID=.
22. Career conception of students before graduation and short-term tendencies expected on the basis of employment statistics. http://www.ofa.hu/index.php?WG_NODE=WebPalyazatok&CAT=ARCHIVE&WG_OID=.
Pakurár Miklós, O
láh Judit

27323. The transformation of the system of social security in townships. The so-cial consequences of decentralization, local authorities’ survival strategies in terms of dealing with poverty. http://www.ofa.hu/index.php?WG_NODE=WebPalyazatok&CAT=ARCHIVE&WG_OID=.
24. Regional criteria of social economy in Hungary http://www.ofa.hu/index.php?WG_NODE=WebPalyazatok&CAT=ARCHIVE&WG_OID=.
25. The future of Hungarian nonprofit sector in dealing with unemployment in the course of European integration. „Being kept or integrating – the chances of closing up in the European market“. http://www.ofa.hu/index.php?WG_NODE=WebPalyazatok&CAT=ARCHIVE&WG_OID=.
26. Eurostat General and regional statistics http://epp.eurostat.ec.europa.eu/portal/page/portal/statistics/themes.
Why do w
e need a more locally focused rural em
ployment policy in the EU
?
