Linking Electronic Medical Record with National Cardiovascular Data Registry CathPCI Registry for Readmission and Mortality Tracking in a Single Healthcare System Dale Henion, MPS Candidate
Linking Electronic Medical Record with National Cardiovascular Data Registry CathPCI Registry for Readmission and Mortality Tracking in a Single Healthcare System
Dale Henion, MPS Candidate
Solving For Quality
Presenter
Presentation Notes
Quality has moved to the forefront in recent years as healthcare attempts to transition from a fee for service model to a value based model. Clinical registries have been at the center of these efforts, collecting large amounts of data tailored to specific disease processes and patient populations. As large, highly curated data sets, registries are tremendously valuable sources for real world data.
Current/Baseline Process
6 months...
or
Database
Analytics
Presenter
Presentation Notes
This is our current process for registry data. Clinical info is put into the EMR Abstractors take it out of the EMR Enter it into another database That database sends it to the registry body Registry takes a minimum of 6 months to process it Then if we pay them lot they give us access to their database with analytics If not we get data back in report form You may see multiple opportunities for improvement in this process, but the most significant one… 6 months of waiting
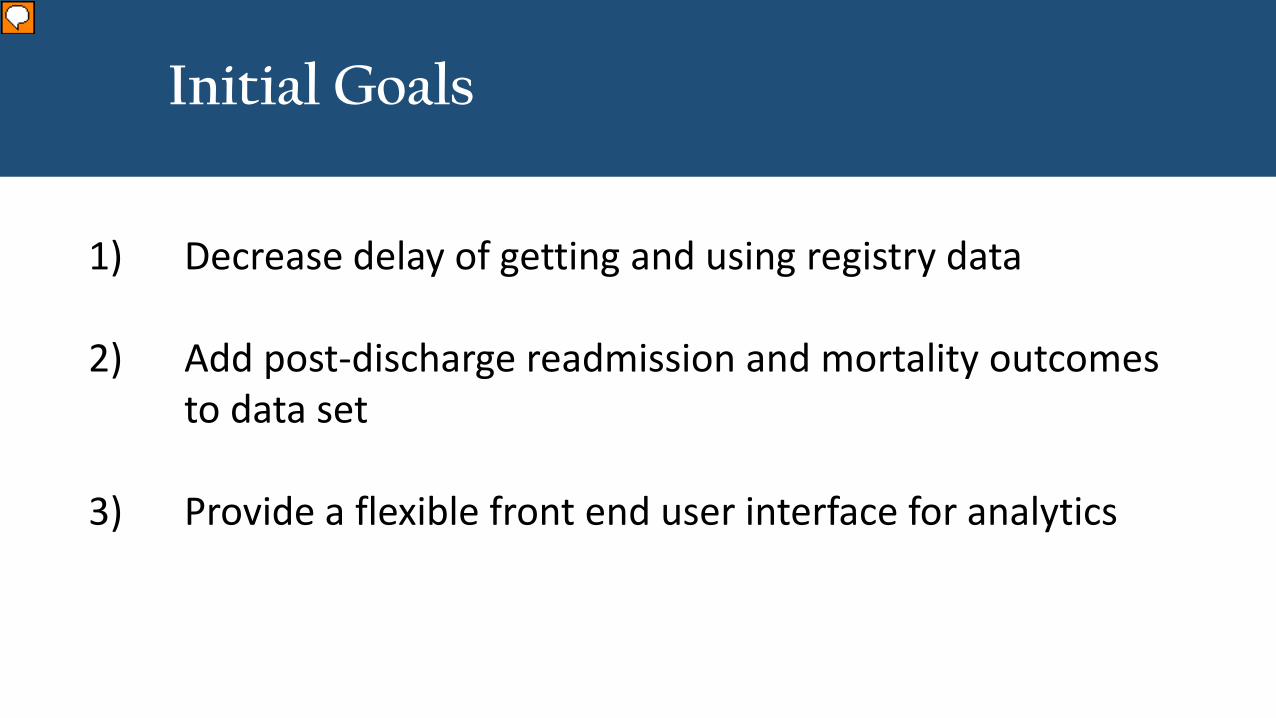
Initial Goals
1) Decrease delay of getting and using registry data
2) Add post-discharge readmission and mortality outcomes to data set
3) Provide a flexible front end user interface for analytics
Presenter
Presentation Notes
This is our current process for registry data. Clinical info is put into the EMR Abstractors take it out of the EMR Enter it into another database That database sends it to the registry body Registry takes a minimum of 6 months to process it Then if we pay them lot they give us access to their database with analytics If not we get data back in report form You may see multiple opportunities for improvement in this process, but the most significant one… 6 months of waiting
CarolinaData
Warehouse
EMR Registry
Real-Time Reports
Solution Model
Analytic Flexibility
Presenter
Presentation Notes
This model shows how UNC is ideally positioned as a healthcare provider to solve these problems. We’ve got the EMR and the Registry both dumping information into our central data repository and can provide real time reporting and analytic interfaces like Tableau and BO to explore correlations and patterns not just from the registry, but also from the rest of the medical record including sociodemographic data, financial data, genetic testing results, etc. Now we’re talking about a tool not only for QI, but a tremendous resource for research as well.
Improved Accessibility
CarolinaData
Warehouse
Registry
EPIC Data - Readmissions
Modified existing tools for CMS reporting
ReadmitQuery
Next Admission
30day
60day
90day
6 mo
1 yr
Account #s from Registry
Mortality Data
MortalityQuery
EPIC Deceased IndicatorEPIC Date of DeathState Death Date
30day
60day
90day
6 mo
1 yr
MRNs from
Registry
Results Summary
Presenter
Presentation Notes
This model shows how UNC is ideally positioned as a healthcare provider to solve these problems. We’ve got the EMR and the Registry both dumping information into our central data repository and can provide real time reporting and analytic interfaces like Tableau and BO to explore correlations and patterns not just from the registry, but also from the rest of the medical record including sociodemographic data, financial data, genetic testing results, etc. Now we’re talking about a tool not only for QI, but a tremendous resource for research as well.
1234
2685 2709 2820 2827
2014 2015 2016 2017 2018
Cases by Year
Date Range: 7/1/14 – 12/31/1812,275 Cases10,245 Patients
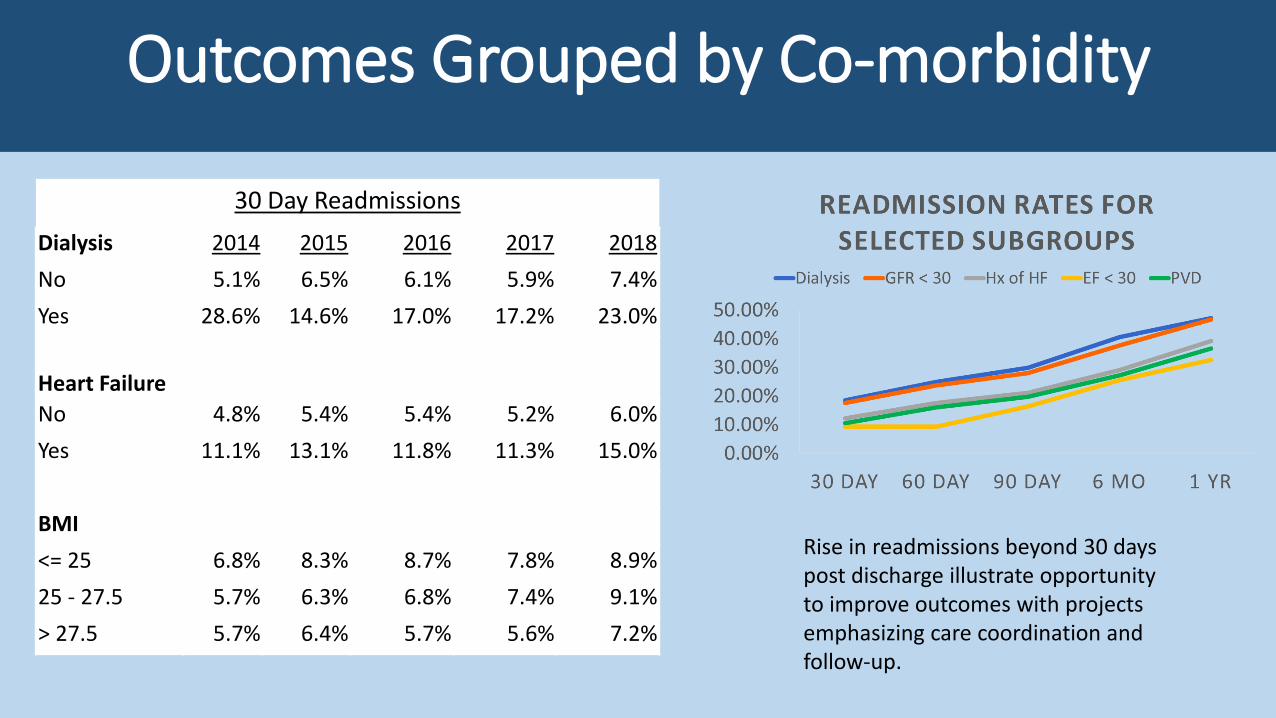
Rise in readmissions beyond 30 days post discharge illustrate opportunity to improve outcomes with projects emphasizing care coordination and follow-up.
Outcomes Dashboards
*Demo Available*
Groups Outcomes Across Many Other
Factors
Advantages and Utilization
1) Data Accessibility• Easy filter selection
operates across all patient level details and group analysis
Yesterday
TodayManual Abstraction
Ad-hoc ISD requests
Click on report filters
Outcome analytics auto-calculated
Presenter
Presentation Notes
Historically, research using real world data involves many hours of manual chart abstraction and multiple requests to ISD for data sets. Today we can accomplish all this with just a few clicks on database filters. Even some of the outcome analysis is embedded to re-calculate automatically.
UNC Cardiology Research & QI Cycle
Data Exploration
IRB Request
NC TraCS Request
Research Folder Request
Project Ideas
Data Export to Research Folder
Statistical AnalysisPI
Revision
Publication
Research implemented as QI
Presenter
Presentation Notes
This cycle is a team based approach we’ve implemented at UNC. Each step is owned by someone on the research committee. The process quickly moves projects along and satisfies all the regulatory compliance for research. It fosters research being implemented as QI, and provides a seamless transition for QI to become publishable as research.
Advantages and Utilization
1) Data Accessibility2) Customize for each QI/research
project… save as (file)… automate run frequency and email recipients
Quality Improvement
Presenter
Presentation Notes
This model shows how UNC is ideally positioned as a healthcare provider to solve these problems. We’ve got the EMR and the Registry both dumping information into our central data repository and can provide real time reporting and analytic interfaces like Tableau and BO to explore correlations and patterns not just from the registry, but also from the rest of the medical record including sociodemographic data, financial data, genetic testing results, etc. Now we’re talking about a tool not only for QI, but a tremendous resource for research as well.
Ongoing Case Level Collection for QI Focus
Monthly QI Dashboard Automated For Display
Project Summary
1) Successfully linked cohort across systems
2) Successfully automated outcome tracking
3) Enabled sub-group outcome analysis
4) Built a valuable asset for research and quality
improvement
Registry
Research
QualityImprovement
Learning HealthcareSystem
Registry
Research
QualityImprovement
Acknowledgements
Dr. Joseph Rossi
Dr. Matthew Cavender
Jennifer Lukes, Director of Cariology
Jenna Kiloran, Qual/Org Executive Analyst
Shaun McDonald, ISD
Questions?
Presenter
Presentation Notes
This model shows how UNC is ideally positioned as a healthcare provider to solve these problems. We’ve got the EMR and the Registry both dumping information into our central data repository and can provide real time reporting and analytic interfaces like Tableau and BO to explore correlations and patterns not just from the registry, but also from the rest of the medical record including sociodemographic data, financial data, genetic testing results, etc. Now we’re talking about a tool not only for QI, but a tremendous resource for research as well.