linking predators to seasonality of upwelling: using food
TRANSCRIPT

Progress in Oceanography 101 (2012) 106–120
Contents lists available at SciVerse ScienceDirect
Progress in Oceanography
journal homepage: www.elsevier .com/locate /pocean
Linking predators to seasonality of upwelling: Using food web indicatorsand path analysis to infer trophic connections
Sarah Ann Thompson a,⇑, William J. Sydeman a, Jarrod A. Santora a, Bryan A. Black b, Robert M. Suryan b,John Calambokidis c, William T. Peterson d, Steven J. Bograd e
a Farallon Institute for Advanced Ecosystem Research, P.O. Box 750756, Petaluma, CA 94952, USAb Oregon State University, Hatfield Marine Science Center, 2030 Marine Science Drive, Newport, OR 97365, USAc Cascadia Research, 218 1/2 W 4th Ave., Olympia, WA 98501, USAd NOAA National Marine Fisheries Service, Northwest Fisheries Science Center, Hatfield Marine Science Center, 2030 Marine Science Drive, Newport, OR 97365, USAe NOAA National Marine Fisheries Service, Southwest Fisheries Science Center, Environmental Research Division, 1352 Lighthouse Drive, Pacific Grove, CA 93950, USA
a r t i c l e i n f o
Article history:Received 5 April 2011Received in revised form 13 February 2012Accepted 14 February 2012Available online 1 March 2012
0079-6611/$ - see front matter � 2012 Elsevier Ltd. Ahttp://dx.doi.org/10.1016/j.pocean.2012.02.001
⇑ Corresponding author. Tel.: +1 707 981 8033.E-mail address: [email protected]
a b s t r a c t
Upwelling in eastern boundary current systems is a primary driver of ecosystem productivity. Typically,peak upwelling occurs during spring and summer, but winter upwelling may also be important to eco-system functions. In this study, we investigated the hypothesis that winter and spring/summer upwell-ing, operating through indirect trophic interactions, are important to a suite of top predators in theCalifornia Current. To test this hypothesis, we collated information on upwelling, chlorophyll-a concen-trations, zooplankton and forage fish, and related these to predator responses including rockfish growth,salmon abundance, seabird productivity and phenology (timing of egg-laying), and whale abundance.Seabird diets served in part as food web indicators. We modeled pathways of response using path anal-ysis and tested for significance of the dominant paths with multiple regression. We found support for thehypothesis that relationships between upwelling and top predator variables were mediated primarily byintermediate trophic levels. Both winter and summer upwelling were important in path models, as wereintermediate lower and mid trophic level functional groups represented by chlorophyll-a, zooplankton,and forage fish. Significant pathways of response explained from 50% to 80% of the variation of seabird(Cassin’s auklet (Ptychoramphus aleuticus) and common murre (Uria aalge)), humpback whale (Megapteranovaeangliae) and Chinook salmon (Oncorhynchus tshawytscha) dependent variables, whereas splitnoserockfish (Sebastes diploproa) showed no significant response pathways. Upwelling and trophic responsesfor salmon were established for both the year of ocean entry and the year of return, with zooplanktonimportant in the year of ocean entry and forage fish important in the year of return. This study providesone of the first comparative investigations between upwelling and predators, from fish to marine mam-mals and birds within a geographically restricted area, demonstrates often difficult to establish ‘‘bottom-up’’ trophic interactions, and establishes the importance of seasonality of upwelling to various trophicconnections and predator demographic traits. Understanding change in the seasonality of upwelling istherefore required to assess dynamics of commercially and recreationally important upper trophic levelspecies in eastern boundary current ecosystems.
� 2012 Elsevier Ltd. All rights reserved.
1. Introduction
Eastern boundary current ecosystems cover approximately 1%of the ocean surface yet contribute disproportionately to theworld’s fisheries catch (�20%) and support vast populations ofmarine wildlife including fish, seabirds, mammals, and turtles(Cushing, 1971; Pauly and Christensen, 1995). Productivity in thesemid-latitude systems is supported by seasonal changes in sunlightand advective nutrient input from coastal and offshore upwelling(Mann and Lazier, 1996; Jahncke et al., 2004; Rykaczewski and
ll rights reserved.
(S.A. Thompson).
Checkley, 2008). At the base of the food chain, phytoplankton re-spond to upwelling-forced nutrient input by increasing growthand reproduction, with primary production increased when phyto-plankton are retained in the photic layer (Kiørboe, 1993; Huete-Ortega et al., 2011). Primary production and fish production aretightly coupled and mediated by zooplankton (Cury et al., 2000;Ware and Thomson, 2005). Finally, it is thought that upper trophiclevel species are controlled by a balance of these ‘‘bottom-up’’ tro-phic effects and other biological interactions, such as predation andcompetition, which may exert ‘‘top-down’’ control on the mid-tro-phic levels of food webs (Cury et al., 2000; Suryan et al., 2006; Mill-er et al., 2010). Top-down and bottom-up processes may dominatein different ocean regions (Frank et al., 2006, 2007) or between

S.A. Thompson et al. / Progress in Oceanography 101 (2012) 106–120 107
years or decades within the same ecosystem (Hunt et al., 2002; Lit-zow and Ciannelli, 2007).
In the California Current, upwelling is a complex process withkey centers of activity at specific locations, often near coastal head-lands (Hickey, 1979; Checkley and Barth, 2009; Garcia-Reyes andLargier, 2012). Upwelling occurs with pulses of northwesterlywinds that last for a few days to about 2 weeks and are inter-spersed with periods of calm or ‘‘relaxation’’ events (Largieret al., 2006). Phytoplankton responses generally lag upwelling by�4–8 days (Dugdale and Wilkerson, 1989; Service et al., 1998;Dugdale et al., 2006), while changes in zooplankton biomass lagprimary productivity by weeks to months, depending on species,water temperature and other hydrographic characteristics (Hay-ward and Venrick, 1998). Phytoplankton and zooplankton re-sponses also depend on the seasonality of upwelling events. Thephenology (i.e., annual timing) of upwelling depends on latitude,with earlier initiation and peaks at southerly latitudes (Bogradet al., 2009). South of �40�N (Cape Mendocino, California), averagemonthly upwelling values are positive in most months, though lessintense in winter than in spring and summer. For example, upwell-ing at 39�N starts in January/February and peaks in May/June eachyear. North of �40�N, mean monthly upwelling values in winterare largely negative, i.e., reflective of southerly (poleward) windsand downwelling; in this region upwelling peaks later in the year,often in July/August.
Bottom-up processes are thought to dominate food web inter-actions in the California Current (Ware and Thomson, 2005). Whilea considerable body of literature exists on the effects of upwellingon upper trophic level predators, rarely has the seasonality ofupwelling been coupled with varying pathways of response andexamined in a systematic fashion for multiple top predators. Onekey reason for this is that difficulties arise in measuring upwelling,phytoplankton concentrations, zooplankton, forage fish and uppertrophic level predator responses on appropriate temporal and spa-tial scales (Croll et al., 1998, 2005). For example, previously in theCalifornia Current, relationships have been established betweenupwelling and the diet composition and reproductive success ofseabirds (e.g., Miller and Sydeman, 2004; Schroeder et al., 2009),but these studies have lacked a clear understanding of intermedi-ate trophic steps. Another difficulty is study length; Jahncke et al.(2008) summarized upwelling, chlorophyll-a, zooplankton prey(krill), and responses of seabird predators, but this study was lim-ited to 2 years which provided only a limited snapshot of upwell-ing and trophic interaction variability. Lastly, despite the factthat pulses of upwelling often begin in January or February eachyear (Bograd et al., 2009; Garcia-Reyes and Largier, 2012) and aseries of recent investigations have shown the importance of earlyseason upwelling (Logerwell et al., 2003; Abraham and Sydeman,2004, 2006; Bograd et al., 2009; Schroeder et al., 2009; Blacket al., 2010, 2011), winter upwelling is often neglected. Mechanis-tically, winter winds may result in effective upwelling if the oceanis less stratified during that time of year resulting in isopycnalshoaling even if winds are weaker (Schroeder et al., 2009). Therealso is growing evidence suggesting that winter and spring/sum-mer upwelling influence species differently; some species re-sponses relate to winter upwelling while others relate mostly tothe summer mode (Black et al., 2011).
Some of the earliest, strongest and most variable winds andupwelling in California are found between 36�N (Monterey Bay)and 39�N (Point Arena), which we refer to as the Gulf of the Farall-ones (GoF) region. We focus on the GoF for this study as it is wellknown for high ecosystem productivity and supports substantialfisheries and wildlife populations. Our overarching hypothesis isthat predator productivity and population variation in the GoF isaffected by seasonal variation in upwelling indirectly throughintermediate trophic levels represented by chlorophyll-a, zoo-
plankton, and forage fish biomass. To address this hypothesis weanalyzed seasonal variation in upwelling and direct and indirectpathways of response for a suite of predators including fish, sea-birds, and marine mammals. Based on the study by Black et al.(2011), we predicted that pathways of response from seasonalupwelling to predators would vary, with some species respondingmore to winter upwelling and others to summer upwelling. Like-wise, we expected some would respond more strongly to variabil-ity in zooplankton biomass, and others to forage fish. Additionally,we investigated whether seabirds responded similarly to the sea-sonality of upwelling by examining different response variables(i.e., timing of reproduction and reproductive success). To testour hypothesis and predictions, we first developed conceptualmodels from upwelling through lower and mid trophic levels tothe growth of rockfish, abundance of whales and salmon, and phe-nology and reproductive success of seabirds. This study is impor-tant as climate change is predicted to affect the amplitude(intensity) and phasing (timing) of upwelling (Bakun, 1990; Snyderet al., 2003; Bakun et al., 2010). Observations have already linkedclimate change to proxies of upwelling intensification in the GoFregion including increasing wind stress and decreasing ocean tem-peratures (Garcia-Reyes and Largier, 2010). Upwelling timing hasalso become more variable (Schwing et al., 2006), with substantialecosystem consequences (Brodeur et al., 2006; Sydeman et al.,2006). Some climatic changes and environmental response vari-ables such as temperature may directly affect species at all trophiclevels while others generally influence only higher trophic levelsand mostly indirectly (Moloney et al., 2011), but these impactsare not well known. Therefore, it is both critical and timely toinvestigate the seasonality of upwelling, trophic connections, andpredator responses in a comprehensive manner, as we present inthis study.
2. Methods
We integrated and modeled data available from a variety ofsources. The data sets (Table 1) include estimates of (1) winterand spring/summer upwelling (based on Black et al. (2011), see be-low for details), (2) chlorophyll-a concentrations, (3) mesozoo-plankton (copepod and krill) abundance and communitystructure, (4) forage fish (juvenile rockfish Sebastes spp.) abun-dance, (5) splitnose rockfish (Sebastes diploproa) otolith growth,(6) seabird (Cassin’s auklet, Ptychoramphus aleuticus; commonmurre, Uria aalge) timing of breeding and reproductive success,(7) Chinook salmon (Oncorhynchus tshawytscha) abundance, and(8) humpback whale (Megaptera novaeangliae) abundance. We se-lected these species and variables as they characterize vital parts ofthe epipelagic food web in the region, encompassing speciesresponsible for key trophic interactions and representing a diversesuite of top predators for the outer continental shelf ecosystem ofthe north-central California Current. Due to challenging datarequirements for this investigation, including monthly-resolvedupwelling data and annualized data on chlorophyll-a, zooplankton,forage fish, and predators, our study was limited to 10 years, 1997through 2006.
2.1. Predictor variables
2.1.1. UpwellingThe Bakun upwelling index (m3/s/100 m coastline) is calculated
by NOAA’s Pacific Fisheries Environmental Laboratory. Data weredownloaded from ftp://orpheus.pfeg.noaa.gov/outgoing/upwell/monthly/upindex.mon. Monthly values for upwelling at 36�N,122�W and 39�N, 125�W were used in this study. Data treatmentis described below.

Table 1Data sets used in the path analyses. Upwelling was the independent variable, and seasonal modes were produced using Empirical Orthogonal Function (EOF) analysis for twosites. Chlorophyll-a concentrations for two sites were combined using EOF analysis for the lowest intermediate trophic level, as were copepods and euphausiids for a zooplanktontrophic level. The third intermediate level included in path models for piscivore predator species was forage fish, represented by juvenile rockfish abundance. Predator responsevariables included rockfish growth, humpback whale abundance, reproductive success and phenology for two seabird species (Cassin’s auklet and common murre), and Chinooksalmon abundance in the year of ocean entry and year of return for two populations.
Variable/species Location Parameters Sampling/summary time scales
Upwelling 36�N and 39�N Bakun Upwelling Index m3/s/100 m coastline Hourly/MonthlyChlorophyll Bodega Bay SeaWiFS Chl-a (9 � 9 km) mg/m3 Daily/Monthly
Farallon Islands Daily/MonthlyCopepods Central Oregon Copepod Biomass mg C/m3 Bi-weekly/Annual
Northern Copepod Index Bi-weekly/AnnualEuphausiids Thysanoessa spinifera Gulf of Farallones Abundance % wet mass (g) Weekly/AnnualRockfish Sebastes spp. Central California Growth of Splitnose Rockfish S. diploproa Annual
Juvenile Rockfish Abundance Daily/AnnualHumpback whale Megaptera novaeangliae California Abundance AnnualCassin’s auklet Ptychoramphus aleuticus Gulf of Farallones Reproductive Success Mean chicks/pair Annual
Phenology Mean egg laying date Weekly/AnnualCommon murre Uria aalge Gulf of Farallones Reproductive Success Mean chicks/pair Annual
Phenology Mean egg laying date Daily/AnnualChinook salmon Oncorhynchus tshawytscha Sacramento River Abundance Annual
Russian River
108 S.A. Thompson et al. / Progress in Oceanography 101 (2012) 106–120
2.1.2. ChlorophyllSatellite remotely-sensed chlorophyll-a concentrations (mg/m3)
were obtained from the Sea-viewing Wide Field-of-View Sensor(SeaWiFS; http://oceancolor.gsfc.nasa.gov/SeaWiFS/). Monthly le-vel-3 mapped 9-km resolution data were obtained. We assessedchanges in chlorophyll-a concentrations for two sites in the region,around the Farallon Islands (37.708�N, 123.125�W) and the BodegaBay NOAA buoy (Station 46013, 38.208�N, 123.375�W). For eachlocation, we averaged the values for four adjacent 9-km � 9-kmcells (pixels), thereby providing chlorophyll-a concentrations for324 km2 of ocean habitat at each site. The four cells were one withcoordinates closest to the location and the adjacent cells directly tothe east, southeast, and south of the first. Chlorophyll-a concentra-tions from both sites were averaged together and temporally toproduce a single annual estimate for inclusion in the path analyses.
2.1.3. ZooplanktonData for copepods included two measures of biomass (mg C/
m3): total copepod biomass and the ‘‘Northern Copepod Index’’(NCI). Data were obtained from field surveys off central Oregon(Newport Hydrographic Line, 44.65�N, Hooff and Peterson, 2006).Copepods were collected using a 0.5-m, 0.202-mm plankton netand were sampled bi-weekly during the months of May–Septem-ber; the bi-weekly data were averaged to produce monthly values.The biomass anomalies of three species from neritic sub-arcticwaters, Pseudocalanus mimus, Acartia longiremis, and Calanus mar-shallae, were averaged to produce the NCI. This data set representsthe longest-running and most comprehensive copepod samplingprogram for the central-northern California Current, and thoughit is located �800 km to the north of our general study area,numerous relationships have established these copepod indicesas important for GoF predators (Sydeman and Thompson, 2010;Sydeman et al., 2011; Sydeman, Peterson and Black, unpublisheddata).
We estimated krill (Thysanoessa spinifera) availability based onthe diet composition of Cassin’s auklet food samples (average ofdaily samples, percent wet mass (g) comprised of adult and juve-nile T. spinifera relative to other prey species). Field and laboratorymethods for auklet diet sampling are described by Abraham andSydeman (2006). Briefly, provisioning adult auklets capture preyat sea and bring undigested food to chicks at the colony once perday. Provisioning adults were caught at the Southeast Farallon Is-land colony (37�420N, 123�000W) and the contents of the pouchwere gently massaged into glass vials or plastic whirlpak bags. Prey
items were identified, enumerated and weighed by M. Galbraith atthe Institute of Ocean Sciences (Sidney, British Columbia). Over theyears 2002–2006, T. spinifera in the auklet diet was positively re-lated to T. spinifera measured in the Gulf of the Farallones (Spear-man rank correlation: rho = 0.975, p = 0.0048). We used theseabird diet as a proxy for T. spinifera availability as this time serieswas longer than other available measurements.
2.1.4. Forage fishThe availability of juvenile rockfish (Sebastes spp.) was similarly
indexed by the diet of a seabird, the common murre. Field methodsfor murre diet sampling are described by Mills et al. (2007). Juve-nile rockfish abundance is expressed as the average proportion ofidentified prey species captured by murres and delivered to off-spring at nest sites on Southeast Farallon Island (proportion = juve-nile rockfish/total number of forage fish identified). Mills et al.(2007) and Sydeman et al. (2009) show that the proportion of juve-nile rockfish in the murre chick diet indicates relative abundance ofjuvenile rockfish in the environment as measured by mid-watertrawls (r2 = 0.81). We use seabird diet as a proxy for juvenile rock-fish availability as this approach (i.e., using seabird diet) matchesthe approach used to index the euphausiid T. spinifera.
2.2. Response variables
2.2.1. Splitnose rockfish growthMethods for generating splitnose rockfish growth chronology
are detailed by Black et al., (2008). Briefly, rockfish were obtainedby research and commercial fishing vessels between 35 and 39�N.Otoliths were extracted from the fish, embedded in resin, thin-sec-tioned along a dorsal–ventral axis perpendicular to the sulcus,mounted on a glass slide, and polished. The dendrochronologytechnique of crossdating was applied to ensure that all growthincrements had been correctly identified and assigned the correctcalendar year of formation. Next, otolith increment widths weremeasured from the margin to the focus, though the first few (3–5) years of growth were excluded given that young fish may havedifferent habitat and food requirements than adults. Measurementtime series were detrended with negative exponential functions toremove age-related growth declines then averaged with respect tothe calendar year to produce the growth-increment chronology.Splitnose rockfish are predators of a wide variety of prey includingeuphausiids, copepods and other crustaceans (Brodeur and Pearcy,1984).

Year1940 1950 1960 1970 1980 1990 2000 2010
Upw
ellin
g EO
F1 (S
umm
er)
-4
-2
0
2
4
6
Year1940 1950 1960 1970 1980 1990 2000 2010
Upw
ellin
g EO
F2 (W
inte
r)
-4
-2
0
2
4
6
8(b)
(a)
Fig. 1. (a) EOF (spring/summer) and (b) EOF (winter) of upwelling index at 36�N,122�W and 39�N, 125�W. Dashed lines indicate 1 standard deviation. See AppendixA1 for month-latitude loadings.
S.A. Thompson et al. / Progress in Oceanography 101 (2012) 106–120 109
2.2.2. Cassin’s auklet and common murre reproductive success andtiming of breeding
Reproductive success and phenology data for seabirds were col-lected at Southeast Farallon Island by PRBO Conservation Scienceunder contract with the U.S. Fish and Wildlife Service/Farallon Na-tional Wildlife Refuge. Methods to determine reproductive successand timing of breeding (mean egg laying date) are provided by Ain-ley et al. (1995) and Sydeman et al. (2001, 2009). In short, a sampleof focal breeding pairs was monitored throughout each nestingseason. Individual nest sites were studied at 1–7 day intervals. Cas-sin’s auklets are planktivorous and prey include euphausiids(Manuwal, 1974), mysids and copepods (Sydeman et al., 2001),though Abraham and Sydeman (2004) report that two species ofeuphausiid (Euphausia pacifica and T. spinifera) comprise about80% of auklets’ diets. Murres are piscivorous and their diets largelycontain juvenile rockfish, anchovies, squid and smelt (Baltz andMorejohn, 1977; Croll, 1990; Scott, 1990; Roth et al., 2008).
2.2.3. Chinook salmon abundanceThe ‘Sacramento Index’ for Chinook salmon, calculated by the
Pacific Fisheries Management Council, is the sum of ocean harvestsouth of Cape Falcon, Oregon, recreational harvest in the Sacra-mento River, and adult spawner escapement to the SacramentoRiver (O’Farrell et al., 2009). Chinook returns to the Russian Riverwere monitored by the Sonoma County Water Agency. Adult Chi-nook were observed and counted by videotape as they returnedupstream and passed over fish ladders (fish/year). We analyzedthe Sacramento Index and the Russian River returned adult abun-dances, and lagged abundance data 2 years to test for the effect ofocean conditions on these populations during their year of oceanentry. Chinook have a varied diet and major prey groups includeeuphausiids, anchovy, herring and rockfish (Brodeur and Pearcy,1992).
2.2.4. Humpback whale abundanceWe used estimates of humpback whale abundance (individuals/
year) from mark-recapture analysis of individually known whalesoff California and Oregon. Whales were identified using photo-graphic surveys (Calambokidis, 2009). Estimates of abundancewere based on the two-sample Petersen capture–recapture meth-od. As for other baleen whales, krill are a primary prey (Crollet al., 2005), but humpback whales also consume forage fish (Wit-teveen et al., 2011), including juvenile rockfish (Kieckhefer, 1992).
2.3. Data treatment
We calculated anomaly statistics for all variables except hump-back whale abundance. Anomalies were calculated by subtractinglong-term monthly or annual mean values from monthly or annualvalues. All data sets fit the assumption of normal distribution ofresiduals with the exception of humpback whale abundance. Tomeet this requirement, estimates of humpback whale abundancewere de-trended to remove the strong trend of increasing abun-dance, and we used the residuals for our analyses. Based in parton the analysis described by Black et al. (2011; though our studyaddressed only two upwelling locations compared to their five),we used Empirical Orthogonal Function (EOF) analysis to describethe dominant modes of seasonality in upwelling. From monthlyupwelling anomalies we found two interpretable EOFs that proxywinter (EOF2upwelling) and summer (EOF1upwelling) upwelling(Fig. 1, details of results are explained below). We also conductedan EOF analysis for the period 1997–2006 on the three zooplanktonvariables NCI, anomalies of overall copepod biomass and T. spinif-era abundance. An average for May–September was calculatedfor both copepod data sets prior to the EOF analysis. The resultingfirst EOF (EOF1zooplankton) was used in the path analysis. All vari-
ables were represented with annual data values for the path anal-ysis, with the driver variable being either winter (EOF2upwelling) orsummer (EOF1upwelling) upwelling.
2.4. Pathways of response
Structured models with multiple intermediate trophic levels(phytoplankton, zooplankton and forage fish) to test effects of adriver variable (seasonal upwelling) on a predator’s response aresuitably quantified with path analysis because of its capacity toanalyze systems with multiple causality (Petraitis et al., 1996). LikeWells et al. (2008), we tested conceptual models of pathways of re-sponse by path analysis and multiple regression. Path models weredetermined a priori, but unlike Wells et al. (2008), who tested theeffect of eight environmental variables, our analyses were con-ducted with upwelling as the sole exogenous variable in all mod-els. In our models, multiple causality is the possible paths of theeffect of upwelling on predator response. Models for planktivoreresponse variables (rockfish growth and auklet phenology andreproductive success) included chlorophyll-a concentration andzooplankton as intermediate variables. Models for piscivore re-sponse variables (whale abundance, salmon abundance and murrephenology and reproductive success) included chlorophyll-a con-centration, zooplankton and juvenile rockfish abundance as inter-mediate variables.
Using EOF1upwelling and EOF2upwelling, path analyses were runseparately for spring/summer and winter upwelling, respectively.Path analyses were run using the program Stata (v.8) and thecommand pathreg. With this command, multiple conceptual

110 S.A. Thompson et al. / Progress in Oceanography 101 (2012) 106–120
models can be run simultaneously. Each model tests the correla-tions of all variables in a given path. On constructed pathdiagrams, each segment of the path was labeled with its corre-sponding ‘‘beta’’ (standardized regression) coefficient. Once dia-grams were complete, direct and indirect effects werecalculated. The direct effect is the beta coefficient betweenupwelling and the response variable. Indirect effects were calcu-lated as the product of all beta coefficients in a given path; thetotal indirect effect for each model is then the sum of all indirecteffects (Mitchell, 2001). We determined the dominant path by
Fig. 2. Path diagrams for seasonal upwelling and splitnose rockfish growth. For all pathdominant path is shown in bold.
Fig. 3. Path diagrams for seasonal upwelling and Cassin’s
comparing the total indirect effect to the direct effect; the largervalue indicated the dominant path. If the dominant pathway ofresponse was indirect, then the indirect path was specified asthe one with the highest effect value.
To determine statistical significance, path analysis was coupledwith regression analyses (Petraitis et al., 1996). We conductedmultiple regression analyses on variables in the identifieddominant paths in the path analysis. Owing to the relatively smallsample size, models were considered significant at p < 0.1 (for ajustification of this approach see Grosbois et al., 2008).
Figs. 2–7, beta coefficients are shown along their respective path segments and the
Auklet (a) phenology and (b) reproductive success.

S.A. Thompson et al. / Progress in Oceanography 101 (2012) 106–120 111
3. Results
3.1. Seasonal modes of upwelling and lower trophic level response
The first EOF of upwelling explained 23.2% of the variance andloaded heavily on the months of April–August for both 36�N and39�N (Fig. 1, Appendix A1). The second EOF of upwelling explained�15% of the variance and loaded heavily on December–March forboth locations. Over the study period, EOF1 (hereafter interpretedas ‘‘summer upwelling’’) was well above one standard deviation ofthe mean in 1999 and again from 2001 to 2003, whereas weakerspring/summer upwelling was found from 2004 to 2008 and in1997–1998. EOF2 (hereafter ‘‘winter upwelling’’) was anomalouslyhigh in 2007–2008. For zooplankton, the first EOF explained 64.1%
Fig. 4. Path diagrams for seasonal upwelling and commo
of the variation, and loaded approximately twice as heavily on eachof the copepod measurements than krill abundance (Appendix A2).
3.2. Pathways of response for top predators
Path analysis diagrams are shown in Figs. 2–7, with the calcu-lated dominant pathways of response shown in bold; the effectvalue for each direct and total indirect path is given in Table 2.Growth of splitnose rockfish was directly affected by winter andsummer upwelling, with winter dominant (larger beta coefficient,Fig. 2). Cassin’s auklet phenology (timing of egg-laying) was indi-rectly affected by winter upwelling via zooplankton, and indirectlyaffected by summer upwelling through chlorophyll-a (Fig. 3a).Cassin’s auklet reproductive success was directly affected by
n murre (a) phenology and (b) reproductive success.

112 S.A. Thompson et al. / Progress in Oceanography 101 (2012) 106–120
winter upwelling, whereas there was an indirect effect of summerupwelling through chlorophyll-a (Fig. 3b). As was seen for the auk-let, common murre phenology was indirectly affected by winterupwelling through zooplankton. The path from summer upwellingwas indirect through chlorophyll-a and zooplankton (Fig. 4a).Murre reproductive success was directly affected by winterupwelling, while the path from summer upwelling worked throughzooplankton (Fig. 4b). Humpback whale abundance was indirectlyaffected by summer upwelling with the intermediate step of foragefish (juvenile rockfish) and directly affected by winter upwelling(Fig. 5).
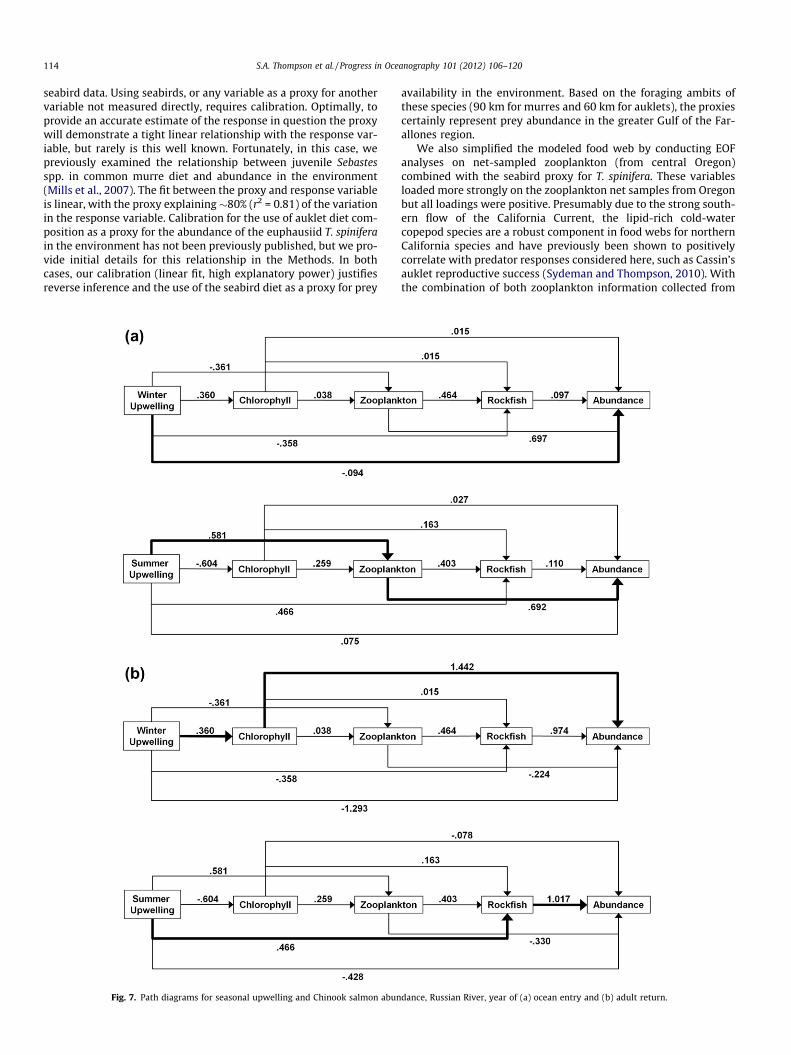
For salmon, we modeled abundance against upwelling andintermediate trophic levels by investigating conditions during boththe year of [ocean] entry (YoE) and the year of return (YoR). For theSacramento River Chinook, we found dominant direct paths fromwinter upwelling in both YoE and YoR, and indirect paths via chlo-rophyll-a and forage fish for summer upwelling in YoE and YoR,respectively (Fig. 6a and b). For the Russian River Chinook in theYoE, there was an indirect path of effect of summer upwellingthrough zooplankton and a dominant path of effect of winterupwelling (Fig. 7a). For Russian River Chinook in the YoR, indirectpaths for both winter and summer upwelling were found; the pathfrom winter upwelling operated through chlorophyll-a whereasthe path from summer upwelling was through rockfish (Fig. 7b).In summary, we found eight direct paths of response, seven forwinter and one for summer, and 12 indirect paths, three for winterand nine for summer. The 12 indirect pathways of response in-cluded five models with chlorophyll-a as an intermediate step, fivemodels with zooplankton, and three models with forage fish.
Results of the regression analyses are shown in Table 3. Split-nose rockfish growth did not relate significantly to either winteror summer upwelling or any intermediate trophic levels. Hump-back whale abundance showed a significant indirect relationshipwith summer upwelling through rockfish. For both seabirds, timingof breeding showed significant indirect inverse relationships withwinter upwelling through zooplankton (Fig. 8a and b), indicatingearlier egg-laying dates with more winter upwelling and zooplank-ton. The Cassin’s auklet phenology model for summer includedchlorophyll-a as well as upwelling as significant components, andthese relationships were negative (Fig. 8c). The model for common
Fig. 5. Path diagrams for seasonal upwell
murre phenology and summer upwelling was also negative(Fig. 8d). Notably, this is the only model that included more thanone intermediate variable (chlorophyll-a and zooplankton), butour results showed that zooplankton was significant whereas chlo-rophyll-a was not. Reproductive success of Cassin’s auklet had asignificant relationship with summer upwelling through chloro-phyll-a, but unexpectedly chlorophyll-a itself was not related toauklet breeding success. Last, reproductive success of commonmurre showed no significance with winter upwelling, but demon-strated a significant indirect positive relationship with zooplank-ton and summer upwelling (Fig. 8e).
Sacramento River Chinook were not significantly related to win-ter upwelling in either YoE or YoR, but demonstrated significantindirect relationships with summer upwelling through rockfish(YoR) and chlorophyll-a (YoE). Notably, the relationship with sum-mer upwelling and rockfish was positive (Fig. 9a), while the rela-tionship with chlorophyll-a was negative (similar to that ofauklet reproductive success). Russian River Chinook were unre-lated to winter upwelling in both YoE and YoR, but had a signifi-cant indirect positive relationship with summer upwellingthrough zooplankton in the YoE (Fig. 9b). Although rockfish andchlorophyll-a were indirect components in the YoR models (sum-mer and winter, respectively), they were not significant.
4. Discussion
To address our primary hypothesis of indirect effects fromupwelling to predators, we examined a variety of response vari-ables (growth, timing, productivity and abundance) across adiverse selection of taxa, including fish (rockfish and salmon), sea-birds (auklets and murres), and mammals (humpback whales). Thevariety of predators and response variables examined makes thisstudy unique with respect to physical–biological coupling andpredator–prey interactions in the California Current, and upwellingecosystems more generally (Cury and Shannon, 2004; Jahnckeet al., 2004; Chavez and Messie, 2009). By decomposing the vari-ance of the upwelling index using EOF analysis, we identified dis-tinct upwelling modes attributable to seasons (see also Black et al.,2011). Subsequently, to infer and compare trophic relationships,we used path analysis and multiple regression to link winter and
ing and humpback whale abundance.

S.A. Thompson et al. / Progress in Oceanography 101 (2012) 106–120 113
summer modes of upwelling with predator responses. While theliterature provides numerous examples of bottom-up forcing inpredator species (see Ware and Thomson (2005) and referencestherein), here we provide a novel perspective for a predator com-munity within the Gulf of the Farallones (GoF). To our knowledge,this is the first empirical study to investigate and compare bottom-up interactions for fish, birds, and mammals in a unified manner,facilitating generalizations about the relationships betweenupwelling and consumers in eastern boundary current systems.Moreover, by creating and analyzing seasonal modes of upwelling,we expanded upon the work of Wells et al. (2008) who focused onthree species of seabirds and spring and summer upwelling peri-ods, and Black et al., (2011) who linked seasonal variation inupwelling to a suite of predator responses, but without the inter-mediate trophic steps that provide mechanistic understanding.
Fig. 6. Path diagrams for seasonal upwelling and Chinook salmon abundan
4.1. Seabird-based food web indicators
The intermediate trophic levels examined in this study providea simplified yet appropriate representation of the epipelagic foodweb in the GoF. The use of SeaWiFS ocean color data as a proxyfor phytoplankton concentration has become standard in marineecology (Chavez et al., 2011). The idea to use seabird diets to proxythe availability of zooplankton and forage fish is not new (Cairns,1987; Piatt et al., 2007; Mills et al., 2008), but the application ofthese data to provide insight into the productivity or abundanceof other species of seabirds, let alone marine mammals or fish, isdifferent. While some proxies of prey abundance based on seabirdshave previously been defined, we also support the cautiousapproach advocated by Durant et al. (2009) in using ‘‘reverse infer-ence’’ to infer prey availability in the environment based on
ce, Sacramento River, for year of (a) ocean entry and (b) adult return.
114 S.A. Thompson et al. / Progress in Oceanography 101 (2012) 106–120
seabird data. Using seabirds, or any variable as a proxy for anothervariable not measured directly, requires calibration. Optimally, toprovide an accurate estimate of the response in question the proxywill demonstrate a tight linear relationship with the response var-iable, but rarely is this well known. Fortunately, in this case, wepreviously examined the relationship between juvenile Sebastesspp. in common murre diet and abundance in the environment(Mills et al., 2007). The fit between the proxy and response variableis linear, with the proxy explaining�80% (r2 = 0.81) of the variationin the response variable. Calibration for the use of auklet diet com-position as a proxy for the abundance of the euphausiid T. spiniferain the environment has not been previously published, but we pro-vide initial details for this relationship in the Methods. In bothcases, our calibration (linear fit, high explanatory power) justifiesreverse inference and the use of the seabird diet as a proxy for prey
Fig. 7. Path diagrams for seasonal upwelling and Chinook salmon abun
availability in the environment. Based on the foraging ambits ofthese species (90 km for murres and 60 km for auklets), the proxiescertainly represent prey abundance in the greater Gulf of the Far-allones region.
We also simplified the modeled food web by conducting EOFanalyses on net-sampled zooplankton (from central Oregon)combined with the seabird proxy for T. spinifera. These variablesloaded more strongly on the zooplankton net samples from Oregonbut all loadings were positive. Presumably due to the strong south-ern flow of the California Current, the lipid-rich cold-watercopepod species are a robust component in food webs for northernCalifornia species and have previously been shown to positivelycorrelate with predator responses considered here, such as Cassin’sauklet reproductive success (Sydeman and Thompson, 2010). Withthe combination of both zooplankton information collected from
dance, Russian River, year of (a) ocean entry and (b) adult return.

Table 2Direct and indirect effects of pathways of responses relative to seasonal upwelling. Shading indicates the dominant path. See Methods for details of assessment.
⁄ Denotes significance (see Table 3).
Table 3Results for multiple regression. The dominant path for effect of upwelling on the response is noted as direct or indirect by listing the intermediate variable or variables of thatdominant indirect path. An exception is Cassin’s auklet phenology and summer upwelling: upwelling is also listed because of the resulting significant individual effect in themodel. Owing to the relatively small sample size, significance was considered when p < 0.1 (for a justification of this approach see Grosbois et al., 2008); NS: not significant.
Response Dominant path N Multiple regression
Model results Significant factor results
R2 p-value t p > |t|
Splitnose rockfish growthWinter upwelling Direct 10 0.20 0.191Summer upwelling Direct 10 0.01 0.782
Cassin’s auklet phenologyWinter upwelling Zooplankton 10 0.52 0.074 �2.77 0.028Summer upwelling Chlorophyll 9 0.69 0.030 �2.49 0.047
Upwelling �3.63 0.011
Cassin’s auklet breeding successWinter upwelling Direct 10 0.17 0.236Summer upwelling Chlorophyll 9 0.63 0.050 NS
Common murre phenologyWinter upwelling Zooplankton 10 0.61 0.038 �4.19 0.009Summer upwelling Chlorophyll 9 0.80 0.034 NS
Zooplankton �2.74 0.041
Common murre breeding successWinter upwelling Direct 10 0.004 0.860Summer upwelling Zooplankton 10 0.50 0.088 2.04 0.081
Humpback abundanceWinter upwelling Direct 10 0.01 0.753Summer upwelling Rockfish 10 0.60 0.041 3.00 0.020
Chinook abundance, Sacramento River (Year of Ocean Entry)Winter upwelling Direct 10 0.12 0.334Summer upwelling Chlorophyll 10 0.63 0.051 �2.04 0.088
Chinook abundance, Sacramento River (Year of Return)Winter upwelling Direct 10 0.15 0.262Summer upwelling Rockfish 10 0.64 0.028 2.79 0.027
Chinook abundance, Russian River (Year of Ocean Entry)Winter upwelling Direct 9 0.15 0.311Summer upwelling Zooplankton 9 0.62 0.053 2.70 0.036
Chinook abundance, Russian River (Year of Return)Winter upwelling Chlorophyll 7 0.28 0.512 NSSummer upwelling Rockfish 7 0.50 0.254 NS
S.A. Thompson et al. / Progress in Oceanography 101 (2012) 106–120 115

-10
-5
0
5
10
Com
mon
Mur
re P
heno
logy
-2 -1 0 1 2Zooplankton/Winter Upwelling
-10
-5
0
5
10
Com
mon
Mur
re P
heno
logy
-2 -1 0 1 2Zooplankton/Chlorophyll-a/Summer Upwelling
-20
0
20
40
60C
assi
n's
Auk
let P
heno
logy
-2 -1 0 1 2
Zooplankton/Winter Upwelling
-20
0
20
40
Cas
sin'
s A
ukle
t Phe
nolo
gy
-4 -2 0 2 4Chlorophyll-a/Summer Upwelling
-.2
-.1
0
.1
.2
.3
Com
mon
Mur
re R
epro
duct
ive
Succ
ess
-2 -1 0 1 2Zooplankton/Summer Upwelling
(a) (b)
(c) (d)
(e)
Fig. 8. Added variable plots for seabirds: (a) Cassin’s auklet phenology predicted by zooplankton adjusted by winter upwelling, (b) common murre phenology predicted byzooplankton adjusted by winter upwelling, (c) Cassin’s auklet phenology predicted by chlorophyll-a adjusted by summer upwelling, (d) common murre phenology predictedby zooplankton adjusted by chlorophyll-a and summer upwelling and e) common murre reproductive success predicted by zooplankton adjusted by summer upwelling.
-2000
-1000
0
1000
2000
-2 -1 0 1 2Zooplankton/Summer Upwelling
0
200000
400000
-.4 -.2 0 .2 .4Rockfish/Summer Upwelling
Chi
nook
Sal
mon
Yea
r of R
etur
nSa
cram
ento
Riv
er
-200000
-400000 Chi
nook
Sal
mon
Yea
r of O
cean
E
ntry
Rus
sian
Riv
er
(a) (b)
Fig. 9. Added variable plots for Chinook salmon: (a) adult return abundance in the Sacramento River predicted by rockfish adjusted by summer upwelling and (b) ocean entryabundance in the Russian River predicted by zooplankton adjusted by summer upwelling.
116 S.A. Thompson et al. / Progress in Oceanography 101 (2012) 106–120
S.A. Thompson et al. / Progress in Oceanography 101 (2012) 106–120 117
seabird diet studies as well as field-sampled zooplankton, we con-sider EOF1zooplankton to be a representation of relative zooplanktonbiomass.
4.2. Direct or indirect effects?
Path analysis showed that dominant modes of response fromupwelling to predators were indirect (12 of 20 models). None ofthe selected direct paths were significant (defined as p < 0.1, givenour relatively small sample size), while 83% of the indirect pathswere significant (Table 3), thereby supporting our primary hypoth-esis. Probably, the inclusion of additional or different prey datawould have produced even more significant indirect models. Fur-thermore, our findings follow a lack of evidence for direct correla-tions between upwelling and predator response (Black et al., 2011),which provides confirmation of the indirect relationship.
While our primary hypothesis was supported, the lack of directeffects, or indirect effects operating through habitat variability,cannot be dismissed. For example, when upwelling is strong, thereis considerable cross-shelf transport in water masses and plank-tonic materials (Peterson et al., 1979). Therefore, with strongerupwelling the volume of coastal cold-water habitat enlarges, andit is well-known that California Current predators often respondto changes in hydrographic habitat characteristics (Hyrenbachand Veit, 2003; Barlow et al., 2008). To demonstrate these kindsof relationships, however, we would have needed to investigatechanges in range or distribution for the predators under consider-ation. We also did not assess any physiological or metabolic re-sponse variables. Therefore, we note that our general conclusionof indirect effects applies only to the type of responses evaluatedin this study which include demographic (breeding success, abun-dance) and life history (phenology).
The one species that showed only direct effects of upwelling,splitnose rockfish, is ectothermic. For this rockfish, the relation-ships with upwelling were positive, indicating greater growth inyears of more upwelling. While insignificant in this study, Blacket al. (2011) found significance of this relationship, but they useda much longer time series (60 years). Generally speaking, growthof ectothermic fish is positively related to water temperature(Brander, 2005), but upwelling and surface temperature in the Cal-ifornia Current are inversely related (Checkley and Barth, 2009). Ascooler temperatures are associated with upwelling, we expected adecrease, not an increase in rockfish growth with increasingupwelling. For this species, it is also possible that we did not in-clude the correct food web prey indicator in the path models to se-cure indirect relationships. Splitnose rockfish are known toprimarily consume euphausiids (Love et al., 2002). Our zooplank-ton functional group included information on copepods and eup-hausiids (relative abundance of T. spinifera), yet the deeper-waterhabitats of splitnose rockfish are known to support a different spe-cies of euphausiid, E. pacifica. Therefore, it seems reasonable tosuggest that the unexpected relationship between splitnose rock-fish growth and upwelling may be related to a prey species thatwas not well-represented by our zooplankton functional group. Itis also possible that upwelling does have a direct effect on rockfishmetabolism and growth, but the mechanism for this relationship ispresently unknown.
4.3. Indirect effects and trophic connections
Of the 10 models showing significant indirect pathways of re-sponse (Table 3), all but one showed only one intermediate trophicstep. The one model showing two steps was the timing of breedingof common murre related to summer upwelling, which includedchlorophyll-a and zooplankton in the dominant path (Fig. 4a).However, chlorophyll-a was not significant when zooplankton
was in the model, indicating that zooplankton was the driving fac-tor. Indeed, seabird phenology was the only response that had indi-rect paths for both winter and summer upwelling. For murretiming, the seasonal path models were consistent in showing neg-ative (i.e., earlier) timing with increasing zooplankton biomass,with winter effects slightly stronger than summer effects (winterupwelling, zooplankton ? phenology beta = �0.663 vs. summerupwelling, zooplankton ? phenology beta = �0.561). Murres areknown to consume euphausiids during the pre-egg-laying period(Sydeman et al., 1997) and generally initiate nesting in late Aprileach year (Reed et al., 2009; Schroeder et al., 2009), so it is reason-able that winter upwelling operating through zooplankton is theprimary determinant of murre phenology. Similarly, aukletsshowed an indirect model from winter upwelling to phenology act-ing through zooplankton, with stronger winter effects (winterupwelling, zooplankton ? phenology beta = �0.784 vs. summerupwelling, chlorophyll-a ? phenology beta = �0.603; Fig. 3a). Thesummer upwelling – timing relationship for auklets is a bit surpris-ing as this species initiates nesting in March or April each year(Schroeder et al., 2009). As seabird laying dates were the only phe-nological responses investigated we conclude that winter upwell-ing operating via zooplankton biomass primarily determinestiming variation for seabirds in this system. While this result hasbeen previously suggested (Abraham and Sydeman, 2004; Schroe-der et al., 2009), this is the first study to link upwelling, zooplank-ton and seabird laying dates using path analysis. Moreover, sincewe investigated two biological characteristics (phenology andbreeding success) for each of two species of seabirds, we were ableto examine the effects of seasonal upwelling in the context of sim-ilarities or differences within and between species. Path analysisindicated similarities across both species for both phenology andbreeding success, but differences across responses for each species.
Of the remaining indirect models, all involved summer upwell-ing and two included chlorophyll-a (auklet breeding success, Sac-ramento YoE salmon), two included juvenile rockfish (humpbackabundance, Sacramento YoR salmon), and two included zooplank-ton (murre breeding success and Russian YoE salmon). Salmon andhumpback whales are known to consume juvenile Sebastes spp. asprey (Kieckhefer, 1992; Mills et al., 2007), so based on food habitsfor these species these models appear to be reasonable. Our findingof a significant indirect pathway of response for humpback whaleabundance, however, was unexpected as abundance of this long-lived, slowly reproducing species would probably not respond onthe interannual time scale, but rather over many years or decades.A reproductive variable similar to what we have used for seabirdsor some measure of body condition might have been better for thisanalysis, but these data are not available. Mortality (Ford et al.,2009) and calving rates (Perryman et al., 2002) of other whale spe-cies has been linked to environmental conditions, but these vari-ables would alter abundances in a detectable way only overmultiple years. Nonetheless, we found that interannual deviations(residuals) from the humpback whale population trend were re-lated to summer upwelling and juvenile rockfish abundance. Weinterpret this relationship as reflective of a change in distributionof whales, or some behavioral attribute that affected whale distri-bution or behavior and thereby altered or biased the abundanceestimates, rather than demonstrating actual changes in whaleabundance. Murres are also known to consume large quantitiesof juvenile rockfish (Roth et al., 2008), and their breeding successhas been previously related to juvenile rockfish abundance (Ainleyet al., 1995; Field et al., 2010), yet in this study murre breeding suc-cess was related to zooplankton. Based on net samples takenthroughout the GoF over 25 years, juvenile rockfish were generallylow in abundance during the 10 years of this study (Field et al.,2010), so it may be that another prey species, possibly northern an-chovy (Engraulis mordax) which was not sampled, related more clo-

118 S.A. Thompson et al. / Progress in Oceanography 101 (2012) 106–120
sely to murre breeding success during this decade. For Cassin’sauklet breeding success the summer upwelling model includedchlorophyll-a as a component, but this factor was not significant,indicating that upwelling was probably the key factor. Despitethe fact that juvenile rockfish abundance has been related to murreproductivity in previous studies (Wells et al., 2008; Field et al.,2010), in this study, zooplankton was a better predictor of predatorgrowth, timing, reproductive success, and abundance. This may berelated to the fact that the trophic chain to rockfish also includesthe zooplankton functional group.
4.4. Salmon year of ocean entry or year of return
A unique aspect of this study is that we examined the relation-ships between Chinook salmon returns (abundance) againstupwelling and intermediate trophic levels in the year of return(YoR) as well as lagged 2 years to the year of ocean entry (YoE).We found a consistent result for the year of return, where summerupwelling was indirectly related to abundance through juvenilerockfish. For the Russian River, however, the model was not statis-tically significant undoubtedly due to the small sample size (Ta-ble 3). In the year of ocean entry, models of summer upwellingthrough chlorophyll-a (Sacramento) and zooplankton (Russian)were significant. Thus, the pathway of response for the effect ofsummer upwelling on juvenile salmon (year of ocean entry) hassignificant intermediate steps at lower trophic levels (chloro-phyll-a and zooplankton), whereas the pathway of response foradult salmon (year of return) has an intermediate step at mid tro-phic levels (juvenile rockfish). It has been previously shown thatadult Chinook salmon prey upon juvenile rockfish (Merkel, 1957;Hunt et al., 1999; Mills et al., 2007) and other fish species (Petersonet al., 1982; Brodeur, 1990), while zooplankton can be prevalent inthe diets of juveniles (Baldwin et al., 2008). Our results corroboratethese findings and show that the ontogenic changes in the prey usemay be reflective of oceanographic-food web interactions that af-fect survival and returns at appropriate time lags.
5. Conclusions
In summary and conclusion, seabird phenology was related toboth winter and summer upwelling through zooplankton and sea-bird breeding success was related to summer upwelling throughzooplankton. Humpback whale abundance was related to summerupwelling through juvenile rockfish, and salmon abundance wassignificantly related to summer upwelling through juvenile rock-fish in the year of return and through zooplankton in the year ofocean entry. Thus, winter upwelling is important to timing vari-ables, summer upwelling is important to demographic variables,and both zooplankton and forage fish are important intermediatetrophic connections. We demonstrate bottom-up trophic controland conclude, as hypothesized, that most predator responses areindirect and varied in accordance with known predator food habits.Knowledge of food habits is therefore critical to predicting preda-tor response to changes in the seasonality of upwelling in easternboundary current ecosystems in the future. Upwelling is predictedto both intensify and change in seasonality as a result of globalwarming (Bakun, 1990; Snyder et al., 2003). The path analysisand modeling framework developed and tested here reflecthypotheses that can be modified to examine, in more detail, pre-dictions of predator responses to future climate variability andupwelling change. Depending on how climate change influencesthe seasonality of upwelling, different species and responses maybe impacted. The evidence-based pathways of response demon-strated in this study should have great relevance to understandingupwelling and ecosystem dynamics in the decades to come.
Acknowledgments
This study was made possible by NSF Grant 0929017, NASAGrant NNX09AU3NG, and California OPC/California Sea GrantENV-07. Field programs were supported by the USFWS and mem-bers and donors of PRBO (Farallon seabirds), NOAA-Fisheries (StockAssessment Improvement Program, the Fisheries and the Environ-ment Program, the US GLOBEC-Northeast Pacific Program (Peter-son, Oregon copepods), the California Department of Fish andGame, and the Sonoma County Water Agency (SCWA). We thankPRBO Conservation Science for data contributions for this project.Analysis of remotely-sensed chlorophyll was facilitated by a grantfrom the Resources Law Group/Resources Legacy Fund Foundation.We thank Karina J. Nielsen for guidance on the use of path analysisand acknowledge Spencer Wood and the Sanak Island Food Webfor feeding links.
Appendix A. Supplementary material
Supplementary data associated with this article can be found, inthe online version, at doi:10.1016/j.pocean.2012.02.001.
References
Abraham, C.L., Sydeman, W.J., 2004. Ocean climate, euphausiids and auklet nesting:inter-annual trends and variation in phenology, diet and growth of aplanktivorous seabird, Ptychoramphus aleuticus. Marine Ecology ProgressSeries 274, 235–250.
Abraham, C.L., Sydeman, W.J., 2006. Prey-switching by Cassin’s aukletPtychoramphus aleuticus reveals seasonal climate-related cycles of Euphausiapacifica and Thysanoessa spinifera. Marine Ecology Progress Series 313, 271–283.
Ainley, D.G., Veit, R.L., Allen, S.G., Spear, L.B., Pyle, P., 1995. Variations in marine birdcommunities of the California Current, 1986–1994. California CooperativeOceanic Fisheries Investigations Reports 36, 72–77.
Bakun, A., 1990. Global climate change and intensification of coastal oceanupwelling. Science 247, 198–201.
Bakun, A., Field, D.B., Redondo-Rodriguez, A., Weeks, S.J., 2010. Greenhouse gas,upwelling-favorable winds, and the future of coastal ocean upwellingecosystems. Global Change Biology 16, 1213–1228.
Baldwin, R.E., Miller, T.W., Brodeur, R.D., Jacobson, K.C., 2008. Expanding theforaging history of juvenile Pacific salmon: combining stomach-content andmacroparasite-community analyses for studying marine diets. Journal of FishBiology 72 (6), 1268–1294.
Baltz, D.M., Morejohn, G.V., 1977. Food habits and niche overlap of seabirdswintering on Monterey Bay, California. The Auk 94, 526–543.
Barlow, J., Kahru, M., Mitchell, B.G., 2008. Cetacean biomass, prey consumption, andprimary production requirements in the California Current ecosystem. MarineEcology Progress Series 371, 285–295.
Black, B.A., Boehlert, G.W., Yoklavich, M.M., 2008. Establishing climate-growthrelationships for yelloweye rockfish (Sebastes ruberrimus) in the northeastPacific using a dendrochronological approach. Fisheries Oceanography 17 (5),368–379.
Black, B.A., Schroeder, I.D., Sydeman, W.J., Bograd, S.J., Lawson, P.W., 2010.Wintertime ocean conditions synchronize rockfish growth and seabirdreproduction in the central California Current ecosystem. Canadian Journal ofFisheries and Aquatic Sciences 67, 1149–1158.
Black, B.A., Schroeder, I.D., Sydeman, W.J., Bograd, S.J., Wells, B.K., Schwing, F.B.,2011. Winter and summer upwelling modes and their relevance to climateimpacts and ecological response in the California Current Ecosystem. GlobalChange Biology 17, 2536–2545.
Bograd, S.J., Schroeder, I., Sarkar, N., Qiu, X.M., Sydeman, W.J., Schwing, F.B., 2009.Phenology of coastal upwelling in the California Current. Geophysical ResearchLetters 36 (1), L01602.
Brander, K.M., 2005. Cod recruitment is strongly affected by climate when stockbiomass is low. ICES Journal of Marine Science 62 (3), 339–343.
Brodeur, R.D., 1990. A Synthesis of the Food Habits and Feeding Ecology ofSalmonids in Marine Waters of the North Pacific. Report FRI-UW-9016.Fisheries Research Institute, University of Washington, 41pp.
Brodeur, R.D., Pearcy, W.G., 1984. Food habits and dietary overlap of some shelfrockfishes (genus Sebastes) from the Northeastern Pacific Ocean. FisheryBulletin 82, 269–293.
Brodeur, R.D., Pearcy, W.G., 1992. Effects of environmental variability on trophicinteractions and food web structure in a pelagic upwelling ecosystem. MarineEcology Progress Series 84, 101–119.
Brodeur, R.D., Ralston, S., Emmett, R.L., Trudel, M., Auth, T.D., Phillips, A.J., 2006.Anomalous pelagic nekton abundance, distribution, and apparent recruitmentin the northern California Current in 2004 and 2005. Geophysical ResearchLetters 33, L22S08.

S.A. Thompson et al. / Progress in Oceanography 101 (2012) 106–120 119
Cairns, D.K., 1987. Seabirds as indicators of marine food supplies. BiologicalOceanography 5, 261–271.
Calambokidis, J., 2009. Abundance Estimates of Humpback and Blue Whales Off theUS West Coast based on Mark-recapture of Photo-identified Individuals through2008. Cascadia Research, Olympia, Washington.
Chavez, F.P., Messie, M., 2009. A comparison of Eastern Boundary UpwellingEcosystems. Progress in Oceanography 83, 80–96.
Chavez, F.P., Messie, M., Pennington, J.T., 2011. Marine primary production inrelation to climate variability and change. Annual Review of Marine Science 3,227–260.
Checkley, D.M., Barth, J.A., 2009. Patterns and processes in the California CurrentSystem. Progress in Oceanography 83 (1–4), 49–64.
Croll, D.A., 1990. Physical and biological determinants of the abundance,distribution and diet of the Common Murre in Monterey Bay, California.Studies in Avian Biology 14, 139–148.
Croll, D.A., Tershy, B.R., Hewitt, R.P., Demer, D.A., Fiedler, P.C., Smith, S.E., Armstrong,W., Popp, J.M., Kiekhefer, T., Lopez, V.R., Urban, J., Gendron, D., 1998. Anintegrated approach to the foraging ecology of marine birds and mammals.Deep-Sea Research Part II 45, 1353–1371.
Croll, D.A., Marinovic, B., Benson, S., Chavez, F.P., Black, N., Ternullo, R., Tershy, B.R.,2005. From wind to whales: trophic links in a coastal upwelling system. MarineEcology Progress Series 289, 117–130.
Cury, P., Shannon, L., 2004. Regime shifts in upwelling ecosystems: observedchanges and possible mechanisms in the northern and southern Benguela.Progress in Oceanography 60 (2–4), 223–243.
Cury, P., Bakun, A., Crawford, R.J.M., Jarre, A., Quinones, R.A., Shannon, L.J., Verheye,H.M., 2000. Small pelagics in upwelling systems: patterns of interaction andstructural changes in ‘‘wasp-waist’’ ecosystems. ICES Journal of Marine Science57 (3), 603–618.
Cushing, D.H., 1971. Upwelling and production on fish. Advances in Marine Biology9, 255–334.
Dugdale, R.C., Wilkerson, F.P., 1989. New production in the upwelling center atPoint Conception, California – temporal and spatial patterns. Deep-Sea ResearchPart I 36 (7), 985–1007.
Dugdale, R.C., Wilkerson, F.P., Hogue, V.E., Marchi, A., 2006. Nutrient controls onnew production in the Bodega Bay, California, coastal upwelling plume. Deep-Sea Research Part II 53 (25–26), 3049–3062.
Durant, J.M., Hjermann, D.O., Frederiksen, M., Charrassin, J.B., Le Maho, Y., Sabarros,P.S., Crawford, R.J.M., Stenseth, N.C., 2009. Pros and cons of using seabirds asecological indicators. Climate Research 39 (2), 115–129.
Field, J.C., MacCall, A.D., Bradley, R.W., Sydeman, W.J., 2010. Estimating the impactsof fishing on dependent predators: a case study in the California Current.Ecological Applications 20 (8), 2223–2236.
Ford, J.K.B., Ellis, G.M., Olesiuk, P.F., Balcomb, K.C., 2009. Linking killer whalesurvival and prey abundance: food limitation in the oceans’ apex predator?Biology Letters 6, 139–142.
Frank, K.T., Petrie, B., Shackell, N.L., Choi, J.S., 2006. Reconciling differences introphic control in mid-latitude marine ecosystems. Ecology Letters 9 (10),1096–1105.
Frank, K.T., Petrie, B., Shackell, N.L., 2007. The ups and downs of trophic control incontinental shelf ecosystems. Trends in Ecology and Evolution 22 (5), 236–242.
Garcia-Reyes, M., Largier, J.L., 2010. Observations of increased wind-driven coastalupwelling off central California. Journal of Geophysical Research 115, C04011.
Garcia-Reyes, M., Largier, J.L., 2012. Seasonality of coastal upwelling off central andnorthern California: New insights, including temporal and spatial variability.Journal of Geophysical Research. doi:10.1029/2011JC007629.
Grosbois, V., Gimenez, O., Gaillard, J.-M., Pradel, R., Barbraud, C., Clobert, J., Moller,A.P., Weimerskirch, H., 2008. Assessing the impact of climate variation onsurvival in vertebrate populations. Biological Review 83, 357–399.
Hayward, T.L., Venrick, E.L., 1998. Nearsurface pattern in the California Current:coupling between physical and biological structure. Deep-Sea Research Part II45 (8–9), 1617–1638.
Hickey, B.M., 1979. The California Current System – hypotheses and facts. Progressin Oceanography 8 (4), 191–279.
Hooff, R.C., Peterson, W.T., 2006. Copepod biodiversity as an indicator of changes inocean and climate conditions of the northern California current ecosystem.Limnology and Oceanography 51, 2607–2620.
Huete-Ortega, M., Calvo-Diaz, A., Graña, R., Mouriño-Carballido, B., Marañón, E.,2011. Effect of environmental forcing on the biomass, production and growthrate of size-fractionated phytoplankton in the central Atlantic Ocean. Journal ofMarine Systems 88, 203–213.
Hunt, S.L., Mulligan, T.J., Komori, K., 1999. Oceanic feeding habits of chinook salmon,Oncorhynchus tshawytscha, off northern California. Fishery Bulletin 97 (3), 717–721.
Hunt, G.L., Stabeno, P., Walters, G., Sinclair, E., Brodeur, R.D., Napp, J.M., Bond, N.A.,2002. Climate change and control of the southeastern Bering Sea pelagicecosystem. Deep-Sea Research Part II 49, 5821–5853.
Hyrenbach, D.K., Veit, R.R., 2003. Ocean warming and seabird communities of theSouthern California Current System (1987–98): response at multiple temporalscales. Deep-Sea Research Part II 50, 2519–2536.
Jahncke, J., Checkley Jr., D.M., Hunt Jr., G.L., 2004. Trends in carbon flux to seabirds inthe Peruvian upwelling system: effects of wind and fisheries on populationregulation. Fisheries Oceanography 13 (3), 208–233.
Jahncke, J., Saenz, B.L., Abraham, C.L., Rintoul, C., Bradley, R.W., Sydeman, W.J., 2008.Ecosystem responses to short-term climate variability in the Gulf of theFarallones, California. Progress in Oceanography 77 (2–3), 182–193.
Kieckhefer, T.R., 1992. Feeding ecology of humpback whales in continental shelfwaters near Cordell Bank, California. Thesis, San Jose State University,California, 86 pp.
Kiørboe, T., 1993. Turbulence, phytoplankton cell size, and the structure of pelagicfood webs. Advances in Marine Biology 29, 1–72.
Largier, J.L., Lawrence, C.A., Roughan, M., Kaplan, D.M., Dever, E.P., Dorman, C.E.,Kudela, R.M., Bollens, S.M., Wilkerson, F.P., Dugdale, R.C., Botsford, L.W.,Garfield, N., Cervantes, B.K., Koracin, D., 2006. WEST: a northern Californiastudy of the role of wind-driven transport in the productivity of coastalplankton communities. Deep-Sea Research Part II 53 (25–26), 2833–2849.
Litzow, M.A., Ciannelli, L., 2007. Oscillating trophic control induces communityreorganization in a marine ecosystem. Ecology Letters 10, 1124–1134.
Logerwell, E.A., Mantua, N., Lawson, P.W., Francis, R.C., Agostini, V.N., 2003. Trackingenvironmental processes in the coastal zone for understanding and predictingOregon coho (Oncorhynchus kisutch) marine survival. Fisheries Oceanography12 (6), 554–568.
Love, M.S., Yoklavich, M., Thorsteinson, L., 2002. The Rockfishes of the NortheastPacific. University of California Press, Berkeley and Los Angeles, California.
Mann, K.H., Lazier, J.R.N., 1996. Dynamics of Marine Ecosystems. Blackwell Science,Inc., Cambridge.
Manuwal, D.A., 1974. The natural history of Cassin’s Auklet (Ptychoramphusaleuticus). The Condor 76, 421–431.
Merkel, T.J., 1957. Food habits of the King Salmon, Oncorhynchus tshawytscha(Walbaum), in the vicinity of San Francisco, California. California Fish and Game43, 249–270.
Miller, A.K., Sydeman, W.J., 2004. Rockfish response to low-frequency ocean climatechange as revealed by the diet of a marine bird over multiple time scales.Marine Ecology Progress Series 281, 207–216.
Miller, T.W., Brodeur, R.D., Rau, G., Omori, K., 2010. Prey dominance shapes trophicstructure of the northern California Current pelagic food web: evidence fromstable isotopes and diet analysis. Marine Ecology Progress Series 420, 15–26.
Mills, K.L., Laidig, T., Ralston, S., Sydeman, W.J., 2007. Diets of top predators indicatepelagic juvenile rockfish (Sebastes spp.) abundance in the California CurrentSystem. Fisheries Oceanography 16 (3), 273–283.
Mills, J.A., Yarrall, J.W., Bradford-Grieve, J.M., Uddstrom, M.J., Renwick, J.A., Merila, J.,2008. The impact of climate fluctuation on food availability and reproductiveperformance of the planktivorous red-billed gull Larus novaehollandiaescopulinus. Journal of Animal Ecology 77 (6), 1129–1142.
Mitchell, R.J., 2001. Path analysis. In: Scheiner, S.M., Gurevitch, J. (Eds.), Design andAnalysis of Ecological Experiments. Oxford University Press, Inc., New York,New York, pp. 217–234.
Moloney, C.L., St. John, M.A., Denman, K.L., Karl, D.M., Koster, F.W., Sundby, S.,Wilson, R.P., 2011. Weaving marine food webs from end to end under globalchange. Journal of Marine Systems 84, 106–116.
O’Farrell, M.R., Mohr, M.S., Palmer-Zwahlen, M.L., Grover, A.M., 2009. TheSacramento Index. National Marine Fisheries Service 32, Report in preparation.
Pauly, D., Christensen, V., 1995. Primary production required to sustain globalfisheries. Nature 374, 255–257.
Perryman, W.L., Donahue, M.A., Perkins, P.C., Reilly, S.B., 2002. Gray whale calfproduction 1994–2000: are observed fluctuations related to changes inseasonal ice cover? Marine Mammal Science 18, 121–144.
Peterson, W.T., Miller, C.B., Hutchinson, A., 1979. Zonation and maintenance ofcopepod populations in the Oregon upwelling zone. Deep-Sea Research Part I26, 467–494.
Peterson, W.T., Brodeur, R.D., Pearcy, W.G., 1982. Food habits of juvenile salmon inthe Oregon Coastal Zone, June 1979. Fishery Bulletin 80, 841–851.
Petraitis, P.S., Dunham, A.E., Niewiarowski, P.H., 1996. Inferring multiple causality:the limitations of path analysis. Functional Ecology 10, 421–431.
Piatt, J.F., Sydeman, W.J., Wiese, F., 2007. Introduction: a modern role for seabirds asindicators. Marine Ecology Progress Series 352, 199–204.
Reed, T.E., Warzybok, P., Wilson, A.J., Bradley, R.W., Wanless, S., Sydeman, W.J.,2009. Timing is everything: flexible phenology and shifting selection in acolonial seabird. Journal of Animal Ecology 78 (2), 376–387.
Roth, J.E., Nur, N., Warzybok, P., Sydeman, W.J., 2008. Annual prey consumption of adominant seabird, the common murre, in the California Current system. ICESJournal of Marine Science 65 (6), 1046–1056.
Rykaczewski, R.R., Checkley Jr., D.M., 2008. Influence of ocean winds on the pelagicecosystem in upwelling regions. Proceedings of the National Academy ofSciences of the United States of America 105, 1965–1970.
Schroeder, I.D., Sydeman, W.J., Sarkar, N., Thompson, S.A., Bograd, S.J., Schwing, F.B.,2009. Winter pre-conditioning of seabird phenology in the California Current.Marine Ecology Progress Series 393, 211–223.
Schwing, F.B., Bond, N.A., Bograd, S.J., Mitchell, T., Alexander, M.A., Mantua, N.A.,2006. Delayed coastal upwelling along the US West Coast in 2005: a historicalperspective. Geophysical Research Letters 33, L22S01.
Scott, J.M., 1990. Offshore distributional patterns, feeding habits, and adult–chickinteractions of the common murre in Oregon. Studies in Avian Biology 14, 103–108.
Service, S.K., Rice, J.A., Chavez, F.P., 1998. Relationship between physical andbiological variables during the upwelling period in Monterey Bay, CA. Deep-SeaResearch Part II 45, 1669–1685.
Snyder, M.A., Sloan, L.C., Diffenbaugh, N.S., Bell, J.L., 2003. Future climate change andupwelling in the California Current. Geophysical Research Letters 30 (15), 1823.
Suryan, R.M., Irons, D.B., Brown, E.D., Jodice, P.G.R., Roby, D.D., 2006. Site-specificeffects on productivity of an upper trophic-level marine predator: bottom-up,

120 S.A. Thompson et al. / Progress in Oceanography 101 (2012) 106–120
top-down, and mismatch effects on reproduction in a colonial seabird. Progressin Oceanography 68 (2–4), 303–328.
Sydeman, W.J., Thompson, S.A., 2010. The California Current Integrated EcosystemAssessment (IEA), Module II: Trends and Variability in Climate-ecosystem State.Report to NOAA, SWFSC, Environmental Research Division, Pacific Grove,California, 59 pp.
Sydeman, W.J., Hobson, K.A., Pyle, P., McLaren, E.B., 1997. Trophic relationshipsamong seabirds in central California: combined stable isotope and conventionaldietary approach. The Condor 99, 327–336.
Sydeman, W.J., Hester, M., Thayer, J.A., Gress, F., Martin, P., Buffa, J., 2001. Climatechange, reproductive performance and diet composition of marine birds in thesouthern California Current System, 1967–1997. Progress in Oceanography 49,309–329.
Sydeman, W.J., Bradley, R.W., Warzybok, P., Abraham, C.L., Jahncke, J., Hyrenbach,K.D., Kousky, V., Hipfner, J.M., Ohman, M.D., 2006. Planktivorous aukletPtychoramphus aleuticus responses to ocean climate, 2005: unusualatmospheric blocking? Geophysical Research Letters 33, L22S09.
Sydeman, W.J., Mills, K.L., Santora, J.A., Thompson, S.A., Bertram, D.F., Morgan, K.H.,Wells, B.K., Hipfner, J.M., Wolf, S.G., 2009. Seabirds and climate in the CaliforniaCurrent – a synthesis of change. California Cooperative Oceanic FisheriesInvestigations Reports 50, 82–104.
Sydeman, W.T., Thompson, S.A., Field, J.C., Peterson, W.T., Tanasichuk, R., Freeland,H., Bograd, S.J., Rykaczewski, R.R., 2011. Does positioning of the North PacificCurrent affect downstream ecosystem productivity? Geophysical ResearchLetters 38, L12606.
Ware, D.M., Thomson, R.E., 2005. Bottom-up ecosystem trophic dynamicsdetermine fish production in the Northeast Pacific. Science 308, 1280–1284.
Wells, B.K., Field, J.C., Thayer, J.A., Grimes, C.B., Bograd, S.J., Sydeman, W.J., Schwing,F.B., Hewitt, R., 2008. Untangling the relationships among climate, prey and toppredators in an ocean ecosystem. Marine Ecology Progress Series 364, 15–29.
Witteveen, B.H., Worthy, G.A.J., Wynne, K.M., Hirons, A.C., Andrews III, A.G., Markel,R.W., 2011. Trophic levels of North Pacific humpback whales (Megapteranovaeangliae) through analysis of stable isotopes: implications on prey andresource quality. Aquatic Mammals 37, 101–110.