linking quality of instruction to instructionally ... · pdf filelinking quality of...
TRANSCRIPT
1
Linking Quality of Instruction to Instructionally Sensitive Assessments
Ming-Chih Lan1, Min Li
1, Araceli Ruiz-Primo
2, Ting Wang
1,
Michael Giamellaro2, Hillary Mason
2
1Uninveristy of Washington at Seattle
2University of Colorado Denver
Paper Presented at the AERA Annual Meeting April, 2012
Vancouver, Canada
The work reported herein was supported by National Science Foundation (DRL-0816123). The findings
and opinions expressed in the paper do not reflect the position or policies of the National Science
Foundation, but the authors.
Contact: Ming-Chih Lan: [email protected]
2
Linking Quality of Instruction to Instructionally Sensitive Assessments
Measurement experts such as Popham (2007) have argued that large-scale tests
used for accountability purposes are instructionally insensitive mainly because very little
of what is taught gets tested. Due to the sampling procedures used for large-scale tests
(Leinhardt, 1983), the test items presented to students do not accurately reflect the
learning that takes place in the classroom (Polikoff, 2010). Thus, these test results tend to
reflect general ability or maturation rather than effective instruction (Wiliam, 2007). As
expressed by Popham (2007),
How can the prospect of annual accountability testing ever motivate educators to
improve their instruction once they realize that better instruction will not lead to
higher test scores? How can officials accurately intervene to improve instruction
on the basis of low scores if those scores really are not a consequence of
ineffective instruction? (p. 147)
In failing to use instructionally sensitive assessments, we cannot adequately monitor the
instructional quality students receive or evaluate the effectiveness of educational reforms.
Thus, we contend that a well-developed assessment to measure student learning should
be sensitive to the quality of instruction that students are exposed to. In this paper we
focus on issues directly related to our conception of instructional sensitivity of
assessment (Ruiz-Primo & Li, 2008): Are test items developed varying in instructional
sensitivity differentially related to instructional quality shown in videotaped classroom
lessons? How test items developed varying in instructional sensitivity based on the
DEISA approach is described in the next session.
3
The study presented in this paper is part of a larger Development and Evaluation
of Instructionally Sensitive Assessment (DEISA, Ruiz-Primo & Li, 2008) project in which
we have developed, revised, and tested an approach to developing and evaluating
instructionally sensitive assessments. In this study, we evaluate the instructionally
sensitive assessments with respect to the quality of instruction teachers provided to their
students. The ultimate goal of the DEISA project is to offer a robust approach to
constructing and evaluating instructionally sensitivity assessments that can detect the
impact of effective instruction or instructional programs.
Theoretical Framework
We define the instructional sensitivity of assessments (or instructionally sensitive
assessments) as the extent to which assessment items: (1) represent the intended and
enacted curriculum (i.e., material covered by the assessment has actually been taught);
(2) reflect the quality of the enacted curriculum (i.e., the quality of instruction provided
by teachers); and (3) have formative value (i.e., if items are sensitive to instruction,
teachers must be able to use the assessment information to adjust instruction). In this
study, we focus on the second aspect: instructional quality as it is less studies compared
to the aspect of content coverage according to the literature review.
Consistent with the approach proposed by Ruiz-Primo et al. (2002) and the
instructional sensitivity notion described above, we claim (Ruiz-Primo & Li, 2008; Ruiz-
Primo, 2010) that assessment evidence can be collected at different distances or
proximities to the enactment of a curriculum or a program students are exposed to (Ruiz-
Primo et al., 2002). Based on the idea of instructionally sensitive assessment, three types
of test items were developed to explore their relationships with quality of instruction in
4
the study: (1) close item - test items close to what student experience in the classroom for
an enacted curriculum; (2) proximal item – test items focused on the same topic and
concepts, but not as close to what students experienced; and (3) distal item – assessment
items developed based on other curriculum standards and neither close nor proximal to
the enacted curriculum. Test items appropriately developed at different
distances/proximity (i.e., close, proximal, or distal to the curriculum content taught by
teachers) are expected to vary in their capacity to reflect a teachers’ instruction in
conjunction with the three levels of the instructional sensitivity notion. For example,
student performance in either close or proximal test items should be higher than that in
distal items because either close or proximal items are related to the planned curriculum
content and distal items are not.
In order to test the proposed DEISA framework for the instructional sensitivity of
assessments, we developed close and proximal items at different proximities from the
intended curriculum but with distal items selected from existing large-scale tests1. We
conceptually and theoretically conceived the proximity of the items as a continuum
between close and distal against the target curriculum like the difficulty index of test
items. In practice, by manipulating the variables we identified to control the level of
proximity, three categories of test items including close, proximal, and distal items were
developed. Two issues are important to focus on: (1) recognize that a goal in the use of
proximal items is to evaluate how well students can transfer what they are learning. By
this we mean that the items, whenever possible, will assess whether students can apply
what they have learned to contexts different from those introduced in the module. (2)
1 We selected distal items from large-scale assessments (i.e., international, national, and state assessments)
based on the Colorado state science standards and the National Science Educational Standards on the
content and processes of scientific investigations that is the focus of the modules at hand.
5
Close and proximal items must measure the knowledge related to learning goals of the
target science modules. Unlike distal items, for each of the close or proximal items
developed, it is important to ensure that it taps the learning goal(s) of the science module.
Three steps to developing test items were described as the following:
1. Defining the Learning Goals. A strategy, called mapping the intended
curriculum, was developed to gather information about the critical characteristics of a
science unit or module. The purpose of mapping included the identification and
development, and understanding of the learning goals to be achieved by teachers and
students at the end of a unit/module. To understand the learning goals of a unit/module,
two tasks during the mapping process were completed: (1) identification of the scientific
knowledge and scientific practices aimed at the learning goals students should achieve for
a taught unit/module, and (2) classification of the scientific knowledge and scientific
practices by types of knowledge – declarative, procedural or schematic knowledge.
Teachers who were scheduled to teach the science module targeted in the project
were invited to map the module to help identify in the mapping process the critical
concepts, principles, procedures and explanation models (Giamellaro, Lan, Ruiz-Primo,
& Li, 2011). In sum, the module maps, tracked seven aspects of each lesson/investigation
within a unit or module. including: (1) the learning targets for the lesson in terms of
scientific knowledge and scientific processes; (2) the type of knowledge being tapped or
engaged in the lesson (i.e., declarative, procedural, and schematic knowledge); (3) the
activities that are critical to achieve the learning targets for the lesson; (4) the
documentation required of students; (5) the materials used; (6) the graphical
representations; and (7) the vocabulary involved in each lesson, activity, or investigation.
6
These aspects were considered Sources of Instructional Sensitivity (SOIS) that could be
potentially used to manipulate close and proximal test items for the study in order to
adequately assess students’ learning outcomes.
2. Identifying the Big Ideas. ‘Big idea is the concept that reflects the principled
understanding that educators should focus on when concerned with transfer of learning.
Only if we align instruction to big ideas, we can make possible the conceptual
connectivity needed to extend the original reasoning learned. With respect to types of
knowledge, big ideas are more directly linked to a particular type of knowledge,
schematic knowledge or knowing why – the knowledge used to reason about, predict, and
explain things in nature. Schematic knowledge focuses on “why” explanations, or
principled understanding (Ruiz-Primo et al., 2012).’ In other words, big ideas focus on
why observable events happen, not just descriptions of how they happen or that they
happen (Ruiz-Primo & Li, 2012). Synthesizing the module map developed by the
teachers and the map developed by the researchers, we developed a collective map that
helped to guide discussion about the big ideas. As a combined group of teachers and
researchers, guided by two content experts, the big ideas were constructed for each unit
or module. In the DEISA project, we have defined Big Ideas as scientific propositions
that have broad explanatory power within or across scientific disciplines and that
typically form the foundation for more advanced learning.
Big ideas were further organized around levels of understanding that could guide
the focus of the items developed. For example, in the Landforms FOSS module, one of
the big ideas explored was the relationship erosion and deposition. The levels progress
from the basic “students know that Earth’s land surfaces change” to a third level

7
“students recognize that deposition is the opposite of erosion. ”Following the purpose of
the mapping, two types of big ideas were developed with one focusing on scientific
knowledge and another focusing on scientific practices. The role that the big idea played
in the development of the items was crucial. Each item needed to tap a particular level of
the primary big idea, either focusing on scientific knowledge or practices. On some
occasions, items could also tap into a secondary big idea.
3. Developing Items: Manipulating Item Proximity. DEISA team researchers have
focused on developing multiple‐choice items based on the rationale that they are the
predominant form of assessment at the classroom, district, state (e.g., CSAP), national
(e.g., NAEP), and international (e.g., TIMSS, PISA) levels. The variables manipulated to
develop different levels of proximity to the intended curriculum included: (1)
characteristics of the question, (2) students’ exposure to the big idea in the module, (3)
sharing of cognitive elements, (4) setting of the item, and (5) experimental setting.
Instructionally sensitive assessment items were developed on the basis of what we
named “bundles of triads,” all of which assess the same construct, defined by a particular
learning goal and level of its understanding. Within each bundle, one close item is first
developed and then two proximal items (Proximal 1 and Proximal 2) are developed using
the close item as reference. The difference between the two types of proximal items is the
magnitude or the extent of the distance from the close item. For a given characteristic,
there is a small change from the close item for developing Proximal 1 items and bigger
change for developing Proximal 2 items. Presumably, the triads should ask exactly the
same or very similar questions of students, with the appropriate adaptations when needed
across Proximal 1 and Proximal 2. Two types of changes are defined: small changes and

8
big changes. The “small change” focuses on developing items using information from the
Close item and changing it to a very small degree. For example, Proximal 1 items will
use similar types of organisms as those used in the Close item. If corn and barley are used
in the module to study environmental preferences, either or both will be used in a Close
item, but plants of different types will be used in a Proximal 1 item. The “big change”
focuses on developing items using information from the Close item with a considerable
degree of change. For example, for Proximal 2 items, the target organism should be
completely different from the one used in a Close item. If the close item uses corn and
barley, the Proximal 2 item can use an animal that is not used in the science module at all,
but still measuring student understanding about environmental preferences. The
introductory paper of this set (Ruiz-Primo & Li, 2012 included information in more detail
about how we developed instructionally sensitive items for the study.
As a result, for the 5th grade Environments module introduced in next section, 19
bundles of test items were developed and distributed across four booklets, each
containing 30 items. Not all developed items were used in the booklets. Four of the
Proximal 2 items were used to create two open-ended questions presented as the 30th
item
in the booklets. Each booklet had seven Close, five Proximal 1, seven Proximal 2, and
nine distal items. For the Heat and Change module, two booklets were developed with
each containing 30 items, too. Each booklet had twelve Close, nine Proximal, and nine
distal items. During the item development process, we did not have enough time to test
the new approach with Heat and Change module. Therefore, we had 2 levels of items
developed for the Proximal for Environments, but only one proximal level for Heat and
Change module.
9
After test items were developed, the correlation between developed test items at
different levels of distance to the intended curriculum and the quality of instruction was
examined as procedures described in the next session.
Methods
Participants
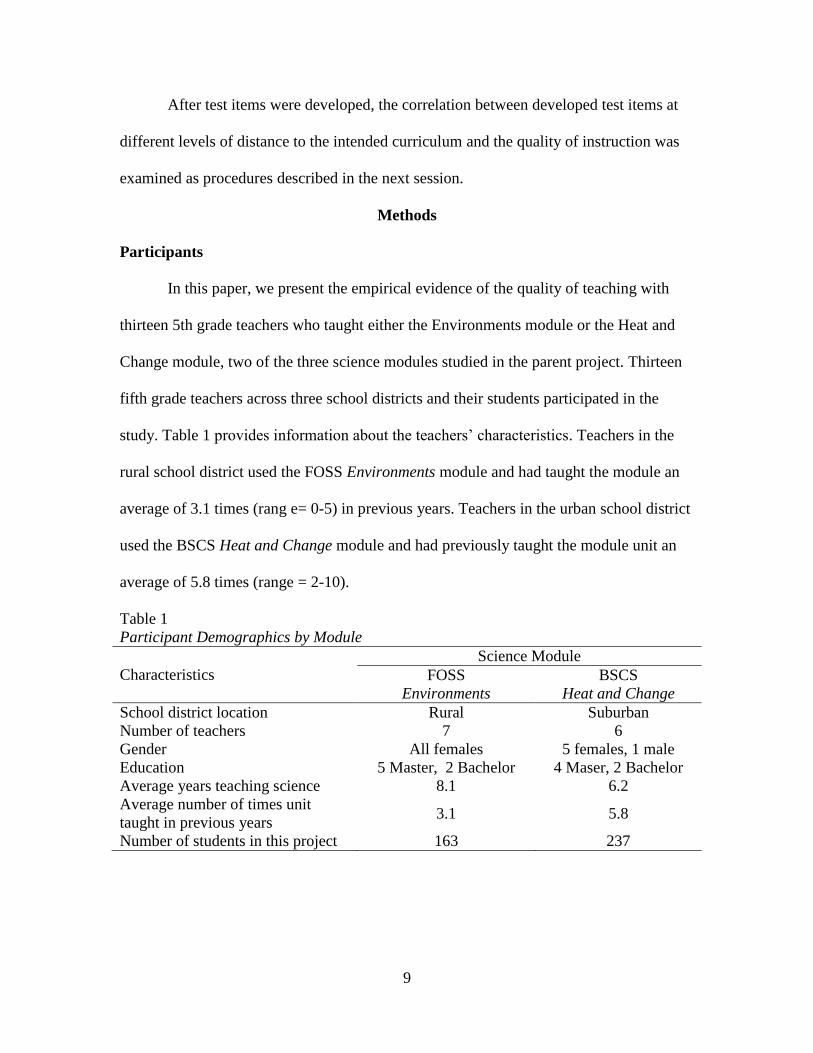
In this paper, we present the empirical evidence of the quality of teaching with
thirteen 5th grade teachers who taught either the Environments module or the Heat and
Change module, two of the three science modules studied in the parent project. Thirteen
fifth grade teachers across three school districts and their students participated in the
study. Table 1 provides information about the teachers’ characteristics. Teachers in the
rural school district used the FOSS Environments module and had taught the module an
average of 3.1 times (rang e= 0-5) in previous years. Teachers in the urban school district
used the BSCS Heat and Change module and had previously taught the module unit an
average of 5.8 times (range = 2-10).
Table 1
Participant Demographics by Module
Characteristics
Science Module
FOSS
Environments
BSCS
Heat and Change
School district location Rural Suburban
Number of teachers 7 6
Gender All females 5 females, 1 male
Education 5 Master, 2 Bachelor 4 Maser, 2 Bachelor
Average years teaching science 8.1 6.2
Average number of times unit
taught in previous years 3.1 5.8
Number of students in this project 163 237
10
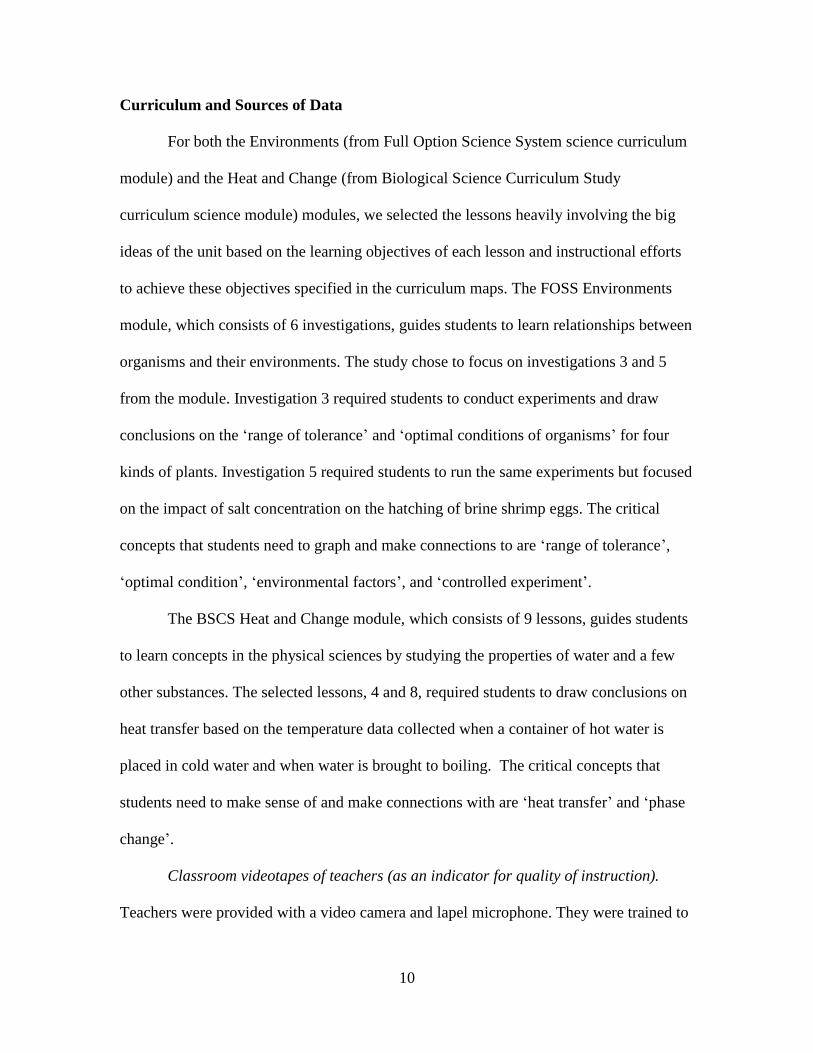
Curriculum and Sources of Data
For both the Environments (from Full Option Science System science curriculum
module) and the Heat and Change (from Biological Science Curriculum Study
curriculum science module) modules, we selected the lessons heavily involving the big
ideas of the unit based on the learning objectives of each lesson and instructional efforts
to achieve these objectives specified in the curriculum maps. The FOSS Environments
module, which consists of 6 investigations, guides students to learn relationships between
organisms and their environments. The study chose to focus on investigations 3 and 5
from the module. Investigation 3 required students to conduct experiments and draw
conclusions on the ‘range of tolerance’ and ‘optimal conditions of organisms’ for four
kinds of plants. Investigation 5 required students to run the same experiments but focused
on the impact of salt concentration on the hatching of brine shrimp eggs. The critical
concepts that students need to graph and make connections to are ‘range of tolerance’,
‘optimal condition’, ‘environmental factors’, and ‘controlled experiment’.
The BSCS Heat and Change module, which consists of 9 lessons, guides students
to learn concepts in the physical sciences by studying the properties of water and a few
other substances. The selected lessons, 4 and 8, required students to draw conclusions on
heat transfer based on the temperature data collected when a container of hot water is
placed in cold water and when water is brought to boiling. The critical concepts that
students need to make sense of and make connections with are ‘heat transfer’ and ‘phase
change’.
Classroom videotapes of teachers (as an indicator for quality of instruction).
Teachers were provided with a video camera and lapel microphone. They were trained to
11
use the camera and they were asked to videotape every lesson related to instruction of the
module. Classroom videotapes were transcribed and analyzed. In this preliminary study,
we only analyzed one type of instructional episode: reporting data and drawing
conclusions, where students were supported by their teachers to make sense of data in
order to build explanatory models. These episodes typically served as closure at the end
of each investigation or lesson,
The coding scheme was part of a coding system focusing on the quality of
instructional activities implemented by science teachers. Following Tarr et al. (2010), we
coded 21 critical aspects organized under the following five categories.
1. Alignment of key concepts to the learning goal: the extent to which teachers
make learning connected to the learning goals (PS. Key concepts were defined as key
words, terms, or a combination of key words/terms focused to learn in an investigation or
lesson).
2. Evidence provided to support claims: the extent to which teachers support
students in transforming observation and collected data into evidence, explanations, and
conclusions.
3. Making connections: the extent to which teachers make learning connected to
ideas for other lessons, real world examples and applications, and other disciplines and
support students to develop in-depth understanding.
4. Engaging student in learning: the extent to which teachers encourage students
engaging in learning.
5. Students’ response to learning: the extent to which students are involved in
learning, to capture quality of instruction as teachers implemented the curriculum.
12
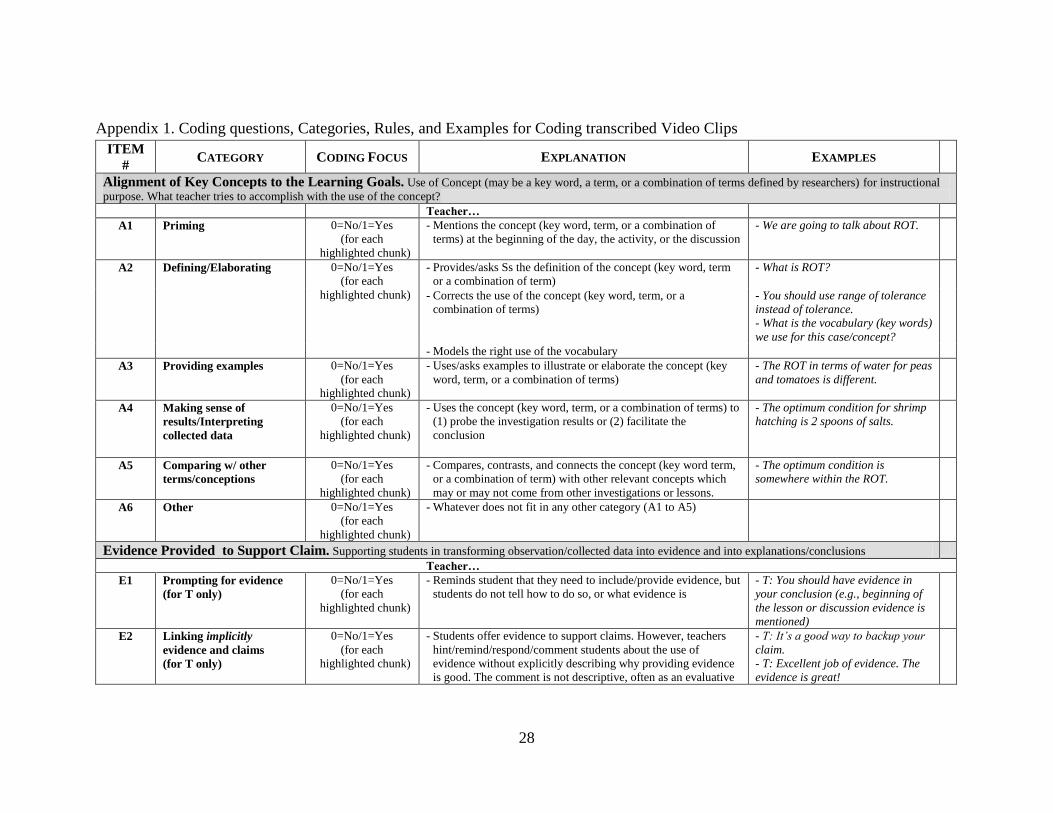
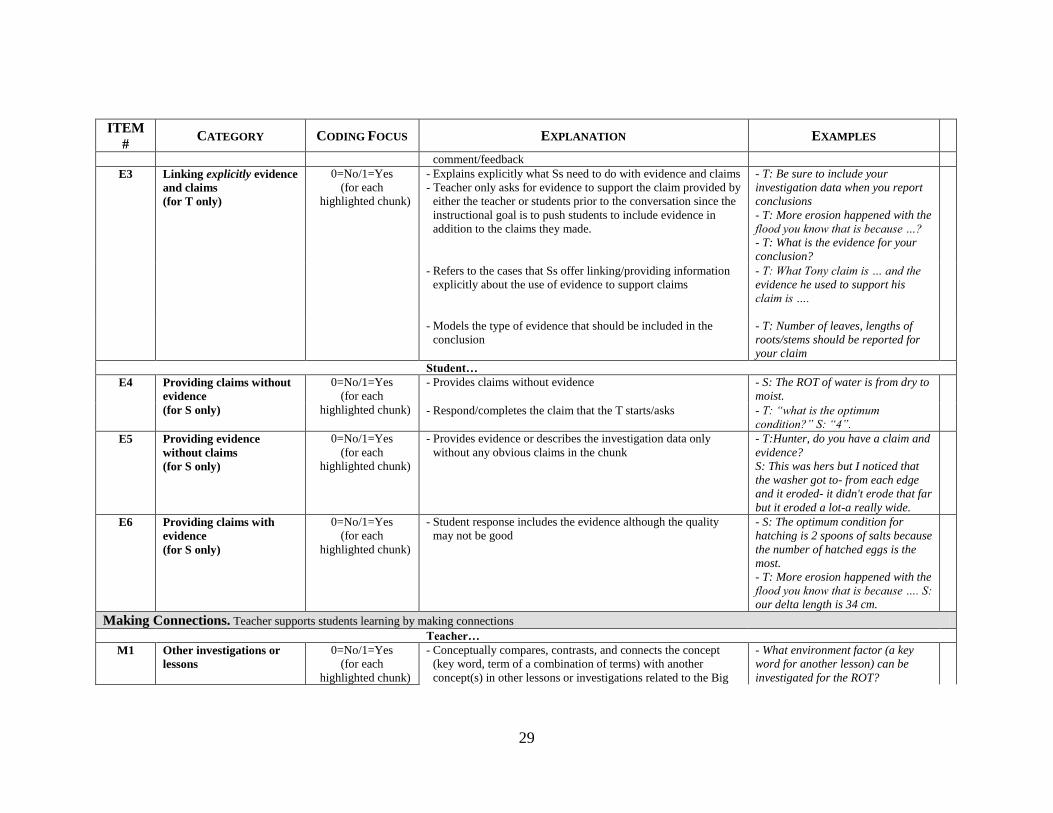
The coding questions, how questions were categorized, coding options and rules,
and coding examples are shown in Appendix 1. Codes were assigned as presence or non-
presence according to the coding rules and then codes were summed up into five
dimensions of codes which were used to evaluate their relationship with quality of
instruction. Table 2 below presents an excerpt of a transcript for Teacher 7 of the
Environment module and explained the reasons for the assigned codes. Two raters
independently completed coding of two randomly selected video segments. The inter-
rater agreement reached 83%, indicating that this coding approach can be reliably used by
coders after participating in the coding training sessions.
Pre- and posttest scores of students (as an indicator for student performance).
The study also collected students’ test scores on the instructionally sensitive assessment
administered before and after instruction. The effect sizes2 which captured students’ gain
scores from the pretest to the posttest on test items were calculated within each proximity
(i.e., close, proximal 1, proximal 2, and distal) of test items to indicate student
performance.
2 All effect sizes were estimated using the formula, for pre-posttest design. ,
Treatment ControlX XES
SD

13
Table 2
An Example of the Video Coding
Transcript Code(s) Assigned
Teacher 7
Alright guys, who has a really good--shh--conclusion that they
wanna share? Okay. Shh! I'll wait.
…
Student A
I said I picked radishes and barley because what we saw is that
they don't take a lot of water and if they have a lot of water,
they won't grow as much
Code E6 was assigned
since the student
provided evidence to
support
Teacher 7
So radishes and barley. I love how you said that and you kind
of it up with your information
Code E3 was assigned
since the teacher
explicitly linked
student’s evidence to
claims
Student B
I picked peas and corn because...we saw a lot of growth with
peas and corn in the drought. They both take a lot of water
Code E6 was assigned
since the student
connected evidence to
claims
Teacher 7
They take a lot of water. So in the drought, are--drought means
we have no water. So are we gonna plant that in a drought?
No. And I love how you backed it up because you sho--you
just proved your own point--it was wrong. You proved that
yourself. So I loved that. So switch that for me. [Student] read
me yours
Code E3 was assigned
since the teacher
explicitly reminded
students to make
connections with
evidence and claims
Student C
Okay, the peas grew the best in the very wet
…
Code E4 was assigned
because student’s
claim without
supported evidence
Data Analysis
The data analysis included a series of correlations between quality of instruction
(indicated by assigned video codes) and student performance (indicated by the effect
sizes of gain scores between pre- and posttest for close, proximal and distal test items
grouped, respectively) to explore how student performance on test items developed at
14
different levels of proximity to the intended curriculum were related to the quality of
teachers’ instruction that students were exposed to.
Results and Discussions
Our preliminary analysis includes (1) descriptive statistics of student performance
on different types of test items, (2) descriptive statistics of the assigned video coding for
seven teachers from the Environments module and six teachers from the Heat and
Change module, and (3) a series of correlations between the video codes and the effect
sizes of pre- and posttest from the assessment items as the indicator of student learning
gain.
Table 3 reports the average student performance indicated by the effect sizes
reported based on different levels of item proximity. For the EN module, there was an
overall linear trend (F = 10.17, p < .01) across the seven teachers despite Teacher 2
showing bigger gain scores in proximal 1 items and teacher 7 showing bigger gains in
proximal 2 items. The effect size of student performance in close items was 1.00 and then
decreased when items moved from close to proximal and proximal to distal with the
highest effect size of 1.00 for close items, a middle value of .64 for proximal 1, .41 for
proximal 2, and the lowest effect size value of .25 for distal items. Results for the HC
module showed the same linear trends trend (F = 3.65, p < .05) as the EN module did.
Overall, the HC module showed the highest effect size of 1.16 for close items, a middle
value of .88 for proximal items (Unlike the EN module, there is only one proximal level),
and the lowest effect size of .61 for distal items.
The finding was consistent with what we hypothesized about the item proximity –
for individual teachers, if the intended curriculum is enacted, their students’ performance

15
in close and proximal items is expected to show higher gains than in distal items because
close and proximal items are more aligned with what students are supposed to learn than
are distal items.
Table 3
Summary of Effect Sizes as an Indicator of Student Performance by Type of Items
Teacher ID
Effect Size Derived from Gain Scores by Pre- and Posttest for Type of Items
Close Proximal 1 Proximal 2 Distal
Environments
1 .94 .25 .44 .42
2 .83 1.22 .04 - .08
3 1.05 .30 .43 .13
4 1.11 .79 .26 .32
5 .75 .46 .54 .69
6 1.21 .85 .18 .15
7 1.15 .58 .95 .12
Average 1.00 .64 .41 .25
Heat and Change
1 .78 0.87a .92
2 .37 0.59a .55
3 1.45 0.91a .18
4 1.28 1.21a .56
5 1.53 0.68a 1.00
6 1.57 1.04a .44
Average 1.16 0.88a .61
a Only one level of proximal items for Heat and Change module
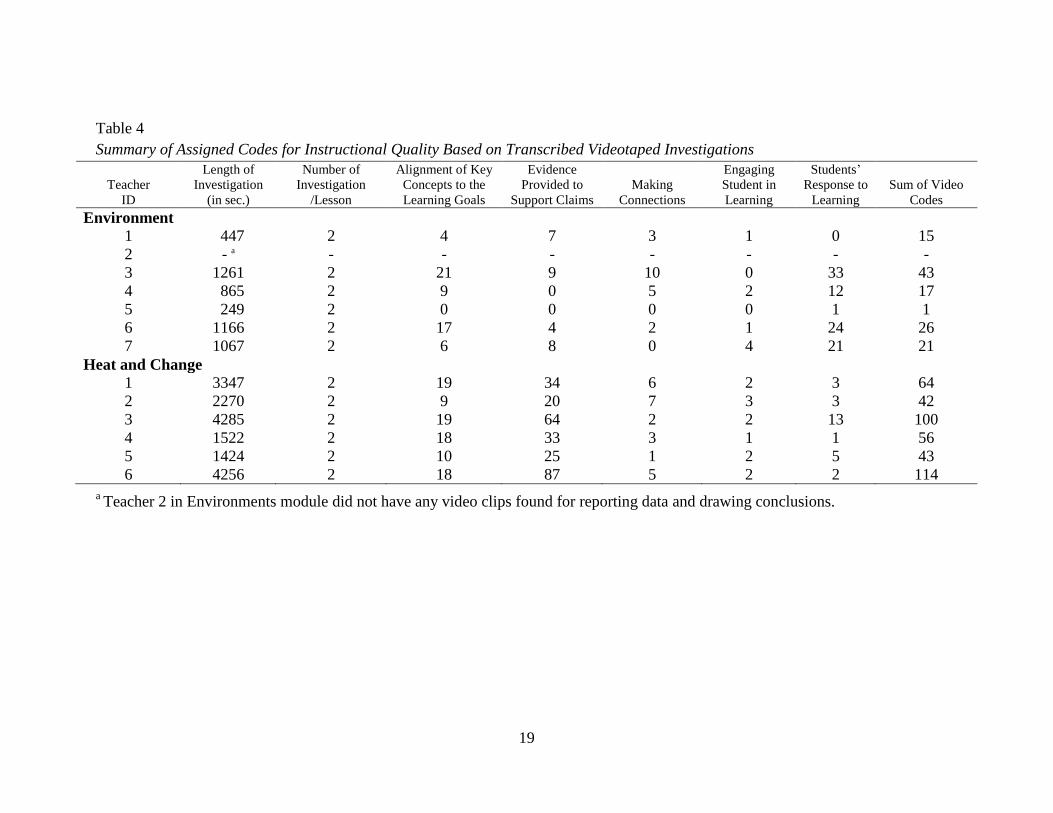
Table 4 summarizes the length of time for instruction and the codes raters
assigned to evaluate the quality of teachers’ instruction. The originally assigned video
codes (21 coding items; see Appendix 1) were grouped into five instruction-related
activities. Because the points of focus could not be found in the videotaped recordings
for Teacher 2 of the Environments module, the teacher was dropped from the study,
leaving 6 teachers in the Environments module and 6 in the Heat and Change module as
well in the further data analysis.
We took a close look at the time teachers took in helping students to make sense
of the investigation data and to discuss conclusions in relation to the concepts of these
16
two investigations/lessons. In the Environments module, the amount of time teachers
spent ranged from approximately 4 minutes (Teacher 5) to 21 minutes (Teacher 3) with
an average of 14 minutes or so (Table 4). That is, there was an average of approximately
seven minutes for each investigation that each teacher spent on reporting data and
drawing conclusions. There was a noticeable difference between teachers in the
Environments and Heat and Change modules. In the Heat and Change module, the
amount of time teachers spent ranged from approximately 24 minutes (Teacher 5) to 72
minutes (Teacher 3) with an average of around 48 minutes (Table 3). There was an
average of approximately twenty-four minutes each teacher spent for each lesson.
Compared to teachers using the EN module (about 7 minutes), teachers using the
Heat and Change module provided more time to support (about 24 minutes) students to
navigate between data and concepts when constructing conclusions. This can be
attributed to several characteristics about the module. For example, the curriculum
developers of the Heat and Change module intentionally included more tools for students
to make conceptual connections such as a map of evidence and claims and more relevant
guiding questions for the class discussion. That is, students would construct data tables
and recorded data for a period of time for two samples of water (e.g., one was warmer
and the other was cooler). Then students individually graphed their data and described
what took place to identify the heat source, the direction of heat flow, and the variables
that affected the heat transfer. Teachers would ask students to spend time plotting the
temperature and the time they recorded for warmer objects and cooler ones to explain the
relationship between them. In addition, teachers in the Heat and Change module spent
more time helping students to make sense of investigation data which are often about the
17
temperature, time and the state of matters. This may be related to the fact that the
concepts in the Heat and Change module (e.g., heat energy, heat transfer, and molecules)
are more intangible and abstract than the ones in the Environments module (e.g., shrimp,
corns, and peas).
We then examined the correlation between teachers’ overall teaching quality
indicated by classroom videotape observations (last column in Table 4) and the
instructional time teachers spent (2nd
column in Table 4) engaging students in “reporting
data and drawing conclusions.” The correlation coefficient was positive for both EN (r =
.87, p < .05) and HC (r = .89, p < .05) modules, indicating teachers who engaged students
longer in discussing investigations showed a better quality of instruction than teachers
who took less time in this session of discussing.
We noticed that the segment of data reporting and drawing conclusions was
almost the last instructional episode in each investigation. We wonder whether teachers
would overlook the importance of this session because of its proximity to the end of the
instructional process and whether the average of seven minutes was enough for teachers
to carry out a productive discussion to make sense of the data and connect the data
pattern to the explanations. Fortunately, according to the finding, most of the teachers (6
teachers for each of the EN and HC modules) led the class discussion on “reporting the
investigation data and then drawing conclusions” in the two coded investigations/lessons.
However, for teachers teaching the EN module, this amount of time was relatively very
little compared to that of teachers in the HC module. Based on the analysis that showed a
positive and high correlation between the amount of time teachers engaged students in
this session and the quality of instruction, it indicated if teachers did not go through the
18
reporting of data and drawing of conclusions with adequate time for implementing this
type of conceptual discussion, their instructional quality was jeopardized and
consequently, it may result in the possibility that students are less likely to achieve the
coherent understanding of the key concepts and learning goals designed and embedded
by the curriculum developers.
As shown in Table 4, for the Environments module, the assigned video codes
which indicate the quality of teachers’ instruction, ranged from 1 (teacher 5) to 43
(teacher 3) with an average of 20.5 and standard deviation of 13.9. For Heat and Change
teachers, the assigned video codes representing the quality of teachers’ instruction ranged
from 42 (for teacher 2) to 114 (for teacher 6) with an average of 69 and standard
deviation of 30.27. It seemed the teaching quality of Heat and Change teachers were
much better than those of Environments teachers. However, after eliminating the impact
of effects resulting from the difference in amount of time teachers spent on teachers’
instructional quality by an ANCOVA statistical procedure with ‘the amount of time
teachers spent on data reporting and drawing conclusions’ as covariate (controlling
variable), it showed there is no difference (F = .336, p > .05) between these two groups of
teachers in terms of instructional quality. In other words, based on the statistics, if
teachers who taught the Environments module in the first place had spent as much time
as Heat and Change teachers did, their instructional quality should have been equally as
high as that for Heat and Change teachers.
19
Table 4
Summary of Assigned Codes for Instructional Quality Based on Transcribed Videotaped Investigations
Teacher
ID
Length of
Investigation
(in sec.)
Number of
Investigation
/Lesson
Alignment of Key
Concepts to the
Learning Goals
Evidence
Provided to
Support Claims
Making
Connections
Engaging
Student in
Learning
Students’
Response to
Learning
Sum of Video
Codes
Environment
1 447 2 4 7 3 1 0 15
2 - a - - - - - - -
3 1261 2 21 9 10 0 33 43
4 865 2 9 0 5 2 12 17
5 249 2 0 0 0 0 1 1
6 1166 2 17 4 2 1 24 26
7 1067 2 6 8 0 4 21 21
Heat and Change
1 3347 2 19 34 6 2 3 64
2 2270 2 9 20 7 3 3 42
3 4285 2 19 64 2 2 13 100
4 1522 2 18 33 3 1 1 56
5 1424 2 10 25 1 2 5 43
6 4256 2 18 87 5 2 2 114
a Teacher 2 in Environments module did not have any video clips found for reporting data and drawing conclusions.
20
The study further examined how students’ performance was associated with their
teachers’ instructional quality by taking ‘the amount of time teachers spent in guiding
data reporting and conclusion drawing’ as covariates. The summary of correlation
coefficient report is shown in Table 5. The correlation tested whether student
performance categorized by types of item proximity reflects the quality of teachers’
instructions in many aspects. Admittedly, the results have to be interpreted with caution
because of the sample size with 6 teachers involved in the study only. As a result, most of
the correlation coefficients were not significant (p > .05) because higher correlation
coefficients are required to reach statistical significance for smaller sample sizes.
However, the study showed some potential patterns.
One hypothesis of the study was that the assigned video codes which indicted
instructional quality would show higher correlation with student performance in the close
and proximal items and no correlation with student learning outcomes in distal items.
That is, for a group of teachers, if the intended curriculum is enacted, the correlation
between student performance in both close and proximal items and the quality of teachers’
instruction is expected to be higher than that between student performance in distal items
and the quality of instruction.
The hypothesis was developed by the rationale that quality instruction not only
supports what students have learned in the classes but also facilitates students to apply the
underlying concepts they have learned from close items to answering the proximal items
related to the learning transfer in novel situations.
21
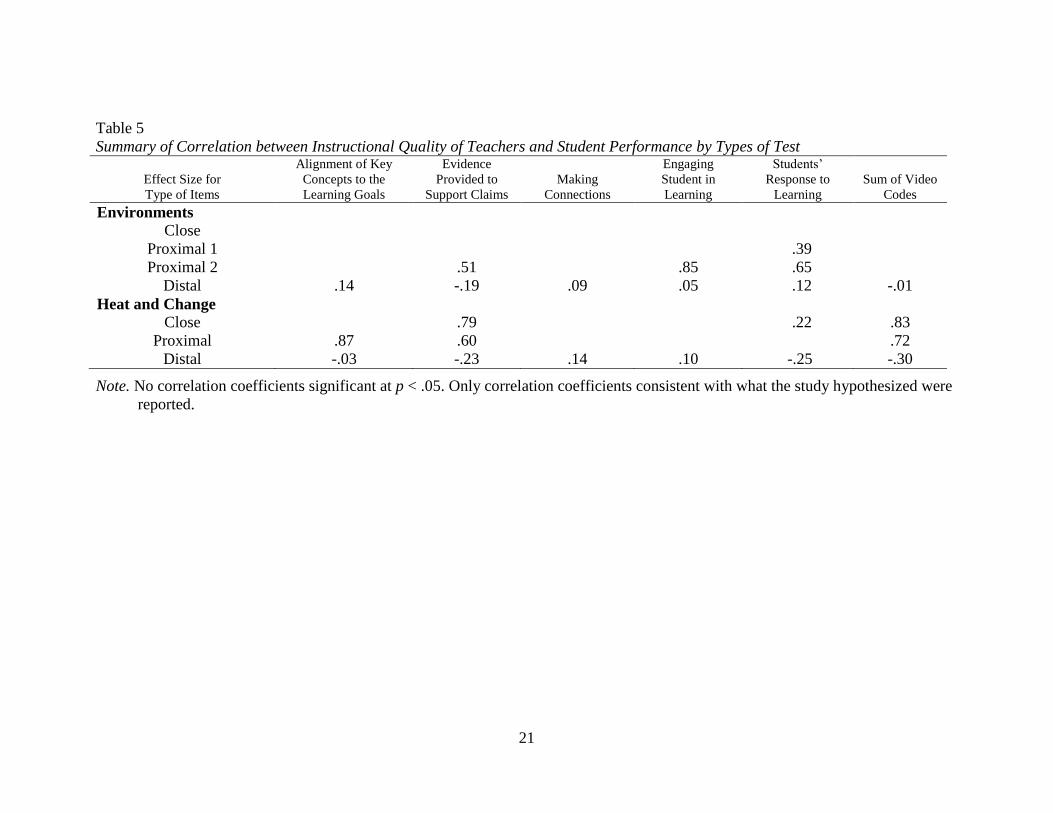
Table 5
Summary of Correlation between Instructional Quality of Teachers and Student Performance by Types of Test
Effect Size for
Type of Items
Alignment of Key
Concepts to the
Learning Goals
Evidence
Provided to
Support Claims
Making
Connections
Engaging
Student in
Learning
Students’
Response to
Learning
Sum of Video
Codes
Environments
Close
Proximal 1 .39
Proximal 2 .51 .85 .65
Distal .14 -.19 .09 .05 .12 -.01
Heat and Change
Close .79 .22 .83
Proximal .87 .60 .72
Distal -.03 -.23 .14 .10 -.25 -.30
Note. No correlation coefficients significant at p < .05. Only correlation coefficients consistent with what the study hypothesized were
reported.
22
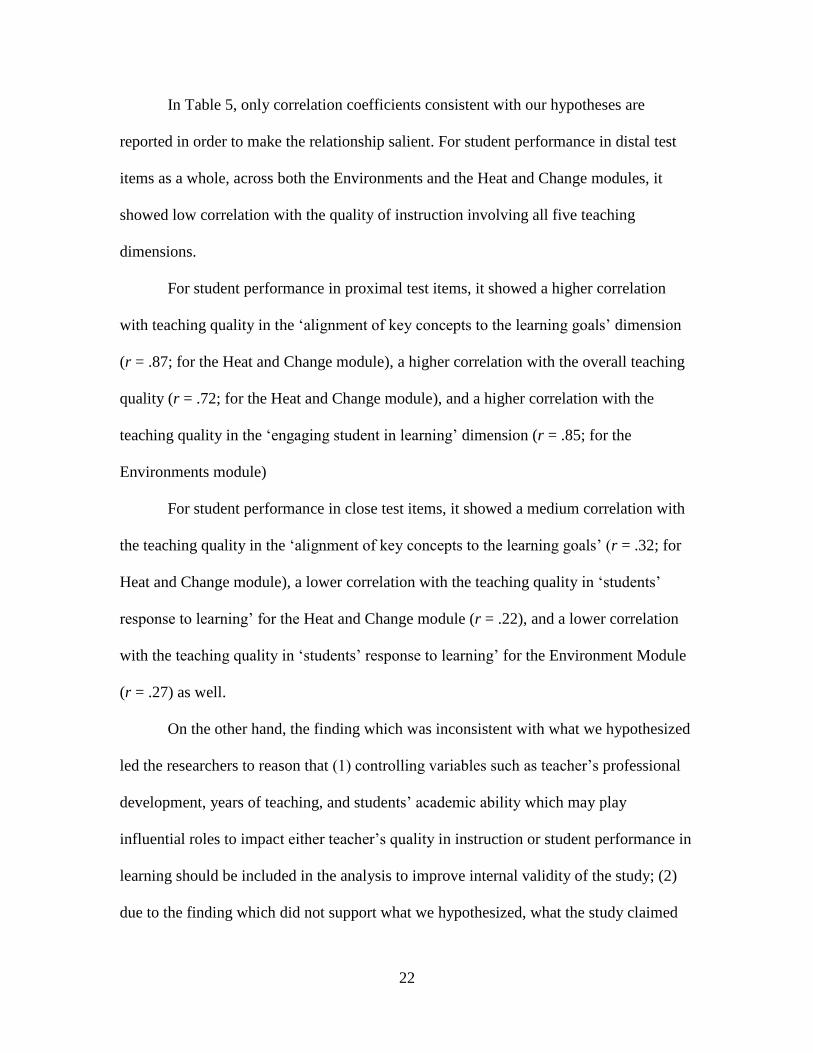
In Table 5, only correlation coefficients consistent with our hypotheses are
reported in order to make the relationship salient. For student performance in distal test
items as a whole, across both the Environments and the Heat and Change modules, it
showed low correlation with the quality of instruction involving all five teaching
dimensions.
For student performance in proximal test items, it showed a higher correlation
with teaching quality in the ‘alignment of key concepts to the learning goals’ dimension
(r = .87; for the Heat and Change module), a higher correlation with the overall teaching
quality (r = .72; for the Heat and Change module), and a higher correlation with the
teaching quality in the ‘engaging student in learning’ dimension (r = .85; for the
Environments module)
For student performance in close test items, it showed a medium correlation with
the teaching quality in the ‘alignment of key concepts to the learning goals’ (r = .32; for
Heat and Change module), a lower correlation with the teaching quality in ‘students’
response to learning’ for the Heat and Change module (r = .22), and a lower correlation
with the teaching quality in ‘students’ response to learning’ for the Environment Module
(r = .27) as well.
On the other hand, the finding which was inconsistent with what we hypothesized
led the researchers to reason that (1) controlling variables such as teacher’s professional
development, years of teaching, and students’ academic ability which may play
influential roles to impact either teacher’s quality in instruction or student performance in
learning should be included in the analysis to improve internal validity of the study; (2)
due to the finding which did not support what we hypothesized, what the study claimed
23
should be re-examined based on the findings; (3) the effect of assigned video codes
which indicated quality of instruction may not be universal. That is, some of our aspect
codes may be more relevant to help students to gain clarity on what they have just learned
from lessons (i.e., close item related) whereas others are helpful to support students to
transfer what they learned to novel situations (i.e., proximal item related), and (4) some
coding dimensions did not have enough variation across teachers suggesting a lack of
sensitivity of the coding questions/rules which may result from rater quality, the number
of points on coding scales, the number of items developed for each coding category, and
the cognitive load for raters (Hill, Charalambous, & Kraft, 2012; Ing & Webb, 2012); and
(5) the video clip sampling strategy should be re-examined such as the number of video
clips selected, the number of lessons included and the representativeness of selected
video clips chose.
Conclusions
The success of science education relies on the quality of teaching that takes place
in the classroom. Meaningful and successful learning will not happen automatically for
students without deliberate scaffolding from teachers. If teachers fail to support students
to make connections between key concepts and investigation data for a given curriculum,
students will end up with scattered, disconnected pieces of information rather than
integrated big ideas that cross curricula.
As the findings indicated, the time spent in data reporting and drawing
conclusions was related to student gain scores in science achievement and may determine
whether students are able to connect collected data to the learning goals/objectives
embedded in the curriculum. According to the summarized codes of the instructional

24
quality, the study found most teachers did carry out class discussions for reporting data
and drawing conclusions after conducting scientific investigations. However, the time
they engaged students in during these critical periods varied highly and may not be
enough for some teachers guiding student to make meaningful connections to learning
targets.
Furthermore, we looked into the correlation between the assigned video codes as
an indicator for the quality of instruction and the student performance effect sizes derived
from the gain scores based on the difference between taking a pre- and posttest. Overall,
there were no neat or significant patterns of the correlation coefficients.
Overall, the finding of the study partially supported what we hypothesized- the
test items developed at different level of proximity to the intended curriculum content
showed differential correlation functioning to quality of teacher’s instruction to some
degree. That is, the association between quality of teachers’ instruction and student
performance varied depending on test items developed at different levels of proximity to
the intended curriculum. In general, the study in part supported one of hypotheses: we
expected the instructional quality would show higher correlation with student
performance in close and proximal items, and no correlation with student performance in
distal items. The inconsistency in the findings may be associated with the small sample
size of participant teachers, the lack of variation in video coding, only a few
investigations or lessons involved in the study, or the decision of only focusing on the
video segment of data reporting and drawing conclusions.
The lessons we learned from the study also included the following: (1) we did not
include other sources of data, such as science notebooks and teacher interviews in our
25
data analysis, which could provide data triangulation and help us to end up with a more
reliable and complete picture about teachers’ instruction; (2) we only coded the
occurrence of the instructional supports, and did not take a closer look at the quality of
these indicators which may differentiate quality of instruction to reflect what teachers’
instruction really is; (3) we did not include co‐variants, such as pre-test scores for student
performance and background information for teachers to adjust potentially biased
measure outcomes; (4) the lack of sensitivity of coding system in some aspects raised
concerns about rater quality, coding scaling and scoring, and coding strategies; and (5)
sampling plan such as how to select video clip representative of teachers’ classroom
practices and what aspects should be included to more effectively measure the quality of
instruction should be re-examined
26
References
Giamellaro, M., Lan, M,, Ruiz-Primo, M. A., & Li, M. (2011, April). Addressing
elementary teachers misconceptions in science and supporting peer learning
through curriculum mapping. Paper presented at NARST annual meeting,
Orlando, FL.
Hill, H, C., Charalambous, C. Y., & Kraft, M. A. (2012). When rater reliability is not
enough: Teacher observation systems and a case for the generalizability study.
Educational Researcher, 41(2), 56-63.
Ing M., & Webb, N. M. (2012). Characterizing mathematics classroom practice: Impact
of observation and coding choices. Educational Measurement: Issues and
Practice, 31 (1), 14-26.
Leinhardt, G. (1983). Overlap: Testing whether it is taught. In G. F. Madaus (Ed.). The
courts,validity, and minimum competency testing (pp. 153-170). Boston, MA:
Kluwer-Nijhoff Publishing.
Polikoff, M. S. (2010). Instructional sensitivity as a psychometric property of
assessments, Educational Measurement: Issues and Practices, 29(4), 3‐14.
Popham, W. J. (2007). Instructional sensitivity of tests: Accountability’s dire drawback.
Phi Delta Kappan, 89(2), 146-150, 155.
Ruiz‐Primo, M. A. (2010, March). Developing and evaluating instructional sensitive
assessments. REESE PI Meeting. Washington, DC: National Science Foundation.
Ruiz‐Primo. M. A., & Li, M. (2008). Building a methodology for developing and
evaluating instructionally sensitive assessments. Proposal submitted to National
27
Science Foundation. Award ID: DRL‐0816123. Washington, DC. National
Science Foundation.
Ruiz‐Primo. M. A., & Li, M. (2012). Assessing transfer of learning: Instructionally
sensitive assessments, curriculum, and instruction. Paper presented at the AERA
meeting, Vancouver, Canada.
Ruiz-Primo, M. A., Li. M., Giamellaro, M., Wills, K., Mason. H., Lan, M., & Wang.
(2012). Instructional science curricula characteristics and transfer of learning:
On learning goals, opportunities to achieve them, and opportunity to transfer
what was learned. Paper presented at the AERA meeting, Vancouver, Canada.
Ruiz‐Primo, M. A., Shavelson, R. J., Hamilton, L. & Klein, S. (2002). On the evaluation
of systemic education reform: Searching for instructional sensitivity. Journal of
Research in Science Teaching, 39(5), 369‐393.
Tarr, J. E., Ross, D. J., McNaught, M. D., Chávez, O., Grouws, D. A., Reys, R. E.,
Swears, R., & Taylan, R. D. (2010, April). Identification of student- and teacher-
level variables in modeling variation of mathematics achievement data. Paper
presented at the AERA meeting, Denver.
Wiliam D. (2007, September). Sensitivity to instruction: The missing ingredient in large-
scale assessment systems? Paper presented at the Annual Meeting of the
International Association for Educational Assessment. Baku, Azerbaijan.
28
Appendix 1. Coding questions, Categories, Rules, and Examples for Coding transcribed Video Clips
ITEM
# CATEGORY CODING FOCUS EXPLANATION EXAMPLES
Alignment of Key Concepts to the Learning Goals. Use of Concept (may be a key word, a term, or a combination of terms defined by researchers) for instructional
purpose. What teacher tries to accomplish with the use of the concept?
Teacher…
A1 Priming 0=No/1=Yes
(for each
highlighted chunk)
- Mentions the concept (key word, term, or a combination of
terms) at the beginning of the day, the activity, or the discussion
- We are going to talk about ROT.
A2 Defining/Elaborating 0=No/1=Yes
(for each
highlighted chunk)
- Provides/asks Ss the definition of the concept (key word, term
or a combination of term)
- What is ROT?
- Corrects the use of the concept (key word, term, or a
combination of terms)
- You should use range of tolerance
instead of tolerance.
- What is the vocabulary (key words)
we use for this case/concept?
- Models the right use of the vocabulary
A3 Providing examples 0=No/1=Yes
(for each
highlighted chunk)
- Uses/asks examples to illustrate or elaborate the concept (key
word, term, or a combination of terms)
- The ROT in terms of water for peas
and tomatoes is different.
A4 Making sense of
results/Interpreting
collected data
0=No/1=Yes
(for each
highlighted chunk)
- Uses the concept (key word, term, or a combination of terms) to
(1) probe the investigation results or (2) facilitate the
conclusion
- The optimum condition for shrimp
hatching is 2 spoons of salts.
A5 Comparing w/ other
terms/conceptions
0=No/1=Yes
(for each
highlighted chunk)
- Compares, contrasts, and connects the concept (key word term,
or a combination of term) with other relevant concepts which
may or may not come from other investigations or lessons.
- The optimum condition is
somewhere within the ROT.
A6 Other 0=No/1=Yes
(for each
highlighted chunk)
- Whatever does not fit in any other category (A1 to A5)
Evidence Provided to Support Claim. Supporting students in transforming observation/collected data into evidence and into explanations/conclusions
Teacher…
E1 Prompting for evidence
(for T only)
0=No/1=Yes
(for each
highlighted chunk)
- Reminds student that they need to include/provide evidence, but
students do not tell how to do so, or what evidence is
- T: You should have evidence in
your conclusion (e.g., beginning of
the lesson or discussion evidence is
mentioned)
E2 Linking implicitly
evidence and claims
(for T only)
0=No/1=Yes
(for each
highlighted chunk)
- Students offer evidence to support claims. However, teachers
hint/remind/respond/comment students about the use of
evidence without explicitly describing why providing evidence
is good. The comment is not descriptive, often as an evaluative
- T: It’s a good way to backup your
claim.
- T: Excellent job of evidence. The
evidence is great!
29
ITEM
# CATEGORY CODING FOCUS EXPLANATION EXAMPLES
comment/feedback
E3 Linking explicitly evidence
and claims
(for T only)
0=No/1=Yes
(for each
highlighted chunk)
- Explains explicitly what Ss need to do with evidence and claims
- Teacher only asks for evidence to support the claim provided by
either the teacher or students prior to the conversation since the
instructional goal is to push students to include evidence in
addition to the claims they made.
- T: Be sure to include your
investigation data when you report
conclusions
- T: More erosion happened with the
flood you know that is because …?
- T: What is the evidence for your
conclusion?
- Refers to the cases that Ss offer linking/providing information
explicitly about the use of evidence to support claims
- T: What Tony claim is … and the
evidence he used to support his
claim is ….
- Models the type of evidence that should be included in the
conclusion
- T: Number of leaves, lengths of
roots/stems should be reported for
your claim
Student…
E4 Providing claims without
evidence
(for S only)
0=No/1=Yes
(for each
highlighted chunk)
- Provides claims without evidence - S: The ROT of water is from dry to
moist.
- Respond/completes the claim that the T starts/asks - T: “what is the optimum
condition?” S: “4”.
E5 Providing evidence
without claims
(for S only)
0=No/1=Yes
(for each
highlighted chunk)
- Provides evidence or describes the investigation data only
without any obvious claims in the chunk
- T:Hunter, do you have a claim and
evidence?
S: This was hers but I noticed that
the washer got to- from each edge
and it eroded- it didn't erode that far
but it eroded a lot-a really wide.
E6 Providing claims with
evidence
(for S only)
0=No/1=Yes
(for each
highlighted chunk)
- Student response includes the evidence although the quality
may not be good
- S: The optimum condition for
hatching is 2 spoons of salts because
the number of hatched eggs is the
most.
- T: More erosion happened with the
flood you know that is because …. S:
our delta length is 34 cm.
Making Connections. Teacher supports students learning by making connections
Teacher…
M1 Other investigations or
lessons
0=No/1=Yes
(for each
highlighted chunk)
- Conceptually compares, contrasts, and connects the concept
(key word, term of a combination of terms) with another
concept(s) in other lessons or investigations related to the Big
- What environment factor (a key
word for another lesson) can be
investigated for the ROT?
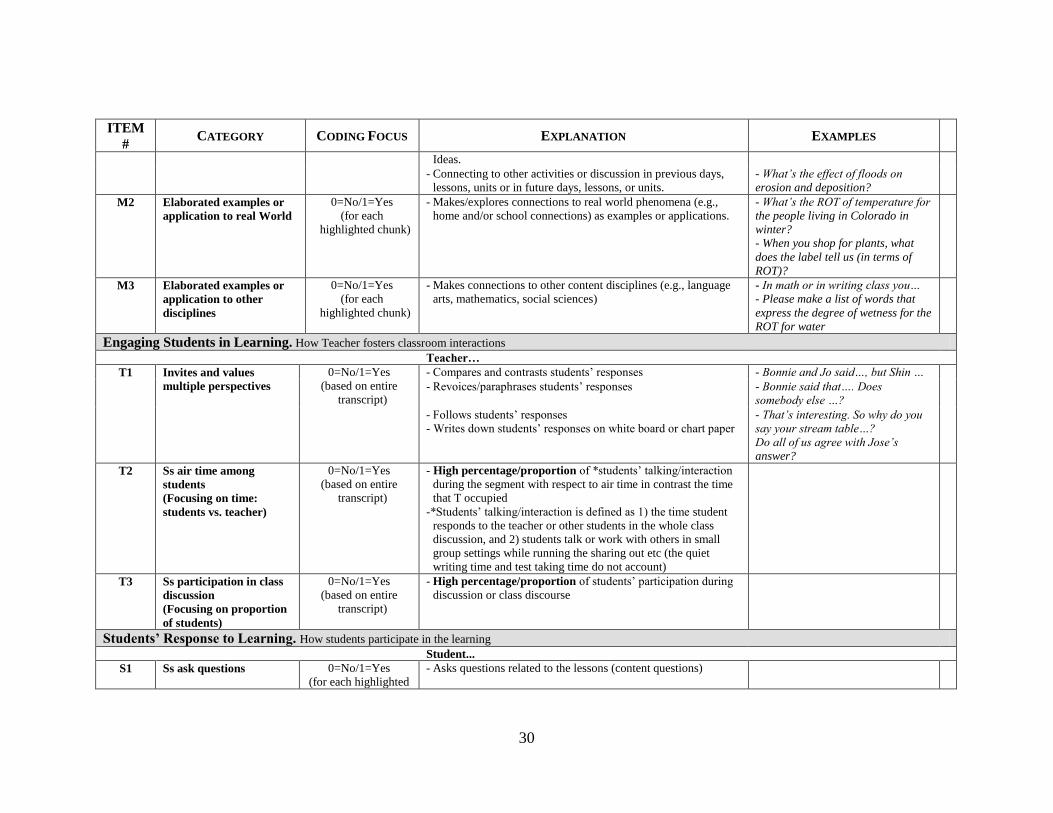
30
ITEM
# CATEGORY CODING FOCUS EXPLANATION EXAMPLES
Ideas.
- Connecting to other activities or discussion in previous days,
lessons, units or in future days, lessons, or units.
- What’s the effect of floods on
erosion and deposition?
M2 Elaborated examples or
application to real World
0=No/1=Yes
(for each
highlighted chunk)
- Makes/explores connections to real world phenomena (e.g.,
home and/or school connections) as examples or applications.
- What’s the ROT of temperature for
the people living in Colorado in
winter?
- When you shop for plants, what
does the label tell us (in terms of
ROT)?
M3 Elaborated examples or
application to other
disciplines
0=No/1=Yes
(for each
highlighted chunk)
- Makes connections to other content disciplines (e.g., language
arts, mathematics, social sciences)
- In math or in writing class you…
- Please make a list of words that
express the degree of wetness for the
ROT for water
Engaging Students in Learning. How Teacher fosters classroom interactions
Teacher…
T1
Invites and values
multiple perspectives
0=No/1=Yes
(based on entire
transcript)
- Compares and contrasts students’ responses - Bonnie and Jo said…, but Shin …
- Revoices/paraphrases students’ responses - Bonnie said that…. Does
somebody else …?
- Follows students’ responses
- Writes down students’ responses on white board or chart paper
- That’s interesting. So why do you
say your stream table…?
Do all of us agree with Jose’s
answer?
T2 Ss air time among
students
(Focusing on time:
students vs. teacher)
0=No/1=Yes
(based on entire
transcript)
- High percentage/proportion of *students’ talking/interaction
during the segment with respect to air time in contrast the time
that T occupied
-*Students’ talking/interaction is defined as 1) the time student
responds to the teacher or other students in the whole class
discussion, and 2) students talk or work with others in small
group settings while running the sharing out etc (the quiet
writing time and test taking time do not account)
T3
Ss participation in class
discussion
(Focusing on proportion
of students)
0=No/1=Yes
(based on entire
transcript)
- High percentage/proportion of students’ participation during
discussion or class discourse
Students’ Response to Learning. How students participate in the learning
Student...
S1 Ss ask questions 0=No/1=Yes
(for each highlighted
- Asks questions related to the lessons (content questions)
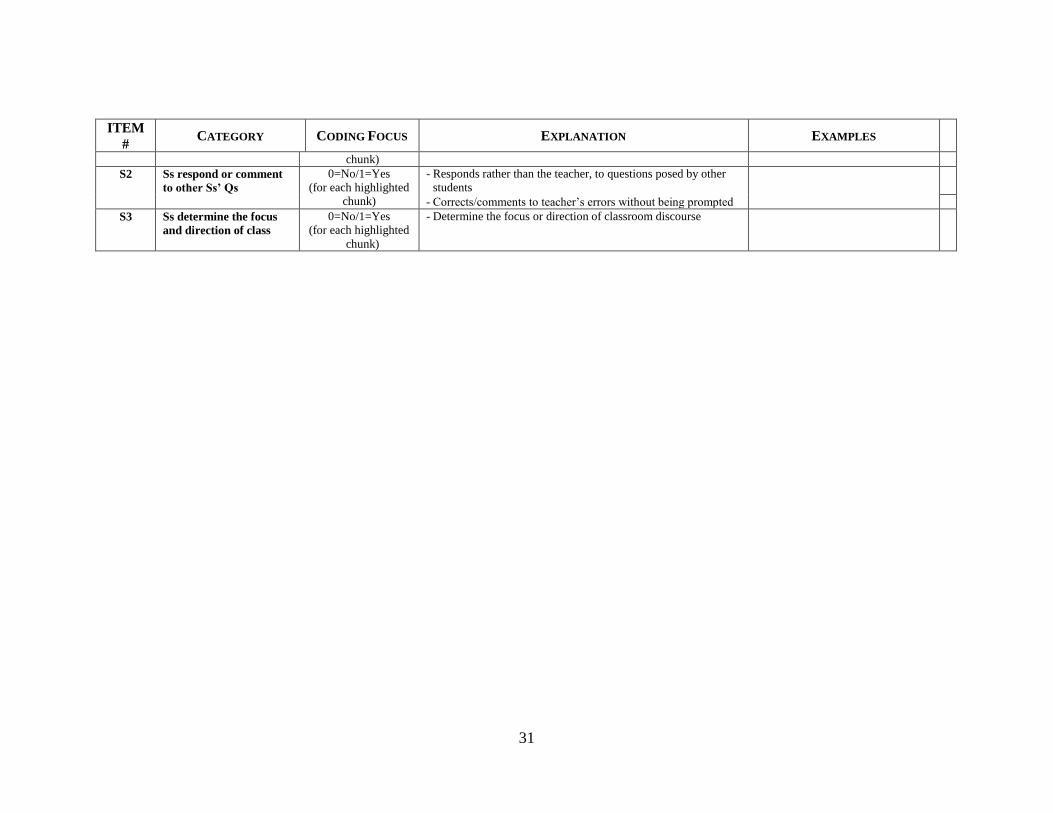
31
ITEM
# CATEGORY CODING FOCUS EXPLANATION EXAMPLES
chunk)
S2 Ss respond or comment
to other Ss’ Qs
0=No/1=Yes
(for each highlighted
chunk)
- Responds rather than the teacher, to questions posed by other
students
- Corrects/comments to teacher’s errors without being prompted
S3 Ss determine the focus
and direction of class
0=No/1=Yes
(for each highlighted
chunk)
- Determine the focus or direction of classroom discourse