links between the environment, economy and jobs
TRANSCRIPT

In association with
Cambridge Econometrics
Links between the environment,
economy and jobs
6th November 2007
Links between the environment, economy and jobs
DG Environment
Submitted by GHK Consulting
In association with
Cambridge Econometrics
Institute of European Environmental Policy
Date06/11/2007
526 Fulham Road, London, SW6 5NR
Tel: 020 7471 8000; Fax: 020 7736 0784
www.ghkint.com

Links between the environment, economy and jobs
Document Control
Document Links between the environment, economy and jobs
Job No. J3476 – Final report
Prepared by Adarsh Varma
Checked by James Medhurst
Date 06/11/07
Links between the environment, economy and jobs
GHK in association with CE and IEEP 4
CONTENTS
PART A: INTRODUCTION AND SUMMARY OF RESULTS ........................................................... 1
1 ECONOMY-ENVIRONMENT LINKAGES .................................................................................. 1
1.1 The Purpose of the Study ........................................................................................................ 1
1.2 The Nature of Environment- Economy Linkages ..................................................................... 2
1.3 From Eco-Industries to Environment Related Economic Activities .......................................... 4
1.4 A New Typology of Linkages ................................................................................................... 5
1.5 Approach to the Quantification of Economic Impacts .............................................................. 9
1.6 Structure of the Report ........................................................................................................... 10
2 SUMMARY OF RESULTS ........................................................................................................ 11
2.1 Economic Significance of Environment Related Activities ..................................................... 11
2.2 Sectoral Importance of Environment Related Activities ......................................................... 14
2.3 Economic Impacts of Selected Policy Scenarios ................................................................... 17
2.4 The Changing Economic Significance of Environment Related Activities ............................. 19
2.5 Further developments – next steps ........................................................................................ 19
PART B: ECONOMIC IMPACT OF ENVIRONMENT RELATED ACTIVITIES ............................. 24
3 APPROACH TO THE ESTIMATION OF ECONOMIC IMPACTS ............................................ 25
3.1 Introduction ............................................................................................................................ 25
3.2 Estimating the Economic Impact of Environment Related Activities ..................................... 26
4 ECONOMIC IMPACTS OF ENVIRONMENT RELATED ACTIVITIES .................................... 31
4.1 Introduction ............................................................................................................................ 31
4.2 Summary of the Overall Impact ............................................................................................. 31
4.3 Employment Impacts from Environment Related Activities ................................................... 34
4.4 Output Impacts from Environment Related Activities ............................................................ 41
4.5 GVA Impacts from Environment Related Activities ................................................................ 49
4.6 Multiplier Effects of the Tourism Sector from WTTC TSA ..................................................... 53
PART C: ECONOMIC IMPACTS OF SELECTED POLICY SCENARIOS .................................... 57
5 INTRODUCTION, APPROACH AND POLICY SCENARIOS .................................................. 58
5.1 Background ............................................................................................................................ 58
5.2 Calculation of Quantity Effects ............................................................................................... 59
5.3 Policy Scenarios ..................................................................................................................... 60
6 ECONOMIC IMPACTS OF THE POLICY SCENARIOS .......................................................... 63
6.1 Scenario 1: Steel Production with Increased Substitution of Recycled Material ................... 63
6.2 Scenario 2: Agricultural Production with an Increase in Output from the Organic Sector ..... 64
6.3 Scenario 3: Reducing water consumption ............................................................................. 67
6.4 Scenario 4a: Increased energy efficiency in the manufacturing sector ................................ 68
6.5 Scenario 4b: Increased energy efficiency in the manufacturing sector ................................. 70
6.6 Scenario 5 Increase in bio-fuels in transport ......................................................................... 73
6.7 Scenario 6a: Increase in Electricity Generation from Renewable Energy Technologies ...... 75
6.8 Scenario 6b: Increase in Electricity Generation from Renewable Energy Technologies at
Higher Costs .................................................................................................................................... 76
6.9 Scenario 7: Reducing the Carbon / Energy Intensity of All Sectors of the Economy ............ 78
6.10 Scenario 8: Increased Use of Structural Funds for Environmental Infrastructure ............... 82
Links between the environment, economy and jobs
GHK in association with CE and IEEP 5
PART D: LINKS TO BIODIVERSITY AND OTHER AREAS NOT CURRENTLY AMENABLE TO
ASSESSMENT USING INPUT-OUTPUT APPROACHES ............................................................. 86
7 INTRODUCTION TO PART D .................................................................................................. 87
8 DRIVERS OF ENVIRONMENT RELATED ECONOMIC ACTIVITIES .................................... 88
9 BIO-DIVERSITY AND LINKS TO THE ECONOMY ................................................................. 90
9.1 A Classification of Bio-diversity and Eco-system Services .................................................... 90
9.2 The Main Linkages between Ecosystem Services and the Economy ................................... 91
9.3 The Scale and Importance of Ecosystem Services ............................................................... 98
9.4 Specific Examples of the Links between Biodiversity and Some Sectors of the Economy . 100
9.5 Conclusions .......................................................................................................................... 102
10 OTHER ECONOMY-ENVIRONMENT LINKAGES .............................................................. 105
10.1 Green Public procurement (GPP) ...................................................................................... 105
10.2 Inward Investment and Business Location Decisions ........................................................ 111
10.3 Environment and Choice of Residential Location .............................................................. 114
10.4 Environment Related Insurance Services, Damage and Rebuild Costs ........................... 116
10.5 Economic Value of the Voluntary Environmental Sector ................................................... 122
11 REFERENCES ...................................................................................................................... 125
12 LITERATURE REVIEW ........................................................................................................ 126

Links between the environment, economy and jobs
GHK in association with CE and IEEP
PART A: INTRODUCTION AND SUMMARY OF RESULTS
Links between the environment, economy and jobs
GHK in association with CE and IEEP 1
1 ECONOMY-ENVIRONMENT LINKAGES
Man shapes himself through decisions that shape his environment.
Rene Dubos
Socialism failed because it couldn't tell the economic truth; capitalism may fail because it couldn't tell the
ecological truth.
Lester Brown, Fortune Brainstorm Conference, 2006
The technologies which have had the most profound effects on human life are usually simple. A good
example of a simple technology with profound historical consequences is hay. Nobody knows who
invented hay, the idea of cutting grass in the autumn and storing it in large enough quantities to keep
horses and cows alive through the winter. All we know is that the technology of hay was unknown to the
Roman Empire but was known to every village of medieval Europe. Like many other crucially important
technologies, hay emerged anonymously during the so-called Dark Ages. According to the Hay Theory of
History, the invention of hay was the decisive event which moved the centre of gravity of urban civilization
from the Mediterranean basin to Northern and Western Europe. The Roman Empire did not need hay
because in a Mediterranean climate the grass grows well enough in winter for animals to graze. North of
the Alps, great cities dependent on horses and oxen for motive power could not exist without hay. So it was
hay that allowed populations to grow and civilizations to flourish among the forests of Northern Europe.
Hay moved the greatness of Rome to Paris and London, and later to Berlin and Moscow and New York.
Freeman Dyson, Infinite in All Directions, Harper and Row, New York, 1988, p 135
1.1 The Purpose of the Study
The main purpose of the study has been to evaluate the economic significance of the
environment in terms of European jobs, output (turnover) and GVA associated with the
range of activities that make use of, or contribute to, environmental resources.
The European Commission recently issued a Working Document on ‗The links between
employment policies and environment policies‖, which set out the importance of the links
between the environment and jobs. This document, and others, have recognised that
the environment clearly acts as one input into the economy and, as such, supports a
number of jobs and economic activity. However, whilst these links clearly exist, there
have been relatively few statistical studies on such aspects.
Many of the studies that have been carried out have followed the OECD/Eurostat (1998)
eco-industries classification1. Considerable effort has also gone into collecting
expenditure statistics using the Eurostat definition of environmental protection
expenditure. Closely linked to this definition, a number of studies have estimated the
number of jobs supported by the ‗eco-industry‘, which generally show that the eco-
industries account for around 1 to 2% of GDP and a similar percentage of jobs in the
economy.
Whilst studies based on the OECD/Eurostat definition have the virtue of having relatively
clear statistical boundaries, they do not by any means include all jobs and economic
activity dependent on the environment. In particular, by concentrating on prevention and
treatment of pollution it excludes jobs for which the environment is a key input into the
1 Please see Annex A for more details.
Links between the environment, economy and jobs
GHK in association with CE and IEEP 2
production process. These jobs and their associated economic activity may be
considerable and include examples such as traditional tourism and agriculture that
depend on the environment for their economic activities.
The purpose of this study has therefore been to examine a broader range of economic
activities concerned with the environment. The study included three types of
environment-economic activities:
1. Activities where the environment is a primary natural resource or input into
the economic process – Agriculture, forestry, mining, electricity generation and
water supply
2. Activities concerned with protection and management of the environment –
Waste recycling, pollution & sewage control, environmental management2
3. Activities dependent on environmental quality – Environment related tourism
The purpose of the study was also to assess direct and indirect effects on the economy. In
addition to the direct economic impacts of environment related activities the study has
quantified the value of economic linkages between the direct economic activities dependent
on the environment and the general economy. Input-output tables for each Member State
(MS) have been used to estimate the indirect and hence total economic impacts of defined
activities that are linked with the use of, or improvement in, environmental resources. The
main results of this analysis are presented in Part B of the report.
The study has also considered the linkages between environmental policy and the
economy, by examining selected examples of policy intervention directed to improved
resource efficiency (e.g. water, energy, waste) and assessing the direct and indirect
economic impacts. Policy scenarios are described as the basis for defining and
estimating the scale of potential economic impacts. The results of this analysis are
presented in Part C of the report.
Finally, in recognition that there remain a number of significant environment related
economic activities that can not be fully quantified, Part D of the report describes a
number of linkages not contained in the fully quantified analysis in Part B.
1.2 The Nature of Environment- Economy Linkages
The size and structure of the economy is fundamentally shaped by the environment.
This is true for a local or national economy as much as for the global economy.
Economic activity in turn changes the environment through the use of resources and
generation of pollution and wastes (Figure 1.1). At one level the economic significance
of the environment can be measured by the size of the economy.
However, to manage the relationship between the economy and the environment such
that the overall stock of natural capital is not depleted over time has short-term
adjustment costs for the economy, even if they are necessary for sustainable
development. These costs do however have compensating benefits in the form of eco-
industries that provide goods and services that enable environmental management.
Furthermore the value of economic activities that make direct use of environmental
resources (such as agriculture, energy or tourism) provides a first indication of the
economic importance of continuing to work to maintain the quantity and quality of
environmental resources.
2 OECD/Eurostat (1998) Eco-industries definition. We have relocated renewable energy under primary
resources

Links between the environment, economy and jobs
GHK in association with CE and IEEP 3
This study seeks to quantify the value of economic activities that directly use and
manage environmental resources.
Figure 1.1: A General Framework of Economy Environment Linkages
ENVIRONMENT
ECONOMY
Environmental
Policy
Key Environmental
Flows
Environmental Resources
• Quantity (eg minerals)
• Quality (eg water, air)
Manufacturing
Environmental
Management
Quantified
Eco-Env
Links
Other Links
Services
Environmental
Quality
Quantified
Eco-Env
Links
Other Links
Climate Change,
Pollution,
Waste
Primary
Use of Natural
Resources
Quantified
Eco-Env
Links
Other Links
Economic
Linkages
Core Economic-Environment Links
– a subset of which is the ‗eco-
industries‘ as in earlier studies
These economic activities that are directly associated with the use and management of
environmental resources also have ‗knock-on‘ (so called ‗multiplier‘) effects on the rest
of the economy. For example, spending on pollution control generates a demand for
components, which in turn generates a demand for raw materials. These knock-on
effects can be calculated based on input-output tables that show the inputs that each
industry needs to produce its own output. The multiplier effects which are based on
these economic linkages capture the economic value generated by the direct use and
management of the environment as it affects the rest of the economy, i.e. the indirect
effect.
To better understand the inter-linkages between the economy and the environment
Table 1.1 provides an illustration of linkages associated with the use and management
of environmental resources, (including that associated with the quality as well as the
quantity of environmental resources) for the three main sections of the economy
(primary, manufacturing, services).
As a first approximation, the use of natural resources is most obviously reflected in the
primary sector, although there are clear uses in other sectors. The need for strong
environmental management and the generation of demand for environmental
management products is generally associated with manufacturing industries, although

Links between the environment, economy and jobs
GHK in association with CE and IEEP 4
other activities also have a requirement for environmental management. The economic
value of the maintenance and enhancement of environmental quality is perhaps most
easily understood in terms of tourism activities, but is obviously integral to all aspects of
economic behaviour (and debated for example in terms of the attraction of inward
investment).
Table 1.1: Examples of Directly Observable / Measurable Environment – Economy
Linkages
Environmental Resources
Economy Use of Natural Resources
Environmental Management
Environmental Quality
Primary Sunlight, water, soil, minerals for energy, agriculture
Mining, energy sector pollution control & waste management
Organic farming, sustainable forestry, rehabilitation of quarries
Manufacturing Water, minerals for industrial production
Industrial pollution control & waste management
Services Tourism related use of water
Waste and resource management / nature protection
Environmentally related tourism, natural risk management
1.3 From Eco-Industries to Environment Related Economic Activities
As Figure 1.1 indicates, there have been previous attempts to define those economic
activities that owe their existence to environmental policy and the maintenance of
natural capital. This has traditionally been based on estimates of pollution control and
waste management expenditure, or market assessments of the value of relevant
products. These so called ‗eco-industries‘ have been defined as the basis of previous
studies using a typology produced by the OECD and Eurostat. This typology has formed
the basis of previous studies (which are discussed further below). It has also been
subject to occasional revision, as other activities that are considered to exist because of
environmental policy, are identified, including for example renewable energy.
However, whilst it is clear that these eco-industries are defined on the basis that they
exist because of environmental policy and the need for environmental management, it is
also clear that as a measure of the economic significance of the environment they are
too limited. However, since measurement is based on typology; and the typology is a
matter of judgement as to what constitutes an environment related economic activity, it
is sensible to use a range of definitions and associated estimates, and allow the user to
select the appropriate definition and related measure.
The European Commission have previously produced two reports3 describing ‗eco-
industries‘ activities i.e. economic activities that produce goods and services to
measure, prevent, limit, minimise or correct environmental damage to water, air and soil,
as well as problems related to waste, noise and eco-systems. This definition refers
mainly to pollution control and resource management. It excludes economic activities
that depend on environmental resources and quality and without which the economy
3 Analysis of the EU Eco-industries, their employment and export potential,‖ Ecotec, 2002 and Study on Eco-
industry, its size, employment, perspectives and barriers to growth in an enlarged EU final report, August
2006, Ernst &Young.

Links between the environment, economy and jobs
GHK in association with CE and IEEP 5
would be smaller. The studies also focus mainly on the direct value added and
employment associated with these activities, and exclude any systematic assessment of
the indirect and induced economic consequences of these activities.
The overall approach to the study has been to build on these previous studies but to
extend the coverage of economic activities included in the analysis, and to deepen the
analysis to include a systematic assessment of the indirect and induced (multiplier)
effects of these activities.
We have therefore used an extended typology of linkages between the economy and
the environment (Section 1.4 below) and sought to measure the economic activities as
part of the system of national accounts and which are taken into account when
measuring levels and changes in GDP. These impacts may relate to the use of
environmental resource in economic production, or to the economic activities
undertaken to protect the environment.
This study is based on a description of the economy based on the sectors and sectoral
linkages as defined in input-output tables4. Combining definitions of the relevant
activities with input-output tables for each of the EU-27 enables the measurement of the
direct and indirect impact of environment related activities on the economy.
Other forms of study have examined the external costs of environmental pollution, the
monetary value of biodiversity services or the willingness to pay for environmental
improvements. These studies can be used to supplement the results of this study.
1.4 A New Typology of Linkages
The general consideration of economy – environment linkages, including the various
drivers for environmentally related economic activities, reference to available literature
and examination of the sectoral definitions used as the basis of national accounts
establishes the basis of a comprehensive and operational typology of environment -
economy links. The typology has two levels: a high level of three broad classes and a
low level comprising sub-divisions of the three classes into more specific linkages.
The high level typology distinguishes between:
1. the environment as a resource input to economic activity;
2. economic activities related to the management of the environment (including
environment protection and resource management)
3. economic activities dependent on environmental quality
These three classes can be further broken down (Table 1.2) to describe a full set of
economy-environment links. This includes linkages which might be contested as being
too broad, but which are relevant to a comprehensive description of linkages. We have
also outlined the main economic sectors / sub-sectors and activity and products
associated with each linkage and compared the linkages with those covered in previous
studies.
4 Please see Annex C for more details on Input-Output tables

Links between the environment, economy and jobs
GHK in association with CE and IEEP 6
Table 1.2: Environment-Economy linkages
Main heading Linkages
Environment related (sector
/ subsector / products /
activity)
CORE
OECD/Eurostat
classification
Ecotec Report E&Y Report
1
Econ based on
Natural resources
(Non renew.)
Natural resource based
activities – non-renewable
natural resources
Energy (coal, oil, gas), mining
& quarrying (minerals)No No
2
Econ based on
Natural resources
(Renew.)
Natural resource based
activities – renewable
resources
Agriculture, timber, fisheries,
renewables, water supply,
pharma (natural drugs)
Water supply and
renewables
Only water
supply
Water supply and
renewables
3
Econ based on
Natural resources
(EcoSP)
Ecologically sustainable
production
Organic farming, Sustainable
forestry, sustainable fisheries,
biofuels; subset of '2'
Sustainable agri,
fisheries and
forestry
No No
4
Environmental
Management (EM)
Greening of the general
economy - process and
appliance and building
efficiency
Energy efficiency in
appliances, process
efficiencies
No No
5
Environmental
Management (PCM)
Historically core Eco-
industries – pollution control
expenditure
SWM (inc direct recycling),
WWT, APC, GPA, PEM, RCS,
NVC, ERD & EMI
All Yes Yes
6
Environmental
Management (RM)
History core- eco-industries
– natural resource
management
Recycled Materials, Nature
protection / conservation,
natural risk mgmt.
All
Recyled
materials and
nature protection
Recyled
materials, nature
protection & eco-
construction
7
Environmental
Management (GP)
Green products - green
procurement
Eco-labels, sustainable
construction (eg passive
houses inc. heat/energy
saving and mgmt), Zero
Emission Vehicles, ethical
investment funds
only indoor air
pollution control &
heat/energy
saving & mgmt
No No
8
Environmental
Quality (EQ)
Economic activities
dependent on environmental
quality
Tourism; recreation; livelihood;
culture value and identity,
health
No No
9
Environmental
Quality (ERT)
Economic activities
dependent on environmental
quality - subset
Env. Related Tourism (ERT),
inward investment, house
prices; subset of 8
eco-tourism No No
10
Environmental
Quality (NRM)
Natural risk management
(NRM) - Avalanches,
droughts, floods, fire,
earthquakes, etc
Residual not captured in 6 -
Insurance, protection of
assets, rebuilding
No No
contested definition of environment
covered by Eurostat/OECD eco-industry definition
linkages documented in the literature for explicit env-eco activities
We summarise the nature of the economic activities, under each of the three high level
classes.
We also provide a review of the relationship between each of the 10 environment-
economy linkages and each of the drivers in Annex B.
1.4.1 Activities where the environment is a primary resource or input into the economic
process
There are three types of environment-economy linkage under this definition of
environment related economic activities:
a) Natural resource based activities – non-renewable natural resources - These
activities are based on the use of non-renewable resources such as fossil fuels,
metals and minerals.
b) Natural resource based activities – renewable resources – activities include
agriculture, timber, fisheries, renewables, water supply, biodiversity based
resources for pharmaceuticals (natural drugs).
Links between the environment, economy and jobs
GHK in association with CE and IEEP 7
c) Ecologically sustainable production – this is a subset of the above natural
resource based activities and include organic farming, sustainable forestry, and
renewable energy.
We have also disaggregated the core environmental activities from the broader sector.
The core sectors as given in Table 1.2 are consistent with the OECD/Eurostat
environmental goods and services industry definition5 shown by the grey cells, but are a
subset of the broader sector.
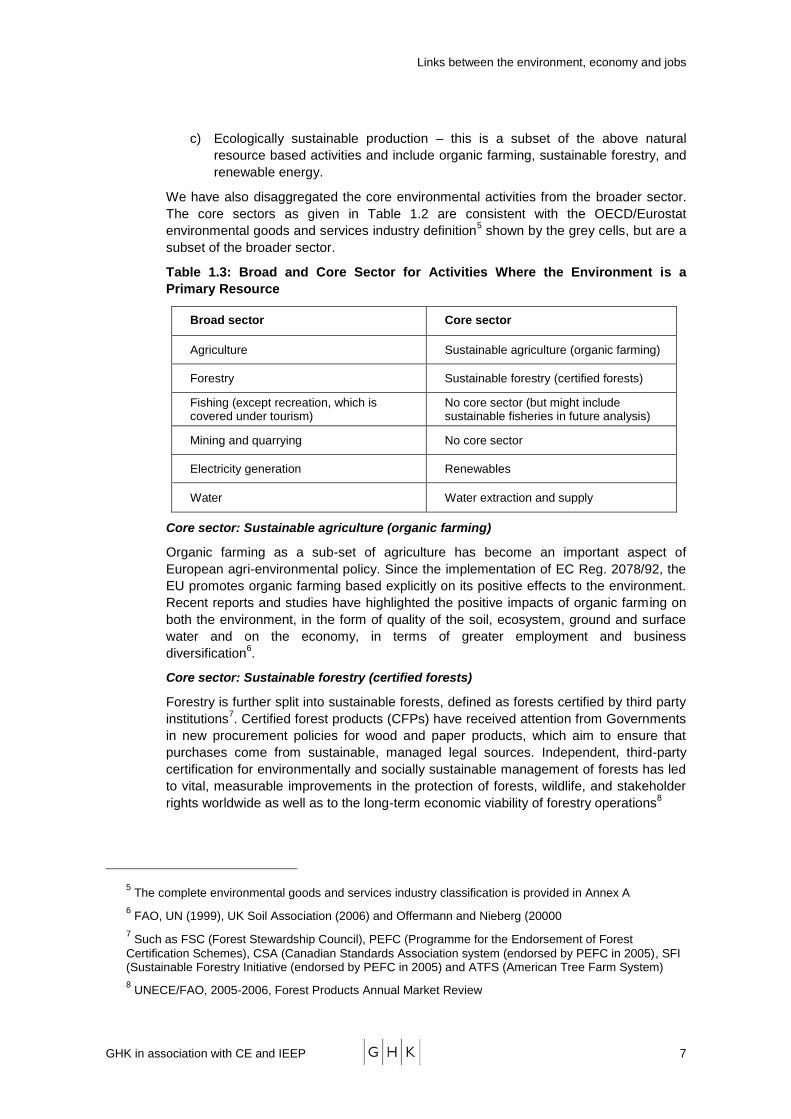
Table 1.3: Broad and Core Sector for Activities Where the Environment is a
Primary Resource
Broad sector Core sector
Agriculture Sustainable agriculture (organic farming)
Forestry Sustainable forestry (certified forests)
Fishing (except recreation, which is covered under tourism)
No core sector (but might include sustainable fisheries in future analysis)
Mining and quarrying No core sector
Electricity generation Renewables
Water Water extraction and supply
Core sector: Sustainable agriculture (organic farming)
Organic farming as a sub-set of agriculture has become an important aspect of
European agri-environmental policy. Since the implementation of EC Reg. 2078/92, the
EU promotes organic farming based explicitly on its positive effects to the environment.
Recent reports and studies have highlighted the positive impacts of organic farming on
both the environment, in the form of quality of the soil, ecosystem, ground and surface
water and on the economy, in terms of greater employment and business
diversification6.
Core sector: Sustainable forestry (certified forests)
Forestry is further split into sustainable forests, defined as forests certified by third party
institutions7. Certified forest products (CFPs) have received attention from Governments
in new procurement policies for wood and paper products, which aim to ensure that
purchases come from sustainable, managed legal sources. Independent, third-party
certification for environmentally and socially sustainable management of forests has led
to vital, measurable improvements in the protection of forests, wildlife, and stakeholder
rights worldwide as well as to the long-term economic viability of forestry operations8
5 The complete environmental goods and services industry classification is provided in Annex A
6 FAO, UN (1999), UK Soil Association (2006) and Offermann and Nieberg (20000
7 Such as FSC (Forest Stewardship Council), PEFC (Programme for the Endorsement of Forest
Certification Schemes), CSA (Canadian Standards Association system (endorsed by PEFC in 2005), SFI (Sustainable Forestry Initiative (endorsed by PEFC in 2005) and ATFS (American Tree Farm System)
8 UNECE/FAO, 2005-2006, Forest Products Annual Market Review
Links between the environment, economy and jobs
GHK in association with CE and IEEP 8
Core sector: Renewable energy
A sub-set of the electricity generation sector is the electricity produced from renewable
energy sources (RES). Policy objectives are driven by Directive 2001/77/EC for the
promotion of electrical energy production from RES and Directive 2003/54/EC which
seeks to increase capacity for production of heat and electricity from RES and the
replacement of fossil fuels and to decrease the load on the environment.
1.4.2 Activities concerned with management of the environment
There are four types of environment-economy links under this definition of environment
related economic activities.
a) Greening of the general economy - process and appliance and building
efficiency – this includes technical change in production processes and products
to use less energy and produce fewer emissions, including modern construction
practices in buildings to reduce carbon and energy footprints.
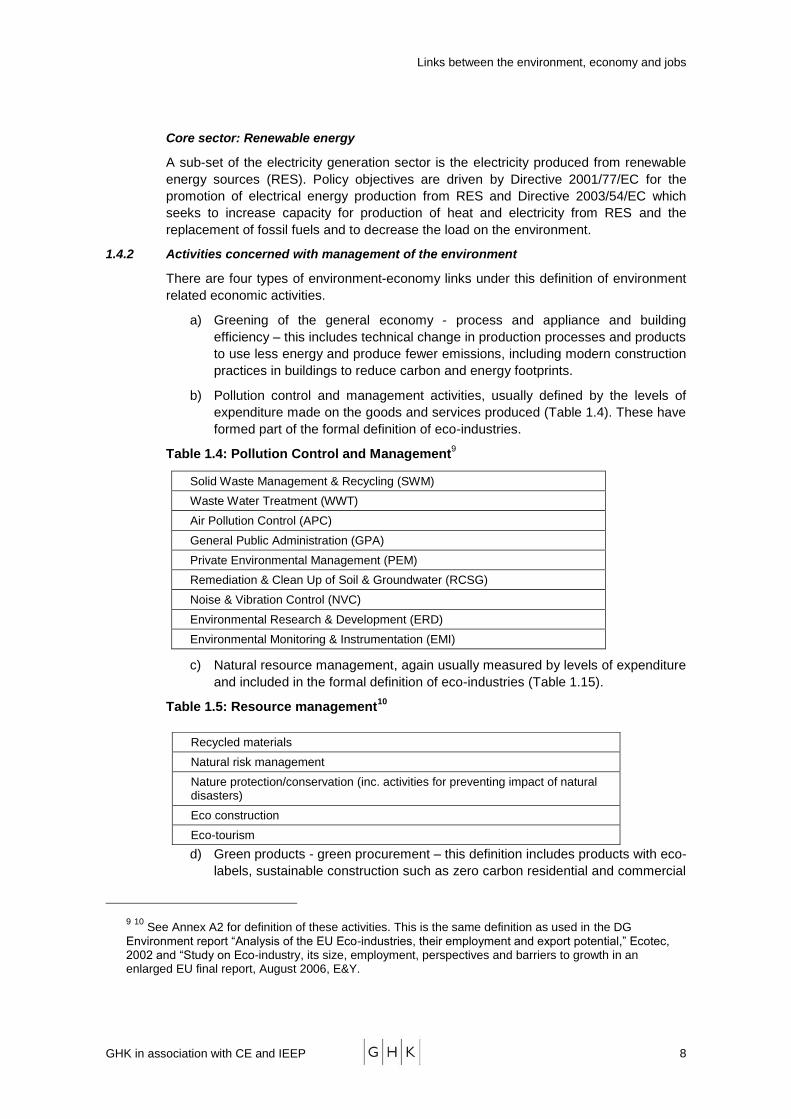
b) Pollution control and management activities, usually defined by the levels of
expenditure made on the goods and services produced (Table 1.4). These have
formed part of the formal definition of eco-industries.
Table 1.4: Pollution Control and Management9
Solid Waste Management & Recycling (SWM)
Waste Water Treatment (WWT)
Air Pollution Control (APC)
General Public Administration (GPA)
Private Environmental Management (PEM)
Remediation & Clean Up of Soil & Groundwater (RCSG)
Noise & Vibration Control (NVC)
Environmental Research & Development (ERD)
Environmental Monitoring & Instrumentation (EMI)
c) Natural resource management, again usually measured by levels of expenditure
and included in the formal definition of eco-industries (Table 1.15).
Table 1.5: Resource management10
d) Green products - green procurement – this definition includes products with eco-
labels, sustainable construction such as zero carbon residential and commercial
9 10
See Annex A2 for definition of these activities. This is the same definition as used in the DG
Environment report ―Analysis of the EU Eco-industries, their employment and export potential,‖ Ecotec, 2002 and ―Study on Eco-industry, its size, employment, perspectives and barriers to growth in an enlarged EU final report, August 2006, E&Y.
Recycled materials
Natural risk management
Nature protection/conservation (inc. activities for preventing impact of natural disasters)
Eco construction
Eco-tourism
Links between the environment, economy and jobs
GHK in association with CE and IEEP 9
developments (includes passive houses/buildings and heat/energy saving and
management), Zero Emission Vehicles (ZEVs), ethical banking and investment
funds.
1.4.3 Activities dependent on environmental quality
There are two types of environment-economy linkages under this definition of
environment related economic activities.
Economic activities dependent on environmental quality – environmental quality
affects economic activities such as tourism and recreation, and provides cultural
identity and health benefits. Environmental quality can affect activities defined in
a number of other sectors. Specific linkages include:
Environment related tourism (ERT), defined as activities where the natural
environment (not the built environment) is responsible for influencing the
choice of destination for the tourism activity. This includes:
Visits to hills, mountains, hills, coasts, farmland, woods, forests, springs,
lakes and wildlife
Activities: fishing (sea, game and coarse), walking, climbing, golfing,
skiing, cycling, bathing/swimming, etc.
Recreation (reflected in health costs/savings) involving exercise/health
benefits attributed to the natural environment (parks, air quality, clean
drinking & bathing water)
Inward investment, defined as the attraction of new businesses into an area
where the quality of the environment is a major determining factor in the
investment decision.
House-building in response to higher house prices that are affected by the
quality of the environment. Green spaces, less noise and pleasant views all
add a premium to house prices.
Natural risk management (NRM) – this extends the natural resource
management definition in Table 1.5 and includes insurance services to
safeguard against natural disasters (avalanches, droughts, floods, fire, coastal
erosion, earthquakes and tsunamis), additional expenditure on environmental
(esp. flood) protection of immovable assets and costs of rebuilding after the
occurrence of natural disasters.
1.5 Approach to the Quantification of Economic Impacts
Having established the typology and the related economic sectors, using the sectoral
definitions contained within the national input-output tables, the work required allocation
of the previous eco-industry analysis to the appropriate activities (see Table 1.2) and
then the calculation of the indirect and induced impacts.
The input-output tables allow the estimation of the economic consequences, or knock-
on effects, of environment related activities by tracing impacts through supply chains
and income effects. These supply and income effects are captured by ‗multipliers‘.
These indicate the ratio of knock-on effects on the rest of the economy, to the direct
impact.
Knock-on effects arise as a result of the purchases made (indirect effects) and the
spending by those in receipt of incomes (induced effects) paid by the defined economic
Links between the environment, economy and jobs
GHK in association with CE and IEEP 10
activities and their suppliers. A detailed description of the use of input-output tables and
Type I (indirect) and Type II (indirect and induced) multipliers is provided in Annex C.
The approach to quantification has also made use of the E3ME economic model
developed by Cambridge Econometrics, which allows the available input-output (I-O)
tables to be integrated with data on the national economies of the EU to allow the I-O
links to be related to the size of national and the EU economy. It also enables the
manipulation of the I-O tables in order to assess the economic impact of policy
scenarios.
The calculation of multipliers provides a useful tool for policy makers, because it
provides a ‗ready reckoner‘ to calculate the economic impacts of a policy proposal,
where the direct impacts can be approximately estimated such as the additional
investment cost, or a change in prices or quantities (e.g. of a given resource)
attributable to the policy intervention.
To test this tool, we have examined the economic impact of selected policy scenarios –
using conventional impact assessment methods, i.e. defining a policy intervention and
estimating the total economic impact (i.e. including multiplier effects). The tool can also
be used to take into account other issues such as economic displacement, as the basis
of estimates of the net additional economic impact.
1.6 Structure of the Report
The next section (2.0) provides an overall summary of the findings of the study.
Detailed analysis and results are contained in the rest of the report, and are structured
into three parts:
Part B – presents the detailed results of the quantification of the economic
significance of environment related activities. This is presented for each of the
linkages defined in the expanded typology, and includes both the direct and
indirect impacts.
Part C – presents selected policy scenarios relevant to current environmental
policy debates and provides an indicative economic impact assessment of each
scenario, using the input-output framework used to quantify the linkages in Part
B. These impact assessments are themselves quite basic, but they are intended
to demonstrate the importance of indirect impacts and hence the value of the
analytical framework developed for the study
Part D – presents a number of other economy-environment linkages which,
because of their character and the difficulty of capturing their significance in
quantitative terms can not be fully captured in the analyses used in Part B.
These includes analysis of the significance of bio-diversity and related eco-
systems for economic activity and specific economic sectors.
A number of Annexes present further detail and explanation of the approaches taken
and provide more detailed results. These are presented in a separate report.
Links between the environment, economy and jobs
GHK in association with CE and IEEP 11
2 SUMMARY OF RESULTS
2.1 Economic Significance of Environment Related Activities
This study builds on two eco-industry reports for DG Environment - ‗Analysis of the EU
Eco-Industries, their Employment and Export Potential‘ (2002) by ECOTEC and more
recently a Study on Eco-industry, its size, employment, perspectives and barriers to
growth in an enlarged EU‘ (2006) by Ernst & Young. Both reports measured jobs and
output in environment related sectors defined partly by the OECD/Eurostat Eco-industry
sectors (See Annex A for more details on the OECD/Eurostat Eco-industry definition).
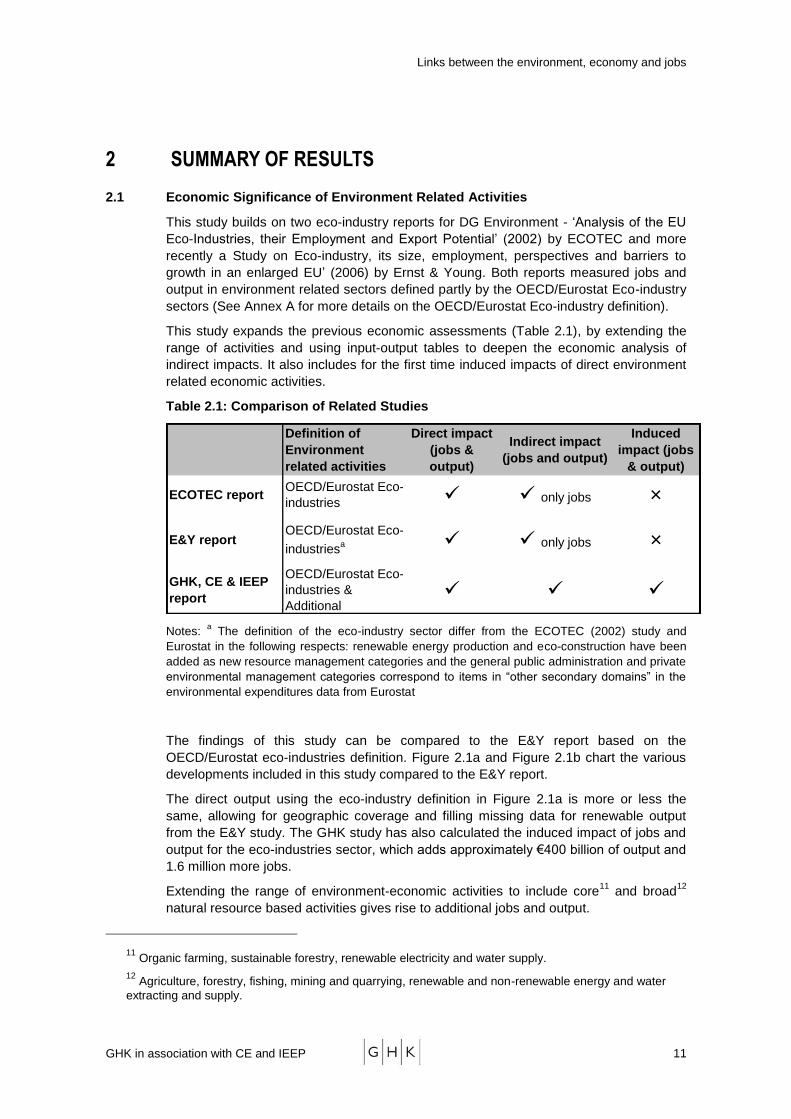
This study expands the previous economic assessments (Table 2.1), by extending the
range of activities and using input-output tables to deepen the economic analysis of
indirect impacts. It also includes for the first time induced impacts of direct environment
related economic activities.
Table 2.1: Comparison of Related Studies
Definition of
Environment
related activities
Direct impact
(jobs &
output)
Indirect impact
(jobs and output)
Induced
impact (jobs
& output)
ECOTEC report OECD/Eurostat Eco-
industries only jobs ×
E&Y report OECD/Eurostat Eco-
industriesa only jobs ×
GHK, CE & IEEP
report
OECD/Eurostat Eco-
industries &
Additional
Notes: a The definition of the eco-industry sector differ from the ECOTEC (2002) study and
Eurostat in the following respects: renewable energy production and eco-construction have been
added as new resource management categories and the general public administration and private
environmental management categories correspond to items in ―other secondary domains‖ in the
environmental expenditures data from Eurostat
The findings of this study can be compared to the E&Y report based on the
OECD/Eurostat eco-industries definition. Figure 2.1a and Figure 2.1b chart the various
developments included in this study compared to the E&Y report.
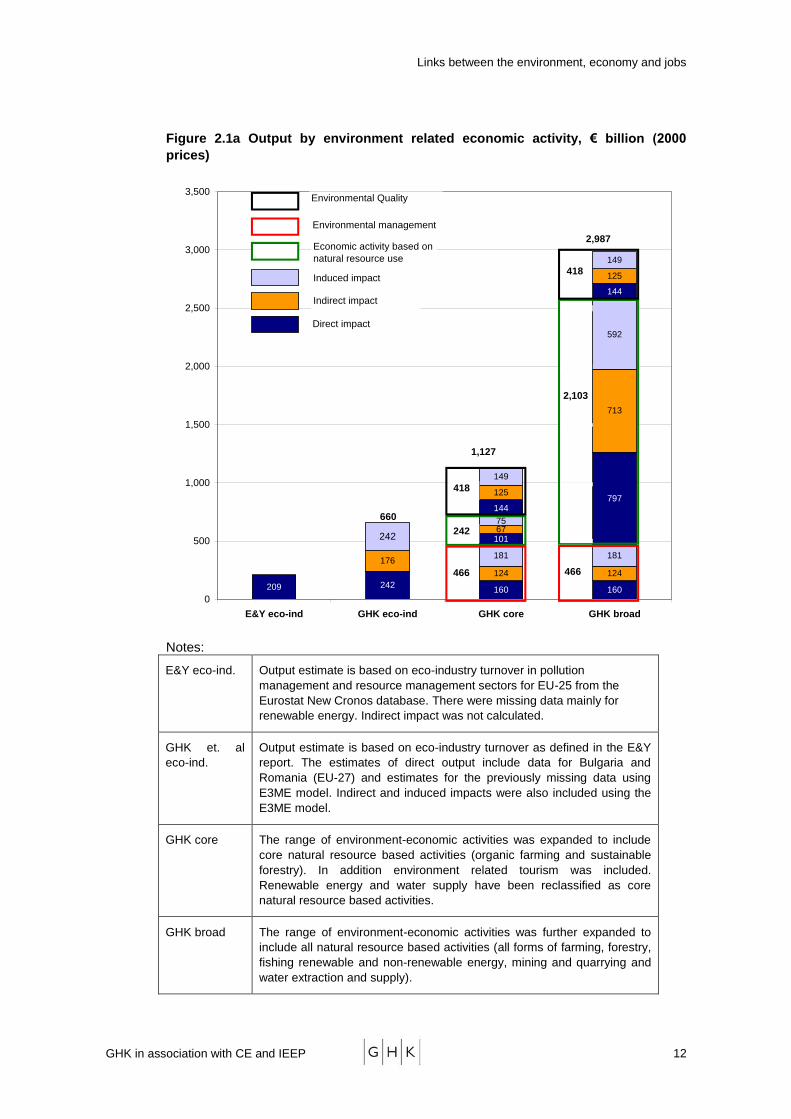
The direct output using the eco-industry definition in Figure 2.1a is more or less the
same, allowing for geographic coverage and filling missing data for renewable output
from the E&Y study. The GHK study has also calculated the induced impact of jobs and
output for the eco-industries sector, which adds approximately €400 billion of output and
1.6 million more jobs.
Extending the range of environment-economic activities to include core11
and broad12
natural resource based activities gives rise to additional jobs and output.
11 Organic farming, sustainable forestry, renewable electricity and water supply.
12 Agriculture, forestry, fishing, mining and quarrying, renewable and non-renewable energy and water
extracting and supply.
Links between the environment, economy and jobs
GHK in association with CE and IEEP 12
Figure 2.1a Output by environment related economic activity, € billion (2000
prices)
209 242
176
242
160 160
124 124
181 181
101
797
67
713
75
592
144
144
125
125
149
149
0
500
1,000
1,500
2,000
2,500
3,000
3,500
E&Y eco-ind GHK eco-ind GHK core GHK broad
1,127
242
466
418
2,103
466
418
660
2,987Economic activity based on
natural resource use
Environmental management
Environmental Quality
Induced impact
Indirect impact
Direct impact
Notes:
E&Y eco-ind. Output estimate is based on eco-industry turnover in pollution
management and resource management sectors for EU-25 from the
Eurostat New Cronos database. There were missing data mainly for
renewable energy. Indirect impact was not calculated.
GHK et. al
eco-ind.
Output estimate is based on eco-industry turnover as defined in the E&Y
report. The estimates of direct output include data for Bulgaria and
Romania (EU-27) and estimates for the previously missing data using
E3ME model. Indirect and induced impacts were also included using the
E3ME model.
GHK core The range of environment-economic activities was expanded to include
core natural resource based activities (organic farming and sustainable
forestry). In addition environment related tourism was included.
Renewable energy and water supply have been reclassified as core
natural resource based activities.
GHK broad The range of environment-economic activities was further expanded to
include all natural resource based activities (all forms of farming, forestry,
fishing renewable and non-renewable energy, mining and quarrying and
water extraction and supply).
Links between the environment, economy and jobs
GHK in association with CE and IEEP 13
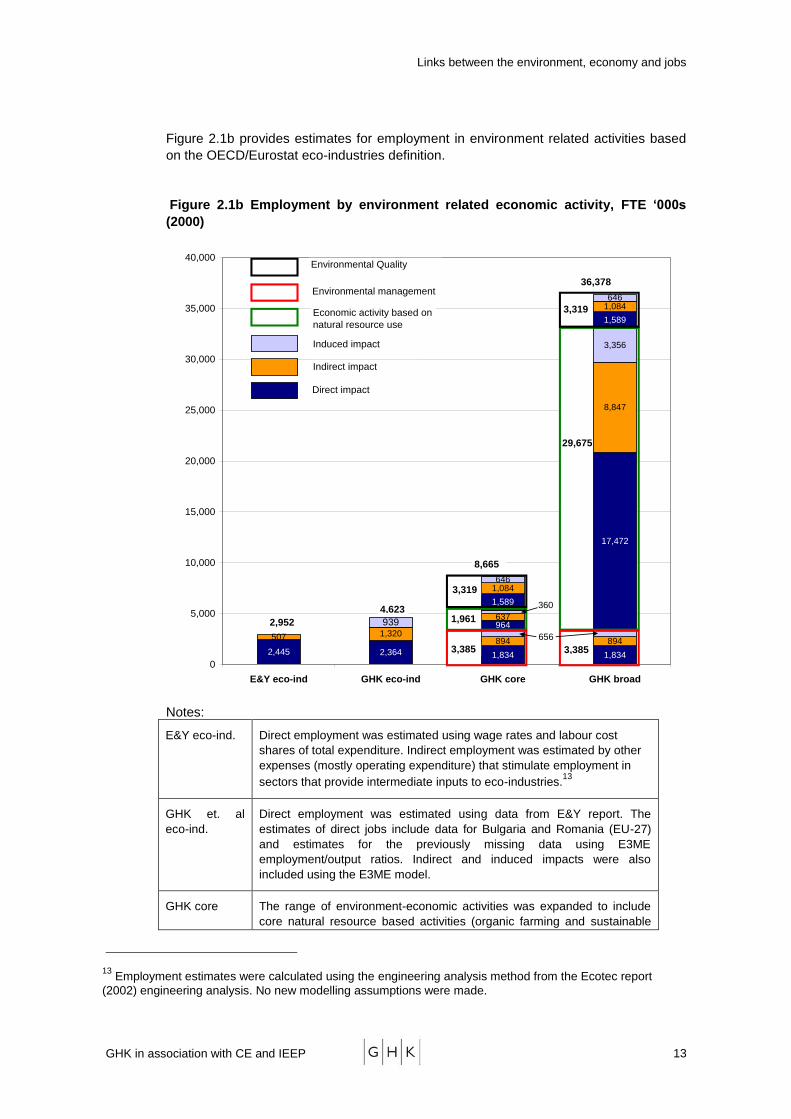
Figure 2.1b provides estimates for employment in environment related activities based
on the OECD/Eurostat eco-industries definition.
Figure 2.1b Employment by environment related economic activity, FTE ‘000s
(2000)
2,445 2,364
507 1,320
939
1,834 1,834
894 894
964
17,472
637
8,847
3,356
1,589
1,589
1,084
1,084
646
646
656
0
5,000
10,000
15,000
20,000
25,000
30,000
35,000
40,000
E&Y eco-ind GHK eco-ind GHK core GHK broad
1,961
3,385
3,319
29,675
3,385
3,319
36,378
Economic activity based on
natural resource use
Environmental management
Environmental Quality
Induced impact
Indirect impact
Direct impact
360
8,665
4,623
2,952
Notes:
E&Y eco-ind. Direct employment was estimated using wage rates and labour cost
shares of total expenditure. Indirect employment was estimated by other
expenses (mostly operating expenditure) that stimulate employment in
sectors that provide intermediate inputs to eco-industries.13
GHK et. al
eco-ind.
Direct employment was estimated using data from E&Y report. The
estimates of direct jobs include data for Bulgaria and Romania (EU-27)
and estimates for the previously missing data using E3ME
employment/output ratios. Indirect and induced impacts were also
included using the E3ME model.
GHK core The range of environment-economic activities was expanded to include
core natural resource based activities (organic farming and sustainable
13 Employment estimates were calculated using the engineering analysis method from the Ecotec report
(2002) engineering analysis. No new modelling assumptions were made.
Links between the environment, economy and jobs
GHK in association with CE and IEEP 14
forestry). In addition environment related tourism was included.
Renewable energy and water supply have been reclassified as core
natural resource based activities.
GHK broad Jobs from environment-economic activities was further expanded to
include broad natural resource based activities (all forms of farming,
forestry, fishing renewable and non-renewable energy, mining and
quarrying and water extraction and supply).
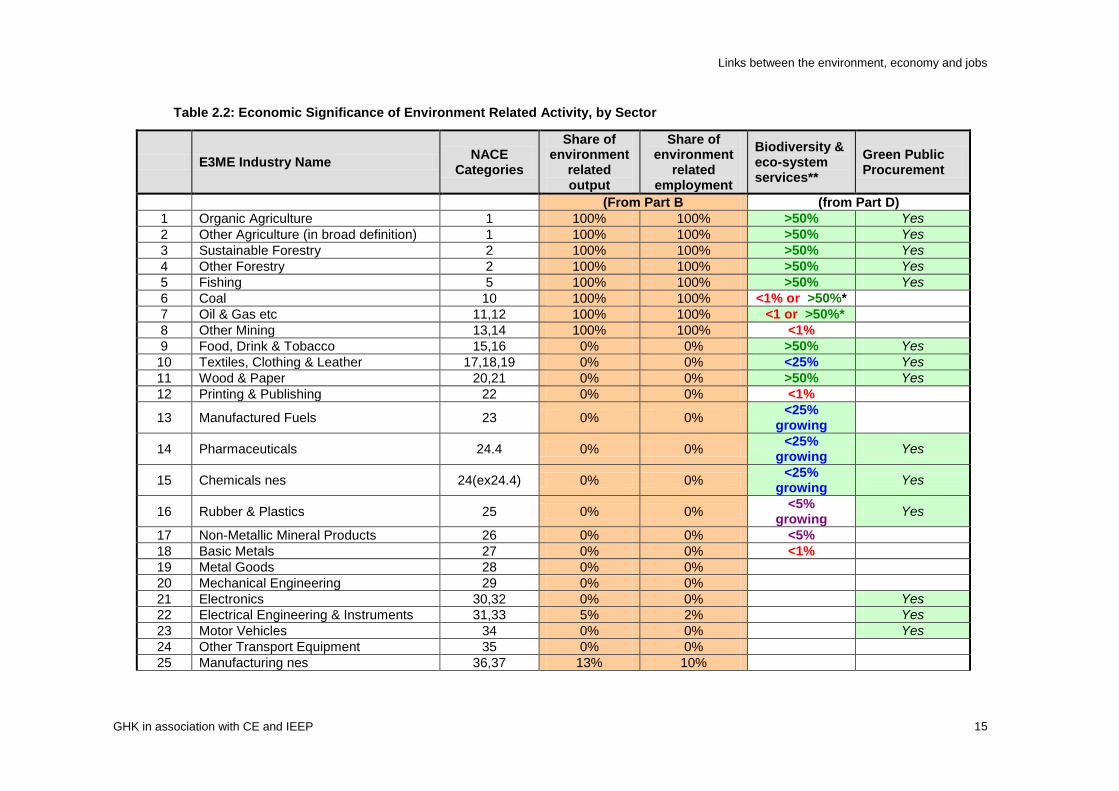
2.2 Sectoral Importance of Environment Related Activities
The importance of environment related activities varies between economic sectors. The
analysis at sectoral level has been undertaken as the basis of the aggregate results
above using input-output analysis. The sectoral significance is shown in Table 2.2 for
each of the 46 industrial sectors used in the E3ME model. The table also includes an
attempt to capture the significance of biodiversity related activities for economic sectors,
and the possible significance of ‗Green‘ public procurement (GPP) (and elaborated in
Part D).
The table clearly shows that the environment plays a key role or a growing role in most
industrial sectors of the economy.
Links between the environment, economy and jobs
GHK in association with CE and IEEP 15
Table 2.2: Economic Significance of Environment Related Activity, by Sector
E3ME Industry Name NACE
Categories
Share of environment
related output
Share of environment
related employment
Biodiversity & eco-system services**
Green Public Procurement
(From Part B (from Part D)
1 Organic Agriculture 1 100% 100% >50% Yes
2 Other Agriculture (in broad definition) 1 100% 100% >50% Yes
3 Sustainable Forestry 2 100% 100% >50% Yes
4 Other Forestry 2 100% 100% >50% Yes
5 Fishing 5 100% 100% >50% Yes
6 Coal 10 100% 100% <1% or >50%*
7 Oil & Gas etc 11,12 100% 100% <1 or >50%*
8 Other Mining 13,14 100% 100% <1%
9 Food, Drink & Tobacco 15,16 0% 0% >50% Yes
10 Textiles, Clothing & Leather 17,18,19 0% 0% <25% Yes
11 Wood & Paper 20,21 0% 0% >50% Yes
12 Printing & Publishing 22 0% 0% <1%
13 Manufactured Fuels 23 0% 0% <25%
growing
14 Pharmaceuticals 24.4 0% 0% <25%
growing Yes
15 Chemicals nes 24(ex24.4) 0% 0% <25%
growing Yes
16 Rubber & Plastics 25 0% 0% <5%
growing Yes
17 Non-Metallic Mineral Products 26 0% 0% <5%
18 Basic Metals 27 0% 0% <1%
19 Metal Goods 28 0% 0%
20 Mechanical Engineering 29 0% 0%
21 Electronics 30,32 0% 0% Yes
22 Electrical Engineering & Instruments 31,33 5% 2% Yes
23 Motor Vehicles 34 0% 0% Yes
24 Other Transport Equipment 35 0% 0%
25 Manufacturing nes 36,37 13% 10%

Links between the environment, economy and jobs
GHK in association with CE and IEEP 16
E3ME Industry Name NACE
Categories
Share of environment
related output
Share of environment
related employment
Biodiversity & eco-system services**
Green Public Procurement
(From Part B (from Part D)
26 Renewable electricity 40.1 100% 100% >50% Yes
27 Non-renewable electricity 40.1 100% 100% <5% Yes
28 Gas Supply 40.2,40.3 0% 0% <1%
29 Water Supply 41 100% 100% >50% Yes
30 Construction 45 0% 0% <5% Yes
31 Distribution 50,51 0% 0% <1%
32 Retailing 52 0% 0% <5%
33 Hotels & Catering 55 12% 7% <25% Yes
34 Land Transport etc 60,63 7% 7% <1% Yes
35 Water Transport 61 10% 25% <5%
36 Air Transport 62 19% 25% <1%
37 Communications 64 0% 0% <1%
38 Banking & Finance 65,67 0% 0% <1% Yes
39 Insurance 66 0% 0% <25%
40 Computing Services 72 0% 0% <1%
41 Professional Services 70,71,73,74.1
-74.4 0% 0% <5%
42 Other Business Services (inc. environment related services)
74.5-74.8 0.5% 0.7% <1%
43 Public Administration & Defence 75 1% 1% <5%
growing Yes
44 Education 80 0% 0% <5%
45 Health & Social Work 85 0% 0% <5%
46 Miscellaneous Services* 90 to
93,95,99 19% 13% <25% Yes
Total 7% 10%
Note: Miscellaneous services include collection and treatment of waste/sewage, recreation, culture, nature reserve activities, sports, etc.
* coal, oil and gas are shown as being ‗<1% or >50%‘. These industries build on fossil fuels, which come originally from biodiversity (plants and animals).
They are therefore arguable very significantly linked to the environment (hence the ‗>50%) though the link is in past geological times and hence less
obvious today (hence the ‗<1%‘)
Links between the environment, economy and jobs
GHK in association with CE and IEEP 17
** The importance of the link between the sector and the environment is presented to show the
level of significance. ‗>50%‘ underlines that most of the activity in the sector is related to the
environment. Where the link is significant and substantial, but not determining the nature of the
sector, the value of ‗<25%‘ is used. Where there is occasional, or local significance (for example
for a discrete set of applications in the sector), but that this remains focused, the value of ‗<5%‘ is
used. Where there is little importance at all, ‗<1%‘ is used. The numbers should be seen as
indicators of significance rather than as empirical analysis based results; they relate more to
expert judgment by the team, backed up by some analysis of the sectors by a short literature
review. The Terms of Reference did not ask that such an analysis be done, but the team
considered it useful to clarify the links and effectively clarify a possible future area for analysis.
In terms of the analysis of the three broad classes of environment related activities at
the sectoral level, primary industries are wholly classified to environment related
activities. The significance for manufacturing industries varies and largely reflects the
activities associated with pollution control, whilst the service sectors reflect the
importance of environment related tourism.
In the case of bio-diversity the importance of the link between environment and
economic activities was assessed more qualitatively. One-third of all industrial sectors
have significant environmental links in terms of biodiversity and eco-system services
and GPP14
.
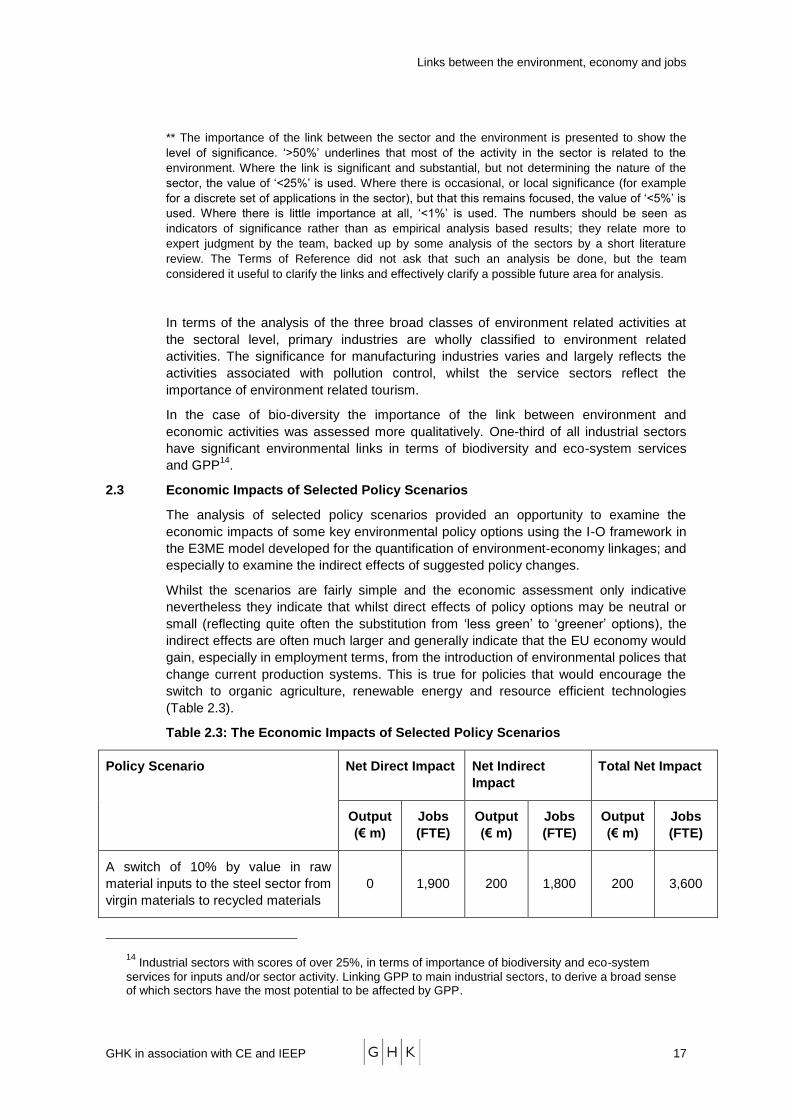
2.3 Economic Impacts of Selected Policy Scenarios
The analysis of selected policy scenarios provided an opportunity to examine the
economic impacts of some key environmental policy options using the I-O framework in
the E3ME model developed for the quantification of environment-economy linkages; and
especially to examine the indirect effects of suggested policy changes.
Whilst the scenarios are fairly simple and the economic assessment only indicative
nevertheless they indicate that whilst direct effects of policy options may be neutral or
small (reflecting quite often the substitution from ‗less green‘ to ‗greener‘ options), the
indirect effects are often much larger and generally indicate that the EU economy would
gain, especially in employment terms, from the introduction of environmental polices that
change current production systems. This is true for policies that would encourage the
switch to organic agriculture, renewable energy and resource efficient technologies
(Table 2.3).
Table 2.3: The Economic Impacts of Selected Policy Scenarios
Policy Scenario Net Direct Impact Net Indirect
Impact
Total Net Impact
Output
(€ m)
Jobs
(FTE)
Output
(€ m)
Jobs
(FTE)
Output
(€ m)
Jobs
(FTE)
A switch of 10% by value in raw
material inputs to the steel sector from
virgin materials to recycled materials
0 1,900 200 1,800 200 3,600
14 Industrial sectors with scores of over 25%, in terms of importance of biodiversity and eco-system
services for inputs and/or sector activity. Linking GPP to main industrial sectors, to derive a broad sense of which sectors have the most potential to be affected by GPP.
Links between the environment, economy and jobs
GHK in association with CE and IEEP 18
Policy Scenario Net Direct Impact Net Indirect
Impact
Total Net Impact
Output
(€ m)
Jobs
(FTE)
Output
(€ m)
Jobs
(FTE)
Output
(€ m)
Jobs
(FTE)
A switch of 10% by value from
conventional to organic agricultural
production
0 66,000 550 -22,200 550 43,800
A saving of 10% by value of water,
invested in water saving technologies 0 700 980 4,800 980 5,500
A saving of 10% by value of energy,
invested in energy efficient
technologies
0 122,200 480 14,600 480 137,200
A switch of 10% by value to biofuels
from conventional transport fuels 0 108,100 1,500 31,400 1,500 139,500
A switch of 10% by value to
renewables from conventional
electricity generation
0 0 8,610 58,200 8,610 58,200
Note: Totals may not sum due to rounding
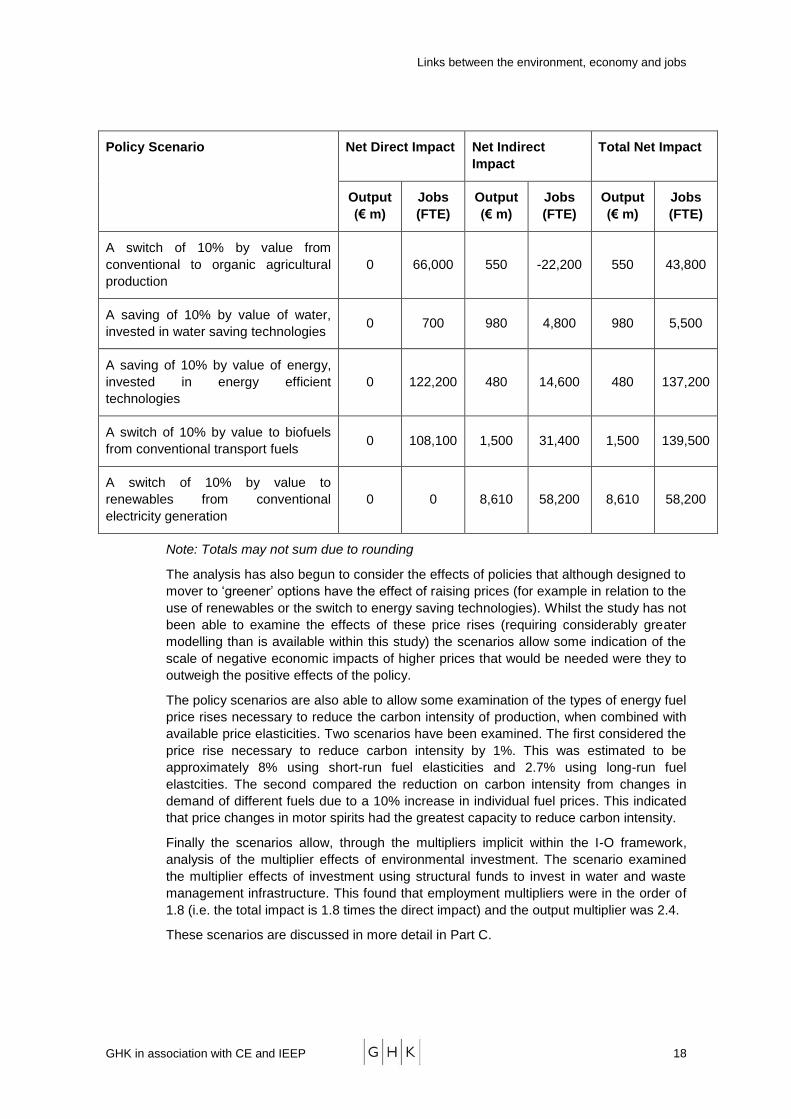
The analysis has also begun to consider the effects of policies that although designed to
mover to ‗greener‘ options have the effect of raising prices (for example in relation to the
use of renewables or the switch to energy saving technologies). Whilst the study has not
been able to examine the effects of these price rises (requiring considerably greater
modelling than is available within this study) the scenarios allow some indication of the
scale of negative economic impacts of higher prices that would be needed were they to
outweigh the positive effects of the policy.
The policy scenarios are also able to allow some examination of the types of energy fuel
price rises necessary to reduce the carbon intensity of production, when combined with
available price elasticities. Two scenarios have been examined. The first considered the
price rise necessary to reduce carbon intensity by 1%. This was estimated to be
approximately 8% using short-run fuel elasticities and 2.7% using long-run fuel
elastcities. The second compared the reduction on carbon intensity from changes in
demand of different fuels due to a 10% increase in individual fuel prices. This indicated
that price changes in motor spirits had the greatest capacity to reduce carbon intensity.
Finally the scenarios allow, through the multipliers implicit within the I-O framework,
analysis of the multiplier effects of environmental investment. The scenario examined
the multiplier effects of investment using structural funds to invest in water and waste
management infrastructure. This found that employment multipliers were in the order of
1.8 (i.e. the total impact is 1.8 times the direct impact) and the output multiplier was 2.4.
These scenarios are discussed in more detail in Part C.
Links between the environment, economy and jobs
GHK in association with CE and IEEP 19
2.4 The Changing Economic Significance of Environment Related Activities
The quantification of the economic significance of environment related activities in this
study is arguably, within a given typology of activities, likely to under-estimate the
economic value associated with the linkages. This is because:
There is often an important non-payment for services and hence implicit subsidies to
the economy. Resources can be under priced as can services (e.g. high value
biodiversity). This suggests that national accounts (and hence GDP values), and
input-output models do not take full account of environmental resource values.
There is not full resource pricing. There is a need to move to greater use of resource
pricing to help build the value of the resource into economic decision making and
make the market work more efficiently.
Inadequate payments for environmental services. In recent years, the recognition of
environmental services and their value has led to efforts to internalise environmental
services in the functioning of markets through direct payments for environmental
services (PES). The idea of PES consists of beneficiaries of ecosystem services
making direct, contractual and conditional payments to local landholders and users
providing the services, e.g. farmers sustainably managing the landscapes or
beekeepers / honey producers for pollination of crops etc. Existing examples on the
use of PES suggest that such payments can be a promising tool for internalising the
values of biodiversity and related ecosystem services into different economic
sectors. However, despite the benefits PES should not be considered as a
―standard fix‖ to all situations.
There is often no liability for negative impacts and hence the price signals in the
market do not do fully reflect the cost implications of inappropriate resource
allocations or loss of undervalued resources or services. There is clearly scope for
better application of EIA and liability rules
There are many economy-economy trade-offs that arise via the interlinkages to
biodiversity and ecosystem services. This suggests decision making needs
upgrading and that opportunities for greater use of strategic environment
assessments (SEAs) and impact assessment to take into account issues not picked
up by market prices be taken.
It is to be expected that the interlinkages between the economy and the environment will
change. There are, for example, growth areas – biofuels, bioplastics and biochemicals,
which will increase the economic value of environment related activities. There is also
an ongoing loss of genetic materials and hence primary genetic materials for
biochemicals, medicines, food crops that might reduce opportunities for development in
the future.
2.5 Further developments – next steps
The study has provided some interesting insights regarding the links between the
environment and economy. Quantifying the links in monetary terms is limited by data
availability. We also discussed the importance of biodiversity and eco-system services.
We were unable to quantify these services due to the non-existence of market values for
these services. Moreover, we have only looked at the economic impact of environmental
activities and it will be worthwhile to also consider the environmental impact of economic
activities. We have suggested some tasks below as possible next steps to further
develop this study.
Links between the environment, economy and jobs
GHK in association with CE and IEEP 20
2.5.1 Refining the policy scenarios
The policy scenarios provided useful indications for looking at the impact of some ‗what
if‘ scenarios. The substitution from ‗less green‘ to ‗greener‘ options showed positive
benefits to the EU economy. This was mainly due to the longer supply chain and higher
labour intensity of the more environmentally-friendly sectors. However, this exercise did
not model the impact of resource substitution at higher prices. This would invariably be
the case for most environmental policy encouraging structural change. Especially in the
short run when businesses and consumers have to adjust to the structural change.
The input-output model can be developed further to capture the effect of higher prices
on profits and output for any sector when substituting inputs from a less environment
intensive sector. By using cost-pass through assumptions from the E3ME model we can
calculate the subsequent impact of the high cost of inputs through to the product prices
for the consumers of the sector in question.
The net effect of the positive impacts of resource allocation and negative impacts of the
high cost of inputs and product prices will determine the final impact on the economy.
Lastly, the policy scenarios can be more realistic than hypothetical. In other words they
can be based on the actual programmes and policies. Some examples include –
detailed structural fund expenditure, using renewable targets from the EU Climate
Change Programme and using sector specific studies from the Environmental
Technologies Action Plan (ETAP).
2.5.2 Forecasting
The input-output table is a static model. It shows the interactions between various
sectors at that point in time. It will be useful to see the change in environment related
jobs and output over time both historical and future.
By using employment, population and GDP projections from other sources we can
forecast the economic impacts of environmental activities. The model can be further
developed by researching the future production trends for each sector. This can be then
used to adjust the coefficients in the input-output tables along with the employment,
population and GDP projections. Domestic and international trade projections can also
be used to chart the trend in environment related jobs and output for the EU.
The above analysis will also provide insights into the competitiveness aspects of
environment related sectors.
2.5.3 Incorporating material flow analysis and environmental impact
The productive use of resource inputs is central to the concept of sustainable
development. The Eurostat Production and Consumption sustainable development
indicators are based on materials flow indicators. The E3ME model is being developed
to calculate total material resources consumed by a sector in the economy15
, to
complement its existing energy submodel. The environmental impact in terms of waste,
emissions and water use can also be calculated. This is shown in the figure below.
15 Please see Extending E3ME to include analysis of materials flow: A scoping report for the Anglo-
German Foundation for WP3, February 2007. http://www.camecon.com/suite_economic_models/e3me/pdf%20files/Material_Flows.pdf

Links between the environment, economy and jobs
GHK in association with CE and IEEP 21
Materials
FlowEnvironmental
Impact
Input-Output
Analysis
Results by value, eg. €m
Results by quantity,
eg, tonnes of minerals,
wood, etc.
Results by quantity,
eg, tonnes of CO2,
waste, etc.
Materials
FlowEnvironmental
Impact
Input-Output
Analysis
Results by value, eg. €m
Results by quantity,
eg, tonnes of minerals,
wood, etc.
Results by quantity,
eg, tonnes of CO2,
waste, etc.
In order to fully model material demands in the context of the wider economy, it is
necessary to link these materials to specific industries in E3ME. Preliminary links are
shown in the table below and can be extended for other materials. It should be noted
that waste is slightly different to the other materials in that it has a negative economic
value and the demand it to dispose of waste rather than to use it as part of a production
process.
Relationship between materials and E3ME sector classification
The primary data source for the six agricultural and mineral materials is a dataset
produced by Eurostat/IFF 200416
. This is a comprehensive set of annual time series for
each of the EU-15 member states covering the period1990-2001. It is due to be updated
in mid-2007 to include a wider set of European countries and include data up to 2005.
2.5.4 Natural resource pricing and valuing eco-system services
The value of biodiversity and ecosystem services to our economies and societies are
either completely unpriced or only partially integrated in the price. Resources can be
under priced as can services (e.g. high value biodiversity). National accounts (and
hence GDP values), and the associated input-output models therefore do not take into
account or represent the range of values from the resources and the different
ecosystem services provided by biodiversity.
The result of this non pricing or under-pricing is that there is, from an economic
perspective, a suboptimal allocation of resources. In social terms this may lead to a loss
of (future) availability of resources or services. In environmental terms it leads to an over
exploitation of resources, running down of natural capital resources and disruption or
destruction of some ecosystem services.
16 Economy-wide Materials Flow Accounts and Indicators of Resource Use for the EU-15: 1970-2001; Weisz
et al (2004), Eurostat and Institute for Social Ecology, Faculty for Interdisciplinary Studies (IFF), Klagenfurt University, Vienna.
Links between the environment, economy and jobs
GHK in association with CE and IEEP 22
Example of where under-pricing often occurs, include:
Provisioning services: eg biochemicals, natural medicines, and pharmaceuticals and
also of Natural resource: fresh water
Regulating services: eg Water regulation - flood prevention, aquifer recharge,
erosion control, water purification, biological control and pollination, storm and
avalanche protection, fire resistance
Cultural services: eg cultural diversity, educational values, aesthetic values, social
relations, sense of place and identity, cultural heritage values
Supporting services: eg nutrient cycling and soil formation.
To address these shortcomings a series of next steps are needed:
Further analysis of ecosystem functions, services and associated values to our
economies and societies - to understand their contributions to the true wealth of
nations and wellbeing of societies. To understand what values we forget or omit to
value in market prices. This could usefully be done both at a national level, and
sectoral level.
Further analysis of natural resource values, building in social and opportunity cost
and resource scarcity issues.
Development of natural resource accounts and material flows analysis to ensure
that the natural capital stock and its links to the economy are understood better and
integrated into policy thinking.
Policies to ‗get the prices right‘ to ensure that the invisible hand of the market leads
to fewer inefficient allocation of resources. There is a need to move to greater use
of resource pricing to help build the value of the resource into economic decision
making and make the market work more efficiently.
One promising area for the application of pricing is that of ‗payments for
environmental services‘ (PES). The idea of PES consists of beneficiaries of
ecosystem services making direct, contractual and conditional payments to local
landholders and users providing the services, e.g. farmers sustainably managing the
landscapes or beekeepers / honey producers for pollination of crops etc. The PES
approach should be applied where it can prove workable and constructive.
There is a need for greater application of liability rules and compensation
mechanisms. There is often no liability for negative impacts and hence the price
signals in the market do not do full justify the cost implications of inappropriate
resource allocations or loss of undervalued resources or services.
There are many economy-environment trade-offs that arise via the interlinkages to
biodiversity and ecosystem services and in practice decision making has sometimes
led to trade-offs that run against the ambitions for sustainable development.
Additional effort is need to look at tools that support decision making and explore
whether/how they need upgrading to ensure that valuation, ecosystem service
issues and trade-offs are suitably integrated. There are opportunities and need for
greater use of strategic environment assessments (SEAs) and impact assessment
to take into account issues not picked up by market prices.

Links between the environment, economy and jobs
GHK in association with CE and IEEP 23
There is also a need to look at both a global level and an eco-system level to
understand the links between an economy/society and the ecosystem(s) within which
they exist and with which they interact. This will make clearer the importance of certain
planning and investment decisions (eg housing development) and the factors that these
need to take into account. Locational quality is directly linked to available of natural
resources - including, for example, water supply availability (short and long term), ability
to accept waste water discharges, temperature, salinity, risk from flooding or sea level
rise.

Links between the environment, economy and jobs
GHK in association with CE and IEEP 24
PART B: ECONOMIC IMPACT OF ENVIRONMENT RELATED
ACTIVITIES

Links between the environment, economy and jobs
GHK in association with CE and IEEP 25
3 APPROACH TO THE ESTIMATION OF ECONOMIC IMPACTS
3.1 Introduction
This section of the report presents the approach to the assessment of the economic
scale of environment related activities. Section 4.0 presents the results of the
assessment.
The main aim of the approach was to indicate the economic impact associated with a
comprehensive definition of the environment – economy linkages, using a broad
typology and building on previous and existing analyses and data sets:
A: Environment as a resource input to economic activity – figures on
employment, output and GVA are available from Eurostat for most of the
sectors given in Table 3.1. Employment and output estimates of the share of
the broad sector in the core sector (such as organic farming and sustainable
forestry) were derived from the literature review.
B: Management of the environment – the direct scale of these activities was
based on the EU eco-industry data including data on the consumption of eco-
products for the household sector. This was further divided into pollution and
resource management using the environmental protection expenditure data
from the Eurostat Cronos database.
C: Activities dependent on environmental quality – the economic activities
that can be defined as being based on environmental quality and which can be
adequately quantified is tourism, and the share considered to be
environmentally related tourism (ERT). This analysis makes use of available
estimates of tourism activity including associated multiplier effects.
Those linkages that can be quantified (a subset of the linkages in the full typology) and
the principal data sources are summarised in Table 3.1.
Table 3.1: Principal Data Sources for the Different Linkages
Environment Related Economic Activities Principal Data Sources
A ACTIVITIES BASED ON NATURAL RESOURCES
i Agriculture OECD, Eurostat
ii Core: Organic farming Estimated
iii Forestry OECD, Eurostat
iv Core: Sustainable forestry Estimated
v Fishing (except recreation, which is covered under tourism) OECD, Eurostat
vi Mining, extraction and quarrying OECD, Eurostat
vii Non-renewable electricity generation OECD, Eurostat
viii Core: Renewable electricity generation OECD, Eurostat
ix Core: Water extraction and supply Eurostat
B ENVIRONMENTAL MANAGEMENT
B1 Pollution management
i Solid Waste Management & Recycling (SWM) Eurostat
ii Waste Water Treatment (WWT) Eurostat
iii Air Pollution Control (APC) Eurostat
iv General Public Administration (GPA) Eurostat

Links between the environment, economy and jobs
GHK in association with CE and IEEP 26
Environment Related Economic Activities Principal Data Sources
v Private Environmental Management (PEM) Eurostat
vi Remediation & Clean Up of Soil & Groundwater (RCSG) Eurostat
vii Noise & Vibration Control (NVC) Eurostat
viii Environmental Research & Development (ERD) Eurostat
ix Environmental Monitoring & Instrumentation (EMI) Eurostat
B2 Resource management
i Recycled materials Eurostat
ii Nature protection Eurostat
C ENVIRONMENT QUALITY
i Environment related tourism Estimated
Note: Described in detail in Annex C, E and F.
3.2 Estimating the Economic Impact of Environment Related Activities
The economic impact was estimated in two stages. In the first stage the existing
estimates of the scale of the eco-industries were used to indicate the direct impacts. To
this was added the direct impact associated with additional activities specified by the
expanded typology. In the second stage the analysis estimated the indirect and induced
impacts by using a combination of the OECD and Cambridge Econometrics‘ (CE) E3ME
Input-Output Tables17
. These tables were expanded to include the core environmental
related economic activities as given in Table 3.1.
The CE E3ME model18
with an input-output structure for 27 European regions, including
the EU25 (as of 2006), Norway and Switzerland, contains data for industry output,
investment, prices, exports, imports, employment and intermediate demand at a 42-
industry level (including 16 service industries) and includes 28 categories for consumers'
expenditure. It also contains energy demand data based on 19 fuel user groups and 12
fuels and estimates of environmental emissions. The E3ME model has been used for
the policy scenarios in Section 6.
The Input-Output (I-O) Tables provide a detailed description (model) of the linkages
between sectors, and between intermediate demand (purchases made by economic
sectors) and final demand (the purchases made by consumers and government and
exports). It enables estimates of the effect of changes in one sector on other sectors
and the effects of changes in final demand from households, government, and foreign
buyers on the economy. These effects are reflected in multipliers. Multipliers indicate the
effect on the economy due to a change in one sector because of its sales to and
purchases from other sectors (Figure 3.1). The ratio of the direct, indirect and induced
income effect to the direct effect is termed a Type II output multiplier. A Type I output
multiplier excludes the induced effects, i.e. it is ratio of direct and indirect to direct
effects.
17 Please see Annex C for more details on input-output tables.
18 Please see www.e3me.com and Annex C for details on the CE E3ME model.
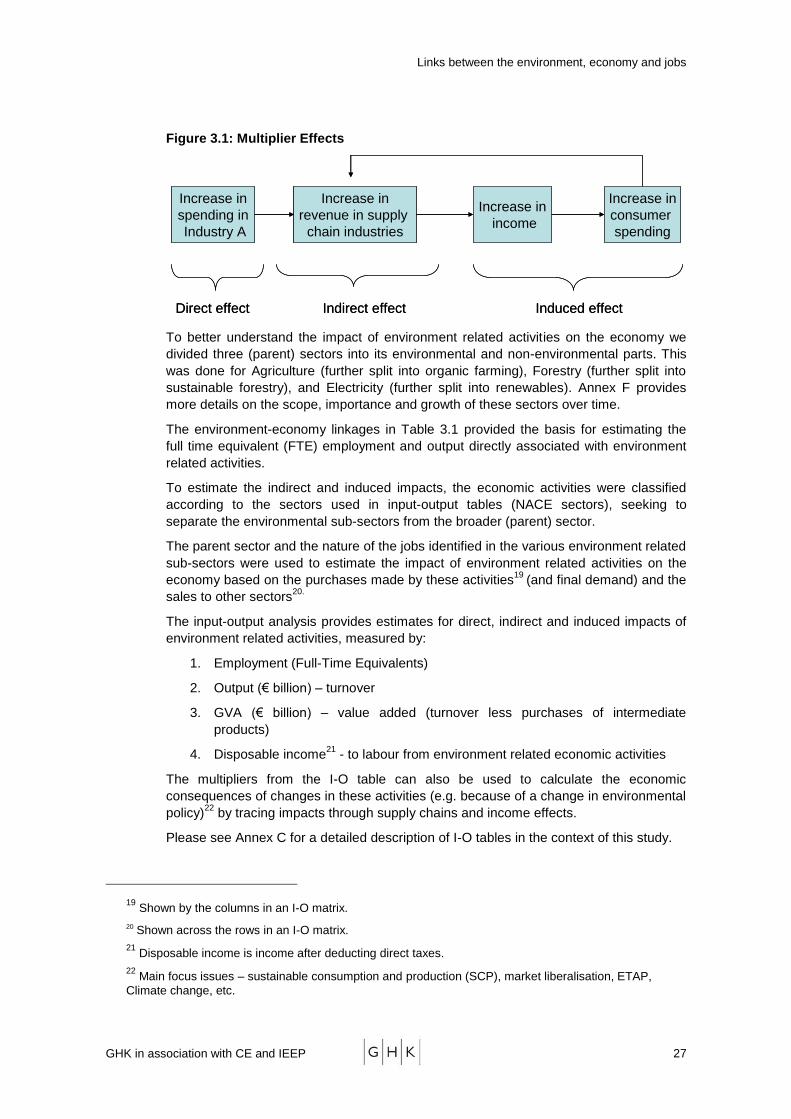
Links between the environment, economy and jobs
GHK in association with CE and IEEP 27
Figure 3.1: Multiplier Effects
Increase in
spending in
Industry A
Increase in
revenue in supply
chain industries
Increase in
income
Increase in
consumer
spending
Direct effect Indirect effect Induced effect
Increase in
spending in
Industry A
Increase in
revenue in supply
chain industries
Increase in
income
Increase in
consumer
spending
Direct effect Indirect effect Induced effect
To better understand the impact of environment related activities on the economy we
divided three (parent) sectors into its environmental and non-environmental parts. This
was done for Agriculture (further split into organic farming), Forestry (further split into
sustainable forestry), and Electricity (further split into renewables). Annex F provides
more details on the scope, importance and growth of these sectors over time.
The environment-economy linkages in Table 3.1 provided the basis for estimating the
full time equivalent (FTE) employment and output directly associated with environment
related activities.
To estimate the indirect and induced impacts, the economic activities were classified
according to the sectors used in input-output tables (NACE sectors), seeking to
separate the environmental sub-sectors from the broader (parent) sector.
The parent sector and the nature of the jobs identified in the various environment related
sub-sectors were used to estimate the impact of environment related activities on the
economy based on the purchases made by these activities19
(and final demand) and the
sales to other sectors20.
The input-output analysis provides estimates for direct, indirect and induced impacts of
environment related activities, measured by:
1. Employment (Full-Time Equivalents)
2. Output (€ billion) – turnover
3. GVA (€ billion) – value added (turnover less purchases of intermediate
products)
4. Disposable income21
- to labour from environment related economic activities
The multipliers from the I-O table can also be used to calculate the economic
consequences of changes in these activities (e.g. because of a change in environmental
policy)22
by tracing impacts through supply chains and income effects.
Please see Annex C for a detailed description of I-O tables in the context of this study.
19 Shown by the columns in an I-O matrix.
20 Shown across the rows in an I-O matrix.
21 Disposable income is income after deducting direct taxes.
22 Main focus issues – sustainable consumption and production (SCP), market liberalisation, ETAP,
Climate change, etc.
Links between the environment, economy and jobs
GHK in association with CE and IEEP 28
3.2.1 Year and Spatial Coverage of the Analysis
The analysis uses the latest data on eco-industries, as previously defined and
assessed, as the starting point. This data is now available from 1999-200323
and is
presented in 2000 prices in order for it to be consistent with the I-O tables. The I-O
tables used in the analysis also relate to 2000 (even though these are the latest tables
and were only published in 2007). The analysis is therefore describing the scale of
environment related activities as they existed in 2000. We have continued to present
data in 2000 prices to aid comparison with previous analyses. However, some of the
headline figures have been inflated to 2006 prices. All values are thus in 2000 prices
unless explicitly stated in the table or figure.
The available data covered most of the EU-25. Data for the Czech Republic and Malta
was missing – we have estimated this from other reports. In addition data for Bulgaria
and Romania has been added to provide a full EU-27 analysis24
. In the case of resource
management (B2 in Table 3.1) only data for the original EU15 was available. Czech
Republic pollution management employment numbers have been derived from EU15
average productivity. Pollution management figures for Malta, Bulgaria and Romania
were obtained from the ECOTEC candidate countries supplementary study.
We have not attempted to extrapolate estimates from the EU15 given the likely error.
For comparisons with earlier analyses, adjustments for geographic coverage are
required.
3.2.2 Modelling the economic impact of environment related tourism
To quantify the economic impact attributable to environmental quality, the study has
examined as a first approximation the economic impact of environment related tourism.
This is difficult because tourism (the parent sector) is itself not a discrete sector within
the NACE classification (and therefore I-O sectors). Tourism activities are divided
between different sectors such as retail, hotels and restaurant and transport. We have
therefore used a combined demand and supply-side approach to measure the economic
impact of tourism (see Annex E for more details), prior to assessing the share of sectoral
activity that can be related to environmental quality.
For the purposes of this study we have estimated the tourism sector by attaching
‗tourism intensity‘ weights to the main tourism sectors such as hotels and restaurants,
transportation and tour operators, to indicate their significance in the parent sector (e.g.
transport, hotels). We have also used estimates of the scale of the tourism sector for
EU-27 produced by the World Tourism and Travel council (WTTC), which is based on a
system of Tourism Satellite Accounts (TSA) (see Annex E). Environment related tourism
is measured as a proportion of overall tourism.
Defining Environment related tourism
In the literature Eco-tourism and sustainable tourism are the most frequently used terms
linking environment, environmental quality and sustainability to tourism. However, there
23 Analysis of the EU Eco-Industries, their Employment and Export Potential‘ (2002) by ECOTEC and
Study on Eco-industry, its size, employment, perspectives and barriers to growth in an enlarged EU‘ (2006) by Ernst & Young
24 Data available for the 10 new member states from the previous ‗Analysis of the size and employment of
the eco-industries of the candidate countries report are not directly comparable due to differences in sources, perimeter and extrapolation method.
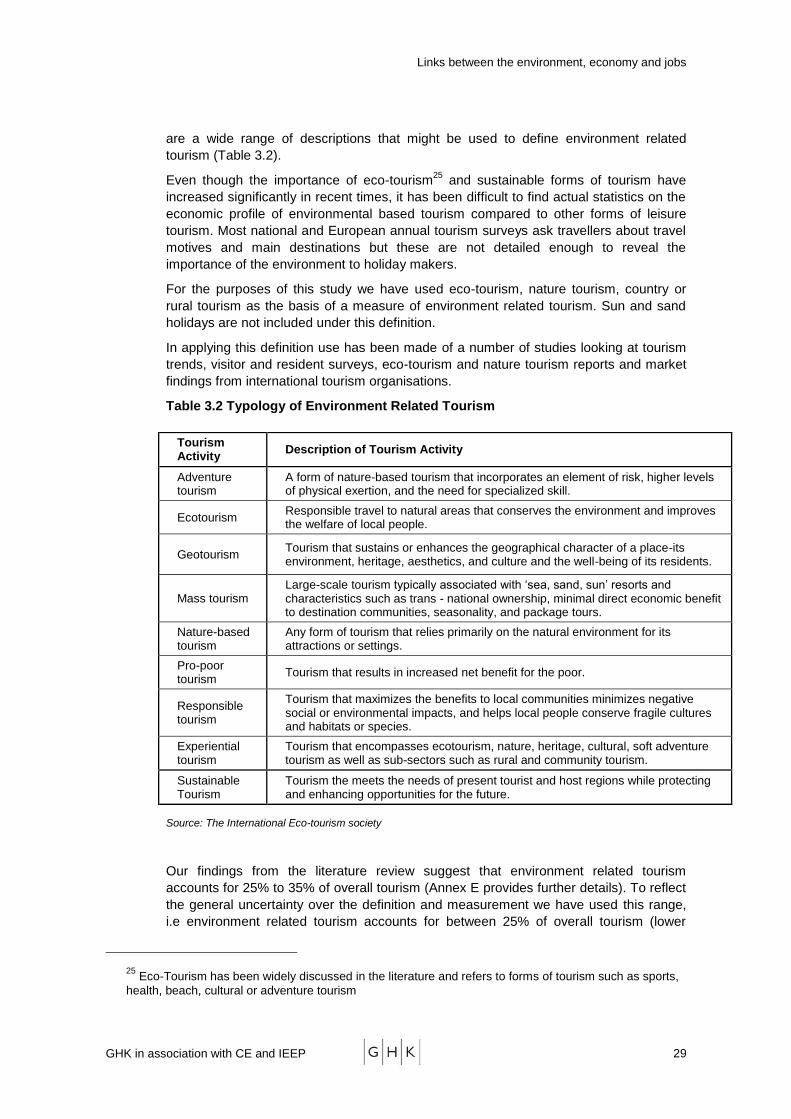
Links between the environment, economy and jobs
GHK in association with CE and IEEP 29
are a wide range of descriptions that might be used to define environment related
tourism (Table 3.2).
Even though the importance of eco-tourism25
and sustainable forms of tourism have
increased significantly in recent times, it has been difficult to find actual statistics on the
economic profile of environmental based tourism compared to other forms of leisure
tourism. Most national and European annual tourism surveys ask travellers about travel
motives and main destinations but these are not detailed enough to reveal the
importance of the environment to holiday makers.
For the purposes of this study we have used eco-tourism, nature tourism, country or
rural tourism as the basis of a measure of environment related tourism. Sun and sand
holidays are not included under this definition.
In applying this definition use has been made of a number of studies looking at tourism
trends, visitor and resident surveys, eco-tourism and nature tourism reports and market
findings from international tourism organisations.
Table 3.2 Typology of Environment Related Tourism
Source: The International Eco-tourism society
Our findings from the literature review suggest that environment related tourism
accounts for 25% to 35% of overall tourism (Annex E provides further details). To reflect
the general uncertainty over the definition and measurement we have used this range,
i.e environment related tourism accounts for between 25% of overall tourism (lower
25 Eco-Tourism has been widely discussed in the literature and refers to forms of tourism such as sports,
health, beach, cultural or adventure tourism
Tourism Activity
Description of Tourism Activity
Adventure tourism
A form of nature-based tourism that incorporates an element of risk, higher levels of physical exertion, and the need for specialized skill.
Ecotourism Responsible travel to natural areas that conserves the environment and improves the welfare of local people.
Geotourism Tourism that sustains or enhances the geographical character of a place-its environment, heritage, aesthetics, and culture and the well-being of its residents.
Mass tourism Large-scale tourism typically associated with ‗sea, sand, sun‘ resorts and characteristics such as trans - national ownership, minimal direct economic benefit to destination communities, seasonality, and package tours.
Nature-based tourism
Any form of tourism that relies primarily on the natural environment for its attractions or settings.
Pro-poor tourism
Tourism that results in increased net benefit for the poor.
Responsible tourism
Tourism that maximizes the benefits to local communities minimizes negative social or environmental impacts, and helps local people conserve fragile cultures and habitats or species.
Experiential tourism
Tourism that encompasses ecotourism, nature, heritage, cultural, soft adventure tourism as well as sub-sectors such as rural and community tourism.
Sustainable Tourism
Tourism the meets the needs of present tourist and host regions while protecting and enhancing opportunities for the future.

Links between the environment, economy and jobs
GHK in association with CE and IEEP 30
estimate) and 35% (upper estimate). In some cases we have taken the mid-point as the
estimate.

Links between the environment, economy and jobs
GHK in association with CE and IEEP 31
4 ECONOMIC IMPACTS OF ENVIRONMENT RELATED
ACTIVITIES
4.1 Introduction
In Section 2, we discussed the main findings based on the OECD/Eurostat eco-
industries definition in the E&Y and GHK study. In this section we present the economic
impacts in terms of jobs, output and GVA by member state and environmental sector.
The total economic impact estimates in most tables are shown for the three main
environment-economy linkages. This has been further presented by the core and broad
definition of natural resource based activities.
4.2 Summary of the Overall Impact
The GHK and E&Y studies are essentially based on the Ecotec (2002) report, a
comparison of findings from all three studies is given in Table 4.1. The limited
geographic coverage of the Ecotec report (EU-15) means that comparison is not
appropriate.
In Table 4.1, the findings have been inflated to 2006 prices though the actual data and
input-output tables relate to 2000. In addition to direct and indirect impacts on jobs and
output, this study has also extended the analysis to include induced effects. Indirect
effects are the additional jobs and output generated in supplying goods and services
generated by the demand for goods and services in the defined economic activities. The
induced effect is the further economic impact as a result of the spending of income
received as a consequence of the direct and indirect employment26
. Thus the total
economic impact of eco-industries was around 4.6 million jobs and €660 billion in output
in 2000.
Table 4.1: Summary of Direct, Indirect and Induced Employment and Output
Impacts based on Eco-industries Definition, 2000
Ecotec report
(EU-15) 2002
E&Y report (EU-25)
2006
GHK report (EU-27)
2007
Year of data 1999 2004b 2000
c
Jobs ('000s)
Direct 2,086 2,445 2,364
Indirect 582 507 1,320
Induced n.a n.a 939
Total 2,668 2,952 4,623
Price base 1999 prices 2000
pricesa
2004 prices
b
2000 prices
c
2006 prices
d
Output/turnover (Bil €)
Direct 183 209 227 242 274
Indirect n.a n.a n.a 176 199
Induced n.a n.a n.a 242 274
Total 183 209 227 660 748
Note: Data for 2000 includes some items of data from 2001 and 2002 n.a – not available
26 The indirect and induced effect for jobs and output is described in more details in section 4.2 and 4.3.
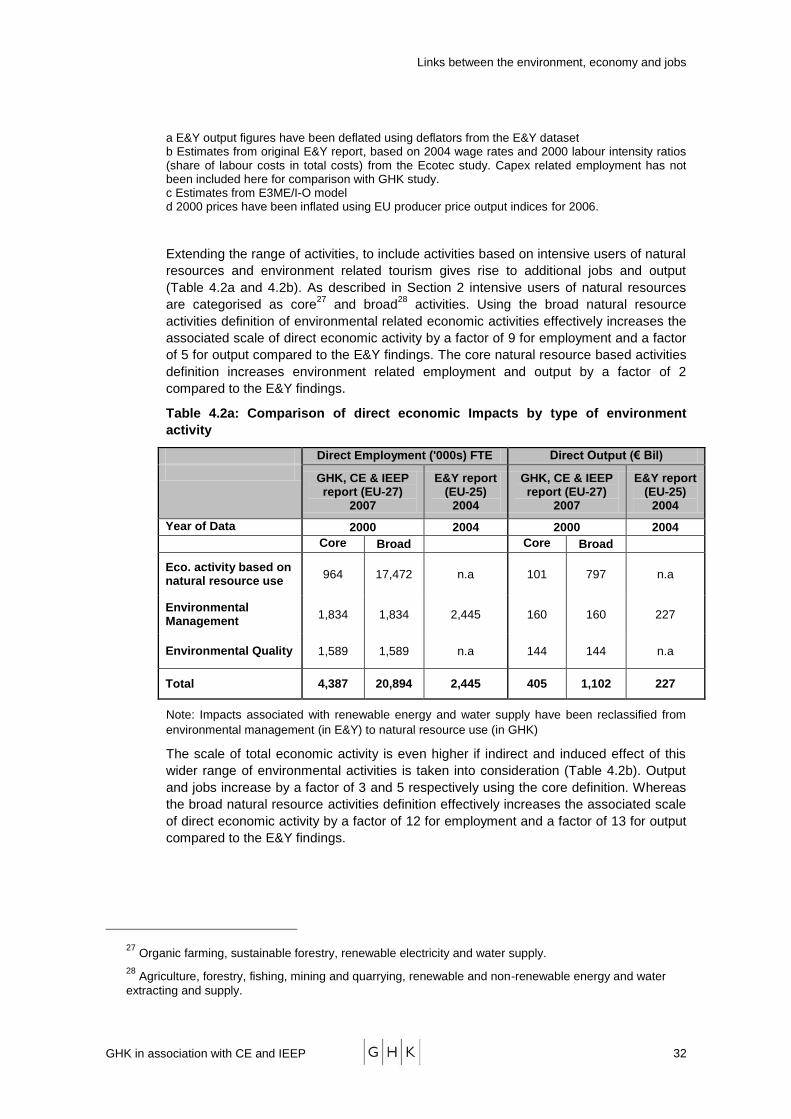
Links between the environment, economy and jobs
GHK in association with CE and IEEP 32
a E&Y output figures have been deflated using deflators from the E&Y dataset b Estimates from original E&Y report, based on 2004 wage rates and 2000 labour intensity ratios (share of labour costs in total costs) from the Ecotec study. Capex related employment has not been included here for comparison with GHK study. c Estimates from E3ME/I-O model d 2000 prices have been inflated using EU producer price output indices for 2006.
Extending the range of activities, to include activities based on intensive users of natural
resources and environment related tourism gives rise to additional jobs and output
(Table 4.2a and 4.2b). As described in Section 2 intensive users of natural resources
are categorised as core27
and broad28
activities. Using the broad natural resource
activities definition of environmental related economic activities effectively increases the
associated scale of direct economic activity by a factor of 9 for employment and a factor
of 5 for output compared to the E&Y findings. The core natural resource based activities
definition increases environment related employment and output by a factor of 2
compared to the E&Y findings.
Table 4.2a: Comparison of direct economic Impacts by type of environment
activity
Direct Employment ('000s) FTE Direct Output (€ Bil)
GHK, CE & IEEP report (EU-27)
2007
E&Y report (EU-25)
2004
GHK, CE & IEEP report (EU-27)
2007
E&Y report (EU-25)
2004
Year of Data 2000 2004 2000 2004
Core Broad Core Broad
Eco. activity based on natural resource use
964 17,472 n.a 101 797 n.a
Environmental Management
1,834 1,834 2,445 160 160 227
Environmental Quality 1,589 1,589 n.a 144 144 n.a
Total 4,387 20,894 2,445 405 1,102 227
Note: Impacts associated with renewable energy and water supply have been reclassified from
environmental management (in E&Y) to natural resource use (in GHK)
The scale of total economic activity is even higher if indirect and induced effect of this
wider range of environmental activities is taken into consideration (Table 4.2b). Output
and jobs increase by a factor of 3 and 5 respectively using the core definition. Whereas
the broad natural resource activities definition effectively increases the associated scale
of direct economic activity by a factor of 12 for employment and a factor of 13 for output
compared to the E&Y findings.
27 Organic farming, sustainable forestry, renewable electricity and water supply.
28 Agriculture, forestry, fishing, mining and quarrying, renewable and non-renewable energy and water
extracting and supply.

Links between the environment, economy and jobs
GHK in association with CE and IEEP 33
Table 4.2b: Comparison of total economic Impacts by type of environment activity
Total Employment ('000s) FTE Total Output (€ Bil)
GHK, CE & IEEP
report (EU-27) 2007 E&Y report
(EU-25) 2004
GHK, CE & IEEP report (EU-27)
2007
E&Y report (EU-25)
2004
Year of Data 2000 2004 2000 2004
Core Broad Core Broad
Eco. activity based on natural resource use
1,961 29,675 n.a 243 2,103 n.a
Environmental Management
3,385 3,385 2,952 466 466 227
Environmental Quality 3,319 3,319 n.a 418 418 n.a
Total 8,665 36,378 2,952 1,127 2,987 227
The analysis also extends the assessment to define the impacts of environment related
economic activities on GVA and disposable income from environment related economic
activities. This is shown for both broad and core definition in Table 4.3 and Table 4.4
respectively.
Table 4.3: Economic Impact of Environment Related Activities, EU-27, 2000 (2006
prices) including broad natural resource based activities
Direct Indirect Induced Total Total (Direct)
% of EU
Total (Indirect
& Induced) % of
EU
Employment ('000s) 20,894 10,826 4,658 36,378 10% 17%
Output (€ billion) 1,248 1,091 1,045 3,384 7% 18%
GVA (€ billion) 619 530 239 1,388 7% 14%
Disposable income (€ billion) 172 171 82 425 5% 11%
Note: Employment in full-time equivalent (FTE), Output, GVA and Disposable income in 2006 prices
The environment related activities attributed to broad natural resources, environmental
management and environmental quality directly support over 21 million jobs in the EU-
27 (Table 4.3). This is over 10% of total EU employment. Taking into account indirect
and induced effects brings the total number of jobs supported by environment related
activities in EU-27 in 2000 to over 36 million (FTE), accounting for 17% of total EU
employment. The environment related activities generated €1,388 billion of GVA
(around 14% of EU-27 GVA) and €425 billion per annum in disposable income, in 2006
prices (Table 4.3).
Economic impact of environment related activities based on core natural resources,
environmental management and environmental quality support a total of 8.6 million jobs.
This is around 4% of total EU employment. These environmental activities generated
€1,277 billion worth of EU output and €506 billion worth of GVA.
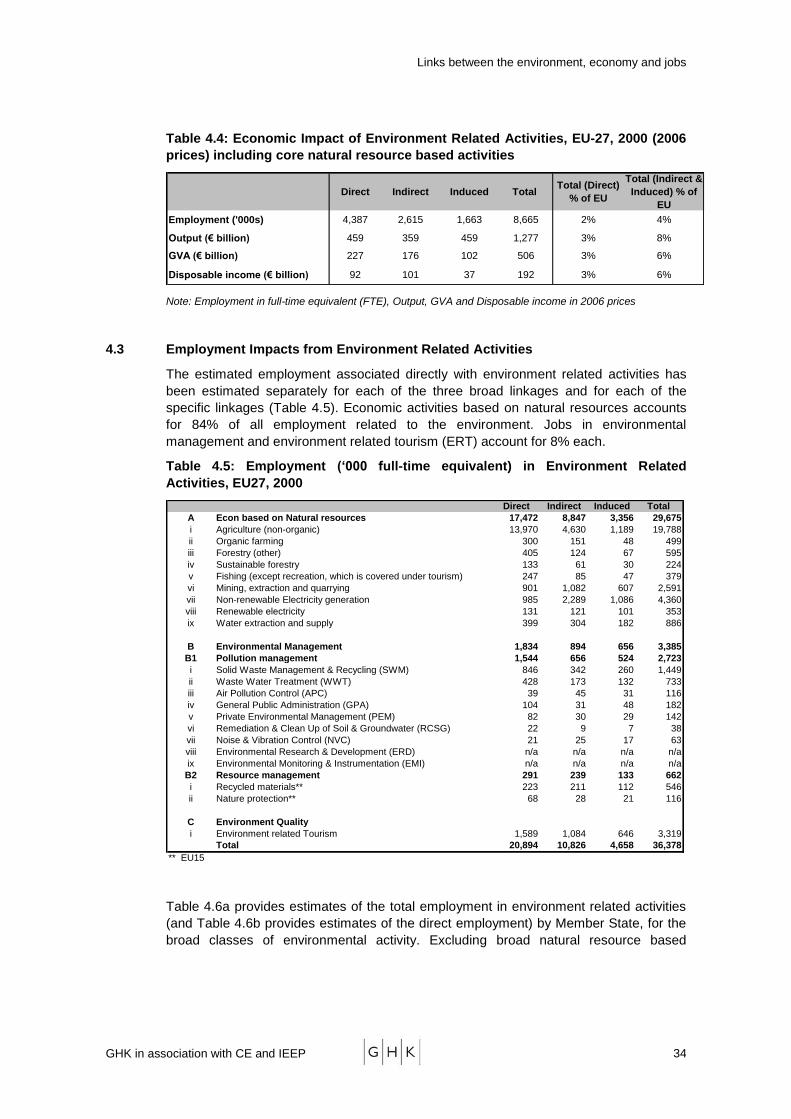
Links between the environment, economy and jobs
GHK in association with CE and IEEP 34
Table 4.4: Economic Impact of Environment Related Activities, EU-27, 2000 (2006
prices) including core natural resource based activities
Direct Indirect Induced Total Total (Direct)
% of EU
Total (Indirect &
Induced) % of
EU
Employment ('000s) 4,387 2,615 1,663 8,665 2% 4%
Output (€ billion) 459 359 459 1,277 3% 8%
GVA (€ billion) 227 176 102 506 3% 6%
Disposable income (€ billion) 92 101 37 192 3% 6%
Note: Employment in full-time equivalent (FTE), Output, GVA and Disposable income in 2006 prices
4.3 Employment Impacts from Environment Related Activities
The estimated employment associated directly with environment related activities has
been estimated separately for each of the three broad linkages and for each of the
specific linkages (Table 4.5). Economic activities based on natural resources accounts
for 84% of all employment related to the environment. Jobs in environmental
management and environment related tourism (ERT) account for 8% each.
Table 4.5: Employment (‘000 full-time equivalent) in Environment Related
Activities, EU27, 2000
Direct Indirect Induced Total
A Econ based on Natural resources 17,472 8,847 3,356 29,675
i Agriculture (non-organic) 13,970 4,630 1,189 19,788
ii Organic farming 300 151 48 499
iii Forestry (other) 405 124 67 595
iv Sustainable forestry 133 61 30 224
v Fishing (except recreation, which is covered under tourism) 247 85 47 379
vi Mining, extraction and quarrying 901 1,082 607 2,591
vii Non-renewable Electricity generation 985 2,289 1,086 4,360
viii Renewable electricity 131 121 101 353
ix Water extraction and supply 399 304 182 886
B Environmental Management 1,834 894 656 3,385
B1 Pollution management 1,544 656 524 2,723
i Solid Waste Management & Recycling (SWM) 846 342 260 1,449
ii Waste Water Treatment (WWT) 428 173 132 733
iii Air Pollution Control (APC) 39 45 31 116
iv General Public Administration (GPA) 104 31 48 182
v Private Environmental Management (PEM) 82 30 29 142
vi Remediation & Clean Up of Soil & Groundwater (RCSG) 22 9 7 38
vii Noise & Vibration Control (NVC) 21 25 17 63
viii Environmental Research & Development (ERD) n/a n/a n/a n/a
ix Environmental Monitoring & Instrumentation (EMI) n/a n/a n/a n/a
B2 Resource management 291 239 133 662
i Recycled materials** 223 211 112 546
ii Nature protection** 68 28 21 116
C Environment Quality
i Environment related Tourism 1,589 1,084 646 3,319
Total 20,894 10,826 4,658 36,378
** EU15
Table 4.6a provides estimates of the total employment in environment related activities
(and Table 4.6b provides estimates of the direct employment) by Member State, for the
broad classes of environmental activity. Excluding broad natural resource based
Links between the environment, economy and jobs
GHK in association with CE and IEEP 35
activities29
makes a major difference to the estimated impact, reducing the estimated
total employment30
to 8.6 million and direct employment to 4.3 million for EU-27.
Total and direct employment for each environmental sector by country is given in Annex
G.
29 Agriculture (non-organic), forestry (other), fishing, mining and non-renewable electricity.
30 Including in-direct and induced effects.

Links between the environment, economy and jobs
GHK in association with CE and IEEP 36
Table 4.6a: Total Employment, (‘000s), by Broad Environment Related Class, by Member State, 2000, FTE
Econ based on
Natural resources
Econ based
on Natural
resources
CorePollution
management
Resource
management
Broad (exc.
Core)
EU-27 1,961 2,723 662 3,319 8,665 EU-27 27,713 8,665 36,378
Belgium 10 36 31 49 126 Belgium 191 126 318
Denmark 15 70 19 33 136 Denmark 203 136 338
Germany 310 550 111 501 1,472 Germany 2,179 1,472 3,651
Greece 17 14 12 65 108 Greece 875 108 983
Spain 92 95 20 298 505 Spain 1,708 505 2,213
France 221 432 180 313 1,146 France 1,888 1,146 3,034
Ireland 7 11 3 23 43 Ireland 175 43 218
Italy 185 78 44 297 605 Italy 1,481 605 2,086
Luxembourg 1 2 2 4 9 Luxembourg 7 9 16
Netherlands 26 175 10 105 316 Netherlands 546 316 862
Austria 91 132 5 68 296 Austria 663 296 959
Portugal 72 30 15 71 188 Portugal 651 188 838
Finland 44 16 1 28 89 Finland 232 89 321
Sweden 59 29 10 50 149 Sweden 175 149 324
UK 154 196 112 543 1,004 UK 1,772 1,004 2,776
Czech Republic 89 3 0 59 152 Czech Republic 617 152 769
Estonia 8 12 0 10 31 Estonia 113 31 144
Cyprus 1 1 0 8 9 Cyprus 24 9 33
Latvia 26 9 0 16 51 Latvia 223 51 275
Lithuania 7 7 0 12 26 Lithuania 396 26 422
Hungary 44 85 0 42 171 Hungary 547 171 717
Malta 0 2 0 3 6 Malta 9 6 14
Poland 161 293 0 123 577 Poland 5,182 577 5,759
Slovenia 11 24 0 12 47 Slovenia 168 47 215
Slovakia 32 40 0 21 93 Slovakia 295 93 387
Bulgaria 82 44 0 39 165 Bulgaria 1,405 165 1,571
Romania 133 221 0 68 423 Romania 5,444 423 5,867
Total
employment
Environmental ManagementEnvironment
Quality
Total (exc. main
env. primary
sectors)
Total (exc. main
env. primary
sectors)
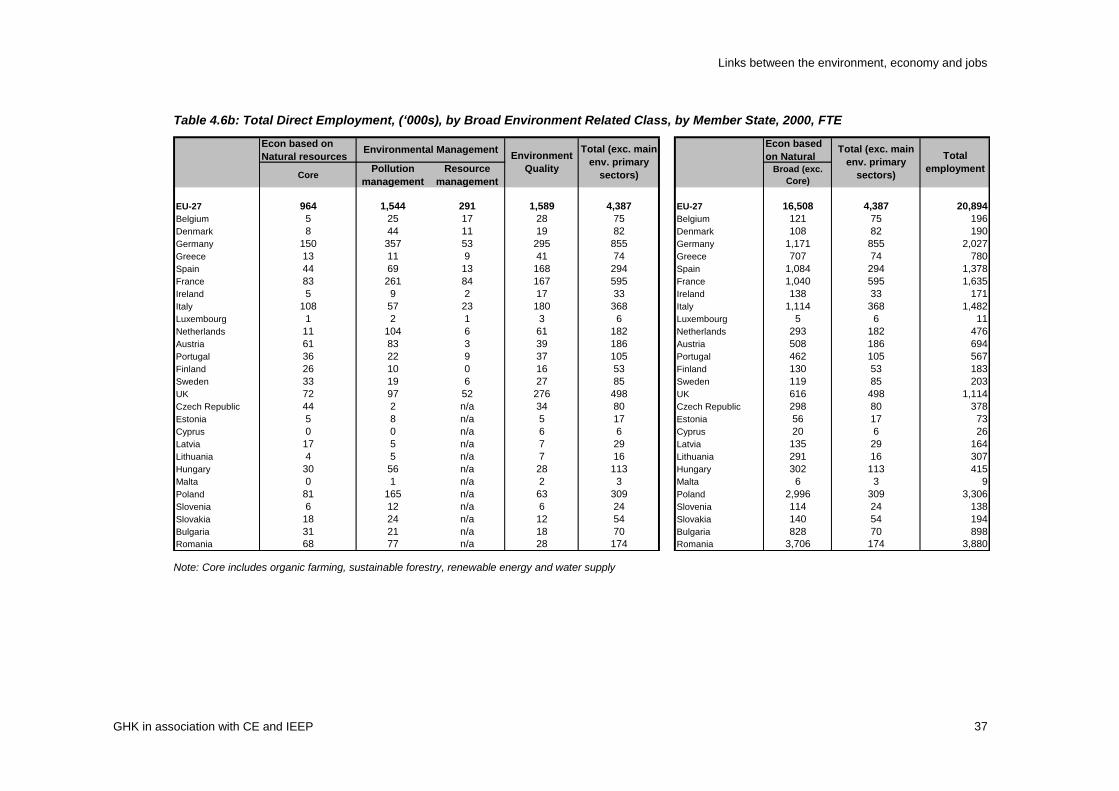
Links between the environment, economy and jobs
GHK in association with CE and IEEP 37
Table 4.6b: Total Direct Employment, (‘000s), by Broad Environment Related Class, by Member State, 2000, FTE
Econ based on
Natural resources
Econ based
on Natural
CorePollution
management
Resource
management
Broad (exc.
Core)
EU-27 964 1,544 291 1,589 4,387 EU-27 16,508 4,387 20,894
Belgium 5 25 17 28 75 Belgium 121 75 196
Denmark 8 44 11 19 82 Denmark 108 82 190
Germany 150 357 53 295 855 Germany 1,171 855 2,027
Greece 13 11 9 41 74 Greece 707 74 780
Spain 44 69 13 168 294 Spain 1,084 294 1,378
France 83 261 84 167 595 France 1,040 595 1,635
Ireland 5 9 2 17 33 Ireland 138 33 171
Italy 108 57 23 180 368 Italy 1,114 368 1,482
Luxembourg 1 2 1 3 6 Luxembourg 5 6 11
Netherlands 11 104 6 61 182 Netherlands 293 182 476
Austria 61 83 3 39 186 Austria 508 186 694
Portugal 36 22 9 37 105 Portugal 462 105 567
Finland 26 10 0 16 53 Finland 130 53 183
Sweden 33 19 6 27 85 Sweden 119 85 203
UK 72 97 52 276 498 UK 616 498 1,114
Czech Republic 44 2 n/a 34 80 Czech Republic 298 80 378
Estonia 5 8 n/a 5 17 Estonia 56 17 73
Cyprus 0 0 n/a 6 6 Cyprus 20 6 26
Latvia 17 5 n/a 7 29 Latvia 135 29 164
Lithuania 4 5 n/a 7 16 Lithuania 291 16 307
Hungary 30 56 n/a 28 113 Hungary 302 113 415
Malta 0 1 n/a 2 3 Malta 6 3 9
Poland 81 165 n/a 63 309 Poland 2,996 309 3,306
Slovenia 6 12 n/a 6 24 Slovenia 114 24 138
Slovakia 18 24 n/a 12 54 Slovakia 140 54 194
Bulgaria 31 21 n/a 18 70 Bulgaria 828 70 898
Romania 68 77 n/a 28 174 Romania 3,706 174 3,880
Total
employment
Environmental ManagementEnvironment
Quality
Total (exc. main
env. primary
sectors)
Total (exc. main
env. primary
sectors)
Note: Core includes organic farming, sustainable forestry, renewable energy and water supply

Links between the environment, economy and jobs
GHK in association with CE and IEEP 38
The proportion of total jobs in each of the environment related economic activity
category in Table 4.6a is expressed as proportion of total environment related jobs and
shown in Table 4.7. Bulgaria and Romania have a high proportion of jobs in the core
and broad sector due to disproportionately greater share of both conventional and
organic farming31
.
Main findings for environment related output as a proportion of total environment output
excluding the broad natural resources based activities are -
Denmark and Netherland have over 50% of jobs in pollution management
activities,
UK, Cyprus, Spain, Ireland, Greece and Malta have more than 50% of
environment related jobs in environment related tourism.
Table 4.7 Share of Total Environment Related Employment by Broad Class, by MS,
2000
Econ based on
Natural resources
Econ based on
Natural
resources
CorePollution
management
Resource
managementBroad (exc. core)
EU-27 23% 31% 8% 38% EU-27 76% 24%
Belgium 8% 29% 25% 39% Belgium 60% 40%
Denmark 11% 51% 14% 24% Denmark 60% 40%
Germany 21% 37% 8% 34% Germany 60% 40%
Greece 16% 13% 11% 60% Greece 89% 11%
Spain 18% 19% 4% 59% Spain 77% 23%
France 19% 38% 16% 27% France 62% 38%
Ireland 15% 26% 6% 53% Ireland 80% 20%
Italy 31% 13% 7% 49% Italy 71% 29%
Luxembourg 8% 24% 21% 47% Luxembourg 44% 56%
Netherlands 8% 55% 3% 33% Netherlands 63% 37%
Austria 31% 45% 2% 23% Austria 69% 31%
Portugal 38% 16% 8% 38% Portugal 78% 22%
Finland 49% 18% 1% 32% Finland 72% 28%
Sweden 40% 20% 6% 34% Sweden 54% 46%
UK 15% 19% 11% 54% UK 64% 36%
Czech Republic 59% 2% n/a 39% Czech Republic 80% 20%
Estonia 26% 40% n/a 33% Estonia 79% 21%
Cyprus 8% 7% n/a 85% Cyprus 73% 27%
Latvia 51% 17% n/a 31% Latvia 81% 19%
Lithuania 29% 26% n/a 45% Lithuania 94% 6%
Hungary 26% 50% n/a 25% Hungary 76% 24%
Malta 9% 34% n/a 57% Malta 61% 39%
Poland 28% 51% n/a 21% Poland 90% 10%
Slovenia 23% 52% n/a 25% Slovenia 78% 22%
Slovakia 35% 43% n/a 23% Slovakia 76% 24%
Bulgaria 49% 27% n/a 24% Bulgaria 89% 11%
Romania 32% 52% n/a 16% Romania 93% 7%
Environmental ManagementEnvironment
Quality
Total (exc.
main env.
primary
sectors)
Note: The shares are based on the two total columns in Table 4.6a. Eg. For core natural
resources – 1,961/8,665 is 23%.
The estimated direct employment for each of the environment related activities (Table
4.5) was assigned to NACE sectors as defined in I-O tables, enabling estimates of the
indirect and induced employment. This was used to calculate employment multipliers for
each country and environmental sector (Table 4.8). Employment multiplier for each
environmental sector by member state is given in Annex G.
31 Organic farming share in Romania and Bulgaria is estimated form EU-10 data.
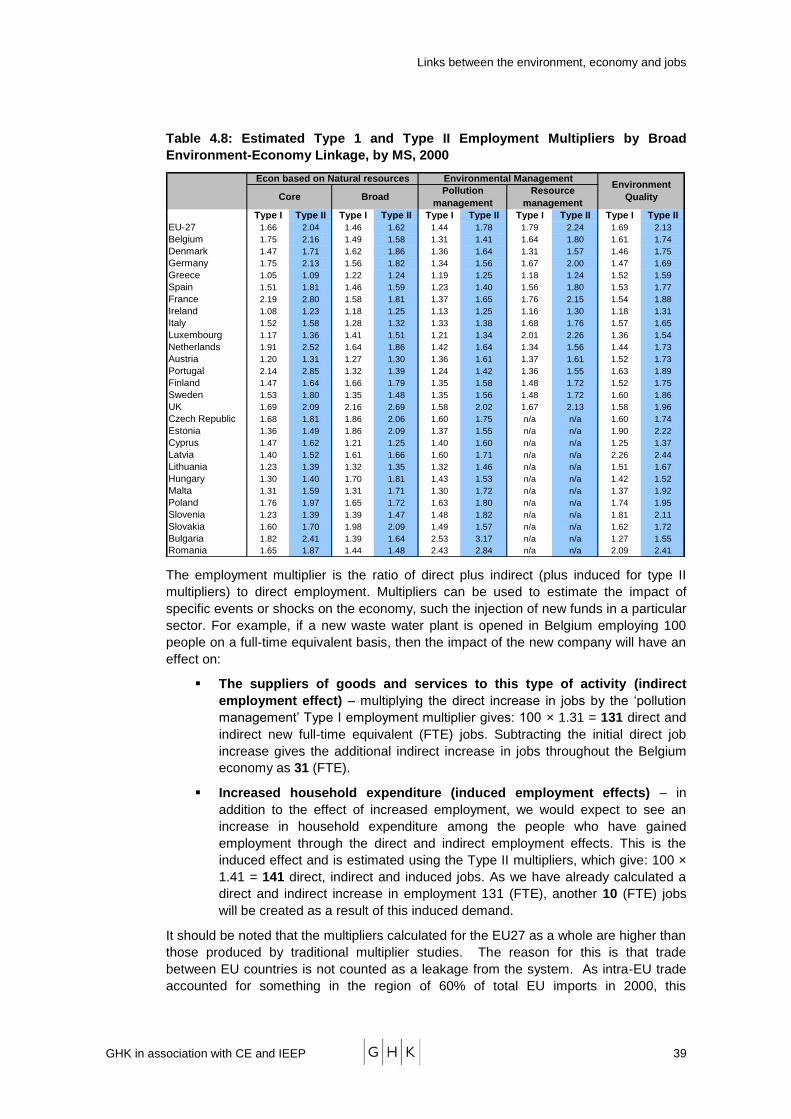
Links between the environment, economy and jobs
GHK in association with CE and IEEP 39
Table 4.8: Estimated Type 1 and Type II Employment Multipliers by Broad
Environment-Economy Linkage, by MS, 2000
Type I Type II Type I Type II Type I Type II Type I Type II Type I Type II
EU-27 1.66 2.04 1.46 1.62 1.44 1.78 1.79 2.24 1.69 2.13
Belgium 1.75 2.16 1.49 1.58 1.31 1.41 1.64 1.80 1.61 1.74
Denmark 1.47 1.71 1.62 1.86 1.36 1.64 1.31 1.57 1.46 1.75
Germany 1.75 2.13 1.56 1.82 1.34 1.56 1.67 2.00 1.47 1.69
Greece 1.05 1.09 1.22 1.24 1.19 1.25 1.18 1.24 1.52 1.59
Spain 1.51 1.81 1.46 1.59 1.23 1.40 1.56 1.80 1.53 1.77
France 2.19 2.80 1.58 1.81 1.37 1.65 1.76 2.15 1.54 1.88
Ireland 1.08 1.23 1.18 1.25 1.13 1.25 1.16 1.30 1.18 1.31
Italy 1.52 1.58 1.28 1.32 1.33 1.38 1.68 1.76 1.57 1.65
Luxembourg 1.17 1.36 1.41 1.51 1.21 1.34 2.01 2.26 1.36 1.54
Netherlands 1.91 2.52 1.64 1.86 1.42 1.64 1.34 1.56 1.44 1.73
Austria 1.20 1.31 1.27 1.30 1.36 1.61 1.37 1.61 1.52 1.73
Portugal 2.14 2.85 1.32 1.39 1.24 1.42 1.36 1.55 1.63 1.89
Finland 1.47 1.64 1.66 1.79 1.35 1.58 1.48 1.72 1.52 1.75
Sweden 1.53 1.80 1.35 1.48 1.35 1.56 1.48 1.72 1.60 1.86
UK 1.69 2.09 2.16 2.69 1.58 2.02 1.67 2.13 1.58 1.96
Czech Republic 1.68 1.81 1.86 2.06 1.60 1.75 n/a n/a 1.60 1.74
Estonia 1.36 1.49 1.86 2.09 1.37 1.55 n/a n/a 1.90 2.22
Cyprus 1.47 1.62 1.21 1.25 1.40 1.60 n/a n/a 1.25 1.37
Latvia 1.40 1.52 1.61 1.66 1.60 1.71 n/a n/a 2.26 2.44
Lithuania 1.23 1.39 1.32 1.35 1.32 1.46 n/a n/a 1.51 1.67
Hungary 1.30 1.40 1.70 1.81 1.43 1.53 n/a n/a 1.42 1.52
Malta 1.31 1.59 1.31 1.71 1.30 1.72 n/a n/a 1.37 1.92
Poland 1.76 1.97 1.65 1.72 1.63 1.80 n/a n/a 1.74 1.95
Slovenia 1.23 1.39 1.39 1.47 1.48 1.82 n/a n/a 1.81 2.11
Slovakia 1.60 1.70 1.98 2.09 1.49 1.57 n/a n/a 1.62 1.72
Bulgaria 1.82 2.41 1.39 1.64 2.53 3.17 n/a n/a 1.27 1.55
Romania 1.65 1.87 1.44 1.48 2.43 2.84 n/a n/a 2.09 2.41
Environmental Management
Pollution
management
Resource
management
Environment
QualityCore Broad
Econ based on Natural resources
The employment multiplier is the ratio of direct plus indirect (plus induced for type II
multipliers) to direct employment. Multipliers can be used to estimate the impact of
specific events or shocks on the economy, such the injection of new funds in a particular
sector. For example, if a new waste water plant is opened in Belgium employing 100
people on a full-time equivalent basis, then the impact of the new company will have an
effect on:
The suppliers of goods and services to this type of activity (indirect
employment effect) – multiplying the direct increase in jobs by the ‗pollution
management‘ Type I employment multiplier gives: 100 × 1.31 = 131 direct and
indirect new full-time equivalent (FTE) jobs. Subtracting the initial direct job
increase gives the additional indirect increase in jobs throughout the Belgium
economy as 31 (FTE).
Increased household expenditure (induced employment effects) – in
addition to the effect of increased employment, we would expect to see an
increase in household expenditure among the people who have gained
employment through the direct and indirect employment effects. This is the
induced effect and is estimated using the Type II multipliers, which give: 100 ×
1.41 = 141 direct, indirect and induced jobs. As we have already calculated a
direct and indirect increase in employment 131 (FTE), another 10 (FTE) jobs
will be created as a result of this induced demand.
It should be noted that the multipliers calculated for the EU27 as a whole are higher than
those produced by traditional multiplier studies. The reason for this is that trade
between EU countries is not counted as a leakage from the system. As intra-EU trade
accounted for something in the region of 60% of total EU imports in 2000, this
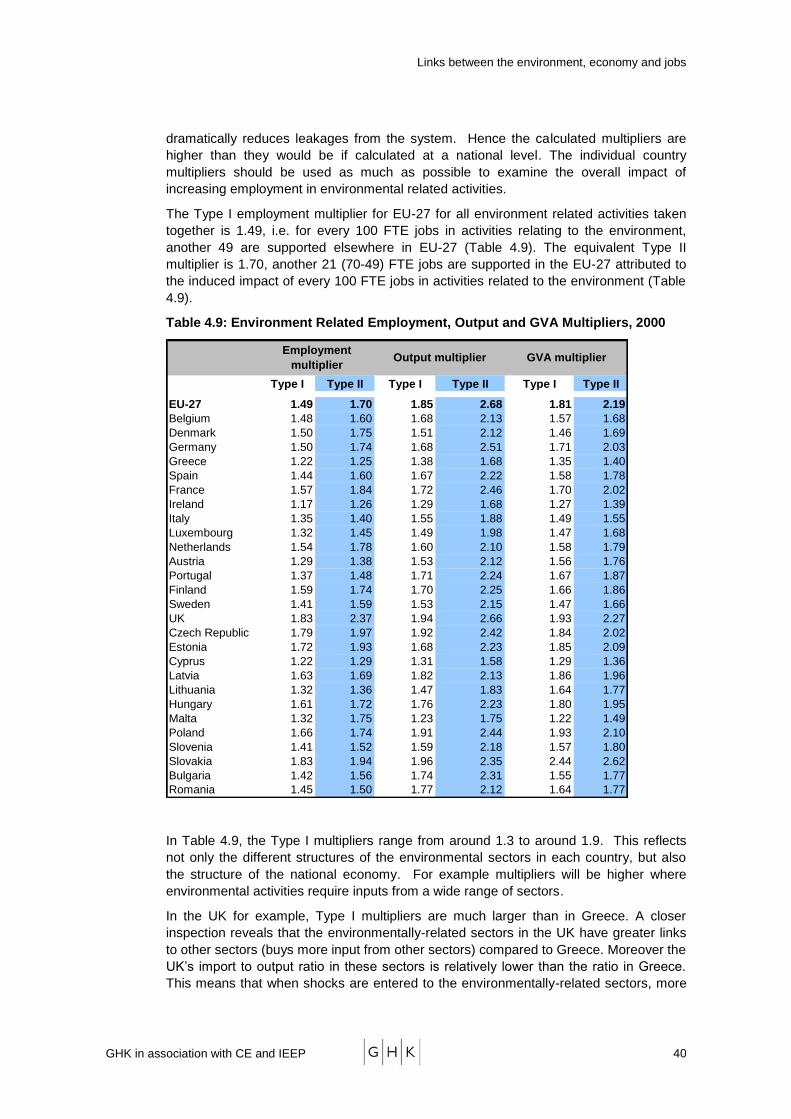
Links between the environment, economy and jobs
GHK in association with CE and IEEP 40
dramatically reduces leakages from the system. Hence the calculated multipliers are
higher than they would be if calculated at a national level. The individual country
multipliers should be used as much as possible to examine the overall impact of
increasing employment in environmental related activities.
The Type I employment multiplier for EU-27 for all environment related activities taken
together is 1.49, i.e. for every 100 FTE jobs in activities relating to the environment,
another 49 are supported elsewhere in EU-27 (Table 4.9). The equivalent Type II
multiplier is 1.70, another 21 (70-49) FTE jobs are supported in the EU-27 attributed to
the induced impact of every 100 FTE jobs in activities related to the environment (Table
4.9).
Table 4.9: Environment Related Employment, Output and GVA Multipliers, 2000
Type I Type II Type I Type II Type I Type II
EU-27 1.49 1.70 1.85 2.68 1.81 2.19
Belgium 1.48 1.60 1.68 2.13 1.57 1.68
Denmark 1.50 1.75 1.51 2.12 1.46 1.69
Germany 1.50 1.74 1.68 2.51 1.71 2.03
Greece 1.22 1.25 1.38 1.68 1.35 1.40
Spain 1.44 1.60 1.67 2.22 1.58 1.78
France 1.57 1.84 1.72 2.46 1.70 2.02
Ireland 1.17 1.26 1.29 1.68 1.27 1.39
Italy 1.35 1.40 1.55 1.88 1.49 1.55
Luxembourg 1.32 1.45 1.49 1.98 1.47 1.68
Netherlands 1.54 1.78 1.60 2.10 1.58 1.79
Austria 1.29 1.38 1.53 2.12 1.56 1.76
Portugal 1.37 1.48 1.71 2.24 1.67 1.87
Finland 1.59 1.74 1.70 2.25 1.66 1.86
Sweden 1.41 1.59 1.53 2.15 1.47 1.66
UK 1.83 2.37 1.94 2.66 1.93 2.27
Czech Republic 1.79 1.97 1.92 2.42 1.84 2.02
Estonia 1.72 1.93 1.68 2.23 1.85 2.09
Cyprus 1.22 1.29 1.31 1.58 1.29 1.36
Latvia 1.63 1.69 1.82 2.13 1.86 1.96
Lithuania 1.32 1.36 1.47 1.83 1.64 1.77
Hungary 1.61 1.72 1.76 2.23 1.80 1.95
Malta 1.32 1.75 1.23 1.75 1.22 1.49
Poland 1.66 1.74 1.91 2.44 1.93 2.10
Slovenia 1.41 1.52 1.59 2.18 1.57 1.80
Slovakia 1.83 1.94 1.96 2.35 2.44 2.62
Bulgaria 1.42 1.56 1.74 2.31 1.55 1.77
Romania 1.45 1.50 1.77 2.12 1.64 1.77
Employment
multiplier Output multiplier GVA multiplier
In Table 4.9, the Type I multipliers range from around 1.3 to around 1.9. This reflects
not only the different structures of the environmental sectors in each country, but also
the structure of the national economy. For example multipliers will be higher where
environmental activities require inputs from a wide range of sectors.
In the UK for example, Type I multipliers are much larger than in Greece. A closer
inspection reveals that the environmentally-related sectors in the UK have greater links
to other sectors (buys more input from other sectors) compared to Greece. Moreover the
UK‘s import to output ratio in these sectors is relatively lower than the ratio in Greece.
This means that when shocks are entered to the environmentally-related sectors, more

Links between the environment, economy and jobs
GHK in association with CE and IEEP 41
are passed on to other sectors domestically within the UK than the amounts that get
passed on domestically in Greece.
The Type II multipliers are larger than the Type I multipliers and range from around 1.6
to around 2.6. This is because Type II multipliers include wage income which is counted
as part of ‗leakages‘ in the Type I multipliers. Otherwise, the patterns of the Type II
multipliers very much follow the Type I multipliers.
As described above, the EU27 multipliers are larger than country level multipliers. This
is because the EU27 IO table includes import within EU. These imports are counted as
leakages.
4.4 Output Impacts from Environment Related Activities
The direct value of turnover (output) from activities relating to the environment was
€1,102 billion in EU-27, in 2000. As a result of the resources required to produce this
output from other sectors, subsequent income and spending generated an additional
€1,900 billion output in EU-27. This brings the total output of environment related
activities in 2000 to around €3,000 billion (Table 4.10).
Table 4.10: Output (€ million) in Environment Related Sectors for EU27, 2000
Direct Indirect Induced Total
A Econ based on Natural resources 797,488 713,127 592,340 2,102,954
i Agriculture (non-organic) 327,073 311,221 225,067 863,361
ii Organic farming 11,796 10,701 8,961 31,458
iii Forestry (other) 14,842 9,452 12,596 36,889
iv Sustainable forestry 6,654 4,718 5,719 17,092
v Fishing (except recreation, which is covered under tourism) 10,554 8,966 8,853 28,374
vi Mining, extraction and quarrying 124,689 98,754 92,519 315,962
vii Non-renewable Electricity generation 219,597 217,511 178,344 615,452
viii Renewable electricity 32,307 12,493 18,271 63,071
ix Water extraction and supply 49,976 39,311 42,010 131,296
B Environmental Management 159,978 124,229 181,417 465,625
B1 Pollution management 132,131 93,956 150,492 376,579
i Solid Waste Management & Recycling (SWM) 47,494 32,567 53,226 133,286
ii Waste Water Treatment (WWT) 47,604 32,643 53,350 133,597
iii Air Pollution Control (APC) 15,200 15,789 17,550 48,538
iv General Public Administration (GPA) 10,319 5,261 15,524 31,104
v Private Environmental Management (PEM) 5,025 2,598 3,508 11,131
vi Remediation & Clean Up of Soil & Groundwater (RCSG) 4,648 3,188 5,210 13,046
vii Noise & Vibration Control (NVC) 1,840 1,912 2,125 5,877
viii Environmental Research & Development (ERD) n/a n/a n/a n/a
ix Environmental Monitoring & Instrumentation (EMI) n/a n/a n/a n/a
B2 Resource management 27,847 30,273 30,925 89,046
i Recycled materials 22,666 26,720 25,118 74,503
ii Nature protection 5,182 3,553 5,807 14,542
C Environment Quality
i Environment related Tourism 144,309 125,308 148,834 418,452
Total 1,101,775 962,664 922,591 2,987,031
Table 4.11a provides estimates of the total output in environment related activities (and
Table 4.11b provides estimates of the direct output) by Member State, for the broad
classes of environmental activity. The UK has the highest direct output of all member
states in broad economic activities based on natural resources (€136 billion) and
‗environment related tourism‘ (€28 billion). Germany on the other hand has the highest
output in ‗environmental management activities‘ with around €50 billion. France had the
highest output in core economic activities based on natural resources with nearly €20
billion.
Links between the environment, economy and jobs
GHK in association with CE and IEEP 42
Total output and direct output if excluding the broad economic activities based on
natural resources (e.g. Conventional agriculture, mining, forestry, etc.) is around €1,126
billion and €405 billion respectively for EU-27. Core natural resource based activities
(organic farming, sustainable forestry, water supply and renewables) account for 22%,
environmental management accounts for a further 42% and ERT another 37% of total
output of €405 billion (Table 4.12).
Total and direct output for each environmental sector by country is given in Annex G.
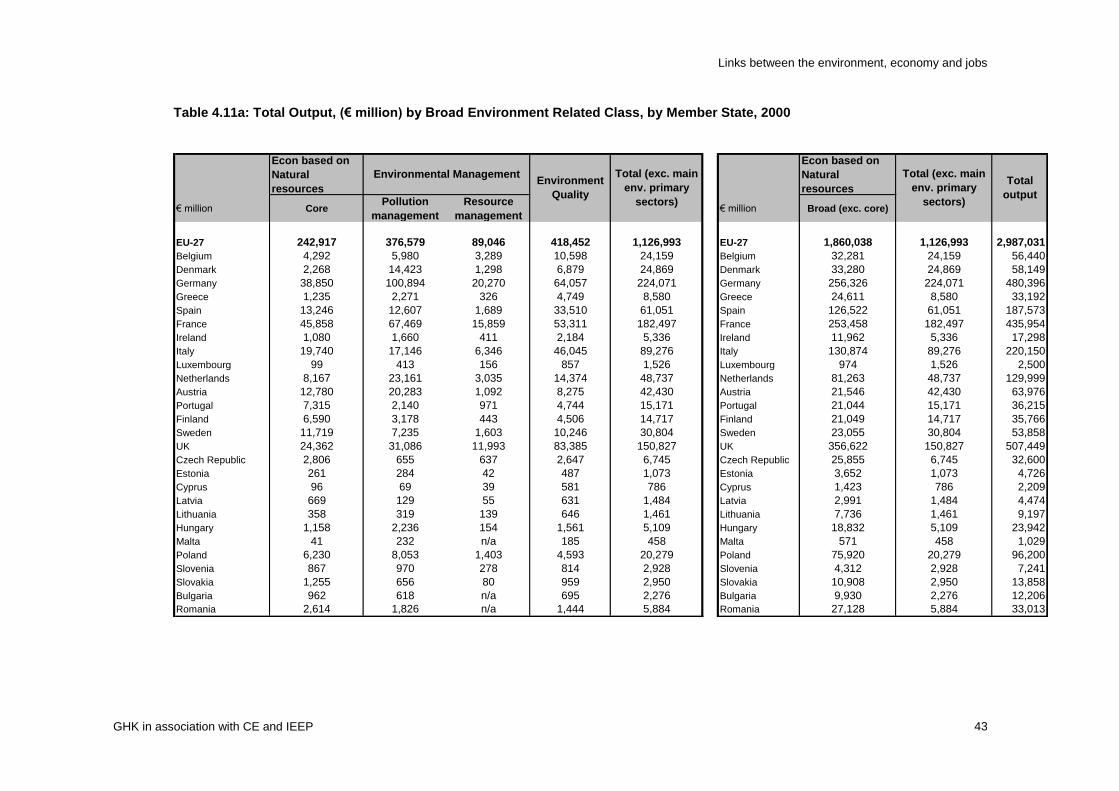
Links between the environment, economy and jobs
GHK in association with CE and IEEP 43
Table 4.11a: Total Output, (€ million) by Broad Environment Related Class, by Member State, 2000
Econ based on
Natural
resources
Econ based on
Natural
resources
€ million CorePollution
management
Resource
management€ million Broad (exc. core)
EU-27 242,917 376,579 89,046 418,452 1,126,993 EU-27 1,860,038 1,126,993 2,987,031
Belgium 4,292 5,980 3,289 10,598 24,159 Belgium 32,281 24,159 56,440
Denmark 2,268 14,423 1,298 6,879 24,869 Denmark 33,280 24,869 58,149
Germany 38,850 100,894 20,270 64,057 224,071 Germany 256,326 224,071 480,396
Greece 1,235 2,271 326 4,749 8,580 Greece 24,611 8,580 33,192
Spain 13,246 12,607 1,689 33,510 61,051 Spain 126,522 61,051 187,573
France 45,858 67,469 15,859 53,311 182,497 France 253,458 182,497 435,954
Ireland 1,080 1,660 411 2,184 5,336 Ireland 11,962 5,336 17,298
Italy 19,740 17,146 6,346 46,045 89,276 Italy 130,874 89,276 220,150
Luxembourg 99 413 156 857 1,526 Luxembourg 974 1,526 2,500
Netherlands 8,167 23,161 3,035 14,374 48,737 Netherlands 81,263 48,737 129,999
Austria 12,780 20,283 1,092 8,275 42,430 Austria 21,546 42,430 63,976
Portugal 7,315 2,140 971 4,744 15,171 Portugal 21,044 15,171 36,215
Finland 6,590 3,178 443 4,506 14,717 Finland 21,049 14,717 35,766
Sweden 11,719 7,235 1,603 10,246 30,804 Sweden 23,055 30,804 53,858
UK 24,362 31,086 11,993 83,385 150,827 UK 356,622 150,827 507,449
Czech Republic 2,806 655 637 2,647 6,745 Czech Republic 25,855 6,745 32,600
Estonia 261 284 42 487 1,073 Estonia 3,652 1,073 4,726
Cyprus 96 69 39 581 786 Cyprus 1,423 786 2,209
Latvia 669 129 55 631 1,484 Latvia 2,991 1,484 4,474
Lithuania 358 319 139 646 1,461 Lithuania 7,736 1,461 9,197
Hungary 1,158 2,236 154 1,561 5,109 Hungary 18,832 5,109 23,942
Malta 41 232 n/a 185 458 Malta 571 458 1,029
Poland 6,230 8,053 1,403 4,593 20,279 Poland 75,920 20,279 96,200
Slovenia 867 970 278 814 2,928 Slovenia 4,312 2,928 7,241
Slovakia 1,255 656 80 959 2,950 Slovakia 10,908 2,950 13,858
Bulgaria 962 618 n/a 695 2,276 Bulgaria 9,930 2,276 12,206
Romania 2,614 1,826 n/a 1,444 5,884 Romania 27,128 5,884 33,013
Total
output
Environmental ManagementEnvironment
Quality
Total (exc. main
env. primary
sectors)
Total (exc. main
env. primary
sectors)
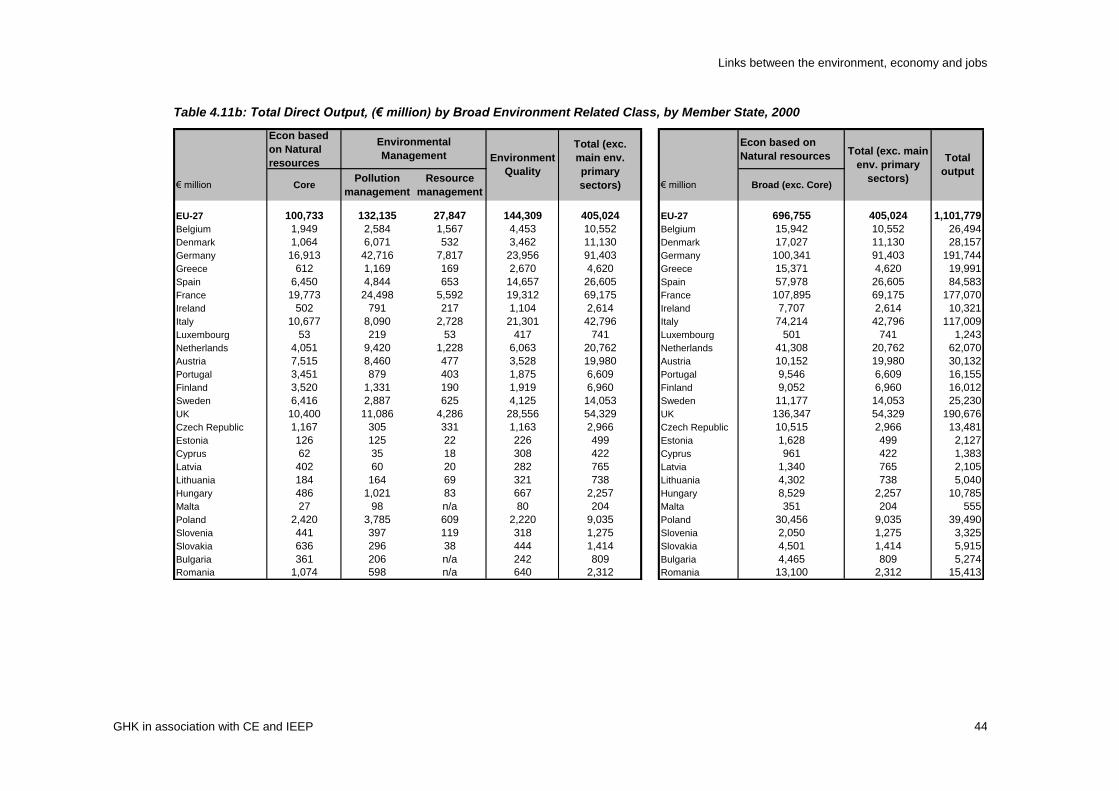
Links between the environment, economy and jobs
GHK in association with CE and IEEP 44
Table 4.11b: Total Direct Output, (€ million) by Broad Environment Related Class, by Member State, 2000
Econ based
on Natural
resources
Econ based on
Natural resources
€ million CorePollution
management
Resource
management€ million Broad (exc. Core)
EU-27 100,733 132,135 27,847 144,309 405,024 EU-27 696,755 405,024 1,101,779
Belgium 1,949 2,584 1,567 4,453 10,552 Belgium 15,942 10,552 26,494
Denmark 1,064 6,071 532 3,462 11,130 Denmark 17,027 11,130 28,157
Germany 16,913 42,716 7,817 23,956 91,403 Germany 100,341 91,403 191,744
Greece 612 1,169 169 2,670 4,620 Greece 15,371 4,620 19,991
Spain 6,450 4,844 653 14,657 26,605 Spain 57,978 26,605 84,583
France 19,773 24,498 5,592 19,312 69,175 France 107,895 69,175 177,070
Ireland 502 791 217 1,104 2,614 Ireland 7,707 2,614 10,321
Italy 10,677 8,090 2,728 21,301 42,796 Italy 74,214 42,796 117,009
Luxembourg 53 219 53 417 741 Luxembourg 501 741 1,243
Netherlands 4,051 9,420 1,228 6,063 20,762 Netherlands 41,308 20,762 62,070
Austria 7,515 8,460 477 3,528 19,980 Austria 10,152 19,980 30,132
Portugal 3,451 879 403 1,875 6,609 Portugal 9,546 6,609 16,155
Finland 3,520 1,331 190 1,919 6,960 Finland 9,052 6,960 16,012
Sweden 6,416 2,887 625 4,125 14,053 Sweden 11,177 14,053 25,230
UK 10,400 11,086 4,286 28,556 54,329 UK 136,347 54,329 190,676
Czech Republic 1,167 305 331 1,163 2,966 Czech Republic 10,515 2,966 13,481
Estonia 126 125 22 226 499 Estonia 1,628 499 2,127
Cyprus 62 35 18 308 422 Cyprus 961 422 1,383
Latvia 402 60 20 282 765 Latvia 1,340 765 2,105
Lithuania 184 164 69 321 738 Lithuania 4,302 738 5,040
Hungary 486 1,021 83 667 2,257 Hungary 8,529 2,257 10,785
Malta 27 98 n/a 80 204 Malta 351 204 555
Poland 2,420 3,785 609 2,220 9,035 Poland 30,456 9,035 39,490
Slovenia 441 397 119 318 1,275 Slovenia 2,050 1,275 3,325
Slovakia 636 296 38 444 1,414 Slovakia 4,501 1,414 5,915
Bulgaria 361 206 n/a 242 809 Bulgaria 4,465 809 5,274
Romania 1,074 598 n/a 640 2,312 Romania 13,100 2,312 15,413
Total (exc. main
env. primary
sectors)
Total
output
Environmental
Management Environment
Quality
Total (exc.
main env.
primary
sectors)
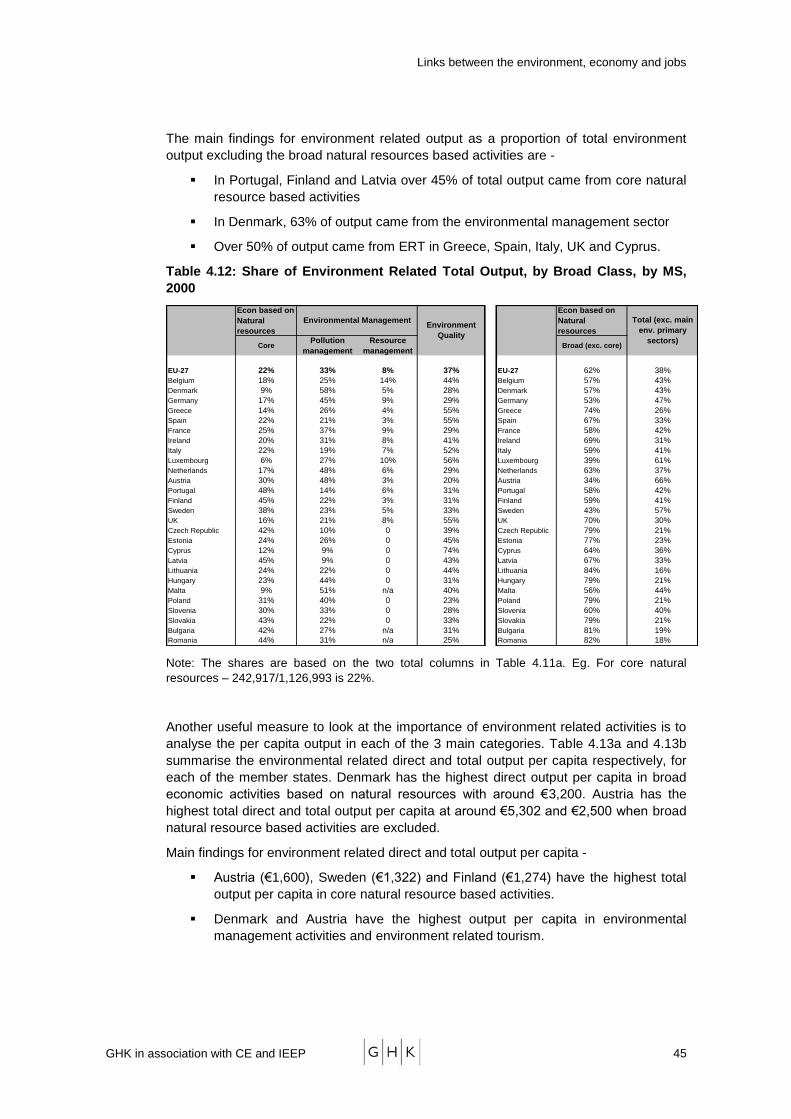
Links between the environment, economy and jobs
GHK in association with CE and IEEP 45
The main findings for environment related output as a proportion of total environment
output excluding the broad natural resources based activities are -
In Portugal, Finland and Latvia over 45% of total output came from core natural
resource based activities
In Denmark, 63% of output came from the environmental management sector
Over 50% of output came from ERT in Greece, Spain, Italy, UK and Cyprus.
Table 4.12: Share of Environment Related Total Output, by Broad Class, by MS,
2000
Econ based on
Natural
resources
Econ based on
Natural
resources
CorePollution
management
Resource
managementBroad (exc. core)
EU-27 22% 33% 8% 37% EU-27 62% 38%
Belgium 18% 25% 14% 44% Belgium 57% 43%
Denmark 9% 58% 5% 28% Denmark 57% 43%
Germany 17% 45% 9% 29% Germany 53% 47%
Greece 14% 26% 4% 55% Greece 74% 26%
Spain 22% 21% 3% 55% Spain 67% 33%
France 25% 37% 9% 29% France 58% 42%
Ireland 20% 31% 8% 41% Ireland 69% 31%
Italy 22% 19% 7% 52% Italy 59% 41%
Luxembourg 6% 27% 10% 56% Luxembourg 39% 61%
Netherlands 17% 48% 6% 29% Netherlands 63% 37%
Austria 30% 48% 3% 20% Austria 34% 66%
Portugal 48% 14% 6% 31% Portugal 58% 42%
Finland 45% 22% 3% 31% Finland 59% 41%
Sweden 38% 23% 5% 33% Sweden 43% 57%
UK 16% 21% 8% 55% UK 70% 30%
Czech Republic 42% 10% 0 39% Czech Republic 79% 21%
Estonia 24% 26% 0 45% Estonia 77% 23%
Cyprus 12% 9% 0 74% Cyprus 64% 36%
Latvia 45% 9% 0 43% Latvia 67% 33%
Lithuania 24% 22% 0 44% Lithuania 84% 16%
Hungary 23% 44% 0 31% Hungary 79% 21%
Malta 9% 51% n/a 40% Malta 56% 44%
Poland 31% 40% 0 23% Poland 79% 21%
Slovenia 30% 33% 0 28% Slovenia 60% 40%
Slovakia 43% 22% 0 33% Slovakia 79% 21%
Bulgaria 42% 27% n/a 31% Bulgaria 81% 19%
Romania 44% 31% n/a 25% Romania 82% 18%
Environmental ManagementEnvironment
Quality
Total (exc. main
env. primary
sectors)
Note: The shares are based on the two total columns in Table 4.11a. Eg. For core natural
resources – 242,917/1,126,993 is 22%.
Another useful measure to look at the importance of environment related activities is to
analyse the per capita output in each of the 3 main categories. Table 4.13a and 4.13b
summarise the environmental related direct and total output per capita respectively, for
each of the member states. Denmark has the highest direct output per capita in broad
economic activities based on natural resources with around €3,200. Austria has the
highest total direct and total output per capita at around €5,302 and €2,500 when broad
natural resource based activities are excluded.
Main findings for environment related direct and total output per capita -
Austria (€1,600), Sweden (€1,322) and Finland (€1,274) have the highest total
output per capita in core natural resource based activities.
Denmark and Austria have the highest output per capita in environmental
management activities and environment related tourism.
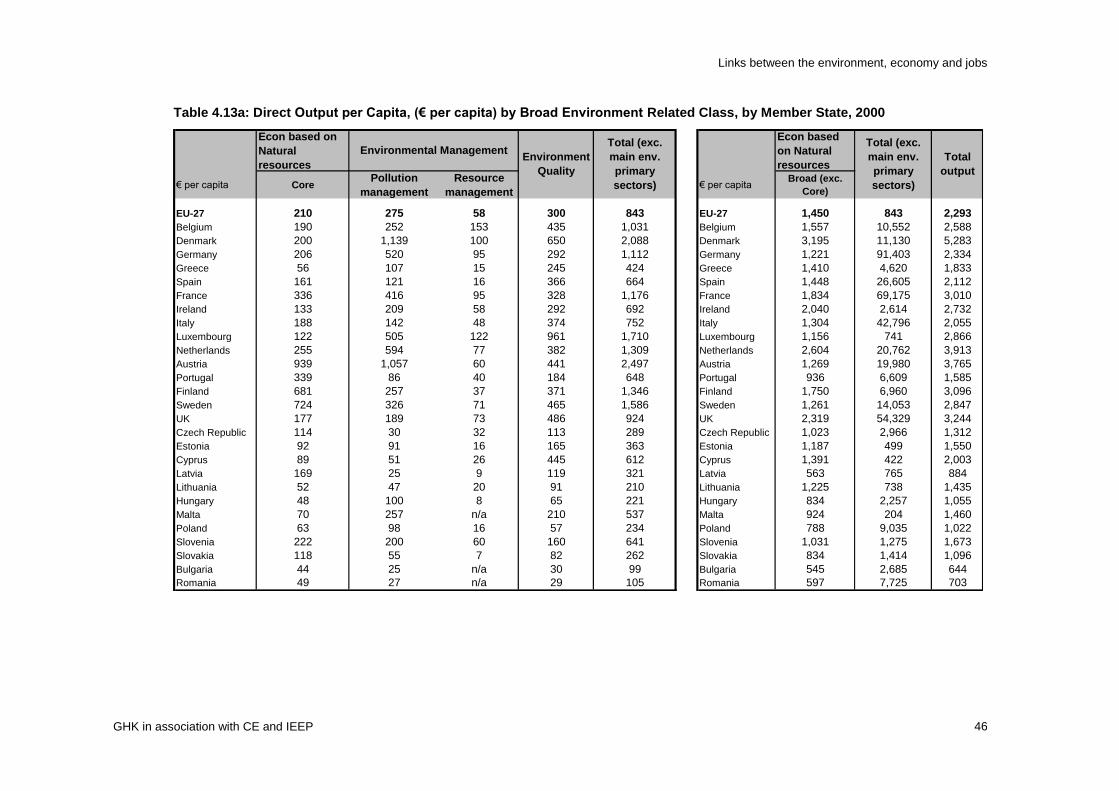
Links between the environment, economy and jobs
GHK in association with CE and IEEP 46
Table 4.13a: Direct Output per Capita, (€ per capita) by Broad Environment Related Class, by Member State, 2000
Econ based on
Natural
resources
Econ based
on Natural
resources
€ per capita CorePollution
management
Resource
management€ per capita
Broad (exc.
Core)
EU-27 210 275 58 300 843 EU-27 1,450 843 2,293
Belgium 190 252 153 435 1,031 Belgium 1,557 10,552 2,588
Denmark 200 1,139 100 650 2,088 Denmark 3,195 11,130 5,283
Germany 206 520 95 292 1,112 Germany 1,221 91,403 2,334
Greece 56 107 15 245 424 Greece 1,410 4,620 1,833
Spain 161 121 16 366 664 Spain 1,448 26,605 2,112
France 336 416 95 328 1,176 France 1,834 69,175 3,010
Ireland 133 209 58 292 692 Ireland 2,040 2,614 2,732
Italy 188 142 48 374 752 Italy 1,304 42,796 2,055
Luxembourg 122 505 122 961 1,710 Luxembourg 1,156 741 2,866
Netherlands 255 594 77 382 1,309 Netherlands 2,604 20,762 3,913
Austria 939 1,057 60 441 2,497 Austria 1,269 19,980 3,765
Portugal 339 86 40 184 648 Portugal 936 6,609 1,585
Finland 681 257 37 371 1,346 Finland 1,750 6,960 3,096
Sweden 724 326 71 465 1,586 Sweden 1,261 14,053 2,847
UK 177 189 73 486 924 UK 2,319 54,329 3,244
Czech Republic 114 30 32 113 289 Czech Republic 1,023 2,966 1,312
Estonia 92 91 16 165 363 Estonia 1,187 499 1,550
Cyprus 89 51 26 445 612 Cyprus 1,391 422 2,003
Latvia 169 25 9 119 321 Latvia 563 765 884
Lithuania 52 47 20 91 210 Lithuania 1,225 738 1,435
Hungary 48 100 8 65 221 Hungary 834 2,257 1,055
Malta 70 257 n/a 210 537 Malta 924 204 1,460
Poland 63 98 16 57 234 Poland 788 9,035 1,022
Slovenia 222 200 60 160 641 Slovenia 1,031 1,275 1,673
Slovakia 118 55 7 82 262 Slovakia 834 1,414 1,096
Bulgaria 44 25 n/a 30 99 Bulgaria 545 2,685 644
Romania 49 27 n/a 29 105 Romania 597 7,725 703
Environmental ManagementEnvironment
Quality
Total (exc.
main env.
primary
sectors)
Total (exc.
main env.
primary
sectors)
Total
output
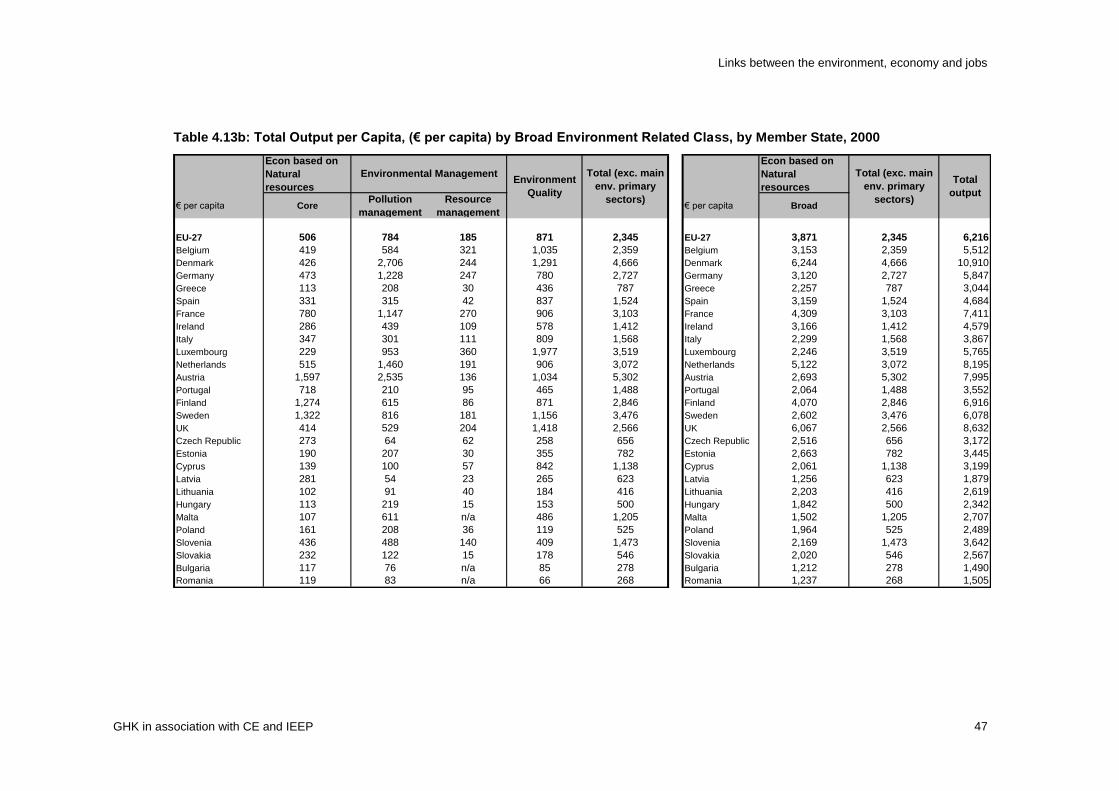
Links between the environment, economy and jobs
GHK in association with CE and IEEP 47
Table 4.13b: Total Output per Capita, (€ per capita) by Broad Environment Related Class, by Member State, 2000
Econ based on
Natural
resources
Econ based on
Natural
resources
€ per capita CorePollution
management
Resource
management€ per capita Broad
EU-27 506 784 185 871 2,345 EU-27 3,871 2,345 6,216
Belgium 419 584 321 1,035 2,359 Belgium 3,153 2,359 5,512
Denmark 426 2,706 244 1,291 4,666 Denmark 6,244 4,666 10,910
Germany 473 1,228 247 780 2,727 Germany 3,120 2,727 5,847
Greece 113 208 30 436 787 Greece 2,257 787 3,044
Spain 331 315 42 837 1,524 Spain 3,159 1,524 4,684
France 780 1,147 270 906 3,103 France 4,309 3,103 7,411
Ireland 286 439 109 578 1,412 Ireland 3,166 1,412 4,579
Italy 347 301 111 809 1,568 Italy 2,299 1,568 3,867
Luxembourg 229 953 360 1,977 3,519 Luxembourg 2,246 3,519 5,765
Netherlands 515 1,460 191 906 3,072 Netherlands 5,122 3,072 8,195
Austria 1,597 2,535 136 1,034 5,302 Austria 2,693 5,302 7,995
Portugal 718 210 95 465 1,488 Portugal 2,064 1,488 3,552
Finland 1,274 615 86 871 2,846 Finland 4,070 2,846 6,916
Sweden 1,322 816 181 1,156 3,476 Sweden 2,602 3,476 6,078
UK 414 529 204 1,418 2,566 UK 6,067 2,566 8,632
Czech Republic 273 64 62 258 656 Czech Republic 2,516 656 3,172
Estonia 190 207 30 355 782 Estonia 2,663 782 3,445
Cyprus 139 100 57 842 1,138 Cyprus 2,061 1,138 3,199
Latvia 281 54 23 265 623 Latvia 1,256 623 1,879
Lithuania 102 91 40 184 416 Lithuania 2,203 416 2,619
Hungary 113 219 15 153 500 Hungary 1,842 500 2,342
Malta 107 611 n/a 486 1,205 Malta 1,502 1,205 2,707
Poland 161 208 36 119 525 Poland 1,964 525 2,489
Slovenia 436 488 140 409 1,473 Slovenia 2,169 1,473 3,642
Slovakia 232 122 15 178 546 Slovakia 2,020 546 2,567
Bulgaria 117 76 n/a 85 278 Bulgaria 1,212 278 1,490
Romania 119 83 n/a 66 268 Romania 1,237 268 1,505
Total
output
Environmental ManagementEnvironment
Quality
Total (exc. main
env. primary
sectors)
Total (exc. main
env. primary
sectors)
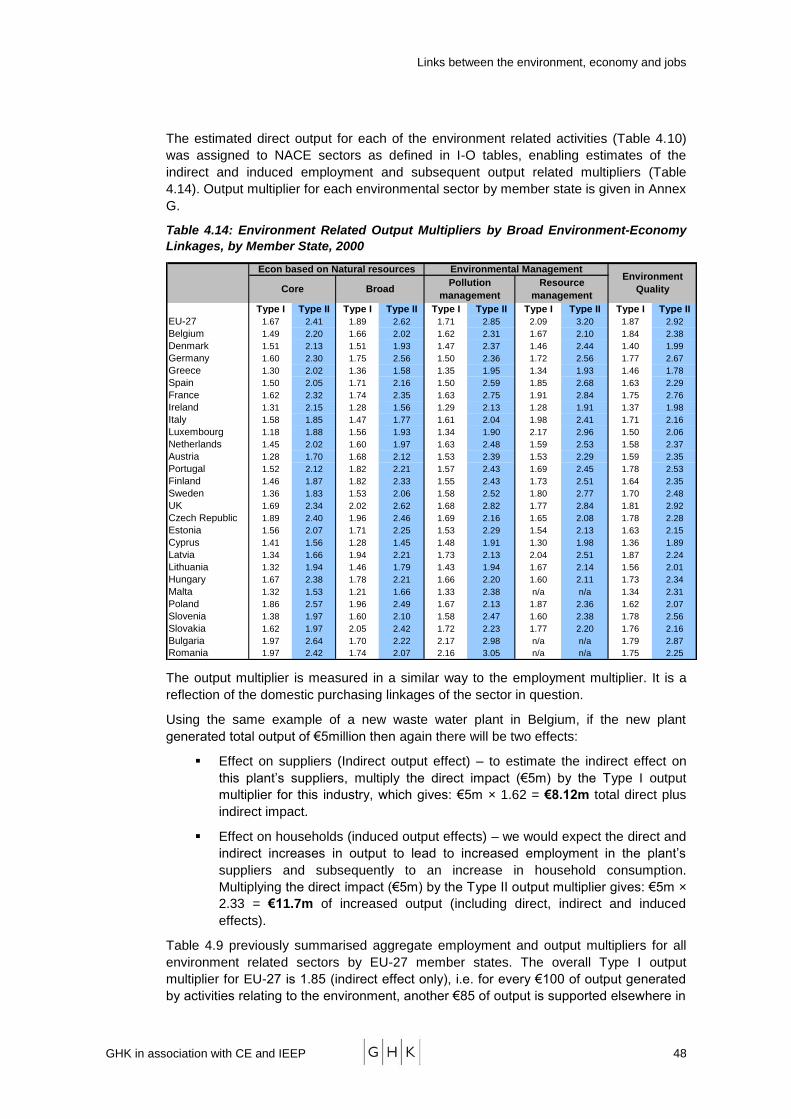
Links between the environment, economy and jobs
GHK in association with CE and IEEP 48
The estimated direct output for each of the environment related activities (Table 4.10)
was assigned to NACE sectors as defined in I-O tables, enabling estimates of the
indirect and induced employment and subsequent output related multipliers (Table
4.14). Output multiplier for each environmental sector by member state is given in Annex
G.
Table 4.14: Environment Related Output Multipliers by Broad Environment-Economy
Linkages, by Member State, 2000
Type I Type II Type I Type II Type I Type II Type I Type II Type I Type II
EU-27 1.67 2.41 1.89 2.62 1.71 2.85 2.09 3.20 1.87 2.92
Belgium 1.49 2.20 1.66 2.02 1.62 2.31 1.67 2.10 1.84 2.38
Denmark 1.51 2.13 1.51 1.93 1.47 2.37 1.46 2.44 1.40 1.99
Germany 1.60 2.30 1.75 2.56 1.50 2.36 1.72 2.56 1.77 2.67
Greece 1.30 2.02 1.36 1.58 1.35 1.95 1.34 1.93 1.46 1.78
Spain 1.50 2.05 1.71 2.16 1.50 2.59 1.85 2.68 1.63 2.29
France 1.62 2.32 1.74 2.35 1.63 2.75 1.91 2.84 1.75 2.76
Ireland 1.31 2.15 1.28 1.56 1.29 2.13 1.28 1.91 1.37 1.98
Italy 1.58 1.85 1.47 1.77 1.61 2.04 1.98 2.41 1.71 2.16
Luxembourg 1.18 1.88 1.56 1.93 1.34 1.90 2.17 2.96 1.50 2.06
Netherlands 1.45 2.02 1.60 1.97 1.63 2.48 1.59 2.53 1.58 2.37
Austria 1.28 1.70 1.68 2.12 1.53 2.39 1.53 2.29 1.59 2.35
Portugal 1.52 2.12 1.82 2.21 1.57 2.43 1.69 2.45 1.78 2.53
Finland 1.46 1.87 1.82 2.33 1.55 2.43 1.73 2.51 1.64 2.35
Sweden 1.36 1.83 1.53 2.06 1.58 2.52 1.80 2.77 1.70 2.48
UK 1.69 2.34 2.02 2.62 1.68 2.82 1.77 2.84 1.81 2.92
Czech Republic 1.89 2.40 1.96 2.46 1.69 2.16 1.65 2.08 1.78 2.28
Estonia 1.56 2.07 1.71 2.25 1.53 2.29 1.54 2.13 1.63 2.15
Cyprus 1.41 1.56 1.28 1.45 1.48 1.91 1.30 1.98 1.36 1.89
Latvia 1.34 1.66 1.94 2.21 1.73 2.13 2.04 2.51 1.87 2.24
Lithuania 1.32 1.94 1.46 1.79 1.43 1.94 1.67 2.14 1.56 2.01
Hungary 1.67 2.38 1.78 2.21 1.66 2.20 1.60 2.11 1.73 2.34
Malta 1.32 1.53 1.21 1.66 1.33 2.38 n/a n/a 1.34 2.31
Poland 1.86 2.57 1.96 2.49 1.67 2.13 1.87 2.36 1.62 2.07
Slovenia 1.38 1.97 1.60 2.10 1.58 2.47 1.60 2.38 1.78 2.56
Slovakia 1.62 1.97 2.05 2.42 1.72 2.23 1.77 2.20 1.76 2.16
Bulgaria 1.97 2.64 1.70 2.22 2.17 2.98 n/a n/a 1.79 2.87
Romania 1.97 2.42 1.74 2.07 2.16 3.05 n/a n/a 1.75 2.25
Econ based on Natural resources Environmental ManagementEnvironment
QualityCore BroadPollution
management
Resource
management
The output multiplier is measured in a similar way to the employment multiplier. It is a
reflection of the domestic purchasing linkages of the sector in question.
Using the same example of a new waste water plant in Belgium, if the new plant
generated total output of €5million then again there will be two effects:
Effect on suppliers (Indirect output effect) – to estimate the indirect effect on
this plant‘s suppliers, multiply the direct impact (€5m) by the Type I output
multiplier for this industry, which gives: €5m × 1.62 = €8.12m total direct plus
indirect impact.
Effect on households (induced output effects) – we would expect the direct and
indirect increases in output to lead to increased employment in the plant‘s
suppliers and subsequently to an increase in household consumption.
Multiplying the direct impact (€5m) by the Type II output multiplier gives: €5m ×
2.33 = €11.7m of increased output (including direct, indirect and induced
effects).
Table 4.9 previously summarised aggregate employment and output multipliers for all
environment related sectors by EU-27 member states. The overall Type I output
multiplier for EU-27 is 1.85 (indirect effect only), i.e. for every €100 of output generated
by activities relating to the environment, another €85 of output is supported elsewhere in
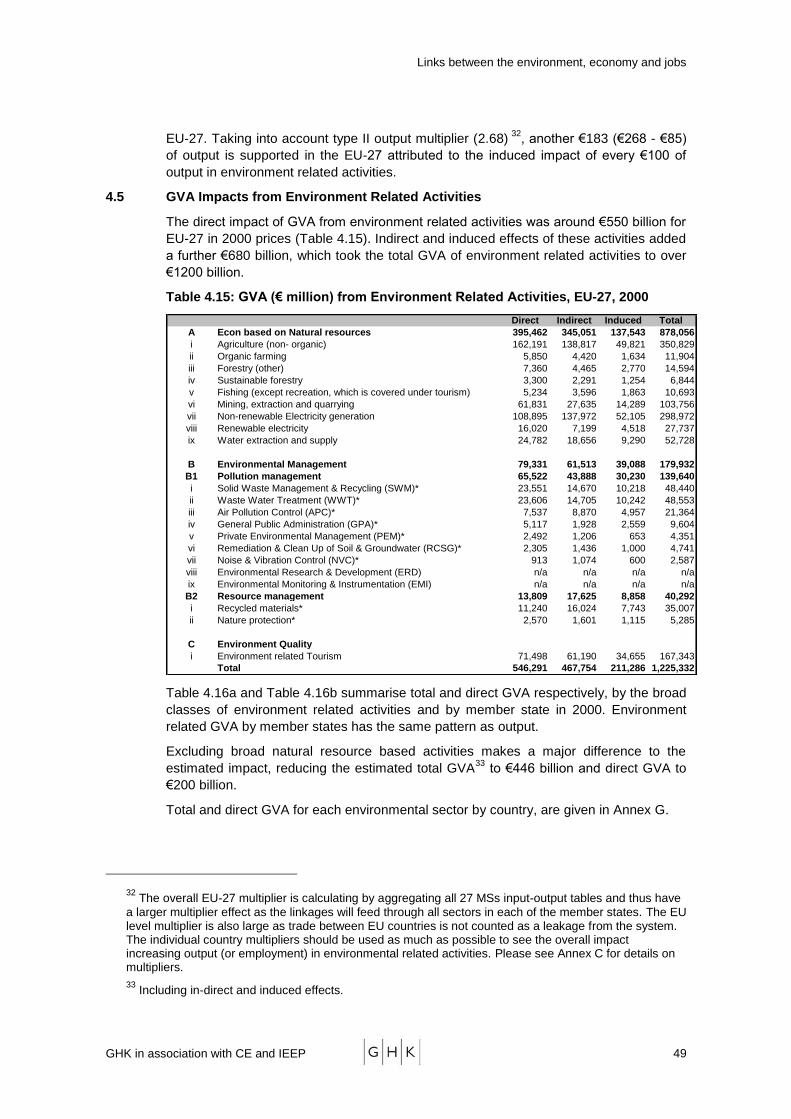
Links between the environment, economy and jobs
GHK in association with CE and IEEP 49
EU-27. Taking into account type II output multiplier (2.68) 32
, another €183 (€268 - €85)
of output is supported in the EU-27 attributed to the induced impact of every €100 of
output in environment related activities.
4.5 GVA Impacts from Environment Related Activities
The direct impact of GVA from environment related activities was around €550 billion for
EU-27 in 2000 prices (Table 4.15). Indirect and induced effects of these activities added
a further €680 billion, which took the total GVA of environment related activities to over
€1200 billion.
Table 4.15: GVA (€ million) from Environment Related Activities, EU-27, 2000
Direct Indirect Induced Total
A Econ based on Natural resources 395,462 345,051 137,543 878,056
i Agriculture (non- organic) 162,191 138,817 49,821 350,829
ii Organic farming 5,850 4,420 1,634 11,904
iii Forestry (other) 7,360 4,465 2,770 14,594
iv Sustainable forestry 3,300 2,291 1,254 6,844
v Fishing (except recreation, which is covered under tourism) 5,234 3,596 1,863 10,693
vi Mining, extraction and quarrying 61,831 27,635 14,289 103,756
vii Non-renewable Electricity generation 108,895 137,972 52,105 298,972
viii Renewable electricity 16,020 7,199 4,518 27,737
ix Water extraction and supply 24,782 18,656 9,290 52,728
B Environmental Management 79,331 61,513 39,088 179,932
B1 Pollution management 65,522 43,888 30,230 139,640
i Solid Waste Management & Recycling (SWM)* 23,551 14,670 10,218 48,440
ii Waste Water Treatment (WWT)* 23,606 14,705 10,242 48,553
iii Air Pollution Control (APC)* 7,537 8,870 4,957 21,364
iv General Public Administration (GPA)* 5,117 1,928 2,559 9,604
v Private Environmental Management (PEM)* 2,492 1,206 653 4,351
vi Remediation & Clean Up of Soil & Groundwater (RCSG)* 2,305 1,436 1,000 4,741
vii Noise & Vibration Control (NVC)* 913 1,074 600 2,587
viii Environmental Research & Development (ERD) n/a n/a n/a n/a
ix Environmental Monitoring & Instrumentation (EMI) n/a n/a n/a n/a
B2 Resource management 13,809 17,625 8,858 40,292
i Recycled materials* 11,240 16,024 7,743 35,007
ii Nature protection* 2,570 1,601 1,115 5,285
C Environment Quality
i Environment related Tourism 71,498 61,190 34,655 167,343
Total 546,291 467,754 211,286 1,225,332
Table 4.16a and Table 4.16b summarise total and direct GVA respectively, by the broad
classes of environment related activities and by member state in 2000. Environment
related GVA by member states has the same pattern as output.
Excluding broad natural resource based activities makes a major difference to the
estimated impact, reducing the estimated total GVA33
to €446 billion and direct GVA to
€200 billion.
Total and direct GVA for each environmental sector by country, are given in Annex G.
32 The overall EU-27 multiplier is calculating by aggregating all 27 MSs input-output tables and thus have
a larger multiplier effect as the linkages will feed through all sectors in each of the member states. The EU level multiplier is also large as trade between EU countries is not counted as a leakage from the system. The individual country multipliers should be used as much as possible to see the overall impact increasing output (or employment) in environmental related activities. Please see Annex C for details on multipliers.
33 Including in-direct and induced effects.

Links between the environment, economy and jobs
GHK in association with CE and IEEP 50
Table 4.16a: Total GVA (€ million) by Broad Environment Related Class, by Member State, 2000
Econ based on
Natural
resources
Econ based on
Natural resources
€ million CorePollution
management
Resource
managementBroad (exc. Core)
EU-27 99,213 139,640 40,292 167,343 446,488 EU-27 778,843 446,488 1,225,332
Belgium 456 2,185 1,648 4,673 8,962 Belgium 13,031 8,962 21,993
Denmark 1,456 5,561 468 3,273 10,758 Denmark 13,841 10,758 24,599
Germany 13,525 36,858 9,295 26,475 86,153 Germany 110,413 86,153 196,567
Greece 308 834 117 1,965 3,225 Greece 10,068 3,225 13,293
Spain 5,232 4,495 815 12,351 22,893 Spain 50,924 22,893 73,817
France 18,347 24,315 7,345 20,552 70,558 France 109,048 70,558 179,607
Ireland 208 607 163 845 1,824 Ireland 5,013 1,824 6,837
Italy 11,119 6,950 3,413 19,184 40,665 Italy 53,008 40,665 93,673
Luxembourg 16 172 70 328 586 Luxembourg 553 586 1,139
Netherlands 1,589 9,527 1,203 5,924 18,243 Netherlands 39,119 18,243 57,363
Austria 10,151 7,406 425 3,227 21,209 Austria 9,376 21,209 30,584
Portugal 2,984 817 435 2,078 6,314 Portugal 9,725 6,314 16,039
Finland 4,933 1,203 201 1,733 8,070 Finland 8,675 8,070 16,745
Sweden 7,453 2,719 838 4,371 15,381 Sweden 9,359 15,381 24,740
UK 6,387 11,782 4,923 33,404 56,496 UK 382,272 56,496 438,768
Czech Republic 625 302 349 1,105 2,380 Czech Republic 10,841 2,380 13,221
Estonia 122 95 51 210 479 Estonia 2,314 479 2,792
Cyprus 0 29 15 229 272 Cyprus 621 272 894
Latvia 375 47 26 294 743 Latvia 1,492 743 2,235
Lithuania 130 119 73 303 624 Lithuania 3,630 624 4,254
Hungary 53 954 78 628 1,714 Hungary 8,286 1,714 9,999
Malta 0 97 0 73 170 Malta 247 170 417
Poland 1,638 3,245 673 1,912 7,469 Poland 33,294 7,469 40,763
Slovenia 419 362 117 342 1,239 Slovenia 1,835 1,239 3,074
Slovakia 964 269 33 438 1,704 Slovakia 7,680 1,704 9,384
Bulgaria 304 291 0 267 862 Bulgaria 4,209 862 5,071
Romania 911 705 0 540 2,156 Romania 12,083 2,156 14,239
Total
output
Total (exc. main
env. primary
sectors)
Total (exc.
main env.
primary
sectors)
Environmental Management
Environment
Quality
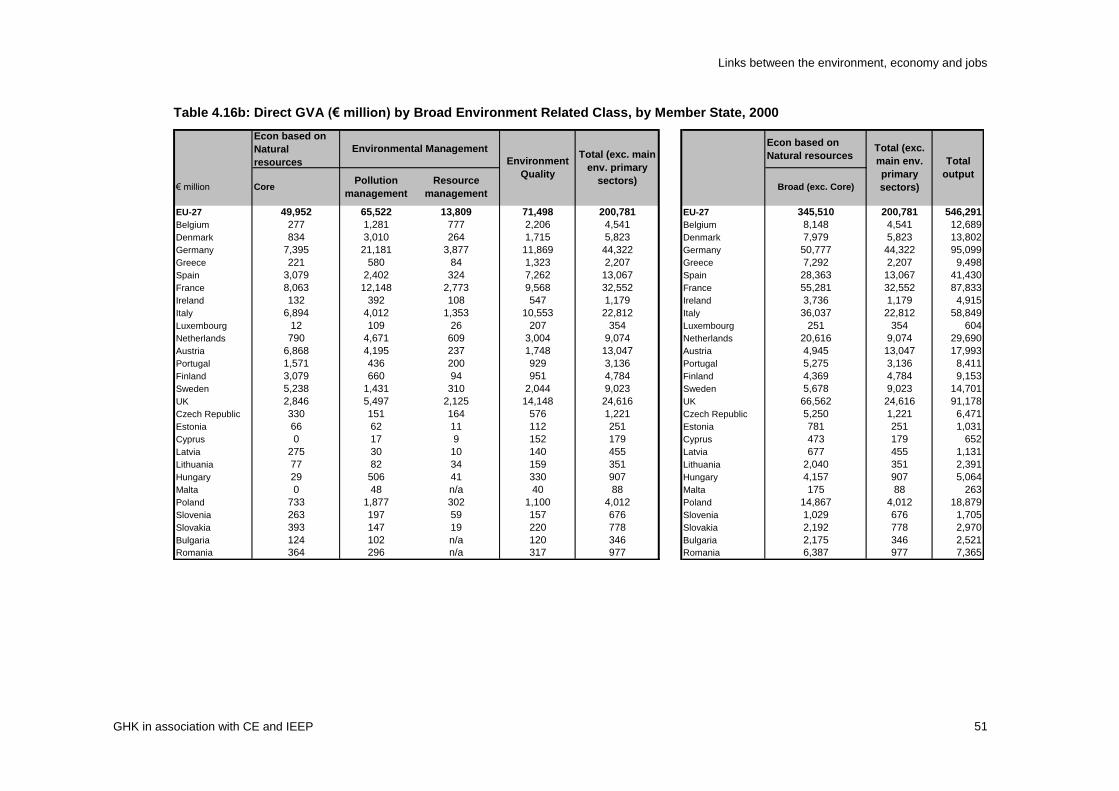
Links between the environment, economy and jobs
GHK in association with CE and IEEP 51
Table 4.16b: Direct GVA (€ million) by Broad Environment Related Class, by Member State, 2000
Econ based on
Natural
resources
Econ based on
Natural resources
€ million CorePollution
management
Resource
managementBroad (exc. Core)
EU-27 49,952 65,522 13,809 71,498 200,781 EU-27 345,510 200,781 546,291
Belgium 277 1,281 777 2,206 4,541 Belgium 8,148 4,541 12,689
Denmark 834 3,010 264 1,715 5,823 Denmark 7,979 5,823 13,802
Germany 7,395 21,181 3,877 11,869 44,322 Germany 50,777 44,322 95,099
Greece 221 580 84 1,323 2,207 Greece 7,292 2,207 9,498
Spain 3,079 2,402 324 7,262 13,067 Spain 28,363 13,067 41,430
France 8,063 12,148 2,773 9,568 32,552 France 55,281 32,552 87,833
Ireland 132 392 108 547 1,179 Ireland 3,736 1,179 4,915
Italy 6,894 4,012 1,353 10,553 22,812 Italy 36,037 22,812 58,849
Luxembourg 12 109 26 207 354 Luxembourg 251 354 604
Netherlands 790 4,671 609 3,004 9,074 Netherlands 20,616 9,074 29,690
Austria 6,868 4,195 237 1,748 13,047 Austria 4,945 13,047 17,993
Portugal 1,571 436 200 929 3,136 Portugal 5,275 3,136 8,411
Finland 3,079 660 94 951 4,784 Finland 4,369 4,784 9,153
Sweden 5,238 1,431 310 2,044 9,023 Sweden 5,678 9,023 14,701
UK 2,846 5,497 2,125 14,148 24,616 UK 66,562 24,616 91,178
Czech Republic 330 151 164 576 1,221 Czech Republic 5,250 1,221 6,471
Estonia 66 62 11 112 251 Estonia 781 251 1,031
Cyprus 0 17 9 152 179 Cyprus 473 179 652
Latvia 275 30 10 140 455 Latvia 677 455 1,131
Lithuania 77 82 34 159 351 Lithuania 2,040 351 2,391
Hungary 29 506 41 330 907 Hungary 4,157 907 5,064
Malta 0 48 n/a 40 88 Malta 175 88 263
Poland 733 1,877 302 1,100 4,012 Poland 14,867 4,012 18,879
Slovenia 263 197 59 157 676 Slovenia 1,029 676 1,705
Slovakia 393 147 19 220 778 Slovakia 2,192 778 2,970
Bulgaria 124 102 n/a 120 346 Bulgaria 2,175 346 2,521
Romania 364 296 n/a 317 977 Romania 6,387 977 7,365
Environmental Management
Environment
Quality
Total
output
Total (exc. main
env. primary
sectors)
Total (exc.
main env.
primary
sectors)
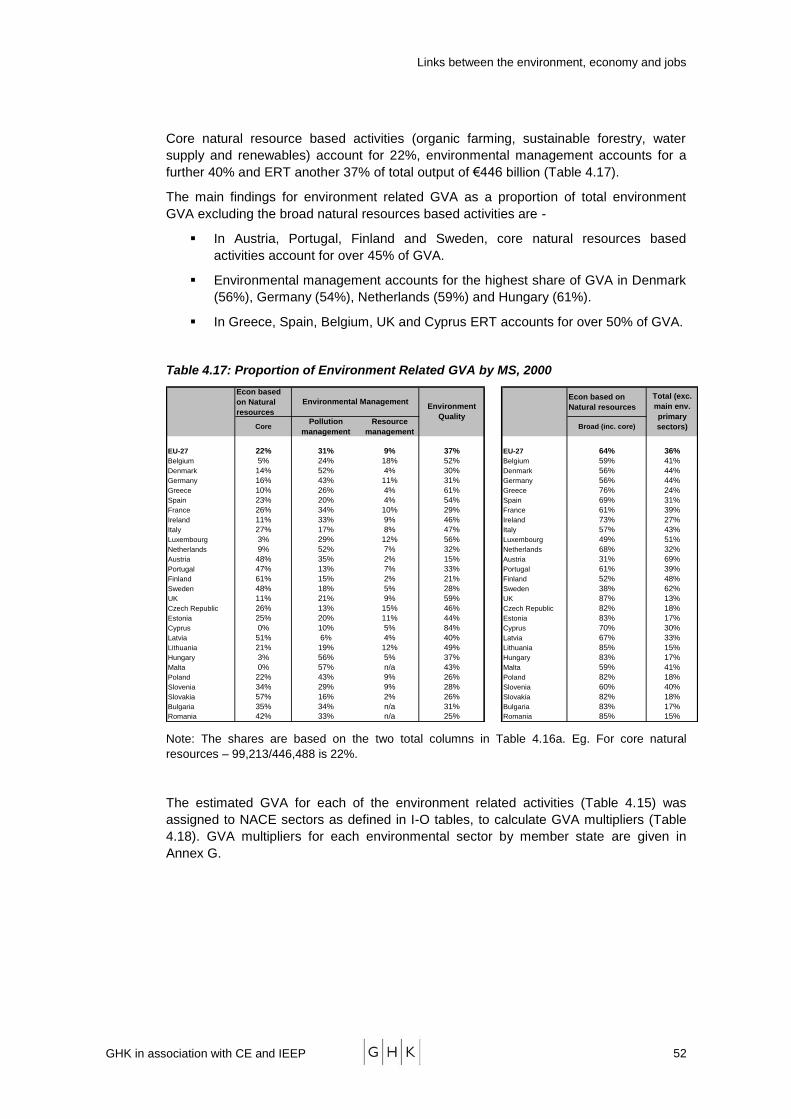
Links between the environment, economy and jobs
GHK in association with CE and IEEP 52
Core natural resource based activities (organic farming, sustainable forestry, water
supply and renewables) account for 22%, environmental management accounts for a
further 40% and ERT another 37% of total output of €446 billion (Table 4.17).
The main findings for environment related GVA as a proportion of total environment
GVA excluding the broad natural resources based activities are -
In Austria, Portugal, Finland and Sweden, core natural resources based
activities account for over 45% of GVA.
Environmental management accounts for the highest share of GVA in Denmark
(56%), Germany (54%), Netherlands (59%) and Hungary (61%).
In Greece, Spain, Belgium, UK and Cyprus ERT accounts for over 50% of GVA.
Table 4.17: Proportion of Environment Related GVA by MS, 2000
Econ based
on Natural
resources
Econ based on
Natural resources
CorePollution
management
Resource
managementBroad (inc. core)
EU-27 22% 31% 9% 37% EU-27 64% 36%
Belgium 5% 24% 18% 52% Belgium 59% 41%
Denmark 14% 52% 4% 30% Denmark 56% 44%
Germany 16% 43% 11% 31% Germany 56% 44%
Greece 10% 26% 4% 61% Greece 76% 24%
Spain 23% 20% 4% 54% Spain 69% 31%
France 26% 34% 10% 29% France 61% 39%
Ireland 11% 33% 9% 46% Ireland 73% 27%
Italy 27% 17% 8% 47% Italy 57% 43%
Luxembourg 3% 29% 12% 56% Luxembourg 49% 51%
Netherlands 9% 52% 7% 32% Netherlands 68% 32%
Austria 48% 35% 2% 15% Austria 31% 69%
Portugal 47% 13% 7% 33% Portugal 61% 39%
Finland 61% 15% 2% 21% Finland 52% 48%
Sweden 48% 18% 5% 28% Sweden 38% 62%
UK 11% 21% 9% 59% UK 87% 13%
Czech Republic 26% 13% 15% 46% Czech Republic 82% 18%
Estonia 25% 20% 11% 44% Estonia 83% 17%
Cyprus 0% 10% 5% 84% Cyprus 70% 30%
Latvia 51% 6% 4% 40% Latvia 67% 33%
Lithuania 21% 19% 12% 49% Lithuania 85% 15%
Hungary 3% 56% 5% 37% Hungary 83% 17%
Malta 0% 57% n/a 43% Malta 59% 41%
Poland 22% 43% 9% 26% Poland 82% 18%
Slovenia 34% 29% 9% 28% Slovenia 60% 40%
Slovakia 57% 16% 2% 26% Slovakia 82% 18%
Bulgaria 35% 34% n/a 31% Bulgaria 83% 17%
Romania 42% 33% n/a 25% Romania 85% 15%
Environmental ManagementEnvironment
Quality
Total (exc.
main env.
primary
sectors)
Note: The shares are based on the two total columns in Table 4.16a. Eg. For core natural
resources – 99,213/446,488 is 22%.
The estimated GVA for each of the environment related activities (Table 4.15) was
assigned to NACE sectors as defined in I-O tables, to calculate GVA multipliers (Table
4.18). GVA multipliers for each environmental sector by member state are given in
Annex G.
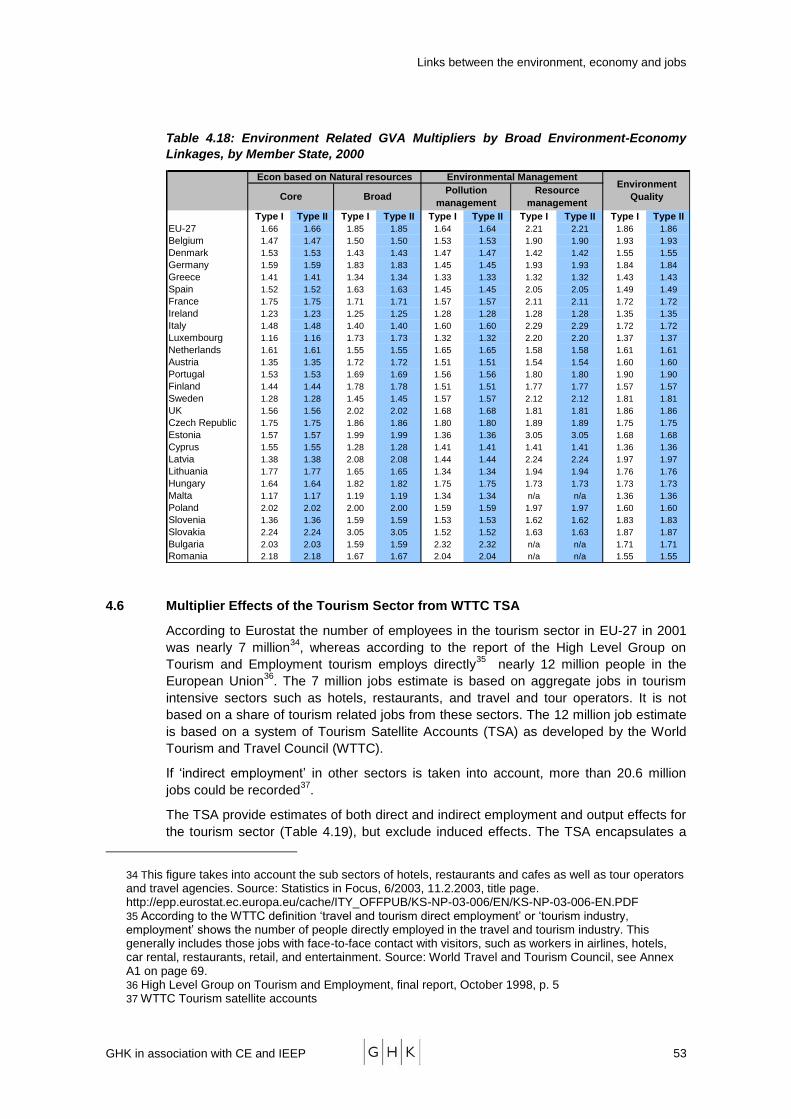
Links between the environment, economy and jobs
GHK in association with CE and IEEP 53
Table 4.18: Environment Related GVA Multipliers by Broad Environment-Economy
Linkages, by Member State, 2000
Type I Type II Type I Type II Type I Type II Type I Type II Type I Type II
EU-27 1.66 1.66 1.85 1.85 1.64 1.64 2.21 2.21 1.86 1.86
Belgium 1.47 1.47 1.50 1.50 1.53 1.53 1.90 1.90 1.93 1.93
Denmark 1.53 1.53 1.43 1.43 1.47 1.47 1.42 1.42 1.55 1.55
Germany 1.59 1.59 1.83 1.83 1.45 1.45 1.93 1.93 1.84 1.84
Greece 1.41 1.41 1.34 1.34 1.33 1.33 1.32 1.32 1.43 1.43
Spain 1.52 1.52 1.63 1.63 1.45 1.45 2.05 2.05 1.49 1.49
France 1.75 1.75 1.71 1.71 1.57 1.57 2.11 2.11 1.72 1.72
Ireland 1.23 1.23 1.25 1.25 1.28 1.28 1.28 1.28 1.35 1.35
Italy 1.48 1.48 1.40 1.40 1.60 1.60 2.29 2.29 1.72 1.72
Luxembourg 1.16 1.16 1.73 1.73 1.32 1.32 2.20 2.20 1.37 1.37
Netherlands 1.61 1.61 1.55 1.55 1.65 1.65 1.58 1.58 1.61 1.61
Austria 1.35 1.35 1.72 1.72 1.51 1.51 1.54 1.54 1.60 1.60
Portugal 1.53 1.53 1.69 1.69 1.56 1.56 1.80 1.80 1.90 1.90
Finland 1.44 1.44 1.78 1.78 1.51 1.51 1.77 1.77 1.57 1.57
Sweden 1.28 1.28 1.45 1.45 1.57 1.57 2.12 2.12 1.81 1.81
UK 1.56 1.56 2.02 2.02 1.68 1.68 1.81 1.81 1.86 1.86
Czech Republic 1.75 1.75 1.86 1.86 1.80 1.80 1.89 1.89 1.75 1.75
Estonia 1.57 1.57 1.99 1.99 1.36 1.36 3.05 3.05 1.68 1.68
Cyprus 1.55 1.55 1.28 1.28 1.41 1.41 1.41 1.41 1.36 1.36
Latvia 1.38 1.38 2.08 2.08 1.44 1.44 2.24 2.24 1.97 1.97
Lithuania 1.77 1.77 1.65 1.65 1.34 1.34 1.94 1.94 1.76 1.76
Hungary 1.64 1.64 1.82 1.82 1.75 1.75 1.73 1.73 1.73 1.73
Malta 1.17 1.17 1.19 1.19 1.34 1.34 n/a n/a 1.36 1.36
Poland 2.02 2.02 2.00 2.00 1.59 1.59 1.97 1.97 1.60 1.60
Slovenia 1.36 1.36 1.59 1.59 1.53 1.53 1.62 1.62 1.83 1.83
Slovakia 2.24 2.24 3.05 3.05 1.52 1.52 1.63 1.63 1.87 1.87
Bulgaria 2.03 2.03 1.59 1.59 2.32 2.32 n/a n/a 1.71 1.71
Romania 2.18 2.18 1.67 1.67 2.04 2.04 n/a n/a 1.55 1.55
Econ based on Natural resources Environmental ManagementEnvironment
QualityCore BroadPollution
management
Resource
management
4.6 Multiplier Effects of the Tourism Sector from WTTC TSA
According to Eurostat the number of employees in the tourism sector in EU-27 in 2001
was nearly 7 million34
, whereas according to the report of the High Level Group on
Tourism and Employment tourism employs directly35
nearly 12 million people in the
European Union36
. The 7 million jobs estimate is based on aggregate jobs in tourism
intensive sectors such as hotels, restaurants, and travel and tour operators. It is not
based on a share of tourism related jobs from these sectors. The 12 million job estimate
is based on a system of Tourism Satellite Accounts (TSA) as developed by the World
Tourism and Travel Council (WTTC).
If ‗indirect employment‘ in other sectors is taken into account, more than 20.6 million
jobs could be recorded37
.
The TSA provide estimates of both direct and indirect employment and output effects for
the tourism sector (Table 4.19), but exclude induced effects. The TSA encapsulates a
34 This figure takes into account the sub sectors of hotels, restaurants and cafes as well as tour operators and travel agencies. Source: Statistics in Focus, 6/2003, 11.2.2003, title page. http://epp.eurostat.ec.europa.eu/cache/ITY_OFFPUB/KS-NP-03-006/EN/KS-NP-03-006-EN.PDF 35 According to the WTTC definition ‗travel and tourism direct employment‘ or ‗tourism industry, employment‘ shows the number of people directly employed in the travel and tourism industry. This generally includes those jobs with face-to-face contact with visitors, such as workers in airlines, hotels, car rental, restaurants, retail, and entertainment. Source: World Travel and Tourism Council, see Annex A1 on page 69. 36 High Level Group on Tourism and Employment, final report, October 1998, p. 5
37 WTTC Tourism satellite accounts
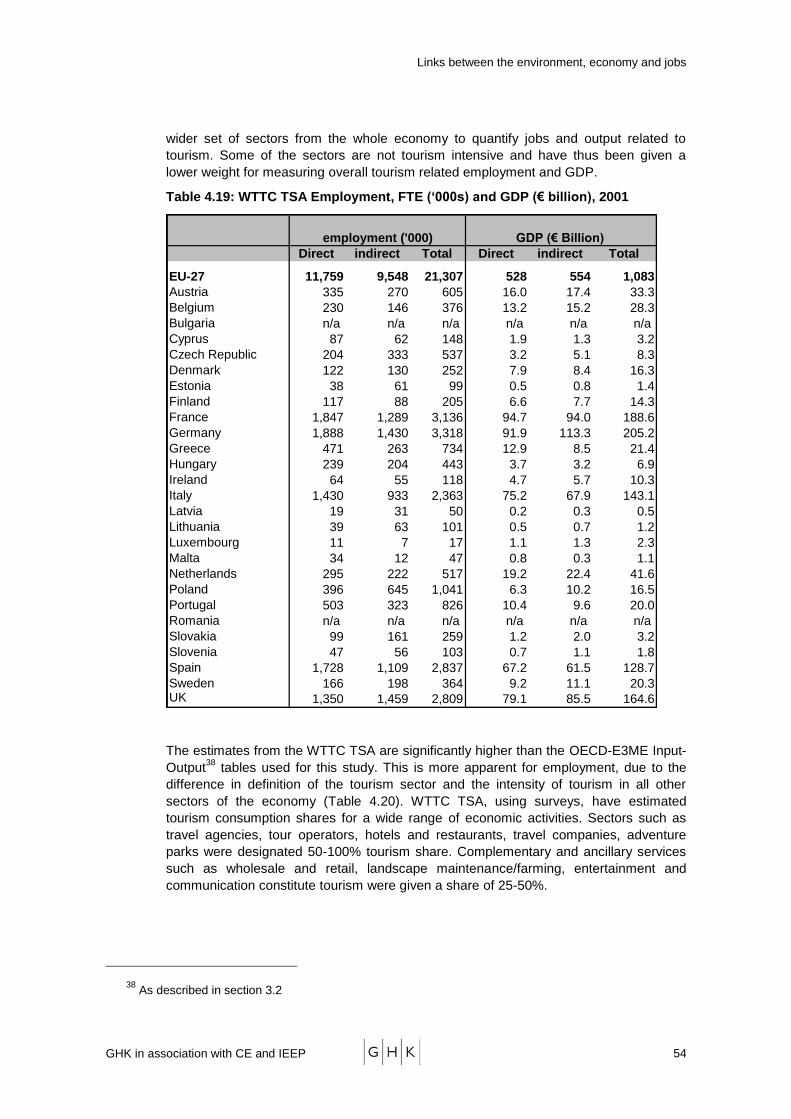
Links between the environment, economy and jobs
GHK in association with CE and IEEP 54
wider set of sectors from the whole economy to quantify jobs and output related to
tourism. Some of the sectors are not tourism intensive and have thus been given a
lower weight for measuring overall tourism related employment and GDP.
Table 4.19: WTTC TSA Employment, FTE (‘000s) and GDP (€ billion), 2001
Direct indirect Total Direct indirect Total
EU-27 11,759 9,548 21,307 528 554 1,083
Austria 335 270 605 16.0 17.4 33.3
Belgium 230 146 376 13.2 15.2 28.3
Bulgaria n/a n/a n/a n/a n/a n/a
Cyprus 87 62 148 1.9 1.3 3.2
Czech Republic 204 333 537 3.2 5.1 8.3
Denmark 122 130 252 7.9 8.4 16.3
Estonia 38 61 99 0.5 0.8 1.4
Finland 117 88 205 6.6 7.7 14.3
France 1,847 1,289 3,136 94.7 94.0 188.6
Germany 1,888 1,430 3,318 91.9 113.3 205.2
Greece 471 263 734 12.9 8.5 21.4
Hungary 239 204 443 3.7 3.2 6.9
Ireland 64 55 118 4.7 5.7 10.3
Italy 1,430 933 2,363 75.2 67.9 143.1
Latvia 19 31 50 0.2 0.3 0.5
Lithuania 39 63 101 0.5 0.7 1.2
Luxembourg 11 7 17 1.1 1.3 2.3
Malta 34 12 47 0.8 0.3 1.1
Netherlands 295 222 517 19.2 22.4 41.6
Poland 396 645 1,041 6.3 10.2 16.5
Portugal 503 323 826 10.4 9.6 20.0
Romania n/a n/a n/a n/a n/a n/a
Slovakia 99 161 259 1.2 2.0 3.2
Slovenia 47 56 103 0.7 1.1 1.8
Spain 1,728 1,109 2,837 67.2 61.5 128.7
Sweden 166 198 364 9.2 11.1 20.3UK 1,350 1,459 2,809 79.1 85.5 164.6
employment ('000) GDP (€ Billion)
The estimates from the WTTC TSA are significantly higher than the OECD-E3ME Input-
Output38
tables used for this study. This is more apparent for employment, due to the
difference in definition of the tourism sector and the intensity of tourism in all other
sectors of the economy (Table 4.20). WTTC TSA, using surveys, have estimated
tourism consumption shares for a wide range of economic activities. Sectors such as
travel agencies, tour operators, hotels and restaurants, travel companies, adventure
parks were designated 50-100% tourism share. Complementary and ancillary services
such as wholesale and retail, landscape maintenance/farming, entertainment and
communication constitute tourism were given a share of 25-50%.
38 As described in section 3.2
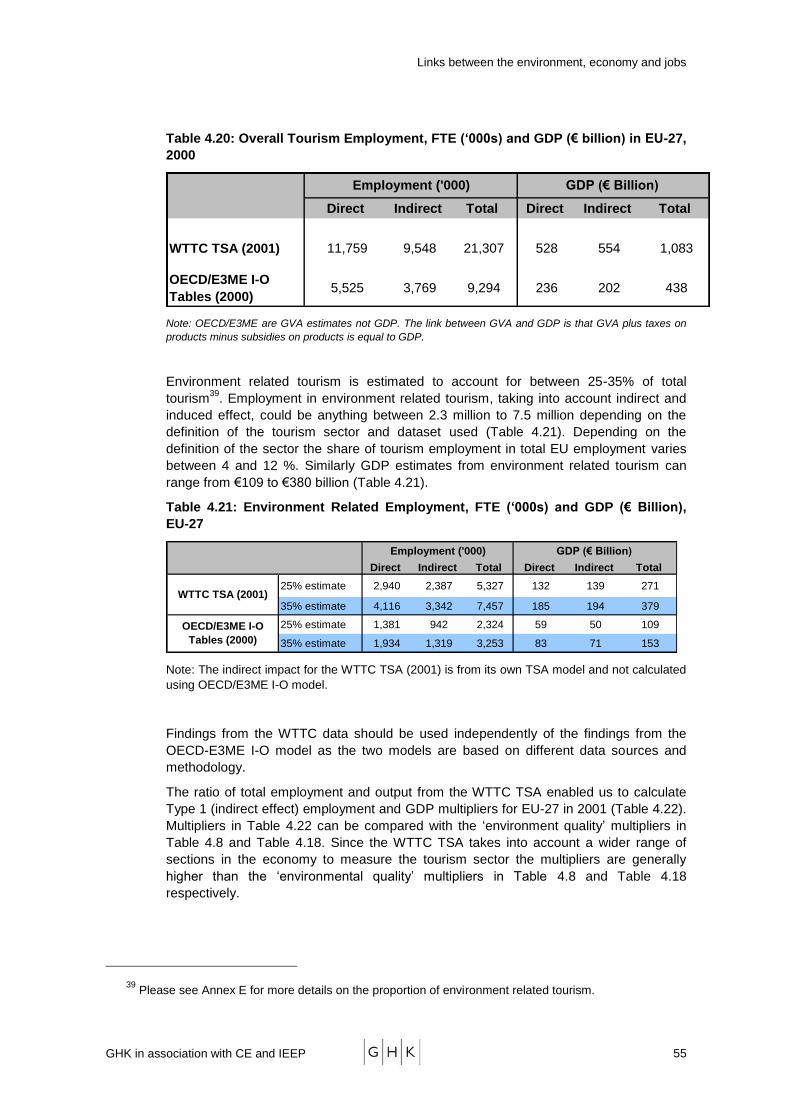
Links between the environment, economy and jobs
GHK in association with CE and IEEP 55
Table 4.20: Overall Tourism Employment, FTE (‘000s) and GDP (€ billion) in EU-27,
2000
Direct Indirect Total Direct Indirect Total
WTTC TSA (2001) 11,759 9,548 21,307 528 554 1,083
OECD/E3ME I-O
Tables (2000)5,525 3,769 9,294 236 202 438
Employment ('000) GDP (€ Billion)
Note: OECD/E3ME are GVA estimates not GDP. The link between GVA and GDP is that GVA plus taxes on
products minus subsidies on products is equal to GDP.
Environment related tourism is estimated to account for between 25-35% of total
tourism39
. Employment in environment related tourism, taking into account indirect and
induced effect, could be anything between 2.3 million to 7.5 million depending on the
definition of the tourism sector and dataset used (Table 4.21). Depending on the
definition of the sector the share of tourism employment in total EU employment varies
between 4 and 12 %. Similarly GDP estimates from environment related tourism can
range from €109 to €380 billion (Table 4.21).
Table 4.21: Environment Related Employment, FTE (‘000s) and GDP (€ Billion),
EU-27
Direct Indirect Total Direct Indirect Total
25% estimate 2,940 2,387 5,327 132 139 271
35% estimate 4,116 3,342 7,457 185 194 379
25% estimate 1,381 942 2,324 59 50 109
35% estimate 1,934 1,319 3,253 83 71 153
WTTC TSA (2001)
OECD/E3ME I-O
Tables (2000)
Employment ('000) GDP (€ Billion)
Note: The indirect impact for the WTTC TSA (2001) is from its own TSA model and not calculated
using OECD/E3ME I-O model.
Findings from the WTTC data should be used independently of the findings from the
OECD-E3ME I-O model as the two models are based on different data sources and
methodology.
The ratio of total employment and output from the WTTC TSA enabled us to calculate
Type 1 (indirect effect) employment and GDP multipliers for EU-27 in 2001 (Table 4.22).
Multipliers in Table 4.22 can be compared with the ‗environment quality‘ multipliers in
Table 4.8 and Table 4.18. Since the WTTC TSA takes into account a wider range of
sections in the economy to measure the tourism sector the multipliers are generally
higher than the ‗environmental quality‘ multipliers in Table 4.8 and Table 4.18
respectively.
39 Please see Annex E for more details on the proportion of environment related tourism.

Links between the environment, economy and jobs
GHK in association with CE and IEEP 56
The employment multiplier effect for EU-27 in Table 4.22 suggests that on average
every 100 FTE jobs in environment related tourism supports another 81 jobs elsewhere
in the EU-27.
Table 4.22 Employment and GDP multipliers (Type I only) from WTTC TSA, 2001
Employment
multiplier
GDP
multiplier
EU-27 1.81 2.05
Austria 1.81 2.09
Belgium 1.64 2.15
Bulgaria n/a n/a
Cyprus 1.71 1.71
Czech Republic 2.63 2.63
Denmark 2.06 2.06
Estonia 2.63 2.61
Finland 1.75 2.17
France 1.70 1.99
Germany 1.76 2.23
Greece 1.56 1.65
Hungary 1.86 1.86
Ireland 1.85 2.22
Italy 1.65 1.90
Latvia 2.63 2.63
Lithuania 2.63 2.63
Luxembourg 1.59 2.20
Malta 1.36 1.36
Netherlands 1.75 2.17
Poland 2.63 2.63
Portugal 1.64 1.92
Romania n/a n/a
Slovakia 2.63 2.63
Slovenia 2.20 2.63
Spain 1.64 1.91
Sweden 2.20 2.20UK 2.08 2.08
Links between the environment, economy and jobs
GHK in association with CE and IEEP 57
PART C: ECONOMIC IMPACTS OF SELECTED POLICY SCENARIOS
Links between the environment, economy and jobs
GHK in association with CE and IEEP 58
5 INTRODUCTION, APPROACH AND POLICY SCENARIOS
5.1 Background
Economic activity is influenced by, and influences, the environment through the use of,
and impact on, environmental resources in both quantitative and qualitative ways. The
two-way economy-environment linkage means that an efficient economy requires an
efficient use of environmental resources (such that resources are used up to the point
where the marginal social costs approximate to the marginal social benefits from their
use). However, because the environment is often a public good establishing the social
costs and benefits is very difficult. By most common consent, current and previous
levels of resource use have exceeded their marginal social costs – environmental
policy is therefore seeking to reduce the use of environmental resources compared to
previous levels. Environmental policy has therefore a direct economic efficiency gain,
although often the only effects that can be quantified are direct economic impacts
associated with a given policy intervention. Of course any particular intervention may
be inefficient having marginal costs in excess of marginal benefits, and the role of
impact assessment is to establish on a case by case basis that measures are
economically efficient.
This study has sought to better define and describe economy - environment linkages,
and in particular to quantify the direct and indirect economic impacts of environmental
policy interventions. This has been defined in aggregate terms with reference to
spending on the use of resources and environmental management. However, to assist
policy makers to understand the marginal direct and indirect impacts of policy the study
has also investigated the economic impacts of specific interventions. These
interventions have, for the purposes of analysis been described in the form of simple
scenarios describing the nature of the intervention. These scenarios have been used to
examine their marginal economic impacts using the input-output tables also used for
the aggregate analysis. The results provide an illustration of a specific economy –
environment linkage. They also provide the basis of a simple ‗rule of thumb‘ calculation
for policy makers when scoping out possible actions (mindful that depending on the
nature or scale of intervention that non-marginal changes are possible). The analysis is
clearly not intended to provide a detailed policy impact assessment.
The scenario analysis shows the impact on the economy of a specified policy
intervention which changes the nature and/or costs of inputs (such as higher fuel costs
or changes in current technology) to a sector (or group of sectors) and the subsequent
impacts on the economy in terms of output and employment attributable to the
intervention. The aim is to demonstrate the economic impact of the change towards a
more sustainable mix of inputs, directly on the firms subject to the intervention, and
indirectly on the economy as a whole.
Of course any intervention will have some impact compared to a ‗steady state‘ situation
where there is no additional intervention, since it implies, at the margin, a reallocation
of resources from those sectors and actors financing the intervention and facing costs
to those sectors and actors who benefit from the intervention. The scenario analysis
therefore helps to understand the structural change in the economy due to policy
drivers. For example, the change in the economy attributed to a 1% increase in energy
efficiency of the manufacturing sector as a result of policy measures. The impacts can
therefore be defined in both gross terms (ignoring the ‗do nothing‘) and net terms
(taking into account the impact were the costs of the intervention to be otherwise

Links between the environment, economy and jobs
GHK in association with CE and IEEP 59
invested in the status quo, i.e. the counterfactual). For example an intervention that
leads to an investment of €1 Million in new energy efficiency technology might be
assumed to have otherwise been invested in technology with higher capital returns as
indicated by current investment patterns.
In a closed domestic economy with no leakages (no taxes, exogenous injections (such
as public investment) and trading) any change in activity (shown by an increase in
output and prices) in one sector will not lead to any overall change in value added of
the whole economy, but it will lead to a change in per sector output, wages,
employment and profits. However, in an open economy, with trade, investment and
taxes, the impacts of a policy intervention will impact on overall output according to
sector productivity and export/import propensities, as well as sectoral output. By
definition a positive impact on output is correlated with a positive impact on GDP
and/or GVA.
5.2 Calculation of Quantity Effects
The quantity effect attempts to model the substitution of inputs from one sector for
another. The policies are designed assuming that the sectors substituting provide less
environmental intensive inputs (e.g. Recycled material sector for virgin material).
The quantity substitution effect is estimated within the Input-Output (I-O) analysis by
changing the appropriate I-O coefficients according to each scenario. The new I-O
table is then used to calculate multipliers (both output and employment), giving results
that are directly comparable to the baseline scenario. The impact on output and
employment is based on type II multipliers, which account for both direct and indirect
effects of changes or shocks to the I-O table40
. Employment estimates are based on
full-time equivalent (FTE).
The estimated impact of the policy scenarios is given as an absolute impact in millions
of euros. The reason for this is that the behavioural changes caused by the policy will
have immediate impacts on output. The output estimate is used to estimate
employment levels using employment-output ratios from the CE E3ME model41
. These
changes are entered as shocks and the indirect effects are subsequently calculated
based on sector multipliers.
The methodology is shown in Figure 5.1, where a sector substitutes inputs from one
sector for the other. This change is incorporated in the I-O table in the Sector C column
by lowering the coefficient for Sector C by X% and increasing the coefficient of sector
B by the same amount. This calculation assumes that sector B inputs cost the same as
Sector C, leaving costs unchanged, but with indirect effects on the rest of the economy
caused by the substitution.
40 Described in detail in Section 3.2.
41 As described in section 3.
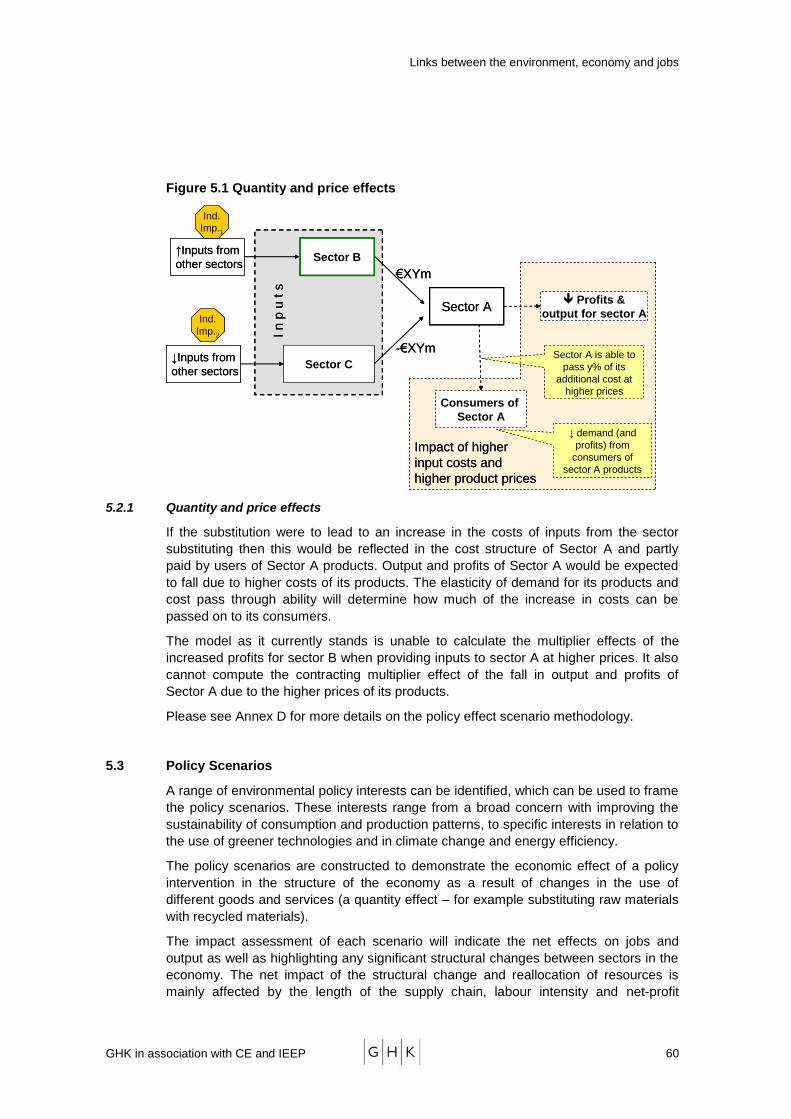
Links between the environment, economy and jobs
GHK in association with CE and IEEP 60
Figure 5.1 Quantity and price effects
Sector A
Sector B
Sector C
I n p
u t
s
↑Inputs from
other sectors
-€XYm
€XYm
Consumers of
Sector A
Sector A is able to
pass y% of its
additional cost at
higher prices
Profits &
output for sector A
↓ demand (and
profits) from
consumers of
sector A products
↓Inputs from
other sectors
Ind.
Imp.1
Ind.
Imp.2
Impact of higher
input costs and
higher product prices
Sector A
Sector B
Sector C
I n p
u t
s
↑Inputs from
other sectors
-€XYm
€XYm
Consumers of
Sector A
Sector A is able to
pass y% of its
additional cost at
higher prices
Profits &
output for sector A
↓ demand (and
profits) from
consumers of
sector A products
↓Inputs from
other sectors
Ind.
Imp.1
Ind.
Imp.2
Impact of higher
input costs and
higher product prices
5.2.1 Quantity and price effects
If the substitution were to lead to an increase in the costs of inputs from the sector
substituting then this would be reflected in the cost structure of Sector A and partly
paid by users of Sector A products. Output and profits of Sector A would be expected
to fall due to higher costs of its products. The elasticity of demand for its products and
cost pass through ability will determine how much of the increase in costs can be
passed on to its consumers.
The model as it currently stands is unable to calculate the multiplier effects of the
increased profits for sector B when providing inputs to sector A at higher prices. It also
cannot compute the contracting multiplier effect of the fall in output and profits of
Sector A due to the higher prices of its products.
Please see Annex D for more details on the policy effect scenario methodology.
5.3 Policy Scenarios
A range of environmental policy interests can be identified, which can be used to frame
the policy scenarios. These interests range from a broad concern with improving the
sustainability of consumption and production patterns, to specific interests in relation to
the use of greener technologies and in climate change and energy efficiency.
The policy scenarios are constructed to demonstrate the economic effect of a policy
intervention in the structure of the economy as a result of changes in the use of
different goods and services (a quantity effect – for example substituting raw materials
with recycled materials).
The impact assessment of each scenario will indicate the net effects on jobs and
output as well as highlighting any significant structural changes between sectors in the
economy. The net impact of the structural change and reallocation of resources is
mainly affected by the length of the supply chain, labour intensity and net-profit
Links between the environment, economy and jobs
GHK in association with CE and IEEP 61
margins. Switching to inputs from a sector with higher labour intensity and a longer
supply chain would thus have a positive impact on the economy. Increased spending
attributed to new jobs would lead to additional output thus creating a ripple effect in the
economy. A smaller supply chain on the other hand has less leakage in profits and
taxes, resulting in a lower multiplier effect.
5.3.1 Sustainable Consumption and Production
Three scenarios have been described:
Scenario 1: Steel production with increased substitution of recycled materials
Scenario 2: Agricultural production with an increase in output from the organic
sector
Scenario 3: Reducing water consumption
5.3.2 Environmental Technology – ETAP
Two scenarios have been described.
Scenario 4a: Increased energy efficiency in the manufacturing sector due to
increased use of more efficient production technologies
Scenario 4b: Increased energy efficiency in the Energy Intensive Industries42
(subset of Manufacturing)
Scenario 5: Increase in bio-fuels in transport
5.3.3 Climate Change
Two scenarios have been described.
Scenario 6: Increase in electricity generation from renewable energy
technologies
Scenario 7: Reducing the carbon intensity of all sectors of the economy
5.3.4 Structural Funds
Scenario 8: Increased use of Structural Funds for environmental infrastructure
The following sectors from the E3ME-OECD Input-output model have been used for
the policy scenarios. The sectors in the policy scenarios are referenced using the I-O
classification as given in the table below.
42 Manufacture of pulp, paper and paper products; publishing and printing (DE), Manufacture of
chemicals, chemical products and man-made fibres (DG), Manufacture of rubber and plastic products (DH), Manufacture of other non-metallic mineral products (includes cements and lime, glass) (DI), Manufacture of basic metals and fabricated metal products (includes ferro-alloys, steel and non-ferrous metals) (DJ).
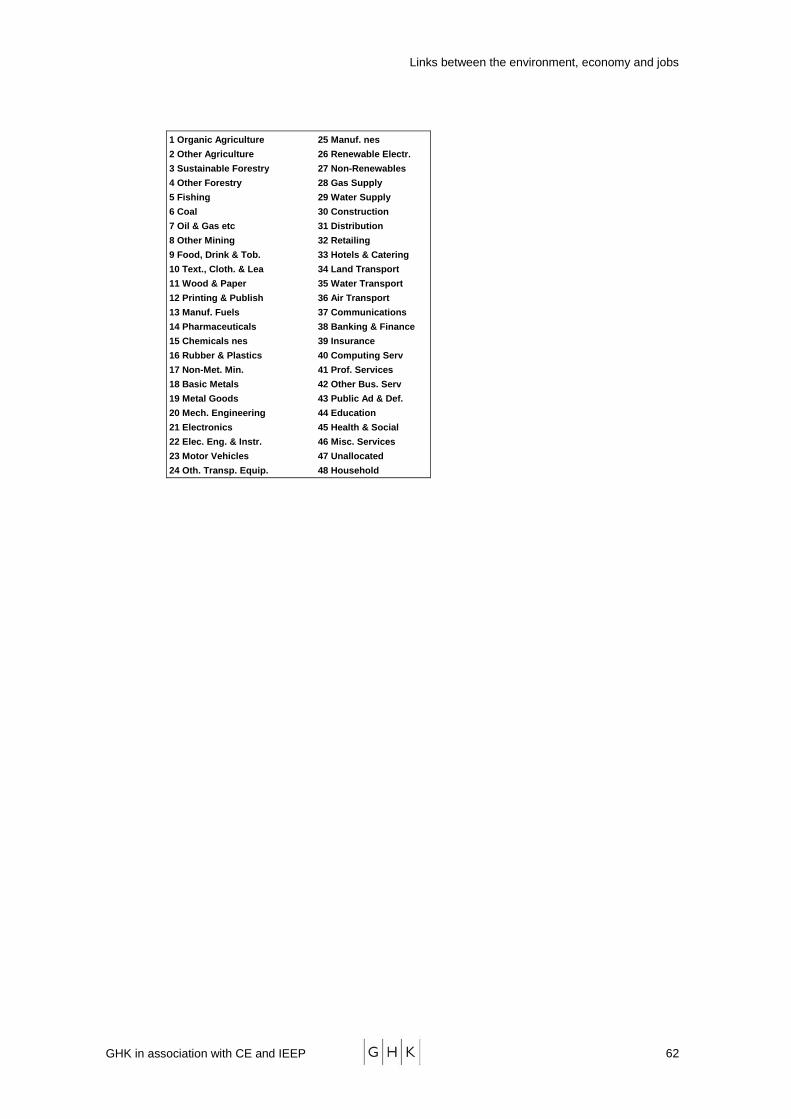
Links between the environment, economy and jobs
GHK in association with CE and IEEP 62
1 Organic Agriculture 25 Manuf. nes
2 Other Agriculture 26 Renewable Electr.
3 Sustainable Forestry 27 Non-Renewables
4 Other Forestry 28 Gas Supply
5 Fishing 29 Water Supply
6 Coal 30 Construction
7 Oil & Gas etc 31 Distribution
8 Other Mining 32 Retailing
9 Food, Drink & Tob. 33 Hotels & Catering
10 Text., Cloth. & Lea 34 Land Transport
11 Wood & Paper 35 Water Transport
12 Printing & Publish 36 Air Transport
13 Manuf. Fuels 37 Communications
14 Pharmaceuticals 38 Banking & Finance
15 Chemicals nes 39 Insurance
16 Rubber & Plastics 40 Computing Serv
17 Non-Met. Min. 41 Prof. Services
18 Basic Metals 42 Other Bus. Serv
19 Metal Goods 43 Public Ad & Def.
20 Mech. Engineering 44 Education
21 Electronics 45 Health & Social
22 Elec. Eng. & Instr. 46 Misc. Services
23 Motor Vehicles 47 Unallocated
24 Oth. Transp. Equip. 48 Household
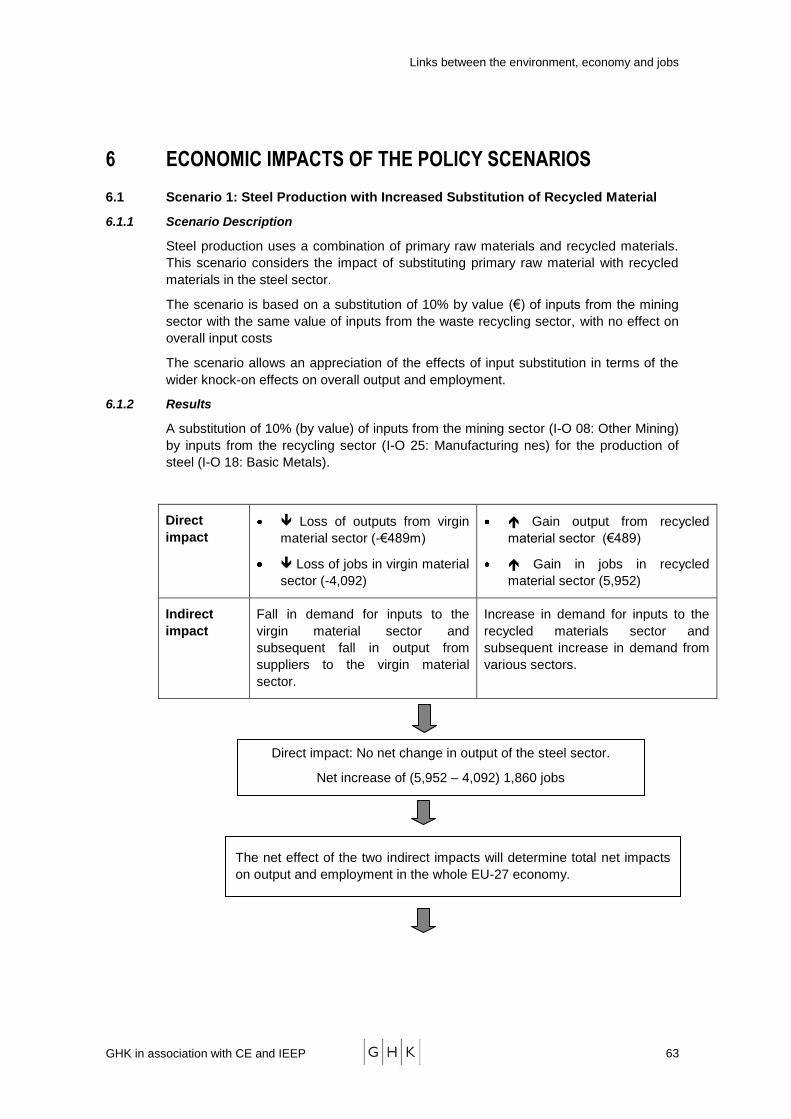
Links between the environment, economy and jobs
GHK in association with CE and IEEP 63
6 ECONOMIC IMPACTS OF THE POLICY SCENARIOS
6.1 Scenario 1: Steel Production with Increased Substitution of Recycled Material
6.1.1 Scenario Description
Steel production uses a combination of primary raw materials and recycled materials.
This scenario considers the impact of substituting primary raw material with recycled
materials in the steel sector.
The scenario is based on a substitution of 10% by value (€) of inputs from the mining
sector with the same value of inputs from the waste recycling sector, with no effect on
overall input costs
The scenario allows an appreciation of the effects of input substitution in terms of the
wider knock-on effects on overall output and employment.
6.1.2 Results
A substitution of 10% (by value) of inputs from the mining sector (I-O 08: Other Mining)
by inputs from the recycling sector (I-O 25: Manufacturing nes) for the production of
steel (I-O 18: Basic Metals).
Direct
impact
Loss of outputs from virgin
material sector (-€489m)
Loss of jobs in virgin material
sector (-4,092)
Gain output from recycled
material sector (€489)
Gain in jobs in recycled
material sector (5,952)
Indirect
impact
Fall in demand for inputs to the
virgin material sector and
subsequent fall in output from
suppliers to the virgin material
sector.
Increase in demand for inputs to the
recycled materials sector and
subsequent increase in demand from
various sectors.
Direct impact: No net change in output of the steel sector.
Net increase of (5,952 – 4,092) 1,860 jobs
The net effect of the two indirect impacts will determine total net impacts
on output and employment in the whole EU-27 economy.
Links between the environment, economy and jobs
GHK in association with CE and IEEP 64
Indirect Impacts Output (€m) Jobs (FTE)
Increase in demand of the recycled materials sector
inputs of €489m 280 2,534
Reduction in demand of virgin material sector inputs
of €489m -83 -753
Net Indirect Impact 197 1,781
Summary Results
The initial direct impact is neutral as the reduction in output from one sector is met by
an increase in output from another sector. However, the net indirect (including induced)
impact of this substitution leads to an increase in output of nearly €197m and an extra
1,781 jobs. Adding the direct and indirect effects indicates that this substitution would
add €197m of output and 3,641 (1,860 direct and 1,781 indirect) jobs. The net positive
impact on jobs and output is mainly due to the supply chain effect of the recycled
materials sector. The recycled materials sector uses inputs from many other sectors
thus creating more jobs and wealth. The mining sector has high profit margins and
fewer inputs from other sectors, which leads to smaller net indirect effect on jobs and
output.
If the substitution were to lead to an increase in the costs to the steel sector because of
inputs from recycled materials sector cost more than virgin materials then this would be
reflected in the cost of steel and paid by users of steel. Output and profits of the steel
sector would be expected to fall due to higher costs of steel products. The elasticity of
demand for steel and cost pass through ability of the steel sectors will determine how
much of the increase in costs can be passed on to its consumers. According to
estimated parameters from the E3ME model, the steel sector is able to pass on 45% of
its unit costs to its customers and would have to absorb the rest as reduced profits.
6.2 Scenario 2: Agricultural Production with an Increase in Output from the Organic
Sector
6.2.1 Scenario description
There is an increasing demand for products from the organic farming sector. The
sector has different inputs compared to conventional agriculture, and the change in
demand will have wider economic impacts, e.g. less demand for pesticides and
Overall change in:
Output €m
Jobs
Net direct impact 0 1,860
Net indirect impact 197 1,781
Total impact 197 3,641
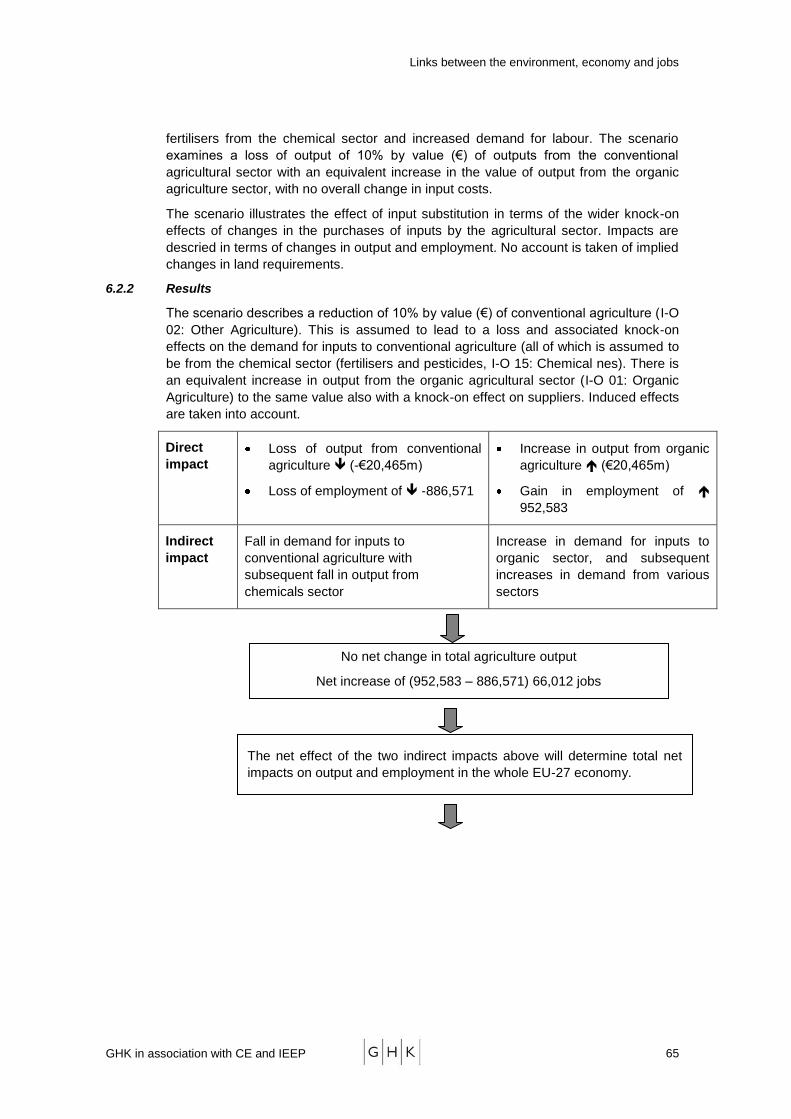
Links between the environment, economy and jobs
GHK in association with CE and IEEP 65
fertilisers from the chemical sector and increased demand for labour. The scenario
examines a loss of output of 10% by value (€) of outputs from the conventional
agricultural sector with an equivalent increase in the value of output from the organic
agriculture sector, with no overall change in input costs.
The scenario illustrates the effect of input substitution in terms of the wider knock-on
effects of changes in the purchases of inputs by the agricultural sector. Impacts are
descried in terms of changes in output and employment. No account is taken of implied
changes in land requirements.
6.2.2 Results
The scenario describes a reduction of 10% by value (€) of conventional agriculture (I-O
02: Other Agriculture). This is assumed to lead to a loss and associated knock-on
effects on the demand for inputs to conventional agriculture (all of which is assumed to
be from the chemical sector (fertilisers and pesticides, I-O 15: Chemical nes). There is
an equivalent increase in output from the organic agricultural sector (I-O 01: Organic
Agriculture) to the same value also with a knock-on effect on suppliers. Induced effects
are taken into account.
Direct
impact
Loss of output from conventional
agriculture (-€20,465m)
Loss of employment of -886,571
Increase in output from organic
agriculture (€20,465m)
Gain in employment of
952,583
Indirect
impact
Fall in demand for inputs to
conventional agriculture with
subsequent fall in output from
chemicals sector
Increase in demand for inputs to
organic sector, and subsequent
increases in demand from various
sectors
No net change in total agriculture output
Net increase of (952,583 – 886,571) 66,012 jobs
The net effect of the two indirect impacts above will determine total net
impacts on output and employment in the whole EU-27 economy.

Links between the environment, economy and jobs
GHK in association with CE and IEEP 66
Indirect Impacts Output (€m) Jobs ‘000s
(FTE)
Increase in demand of the organic sector inputs of
€20,465m 2,341 14,116
Reduction in demand of conventional agriculture
inputs of -€20,465m -1,787 -36,294
Net Indirect Impact 554 -22,178
Summary of results
The initial direct impact is neutral as the reduction in output from one sector is met by
an increase in output from another sector. However, the net indirect impact of this
substitution leads to an increase in output of nearly €554m but a loss of 22,178 jobs.
The sum of the direct and indirect impacts is an extra €554m of output and 43,834
(66,012 direct less 22,718 indirect) jobs43
. The net positive effect is mainly due to the
direct increase in employment from the shift to organic agriculture which is more
labour-intensive. This causes an increase in output through, the induced effect, the
wage related spending from the direct jobs. If the effects of additional spending are
ignored (ie type-I multiplier) output falls, mainly due to the lower output in the
chemicals sector.
Input costs are generally higher for organic farming compared to conventional farming.
This is mainly due to higher prices for organically produced inputs (e.g. Foodstuffs,
seeds, etc). Some fixed costs, such as wages and salaries are higher. Purchase of
alternative machinery (eg. mechanical weed control and tillage) also leads to higher
costs. Stricter rules on livestock housing are likely to increase depreciation figures for
buildings. Additional investments may be necessary for processing and marketing
activities. Overall organic farming is expected to enjoy lesser economics of scale due
to lower yields (tonnes per hectare) compared to conventional farming.
If prices of organic inputs were higher than conventional agriculture then this would
reflect in the cost structure of industries like the Food, Drink and Tobacco (FDT) which
use inputs from the organic sector. However, the FDT sector, according to estimated
43 To take account of the lack of data on organic farming in the EU12, the scenario uses employment-
output ratios taken from EU15.
Overall change in:
Output €m
jobs
Net direct impact 0 66,012
Net indirect impact 554 -22,178
Total impact 554 43,834
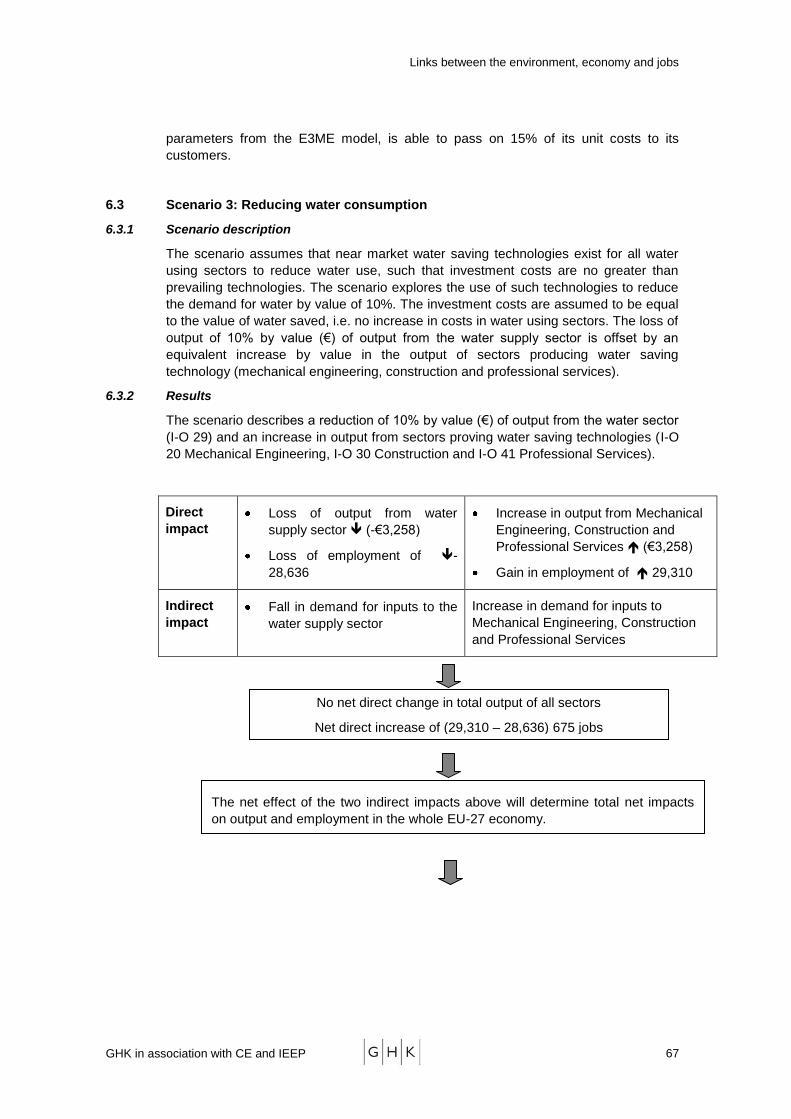
Links between the environment, economy and jobs
GHK in association with CE and IEEP 67
parameters from the E3ME model, is able to pass on 15% of its unit costs to its
customers.
6.3 Scenario 3: Reducing water consumption
6.3.1 Scenario description
The scenario assumes that near market water saving technologies exist for all water
using sectors to reduce water use, such that investment costs are no greater than
prevailing technologies. The scenario explores the use of such technologies to reduce
the demand for water by value of 10%. The investment costs are assumed to be equal
to the value of water saved, i.e. no increase in costs in water using sectors. The loss of
output of 10% by value (€) of output from the water supply sector is offset by an
equivalent increase by value in the output of sectors producing water saving
technology (mechanical engineering, construction and professional services).
6.3.2 Results
The scenario describes a reduction of 10% by value (€) of output from the water sector
(I-O 29) and an increase in output from sectors proving water saving technologies (I-O
20 Mechanical Engineering, I-O 30 Construction and I-O 41 Professional Services).
Direct
impact
Loss of output from water
supply sector (-€3,258)
Loss of employment of -
28,636
Increase in output from Mechanical
Engineering, Construction and
Professional Services (€3,258)
Gain in employment of 29,310
Indirect
impact
Fall in demand for inputs to the
water supply sector
Increase in demand for inputs to
Mechanical Engineering, Construction
and Professional Services
No net direct change in total output of all sectors
Net direct increase of (29,310 – 28,636) 675 jobs
The net effect of the two indirect impacts above will determine total net impacts
on output and employment in the whole EU-27 economy.
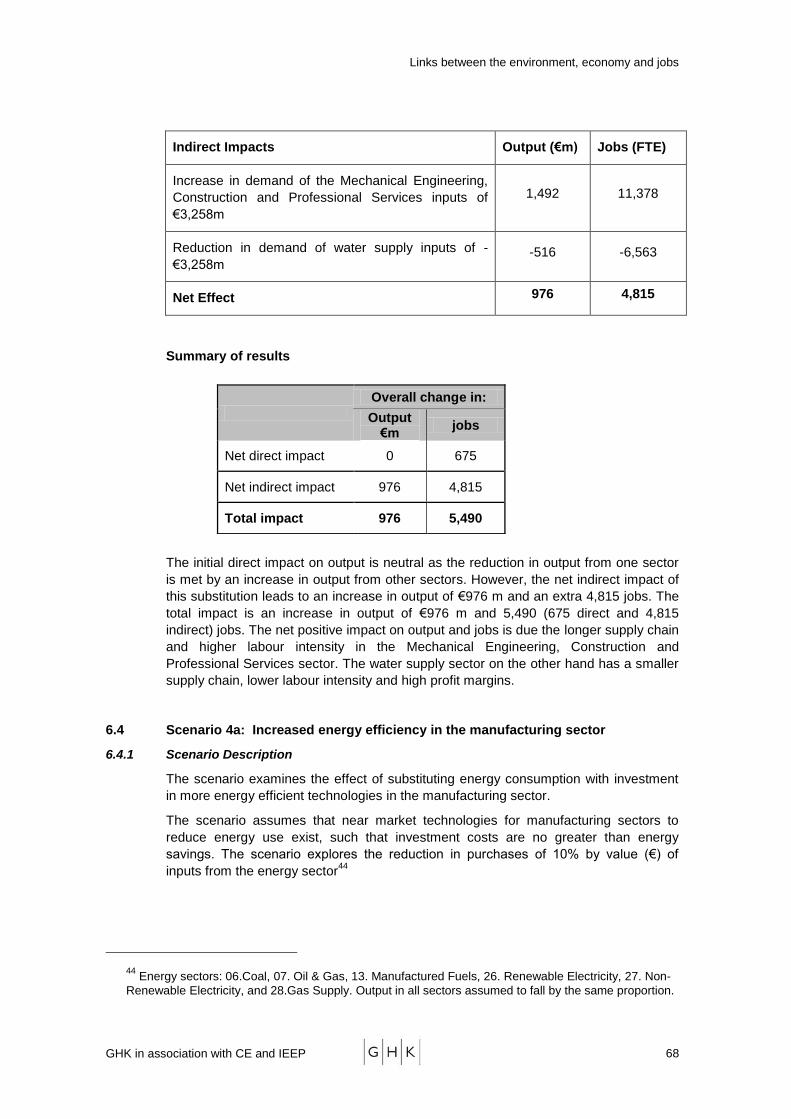
Links between the environment, economy and jobs
GHK in association with CE and IEEP 68
Indirect Impacts Output (€m) Jobs (FTE)
Increase in demand of the Mechanical Engineering,
Construction and Professional Services inputs of
€3,258m
1,492 11,378
Reduction in demand of water supply inputs of -
€3,258m -516 -6,563
Net Effect 976 4,815
Summary of results
The initial direct impact on output is neutral as the reduction in output from one sector
is met by an increase in output from other sectors. However, the net indirect impact of
this substitution leads to an increase in output of €976 m and an extra 4,815 jobs. The
total impact is an increase in output of €976 m and 5,490 (675 direct and 4,815
indirect) jobs. The net positive impact on output and jobs is due the longer supply chain
and higher labour intensity in the Mechanical Engineering, Construction and
Professional Services sector. The water supply sector on the other hand has a smaller
supply chain, lower labour intensity and high profit margins.
6.4 Scenario 4a: Increased energy efficiency in the manufacturing sector
6.4.1 Scenario Description
The scenario examines the effect of substituting energy consumption with investment
in more energy efficient technologies in the manufacturing sector.
The scenario assumes that near market technologies for manufacturing sectors to
reduce energy use exist, such that investment costs are no greater than energy
savings. The scenario explores the reduction in purchases of 10% by value (€) of
inputs from the energy sector44
44 Energy sectors: 06.Coal, 07. Oil & Gas, 13. Manufactured Fuels, 26. Renewable Electricity, 27. Non-
Renewable Electricity, and 28.Gas Supply. Output in all sectors assumed to fall by the same proportion.
Overall change in:
Output €m
jobs
Net direct impact 0 675
Net indirect impact 976 4,815
Total impact 976 5,490
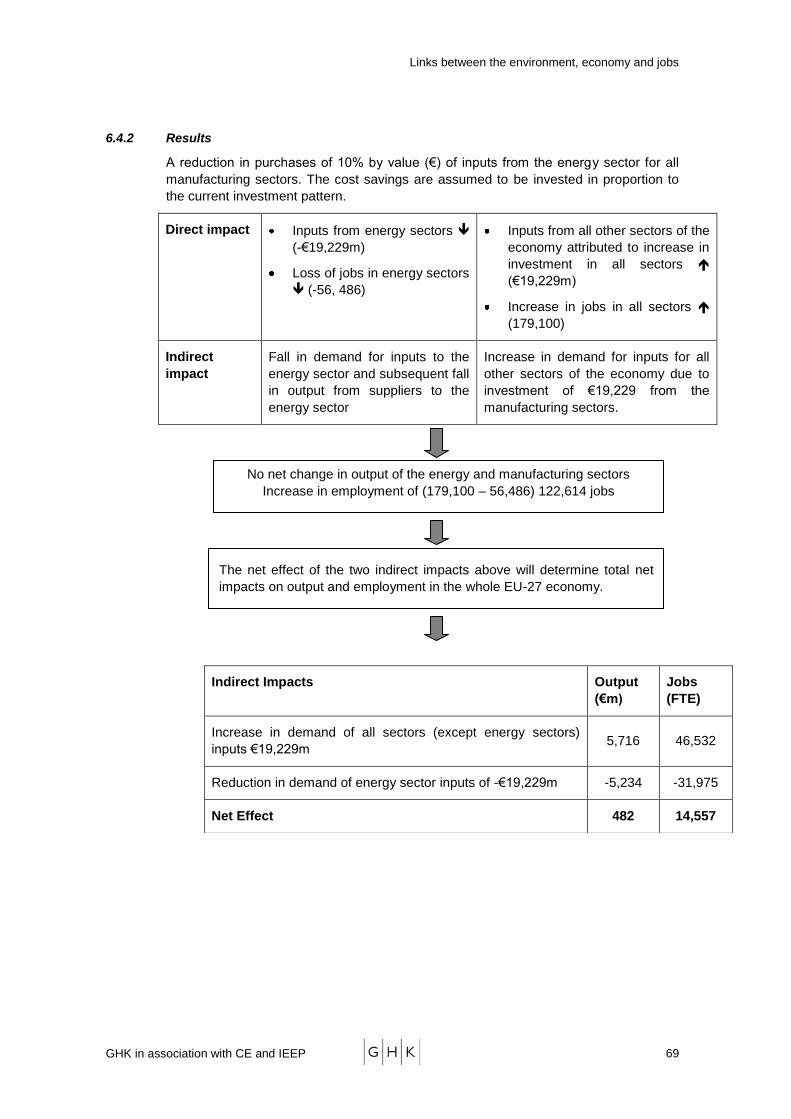
Links between the environment, economy and jobs
GHK in association with CE and IEEP 69
6.4.2 Results
A reduction in purchases of 10% by value (€) of inputs from the energy sector for all
manufacturing sectors. The cost savings are assumed to be invested in proportion to
the current investment pattern.
Direct impact Inputs from energy sectors
(-€19,229m)
Loss of jobs in energy sectors
(-56, 486)
Inputs from all other sectors of the
economy attributed to increase in
investment in all sectors
(€19,229m)
Increase in jobs in all sectors
(179,100)
Indirect
impact
Fall in demand for inputs to the
energy sector and subsequent fall
in output from suppliers to the
energy sector
Increase in demand for inputs for all
other sectors of the economy due to
investment of €19,229 from the
manufacturing sectors.
Indirect Impacts Output
(€m)
Jobs
(FTE)
Increase in demand of all sectors (except energy sectors)
inputs €19,229m 5,716 46,532
Reduction in demand of energy sector inputs of -€19,229m -5,234 -31,975
Net Effect 482 14,557
No net change in output of the energy and manufacturing sectors
Increase in employment of (179,100 – 56,486) 122,614 jobs
The net effect of the two indirect impacts above will determine total net
impacts on output and employment in the whole EU-27 economy.

Links between the environment, economy and jobs
GHK in association with CE and IEEP 70
Summary of results
A reduction in energy inputs to the manufacturing sector invested in proportion to
current investment patterns leads to a net increase in output of nearly €482m with a
gain of 137,171 jobs. The large positive employment impact is mainly because the
energy sectors are less labour intensive with low employment-output ratios. Like the
water supply sector, the energy sector also has a small supply chain. The
manufacturing sectors producing the energy efficient technologies use inputs from a
number of other sectors. This leads to a higher multiplier effect for both jobs and
output.
6.5 Scenario 4b: Increased energy efficiency in the manufacturing sector
6.5.1 Scenario description
This scenario examines the impact of the take-up of energy efficiency and low carbon
investment technologies by Energy Intensive Industries45
(EIIs). This scenario
assumes that investment costs for new technologies are greater than the conventional
technologies.
Quantity and price effect – a reduction by value (€) of inputs from the energy sector
with the cost savings assumed to finance higher investment costs. In addition the
scenario assumes a further 10% increase in these investment costs, financed by
higher prices and reduced profits in the EIIs.
This scenario attempts to capture the effects of input substitution in terms of wider
knock on effects of a shift in production inputs from the energy sector to the
manufacturing sector (purchase of energy efficient capital equipment). The impact of
the additional 10% increase in investment provides a de minimis positive effect, which
the negative effects of the higher prices must exceed for there to be a net overall
decrease in EU output.
The results from Scenario 4b are not directly comparable to the quantity effect in
Scenario 4a because Scenario 4a assumes energy efficiency in all the manufacturing
sectors while Scenario 4b assumes energy efficiency in the energy-intensive
manufacturing sectors.
45 11: Wood and Paper, 12: Printing and Publishing, 14: Pharmaceuticals, 15: Chemicals nes, 16:
Rubber and Plastics, 17:Non-Metallic Minerals Product, 18: Basic Metals, and 19: Metal Goods
Overall change in:
Output €m
jobs
Net direct impact 0 122,164
Net indirect impact 482 14,557
Total effect 482 137,171
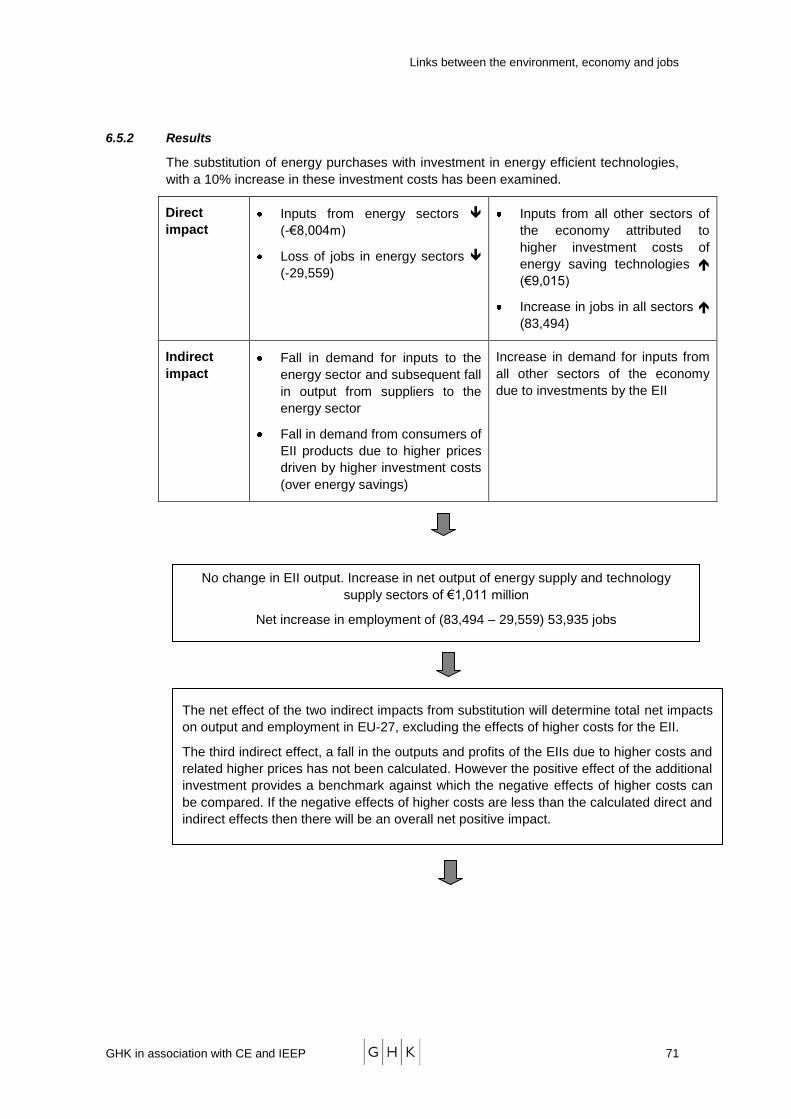
Links between the environment, economy and jobs
GHK in association with CE and IEEP 71
6.5.2 Results
The substitution of energy purchases with investment in energy efficient technologies,
with a 10% increase in these investment costs has been examined.
Direct
impact
Inputs from energy sectors
(-€8,004m)
Loss of jobs in energy sectors
(-29,559)
Inputs from all other sectors of
the economy attributed to
higher investment costs of
energy saving technologies
(€9,015)
Increase in jobs in all sectors
(83,494)
Indirect
impact
Fall in demand for inputs to the
energy sector and subsequent fall
in output from suppliers to the
energy sector
Fall in demand from consumers of
EII products due to higher prices
driven by higher investment costs
(over energy savings)
Increase in demand for inputs from
all other sectors of the economy
due to investments by the EII
The net effect of the two indirect impacts from substitution will determine total net impacts
on output and employment in EU-27, excluding the effects of higher costs for the EII.
The third indirect effect, a fall in the outputs and profits of the EIIs due to higher costs and
related higher prices has not been calculated. However the positive effect of the additional
investment provides a benchmark against which the negative effects of higher costs can
be compared. If the negative effects of higher costs are less than the calculated direct and
indirect effects then there will be an overall net positive impact.
No change in EII output. Increase in net output of energy supply and technology
supply sectors of €1,011 million
Net increase in employment of (83,494 – 29,559) 53,935 jobs
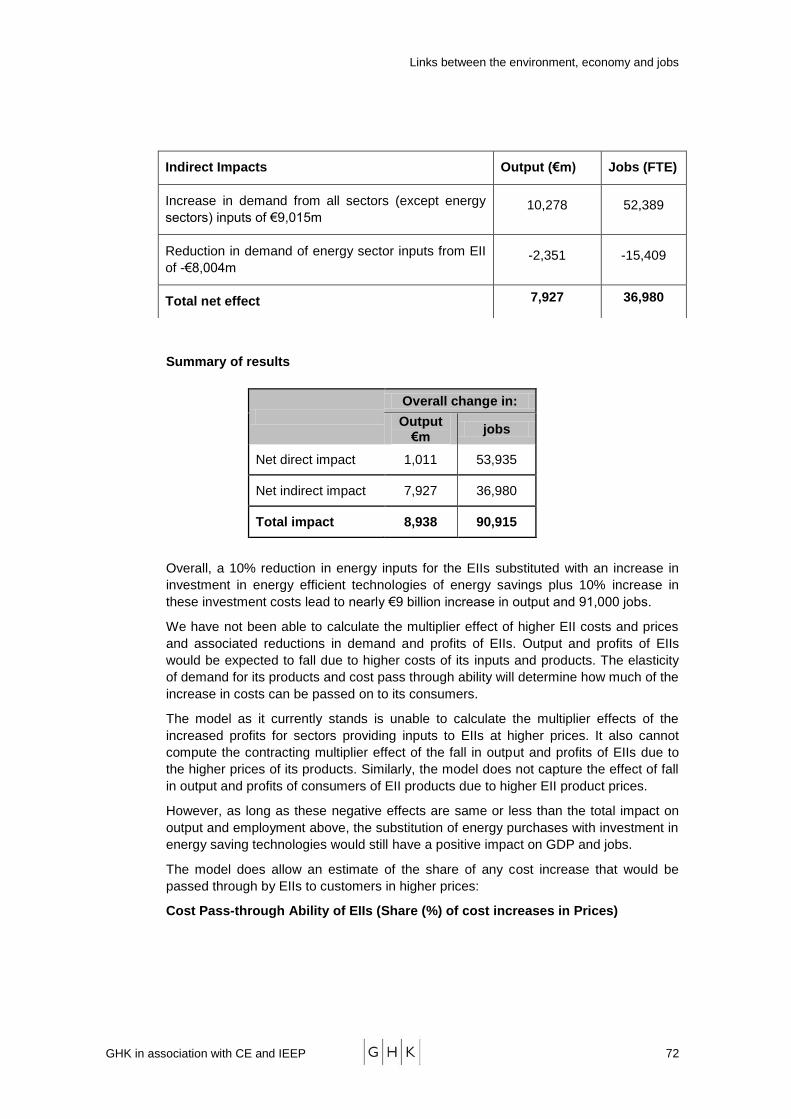
Links between the environment, economy and jobs
GHK in association with CE and IEEP 72
Summary of results
Overall, a 10% reduction in energy inputs for the EIIs substituted with an increase in
investment in energy efficient technologies of energy savings plus 10% increase in
these investment costs lead to nearly €9 billion increase in output and 91,000 jobs.
We have not been able to calculate the multiplier effect of higher EII costs and prices
and associated reductions in demand and profits of EIIs. Output and profits of EIIs
would be expected to fall due to higher costs of its inputs and products. The elasticity
of demand for its products and cost pass through ability will determine how much of the
increase in costs can be passed on to its consumers.
The model as it currently stands is unable to calculate the multiplier effects of the
increased profits for sectors providing inputs to EIIs at higher prices. It also cannot
compute the contracting multiplier effect of the fall in output and profits of EIIs due to
the higher prices of its products. Similarly, the model does not capture the effect of fall
in output and profits of consumers of EII products due to higher EII product prices.
However, as long as these negative effects are same or less than the total impact on
output and employment above, the substitution of energy purchases with investment in
energy saving technologies would still have a positive impact on GDP and jobs.
The model does allow an estimate of the share of any cost increase that would be
passed through by EIIs to customers in higher prices:
Cost Pass-through Ability of EIIs (Share (%) of cost increases in Prices)
Indirect Impacts Output (€m) Jobs (FTE)
Increase in demand from all sectors (except energy
sectors) inputs of €9,015m 10,278 52,389
Reduction in demand of energy sector inputs from EII
of -€8,004m -2,351 -15,409
Total net effect 7,927 36,980
Overall change in:
Output €m
jobs
Net direct impact 1,011 53,935
Net indirect impact 7,927 36,980
Total impact 8,938 90,915

Links between the environment, economy and jobs
GHK in association with CE and IEEP 73
%
Wood & Paper 46
Printing & Publishing 25
Pharmaceuticals 46
Chemicals nes. 8
Rubber & Plastics 21
Non-Met. Min. Prods. 26
Basic Metals 45
Metal Goods 35
Notes: Figures presented are short-term estimates of cost pass-through for selected sectors in
the EU15, derived from historical time series covering the period 1975-2004 using Cambridge
Econometrics' software.
Source: E3ME, Cambridge Econometrics
6.6 Scenario 5 Increase in bio-fuels in transport
6.6.1 Scenario description
The scenario examines the effect of a given increase in the use of bio-fuels by the
transport sector as a substitution for conventional transport fuels (petrol / diesel). A
given substitution to bio-fuels increase will be reflected in an increase in output from
the conventional agricultural sector and a decrease in output from the transport fuel
sector. The scenario is based on a substitution of 10% by value (€) of inputs from the
transport fuel sector with the same value of inputs from the agriculture sector, with no
effect on overall input costs. The effects on land and the supply of agricultural products
attributable to the competition for agricultural inputs attributable to bio-fuels are not
included.
6.6.2 Summary of results
A substitution of 10% by value (€) of inputs from the transport fuel sector (I-O 13:
Manufactured fuels) with the same value of inputs from the agriculture sector (I-O 02:
Other Agriculture)
Direct impact Loss of outputs from
manufactured fuel sector
(-€2,514m)
Loss of employment of
-2,263
Increase in outputs from
agriculture sector (€2514m)
Increase in employment of
110,379
Indirect
impact
Fall in demand for inputs to the
manufactured fuel sector and
subsequent fall in output from
suppliers to the manufactured fuel
sector
Increase in demand for inputs to the
agriculture sector and subsequent
increase in demand from various
supply sectors
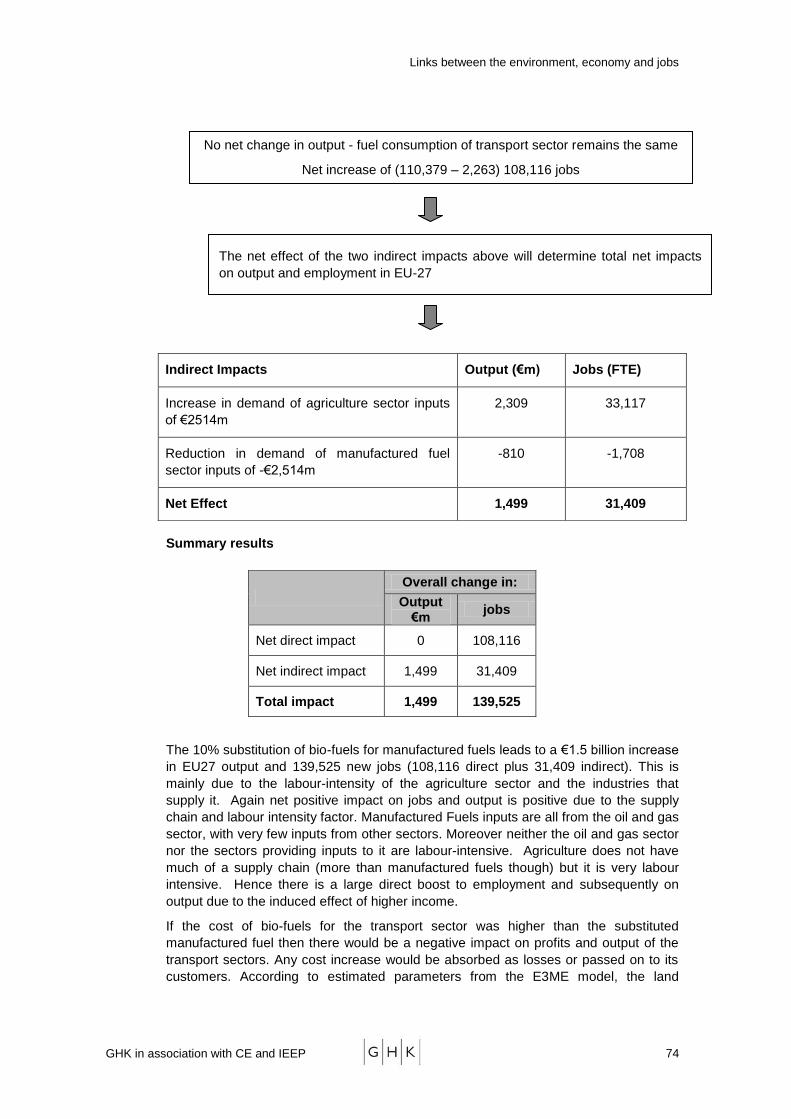
Links between the environment, economy and jobs
GHK in association with CE and IEEP 74
Summary results
The 10% substitution of bio-fuels for manufactured fuels leads to a €1.5 billion increase
in EU27 output and 139,525 new jobs (108,116 direct plus 31,409 indirect). This is
mainly due to the labour-intensity of the agriculture sector and the industries that
supply it. Again net positive impact on jobs and output is positive due to the supply
chain and labour intensity factor. Manufactured Fuels inputs are all from the oil and gas
sector, with very few inputs from other sectors. Moreover neither the oil and gas sector
nor the sectors providing inputs to it are labour-intensive. Agriculture does not have
much of a supply chain (more than manufactured fuels though) but it is very labour
intensive. Hence there is a large direct boost to employment and subsequently on
output due to the induced effect of higher income.
If the cost of bio-fuels for the transport sector was higher than the substituted
manufactured fuel then there would be a negative impact on profits and output of the
transport sectors. Any cost increase would be absorbed as losses or passed on to its
customers. According to estimated parameters from the E3ME model, the land
Indirect Impacts Output (€m) Jobs (FTE)
Increase in demand of agriculture sector inputs
of €2514m
2,309 33,117
Reduction in demand of manufactured fuel
sector inputs of -€2,514m
-810 -1,708
Net Effect 1,499 31,409
Overall change in:
Output €m
jobs
Net direct impact 0 108,116
Net indirect impact 1,499 31,409
Total impact 1,499 139,525
No net change in output - fuel consumption of transport sector remains the same
Net increase of (110,379 – 2,263) 108,116 jobs
The net effect of the two indirect impacts above will determine total net impacts
on output and employment in EU-27
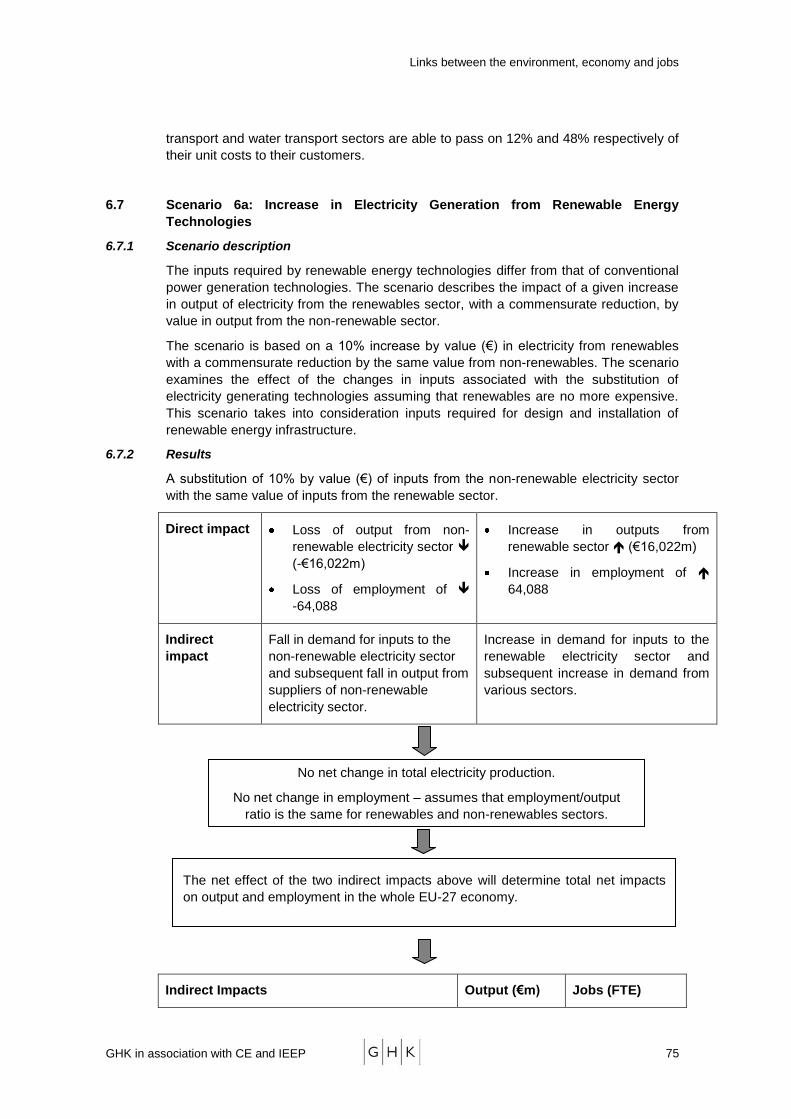
Links between the environment, economy and jobs
GHK in association with CE and IEEP 75
transport and water transport sectors are able to pass on 12% and 48% respectively of
their unit costs to their customers.
6.7 Scenario 6a: Increase in Electricity Generation from Renewable Energy
Technologies
6.7.1 Scenario description
The inputs required by renewable energy technologies differ from that of conventional
power generation technologies. The scenario describes the impact of a given increase
in output of electricity from the renewables sector, with a commensurate reduction, by
value in output from the non-renewable sector.
The scenario is based on a 10% increase by value (€) in electricity from renewables
with a commensurate reduction by the same value from non-renewables. The scenario
examines the effect of the changes in inputs associated with the substitution of
electricity generating technologies assuming that renewables are no more expensive.
This scenario takes into consideration inputs required for design and installation of
renewable energy infrastructure.
6.7.2 Results
A substitution of 10% by value (€) of inputs from the non-renewable electricity sector
with the same value of inputs from the renewable sector.
Direct impact Loss of output from non-
renewable electricity sector
(-€16,022m)
Loss of employment of
-64,088
Increase in outputs from
renewable sector (€16,022m)
Increase in employment of
64,088
Indirect
impact
Fall in demand for inputs to the
non-renewable electricity sector
and subsequent fall in output from
suppliers of non-renewable
electricity sector.
Increase in demand for inputs to the
renewable electricity sector and
subsequent increase in demand from
various sectors.
Indirect Impacts Output (€m) Jobs (FTE)
No net change in total electricity production.
No net change in employment – assumes that employment/output
ratio is the same for renewables and non-renewables sectors.
The net effect of the two indirect impacts above will determine total net impacts
on output and employment in the whole EU-27 economy.
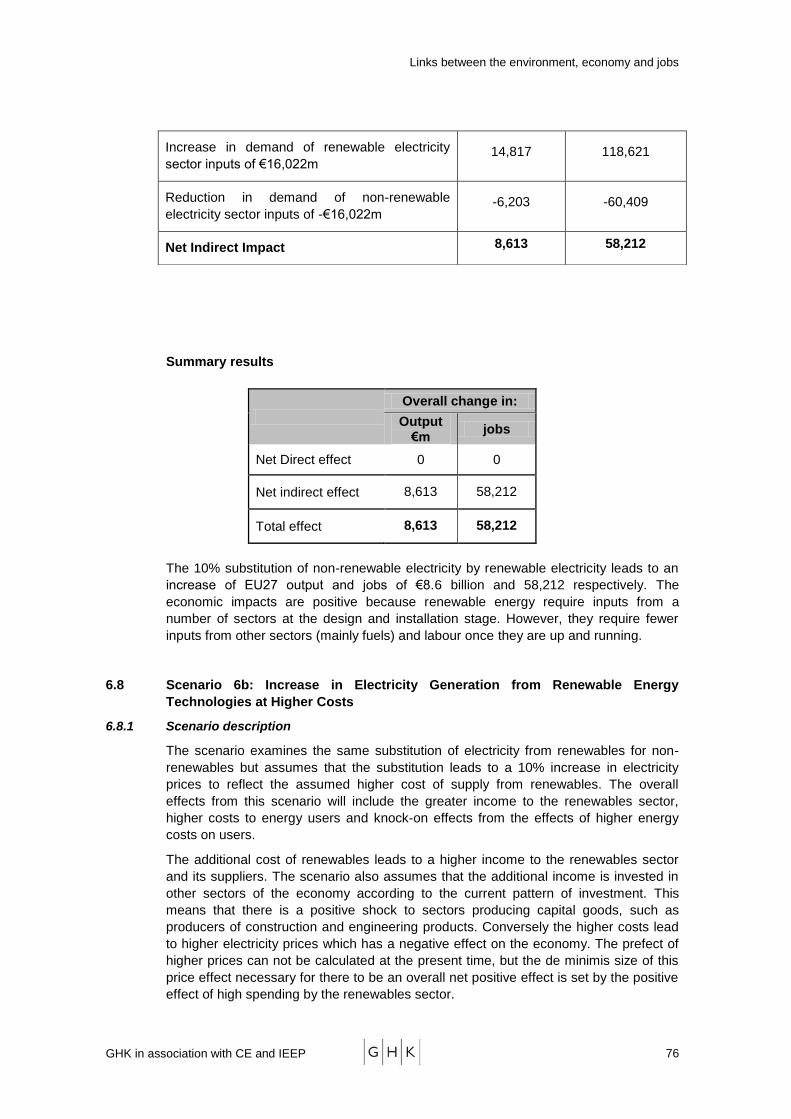
Links between the environment, economy and jobs
GHK in association with CE and IEEP 76
Summary results
The 10% substitution of non-renewable electricity by renewable electricity leads to an
increase of EU27 output and jobs of €8.6 billion and 58,212 respectively. The
economic impacts are positive because renewable energy require inputs from a
number of sectors at the design and installation stage. However, they require fewer
inputs from other sectors (mainly fuels) and labour once they are up and running.
6.8 Scenario 6b: Increase in Electricity Generation from Renewable Energy
Technologies at Higher Costs
6.8.1 Scenario description
The scenario examines the same substitution of electricity from renewables for non-
renewables but assumes that the substitution leads to a 10% increase in electricity
prices to reflect the assumed higher cost of supply from renewables. The overall
effects from this scenario will include the greater income to the renewables sector,
higher costs to energy users and knock-on effects from the effects of higher energy
costs on users.
The additional cost of renewables leads to a higher income to the renewables sector
and its suppliers. The scenario also assumes that the additional income is invested in
other sectors of the economy according to the current pattern of investment. This
means that there is a positive shock to sectors producing capital goods, such as
producers of construction and engineering products. Conversely the higher costs lead
to higher electricity prices which has a negative effect on the economy. The prefect of
higher prices can not be calculated at the present time, but the de minimis size of this
price effect necessary for there to be an overall net positive effect is set by the positive
effect of high spending by the renewables sector.
Increase in demand of renewable electricity
sector inputs of €16,022m 14,817 118,621
Reduction in demand of non-renewable
electricity sector inputs of -€16,022m -6,203 -60,409
Net Indirect Impact 8,613 58,212
Overall change in:
Output €m
jobs
Net Direct effect 0 0
Net indirect effect 8,613 58,212
Total effect 8,613 58,212
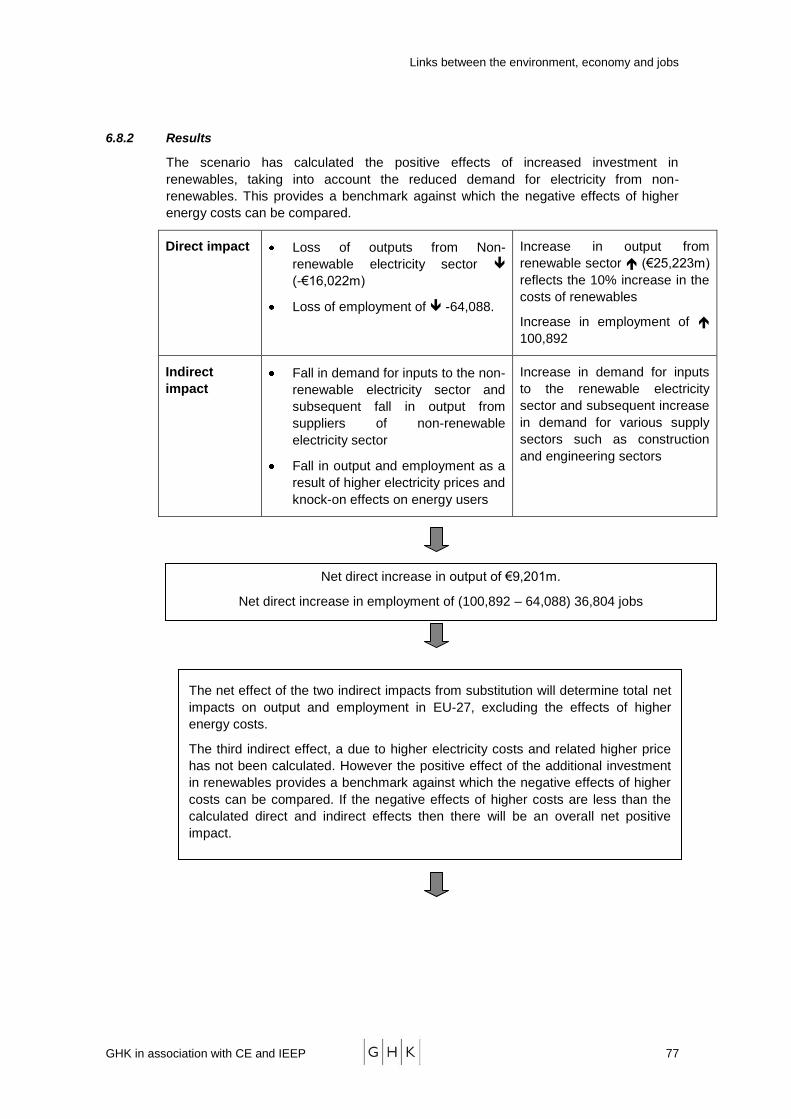
Links between the environment, economy and jobs
GHK in association with CE and IEEP 77
6.8.2 Results
The scenario has calculated the positive effects of increased investment in
renewables, taking into account the reduced demand for electricity from non-
renewables. This provides a benchmark against which the negative effects of higher
energy costs can be compared.
Direct impact Loss of outputs from Non-
renewable electricity sector
(-€16,022m)
Loss of employment of -64,088.
Increase in output from
renewable sector (€25,223m)
reflects the 10% increase in the
costs of renewables
Increase in employment of
100,892
Indirect
impact
Fall in demand for inputs to the non-
renewable electricity sector and
subsequent fall in output from
suppliers of non-renewable
electricity sector
Fall in output and employment as a
result of higher electricity prices and
knock-on effects on energy users
Increase in demand for inputs
to the renewable electricity
sector and subsequent increase
in demand for various supply
sectors such as construction
and engineering sectors
The net effect of the two indirect impacts from substitution will determine total net
impacts on output and employment in EU-27, excluding the effects of higher
energy costs.
The third indirect effect, a due to higher electricity costs and related higher price
has not been calculated. However the positive effect of the additional investment
in renewables provides a benchmark against which the negative effects of higher
costs can be compared. If the negative effects of higher costs are less than the
calculated direct and indirect effects then there will be an overall net positive
impact.
Net direct increase in output of €9,201m.
Net direct increase in employment of (100,892 – 64,088) 36,804 jobs
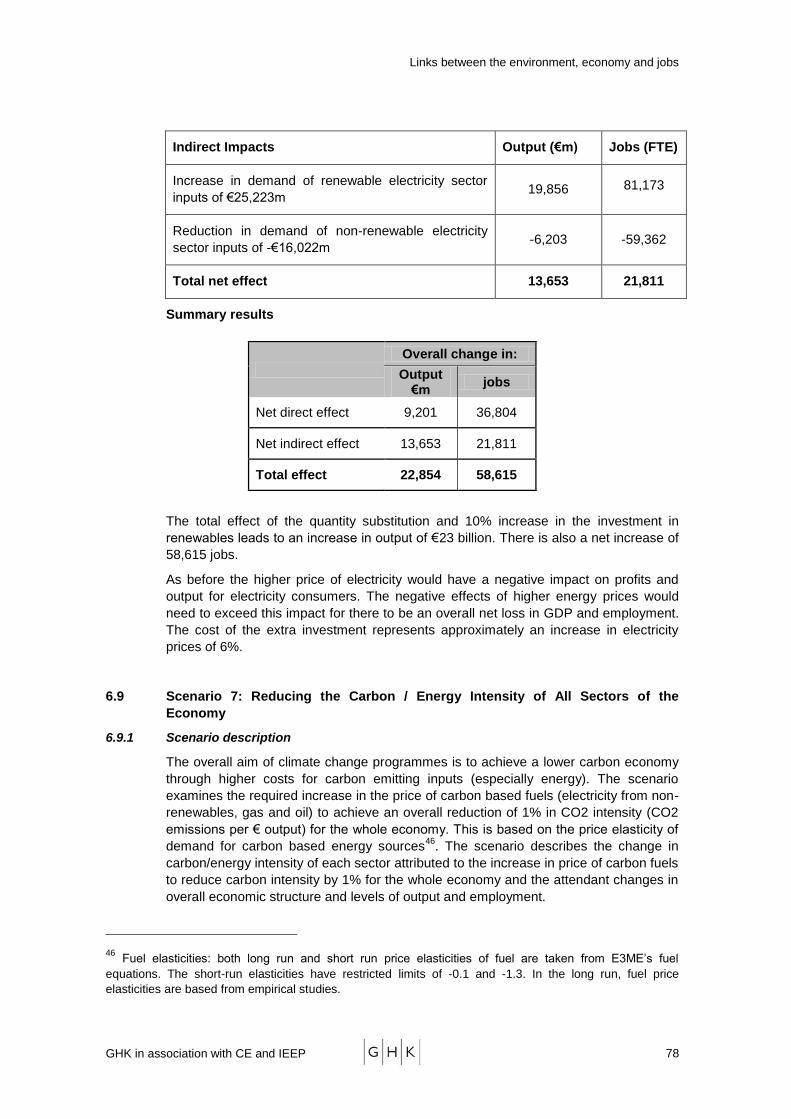
Links between the environment, economy and jobs
GHK in association with CE and IEEP 78
Indirect Impacts Output (€m) Jobs (FTE)
Increase in demand of renewable electricity sector
inputs of €25,223m 19,856 81,173
Reduction in demand of non-renewable electricity
sector inputs of -€16,022m -6,203 -59,362
Total net effect 13,653 21,811
Summary results
The total effect of the quantity substitution and 10% increase in the investment in
renewables leads to an increase in output of €23 billion. There is also a net increase of
58,615 jobs.
As before the higher price of electricity would have a negative impact on profits and
output for electricity consumers. The negative effects of higher energy prices would
need to exceed this impact for there to be an overall net loss in GDP and employment.
The cost of the extra investment represents approximately an increase in electricity
prices of 6%.
6.9 Scenario 7: Reducing the Carbon / Energy Intensity of All Sectors of the
Economy
6.9.1 Scenario description
The overall aim of climate change programmes is to achieve a lower carbon economy
through higher costs for carbon emitting inputs (especially energy). The scenario
examines the required increase in the price of carbon based fuels (electricity from non-
renewables, gas and oil) to achieve an overall reduction of 1% in CO2 intensity (CO2
emissions per € output) for the whole economy. This is based on the price elasticity of
demand for carbon based energy sources46
. The scenario describes the change in
carbon/energy intensity of each sector attributed to the increase in price of carbon fuels
to reduce carbon intensity by 1% for the whole economy and the attendant changes in
overall economic structure and levels of output and employment.
46 Fuel elasticities: both long run and short run price elasticities of fuel are taken from E3ME‘s fuel
equations. The short-run elasticities have restricted limits of -0.1 and -1.3. In the long run, fuel price
elasticities are based from empirical studies.
Overall change in:
Output €m
jobs
Net direct effect 9,201 36,804
Net indirect effect 13,653 21,811
Total effect 22,854 58,615
Links between the environment, economy and jobs
GHK in association with CE and IEEP 79
6.9.2 Summary of Results
Scenario 7 differs from other price-effect scenarios as it looks at the impact of price
increases of the carbon-based fuel on the overall level of CO2 emissions. The aim of
this scenario is to find out how much energy prices would need to increase to reduce
CO2 emission intensity by 1%. An increase in the price of carbon-based fuel will lead
to reductions in demand of the fuel through the price-elasticity effect (estimated from
E3ME fuel equations).
There are two sets of results from Scenario 7 using short run and long run fuel price
elasticities, and based on the existing energy mix:
1. Price increase required to reduce CO2 intensity by 1%
2. Impact of a 10% price increase in each fuel type (separately) on the overall
carbon intensity of the EU27 economy
6.9.3 Price increase required to reduce CO2 intensity by 1%.
The overall energy price increase required to reduce CO2-intensity by 1% is 8% using
short-run fuel price elasticities47
. CO2 intensity as a result of the energy price increase
in 2000 was 163 tonnes per million € of output48
. Around 37,917 tonnes of CO2 can be
saved by an 8% price increase and assocated1% reduction in CO2 intensity.
A series of interactions takes place in the I-O tables as a result of the higher energy
prices. An increase in the price of carbon-based fuel will lead to reductions in demand
of the fuel through the price elasticity effect (estimated from E3ME fuel elasticities,
given in Annex D). In common with much of the research in this field, the short-term
price elasticities have been found to be zero or close to zero in many of the sectors
examined. This is mainly due to difficulties in switching fuels or production techniques
in machinery that is typically designed to last many years.
The input-output tables compare input costs against final output and are measured in
current prices. Thus when energy costs increase it affects the relative costs of all the
industries that use energy as an input in its production process. The I-O coefficients
across the entire row for the energy sectors are revised upwards. The multiplier effects
of all sectors also change which gives us the net impact on total output due to the
energy price increase. CO2 intensity is then calculated by dividing total CO2 emissions
(using emission factors for each fuel type) by total output.
Data for CO2 emissions, disaggregated by fuel and fuel user group, were taken from
the E3ME model and converted into the same classification as the input-output tables.
Fixed proportions were used to determine fuel purchases and emissions. For
example, emissions by the power generation sector are calculated as a linear function
of its purchases of coal, oil, gas and manufactured fuels (ie four points in the column
for power generation in the I-O table). In the model, CO2 intensity will therefore fall if
these coefficients are reduced due to increase in energy prices.
47 This result is not surprising given the assumption that the non-significant elasticities have been set to -0.1
(if they were all 10% the required price increase would be not much more than 10). If the estimation system came up with a significant elasticity greater than -0.1 (eg -0.05) this was used. Not unexpectedly, this is often the case in the sectors that appear at the top of the list in the above table. Please see Annex D for more details on fuel price elasticities.
48 3,538,810 thousand tonnes of CO2 divided by €12.1 trillion output. The figure 3,538,810 tonnes of CO2 is
only emissions from energy use. The total value, which includes CO2 from industrial processes and some other miscellaneous processes, is about 5% higher.
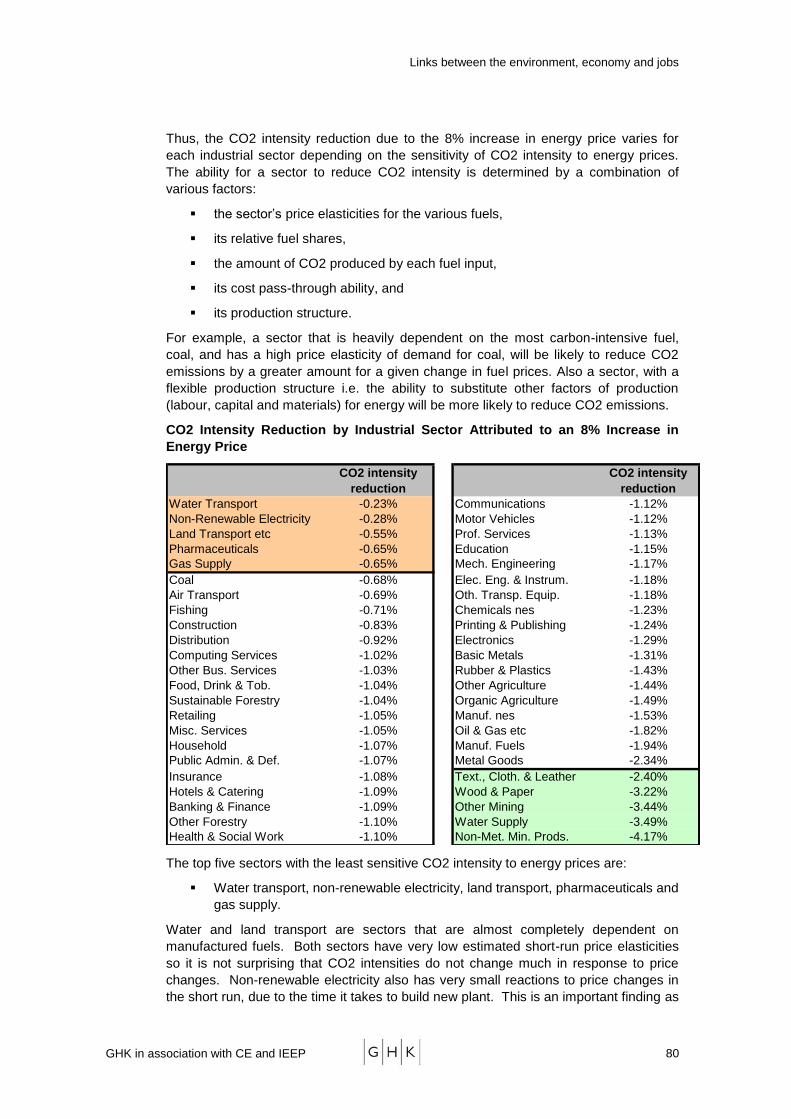
Links between the environment, economy and jobs
GHK in association with CE and IEEP 80
Thus, the CO2 intensity reduction due to the 8% increase in energy price varies for
each industrial sector depending on the sensitivity of CO2 intensity to energy prices.
The ability for a sector to reduce CO2 intensity is determined by a combination of
various factors:
the sector‘s price elasticities for the various fuels,
its relative fuel shares,
the amount of CO2 produced by each fuel input,
its cost pass-through ability, and
its production structure.
For example, a sector that is heavily dependent on the most carbon-intensive fuel,
coal, and has a high price elasticity of demand for coal, will be likely to reduce CO2
emissions by a greater amount for a given change in fuel prices. Also a sector, with a
flexible production structure i.e. the ability to substitute other factors of production
(labour, capital and materials) for energy will be more likely to reduce CO2 emissions.
CO2 Intensity Reduction by Industrial Sector Attributed to an 8% Increase in
Energy Price
CO2 intensity
reduction
CO2 intensity
reduction
Water Transport -0.23% Communications -1.12%
Non-Renewable Electricity -0.28% Motor Vehicles -1.12%
Land Transport etc -0.55% Prof. Services -1.13%
Pharmaceuticals -0.65% Education -1.15%
Gas Supply -0.65% Mech. Engineering -1.17%
Coal -0.68% Elec. Eng. & Instrum. -1.18%
Air Transport -0.69% Oth. Transp. Equip. -1.18%
Fishing -0.71% Chemicals nes -1.23%
Construction -0.83% Printing & Publishing -1.24%
Distribution -0.92% Electronics -1.29%
Computing Services -1.02% Basic Metals -1.31%
Other Bus. Services -1.03% Rubber & Plastics -1.43%
Food, Drink & Tob. -1.04% Other Agriculture -1.44%
Sustainable Forestry -1.04% Organic Agriculture -1.49%
Retailing -1.05% Manuf. nes -1.53%
Misc. Services -1.05% Oil & Gas etc -1.82%
Household -1.07% Manuf. Fuels -1.94%
Public Admin. & Def. -1.07% Metal Goods -2.34%
Insurance -1.08% Text., Cloth. & Leather -2.40%
Hotels & Catering -1.09% Wood & Paper -3.22%
Banking & Finance -1.09% Other Mining -3.44%
Other Forestry -1.10% Water Supply -3.49%
Health & Social Work -1.10% Non-Met. Min. Prods. -4.17%
The top five sectors with the least sensitive CO2 intensity to energy prices are:
Water transport, non-renewable electricity, land transport, pharmaceuticals and
gas supply.
Water and land transport are sectors that are almost completely dependent on
manufactured fuels. Both sectors have very low estimated short-run price elasticities
so it is not surprising that CO2 intensities do not change much in response to price
changes. Non-renewable electricity also has very small reactions to price changes in
the short run, due to the time it takes to build new plant. This is an important finding as
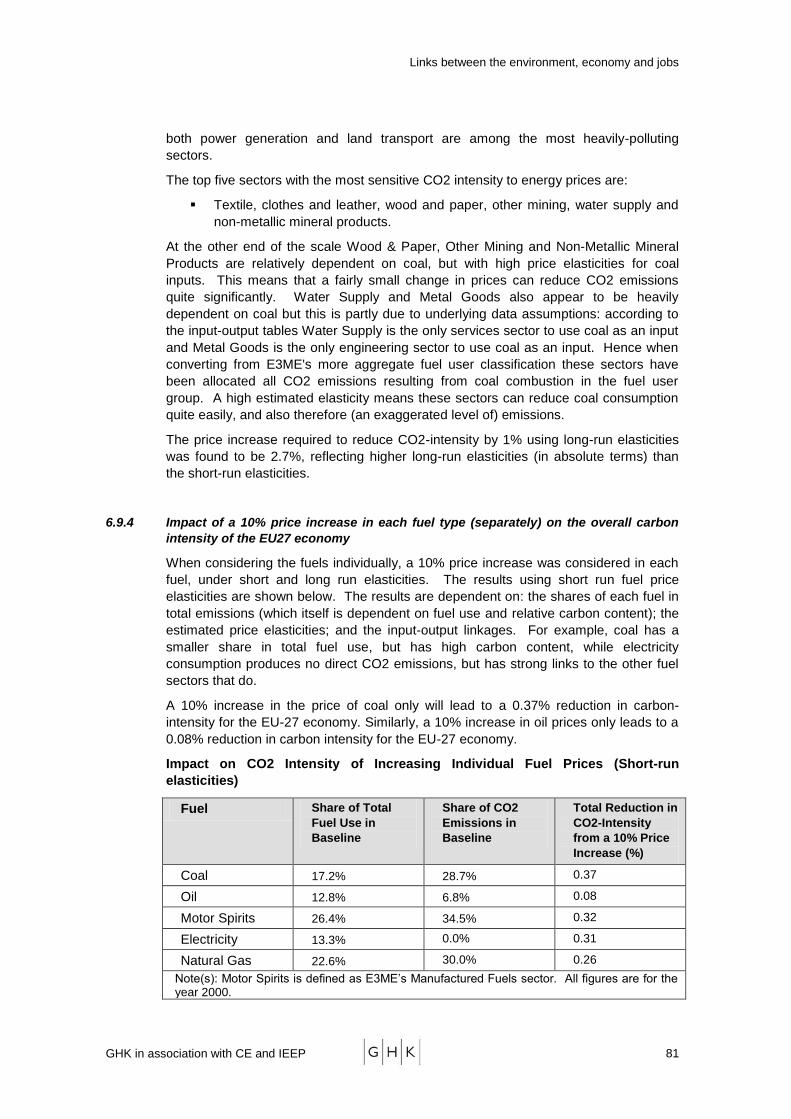
Links between the environment, economy and jobs
GHK in association with CE and IEEP 81
both power generation and land transport are among the most heavily-polluting
sectors.
The top five sectors with the most sensitive CO2 intensity to energy prices are:
Textile, clothes and leather, wood and paper, other mining, water supply and
non-metallic mineral products.
At the other end of the scale Wood & Paper, Other Mining and Non-Metallic Mineral
Products are relatively dependent on coal, but with high price elasticities for coal
inputs. This means that a fairly small change in prices can reduce CO2 emissions
quite significantly. Water Supply and Metal Goods also appear to be heavily
dependent on coal but this is partly due to underlying data assumptions: according to
the input-output tables Water Supply is the only services sector to use coal as an input
and Metal Goods is the only engineering sector to use coal as an input. Hence when
converting from E3ME's more aggregate fuel user classification these sectors have
been allocated all CO2 emissions resulting from coal combustion in the fuel user
group. A high estimated elasticity means these sectors can reduce coal consumption
quite easily, and also therefore (an exaggerated level of) emissions.
The price increase required to reduce CO2-intensity by 1% using long-run elasticities
was found to be 2.7%, reflecting higher long-run elasticities (in absolute terms) than
the short-run elasticities.
6.9.4 Impact of a 10% price increase in each fuel type (separately) on the overall carbon
intensity of the EU27 economy
When considering the fuels individually, a 10% price increase was considered in each
fuel, under short and long run elasticities. The results using short run fuel price
elasticities are shown below. The results are dependent on: the shares of each fuel in
total emissions (which itself is dependent on fuel use and relative carbon content); the
estimated price elasticities; and the input-output linkages. For example, coal has a
smaller share in total fuel use, but has high carbon content, while electricity
consumption produces no direct CO2 emissions, but has strong links to the other fuel
sectors that do.
A 10% increase in the price of coal only will lead to a 0.37% reduction in carbon-
intensity for the EU-27 economy. Similarly, a 10% increase in oil prices only leads to a
0.08% reduction in carbon intensity for the EU-27 economy.
Impact on CO2 Intensity of Increasing Individual Fuel Prices (Short-run
elasticities)
Fuel Share of Total
Fuel Use in
Baseline
Share of CO2
Emissions in
Baseline
Total Reduction in
CO2-Intensity
from a 10% Price
Increase (%)
Coal 17.2% 28.7% 0.37
Oil 12.8% 6.8% 0.08
Motor Spirits 26.4% 34.5% 0.32
Electricity 13.3% 0.0% 0.31
Natural Gas 22.6% 30.0% 0.26
Note(s): Motor Spirits is defined as E3ME‘s Manufactured Fuels sector. All figures are for the year 2000.
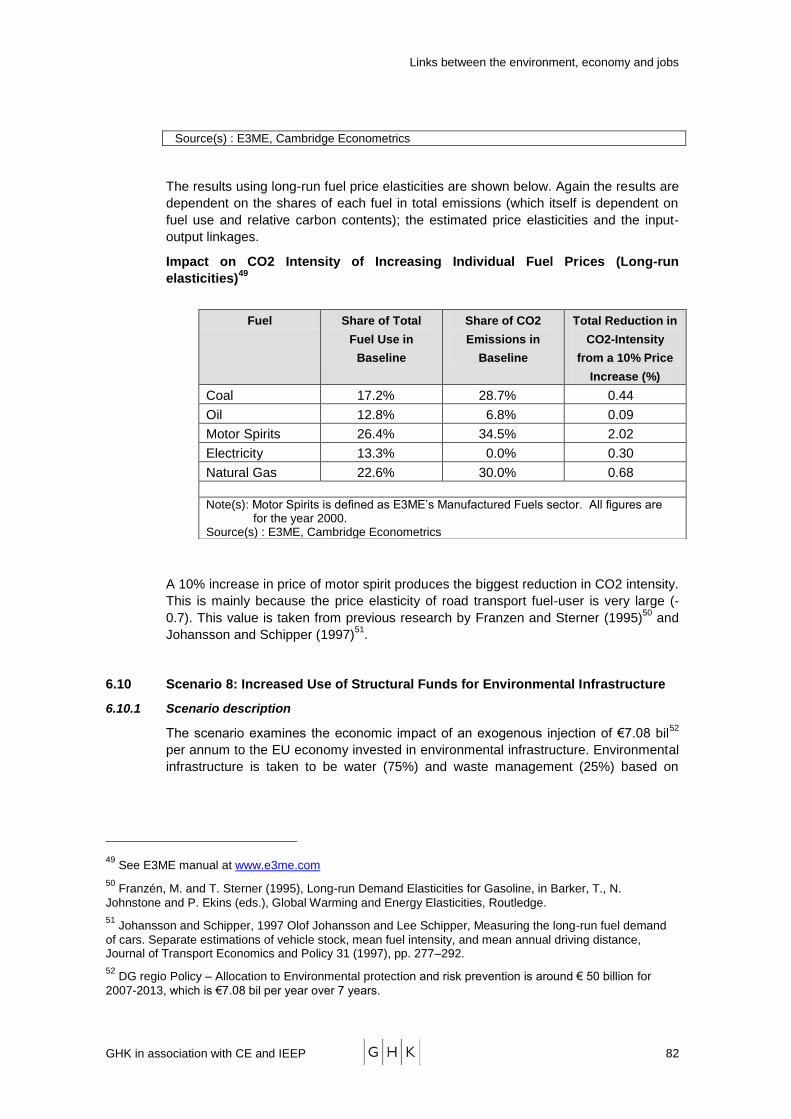
Links between the environment, economy and jobs
GHK in association with CE and IEEP 82
Source(s) : E3ME, Cambridge Econometrics
The results using long-run fuel price elasticities are shown below. Again the results are
dependent on the shares of each fuel in total emissions (which itself is dependent on
fuel use and relative carbon contents); the estimated price elasticities and the input-
output linkages.
Impact on CO2 Intensity of Increasing Individual Fuel Prices (Long-run
elasticities)49
A 10% increase in price of motor spirit produces the biggest reduction in CO2 intensity.
This is mainly because the price elasticity of road transport fuel-user is very large (-
0.7). This value is taken from previous research by Franzen and Sterner (1995)50
and
Johansson and Schipper (1997)51
.
6.10 Scenario 8: Increased Use of Structural Funds for Environmental Infrastructure
6.10.1 Scenario description
The scenario examines the economic impact of an exogenous injection of €7.08 bil52
per annum to the EU economy invested in environmental infrastructure. Environmental
infrastructure is taken to be water (75%) and waste management (25%) based on
49 See E3ME manual at www.e3me.com
50 Franzén, M. and T. Sterner (1995), Long-run Demand Elasticities for Gasoline, in Barker, T., N.
Johnstone and P. Ekins (eds.), Global Warming and Energy Elasticities, Routledge.
51 Johansson and Schipper, 1997 Olof Johansson and Lee Schipper, Measuring the long-run fuel demand
of cars. Separate estimations of vehicle stock, mean fuel intensity, and mean annual driving distance, Journal of Transport Economics and Policy 31 (1997), pp. 277–292.
52 DG regio Policy – Allocation to Environmental protection and risk prevention is around € 50 billion for
2007-2013, which is €7.08 bil per year over 7 years.
Fuel Share of Total
Fuel Use in
Baseline
Share of CO2
Emissions in
Baseline
Total Reduction in
CO2-Intensity
from a 10% Price
Increase (%)
Coal 17.2% 28.7% 0.44
Oil 12.8% 6.8% 0.09
Motor Spirits 26.4% 34.5% 2.02
Electricity 13.3% 0.0% 0.30
Natural Gas 22.6% 30.0% 0.68
Note(s): Motor Spirits is defined as E3ME‘s Manufactured Fuels sector. All figures are
for the year 2000. Source(s) : E3ME, Cambridge Econometrics
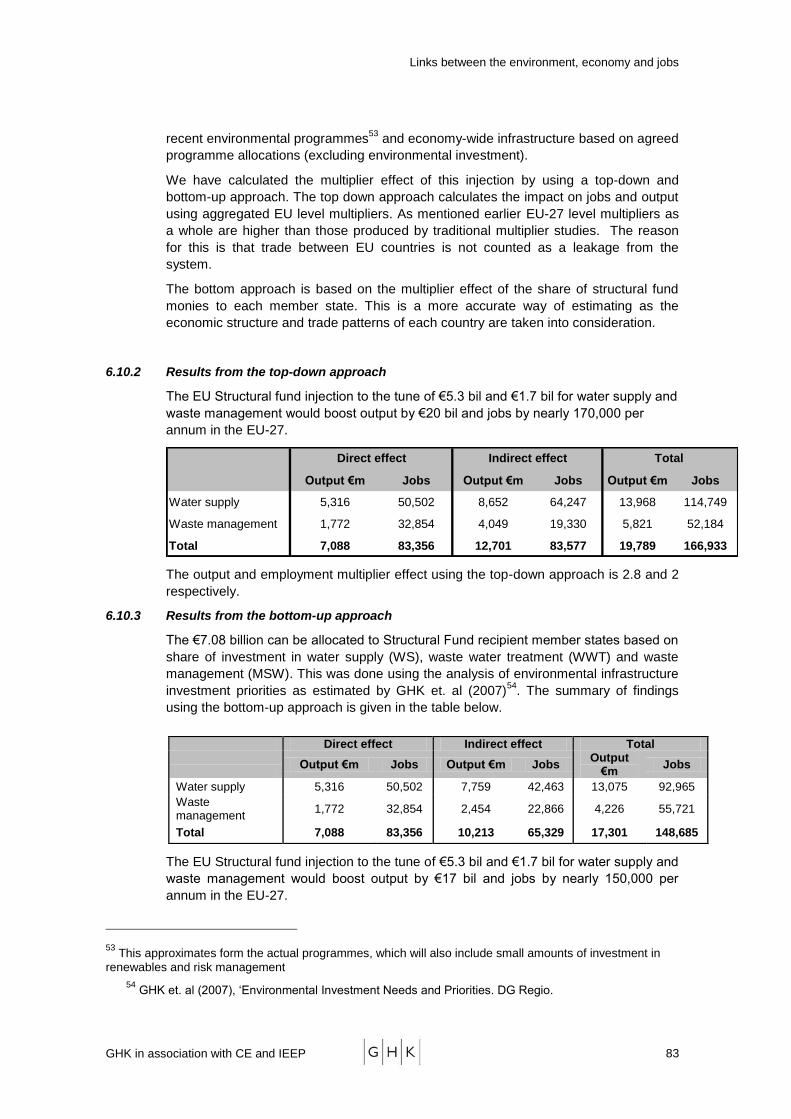
Links between the environment, economy and jobs
GHK in association with CE and IEEP 83
recent environmental programmes53
and economy-wide infrastructure based on agreed
programme allocations (excluding environmental investment).
We have calculated the multiplier effect of this injection by using a top-down and
bottom-up approach. The top down approach calculates the impact on jobs and output
using aggregated EU level multipliers. As mentioned earlier EU-27 level multipliers as
a whole are higher than those produced by traditional multiplier studies. The reason
for this is that trade between EU countries is not counted as a leakage from the
system.
The bottom approach is based on the multiplier effect of the share of structural fund
monies to each member state. This is a more accurate way of estimating as the
economic structure and trade patterns of each country are taken into consideration.
6.10.2 Results from the top-down approach
The EU Structural fund injection to the tune of €5.3 bil and €1.7 bil for water supply and
waste management would boost output by €20 bil and jobs by nearly 170,000 per
annum in the EU-27.
Output €m Jobs Output €m Jobs Output €m Jobs
Water supply 5,316 50,502 8,652 64,247 13,968 114,749
Waste management 1,772 32,854 4,049 19,330 5,821 52,184
Total 7,088 83,356 12,701 83,577 19,789 166,933
Direct effect Indirect effect Total
The output and employment multiplier effect using the top-down approach is 2.8 and 2
respectively.
6.10.3 Results from the bottom-up approach
The €7.08 billion can be allocated to Structural Fund recipient member states based on
share of investment in water supply (WS), waste water treatment (WWT) and waste
management (MSW). This was done using the analysis of environmental infrastructure
investment priorities as estimated by GHK et. al (2007)54
. The summary of findings
using the bottom-up approach is given in the table below.
Direct effect Indirect effect Total
Output €m Jobs Output €m Jobs
Output €m
Jobs
Water supply 5,316 50,502 7,759 42,463 13,075 92,965
Waste management
1,772 32,854 2,454 22,866 4,226 55,721
Total 7,088 83,356 10,213 65,329 17,301 148,685
The EU Structural fund injection to the tune of €5.3 bil and €1.7 bil for water supply and
waste management would boost output by €17 bil and jobs by nearly 150,000 per
annum in the EU-27.
53 This approximates form the actual programmes, which will also include small amounts of investment in
renewables and risk management
54 GHK et. al (2007), ‗Environmental Investment Needs and Priorities. DG Regio.
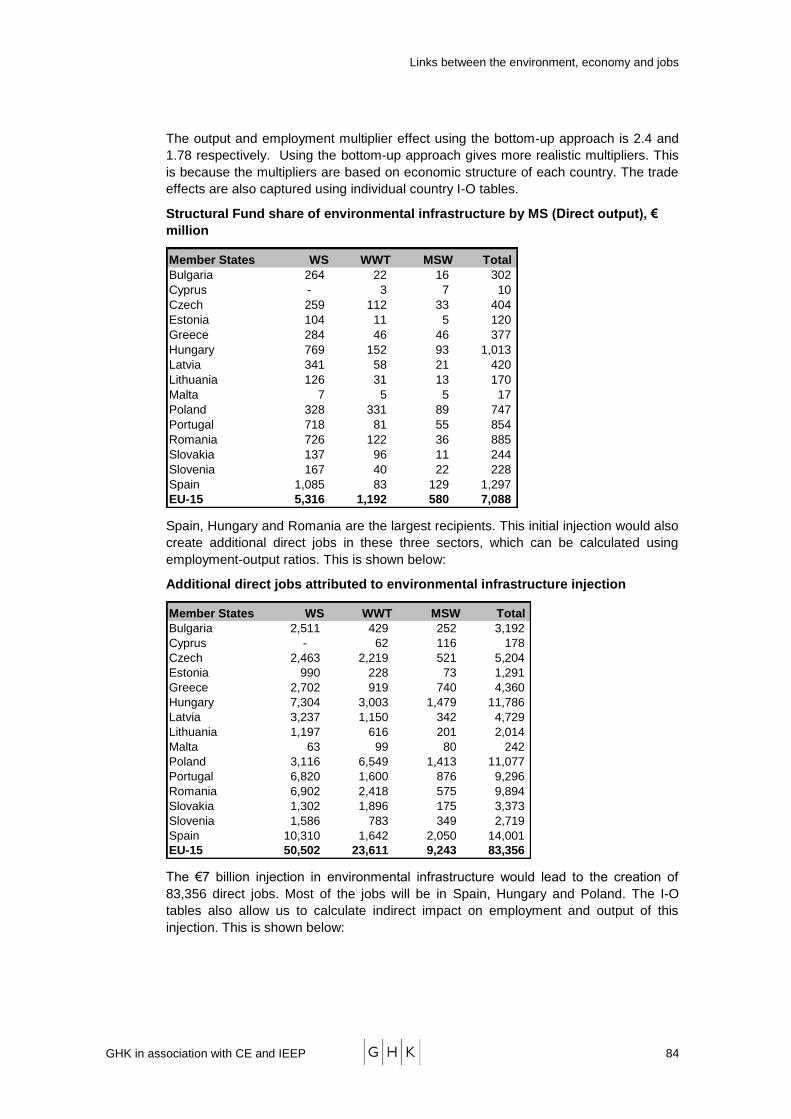
Links between the environment, economy and jobs
GHK in association with CE and IEEP 84
The output and employment multiplier effect using the bottom-up approach is 2.4 and
1.78 respectively. Using the bottom-up approach gives more realistic multipliers. This
is because the multipliers are based on economic structure of each country. The trade
effects are also captured using individual country I-O tables.
Structural Fund share of environmental infrastructure by MS (Direct output), €
million
Member States WS WWT MSW Total
Bulgaria 264 22 16 302
Cyprus - 3 7 10
Czech 259 112 33 404
Estonia 104 11 5 120
Greece 284 46 46 377
Hungary 769 152 93 1,013
Latvia 341 58 21 420
Lithuania 126 31 13 170
Malta 7 5 5 17
Poland 328 331 89 747
Portugal 718 81 55 854
Romania 726 122 36 885
Slovakia 137 96 11 244
Slovenia 167 40 22 228
Spain 1,085 83 129 1,297
EU-15 5,316 1,192 580 7,088
Spain, Hungary and Romania are the largest recipients. This initial injection would also
create additional direct jobs in these three sectors, which can be calculated using
employment-output ratios. This is shown below:
Additional direct jobs attributed to environmental infrastructure injection
Member States WS WWT MSW Total
Bulgaria 2,511 429 252 3,192
Cyprus - 62 116 178
Czech 2,463 2,219 521 5,204
Estonia 990 228 73 1,291
Greece 2,702 919 740 4,360
Hungary 7,304 3,003 1,479 11,786
Latvia 3,237 1,150 342 4,729
Lithuania 1,197 616 201 2,014
Malta 63 99 80 242
Poland 3,116 6,549 1,413 11,077
Portugal 6,820 1,600 876 9,296
Romania 6,902 2,418 575 9,894
Slovakia 1,302 1,896 175 3,373
Slovenia 1,586 783 349 2,719
Spain 10,310 1,642 2,050 14,001
EU-15 50,502 23,611 9,243 83,356
The €7 billion injection in environmental infrastructure would lead to the creation of
83,356 direct jobs. Most of the jobs will be in Spain, Hungary and Poland. The I-O
tables also allow us to calculate indirect impact on employment and output of this
injection. This is shown below:
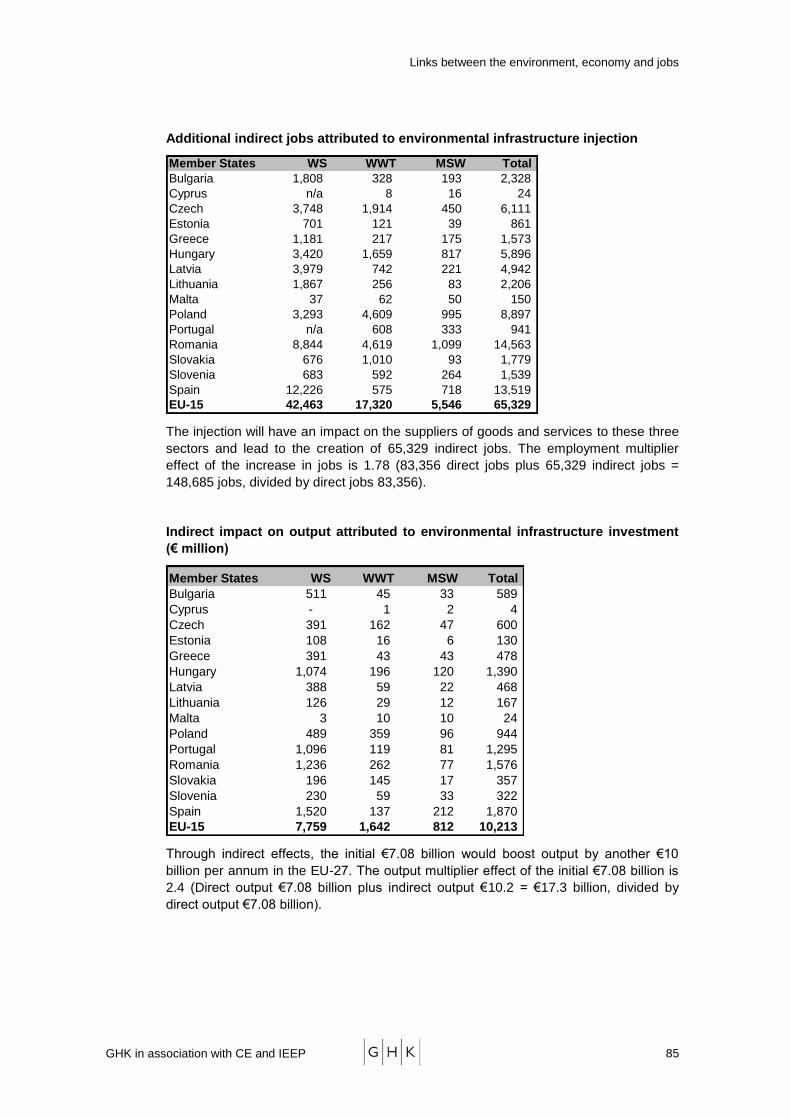
Links between the environment, economy and jobs
GHK in association with CE and IEEP 85
Additional indirect jobs attributed to environmental infrastructure injection
Member States WS WWT MSW Total
Bulgaria 1,808 328 193 2,328
Cyprus n/a 8 16 24
Czech 3,748 1,914 450 6,111
Estonia 701 121 39 861
Greece 1,181 217 175 1,573
Hungary 3,420 1,659 817 5,896
Latvia 3,979 742 221 4,942
Lithuania 1,867 256 83 2,206
Malta 37 62 50 150
Poland 3,293 4,609 995 8,897
Portugal n/a 608 333 941
Romania 8,844 4,619 1,099 14,563
Slovakia 676 1,010 93 1,779
Slovenia 683 592 264 1,539
Spain 12,226 575 718 13,519
EU-15 42,463 17,320 5,546 65,329
The injection will have an impact on the suppliers of goods and services to these three
sectors and lead to the creation of 65,329 indirect jobs. The employment multiplier
effect of the increase in jobs is 1.78 (83,356 direct jobs plus 65,329 indirect jobs =
148,685 jobs, divided by direct jobs 83,356).
Indirect impact on output attributed to environmental infrastructure investment
(€ million)
Member States WS WWT MSW Total
Bulgaria 511 45 33 589
Cyprus - 1 2 4
Czech 391 162 47 600
Estonia 108 16 6 130
Greece 391 43 43 478
Hungary 1,074 196 120 1,390
Latvia 388 59 22 468
Lithuania 126 29 12 167
Malta 3 10 10 24
Poland 489 359 96 944
Portugal 1,096 119 81 1,295
Romania 1,236 262 77 1,576
Slovakia 196 145 17 357
Slovenia 230 59 33 322
Spain 1,520 137 212 1,870
EU-15 7,759 1,642 812 10,213
Through indirect effects, the initial €7.08 billion would boost output by another €10
billion per annum in the EU-27. The output multiplier effect of the initial €7.08 billion is
2.4 (Direct output €7.08 billion plus indirect output €10.2 = €17.3 billion, divided by
direct output €7.08 billion).

Links between the environment, economy and jobs
GHK in association with CE and IEEP 86
PART D: LINKS TO BIODIVERSITY AND OTHER AREAS NOT
CURRENTLY AMENABLE TO ASSESSMENT USING INPUT-OUTPUT
APPROACHES

Links between the environment, economy and jobs
GHK in association with CE and IEEP 87
7 INTRODUCTION TO PART D
Part B of this study looked at the following links between the environment, economy
and jobs:
1. Activities where the environment is a primary resource or input into the
economic process – Agriculture, forestry, mining, electricity generation (excl.
renewables) and water supply
2. Activities concerned with protection and management of the environment –
such as waste recycling, renewable energy, pollution and sewage control, and
environmental management.55
3. Activities dependent on environmental quality – Environment related tourism
This analysis quantified environmental related activities in terms of jobs and output
Both direct and indirect economic impacts were presented using input-output tables.
Part C used a number of environmental policy scenarios to explore how different
policies would affect the economy taking into account the indirect effects.
This part (Part D) examines a range of other linkages between the economy and the
environment, which are potentially important but which, are more difficult to quantify
with existing levels of data and which are less amenable to the application of the
quantitative approach, based on the Input-Output (I-O) framework used in the rest of
the study.
It starts with a discussion of the drivers of environment related economic activities
(Chapter 8). Chapter 9 then explores the link between biodiversity/natural capital and
the associated ‗ecosystem services‘ with the economy – a link difficult to quantify fully
and hence not included under Part B. There are a wide range of links between
biodiversity and the economy. These links are not ‗just‘ the generally perceived one of
the economy‘s impact on biodiversity but about the positive impact on the economy of
the existence of biodiversity and the provision of ecosystem services.
In the chapter 10 we look briefly at some of the other important links between the
economy and the environment, which were not quantifiable under the I-O framework.
These are green public procurement (GPP), the role of good quality environment in
business and residential location choices, the environment voluntary sector and
environment related insurance services, damage and rebuild costs.
55 OECD/Eurostat (1998) Eco-industries definition
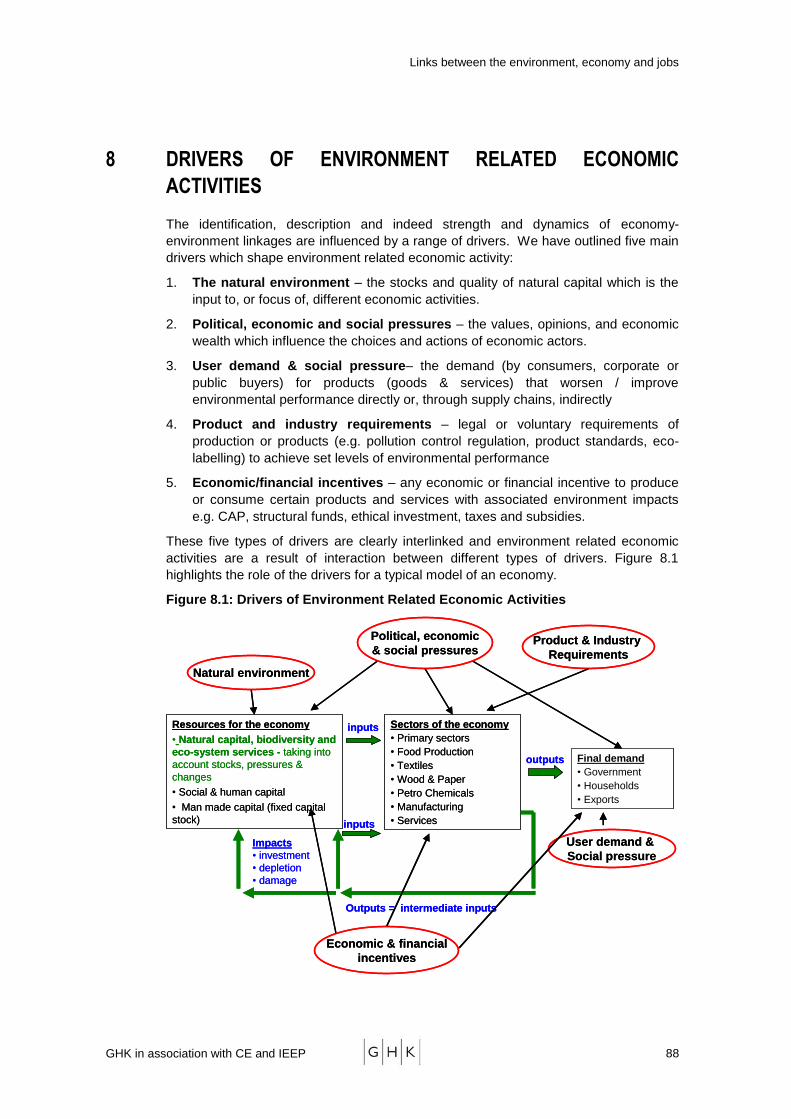
Links between the environment, economy and jobs
GHK in association with CE and IEEP 88
8 DRIVERS OF ENVIRONMENT RELATED ECONOMIC
ACTIVITIES
The identification, description and indeed strength and dynamics of economy-
environment linkages are influenced by a range of drivers. We have outlined five main
drivers which shape environment related economic activity:
1. The natural environment – the stocks and quality of natural capital which is the
input to, or focus of, different economic activities.
2. Political, economic and social pressures – the values, opinions, and economic
wealth which influence the choices and actions of economic actors.
3. User demand & social pressure– the demand (by consumers, corporate or
public buyers) for products (goods & services) that worsen / improve
environmental performance directly or, through supply chains, indirectly
4. Product and industry requirements – legal or voluntary requirements of
production or products (e.g. pollution control regulation, product standards, eco-
labelling) to achieve set levels of environmental performance
5. Economic/financial incentives – any economic or financial incentive to produce
or consume certain products and services with associated environment impacts
e.g. CAP, structural funds, ethical investment, taxes and subsidies.
These five types of drivers are clearly interlinked and environment related economic
activities are a result of interaction between different types of drivers. Figure 8.1
highlights the role of the drivers for a typical model of an economy.
Figure 8.1: Drivers of Environment Related Economic Activities
Natural environment
Sectors of the economy
• Primary sectors
• Food Production
• Textiles
• Wood & Paper
• Petro Chemicals
• Manufacturing
• Services
outputs Final demand
• Government
• Households
• Exports
Resources for the economy
• Natural capital, biodiversity and
eco-system services - taking into
account stocks, pressures &
changes
• Social & human capital
• Man made capital (fixed capital
stock)
Outputs = intermediate inputs
Impacts
• investment
• depletion
• damage
inputs
inputs
User demand &
Social pressure
Political, economic
& social pressuresProduct & Industry
Requirements
Economic & financial
incentives
Links between the environment, economy and jobs
GHK in association with CE and IEEP 89
All relevant economic activities use and/or impact on environmental resources (natural
capital). Some activities use the environment as an input, while others are concerned
with managing resources or environmental risks. For activities to exist there must be
final / user demand. In general terms user demand is affected by the other types of
drivers: political, economic and social pressures (i.e. values, perceptions, and wealth),
requirements (i.e. the types of products and services available), and economic and
financial incentives (i.e. the price of products and services). The political, economic
and social pressures also influence the way requirements are set and where economic
and financial incentives are targeted, as well as the way the natural environment is
valued and reflected in policy decisions.
Finally, the way we choose to use, regulate, and financially support environment
related activities, products and services has effects on the natural environment. In the
worst case it reduces stocks and quality of the environment (e.g. over fishing, use of
fossil fuels), and in the better case it contributes to a minimising the negative impacts
on the environment and the preservation of stocks and resources (e.g. organic farming,
pollution control, energy efficiency products). In the latter case, it should however be
noted that some activities which make a positive contribution to the environment, are
actually driven by the existence of negative impacts on the environment, such as
pollution.
These drivers indicate the complexity of the relationships between the environment
and the economy. They also provide some appreciation of the influences that
environmental policy can have on economic activity and hence on the use of
environmental resources and associated environmental quality. These drivers
therefore help in establishing policy scenarios and the assessment of their potential
economic impacts.
Details on the drivers and how they interact with the 10 environmental activity domains
is presented in Annex B.
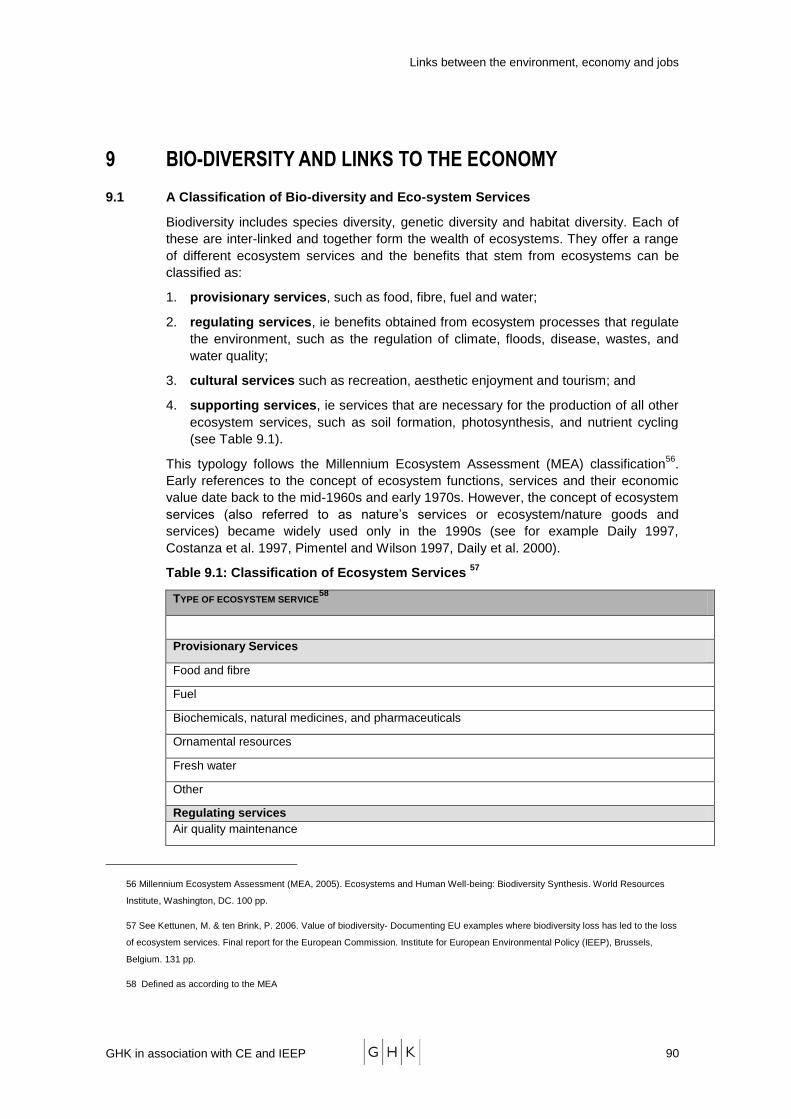
Links between the environment, economy and jobs
GHK in association with CE and IEEP 90
9 BIO-DIVERSITY AND LINKS TO THE ECONOMY
9.1 A Classification of Bio-diversity and Eco-system Services
Biodiversity includes species diversity, genetic diversity and habitat diversity. Each of
these are inter-linked and together form the wealth of ecosystems. They offer a range
of different ecosystem services and the benefits that stem from ecosystems can be
classified as:
1. provisionary services, such as food, fibre, fuel and water;
2. regulating services, ie benefits obtained from ecosystem processes that regulate
the environment, such as the regulation of climate, floods, disease, wastes, and
water quality;
3. cultural services such as recreation, aesthetic enjoyment and tourism; and
4. supporting services, ie services that are necessary for the production of all other
ecosystem services, such as soil formation, photosynthesis, and nutrient cycling
(see Table 9.1).
This typology follows the Millennium Ecosystem Assessment (MEA) classification56
.
Early references to the concept of ecosystem functions, services and their economic
value date back to the mid-1960s and early 1970s. However, the concept of ecosystem
services (also referred to as nature‘s services or ecosystem/nature goods and
services) became widely used only in the 1990s (see for example Daily 1997,
Costanza et al. 1997, Pimentel and Wilson 1997, Daily et al. 2000).
Table 9.1: Classification of Ecosystem Services 57
TYPE OF ECOSYSTEM SERVICE58
Provisionary Services
Food and fibre
Fuel
Biochemicals, natural medicines, and pharmaceuticals
Ornamental resources
Fresh water
Other
Regulating services
Air quality maintenance
56 Millennium Ecosystem Assessment (MEA, 2005). Ecosystems and Human Well-being: Biodiversity Synthesis. World Resources
Institute, Washington, DC. 100 pp.
57 See Kettunen, M. & ten Brink, P. 2006. Value of biodiversity- Documenting EU examples where biodiversity loss has led to the loss
of ecosystem services. Final report for the European Commission. Institute for European Environmental Policy (IEEP), Brussels,
Belgium. 131 pp.
58 Defined as according to the MEA

Links between the environment, economy and jobs
GHK in association with CE and IEEP 91
Climate regulation (eg temperature and precipitation, carbon storage)
Water regulation (e.g. flood prevention, timing and magnitude of runoff, aquifer recharge)
Erosion control
Water purification and waste management
Regulation of human diseases
Biological control (e.g. loss of natural predator of pests)
Pollination
Storm protection (damage by hurricanes or large waves)
Fire resistance (change of vegetation cover lead increased fire susceptibility)
Avalanche protection
Other
Cultural services
Cultural diversity, spiritual and religious values, educational values, inspiration, aesthetic values,
social relations, sense of place and identity
Cultural heritage values
Recreation and ecotourism
Other
Supporting services
Primary production
Nutrient cycling
Soil formation
Other
9.2 The Main Linkages between Ecosystem Services and the Economy
Ecosystem services provide economic benefits which can be reflected in the national
accounts. For example the provisionary and cultural services can be directly quantified
in economic terms due to the existence of a market for these products and services.
On the other hand vital environmental regulating services such as flood protection,
carbon storage and water purification can only be valued indirectly by comparing the
cost of man-made interventions performing the same service. Moreover, other services
such as pollination, climate control and the supporting services are extremely precious
and can only to a very limited extent be valued in economic terms. Thus ecosystem
services are important to the economy and the links between ecosystem services and
the economy can be classified in three main ways:
1. Ecosystem services providing inputs into production activities – this can
range from the water, soil, fuel to the minerals, biochemicals, natural medicines
and pharmaceuticals. We have captured this link as much as possible in the
standardised version of the study.
2. Ecosystem services and products of extreme importance to the economy
but not fully valued in economic terms – mainly regulating services such as
pollination, climate regulation, water purification, etc. For example, Costa Rica
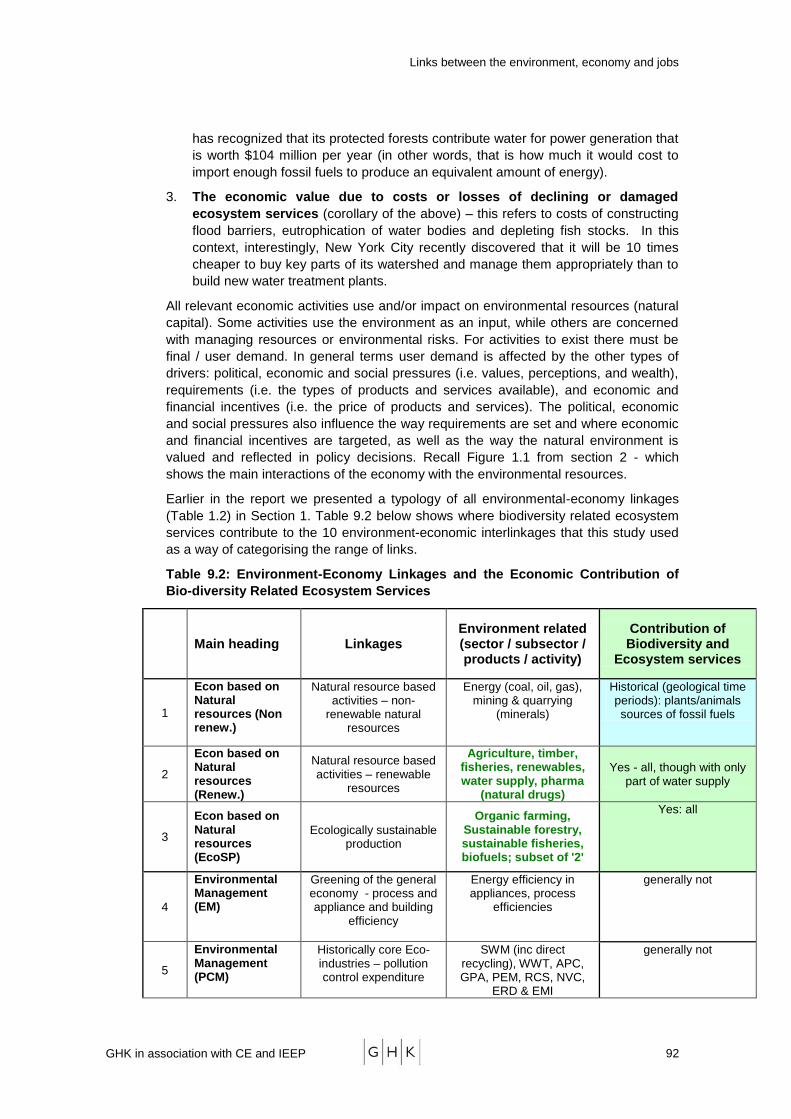
Links between the environment, economy and jobs
GHK in association with CE and IEEP 92
has recognized that its protected forests contribute water for power generation that
is worth $104 million per year (in other words, that is how much it would cost to
import enough fossil fuels to produce an equivalent amount of energy).
3. The economic value due to costs or losses of declining or damaged
ecosystem services (corollary of the above) – this refers to costs of constructing
flood barriers, eutrophication of water bodies and depleting fish stocks. In this
context, interestingly, New York City recently discovered that it will be 10 times
cheaper to buy key parts of its watershed and manage them appropriately than to
build new water treatment plants.
All relevant economic activities use and/or impact on environmental resources (natural
capital). Some activities use the environment as an input, while others are concerned
with managing resources or environmental risks. For activities to exist there must be
final / user demand. In general terms user demand is affected by the other types of
drivers: political, economic and social pressures (i.e. values, perceptions, and wealth),
requirements (i.e. the types of products and services available), and economic and
financial incentives (i.e. the price of products and services). The political, economic
and social pressures also influence the way requirements are set and where economic
and financial incentives are targeted, as well as the way the natural environment is
valued and reflected in policy decisions. Recall Figure 1.1 from section 2 - which
shows the main interactions of the economy with the environmental resources.
Earlier in the report we presented a typology of all environmental-economy linkages
(Table 1.2) in Section 1. Table 9.2 below shows where biodiversity related ecosystem
services contribute to the 10 environment-economic interlinkages that this study used
as a way of categorising the range of links.
Table 9.2: Environment-Economy Linkages and the Economic Contribution of
Bio-diversity Related Ecosystem Services
Main heading Linkages Environment related (sector / subsector / products / activity)
Contribution of Biodiversity and
Ecosystem services
1
Econ based on Natural resources (Non renew.)
Natural resource based activities – non-
renewable natural resources
Energy (coal, oil, gas), mining & quarrying
(minerals)
Historical (geological time periods): plants/animals sources of fossil fuels
2
Econ based on Natural resources (Renew.)
Natural resource based activities – renewable
resources
Agriculture, timber, fisheries, renewables, water supply, pharma
(natural drugs)
Yes - all, though with only part of water supply
3
Econ based on Natural resources (EcoSP)
Ecologically sustainable production
Organic farming, Sustainable forestry, sustainable fisheries, biofuels; subset of '2'
Yes: all
4
Environmental Management (EM)
Greening of the general economy - process and appliance and building
efficiency
Energy efficiency in appliances, process
efficiencies
generally not
5
Environmental Management (PCM)
Historically core Eco-industries – pollution control expenditure
SWM (inc direct recycling), WWT, APC, GPA, PEM, RCS, NVC,
ERD & EMI
generally not

Links between the environment, economy and jobs
GHK in association with CE and IEEP 93
6
Environmental Management (RM)
History core- eco-industries – natural
resource management
Recycled Materials, Nature protection /
conservation, natural risk mgmt.
Yes for nature protection, conservation and natural
risk management
7
Environmental Management (GP)
Green products - green procurement
Eco-labels, sustainable construction (e.g. passive houses inc. heat/energy saving and mgmt), Zero
Emission Vehicles, ethical investment funds
generally not (some relatively minor potential
via sustainable construction)
8
Environmental Quality (EQ)
Economic activities dependent on
environmental quality
Tourism; recreation; livelihood; culture value
and identity, health
Yes
9
Environmental Quality (ERT)
Economic activities dependent on
environmental quality - subset
Env. Related Tourism (ERT), inward
investment, house prices; subset of 8
Yes
10
Environmental Quality (NRM)
Natural risk management (NRM) - Avalanches, droughts,
floods, fire, earthquakes, etc
Natural risk management (residual
not captured in 6: Insurance, protection of
assets, rebuilding)
Yes
Biodiversity and ecosystem services are directly important for linkages 1 to 5 of the 10
areas, partly for nature protection / conservation, natural risk mgmt areas, and within a
geological timeframe for environmental management as fossil fuels come from
biodiversity - plants and animals. Note that in the areas where biodiversity ecosystem
services are not valuable inputs, the activities in these areas can help mitigate potential
negative effects on biodiversity and associate ecosystem services. Hence in all areas
there are direct or indirect connections.
To discuss the links further, biodiversity contributions to the industrial sectors of the
economy were explored (Table 9.3). This is not an in-depth investigation but an
exercise to highlight the biodiversity links for each sector.
The importance of the link between the sector and the environment is presented to
show the level of significance. ‗>50%‘ underlines that most of the activity in the sector
is related to the environment. Where the link is significant and substantial, but not
determining the nature of the sector, the value of ‗<25%‘ is used. Where there is
occasional, or local significance (for example for a discrete set of applications in the
sector), but that this remains focused, the value of ‗<5%‘ is used. Where there is little
importance at all, ‗<1%‘ is used. In some sectors there is a fast changing link – eg
bioplastics within plastics – here a label ‗F+‘ is used to indicate that future growth is
expected. The numbers should be seen as indicators of significance rather than as
empirical analysis based results; they relate more to expert judgment by the team,
backed up by some analysis of the sectors by a short literature review. The Terms of
Reference did not ask that such an analysis be done, but the team considered it useful
to clarify the links and effectively clarify a possible future area for analysis.
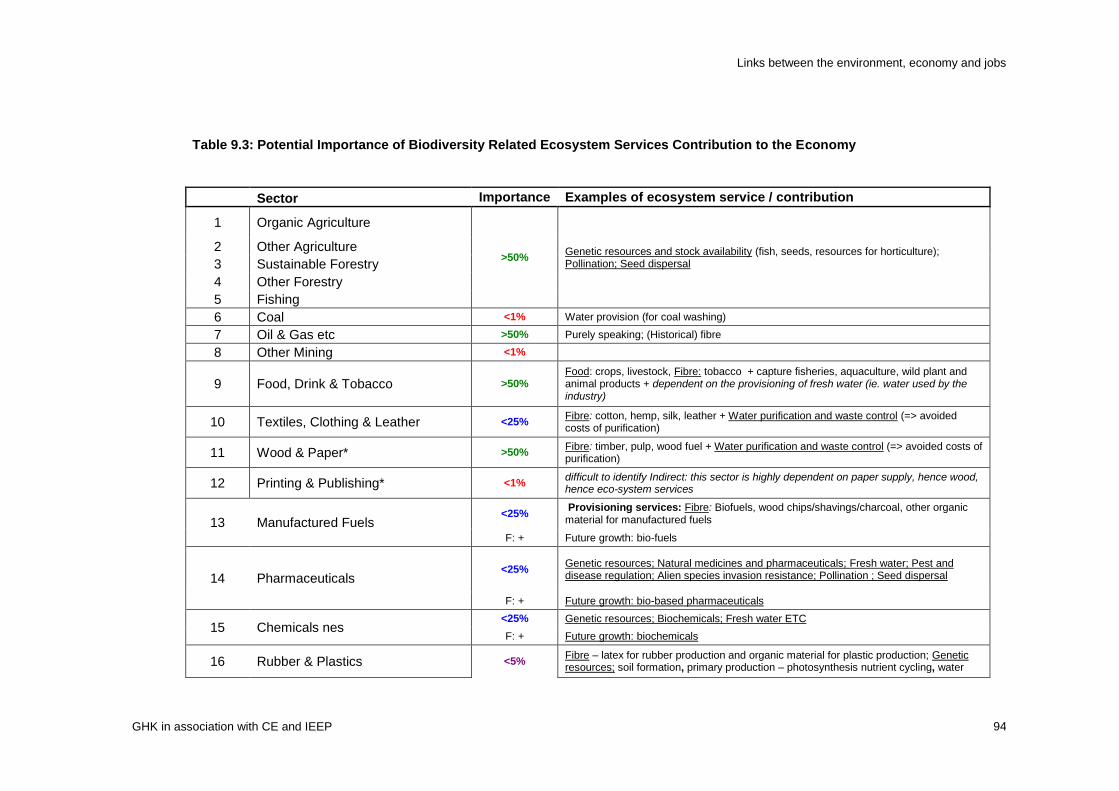
Links between the environment, economy and jobs
GHK in association with CE and IEEP 94
Table 9.3: Potential Importance of Biodiversity Related Ecosystem Services Contribution to the Economy
Sector Importance Examples of ecosystem service / contribution
1 Organic Agriculture
>50% Genetic resources and stock availability (fish, seeds, resources for horticulture); Pollination; Seed dispersal
2 Other Agriculture
3 Sustainable Forestry
4 Other Forestry
5 Fishing
6 Coal <1% Water provision (for coal washing)
7 Oil & Gas etc >50% Purely speaking; (Historical) fibre
8 Other Mining <1%
9 Food, Drink & Tobacco >50% Food: crops, livestock, Fibre: tobacco + capture fisheries, aquaculture, wild plant and animal products + dependent on the provisioning of fresh water (ie. water used by the industry)
10 Textiles, Clothing & Leather <25% Fibre: cotton, hemp, silk, leather + Water purification and waste control (=> avoided costs of purification)
11 Wood & Paper* >50% Fibre: timber, pulp, wood fuel + Water purification and waste control (=> avoided costs of purification)
12 Printing & Publishing* <1% difficult to identify Indirect: this sector is highly dependent on paper supply, hence wood, hence eco-system services
13 Manufactured Fuels <25%
Provisioning services: Fibre: Biofuels, wood chips/shavings/charcoal, other organic material for manufactured fuels
F: + Future growth: bio-fuels
14 Pharmaceuticals <25%
Genetic resources; Natural medicines and pharmaceuticals; Fresh water; Pest and disease regulation; Alien species invasion resistance; Pollination ; Seed dispersal
F: + Future growth: bio-based pharmaceuticals
15 Chemicals nes <25% Genetic resources; Biochemicals; Fresh water ETC
F: + Future growth: biochemicals
16 Rubber & Plastics <5% Fibre – latex for rubber production and organic material for plastic production; Genetic resources; soil formation, primary production – photosynthesis nutrient cycling, water

Links between the environment, economy and jobs
GHK in association with CE and IEEP 95
F: + cycling
17 Non-Metallic Mineral Products <5% Fossil-based sulphur deposits; Role of bacteria etc. in non-metal mineral products formation (e.g. sulphur).
18 Basic Metals
<1% Water purification and waste control (=> avoided costs of purification)
19 Metal Goods
20 Mechanical Engineering
21 Electronics
22 Electrical Engineering & Instruments
23 Motor Vehicles
24 Other Transport Equipment
25 Manufacturing nes
26 Renewable electricity >50% Fibre – biofuels (electricity from biofuels); wood chips, wind, solar
27 Non-renewable electricity <5% Fresh water used by the sector (e.g. water for cooling, hydropower);
28 Gas Supply <1% Biodiversity related ecosystem services affect this sector through the (bio) gas production sector
29 Water Supply >50% Fresh water supply, cycling, regulation and purification and Natural hazard regulation: flood protection / mitigation (=> effects on water supply)
30 Construction <5% Erosion regulation; Natural hazard regulation:
31 Distribution <1% Natural hazard regulation (e.g. flooding)
32 Retailing <5% Food: Ornamental resources; merchandise linked to ecotourism
33 Hotels & Catering <25% Food; Fresh water; Air quality control ; educational values, aesthetic values, cultural heritage values, recreation and ecotourism
34 Land Transport etc <1% Natural hazard regulation: flood and avalanche protection / mitigation,
35 Water Transport <5% Natural hazard regulation: flood protection / mitigation (=> stable conditions, minimising risks to water transport)
36 Air Transport <1% difficult to identify
37 Communications <1% Communication related to natural hazard monitoring and emergency response.
38 Banking & Finance <1% Liabilities associated with impacts on biodiversity and eco-system services
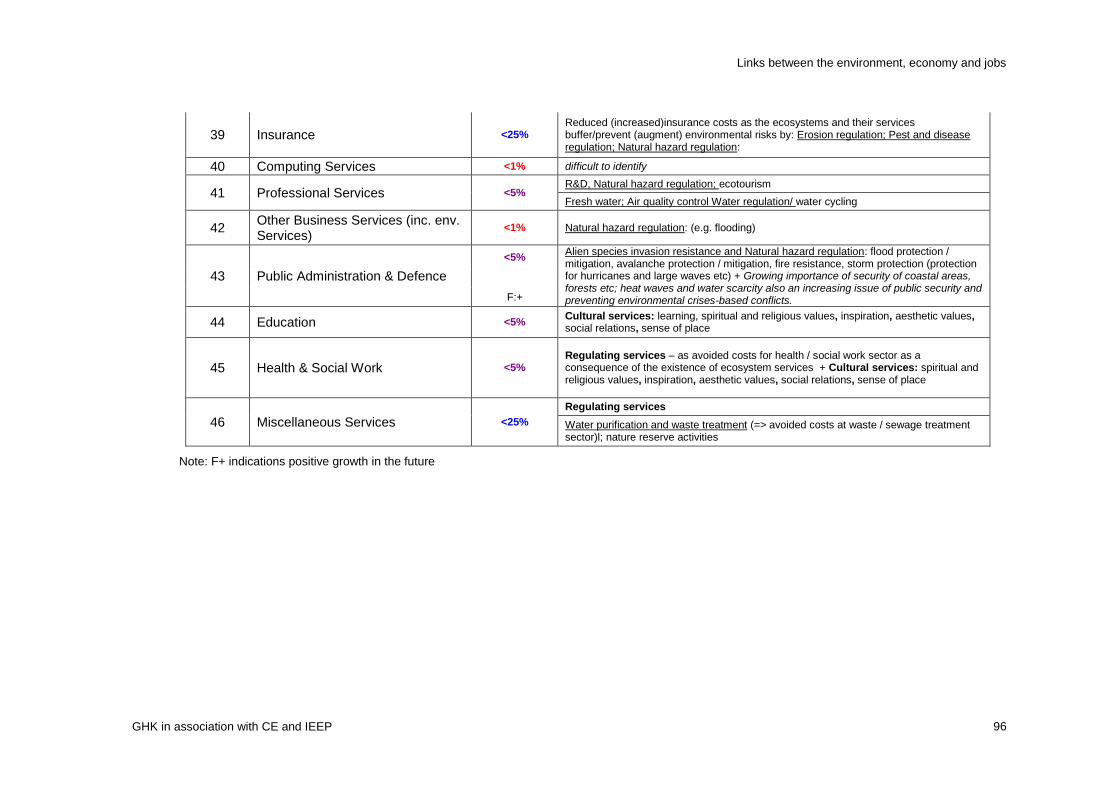
Links between the environment, economy and jobs
GHK in association with CE and IEEP 96
39 Insurance <25% Reduced (increased)insurance costs as the ecosystems and their services buffer/prevent (augment) environmental risks by: Erosion regulation; Pest and disease regulation; Natural hazard regulation:
40 Computing Services <1% difficult to identify
41 Professional Services <5% R&D, Natural hazard regulation; ecotourism
Fresh water; Air quality control Water regulation/ water cycling
42 Other Business Services (inc. env. Services)
<1% Natural hazard regulation: (e.g. flooding)
43 Public Administration & Defence
<5% Alien species invasion resistance and Natural hazard regulation: flood protection / mitigation, avalanche protection / mitigation, fire resistance, storm protection (protection for hurricanes and large waves etc) + Growing importance of security of coastal areas, forests etc; heat waves and water scarcity also an increasing issue of public security and preventing environmental crises-based conflicts.
F:+
44 Education <5% Cultural services: learning, spiritual and religious values, inspiration, aesthetic values, social relations, sense of place
45 Health & Social Work <5% Regulating services – as avoided costs for health / social work sector as a consequence of the existence of ecosystem services + Cultural services: spiritual and religious values, inspiration, aesthetic values, social relations, sense of place
46 Miscellaneous Services <25%
Regulating services
Water purification and waste treatment (=> avoided costs at waste / sewage treatment sector)l; nature reserve activities
Note: F+ indications positive growth in the future

Links between the environment, economy and jobs
GHK in association with CE and IEEP 97
More details on the environmental links for each of the 46 sectors in Table 9.3 is given
in Annex H.
The sectors where biodiversity and ecosystem services play a predominant role
include: agriculture (e.g. fisheries, aquaculture, and forestry), food, drink & tobacco,
wood & paper, and water supply. Here the genetic resources and stock availability are
clearly vital, as are biodiversity‘s role in pollination and seed dispersal and the
ecosystem contributions to water and soil quality. Water purification is an important
ecosystem service and can significantly help reduce costs of pre treatment of water.
See Table 9.5 for economic benefits of water purification.
Biodiversity and ecosystem services also play a very significant role in the following
sectors: textiles, clothing. & leather, manufactured fuels, pharmaceuticals, chemicals,
hotels & catering, insurance and miscellaneous services (e.g. collection and treatment
of waste/sewage, recreation, culture, nature reserve activities, sports, artistic /
literature creation etc.).
It is also valuable to highlight that for some of these issues, the role is becoming
increasingly important, notably for manufactured fuels, pharmaceuticals, chemicals,
and rubber & plastics (as shown in Table 9.3). This is part of the growing move
towards biological based goods, e.g. biofuels, biologically based pharmaceuticals,
biochemists and bio-plastics. Those that speak of ‗peak oil‘ foresee an important
paradigm shift / transition from fossil fuel base in these sectors, to renewable biological
base that is already starting now.
In the following sectors, ecosystem services can play an occasionally important role:
non-metal mineral product, electricity, construction, retailing, water transport,
professional services (e.g. R&D), public administration & defence (e.g. defence, public
security, fire services), education, and health & social work.
This list of sectors where biodiversity plays a predominant and significant role is
greater than half of the sectors of the economy, underlining that the link between
biodiversity and the economy is critical sustainable economic growth.
Furthermore, economic activity can lead to losses in biodiversity and subsequently a
loss of ecosystem services, which in turn would affect the economy. In short, economic
activity can compromise other economic activities through negative knock on effects.
There are some important issues to consider with regards to biodiversity and
ecosystem services with the economy:
There is often an important non-payment for services and hence implicit subsidies
to the economy. Resources can be under priced as can services (e.g. high value
biodiversity). Table 9.4 shows to what extent the market values biodiversity goods
and eco-system services. This table demonstrates that national accounts (and
hence GDP values), and the associated input-output models do not take into
account or represent the range of values from the different ecosystem services
provided by biodiversity.
There is often no liability for negative impacts on biodiversity.
There are many economy-economy trade-offs that arise via the interlinkages to
biodiversity and ecosystem services. This raises the question as to whether
decision making needs upgrading59
.
59 For more on the integration of these concerns into regional development assessments , see ten Brink et al (2007)
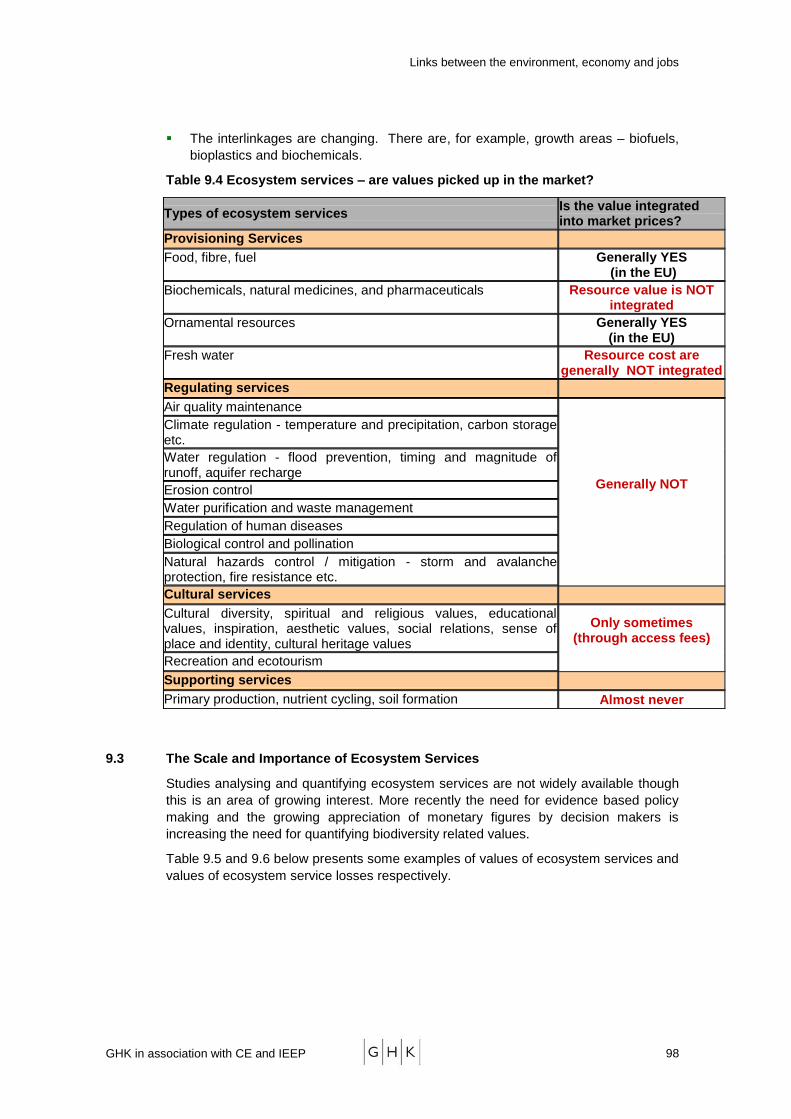
Links between the environment, economy and jobs
GHK in association with CE and IEEP 98
The interlinkages are changing. There are, for example, growth areas – biofuels,
bioplastics and biochemicals.
Table 9.4 Ecosystem services – are values picked up in the market?
Types of ecosystem services Is the value integrated into market prices?
Provisioning Services
Food, fibre, fuel Generally YES (in the EU)
Biochemicals, natural medicines, and pharmaceuticals Resource value is NOT integrated
Ornamental resources Generally YES (in the EU)
Fresh water Resource cost are generally NOT integrated
Regulating services
Air quality maintenance
Generally NOT
Climate regulation - temperature and precipitation, carbon storage etc.
Water regulation - flood prevention, timing and magnitude of runoff, aquifer recharge
Erosion control
Water purification and waste management
Regulation of human diseases
Biological control and pollination
Natural hazards control / mitigation - storm and avalanche protection, fire resistance etc.
Cultural services
Cultural diversity, spiritual and religious values, educational values, inspiration, aesthetic values, social relations, sense of place and identity, cultural heritage values
Only sometimes (through access fees)
Recreation and ecotourism
Supporting services
Primary production, nutrient cycling, soil formation Almost never
9.3 The Scale and Importance of Ecosystem Services
Studies analysing and quantifying ecosystem services are not widely available though
this is an area of growing interest. More recently the need for evidence based policy
making and the growing appreciation of monetary figures by decision makers is
increasing the need for quantifying biodiversity related values.
Table 9.5 and 9.6 below presents some examples of values of ecosystem services and
values of ecosystem service losses respectively.
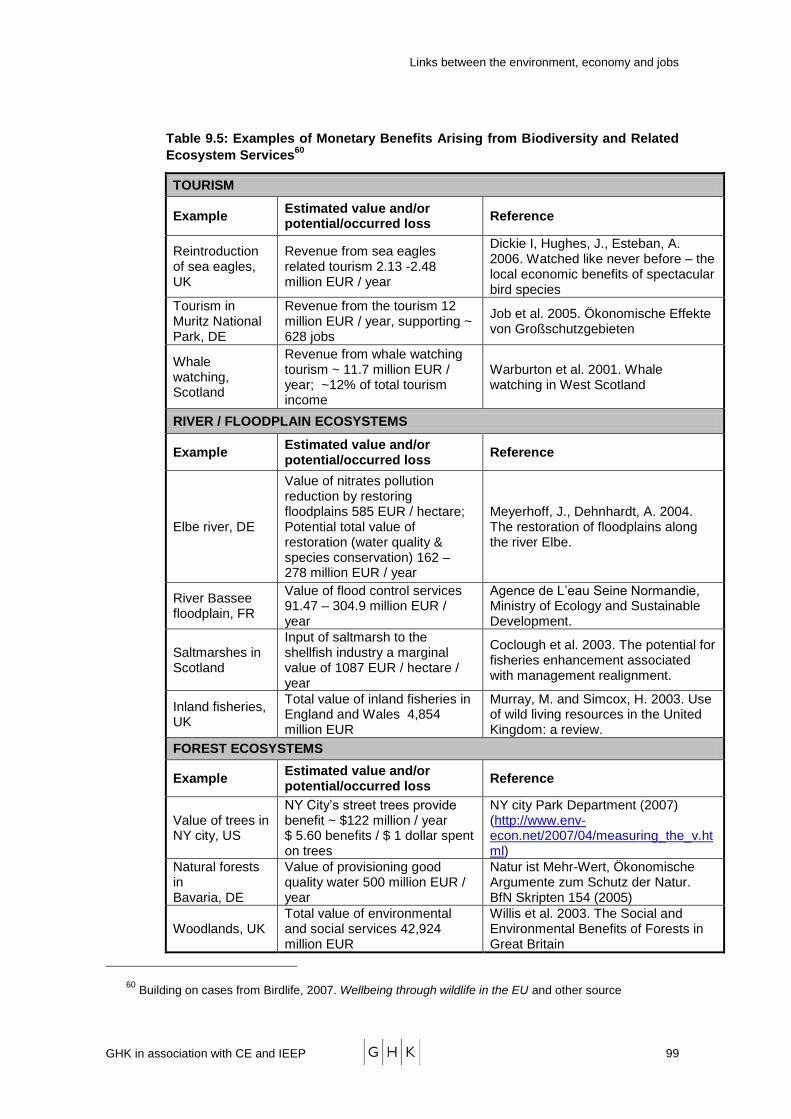
Links between the environment, economy and jobs
GHK in association with CE and IEEP 99
Table 9.5: Examples of Monetary Benefits Arising from Biodiversity and Related
Ecosystem Services60
TOURISM
Example Estimated value and/or potential/occurred loss
Reference
Reintroduction of sea eagles, UK
Revenue from sea eagles related tourism 2.13 -2.48 million EUR / year
Dickie I, Hughes, J., Esteban, A. 2006. Watched like never before – the local economic benefits of spectacular bird species
Tourism in Muritz National Park, DE
Revenue from the tourism 12 million EUR / year, supporting ~ 628 jobs
Job et al. 2005. Ökonomische Effekte von Großschutzgebieten
Whale watching, Scotland
Revenue from whale watching tourism ~ 11.7 million EUR / year; ~12% of total tourism income
Warburton et al. 2001. Whale watching in West Scotland
RIVER / FLOODPLAIN ECOSYSTEMS
Example Estimated value and/or potential/occurred loss
Reference
Elbe river, DE
Value of nitrates pollution reduction by restoring floodplains 585 EUR / hectare; Potential total value of restoration (water quality & species conservation) 162 – 278 million EUR / year
Meyerhoff, J., Dehnhardt, A. 2004. The restoration of floodplains along the river Elbe.
River Bassee floodplain, FR
Value of flood control services 91.47 – 304.9 million EUR / year
Agence de L‘eau Seine Normandie, Ministry of Ecology and Sustainable Development.
Saltmarshes in Scotland
Input of saltmarsh to the shellfish industry a marginal value of 1087 EUR / hectare / year
Coclough et al. 2003. The potential for fisheries enhancement associated with management realignment.
Inland fisheries, UK
Total value of inland fisheries in England and Wales 4,854 million EUR
Murray, M. and Simcox, H. 2003. Use of wild living resources in the United Kingdom: a review.
FOREST ECOSYSTEMS
Example Estimated value and/or potential/occurred loss
Reference
Value of trees in NY city, US
NY City‘s street trees provide benefit ~ $122 million / year $ 5.60 benefits / $ 1 dollar spent on trees
NY city Park Department (2007) (http://www.env-econ.net/2007/04/measuring_the_v.html)
Natural forests in Bavaria, DE
Value of provisioning good quality water 500 million EUR / year
Natur ist Mehr-Wert, Ökonomische Argumente zum Schutz der Natur. BfN Skripten 154 (2005)
Woodlands, UK Total value of environmental and social services 42,924 million EUR
Willis et al. 2003. The Social and Environmental Benefits of Forests in Great Britain
60 Building on cases from Birdlife, 2007. Wellbeing through wildlife in the EU and other source
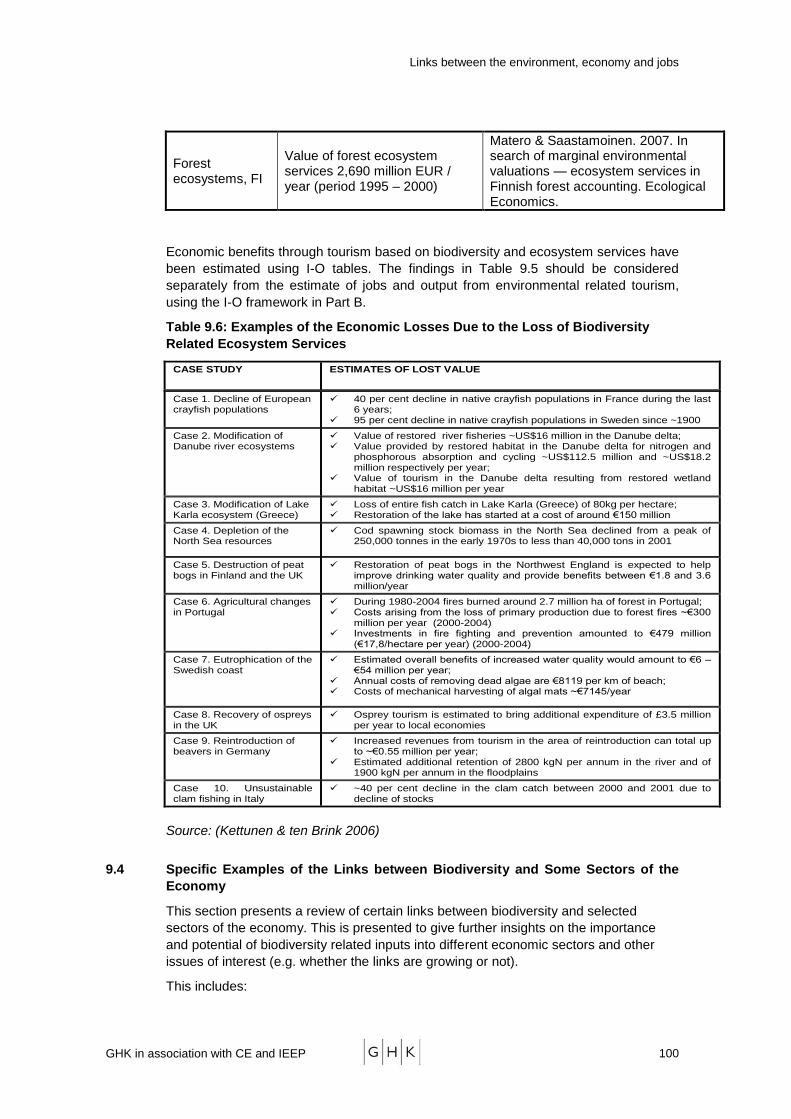
Links between the environment, economy and jobs
GHK in association with CE and IEEP 100
Forest ecosystems, FI
Value of forest ecosystem services 2,690 million EUR / year (period 1995 – 2000)
Matero & Saastamoinen. 2007. In search of marginal environmental valuations — ecosystem services in Finnish forest accounting. Ecological Economics.
Economic benefits through tourism based on biodiversity and ecosystem services have
been estimated using I-O tables. The findings in Table 9.5 should be considered
separately from the estimate of jobs and output from environmental related tourism,
using the I-O framework in Part B.
Table 9.6: Examples of the Economic Losses Due to the Loss of Biodiversity
Related Ecosystem Services
CASE STUDY ESTIMATES OF LOST VALUE
Case 1. Decline of European crayfish populations
40 per cent decline in native crayfish populations in France during the last 6 years;
95 per cent decline in native crayfish populations in Sweden since ~1900
Case 2. Modification of Danube river ecosystems
Value of restored river fisheries ~US$16 million in the Danube delta; Value provided by restored habitat in the Danube delta for nitrogen and
phosphorous absorption and cycling ~US$112.5 million and ~US$18.2 million respectively per year;
Value of tourism in the Danube delta resulting from restored wetland habitat ~US$16 million per year
Case 3. Modification of Lake Karla ecosystem (Greece)
Loss of entire fish catch in Lake Karla (Greece) of 80kg per hectare; Restoration of the lake has started at a cost of around €150 million
Case 4. Depletion of the North Sea resources
Cod spawning stock biomass in the North Sea declined from a peak of 250,000 tonnes in the early 1970s to less than 40,000 tons in 2001
Case 5. Destruction of peat bogs in Finland and the UK
Restoration of peat bogs in the Northwest England is expected to help improve drinking water quality and provide benefits between €1.8 and 3.6 million/year
Case 6. Agricultural changes in Portugal
During 1980-2004 fires burned around 2.7 million ha of forest in Portugal; Costs arising from the loss of primary production due to forest fires ~€300
million per year (2000-2004) Investments in fire fighting and prevention amounted to €479 million
(€17,8/hectare per year) (2000-2004)
Case 7. Eutrophication of the Swedish coast
Estimated overall benefits of increased water quality would amount to €6 – €54 million per year;
Annual costs of removing dead algae are €8119 per km of beach; Costs of mechanical harvesting of algal mats ~€7145/year
Case 8. Recovery of ospreys in the UK
Osprey tourism is estimated to bring additional expenditure of £3.5 million per year to local economies
Case 9. Reintroduction of beavers in Germany
Increased revenues from tourism in the area of reintroduction can total up to ~€0.55 million per year;
Estimated additional retention of 2800 kgN per annum in the river and of 1900 kgN per annum in the floodplains
Case 10. Unsustainable clam fishing in Italy
~40 per cent decline in the clam catch between 2000 and 2001 due to decline of stocks
Source: (Kettunen & ten Brink 2006)
9.4 Specific Examples of the Links between Biodiversity and Some Sectors of the
Economy
This section presents a review of certain links between biodiversity and selected
sectors of the economy. This is presented to give further insights on the importance
and potential of biodiversity related inputs into different economic sectors and other
issues of interest (e.g. whether the links are growing or not).
This includes:

Links between the environment, economy and jobs
GHK in association with CE and IEEP 101
Biodiversity, agriculture and the dangers of lack of genetic diversity.
Biomedicine; building on genetic wealth
Organic sources of plastics
9.4.1 Agriculture and Genetic Diversity
Currently the agriculture sector of the economy is based on a tiny fraction of the
available plant varieties. The world‘s food supply depends on about 150 plant species
(FAO), while there are 250,000 plant varieties available for agriculture, but less than
3% in use today (FAO). Furthermore, more than half of the world‘s food energy comes
from a limited number of varieties of three ―mega-crops‖: rice, wheat, and maize.
(FAO). Note also that 80% of tomatoes and 92% of lettuce varieties have been lost
during the 20th century. (Worldwatch Institute)
The loss of varieties has for the moment not had a major influence on agricultural
output at a global scale. However, there are dangers of a loss of genetic diversity to
agriculture and also a danger of basing agriculture on only a minority of crop varieties.
Examples of problems include:
In Ireland, in 1845, a mildew epidemic destroyed the entire potato crop for two
consecutive years. Because potatoes were the basis of the local diet and there
was only one variety on the island, over one million Irish died and another one
million emigrated to North America to escape starvation
The only species of banana widely used and consumed is the Cavendish. The
bananas are thus deprived of their genetic dynamism. When a bacteria, virus,
or insect targets the Cavendish as a host, the results are explosive because
normal genetic variation is not there. Hence ever increasing quantities of
chemicals inputs (an average of 280 different pesticides are currently
authorized in banana cultivation) and significant environmental damage in
terms of soil erosion, water pollution and land contamination.
The existence of a range of regional or local varieties can be valuable for the global
markets. For example Ethiopian barley is said to be worth $150million in the United
States each year.
9.4.2 Biomedicine
Ten of the twenty-five most sold medicines are made from natural resources
(Greenpeace). Furthermore, around 80% of the world's population is at least partly
dependent upon traditional medicine and medicinal plants to treat their ills. This
demonstrates the importance and the biodiversity based resource base in this sector
and its market value. In 1990 the annual world market value of medicinal plants alone
was estimated at $43 billion.
Specific noteworthy examples of valuable bio-medicines include:
Pau D'Arco, a medicinal plant from Latin America, which has long been used
to combat malaria and cancers, has a market value in the North of $200 million
a year.
The rosy periwinkle, for example, "a plant vital to childhood leukaemia
treatment, originated in, and has long been used by healers in Madagascar―.
A Chinese herb, Artemisia annua, is a promising new weapon in the fight
against malaria.

Links between the environment, economy and jobs
GHK in association with CE and IEEP 102
The Pacific Yew was considered a trash tee until taxol, a compound found in
its bark, was discovered to be a powerful drug against ovarian, lung and other
cancers.
The bacterium living in the Yellowstone hot springs might have seemed quite
worthless before it was discovered to have an enzyme that drives the
polymerase chain reaction, a biochemical process that won the Nobel Prize in
1993 and that is now responsible for billions of dollars worth of economic
activity annually.
9.4.3 Plastics
Plastics, with their current global consumption of more than 200 million tonnes (EU
approx. 40 million tonnes) and annual growth of approximately 5%, represent the
largest field of application for crude oil outside the energy and transport sectors. With
the oil price increase it is becoming increasingly important and pressing for this
significant industry branch (worth 200 billion euros in all sectors of Europe) to utilise
alternative raw materials, hence the renewed interest for bioplastics. Companies see in
this new raw material a combination of new market opportunities. National or regional
interests served by bioplastics can be manifold and differ substantially at present: in
the US, resource security and resource utilisation are paramount; in Japan, a strong
drive towards products with green credentials; in Europe, resource utilisation, reduction
of GHGs, and compostability.
Today, bioplastics development is just beginning. The European bioplastics
association estimates that their market share in Europe is currently less than 1%
(approximately 50,000 tonnes in 2005)61
. The European countries with the highest
consumption are Germany, England, France, Italy and the Netherlands. Bioplastics are
also increasingly being used in individual applications in Belgium, Norway, Austria,
Spain and Switzerland.
The Institute for Prospective Technological Studies (IPTS) one of the seven scientific
institutes of the European Commission's Joint Research Centre (JRC) estimated the
total technical substitution potential of bioplastics is around 15.4 million tonnes for EU-
15, or 33% of the total current polymer production. In absolute terms, biobased
polymers are projected to reach a maximum of 1 million tonnes by 2010 in the scenario
without any incentive policies and measures (P&M) and max 1.75-3.0 million tonnes by
2020 in the scenarios with P&M and without P&M respectively. These (physical)
amounts are equivalent to an estimated maximum (monetary) production volume of
roughly 1-2 billion EUR by 2010 and 3-6 billion EUR by 2020. It is however highlighted
that these quantities are modest compared to the expected production increase of
petrochemical polymers by 12.5 million tonnes by 2010 and 25 million tonnes by 2020.
Thus, the market share of bio-based polymers will remain very small, in the order of 1-
2% by 2010 and 1-4% by 2020.
9.5 Conclusions
There are manifold links between biodiversity and the related ecosystem services and
the economy and these links are more pervasive and fundamental to the economy
(and society) that generally previously thought.
Table 9.7 provides an overview of the linkages in terms of the standard listing of
economic sectors. Annex H provides a more detailed analysis.
61 See http://www.european-bioplastics.org
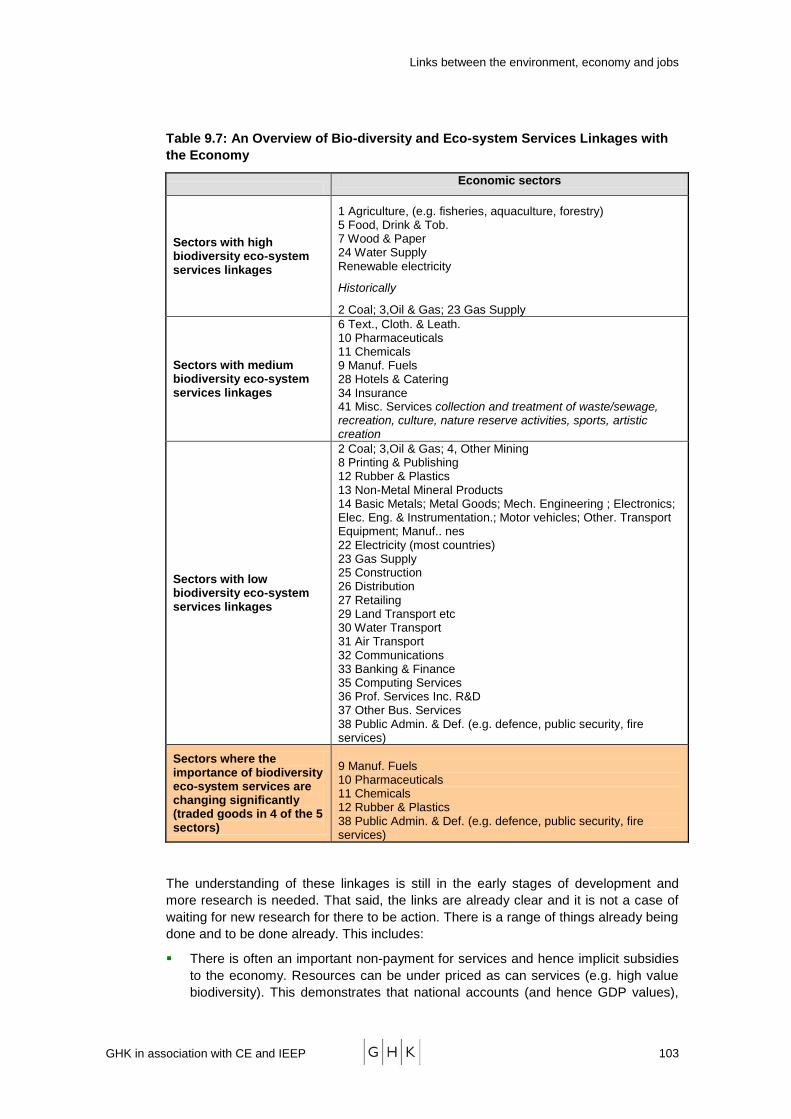
Links between the environment, economy and jobs
GHK in association with CE and IEEP 103
Table 9.7: An Overview of Bio-diversity and Eco-system Services Linkages with
the Economy
Economic sectors
Sectors with high biodiversity eco-system services linkages
1 Agriculture, (e.g. fisheries, aquaculture, forestry) 5 Food, Drink & Tob. 7 Wood & Paper 24 Water Supply Renewable electricity
Historically
2 Coal; 3,Oil & Gas; 23 Gas Supply
Sectors with medium biodiversity eco-system services linkages
6 Text., Cloth. & Leath. 10 Pharmaceuticals 11 Chemicals 9 Manuf. Fuels 28 Hotels & Catering 34 Insurance 41 Misc. Services collection and treatment of waste/sewage, recreation, culture, nature reserve activities, sports, artistic creation
Sectors with low biodiversity eco-system services linkages
2 Coal; 3,Oil & Gas; 4, Other Mining 8 Printing & Publishing 12 Rubber & Plastics 13 Non-Metal Mineral Products 14 Basic Metals; Metal Goods; Mech. Engineering ; Electronics; Elec. Eng. & Instrumentation.; Motor vehicles; Other. Transport Equipment; Manuf.. nes 22 Electricity (most countries) 23 Gas Supply 25 Construction 26 Distribution 27 Retailing 29 Land Transport etc 30 Water Transport 31 Air Transport 32 Communications 33 Banking & Finance 35 Computing Services 36 Prof. Services Inc. R&D 37 Other Bus. Services 38 Public Admin. & Def. (e.g. defence, public security, fire services)
Sectors where the importance of biodiversity eco-system services are changing significantly (traded goods in 4 of the 5 sectors)
9 Manuf. Fuels 10 Pharmaceuticals 11 Chemicals 12 Rubber & Plastics 38 Public Admin. & Def. (e.g. defence, public security, fire services)
The understanding of these linkages is still in the early stages of development and
more research is needed. That said, the links are already clear and it is not a case of
waiting for new research for there to be action. There is a range of things already being
done and to be done already. This includes:
There is often an important non-payment for services and hence implicit subsidies
to the economy. Resources can be under priced as can services (e.g. high value
biodiversity). This demonstrates that national accounts (and hence GDP values),
Links between the environment, economy and jobs
GHK in association with CE and IEEP 104
and input-output models do not take into account or represent all the range of
values from the different ecosystem services provided by biodiversity.
Full resource pricing. There is a need to move to greater use of resource pricing to
help build the value of the resource into economic decision making and make the
market work more efficiently.
Payments for environmental services: In recent years, the recognition of
environmental services and their value has led to efforts to internalise
environmental services to the functioning of markets through direct payments for
environmental services (PES). The idea of PES consists of beneficiaries of
ecosystem services making direct, contractual and conditional payments to local
landholders and users providing the services, e.g. farmers sustainably managing
the landscapes or beekeepers / honey producers for pollination of crops etc.
Existing examples on the use of PES suggest that such payments can be a
promising tool for internalising the values of biodiversity and related ecosystem
services into different economic sectors62
. However, despite the benefits PES
should not be considered as a ―standard fix‖ to all situations.
There is often no liability for negative impacts and hence the price signals in the
market do not do full justify the cost implications of inappropriate resource
allocations or loss of undervalued resources or services. There is clearly scope for
better application of EIA and liability rules
There are many economy-economy trade-offs that arise via the interlinkages to
biodiversity and ecosystem services. This raises the question as to whether
decision making needs upgrading63
and opportunities for greater use of strategic
environment assessments (SEAs) and impact assessment to take into account
issues not picked up by market prices.
The interlinkages between the economy and the environment are changing. There
are, for example, growth areas – biofuels, bioplastics and biochemicals. There is
also an ongoing loss or genetic materials and hence primary genetic materials for
biochemicals, medicines, food crops that might reduce opportunities for
development in the future.
62 Wertz-Kanounnikoff, S. 2006. Payments for environmental services – A solution for biodiversity conservation? Institut
du développement durable et des relations internationales (IDDRI) publications number 12, 16 pp.; Kettunen, M., Bassi,
S. & ten Brink, P. 2007. Complementary Financing for Environment in the Context of Accession – Innovative Resources:
A synthesis of the national level analyses from Bulgaria, Croatia, Macedonia, Turkey and Romania, IEEP, Brussels. 49 pp
+ Annexes; Kazakova, Y., Kettunen, M., Bassi, S., & ten Brink, P. 2007. Complementary Financing for Environment in the
Context of Accession – Innovative Resources: Final Project Report. A project for the European Commission
(ENV.E.3/SER/2006/0063). WWF Danube Carpathian Programme/Institute for European Environmental Policy, Brussels.
70 pp + Annexes.
63 For more on the integration of these concerns into regional development assessments , see ten Brink et al (2007)
Links between the environment, economy and jobs
GHK in association with CE and IEEP 105
10 OTHER ECONOMY-ENVIRONMENT LINKAGES
10.1 Green Public procurement (GPP)
10.1.1 Introduction and definitions
Public authorities in Europe spend about 16% of the EU's gross domestic product to
purchase goods and services per annum. If in their purchasing decisions they opt for
more environmentally friendly choices, they can have a real influence on suppliers,
stimulating the production of more sustainable goods and services – such as greener
vehicles, environment friendly buildings and office equipments and biofuels.
Through ‗green‘ public procurement (GPP) (see Box 10.1), public authorities can
reduce the impact of their procurement on human health and the environment. They
can develop niche markets and even ensure the widespread diffusion of technologies.
Box 10.1 Definitions of GPP
‗Green public procurement means that contracting authorities take into account
environmental elements when procuring goods, services or works at all stages of the
project and within the entire life-cycle of procured goods‘64
.
More specifically, a recent Commission report on GPP65
refers to GPP as ‗Green
Public Procurement is the approach by which Public Authorities integrate
environmental criteria into all stages of their procurement process, thus encouraging
the spread of environmental technologies and the development of environmentally
sound products, by seeking and choosing outcomes and solutions that have the least
possible impact on the environment throughout their whole life-cycle‘.
GPP is the focus of priority action 8 of the EU‘s environmental technology action plan
(ETAP) to encourage procurement of environmental technologies. ETAP was adopted
by the Commission on 28 January 2004, with the aim of harnessing the full potential of
environmental technologies to reduce pressures on natural resources, improve the
quality of life of European citizens and stimulate economic growth. The objectives of
ETAP are to remove the obstacles for environmental technologies, to ensure the EU
takes a leading role in developing and applying environmental technologies and to
mobilise all stakeholders in supporting these objectives. ETAP is thereby also meant to
contribute to the EU SDS and the Lisbon Strategy. The idea behind ETAP is that
technology could improve the environment while contributing to competitiveness and
growth, and could therefore truly embody the concept of sustainable development.
ETAP sets out a series of separate, though interlinked, initiatives to encourage
environmental technology.
If public procurement, which accounts for around 16 percent of the EU‘s GDP,
becomes ‗greener‘, this could in principle lead to a step change in the uptake of
environmental technologies. It is mostly up to Member States to take action in the field
of Green Public Procurement (GPP), within the framework of the EU Directives on
64 http://ec.europa.eu/environment/gpp/green_vs_sustainable.htm
65 Bouwer M, Jonk M, Berman T, Bersani R, Lusser H, Nappa V, Nissinen A, Parikka K, Szuppinger P
and Viganò C, 2006. Green Public Procurement in Europe 2006 – Conclusions and recommendations
Links between the environment, economy and jobs
GHK in association with CE and IEEP 106
public procurement and other related initiatives such as a handbook66
on GPP. Country
initiatives in the area of GPP are already in place, notably in Austria, Denmark,
Finland, the Netherlands, Sweden and the UK. The Commission has launched a
project looking to develop an EU wide comparison of GPP and establish guidelines
and a target to be able to progress the OMC (open method of coordination) type
activities.
GPP at the EU level are mainly disciplined by two Directives:
Directive 2004/18 on the coordination of procedures for the award of public works
contracts, public supply contracts and public service contracts
Directive 2004/17 on the coordination of procurement procedures of entities
operating in the water, energy, transport and postal services sector
The elements of these directives are clarified in a document proving guidelines for
public authorities and contracting parties to support the introduction and use of GPP:
European Communities, 2004: Buying green! A handbook on environmental public
procurement http://ec.europa.eu/environment/gpp/pdf/buying_green_handbook_en.pdf
In the field of Green Public Procurement, the European Court of Justice has issued
important rulings, two are:
The ‗Helsinki bus‘ case (Case C-513/99 of 17 September 2002) - see box below The ‗Wienstrom case‘ (Case C-448/01 of 4 December 2003)
Box 10.2 The ‘Helsinki bus’ case
Concordia Bus Finland, a Finnish bus company, contested the procurement procedures taken
by the Helsinki administration, with regard to a contract for renewing the city bus network.
The tender notice issued by the Finnish administration indicated that the contract would have
been awarded to the most economically advantageous tender, and included some
environmental criteria.
The tender was awarded to a rival company, HKL, which, despite not offering the lowest
price, gained additional points by fulfilling environmental criteria on low nitrogen oxide and
noise emission. Concordia argued that the award of additional points to HKL fleet was unfair
and discriminatory. It submitted that additional points had been awarded for the use of a type
of bus which only HKL was in fact able to offer.
The Case was brought to the European Court of Justice, which had to clarify the extent to
which environmental requirements can be taken into consideration at the award stage of a
public service contract, and therefore in which cases extra points should be awarded for
them.
The Court confirmed that, while awarding a contract to the tenderer who submits the
economically most advantageous offer, a contracting authority may take into consideration
ecological criteria - such as, in the case of buses, the level of nitrogen oxide emissions or the
noise level of the buses.
The Court though clarified that environmental criteria should fulfil four conditions:
66 European Commission, 2004: Buying Green! A handbook on environmental public procurement
(http://ec.europa.eu/environment/gpp/pdf/int.pdf)

Links between the environment, economy and jobs
GHK in association with CE and IEEP 107
they should be linked to the subject matter of the contract; they should not give unrestricted freedom of choice on the contracting authority, i.e.
environmental requirements must be specific and objectively quantifiable; they should be expressly mentioned in the contract documents or in the tender notice;
and they have to comply with the general EC Treaty principles.
The EU Member State approach to GPP is developing quickly. It is seen as one area
of ETAP where there is some potential for real progress. A report will be out shortly
(financed by the European Commission) that should provide details of national
approaches (see also the ETAP road maps) and size of GPP expenditures.
10.1.2 Assessing the size of GPP expenditures
According to Commission estimates67
, total public procurement amounted to 1,500
billion euros in 2002, accounting for 16.3% of EU‘s GDP.
Estimating the share of public procurements undertaken on the basis of environmental
criteria can help understand the weight of GPP on the supply of green products, and
the potential for public administration to affect the market by increasing their GPP.
A recent study on GPP68
in the EU 25 provides useful data on the percentage of
tenders including environmental criteria, although it does not allow defining the actual
outcome of the procurement – i.e. the quantity of green products actually bought.
The study reveals that some product groups are more suitable for greening than
others. For instance, professional services such as advertising, general management,
research and auditing services seldom contain environmental criteria whereas furniture
and construction often do. The study also shows that seven countries in particular are
leading the way with regards to GPP. These are Austria, Denmark, Finland, Germany,
Netherlands, Sweden and UK (therefore called the ‗Green 7‘), as they consistently
have more tenders with green criteria than other member states. A summary table
(Table 10.1) of the green tenders analysed, by product group, is provided below and in
Figure 10.1.
67 European Commission, 2004: A report on the functioning of public procurement markets in the EU:
benefits from the application of EU directives and challenges for the future
68 Bouwer M, Jonk M, Berman T, Bersani R, Lusser H, Nappa V, Nissinen A, Parikka K, Szuppinger P
and Viganò C, 2006. Green Public Procurement in Europe 2006 – Conclusions and recommendations

Links between the environment, economy and jobs
GHK in association with CE and IEEP 108
Table 10.1: Percentage of green tenders
Source: Bouwer M, Jonk M, Berman T, Bersani R, Lusser H, Nappa V, Nissinen A, Parikka K,
Szuppinger P and Viganò C, 2006. Green Public Procurement in Europe 2006 – Conclusions
and recommendations 69
69 The study can be found at: http://ec.europa.eu/environment/gpp/pdf/take_5.pdf
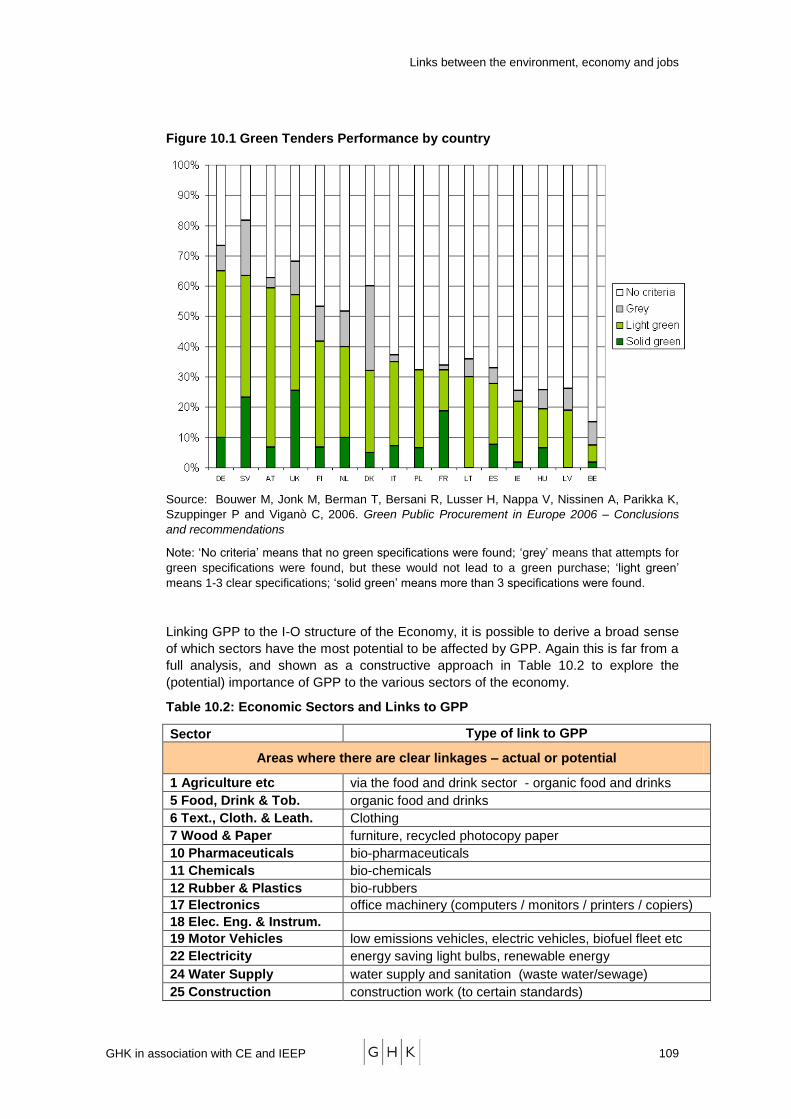
Links between the environment, economy and jobs
GHK in association with CE and IEEP 109
Figure 10.1 Green Tenders Performance by country
Source: Bouwer M, Jonk M, Berman T, Bersani R, Lusser H, Nappa V, Nissinen A, Parikka K,
Szuppinger P and Viganò C, 2006. Green Public Procurement in Europe 2006 – Conclusions
and recommendations
Note: ‗No criteria‘ means that no green specifications were found; ‗grey‘ means that attempts for
green specifications were found, but these would not lead to a green purchase; ‗light green‘
means 1-3 clear specifications; ‗solid green‘ means more than 3 specifications were found.
Linking GPP to the I-O structure of the Economy, it is possible to derive a broad sense
of which sectors have the most potential to be affected by GPP. Again this is far from a
full analysis, and shown as a constructive approach in Table 10.2 to explore the
(potential) importance of GPP to the various sectors of the economy.
Table 10.2: Economic Sectors and Links to GPP
Sector Type of link to GPP
Areas where there are clear linkages – actual or potential
1 Agriculture etc via the food and drink sector - organic food and drinks
5 Food, Drink & Tob. organic food and drinks
6 Text., Cloth. & Leath. Clothing
7 Wood & Paper furniture, recycled photocopy paper
10 Pharmaceuticals bio-pharmaceuticals
11 Chemicals bio-chemicals
12 Rubber & Plastics bio-rubbers
17 Electronics office machinery (computers / monitors / printers / copiers)
18 Elec. Eng. & Instrum.
19 Motor Vehicles low emissions vehicles, electric vehicles, biofuel fleet etc
22 Electricity energy saving light bulbs, renewable energy
24 Water Supply water supply and sanitation (waste water/sewage)
25 Construction construction work (to certain standards)
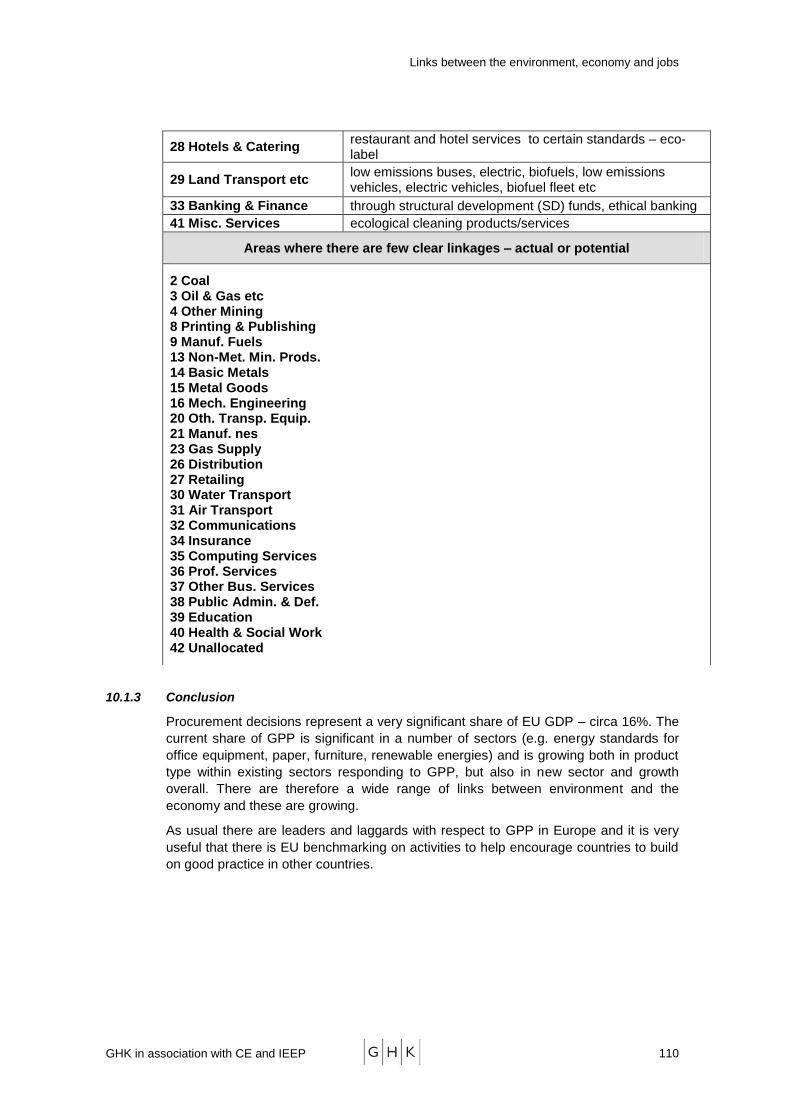
Links between the environment, economy and jobs
GHK in association with CE and IEEP 110
28 Hotels & Catering restaurant and hotel services to certain standards – eco-label
29 Land Transport etc low emissions buses, electric, biofuels, low emissions vehicles, electric vehicles, biofuel fleet etc
33 Banking & Finance through structural development (SD) funds, ethical banking
41 Misc. Services ecological cleaning products/services
Areas where there are few clear linkages – actual or potential
2 Coal 3 Oil & Gas etc 4 Other Mining 8 Printing & Publishing 9 Manuf. Fuels 13 Non-Met. Min. Prods. 14 Basic Metals 15 Metal Goods 16 Mech. Engineering 20 Oth. Transp. Equip. 21 Manuf. nes 23 Gas Supply 26 Distribution 27 Retailing 30 Water Transport 31 Air Transport 32 Communications 34 Insurance 35 Computing Services 36 Prof. Services 37 Other Bus. Services 38 Public Admin. & Def. 39 Education 40 Health & Social Work 42 Unallocated
10.1.3 Conclusion
Procurement decisions represent a very significant share of EU GDP – circa 16%. The
current share of GPP is significant in a number of sectors (e.g. energy standards for
office equipment, paper, furniture, renewable energies) and is growing both in product
type within existing sectors responding to GPP, but also in new sector and growth
overall. There are therefore a wide range of links between environment and the
economy and these are growing.
As usual there are leaders and laggards with respect to GPP in Europe and it is very
useful that there is EU benchmarking on activities to help encourage countries to build
on good practice in other countries.
Links between the environment, economy and jobs
GHK in association with CE and IEEP 111
10.2 Inward Investment and Business Location Decisions
The environment is increasingly playing a role in influencing the choice of business
location. This interest partly stems from changes in the structure of the economy, with
improved communications and the growth of knowledge based businesses increasing
the mobility of companies and their workers, and increasing the scope for quality of life
considerations to influence the choice of business location.
Environmental organisations have highlighted the potential role of environmental
factors in influencing business location and inward investment as a means of
increasing the prominence of environmental issues in the regional development
agenda, and have sought to gather and publicise evidence to support this proposition.
However, while the arguments about the role of environmental and quality of life
factors in driving business decisions are increasingly well rehearsed, the evidence
base remains somewhat patchy.
10.2.1 Factors Influencing Business Location
There are a number of factors influencing business location. The main factors are
primarily concerned with the actual business operation. Some of them are:
Closeness to market
Communications links including transportation
Availability and price of raw materials
Availability and price of appropriately skilled employees
Availability and price of power supplies
Availability and price of land
Government incentives – tax incentives and benefits
In addition to core factors mentions above, environment factors such as air and noise
pollution, proximity to parks and green spaces, water side location and other natural
amenities are also important for businesses deciding location and remuneration
packages. Surveys on quality of life based on environmental and other factors are
often used by businesses for inward investment and remuneration packages.
The 2007 Worldwide Quality of Living Survey by Mercer Human Resource Consulting70
has found that four of the world‘s five top-scoring cities for health and sanitation are in
North America. Calgary ranks top with a score of 131.7, followed by Honolulu, which
scores 130.3. Helsinki – the only European city in the top five – follows closely in the
rankings with a score of 128.5. Ottawa and Minneapolis take fourth and fifth places
with scores of 127.2 and 125.7 respectively. Almost half of the 30 top-scoring cities
surveyed are in Western Europe. Helsinki has the highest score for the region, at
position 3 with a rating of 128.5. Oslo, Stockholm and Zurich all rank 6th with a score
of 125. London is ranked 63 with a score of 111.2.
Scores are based on the quality and availability of hospital and medical supplies and
levels of air pollution and infectious diseases. The efficiency of waste removal and
70 Mercer‘s study is based on detailed assessments and evaluations of 39 key quality of living
determinants, grouped in the following categories: Political and social environment, Economic environment, Socio-cultural environment, Health and sanitation, Schools and education, Public services and transportation, Recreation, Consumer goods, Housing and Natural environment (climate, record of natural disasters).

Links between the environment, economy and jobs
GHK in association with CE and IEEP 112
sewage systems, water potability and the presence of harmful animals and insects are
also taken into account. Cities are ranked against New York as the base city which has
an index score of 100. The analysis is part of Mercer‘s Worldwide Quality of Living
Survey, covering 215 cities.
These indices are increasingly used to decide personnel relocation, opening new
offices and remuneration packages.
A report by Wong (1998) investigated the relative importance of traditional factors
(such as location, infrastructure, workforce, knowledge etc) and softer, more tangible
factors (quality of life, community identity and image, institutional capacity, business
culture), on the grounds that the former are not capable of fully explaining variations in
economic performance. A literature review revealed evidence that quality of life factors
could be the major factor encouraging businesses to locate to certain high natural
value areas such as the Greater Yellowstone region of the US, as well as other studies
that suggested that quality of life and other intangible factors were important only if
more traditional factors are satisfied.
Wong conducted a survey of economic development practitioners in North West and
Eastern England, and found that they considered traditional factors to be more
important than intangible factors in both regions. Quality of life factors were found to
be relatively more important in the Eastern region than the North West. More in depth
interviews concluded that, while the traditional factors were essential in providing the
basic and necessary conditions for economic development, intangible factors such as
quality of life could provide a competitive ―cutting edge‖ if other conditions were
satisfied.
The study also highlighted the distinction between the business environment and the
living environment. While quality of life may be important among business executives
and employees, commuting often makes it possible for individuals to enjoy a high
quality living environment while working in a location chosen because of its more
traditional business attributes.
Similar conclusions can be drawn from available business survey evidence. For
example, a survey of major employers by OMIS Research (2003)71
, which examined
which UK cities were best as a business location, concluded that workforce factors are
now by far the most significant consideration, with the quality of the local environment
among other factors playing an important supporting role. The survey highlighted
increasing concern about traffic congestion and the quality of transport infrastructure,
which is having an increasingly negative impact on business as well as the
environment.
For retailers, a good-quality public environment can improve trading by attracting more
people into an area. It has been shown, for example, that well-planned improvements
to public spaces within town centres can boost commercial trading by up to 40 per cent
and generate significant private sector investment72
.
71 http://www.omis.co.uk/Downloads/BBC06.pdf
72 DoE and The Association of Town Centre Management (1997) Managing Urban Spaces in Town Centres
– Good Practice Guide. London, HMSO.

Links between the environment, economy and jobs
GHK in association with CE and IEEP 113
A report by CABE (2004) demonstrated how 11 cities73
from Melbourne and
Minneapolis, to Curitiba in Brazil and Malmo in Sweden are improving their residents‘
health, wealth and quality of life by investing in parks. The case studies show that
policies and economic initiatives for better urban green space management and
maintenance help in economic growth and development as well as improving quality of
life. The view is that the visual image and recreational amenities offered by any city are
attractive for living and will attract new enterprises and skilled employees, bringing with
them clearly-defined social and economic benefits.
While effectively placing environmental factors at the core of every activity is a
challenge for urban authorities, many are already making impressive steps. Two EU-
funded projects have stimulated solutions for participating cities (see below). Both
adopted the Liveable Cities strap-line, which indicates that the European Commission
is now much more aware of the importance of attractive cities to the 27-member Union.
This is driven by the Lisbon jobs and growth strategy and now by the focus on climate
change.
1. Liveable cities – INTERREG project74
: City enhancement through public
realm-led regeneration was the theme of an INTERREG project, ‗Liveable
Cities‘ implemented by six North Sea Arc city partners led by Norwich in the
UK. The final conference of the four-year programme was in Norwich on 16
and 17 May 2007. The draft final report of the North Sea Arc cities seeks to
measure the benefits of public realm-led regeneration widely and cites
examples of successful interventions, most of which are replicable, in the six
partner cities. Broader conclusions are also drawn by the report, which says
that public space is the city‘s living room. ―Positive nurturing of urban space is
not a mere peripheral townscape cosmetic - it is at the heart of what makes a
city liveable and therefore successful.‖
2. The Liveable Cities project75
, funded by the European Commission - DG
Environment within the framework of the ‗Community framework for co-
operation to promote sustainable urban development‘. This was co-ordinated
by the Euro Cities network and carried out in eight cities for two years. In
February 2007, the conclusions and a comprehensive guidance brochure were
produced and presented to stakeholders from the European Parliament, the
Commission and the Committee of the Regions. Guidance documents include
examples of effective policies and actions by cities and towns across Europe.
The results show that improving the quality of public realm and reducing
environmental problems like traffic pollution has significant benefits in
attracting people to live closer to where they work. This satisfies an important
sustainable principle as both commuting and traffic pollution are important
quality of life and sustainable development indicators.
73 Tokyo, Japan; Aarhus, Denmark; Malmo, Sweden; Curitiba, Brazil; Minneapolis, USA;
Hanover, Germany; Zurich, Switzerland; Wellington, New Zealand; Melbourne, Australia; Paris,
France; Groningen, Netherlands
74 http://www.interreg3c.net/sixcms/detail.php?id=312
75 http://www.liveablecities.org/
Links between the environment, economy and jobs
GHK in association with CE and IEEP 114
10.3 Environment and Choice of Residential Location
The environment plays a more prominent and direct role in influencing decisions about
residential location than business location. While environmental criteria are only one
influence on choice of business location, and may be outweighed by other business
critical factors, they play a central role in determining quality of life, which is clearly
critical to choices people make about where they live.
Parks and green spaces define our communities. They enhance our quality of life and
give local neighbourhoods the identity that helps engender a sense of belonging. In
addition, high quality parks and green spaces can create economic benefits for a wide
range of communities.
Good quality green spaces add value to the surrounding property, both commercial
and residential, consequently increasing tax yield to maintain public services. However,
there have been few studies of these wider economic benefits and this is an area
where additional research would be valuable in informing understanding of the role that
green spaces plays in sustaining vibrant urban communities. Most findings are based
on academic research using economic tools such as hedonic pricing or willingness to
pay (WTP) for quantifying environmental amenities.
The hedonic pricing method is based on the proposition that the value of a good or
service is based on its attributes. The price of amenities for which markets do not exist
– such as green spaces – can be inferred from observing and analysing the price of
goods for which markets do exist – such as houses. For example, the purchase price
of a house is determined by local socio-economic characteristics such as housing
densities, accessibility to transport and health services, and local features such as
green spaces and river views.
Findings from some of the studies are given below:
Study from the University of East Anglia76
, UK indicates that being close to green
space increased house prices from 1 to 30% depending on proximity, type of park
and visibility
In the towns of Emmen, Appledoorn and Leiden in the Netherlands, it has been
shown that a garden bordering water can increase the price of a house by 11 per
cent, while a view of water or having a lake nearby can boost the price by 10 per
cent and 7 per cent respectively. A view of a park was shown to raise house prices
by 8 per cent, and having a park nearby by 6 per cent77
.
In Berlin in 2000, proximity to playgrounds in residential areas was found to
increase land values by up to 16 per cent. In the same study, a high number of
street trees resulted in an increase of 17 per cent in land values.78
Study by Peiser and Schwann (1993)79
in Dallas, survey residents and found that
the public green spaces running behind their back gardens as a major factor in
76 Equal access for all? Ethnicity and public park availability. Brainard, J.S et al in Birmingham School of
Environmental Sciences, University of East Anglia and CSERGE, 2003
77 Luttik, J. (2000) ‗The value of trees, water and open spaces as reflected by house prices in the
Netherlands‘. Landscape and Urban Planning, Vol. 48, pp161-167.
78 The Trust for Public Land (2001), Economic Benefits of Open Space Index (online). New York, The
Trust for Public Land
Links between the environment, economy and jobs
GHK in association with CE and IEEP 115
their decision to move to the area. Sixty per cent of these residents believed that
the value of their homes was at least 15 per cent higher because of the presence
of the green spaces.
An Ernst and Young report80
, ‗How smart parks investment pays its way‘, examined
six parks in New York and concluded that commercial asking rents, residential sale
prices and assessed values for properties near a well-improved park generally
exceeded those values in surrounding areas. Properties in immediate proximity to
Bryant Park were shown to have enjoyed up to a 220% increase in commercial
rental values as compared to a maximum 75% increase in the surrounding area.
The Trust for Public Land (2001)81
in the US compiled a casebook of evidence on
the relationship between good quality public space and its social and/or economic
benefits from earlier studies. In summarising these findings it was clear that a
positive relationship exists but the extent of the impact does vary significantly
across the different reports.
According to a study by Tyrväinen and Miettinen (2000)82
using hedonic models, in
Finland, a one kilometer increase in the distance to the nearest forested area led to
an average 6% fall in the market price of the dwelling. Dwellings with forest views
on average were 5% more expensive than dwellings with otherwise similar
characteristics.
Study by Hui. et. Al (2007) looking at environmental effects on residential property
values in Hong Kong, using hedonic model with spatial adjustments (GIS
techniques), found that the availability of green belt area in proximity to homes did
not significantly change the sale price. However, availability of sea views could
increase the sale price by 4.6%. Apartments located in better air quality areas also
attracted higher sale prices. Specifically, the sale price of an apartment was found
to be approximately 1.3% higher than that of an identical one located in a
neighbourhood whose annual average air pollution index was one percent less
than the one under examination.
Bolitzera and Netusil (2000)83
looked at the influence of open spaces such as
public parks, natural areas and golf courses on the sale price of homes in close
proximity to these spaces. They found that that a home located within 1500 feet of
any open space sells for 1.4% to 3% more than a home located more than 1500
feet from an open space. Open space size is also an important factor with each
additional acre of open space estimated to increase a home‘s sale by 0.04%.
79 Peiser, R. B. and Schwann, G. M. (1993) ‗The private value of public open space within subdivisions‘.
Journal of Architectural and Planning Research, Vol. 10(2), pp 91-104.
80 New Yorkers for Parks: How smart parks investment pays its way. Ernst and Young/New Yorkers for
Parks, New York, 2003
81 http://www.tpl.org/tier3_cdl.cfm?content_item_id=1145&folder_id=727
82 Liisa Tyrväinen and Antti Miettinen (2000), Property Prices and Urban Forest Amenities, Journal of
Environmental Economics and Management, Volume 39, Issue 2, March 2000, Pages 205-223
83 B. Bolitzera and N. R. Netusil (2000), The impact of open spaces on property values in Portland,
Oregon, Journal of Environmental Management Volume 59, Issue 3, July 2000, Pages 185-193

Links between the environment, economy and jobs
GHK in association with CE and IEEP 116
10.4 Environment Related Insurance Services, Damage and Rebuild Costs
Hurricane Katrina clearly showed how severe weather events can affect both local and
global business. In recent times worldwide floods, severe windstorms, earthquakes
and the hot summers, such as the one in Europe in 2003 have caused a significant
number of deaths and damage to property. Figure 10.2a and 10.2b shows the
increasing trend in losses to the insurance industry over time and extreme weather
events. There is little doubt in the insurance industry that these trends are related to
greenhouse gases84
.
Figure 10.2a: Global Weather-Related Losses from weather related natural
disasters, 1980-2005
Economic losses
Insured losses
US
$ B
illio
n
Economic losses
Insured losses
US
$ B
illio
n
Note: Events are considered ―great‖ if the affected region‘s resilience is clearly overstretched and supraregional or international assistance is required. As a rule, this is the case when there are thousands of fatalilities, when hundreds of thousands of people are made homeless, or when economic losses — depending on the economic circumstances of the country concerned — and/or insured losses reach exceptional levels. Source: Munich Re, NatCatSERVICE.
Global economic85
and insured losses were around $100 billion each in 2005. The
insured portion of losses from weather-related catastrophes is on the rise, increasing
from a small fraction of the global total economic losses in the 1950s to 19% in the
1990s and 35% in 2004. The ratio has been rising twice as quickly in the US, with over
40% of the total disaster losses being insured in the 1990s (American Re 2005).
Where the burden of losses falls depends on geography, the type of risk and the
political clout of those in harm‘s way. The developed world has sophisticated ways of
84 Association of British Insurers (2005), The financial risks of climate change
85 Per Munich Re's definition, total economic losses are dominated by direct damages, defined as
damage to fixed assets (including property or crops), capital, and inventories of finished and semifinished goods or raw materials that occur simultaneously or as a direct consequence of the natural phenomenon causing a disaster. The economic loss data can also include indirect or other secondary damages such as business interruptions or temporary relocation expenses for displaced households. More loosely related damages such as impacts on national GDP are not included.
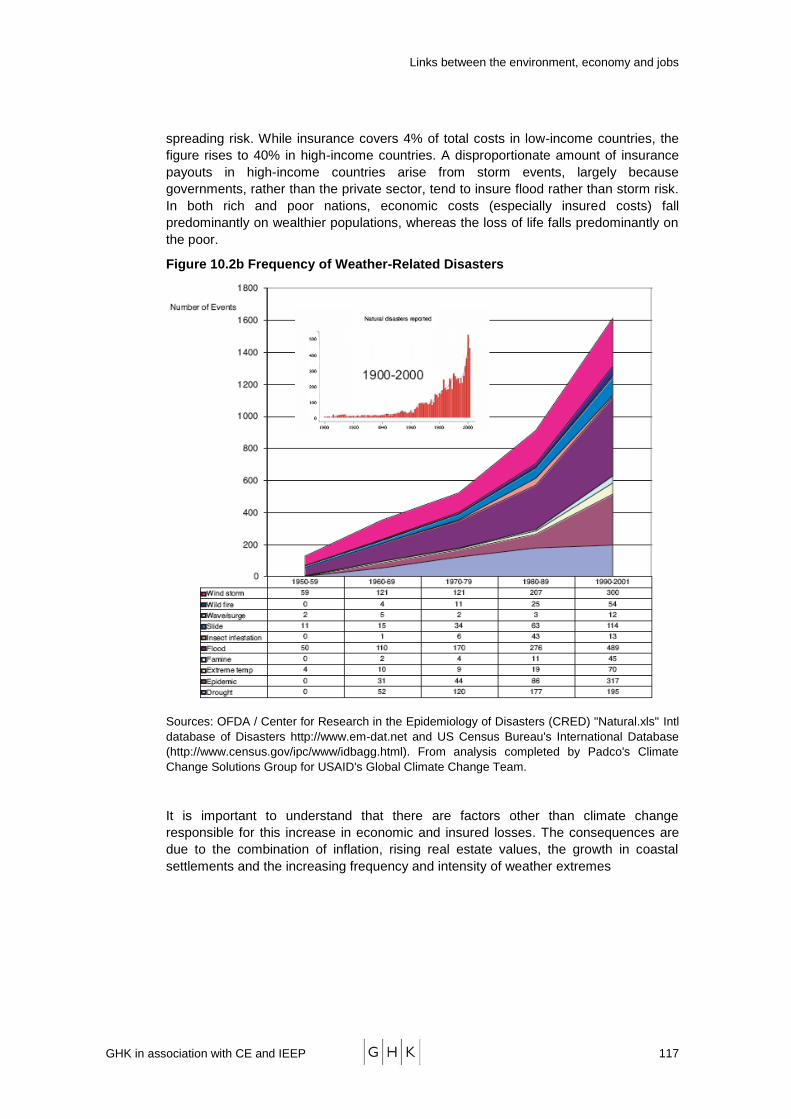
Links between the environment, economy and jobs
GHK in association with CE and IEEP 117
spreading risk. While insurance covers 4% of total costs in low-income countries, the
figure rises to 40% in high-income countries. A disproportionate amount of insurance
payouts in high-income countries arise from storm events, largely because
governments, rather than the private sector, tend to insure flood rather than storm risk.
In both rich and poor nations, economic costs (especially insured costs) fall
predominantly on wealthier populations, whereas the loss of life falls predominantly on
the poor.
Figure 10.2b Frequency of Weather-Related Disasters
Sources: OFDA / Center for Research in the Epidemiology of Disasters (CRED) "Natural.xls" Intl
database of Disasters http://www.em-dat.net and US Census Bureau's International Database
(http://www.census.gov/ipc/www/idbagg.html). From analysis completed by Padco's Climate
Change Solutions Group for USAID's Global Climate Change Team.
It is important to understand that there are factors other than climate change
responsible for this increase in economic and insured losses. The consequences are
due to the combination of inflation, rising real estate values, the growth in coastal
settlements and the increasing frequency and intensity of weather extremes
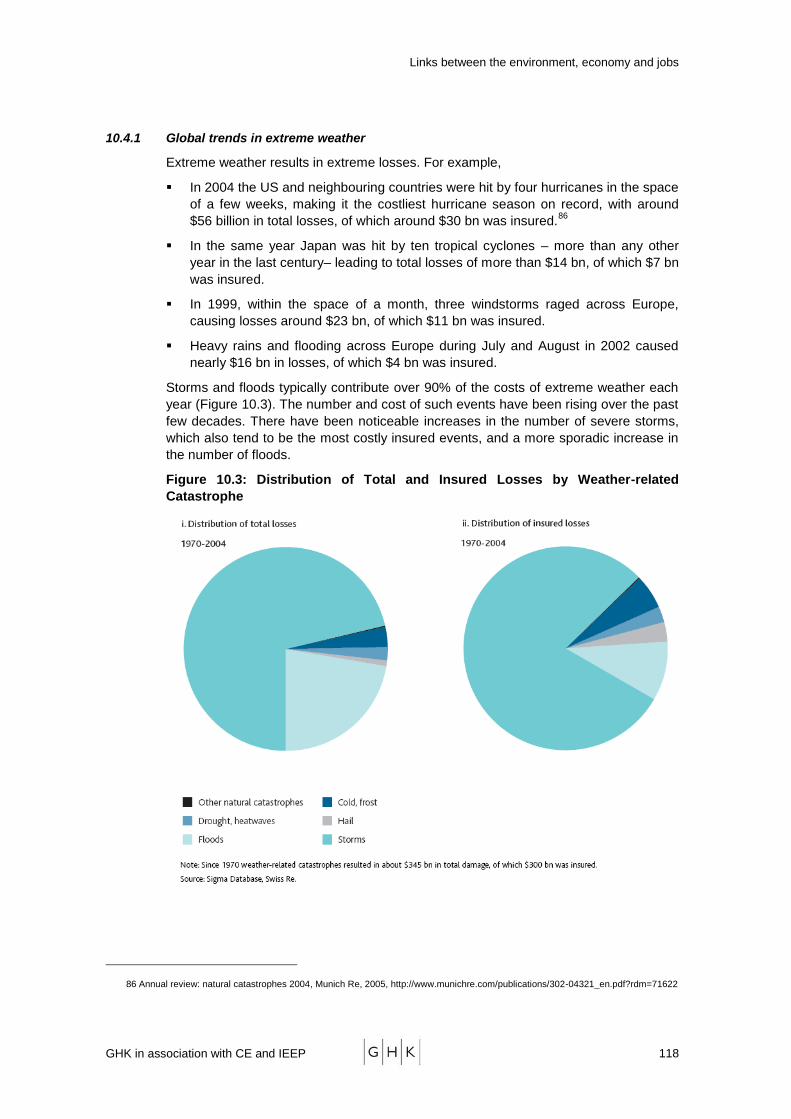
Links between the environment, economy and jobs
GHK in association with CE and IEEP 118
10.4.1 Global trends in extreme weather
Extreme weather results in extreme losses. For example,
In 2004 the US and neighbouring countries were hit by four hurricanes in the space
of a few weeks, making it the costliest hurricane season on record, with around
$56 billion in total losses, of which around $30 bn was insured.86
In the same year Japan was hit by ten tropical cyclones – more than any other
year in the last century– leading to total losses of more than $14 bn, of which $7 bn
was insured.
In 1999, within the space of a month, three windstorms raged across Europe,
causing losses around $23 bn, of which $11 bn was insured.
Heavy rains and flooding across Europe during July and August in 2002 caused
nearly $16 bn in losses, of which $4 bn was insured.
Storms and floods typically contribute over 90% of the costs of extreme weather each
year (Figure 10.3). The number and cost of such events have been rising over the past
few decades. There have been noticeable increases in the number of severe storms,
which also tend to be the most costly insured events, and a more sporadic increase in
the number of floods.
Figure 10.3: Distribution of Total and Insured Losses by Weather-related
Catastrophe
86 Annual review: natural catastrophes 2004, Munich Re, 2005, http://www.munichre.com/publications/302-04321_en.pdf?rdm=71622
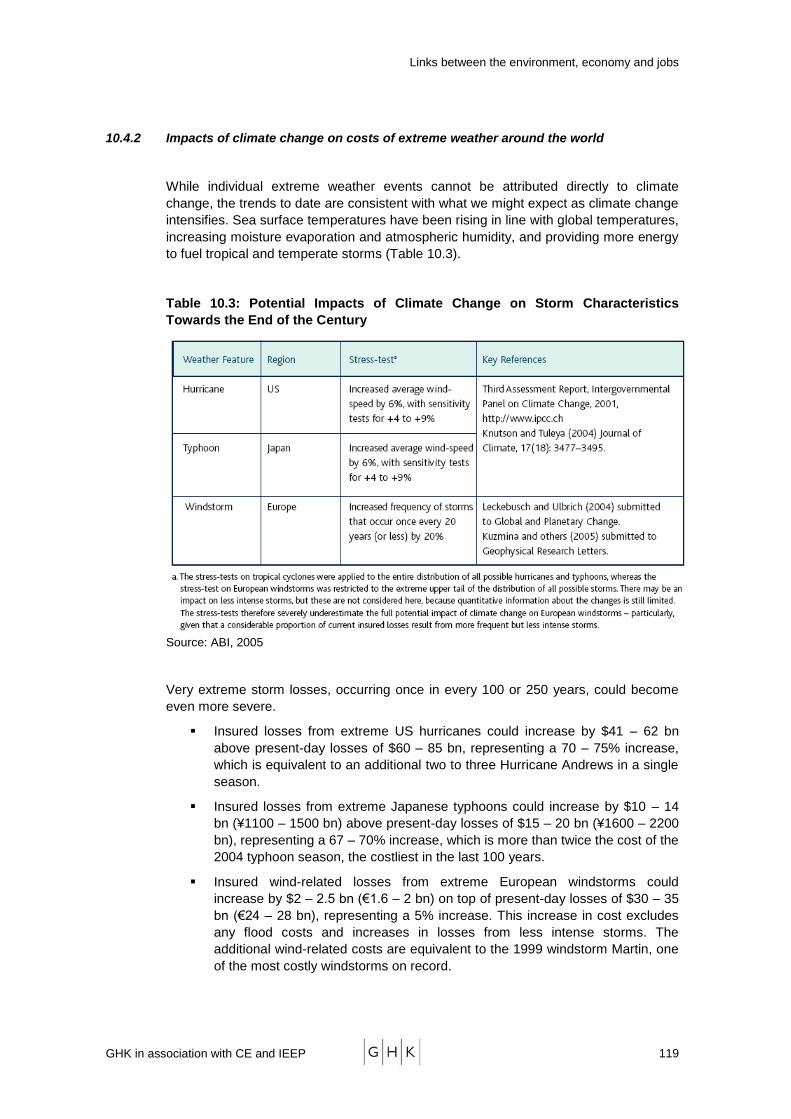
Links between the environment, economy and jobs
GHK in association with CE and IEEP 119
10.4.2 Impacts of climate change on costs of extreme weather around the world
While individual extreme weather events cannot be attributed directly to climate
change, the trends to date are consistent with what we might expect as climate change
intensifies. Sea surface temperatures have been rising in line with global temperatures,
increasing moisture evaporation and atmospheric humidity, and providing more energy
to fuel tropical and temperate storms (Table 10.3).
Table 10.3: Potential Impacts of Climate Change on Storm Characteristics
Towards the End of the Century
Source: ABI, 2005
Very extreme storm losses, occurring once in every 100 or 250 years, could become
even more severe.
Insured losses from extreme US hurricanes could increase by $41 – 62 bn
above present-day losses of $60 – 85 bn, representing a 70 – 75% increase,
which is equivalent to an additional two to three Hurricane Andrews in a single
season.
Insured losses from extreme Japanese typhoons could increase by $10 – 14
bn (¥1100 – 1500 bn) above present-day losses of $15 – 20 bn (¥1600 – 2200
bn), representing a 67 – 70% increase, which is more than twice the cost of the
2004 typhoon season, the costliest in the last 100 years.
Insured wind-related losses from extreme European windstorms could
increase by $2 – 2.5 bn (€1.6 – 2 bn) on top of present-day losses of $30 – 35
bn (€24 – 28 bn), representing a 5% increase. This increase in cost excludes
any flood costs and increases in losses from less intense storms. The
additional wind-related costs are equivalent to the 1999 windstorm Martin, one
of the most costly windstorms on record.
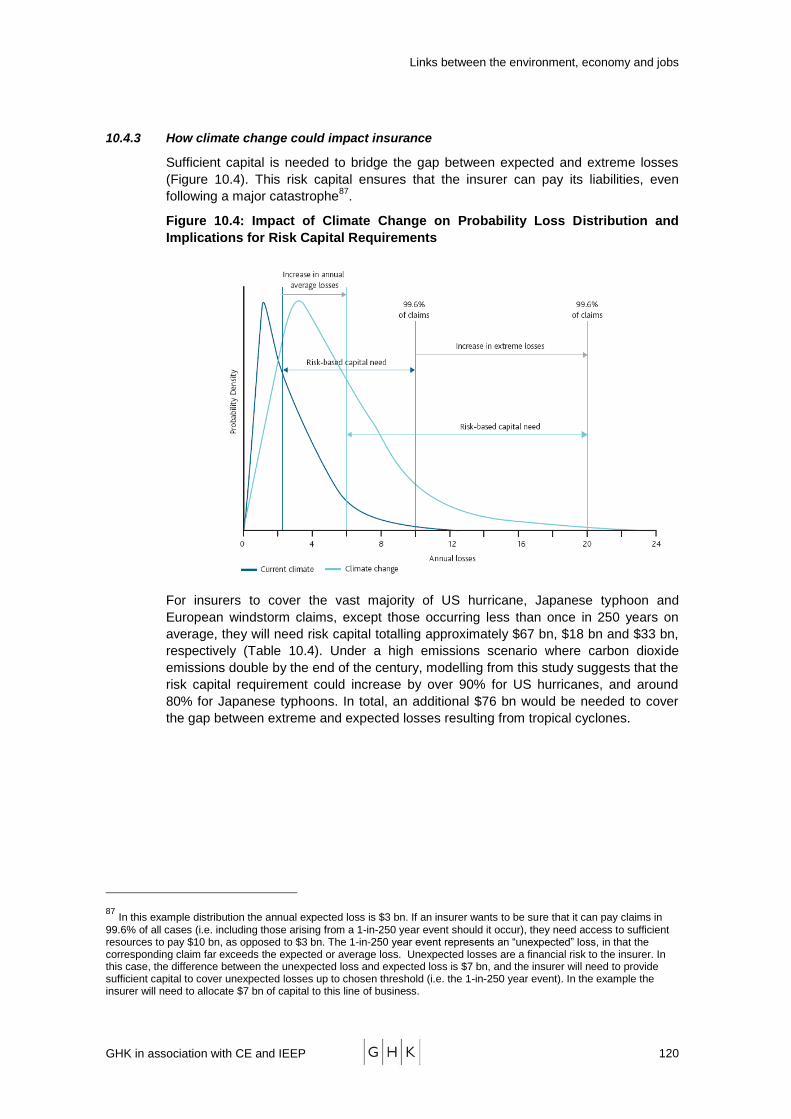
Links between the environment, economy and jobs
GHK in association with CE and IEEP 120
10.4.3 How climate change could impact insurance
Sufficient capital is needed to bridge the gap between expected and extreme losses
(Figure 10.4). This risk capital ensures that the insurer can pay its liabilities, even
following a major catastrophe87
.
Figure 10.4: Impact of Climate Change on Probability Loss Distribution and
Implications for Risk Capital Requirements
For insurers to cover the vast majority of US hurricane, Japanese typhoon and
European windstorm claims, except those occurring less than once in 250 years on
average, they will need risk capital totalling approximately $67 bn, $18 bn and $33 bn,
respectively (Table 10.4). Under a high emissions scenario where carbon dioxide
emissions double by the end of the century, modelling from this study suggests that the
risk capital requirement could increase by over 90% for US hurricanes, and around
80% for Japanese typhoons. In total, an additional $76 bn would be needed to cover
the gap between extreme and expected losses resulting from tropical cyclones.
87 In this example distribution the annual expected loss is $3 bn. If an insurer wants to be sure that it can pay claims in
99.6% of all cases (i.e. including those arising from a 1-in-250 year event should it occur), they need access to sufficient resources to pay $10 bn, as opposed to $3 bn. The 1-in-250 year event represents an ―unexpected‖ loss, in that the corresponding claim far exceeds the expected or average loss. Unexpected losses are a financial risk to the insurer. In this case, the difference between the unexpected loss and expected loss is $7 bn, and the insurer will need to provide sufficient capital to cover unexpected losses up to chosen threshold (i.e. the 1-in-250 year event). In the example the insurer will need to allocate $7 bn of capital to this line of business.
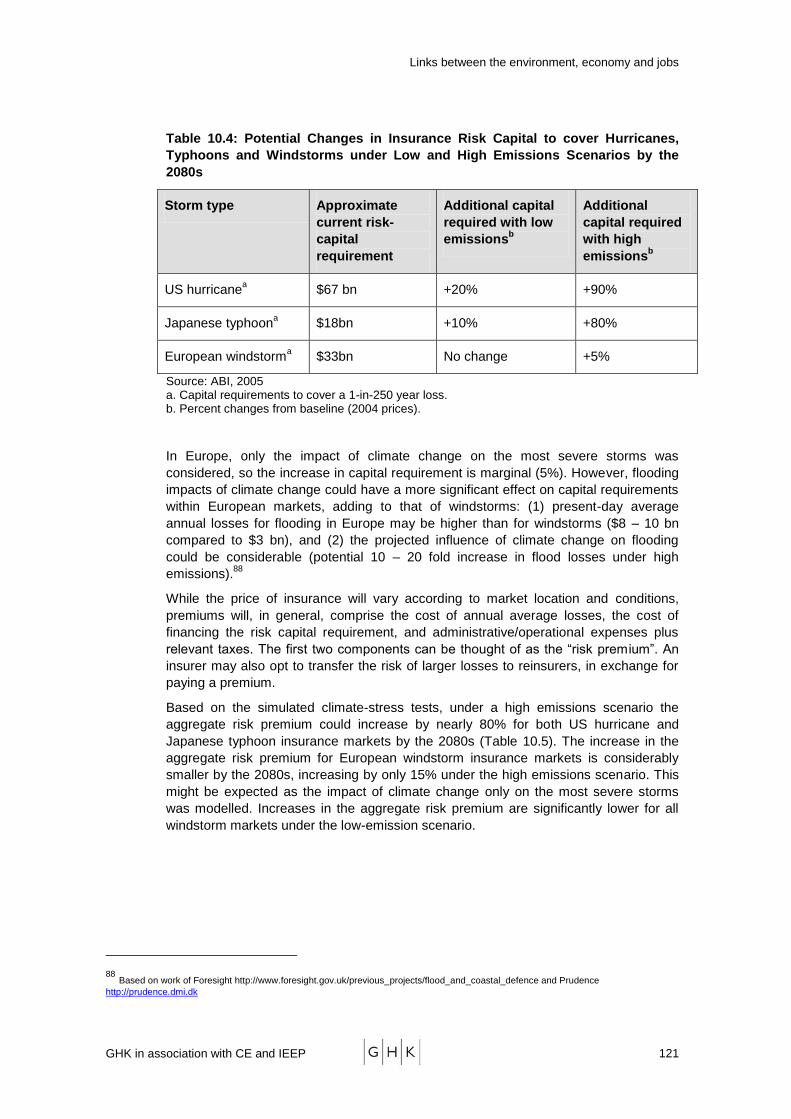
Links between the environment, economy and jobs
GHK in association with CE and IEEP 121
Table 10.4: Potential Changes in Insurance Risk Capital to cover Hurricanes,
Typhoons and Windstorms under Low and High Emissions Scenarios by the
2080s
Storm type Approximate
current risk-
capital
requirement
Additional capital
required with low
emissionsb
Additional
capital required
with high
emissionsb
US hurricanea
$67 bn +20% +90%
Japanese typhoona
$18bn +10% +80%
European windstorma
$33bn No change +5%
Source: ABI, 2005 a. Capital requirements to cover a 1-in-250 year loss. b. Percent changes from baseline (2004 prices).
In Europe, only the impact of climate change on the most severe storms was
considered, so the increase in capital requirement is marginal (5%). However, flooding
impacts of climate change could have a more significant effect on capital requirements
within European markets, adding to that of windstorms: (1) present-day average
annual losses for flooding in Europe may be higher than for windstorms ($8 – 10 bn
compared to $3 bn), and (2) the projected influence of climate change on flooding
could be considerable (potential 10 – 20 fold increase in flood losses under high
emissions).88
While the price of insurance will vary according to market location and conditions,
premiums will, in general, comprise the cost of annual average losses, the cost of
financing the risk capital requirement, and administrative/operational expenses plus
relevant taxes. The first two components can be thought of as the ―risk premium‖. An
insurer may also opt to transfer the risk of larger losses to reinsurers, in exchange for
paying a premium.
Based on the simulated climate-stress tests, under a high emissions scenario the
aggregate risk premium could increase by nearly 80% for both US hurricane and
Japanese typhoon insurance markets by the 2080s (Table 10.5). The increase in the
aggregate risk premium for European windstorm insurance markets is considerably
smaller by the 2080s, increasing by only 15% under the high emissions scenario. This
might be expected as the impact of climate change only on the most severe storms
was modelled. Increases in the aggregate risk premium are significantly lower for all
windstorm markets under the low-emission scenario.
88 Based on work of Foresight http://www.foresight.gov.uk/previous_projects/flood_and_coastal_defence and Prudence
http://prudence.dmi.dk
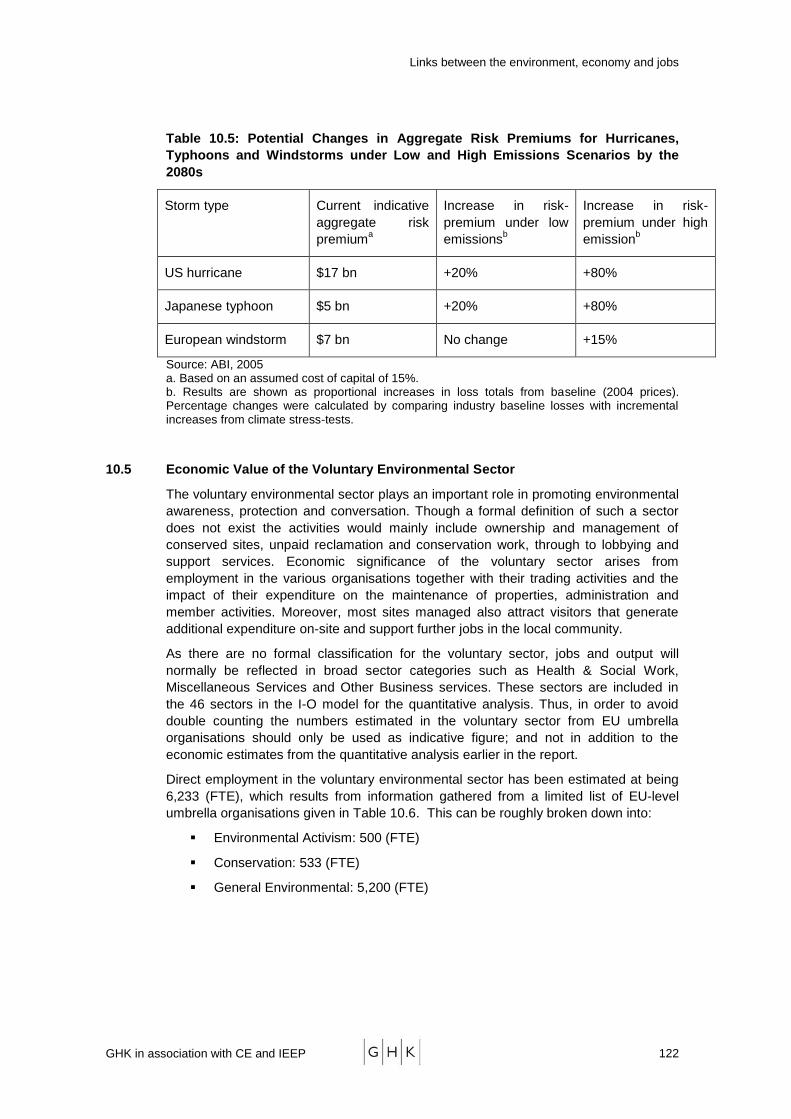
Links between the environment, economy and jobs
GHK in association with CE and IEEP 122
Table 10.5: Potential Changes in Aggregate Risk Premiums for Hurricanes,
Typhoons and Windstorms under Low and High Emissions Scenarios by the
2080s
Storm type Current indicative
aggregate risk
premiuma
Increase in risk-
premium under low
emissionsb
Increase in risk-
premium under high
emissionb
US hurricane
$17 bn +20% +80%
Japanese typhoon
$5 bn +20% +80%
European windstorm
$7 bn No change +15%
Source: ABI, 2005 a. Based on an assumed cost of capital of 15%. b. Results are shown as proportional increases in loss totals from baseline (2004 prices). Percentage changes were calculated by comparing industry baseline losses with incremental increases from climate stress-tests.
10.5 Economic Value of the Voluntary Environmental Sector
The voluntary environmental sector plays an important role in promoting environmental
awareness, protection and conversation. Though a formal definition of such a sector
does not exist the activities would mainly include ownership and management of
conserved sites, unpaid reclamation and conservation work, through to lobbying and
support services. Economic significance of the voluntary sector arises from
employment in the various organisations together with their trading activities and the
impact of their expenditure on the maintenance of properties, administration and
member activities. Moreover, most sites managed also attract visitors that generate
additional expenditure on-site and support further jobs in the local community.
As there are no formal classification for the voluntary sector, jobs and output will
normally be reflected in broad sector categories such as Health & Social Work,
Miscellaneous Services and Other Business services. These sectors are included in
the 46 sectors in the I-O model for the quantitative analysis. Thus, in order to avoid
double counting the numbers estimated in the voluntary sector from EU umbrella
organisations should only be used as indicative figure; and not in addition to the
economic estimates from the quantitative analysis earlier in the report.
Direct employment in the voluntary environmental sector has been estimated at being
6,233 (FTE), which results from information gathered from a limited list of EU-level
umbrella organisations given in Table 10.6. This can be roughly broken down into:
Environmental Activism: 500 (FTE)
Conservation: 533 (FTE)
General Environmental: 5,200 (FTE)
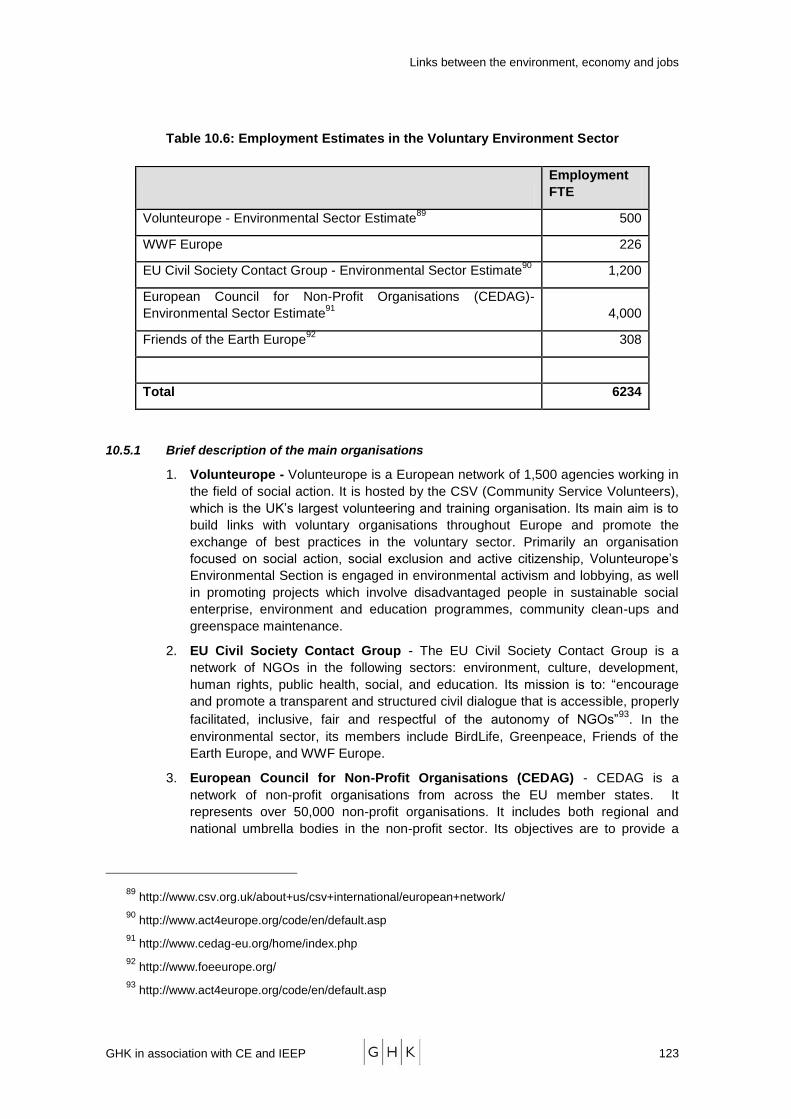
Links between the environment, economy and jobs
GHK in association with CE and IEEP 123
Table 10.6: Employment Estimates in the Voluntary Environment Sector
10.5.1 Brief description of the main organisations
1. Volunteurope - Volunteurope is a European network of 1,500 agencies working in
the field of social action. It is hosted by the CSV (Community Service Volunteers),
which is the UK‘s largest volunteering and training organisation. Its main aim is to
build links with voluntary organisations throughout Europe and promote the
exchange of best practices in the voluntary sector. Primarily an organisation
focused on social action, social exclusion and active citizenship, Volunteurope‘s
Environmental Section is engaged in environmental activism and lobbying, as well
in promoting projects which involve disadvantaged people in sustainable social
enterprise, environment and education programmes, community clean-ups and
greenspace maintenance.
2. EU Civil Society Contact Group - The EU Civil Society Contact Group is a
network of NGOs in the following sectors: environment, culture, development,
human rights, public health, social, and education. Its mission is to: ―encourage
and promote a transparent and structured civil dialogue that is accessible, properly
facilitated, inclusive, fair and respectful of the autonomy of NGOs‖93
. In the
environmental sector, its members include BirdLife, Greenpeace, Friends of the
Earth Europe, and WWF Europe.
3. European Council for Non-Profit Organisations (CEDAG) - CEDAG is a
network of non-profit organisations from across the EU member states. It
represents over 50,000 non-profit organisations. It includes both regional and
national umbrella bodies in the non-profit sector. Its objectives are to provide a
89 http://www.csv.org.uk/about+us/csv+international/european+network/
90 http://www.act4europe.org/code/en/default.asp
91 http://www.cedag-eu.org/home/index.php
92 http://www.foeeurope.org/
93 http://www.act4europe.org/code/en/default.asp
Employment
FTE
Volunteurope - Environmental Sector Estimate89
500
WWF Europe 226
EU Civil Society Contact Group - Environmental Sector Estimate90
1,200
European Council for Non-Profit Organisations (CEDAG)-
Environmental Sector Estimate91
4,000
Friends of the Earth Europe92
308
Total 6234

Links between the environment, economy and jobs
GHK in association with CE and IEEP 124
forum for EU non-profit organisations, promote the non-profit sector and inform
members of best practices.
4. Friends of the Earth Europe - Friends of the Earth Europe is a grassroots
organisation which campaigns for the protection of the environment. It unites 30
national Friends of the Earth organisations throughout Europe.
5. WWF Europe - WWF Europe is the European Union office for WWF International.
Its mission statement is: ―to contribute to the achievement of WWF‘s global mission
by leading the WWF network to shape EU policies impacting on the European and
global environment‖.94
10.5.2 Main Problems and issues
As mentioned earlier employment in the voluntary sector is not collected through a
central database such as Eurostat. Moreover, this information is also not systematically
collected by umbrella organisations.
Calculation full-time equivalents (FTE) employment - In the voluntary sector it is
difficult to calculate full-time equivalents. Due to the nature of the sector, many
workers are unpaid, paid with lump-sum stipends or partially paid for the hours worked.
This makes it difficult to calculate the actual number of paid hours worked.
Definitional Problems - Many volunteer organisations engage in several types of
voluntary activity, including social, environmental, education, community involvement,
etc. When reporting FTEs, they do not distinguish between specific voluntary sectors.
Difficulty Locating Organisations - Umbrella organisations do not always supply the
contact information of the organisations they represent. In addition, a list of the
specific non-profit or voluntary organisations they represent is not always publicly
available, making it difficult to collect information from individual organisations.
94 http://www.panda.org/about_wwf/where_we_work/europe/what_we_do/epo/about_us/index.cfm
Links between the environment, economy and jobs
GHK in association with CE and IEEP 125
11 REFERENCES
Biomat.net, Biodegradability of Bioplastics: Prenormative Research, Biorecycling and
Ecological Impacts http://www.biomatnet.org/secure/Air/F235.htm
Crank M. et al (2005) Techno-economic Feasibility of Largescale Production of Bio-
based Polymers in Europe. European Union Joint Research Committee (JRC), IPTS,
ETSO available at www.biomatnet.org/publications/1944rep.pdf
David M. Biopolymers from crops: their potential to improve the environment
www.regional.org.au/au/asa/2003/c/11/michael.htm
European Bioplastics: www.european-bioplastics.org
Holdings W. Bioplastics Supply Chains- Implications and Opportunities for Agriculture,
a report for the Rural Industries Research and Development Corporation
www.rirdc.gov.au/reports/EFM/04-044.pdf
Scienceinschool.org, Plastics naturally:www.scienceinschool.org/2007/issue5/plastics/
ABI, (2005), Financial risks of climate change
Cecilia Wong, 1998, Determining Factors for Local Economic Development: The
Perception of Practitioners in the North West and Eastern Regions of the UK. Regional
Studies, Vol. 32.8, pp. 707 – 720. Project was funded by Economic and Social
Research Council.
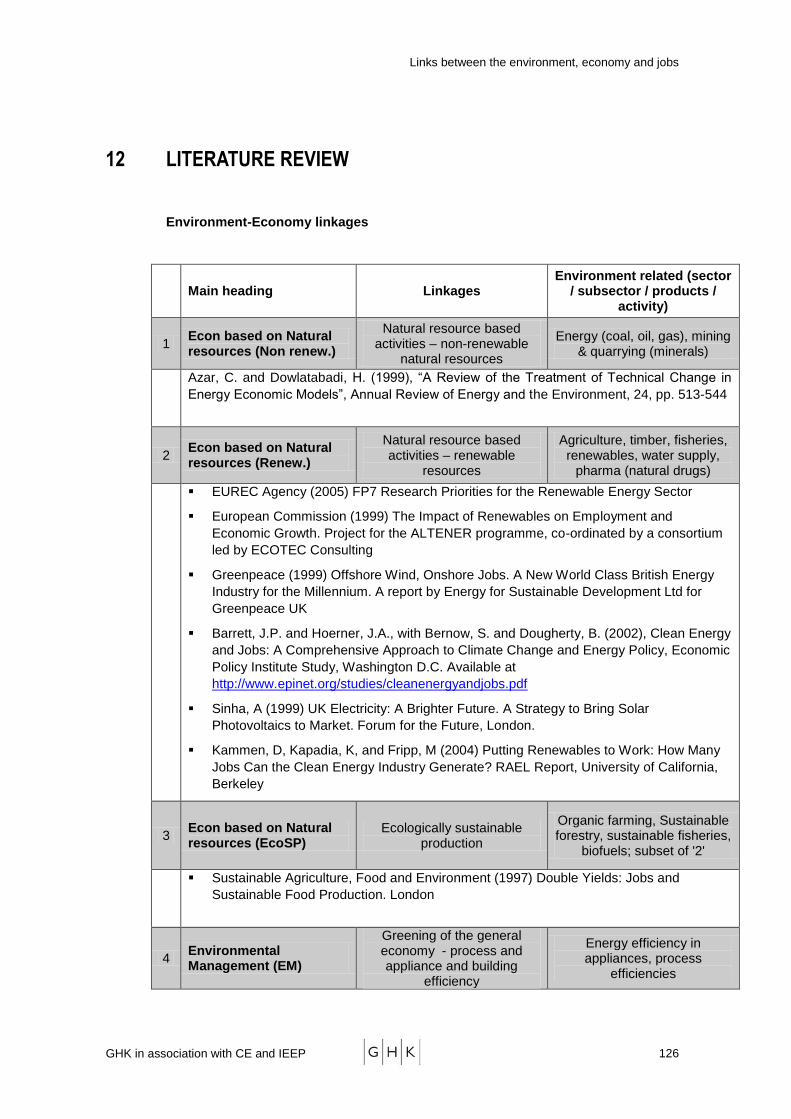
Links between the environment, economy and jobs
GHK in association with CE and IEEP 126
12 LITERATURE REVIEW
Environment-Economy linkages
Main heading Linkages Environment related (sector
/ subsector / products / activity)
1 Econ based on Natural resources (Non renew.)
Natural resource based activities – non-renewable
natural resources
Energy (coal, oil, gas), mining & quarrying (minerals)
Azar, C. and Dowlatabadi, H. (1999), ―A Review of the Treatment of Technical Change in
Energy Economic Models‖, Annual Review of Energy and the Environment, 24, pp. 513-544
2 Econ based on Natural resources (Renew.)
Natural resource based activities – renewable
resources
Agriculture, timber, fisheries, renewables, water supply,
pharma (natural drugs)
EUREC Agency (2005) FP7 Research Priorities for the Renewable Energy Sector
European Commission (1999) The Impact of Renewables on Employment and
Economic Growth. Project for the ALTENER programme, co-ordinated by a consortium
led by ECOTEC Consulting
Greenpeace (1999) Offshore Wind, Onshore Jobs. A New World Class British Energy
Industry for the Millennium. A report by Energy for Sustainable Development Ltd for
Greenpeace UK
Barrett, J.P. and Hoerner, J.A., with Bernow, S. and Dougherty, B. (2002), Clean Energy
and Jobs: A Comprehensive Approach to Climate Change and Energy Policy, Economic
Policy Institute Study, Washington D.C. Available at
http://www.epinet.org/studies/cleanenergyandjobs.pdf
Sinha, A (1999) UK Electricity: A Brighter Future. A Strategy to Bring Solar
Photovoltaics to Market. Forum for the Future, London.
Kammen, D, Kapadia, K, and Fripp, M (2004) Putting Renewables to Work: How Many
Jobs Can the Clean Energy Industry Generate? RAEL Report, University of California,
Berkeley
3 Econ based on Natural resources (EcoSP)
Ecologically sustainable production
Organic farming, Sustainable forestry, sustainable fisheries,
biofuels; subset of '2'
Sustainable Agriculture, Food and Environment (1997) Double Yields: Jobs and
Sustainable Food Production. London
4 Environmental Management (EM)
Greening of the general economy - process and appliance and building
efficiency
Energy efficiency in appliances, process
efficiencies
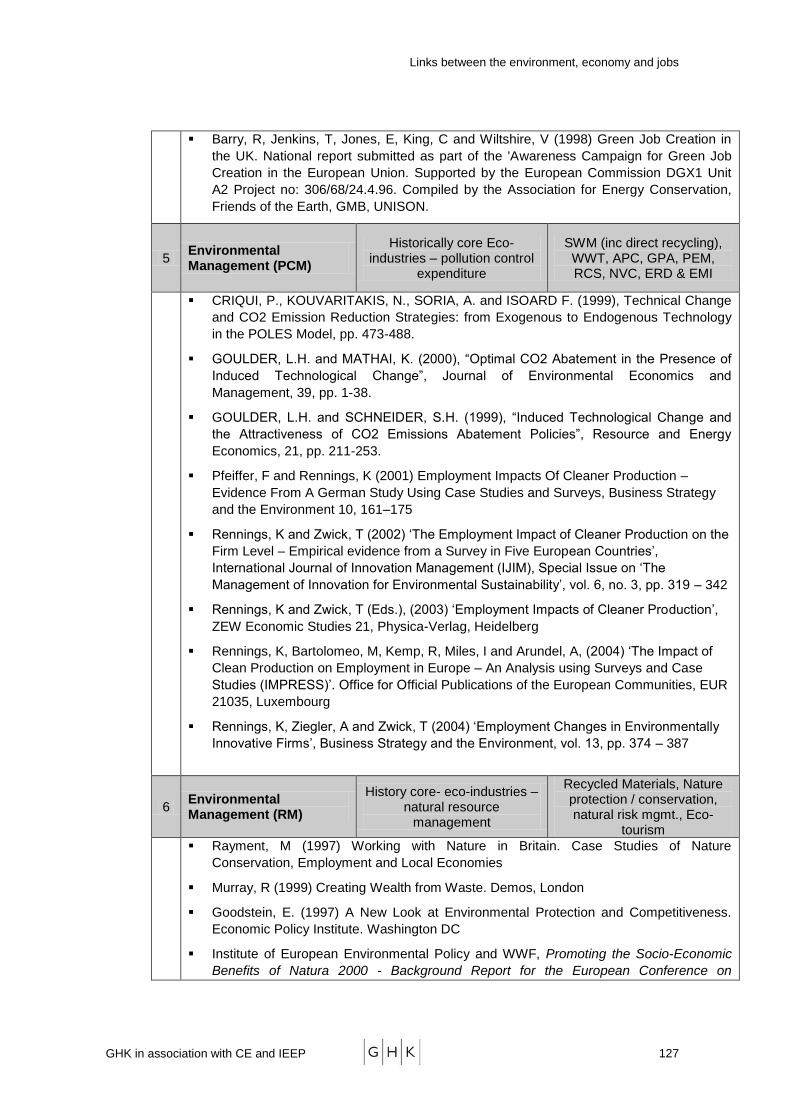
Links between the environment, economy and jobs
GHK in association with CE and IEEP 127
Barry, R, Jenkins, T, Jones, E, King, C and Wiltshire, V (1998) Green Job Creation in
the UK. National report submitted as part of the 'Awareness Campaign for Green Job
Creation in the European Union. Supported by the European Commission DGX1 Unit
A2 Project no: 306/68/24.4.96. Compiled by the Association for Energy Conservation,
Friends of the Earth, GMB, UNISON.
5 Environmental Management (PCM)
Historically core Eco-industries – pollution control
expenditure
SWM (inc direct recycling), WWT, APC, GPA, PEM, RCS, NVC, ERD & EMI
CRIQUI, P., KOUVARITAKIS, N., SORIA, A. and ISOARD F. (1999), Technical Change
and CO2 Emission Reduction Strategies: from Exogenous to Endogenous Technology
in the POLES Model, pp. 473-488.
GOULDER, L.H. and MATHAI, K. (2000), ―Optimal CO2 Abatement in the Presence of
Induced Technological Change‖, Journal of Environmental Economics and
Management, 39, pp. 1-38.
GOULDER, L.H. and SCHNEIDER, S.H. (1999), ―Induced Technological Change and
the Attractiveness of CO2 Emissions Abatement Policies‖, Resource and Energy
Economics, 21, pp. 211-253.
Pfeiffer, F and Rennings, K (2001) Employment Impacts Of Cleaner Production –
Evidence From A German Study Using Case Studies and Surveys, Business Strategy
and the Environment 10, 161–175
Rennings, K and Zwick, T (2002) ‗The Employment Impact of Cleaner Production on the
Firm Level – Empirical evidence from a Survey in Five European Countries‘,
International Journal of Innovation Management (IJIM), Special Issue on ‗The
Management of Innovation for Environmental Sustainability‘, vol. 6, no. 3, pp. 319 – 342
Rennings, K and Zwick, T (Eds.), (2003) ‗Employment Impacts of Cleaner Production‘,
ZEW Economic Studies 21, Physica-Verlag, Heidelberg
Rennings, K, Bartolomeo, M, Kemp, R, Miles, I and Arundel, A, (2004) ‗The Impact of
Clean Production on Employment in Europe – An Analysis using Surveys and Case
Studies (IMPRESS)‘. Office for Official Publications of the European Communities, EUR
21035, Luxembourg
Rennings, K, Ziegler, A and Zwick, T (2004) ‗Employment Changes in Environmentally
Innovative Firms‘, Business Strategy and the Environment, vol. 13, pp. 374 – 387
6 Environmental Management (RM)
History core- eco-industries – natural resource
management
Recycled Materials, Nature protection / conservation, natural risk mgmt., Eco-
tourism
Rayment, M (1997) Working with Nature in Britain. Case Studies of Nature
Conservation, Employment and Local Economies
Murray, R (1999) Creating Wealth from Waste. Demos, London
Goodstein, E. (1997) A New Look at Environmental Protection and Competitiveness.
Economic Policy Institute. Washington DC
Institute of European Environmental Policy and WWF, Promoting the Socio-Economic
Benefits of Natura 2000 - Background Report for the European Conference on
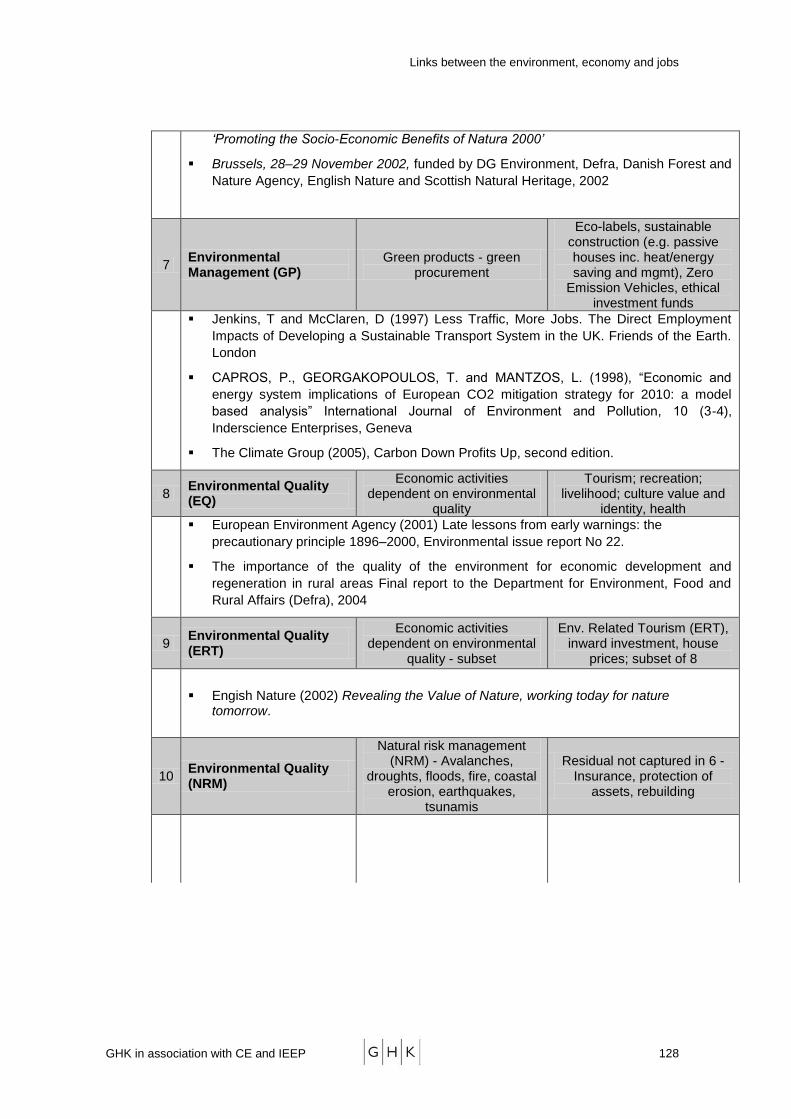
Links between the environment, economy and jobs
GHK in association with CE and IEEP 128
‘Promoting the Socio-Economic Benefits of Natura 2000’
Brussels, 28–29 November 2002, funded by DG Environment, Defra, Danish Forest and
Nature Agency, English Nature and Scottish Natural Heritage, 2002
7 Environmental Management (GP)
Green products - green procurement
Eco-labels, sustainable construction (e.g. passive houses inc. heat/energy saving and mgmt), Zero
Emission Vehicles, ethical investment funds
Jenkins, T and McClaren, D (1997) Less Traffic, More Jobs. The Direct Employment
Impacts of Developing a Sustainable Transport System in the UK. Friends of the Earth.
London
CAPROS, P., GEORGAKOPOULOS, T. and MANTZOS, L. (1998), ―Economic and
energy system implications of European CO2 mitigation strategy for 2010: a model
based analysis‖ International Journal of Environment and Pollution, 10 (3-4),
Inderscience Enterprises, Geneva
The Climate Group (2005), Carbon Down Profits Up, second edition.
8 Environmental Quality (EQ)
Economic activities dependent on environmental
quality
Tourism; recreation; livelihood; culture value and
identity, health
European Environment Agency (2001) Late lessons from early warnings: the
precautionary principle 1896–2000, Environmental issue report No 22.
The importance of the quality of the environment for economic development and
regeneration in rural areas Final report to the Department for Environment, Food and
Rural Affairs (Defra), 2004
9 Environmental Quality (ERT)
Economic activities dependent on environmental
quality - subset
Env. Related Tourism (ERT), inward investment, house
prices; subset of 8
Engish Nature (2002) Revealing the Value of Nature, working today for nature
tomorrow.
10 Environmental Quality (NRM)
Natural risk management (NRM) - Avalanches,
droughts, floods, fire, coastal erosion, earthquakes,
tsunamis
Residual not captured in 6 - Insurance, protection of
assets, rebuilding
Links between the environment, economy and jobs
GHK in association with CE and IEEP 129
Other related references
General references on environmental innovation and impact on employment
Berg, D and Ferrier, G (1998), Meeting the Challenge: U.S Industry Faces the 21st
Century – The U.S Environmental Industry, U.S. Department of Commerce Office
of Technology Policy
Brooke, C and Rayment, M (1999) The Environment and Regional Economy.
Opportunities for the Regional Development Agencies. RSPB
CES, LEUVEN, K.U. (2002), The Role of Innovation and Policy Design in Energy
and Environment for a Sustainable Growth in Europe, Research Project ENG2-CT-
1999-00002, European Commission Community Research.
DIETZ, E., KUIPERS, R. and SALOMONS, R. (2000), Environment-related
employment in the Netherlands, 1997, Eurostat Working Papers, 2/2000/B/3.
ECOTEC (1994) The Potential for Employment Opportunities from Pursuing
Sustainable Development. Birmingham
EEA European Energy Colloquium (2001), Le progrès technique face aux défis
énergétiques du futur, Paris, 30 Sept.–1 Oct, DATAR / OECD Proceedings - World
Congress on Local Clusters, Paris
European Commission (1997) Communication from the Commission on
environment and employment (Building from a Sustainable Europe) COM (97) 592
Getzner, M and Ritt, T (2004) Quantitative and qualitative employment impacts of
environmental innovations, International Journal of Environmental Technology and
Management, Vol. 4, No. 4
Natural Life Magazine, November/December 2000, ‗Saving the Environment is a
Jobs Engine‘
OECD (2004) Environment and Employment: An Assessment
Renner, M. (2000) Working for the Environment: a growing source of jobs.
Worldwatch Institute. Washington DC
Rennings K, Ziegler A and Zwick, T (2004), The Effect of Environmental
Innovations on Employment Changes: An Econometric Analysis, Business
Strategy and the Environment 13, 374–387
Secrett, C (1999) Making Work The Environment. Economic Report, Volume 14,
No 4. September
Growth of global economy, trade, travel and impact on EU environment
OECD (1999) Foreign Direct Investment and the Environment. Paris
ECOTEC (2002a), EU Eco-Industries: Trade and International Markets,
Birmingham.
Links between the environment, economy and jobs
GHK in association with CE and IEEP 130
Hammond A.L. (2005), The Environment as a Source of Competitive Advantage, in
The Global Competitiveness Report 2005-2006, World Economic Forum, p. 19-
126. Palgrave Macmillan, New York.
Global environmental markets and the UK environmental industry: opportunities to
2010
Policy drivers and other key issues leading to environment-economic activities
Bach, S., Kohlhaas, M., Meyer, B., Praetorius, B. and Welsch, H. (2002), ―The
Effects of Environmental Fiscal Reform in Germany: A Simulation Study‖, Energy
Policy, 30 (9), pp. 803-811. A previous version is available at
http://www.ecotax.info/DIWstudy.pdf
Bayindir-Upman, T. and Raith, M.G. (1998), Should High Tax Countries Pursue
Revenue Neutral Ecological Tax Reforms? Working Paper No.304, University of
Bielefield, Institute of Mathematical Economics
Bosquet, B. (2000), ―Environmental tax reform: Does it work? A survey of empirical
evidence‖, Ecological Economics, 34 (1), pp. 19-32
BOSSIER, F., LEMIALE, L., MERTENS, S., MEYERMANS, E., Van BRUSSELEN,
P. and ZAGAMÉ, P. (1998), An Evaluation of Fiscal Measures for Energy Products
in the European Union: Results from HERMES-Link System, Working Paper 8-98,
Belgian Federal Planning Office. Available at
http://www.plan.be/fr/pub/wp/WP9808/WP9808en.pdf
BOVENBERG, A.L. and VAN DER PLOEG, F (1998), Consequences of
Environmental Tax Reform for Unemployment and Welfare, Environmental and
Resource Economics, 12, pp. 137-150.
BOVENBERG, A.L. (1997), ―Environmental Policy, Distortionary Labour Taxation
in the Presence of Other Taxes: Pollution Taxes and the Double Dividend‖, in
CARRARO, C. and SINISCALCO, D. (Eds.): New Directions in the Economic
Theory of the Environment, Cambridge University Press, p. 69-104.
BOVENBERG, A.L. and GOULDER, L.H. (1996), ―Optimal Environmental Taxation
in the Presence of Other Taxes: General Equilibrium Analysis‖, American
Economic Review, 86 (4), pp. 985-1000.
BOVENBERG, A.L. and DE MOOIJ, R.A. (1994), ―Environmental taxes and
labour-market distortions‖, European journal of political economy, 10 (4), pp. 655-
683.
BUONANNO, P., CARRARO, C. and GALEOTTI, M. (2001), "Endogenous
Technical Change and the Costs of Kyoto", FEEM working paper 64.01. Available
at http://www.feem.it/Feem/Pub/Publications/WPapers/64-
01.htm?WP_Year=2001&WP_Page=1
CAPROS, P., GEORGAKOPOULOS, T., VAN REGEMORTER, D., PROOST, S.,
SCHMIDT, T. and CONRAD, K., (1997), ―The GEM-E3 General Equilibrium Model
for the European Union‖, Economic and Financial Modeling, 4, pp. 51-160.
Links between the environment, economy and jobs
GHK in association with CE and IEEP 131
CARRARO, C., GALEOTTI, M. and GALLO, M. (1996), ―Environmental Taxation
and Unemployment: Some Evidence on the ‗double dividend hypothesis‘ in
Europe‖, Journal of Public Economics, 62 (1-2), pp. 141-181.
Coates, I (2000). TUSDAC Paper. Employment Implications of Environmental
Policy. (DETR, unpublished)
ENERGY JOURNAL, THE (1999), Special Issue ―The Costs of the Kyoto protocol:
A multi-model evaluation‖.
EUROPEAN ACADEMY OF THE URBAN ENVIRONMENT (1997), ―Job creation
in the environmental sector: Local employment initiatives in Europe‖, Berlin.
European Commission, DG Enterprise, (1998) Economic evaluation on
environmental policies and legislation. Study commissioned by Enterprise DG on
economic evaluation on environmental policies and legislation using CBA and
CEA. Brussels
European Commission, DG Enterprise (2001) Business, eco-efficiency and
sustainable development - The role of environmental management tools,
Luxembourg
EUROPEAN ENVIRONMENT AGENCY (2002), "Greenhouse gas emission trends
and projections in Europe: Are the EU and the candidate countries on track to
achieve the Kyoto Protocol targets?" Environmental issue report No.33. See
http://reports.eea.eu.int/report_2002_1205_091750/en/Issue_33_www.pdf
FOUGEYROLLAS, A., LE MOUEL, P. and ZAGAME, P, (2001), Endogenous
Growth and Environmental Regulation: The Case of the Kyoto Protocol, Paper
presented at the 7th Conference of the Society of Computational Economics, Yale
University, June 28-30.
FULLERTON, D. and METCALF, G.E. (2001), ―Environmental controls, scarcity
rents, and pre-existing distortions‖, Journal of Public Economics, 80 (2), pp. 249-
267.
GEDDES, M. (1998), Local Partnership: A Successful Strategy for Social
Cohesion?, Ireland: European Foundation for the Improvement of Living and
Working Conditions.
GOULDER, L.H., PARRY, I.W.H. and BURTRAW, D. (1997), ―Revenue-raising
versus other approaches to environmental protection: the critical significance of
pre-existing tax distortions‖, Journal of Economics, 28 (4), pp. 708-731.
GOULDER, L.H. (1995), ―Environmental Taxation and the Double Dividend: A
Reader's Guide‖, International Tax and Public Finance, 2, pp. 157-183.
HARRISON, G. W. and KRISTRÖM, B. (1997), ―Carbon Taxes in Sweden‖, in
Skatter, miljö och sysselsättning, SOU 1997:11, Underlagsrapporter till
Skatteväxlingskommiténs slutbetänkande.
HAYDEN, M. (1999), Issues in Ecological Tax Reform, Paper presented at the
June 1999 EnvEco Meeting, European Commission, DG II, Brussels, May.
Heady, C., Markandya, A., Blyth, W., Collingwood, J., Taylor, P. (2000) Study of
the Relationship between Environmental/Energy taxation and Employment
Creation. Prepared for European Commission, DG Environment. University of
Bath
Links between the environment, economy and jobs
GHK in association with CE and IEEP 132
Hewett, C and Foley, J (2000) Employment Creation and Environmental Policy: a
literature review
HILL, M. (1998), Green Tax Reform in Sweden: The Second Dividend and the
Cost of Tax Exemptions, Working Paper No.119, The Beijer Institute of Ecological
Economics, Stockholm, Sweden.
SINISCALCO, D. (Eds.), Environmental Fiscal Reform and Unemployment,
FEEM/Kluwer
Ekins, P, Hough, C and Russell, A (1999) The 20% Solution: Meeting the
Government's Targets on Climate Change. Forum for the Future. Policy Briefing
AEA Technologies and Metroeconomica (2004) Study No1 - A Comparison of EU
Air Quality Pollution Policies and Legislation in Other Countries – Review of the
Implications for the Competitiveness of European Industry, DG Enterprise,
European Commission.
Swedish Environment Protection Agency, Naturgrusskatten –utvärdering av
skatteeffekterna, report no 5077, 2000.
Economic impact of climate change mitigation and adaptation
CEBRYK, N., MAY, K., RENSONNET, A. and SONNEN, C. (2000),
Macroeconomic Impacts of Greenhouse Gas Reduction Options: National and
Provincial Effects, Executive Summary, Informetrica. Available at
http://www.informetrica.com/ILAMGReport.htm
EDMONDS, J., ROOP, J.M. and SCOTT, M.J. (2000), Technology and the
Economics of Climate Change Policy, Pew Center on Global Climate Change
Report, Battelle, Washington, D.C. Available at
http://www.pewclimate.org/projects/technology_economics.pdf