links positioning strategy simulation - links simulations
TRANSCRIPT
LINKS Positioning
Strategy Simulation
Revised February 2018
Randall G. Chapman, PhD

RG Chapman PhD, "LINKS Positioning Strategy Simulation" 2
Copyright (c) 2006-2018 by Randall G Chapman LINKS® is a registered trademark of Randall G Chapman. All rights reserved.

RG Chapman PhD, "LINKS Positioning Strategy Simulation" 3
Table of Contents
Introduction .................................................................................................................... 5
Why Use Simulations? ............................................................................................... 6
Some General Advice About LINKS ........................................................................... 7
The Marketplace ......................................................................................................... 8
Decisions ...................................................................................................................... 10
Set-Top Box Configurations ...................................................................................... 10
Product Costs .......................................................................................................... 11
Reconfigurations ...................................................................................................... 12
Patents ..................................................................................................................... 12
Price Decisions ......................................................................................................... 13
Marketing Spending Decisions ................................................................................. 16
Marketing Communications Positioning Decisions .................................................. 16
Introduction/Drop Decisions ...................................................................................... 18
Service Decisions ..................................................................................................... 19
Sales Volume Forecasting Decisions ........................................................................ 19
Firm Name ............................................................................................................... 20
Marketing Research Studies ..................................................................................... 22 Research Study #1: Benchmarking - Earnings ............................................................... 23 Research Study #2: Benchmarking - Balance Sheets .................................................... 24 Research Study #3: Benchmarking - Product Development ........................................... 24 Research Study #9: Benchmarking - Generate Demand ................................................ 24 Research Study #11: Benchmarking - Operating Statistics ............................................ 25 Research Study #12: Market Statistics .......................................................................... 26 Research Study #14: Regional Summary Analysis ......................................................... 27 Research Study #20: Customer Satisfaction .................................................................. 28 Research Study #23: Concept Tests ............................................................................. 28 Research Study #24: Price Sensitivity Analysis .............................................................. 29 Research Study #27: Marketing Program Benchmarking ............................................... 31 Research Study #28: Marketing Program Experiment .................................................... 32 Research Study #30: Conjoint Analysis ......................................................................... 33 Interpreting Conjoint Analysis Results: A Tutorial ........................................................... 37 Research Study #31: Self-Reported Preferences ........................................................... 40 Research Study #33: Value Maps.................................................................................. 42 Research Study #35: Market Structure Analysis ............................................................ 43 Research Study #38: Retention Statistics ...................................................................... 44 Interpreting Retention Statistics and Customer Lifetime Value: A Tutorial ....................... 45 Research Study #39: Benchmarking - Product Variable Cost Estimates ......................... 47
Decision Forms ............................................................................................................ 48
Financial Reports ......................................................................................................... 52
Performance Evaluation ............................................................................................... 65
Appendix: Web-Based LINKS Access ........................................................................ 67

RG Chapman PhD, "LINKS Positioning Strategy Simulation" 4

RG Chapman PhD, "LINKS Positioning Strategy Simulation" 5
Introduction
"A company can outperform rivals only if it can establish a difference that it can
preserve. Competitive strategy is about being different, deliberately choosing
a different set of activities to deliver a unique value mix." – Michael Porter
In LINKS, your team manages a firm in the set-top box industry. You'll be competing against
other firms in your own simulated industry. Your goal in the LINKS Positioning Strategy
Simulation is to improve your firm's long-run financial performance.
As your team assumes managerial control at the end of quarter 3, your set-top box firm's product
line consists of two products, a low-quality low-priced product 1 and a high-quality high-priced
product 2 ("high-quality" or "higher-quality" to some customers, at least). Both products are
profitable at the end of quarter 3, although profitability varies by product and market region.
All firms in your industry have been emulating each other for some time,
so your competitors have exactly the same products, priced and
marketed identically to your firm’s products. While your firm and your
competitors have had the identical marketing programs in place
throughout quarters 1, 2, and 3, there are some differences in market
standing due to the normal randomness inherent in the sales generation
process in the set-top box industry.
As you assume managerial control of your firm at the end of quarter 3,
these notable opportunities and challenges exist for your firm and for
your competitors in the LINKS Positioning Strategy Simulation set-top box industry:
Your firm now has access to a third product. Product 3 needs to be configured and launched
in one or more market regions. Product 3's current configuration is the same as product 1, so
there's no reason to launch product 3 as it's currently configured. You already have a well-
established product 1 with that configuration. Your management challenge is to work through
the product development process and ultimately launch product 3 to contribute positively to
your firm's long-run financial performance.
A new technological advance present opportunities and challenges. Accessible to all firms in
your set-top box industry, this technological advance extend the range of options for
configuring your set-top box products. Memory capacity is a new set-top box product
attribute (feature-set element). Your management challenge is to assess if this
technological advance is worth incorporating into one or more of the three products (SKUs) in
your set-top box product line. Product reconfigurations would be required to embrace this
technological advance, so the associated costs and benefits must be assessed carefully.
Emulating competitors exactly with all products and generate demand programs in all markets
hardly seems consistent with achieving superior long-run financial performance. Product
reconfigurations and/or generate demand (price and marketing) program adjustments may be
needed in your existing product line (i.e., for products 1 and 2). Furthermore, you're not required
to actively distribute your products in all market regions. Perhaps your firm's long-run financial
performance can be improved by being more selective and focused in the market regions where
you distribute your products.

RG Chapman PhD, "LINKS Positioning Strategy Simulation" 6
In addressing these interrelated opportunities and challenges, you need to be mindful of the
simulation's prime directive: improve your firm's long-run financial performance. Remember, too,
that you're operating in a dynamic competitive marketplace. Your firm's performance will be
influenced by how your competitors respond to these issues.
Speed matters in the set-top box industry. Early reconfigurations secure a degree of patent
protection, capture first-to-market early volume, and, hopefully, garner profits that accrue for
longer than later entrants. Of course, it's not simply being "first" but being early-to-market with a
superior offering valued by customers.
Within the LINKS Positioning Strategy Simulation, your team's performance will be evaluated
based on a multi-factor, balanced scorecard evaluation system. Your instructor may require a
written report of your strategies, tactics, and performance and/or a post-event public presentation
of your team's actions, performance, and learnings in this simulation. Details about your particular
post-simulation deliverables will be provided by your instructor.
Why Use Simulations?
"I hear and I forget; I see and I remember; I do and I understand." – Confucius
Why use simulations in management education? Why not use traditional classroom lectures,
perhaps combined with case studies? Adults learn best by doing. "Doing" involves taking
responsibility for one's actions, receiving feedback, and having an opportunity to improve through
time. In management education and training settings, management simulations support learning
in a non-threatening but competitive environment of the kind that real managers face every day.
Like an airline pilot flight simulator, a management simulator allows rapid time compression, quick
feedback to the learner, and is a low-risk process (except to one's ego). A well-designed
management simulator can provide the student with a realistic education and training experience
in the relative safety of the simulation’s operating environment. And, perhaps more importantly,
the lessons learned in the management simulator environment occur within hours or days, not the
months, quarters, or years associated with real life.
Here are the classic reasons to favor management simulations in adult-learning environments.
Compared to traditional lecture/case/discussion educational events, simulations:
Reflect active not passive participation, enhancing learning motivation.
Apply key management concepts, especially coordination and planning.
Demand analysis and decisions in the context of market-based feedback in the presence of
thoughtful, vigilant competitors.
Provide rapid feedback, encouraging participants to learn from their successes and failures
within a relatively low-risk competitive environment.
Provide learning variety through novel learning environments.

RG Chapman PhD, "LINKS Positioning Strategy Simulation" 7
Some General Advice About LINKS
"The fight is won or lost far away from witnesses, behind the lines in the gym and
out on the road, long before I dance under those lights." – Muhammad Ali
Based on extensive observations of the performance of thousands of past LINKS participants,
these general suggestions and summary-advice nuggets are of well-proven value:
Read and re-read this LINKS participant's manual (there's lots of good stuff in it).
Regularly think about general business and management principles and how they might relate
to and work within LINKS.
You don't have to know everything about the LINKS set-top box industry at the beginning of
the exercise, but you must consistently increase your knowledge base through time.
"Share toys" (i.e., work at sharing useful fact-based analyses and insights with all of your team
members). "Knowing" something important personally is only a part of the LINKS
management challenge. Exploiting that knowledge effectively throughout all of your LINKS
team's deliberations, with and through your whole team, is the key to harvesting the maximum
ROI from your data, analysis methodologies, insights, and knowledge.
Get the facts and base your decisions on the facts, not on wishes, hopes, and dreams.
Continually strive to see the whole demand-chain within the LINKS set-top box industry. Don't
focus myopically on a single part of the LINKS demand-chain without regard for how it relates
to, and is influenced by, other LINKS parts and to the "whole" of LINKS. The source of the
"LINKS" name is the simulation's focus on managing the interrelationships, the linkages,
among all demand-chain elements.
Remember the Ferengi proverb (for Star Trek fans): "There is no honor in volume without
profit." Volume, sales, and market share are easy to obtain, if there are no constraints on
profitability. Profitable volume is the "holy grail" in business and in LINKS.
Completion of the LINKS Positioning Strategy Simulation involves the following elements:
(1) Pre-Simulation: Read/study the background information in this document. This will require
several hours of time. This background information includes your quarter 1 results so that
you'll be able to review your firm's starting position. Your quarter 3 results will be provided to
you when the simulation exercise actually begins. You'll be working as part of a team in the
LINKS Positioning Strategy Simulation. While there's no need to meet with your teammates
prior to the commencement of the simulation, it's important that you be personally prepared
when the simulation begins.
(2) Within-Simulation: In each quarter in the LINKS Positioning Strategy Simulation:
Review your financial and marketing research reports with your team.
Analyze your firm's performance. How can you improve your firm's long-run financial
performance? What marketing research do you need?
One team member inputs your decision variable changes and marketing research orders
for the next quarter into the LINKS Simulation Database. This takes about 10 minutes;
plan your team meeting time accordingly.
Submit your decision inputs for the next quarter by the scheduled time.
The suggested reading strategy for the LINKS participant's manual is to:
browse through the whole document to get a general feel for this simulation
read this document once from beginning to end
re-read parts of this document as necessary during the simulation exercise.
This LINKS Positioning Strategy Simulation participant’s manual includes many tabular exhibits.

RG Chapman PhD, "LINKS Positioning Strategy Simulation" 8
To facilitate convenient access to these exhibits for on-going referencing during your LINKS
exercise, these exhibits have been included in an Excel spreadsheet. To access/download this
Excel spreadsheet, point your favorite browser to this case-sensitive URL:
http://www.LINKS-simulations.com/PS/ExhibitsPS.xls
The Marketplace
"Just because the river is quiet does not mean the crocodiles have left." – Malay Proverb
LINKS firms manufacture and market set-top boxes. A set-top box is a high-tech electronics
product purchased by individual consumers for home use and by a wide range of businesses for
office and manufacturing/operations environment uses. LINKS set-top boxes are "fourth
generation" versions which include telephony applications (such as internet-based long-distance
calling, interactive video conferencing, and interactive TV), local-area wireless networking,
control/monitoring of a wide range of within-area electrical appliances and devices, digital media
server, basic virtual reality, and teleportation enhancement capabilities.
Your particular set-top box sub-category is hyperware. Your firm has three products, referenced
as "f-p" (for firm "f" and product "p"). For example, product 4-1 refers to product 1 of firm 4. Your
manufacturing plant in market region 1 produces finished set-top boxes that are shipped to
customers in all market regions served by your firm.
There is one sales channel within the LINKS market regions: a dealer (distributor/retail) channel.
The dealer (distributor/retail) channel serves individual consumers who purchase set-top boxes for
home use and businesses with set-top box needs. Dealers stock set-top boxes along with an
array of other similar and complementary electronic products. Dealers provide point-of-purchase
support for in-person shoppers.
The demand-supply chain architecture in the LINKS set-top box industry is described in the
following graphic:
Your LINKS firm is a set-top box manufacturer. Your manufacturing firm distributes your products
MMaannuuffaaccttuurreerrss
Build-To-Plan
Set-Top Box
Manufacturers
Who Produce
and Market
“Low-End” and
“Mid-Range”
Set-Top Boxes
to End-User
Consumers Via
a Retail Channel
CCuussttoommeerrss
End-User
Consumers
(Individuals,
Families,
Businesses,
and Not-For-
Profit and
Government
Organizations)
RReettaaiilleerrss
Small,
Medium,
and Large
Retail
Chains and
Independent
Retail Stores
SSuupppplliieerrss
Raw Material
Suppliers
Sub-
Assembly
Component
Suppliers
Carriers

RG Chapman PhD, "LINKS Positioning Strategy Simulation" 9
via retailers in each of your market regions. End-user customers (consumers) purchase set-top
boxes from retailers.
Each LINKS decision round is one calendar quarter. There is no known time-of-year seasonality
within the hyperware market of interest in the LINKS Positioning Strategy Simulation.
The LINKS currency unit is the LCU, the "LINKS Currency Unit." The LCU is
abbreviated "$" and pronounced Ldollar ("el-dollar"). The "LINKS Currency
Unit" (LCU) is a Euro-like multi-country currency.
In your travels, you might have encountered the "$" symbol associated
with currencies in Australia, the Bahamas, Barbados, Belize, Bermuda, Brunei Darussalam,
Canada, Cayman Islands, Fiji, Guyana, Hong Kong, Jamaica, Liberia, Namibia, New Zealand,
Singapore, Solomon Islands, Suriname, Taiwan, Trinidad/Tobago, the United States, and
Zimbabwe. That's merely a coincidence. The "$" currency symbol is widely known to have
originated with the Ldollar.

RG Chapman PhD, "LINKS Positioning Strategy Simulation" 10
Decisions
"Success doesn't come to you. You go to it." – Marva Collins
In the LINKS Positioning Strategy Simulation, you'll be responsible for these decisions each
decision round (quarter):
Product Development: Product configuration/reconfiguration decisions.
Generate Demand: Price, marketing spending, marketing mix allocation, communications
positioning, and introduction/drop decisions for each product and region.
Service: Service outsourcing level in each region.
Forecasting: Next-quarter sales volume forecasts for each product and region.
Other Decisions: Firm name.
Research Studies: Ordering specific marketing research studies.
All decisions (except research studies decisions that are only for the next quarter) are permanent
standing orders. If you're happy with a current decision, no explicit decision change is required.
Set-Top Box Configurations
Each of your three set-top box products is defined by a configuration that is expressed as a
seven-character code with the following elements and interpretations:
(1) Product form: "H" for hyperware
(2) Raw material Alpha: 0-9 (number of kilograms)
(3) Raw material Beta: 0-9 (number of kilograms)
(4) Bandwidth: 1-7 (terahertz)
(5) Warranty: corporate policy is to offer a 0-quarter warranty (i.e., no warranty)
(6) Packaging: "1" (standard), "2" (premium), or "3" (environmentally sensitive premium).
(7) Memory Capacity: 0-3 (disks).
For example, H553010 is a hyperware set-top box with 5 kg of raw material Alpha, 5 kg of raw
material Beta, bandwidth of 3 terahertz, warranty of 0 quarters, standard packaging, and 0
memory disks.
Each product may have only one configuration at a time and that configuration is the same
in all market regions. With varying customer preferences across regions, the implication is that
trade-offs may be required in meeting customers' heterogeneous preferences. It is, of course,
possible to target a product's configuration toward the preferences of particular customers. But,
that might be to the detriment of customers in other regions who prefer alternate configurations.
In addition to one Epsilon sub-assembly component, set-top boxes in the hyperware sub-category
require a Gamma sub-assembly component. A variety of suppliers provide sub-assembly
components and alternative suppliers' offerings are fully interchangeable in manufacturing. Thus,
since their particular "value" (supplier) doesn't impact configuration, sub-assembly components
are not a formal part of the set-top box configuration.
You’ll need to conduct appropriate research to assess customers’ preferences for Alpha and
Beta in set-top boxes. For bandwidth and packaging, “more-is-always-better” for all customers

RG Chapman PhD, "LINKS Positioning Strategy Simulation" 11
and all markets. However, larger or smaller Alpha and Beta levels could be preferred by
customers in particular markets, channels, and regions. Larger Alpha and larger Beta values
are not necessarily preferred. Set-top box customers may prefer particular Alpha and Beta
levels (not necessarily equal, of course), with deviations from preferred Alpha and Beta levels
resulting in lower-quality customer perceptions.
Product Costs
The goal of your positioning strategy efforts in the LINKS Positioning Strategy Simulation is to
improve your firm's long-run financial performance. Product repositionings influence both
revenues and costs. Costs are obviously easier to forecast than sales volumes and revenues,
since costs arise from within-firm manufacturing functions using existing technology. The
following paragraphs provide relevant cost-related information that you'll need to take into account
in your repositioning efforts and in your efforts to manage your LINKS firm.
Your input and manufacturing costs for hyperware set-top box products are as follows:
Raw Materials: Raw materials Alpha and Beta are single-grade commodities purchased at
common world prices. In-bound transportation costs are covered by raw material suppliers.
All raw materials are always delivered for use within the current quarter's production activities.
The current prices of raw materials are $3/kg for Alpha and $4/kg for Beta. Raw materials
vendors provide inbound just-in-time transportation as part of their bundled prices, so you
never have any raw materials inventory.
Sub-Assembly Components: Gamma and Epsilon sub-assemblies cost $17 and $24 per
unit, respectively. Customers (e.g., your firm) arrange and pay for the transportation
associated with in-bound sub-assembly components. Gamma and Epsilon sub-assembly
components cost $4/unit and $6/unit, respectively, for transportation. Sub-assembly
component suppliers provide just-in-time service, so you never have to carry any inventory.
Labor and Production: Labor and production costs (per unit) for hyperware products are
$30 and $20, respectively. Your manufacturing plant has the flexibility to produce on-demand
so you never have any finished goods inventory.
Outbound Transportation Costs: Customer shipment transportation costs per-unit for
hyperware products sourced from your manufacturing plant in market region 1 are as follows:
$4, $18, and $26 per-unit to market regions 1, 2, and 3, respectively.
Costs other than those related to raw materials, sub-assembly components, labor/production, and
transportation are detailed below:
Bandwidth: $10+0.5(T*T*T) where T is a product's terahertz rating. Bandwidth of 1 terahertz
costs $10.50 while bandwidth of 6 terahertz costs $118. You have the engineering capability
to include any level of bandwidth in your set-top box products, within the technology range 1-7.
Bandwidth is a "more-is-better" attribute. Terahertz is just an industry-specific, generally-
accepted metric describing the bandwidth performance of a set-top box. Customers will
always prefer more bandwidth, but they might or might not prefer it enough to offset the
additional bandwidth costs. You'd need to conduct appropriate research to assess customer
preferences for higher bandwidth levels and then compare that preference to your input costs
of providing higher bandwidth.
Warranty: Corporate policy is to offer no warranty with your set-top boxes, so there are no
associated warranty costs.
Packaging: "1" (standard) packaging costs $10 per unit, "2" (premium) packaging costs $14

RG Chapman PhD, "LINKS Positioning Strategy Simulation" 12
per unit, and "3" (environmentally sensitive premium) packaging costs $28 per unit. More
expensive, premium packaging presumably has positive generate demand implications and
provides greater physical protection during shipping, resulting in somewhat reduced failure
rates in the field (i.e., lower failure rates to customers). "3" packaging denotes premium
packaging with environmentally sensitive design, construction, and materials.
Memory Capacity: Memory capacity ranges from 0 to 3 with these per-unit costs: $0, $10,
$25, and $45, respectively. Memory capacity refers to the pre-engineered capacity for
optional additional memory chips and disks included in the set-top box configuration. Optional
memory chips and disks are purchased, installed, and configured by the set-top box customer
after (sometimes many months after) the original purchase of the set-top box product.
Customers will always prefer more memory capacity, but they might not prefer it enough to
offset the additional memory capacity costs. You'd need to conduct appropriate research to
assess customer preferences for higher memory capacity levels and then compare that
preference to your input costs of providing higher memory capacity.
Reconfigurations
Any change in the configuration of a set-top box is a product reconfiguration. A reconfiguration
involves a change in one or more of Alpha, Beta, bandwidth, warranty, packaging, and
memory capacity. Any configuration change incurs charges of $1,000,000, plus an additional
$100,000 per configuration element that is changed. These costs cover all of the necessary
engineering, retooling, testing, and administrative activities related to implementing the
reconfiguration request. If you reconfigure a set-top box by changing three of its elements
simultaneously, the total associated reconfiguration cost is $1,300,000. Reconfiguration occurs
immediately, so the next quarter's production involves the reconfigured product.
Due to the workload associated with a reconfiguration, you are limited to reconfiguring at most
one product per quarter. This single product reconfiguration may involve changing more than
one element of a product's existing configuration.
Patents
Patent royalties are payable whenever a reconfigured product lies within the pre-existing protected
patent zone for another hyperware set-top box product. The protected patent zone is the sum of
the absolute values of the Alpha, Beta, bandwidth, warranty, packaging, and memory capacity
differences in two product configurations. For example, the product configurations H321110 and
H452120 have a patent zone difference of (4-3) + (5-2) + (2-1) + (1-1) + (2-1) + (0-0) = 6.
Patent zone differentials of 0, 1, 2, 3, 4, 5, 6, and 7 points involve patent royalties of
$1,000,000, $500,000, $250,000, $125,000, $62,500, $31,250, $15,625, and $7,812 No patent
royalties are payable for patent zone differentials of eight or more.
Patent royalties are one-time payments made by manufacturers of patent-violating
reconfigured products. Patent royalties are only payable in the quarter in which a patent-
violating reconfiguration occurs. Royalties are paid by patent-violating reconfigurations to
competitors whose patents are violated. That is, one firm’s “royalties paid” are another firm’s
“royalties received.”

RG Chapman PhD, "LINKS Positioning Strategy Simulation" 13
Other patent royalties considerations follow:
(1) No patent royalties are paid by or paid to
original quarter-1 product configurations
by other firms' quarter-1 product
configurations. But, any reconfigurations
violating still-existing patents of quarter-1
product configurations are subject to
patent royalty payments according to the
schedule described above.
(2) Patent royalties are payable only to
pre-existing patents, not to competitors’
products reconfigured simultaneously with
your reconfiguration (i.e., in the same
quarter that you reconfigure a product).
(3) Multiple patent zone violations are possible on any reconfiguration. The patent royalty
payments described above are payable for each patent zone violation.
(4) Patent royalties (receipts and disbursements) are reported on your "Corporate P&L
Statement."
Price Decisions
You set prices for each actively distributed product in each market region. The dealer channel
price is the bulk-rate price for all units purchased for resale by dealers. The custom in the set-top
box industry is to quote a single price regardless of order volume. You do not control final selling
prices in the dealer channel. Rather, your manufacturer price is marked up by some percentage
dealers in the various regions. You will need to consult current research studies to determine
average dealer prices for your products in the various market regions.
Prices affect customer demand in the usual fashion within the set-top box industry. Higher prices
are normally associated with lower customer demand. The specific price sensitivities in the LINKS
markets are unknown. You will need to learn about the markets' responsiveness to price through
your experience in LINKS and by exploiting available LINKS research studies.
In addition to the physical costs of producing and distributing updated price sheets, lists, and
databases that accrue when a manufacturer changes price (so-called “menu costs”), a range of
indirect and non-obvious costs arise with price adjustments.1
1 Recent published research documents the range of direct and indirect costs associated with price
adjustments for a large U.S. industrial manufacturer (more than one billion USD$ revenues selling 8,000
products [used to maintain machinery] through OEMs and distributors). The authors found that
managerial costs are more than 6 times, and customer-facing costs are more than 20 times, the so-called
“menu costs” (physical costs) associated with price adjustments. In total, price adjustment costs comprise
1.22% of the company’s revenue and 20.03% of the company’s net margin. {Source: Mark J. Zbaracki,
Mark Ritson, Daniel Levy, Shantanu Dutta, and Mark Bergen, “Managerial and Customer Costs of Price
Adjustment: Direct Evidence From Industrial Markets,” The Review of Economics and Statistics,
Volume 86, Number 2 (May 2004), pp. 514-533.}
FAQ
"If we reconfigure immediately by just one 'unit'
(e.g., change Bandwidth by 1), what are the
patent royalty implications?" Such a minor
reconfiguration would violate all other firms'
existing patent protection (in that set-top box
category), since all firms' products are initially
configured identically in each set-top box
category. Thus, there would be some fairly
substantial patent royalties to pay with such a
minor reconfiguration.
RG Chapman PhD, "LINKS Positioning Strategy Simulation" 14
Managerial Costs: A manufacturer must gather information, analyze, assess, and ultimately
communicate the logic associated with price changes throughout their firm. Managerial
costs presumably increase with larger price changes, since there is more to assess/analyze
and more organizational members become involved with larger price changes.
Customer-Facing Costs: When implementing price changes, a communications program
must be created and executed to portray a price change in the most favorable light to
customers. In a B2B environment, price adjustments potentially involve (re)negotiation with
those customers who are resistant to new (higher) prices.
In LINKS, each price change by your manufacturing firm for a product in a channel in a market
region results in $10,000 in costs plus $200 in costs per-dollar change in price (increase or
decrease in price) plus costs of 0.25% of current-quarter revenues.2 For example, a $75
change in price on a product with revenues of $4,500,000 in a particular channel and region
incurs price change costs of $10,000 + ($200)(75) + (0.0025)($4,500,000) = $10,000 + $15,000
+ $11,250 = $36,250. These price change costs are recorded as “Price Changes” in the “Fixed
and Other Costs” section of your firm’s profit-and-loss statements in the quarter in which the
price change occurs.
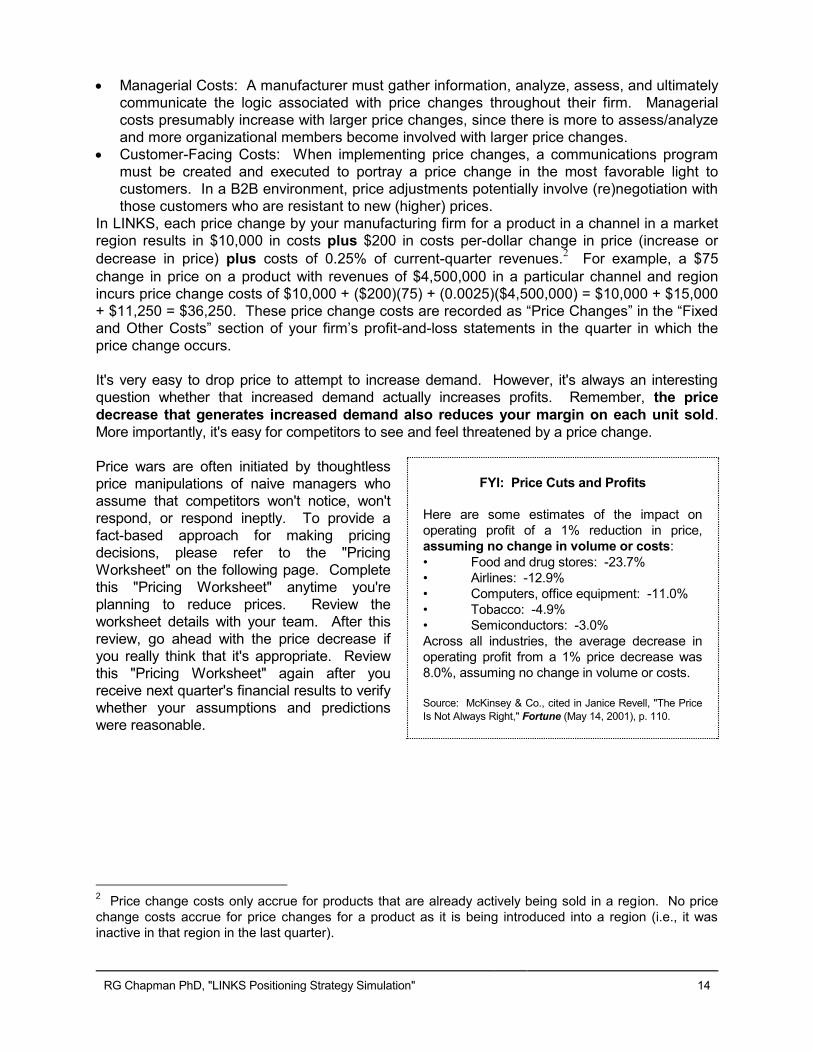
It's very easy to drop price to attempt to increase demand. However, it's always an interesting
question whether that increased demand actually increases profits. Remember, the price
decrease that generates increased demand also reduces your margin on each unit sold.
More importantly, it's easy for competitors to see and feel threatened by a price change.
Price wars are often initiated by thoughtless
price manipulations of naive managers who
assume that competitors won't notice, won't
respond, or respond ineptly. To provide a
fact-based approach for making pricing
decisions, please refer to the "Pricing
Worksheet" on the following page. Complete
this "Pricing Worksheet" anytime you're
planning to reduce prices. Review the
worksheet details with your team. After this
review, go ahead with the price decrease if
you really think that it's appropriate. Review
this "Pricing Worksheet" again after you
receive next quarter's financial results to verify
whether your assumptions and predictions
were reasonable.
2 Price change costs only accrue for products that are already actively being sold in a region. No price
change costs accrue for price changes for a product as it is being introduced into a region (i.e., it was
inactive in that region in the last quarter).
FYI: Price Cuts and Profits
Here are some estimates of the impact on
operating profit of a 1% reduction in price,
assuming no change in volume or costs:
• Food and drug stores: -23.7%
• Airlines: -12.9%
• Computers, office equipment: -11.0%
• Tobacco: -4.9%
• Semiconductors: -3.0%
Across all industries, the average decrease in
operating profit from a 1% price decrease was
8.0%, assuming no change in volume or costs.
Source: McKinsey & Co., cited in Janice Revell, "The Price
Is Not Always Right," Fortune (May 14, 2001), p. 110.

RG Chapman PhD, "LINKS Positioning Strategy Simulation" 15
Pricing Worksheet
This pricing worksheet is designed to provide an analysis framework anytime you are
contemplating decreasing prices within LINKS.
Complete the "Before" columns and review the "Before" columns with your team members.
Complete the "After" column with actual data from the next quarter, after the results are available.
Review the before-after comparison with your team members.
Firm Product Region Quarter
Before Action Analysis,
Review, and Forecast
After Action
Review
Last
Quarter,
Actual
Next
Quarter,
Predicted
Next
Quarter,
Actual
Industry Sales Volume [units]
* Volume Market Share [%s]
= Sales Volume [units]
* Manufacturer Price [$]
= Revenue [$]
- Variable Costs [$]
= Gross Margin [$]
- Fixed Costs [$]
= Operating Income [$]

RG Chapman PhD, "LINKS Positioning Strategy Simulation" 16
Marketing Spending Decisions
A marketing spending budget is required for each set-top box product in each market region. This
budget is managed by the relevant region managers in your firm and is used for advertising,
promotion, and sales force efforts associated with your products. You are free to allocate funds to
marketing spending as you see fit. Spending does not have to be equal in all regions.
Significant percentages of advertising and promotion budgets are automatically spent on digital
marketing, as is typical practice in other comparable industries. This includes allocations to
Facebook, YouTube, and Google, for example, as well as location-based mobile marketing.
Marketing spending is thought to increase customer demand for set-top box products. Past
industry practice has been to budget at least $50,000/quarter in marketing spending in all regions
within which a set-top box product is actively distributed. It is thought that marketing spending's
impact on customer demand declines at higher expenditure levels, but the precise form of the
relationship between marketing spending and sales is unknown. You will have to learn about the
influence of marketing spending on sales through your experience within the set-top box industry
If you drop a product from a region, you must change marketing spending to $0. Otherwise,
marketing spending continues to occur, in anticipation of a future relaunch.
In addition to overall marketing spending decisions for each product/region, marketing mix
allocation decisions are also required. Marketing mix allocation refers to the distribution of a
marketing spending budget across advertising, promotion, and sales force programs in support
of each product in each region. Obviously, these three percentages must sum to 100% for
each product in each region
Advertising programs are implemented by your firm's advertising agency in each market region
in which your firm operates. Your regional sales managers implement promotional and sales
force programs in your market regions. Sales force programs can include both internal sales
representatives (company employees) and external sales representatives (independent sales
representatives who work for several non-competing companies simultaneously).
Your 6-digit marketing mix allocation (excluding "%" symbols) specifies the 2-digit percentage
allocations of your total marketing spending budget to advertising, promotion, and sales force
programs, respectively. You must allocate at least 10% of your marketing spending
budget to each of advertising, promotion, and sales force. For example, the 6-digit
marketing mix allocation 113653 specifies that 11%, 36%, and 53% of the total marketing
spending budget is allocated to advertising, promotion, and sales force programs, respectively.
You are, of course, free to vary your marketing mix allocations across your products and
regions, as you see fit.
Marketing Communications Positioning Decisions
Each set-top box product in each market (channel and region) has a marketing positioning to
guide advertising, promotion, and sales force efforts. Marketing positioning communicates the
value proposition that a product offers to customers in a market.

RG Chapman PhD, "LINKS Positioning Strategy Simulation" 17
Marketing positioning includes both “how to say it” (competitive positioning) and "what to say"
(benefit proposition). LINKS firms select a two-digit marketing positioning code for each product
in each market (channel and region).
First Digit: “How To Say It”
(Competitive Positioning)
Examples of “how to say it” include marketing
communications claims of more benefits for
the same price as competitors or equivalent
competitive benefits but at a lower price.
Second Digit: “What To Say”
(Benefit Proposition)
Examples of “what to say” include marketing
communications claims of superiority in
product quality, service quality, or availability
either individually or in combination.
“How to say it" (competitive positioning), the first digit in a LINKS marketing positioning
code, reflects a firm’s decision about focusing on benefit(s) exclusively, price exclusively, or
explicitly compare benefit(s) to price within marketing positioning. Your firm may use the
adjectives "more," "same," or "less" to describe your product offering relative to competing
products targeted at a specific market segment in a particular market (channel and region).
Different combinations of these competitive positioning options (benefits and price) produce eight
meaningful marketplace positions. These eight competitive positioning options, and their
associated LINKS codes, are described in the following table. Dominated options, such as less
benefits at a higher relative price, are "blacked out" (i.e., infeasible) because they are always
inferior to other competitive positioning options.
"Benefit"
More Same Less No Mention
More 1 7
(Exclusive
Price
Emphasis)
Price Same 2 3
Less 4 5 6
No Mention 8 (Exclusive "Benefit" Emphasis)
“What to say” (benefit proposition), the second digit in a LINKS marketing positioning
code, is an articulation of the specific benefit(s) offered by a product. These benefits are what the
customer receives from purchasing and using a set-top box product. For example, a set-top box
product might provide benefits because it is better designed to match customer preferences, it
delivers a superior service experience, or it is more accessible/available to customers. In LINKS,
the specific benefit emphasis possibilities include product quality, service quality, and availability.
"Product Quality" is perceived product quality, reflecting customers' perceptions of a
product's configuration and its reliability and performance in actual usage.
"Service Quality" is perceived service quality, reflecting customers' perceptions of the
service quality associated with a product. Service quality derives from experiences with a
firm's regional call centers.
"Availability" is perceived product availability, reflecting customers' perceptions of a
product's top-of-mind awareness, channel presence, distribution accessibility, ease of
access, convenience to purchase, and general presence/prominence in the market place.
A product’s marketing positioning may focus on one, two, or all three of these benefits. Note that
RG Chapman PhD, "LINKS Positioning Strategy Simulation" 18
price is not a benefit to customers, but rather reflects the economic cost incurred to obtain the
offering's benefit(s). Price positioning is included within the first part of the marketing positioning
decision, "how you say it" (competitive positioning).
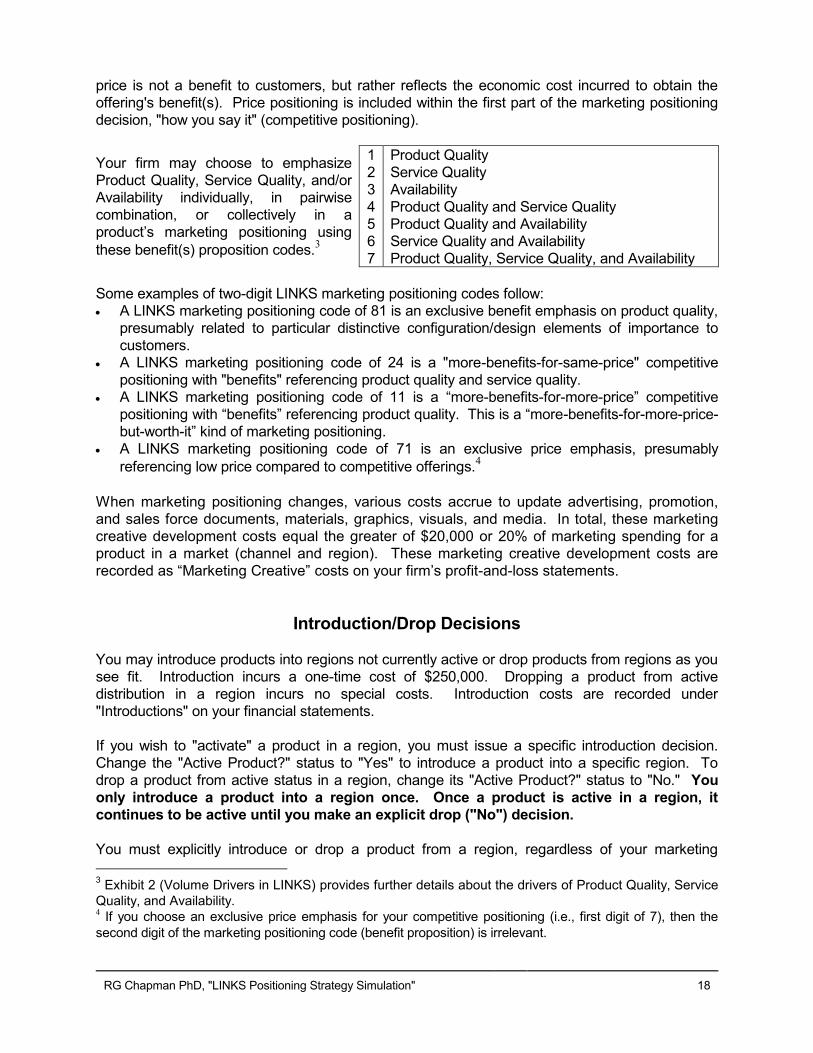
Your firm may choose to emphasize
Product Quality, Service Quality, and/or
Availability individually, in pairwise
combination, or collectively in a
product’s marketing positioning using
these benefit(s) proposition codes.3
1
2
3
4
5
6
7
Product Quality
Service Quality
Availability
Product Quality and Service Quality
Product Quality and Availability
Service Quality and Availability
Product Quality, Service Quality, and Availability
Some examples of two-digit LINKS marketing positioning codes follow:
A LINKS marketing positioning code of 81 is an exclusive benefit emphasis on product quality,
presumably related to particular distinctive configuration/design elements of importance to
customers.
A LINKS marketing positioning code of 24 is a "more-benefits-for-same-price" competitive
positioning with "benefits" referencing product quality and service quality.
A LINKS marketing positioning code of 11 is a “more-benefits-for-more-price” competitive
positioning with “benefits” referencing product quality. This is a “more-benefits-for-more-price-
but-worth-it” kind of marketing positioning.
A LINKS marketing positioning code of 71 is an exclusive price emphasis, presumably
referencing low price compared to competitive offerings.4
When marketing positioning changes, various costs accrue to update advertising, promotion,
and sales force documents, materials, graphics, visuals, and media. In total, these marketing
creative development costs equal the greater of $20,000 or 20% of marketing spending for a
product in a market (channel and region). These marketing creative development costs are
recorded as “Marketing Creative” costs on your firm’s profit-and-loss statements.
Introduction/Drop Decisions
You may introduce products into regions not currently active or drop products from regions as you
see fit. Introduction incurs a one-time cost of $250,000. Dropping a product from active
distribution in a region incurs no special costs. Introduction costs are recorded under
"Introductions" on your financial statements.
If you wish to "activate" a product in a region, you must issue a specific introduction decision.
Change the "Active Product?" status to "Yes" to introduce a product into a specific region. To
drop a product from active status in a region, change its "Active Product?" status to "No." You
only introduce a product into a region once. Once a product is active in a region, it
continues to be active until you make an explicit drop ("No") decision.
You must explicitly introduce or drop a product from a region, regardless of your marketing
3 Exhibit 2 (Volume Drivers in LINKS) provides further details about the drivers of Product Quality, Service
Quality, and Availability. 4 If you choose an exclusive price emphasis for your competitive positioning (i.e., first digit of 7), then the
second digit of the marketing positioning code (benefit proposition) is irrelevant.
RG Chapman PhD, "LINKS Positioning Strategy Simulation" 19
spending and your sales volume forecasts. Setting marketing spending to zero does not result in
the associated product being dropped from that market region.
If you drop a product from a channel/region, you must change marketing spending to $0.
Otherwise, marketing spending continues to occur, in anticipation of a future relaunch.
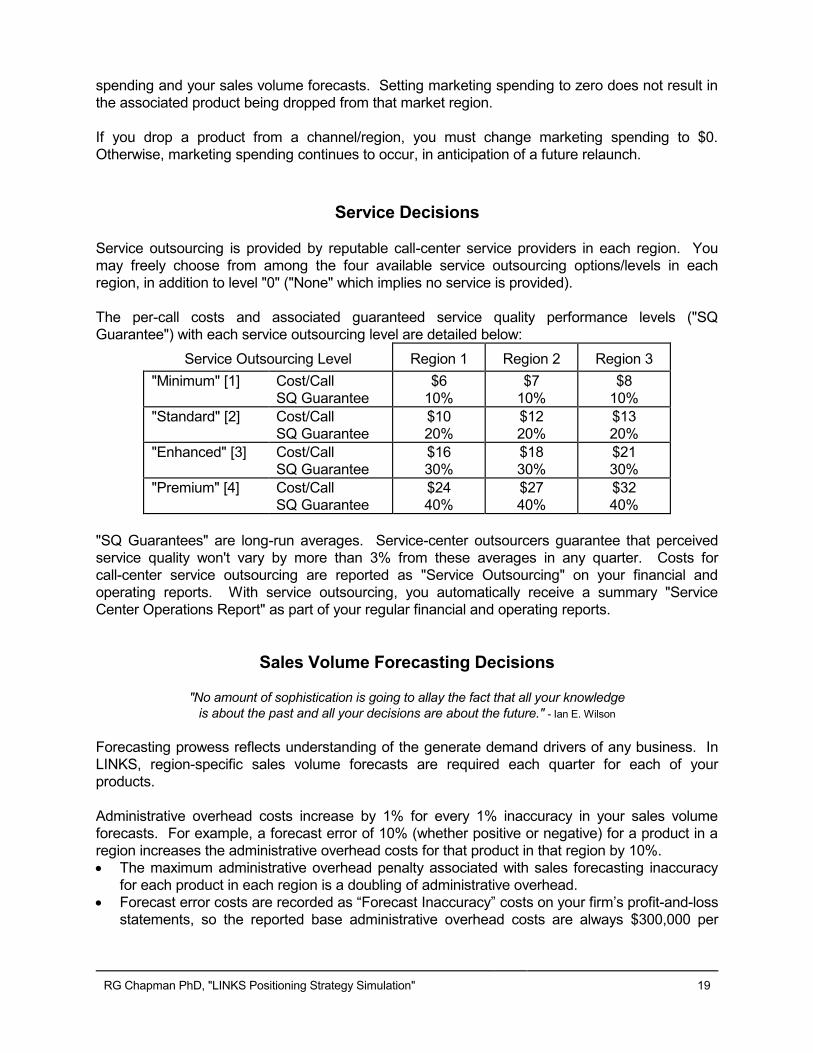
Service Decisions
Service outsourcing is provided by reputable call-center service providers in each region. You
may freely choose from among the four available service outsourcing options/levels in each
region, in addition to level "0" ("None" which implies no service is provided).
The per-call costs and associated guaranteed service quality performance levels ("SQ
Guarantee") with each service outsourcing level are detailed below:
Service Outsourcing Level Region 1 Region 2 Region 3
"Minimum" [1] Cost/Call
SQ Guarantee
$6
10%
$7
10%
$8
10%
"Standard" [2] Cost/Call
SQ Guarantee
$10
20%
$12
20%
$13
20%
"Enhanced" [3] Cost/Call
SQ Guarantee
$16
30%
$18
30%
$21
30%
"Premium" [4] Cost/Call
SQ Guarantee
$24
40%
$27
40%
$32
40%
"SQ Guarantees" are long-run averages. Service-center outsourcers guarantee that perceived
service quality won't vary by more than 3% from these averages in any quarter. Costs for
call-center service outsourcing are reported as "Service Outsourcing" on your financial and
operating reports. With service outsourcing, you automatically receive a summary "Service
Center Operations Report" as part of your regular financial and operating reports.
Sales Volume Forecasting Decisions
"No amount of sophistication is going to allay the fact that all your knowledge
is about the past and all your decisions are about the future." - Ian E. Wilson
Forecasting prowess reflects understanding of the generate demand drivers of any business. In
LINKS, region-specific sales volume forecasts are required each quarter for each of your
products.
Administrative overhead costs increase by 1% for every 1% inaccuracy in your sales volume
forecasts. For example, a forecast error of 10% (whether positive or negative) for a product in a
region increases the administrative overhead costs for that product in that region by 10%.
The maximum administrative overhead penalty associated with sales forecasting inaccuracy
for each product in each region is a doubling of administrative overhead.
Forecast error costs are recorded as “Forecast Inaccuracy” costs on your firm’s profit-and-loss
statements, so the reported base administrative overhead costs are always $300,000 per

RG Chapman PhD, "LINKS Positioning Strategy Simulation" 20
quarter per product per region.
Forecasting accuracy equals 100*(1-(abs(Forecast-Actual)/Actual)) expressed in percentage
terms, where "abs" is the absolute value function. Thus, a forecast value of 11,000 and an actual
value of 8,000 results in a forecast accuracy of 100*(1-abs(11,000-8,000)/8,000) = 100*(1-
(3,000/8,000)) = 100*(1-0.375) = 62.5%. The minimum possible value of forecasting accuracy is
0.0%. For example, with an Actual sales volume of 8,000, a Forecast above 16,000 results in a
forecasting accuracy score of 0.0%.
Given the importance of forecasting in running your LINKS business, you might find that reading
the following article has a positive return on your reading-time investment:
J. Scott Armstrong, "The Forecasting Canon: Generalizations To Improve Forecast
Accuracy," FORESIGHT: The International Journal of Applied Forecasting, Volume 1,
Issue 1 (June 2005), pp. 29-35.
http://www.forecastingprinciples.com/paperpdf/The_Forecasting_Canon.pdf
The following page contains a judgmental sales forecasting worksheet that provides a template
for systematically approaching the sales forecasting process. Judgmental adjustments are
naturally challenging, but at least you're explicitly taking into account that your generate demand
program changes, and those of your competitors, influence your sales.
Firm Name
Your firm may choose a firm name with up to 40 characters. This firm name is printed on the top
of all financial, operating, and research reports. Firm names have no cost or known demand-side
implications, so you are free to choose (or change) your firm's name as you wish.

RG Chapman PhD, "LINKS Positioning Strategy Simulation" 21
Judgmental Sales Forecasting Worksheet
Sales forecasting drives everything in demand and supply chains. Unfortunately, sales
forecasting is extraordinarily challenging due to the many factors influencing your sales (your
current and recent generate demand programs, current and recent competitors' generate demand
programs, and exogenous market forces).
Here's a judgmental sales forecasting process that, at a minimum,
provides an organizational template to systematically approach the sales
forecasting process. Judgmental adjustments are challenging, but at
least you're explicitly taking into account that your generate demand
program changes, and those of your competitors, influence your sales.
Step 1 (the "easy" part): Construct a trend-line extrapolation of past
sales realizations based on a crucial assumption: future market and
environmental forces will continue as they have existed in the recent
past. Be watchful for structural considerations like channel loading
(forward buying), unfilled orders, and backlogged orders.
Step 2 (the "hard" part): Make adjustments for planned changes in your generate demand
programs. The potential impacts of changes in product, price, distribution, communications,
and service on your sales must be quantified.
Step 3 (the "subtle" part): Account for foreseeable competitors' changes in their generate
demand programs. It's easy to overlook competitors in forecasting. Assume that competitors
are vigilant and thoughtful and present.
1 Trend-Line Extrapolation of Past Sales Realizations (Base-Line Forecast)
2 Adjustments For Planned Changes In Generate Demand Program (list specifics,
with judgmental estimates of sales impacts [expressed in +/- %s]) Product Changes
Price Changes
Distribution Changes
Communications Changes
Service Changes
3 Adjustments For Foreseeable Changes In Competitors' Generate Demand
Programs (list specifics, with judgmental estimates of sales impacts [expressed in +/- %s])
Product Changes
Price Changes
Distribution Changes
Communications Changes
Service Changes
Adjusted Sales Forecast

RG Chapman PhD, "LINKS Positioning Strategy Simulation" 22
Marketing Research Studies
"Time spent in reconnaissance is seldom wasted." – Sun Tzu, 4BC
Research studies requests are submitted along with your other decision variable changes.
Although LINKS research studies are ordered prior to the beginning of the next quarter, research
studies are executed during and after the next quarter, as appropriate. Thus, research studies
reports always reflect the just-completed quarter's experience.
The following research study descriptions
include sample output to illustrate the style
and formatting of research study output. These samples are only for illustrative
purposes. The output should not be viewed
as providing any specific insight into your
particular set-top box industry.
The existence of any particular LINKS
research study is not an implicit endorsement
that such a research study is important,
relevant, or even useful to the management of
your LINKS firm. Rather, the inclusion of
these research studies in LINKS reflects their
real-world existence in a wide variety of
industries and product/service categories.
You must form your own opinion about the
relative merits of these LINKS research
studies and, in particular, whether each
research study's potential value exceeds its
monetary cost.
Which research studies should you purchase
and when? Snappy but uninformative
responses would be "purchase only research
that you really need" and "it depends."
Unfortunately, these responses are not very
constructive counsel. Heavy-duty anticipatory
thinking is needed before deciding on
research study purchases. There are no
universal answers about appropriate, needed,
and desirable research studies, other than the
principle that research is about uncertainty
reduction. What don't you know? How
important is it to "know" these things? Is there
any research that might be conducted in a
timely fashion to reduce this uncertainty?
Bruce Henderson, noted strategist, author, and consultant, offers this insightful process-based
suggestion for conducting research: "Define the problem and hypothesize the approach to a
solution intuitively before wasting time on data collection and analysis. Do the first analysis lightly.
FYI: The Cost of Marketing Research
Marketing research is more often than not
underfunded. I continue to be amazed by
companies that are extremely averse to spending
$200K on researching a new product that will cost
$40 million to launch — that's 1/2 of 1% of the
money at risk. Or why is it so difficult to justify
even 1% of the cost of an advertising or
promotional campaign on conducting pre-launch
evaluations of that campaign at the critical stages
of development? There are several credible
explanations.
One reason is that marketing campaigns too
often take on a life of their own, with
marketers' egos and reputations perceived to
be on the line. To advocates, research is seen
as a constraint on their personal prerogatives
and creativity. Gunslinger marketers and well-
trained, methodical researchers do not mix
well.
Researchers often aren't involved in the early
planning process for new products or
campaigns. Consequently, at the time of
budget development, there's no input from the
professional researcher as to what should be
researched, how it should be researched, and
how much it will cost.
In most companies, spending on marketing
research is considered an expense, not an
investment in risk reduction. Until we develop
and can agree on measures of return on
marketing research investment, the marketing
research function will continue to suffer the
fate of short budgets and yo-yo staffing.
Source: William D. Neal, "Getting Serious About Marketing
Research," Marketing Research: A Magazine of
Management and Applications (Summer 2002), p. 26.

RG Chapman PhD, "LINKS Positioning Strategy Simulation" 23
Then, and only then, redefine the problem more rigorously and reanalyze in depth. Don't go to
the library and read all the books before you know what you want to learn." The problem
"reanalysis" stage is particularly relevant since that is where research studies may play a role,
once you have determined that the information provided in the research may provide useful
insight into the problem.
Some generalizations about research studies strategy and tactics are possible:
Excellent strategy can only be developed based on excellent analysis. Since research
provides the raw data for excellent analysis, research should be an important component of
your decision-making process. Do not relegate your research studies pre-ordering decisions
to the last five minutes of team meetings. Rather, treat research studies ordering decisions as
a fundamental part of your whole LINKS decision-making process.
Plan ahead. To identify patterns and trends, you will need some research on a more-or-less
regular basis. A formal research studies plan should be a part of your management planning
process.
Systematize the post-analysis of research studies. This might involve, for example, the
continual updating of databases, charts, or graphs to reformat the raw LINKS research studies
results into more meaningful and useful forms.
Share insights derived from particular research studies with all of your LINKS team members.
These may require research studies’ "experts" to assume coaching roles with research
studies "novices." This is a natural state of affairs. Given the complexity of LINKS, it is not
possible to be an "expert" on everything.
Research Study #1: Benchmarking - Earnings
"Every accomplishment starts with the decision to try." – Anonymous
Purpose: This research study provides
earnings benchmarks for your set-top box
industry. The current-quarter earnings,
cumulative-to-date earnings, and current-
quarter dividends of each firm in your
industry are reported. In addition, a variety
of financial market statistics are reported.
Information Source: These data are
based on public information.
Cost: $500.
Sample Output
======================================================================= RESEARCH STUDY # 1 (Benchmarking - Earnings ) ======================================================================= Current Cumulative Current Net Income Net Income Dividends ----------- ----------- ----------- Firm 1 2,974,292 5,788,265 892,287 Firm 2 3,472,461 6,234,171 1,041,738 ... Financial Market Statistics [stock price, shares outstanding (millions), earnings per share, dividends per share, market capitalization ($millions)] ------ ------ ------ ------ Firm 1 Firm 2 Firm 3 Firm 4 ------ ------ ------ ------ StockPrice 120.00 131.80 117.63 123.96 Shares 2.0M 2.0M 2.0M 2.0M EPS DPS MarketCap ...

RG Chapman PhD, "LINKS Positioning Strategy Simulation" 24
Research Study #2: Benchmarking - Balance Sheets
Purpose: This research study provides
summary balance sheet benchmarks for your
industry. These balance sheets must be
requested for specific firms in your industry.
Information Source: These summary
balance sheets are provided by your
research supplier based on public
information.
Cost: $1,000 per firm.
Additional Information: These summary
balance sheets contain the level of
information available from public sources.
Research Study #3: Benchmarking - Product Development
Purpose: Current configurations are reported for all actively-sold products. The last quarter in
which each product was reconfigured is reported, with quarter "0" referencing reconfigurations
which occurred prior to quarter 1.
Information Source: These research
study results are based on reverse
engineering efforts by your research
supplier.
Cost: $1,500 per competitor product.
Research Study #9: Benchmarking - Generate Demand
Purpose: This research study provides
generate demand benchmarks for your
industry. Price and marketing statistics
(minimum, average, and maximum) for
each market region are provided.
Information Source: This research study
is based on information sharing and pooling
agreements among all firms in the set-top
box industry administered by the Set-Top
Box Industry Trade Association.
Cost: $5,000.
Sample Output
======================================================================= RESEARCH STUDY # 2 (Benchmarking - Balance Sheets ) ======================================================================= -------------------- FIRM 2 BALANCE SHEET -------------------- ASSETS ------ Cash 3,999,248 Marketable Securities 3,404,352 Finished Goods Inventory 0 Plant Investment 100,000,000 Total Assets 107,403,600 LIABILITIES AND EQUITIES ------------------------ Corporate Capitalization 100,000,000 Dividends, Current Quarter -1,082,785 Dividends, Cumulative Prior To This Quarter -2,090,183 Loans 0 Retained Earnings, Current Quarter 3,609,285 Retained Earnings, Cumulative Prior To This Quarter 6,967,283 Total Liabilities and Equities 107,403,600
Sample Output
======================================================================= RESEARCH STUDY # 3 (Benchmarking - Product Development ) ======================================================================= Product 1-1H Configuration: H351020 [reconfigured in quarter 6] Product 1-2H Configuration: H738011 [reconfigured in quarter 6]
Product 1-3H Configuration: Configuration Unavailable: Product Is Inactive Product 2-1H Configuration: H111010 [reconfigured in quarter 0] ...
Sample Output
======================================================================= RESEARCH STUDY # 9 (Benchmarking - Generate Demand ) ======================================================================= Quarter 55 Quarter 56 Quarter 57 Quarter 58 ----------- ----------- ----------- ----------- ----------- HYPERWARE REGION 1 min/ave/max
----------- Price [$] 435 520 657 431 554 689 437 542 662 429 542 662 Mktg [$K] 100 161 300 0 183 300 0 157 300 0 181 326 ...

RG Chapman PhD, "LINKS Positioning Strategy Simulation" 25
Research Study #11: Benchmarking - Operating Statistics
Purpose: This research study provides a
variety of operating statistics benchmarks
for your industry. Various "Corporate P&L
Statement" figures are reported as
percentages of revenues for your firm and
for industry-wide minimums, means, and
maximums. And, some call center
statistics are reported for your industry.
Information Source: This research study
is based on information sharing and
pooling agreements among all firms in the
set-top box industry administered by the
Set-Top Box Industry Trade Association.
Cost: $2,500.
Sample Output
======================================================================= RESEARCH STUDY #11 (Benchmarking - Operating Statistics ) ======================================================================= Firm 8 Minimum Average Maximum ----------- ----------- ----------- ----------- P&L OPERATING STATISTICS Revenues 100.0% 100.0% 100.0% 100.0% Product Costs 50.7% 44.3% 49.1% 50.7% Transportation Costs 10.2% 8.0% 9.7% 10.5% Duties & Tariffs 7.9% 7.0% 8.0% 8.9% Gross Margin 30.5% 30.5% 32.6% 38.2% Administrative O/H 5.7% 4.7% 5.6% 6.0% Marketing 4.5% 3.8% 4.7% 6.0% Research Studies .0% .0% .0% .1% Service 4.7% 3.6% 4.5% 4.9% Total Fixed Costs 25.7% 22.0% 24.9% 27.2% Operating Income 4.8% 4.8% 7.8% 13.7% Net Income 2.9% 2.9% 4.4% 7.3% CSR CALLS STATISTICS Region 1 21,059 19,107 19,964 21,059 Region 2 18,485 17,339 18,171 18,930
Region 3 29,680 25,487 27,747 30,611 CSR $/CALL STATISTICS Region 1 10.73 10.73 11.57 12.99 ….

RG Chapman PhD, "LINKS Positioning Strategy Simulation" 26
Research Study #12: Market Statistics
Purpose: This research study provides a
variety of market statistics for each region
for the last four quarters:
Industry demand (final customer
purchases) is reported for the
hyperware set-top box category.
Overall market shares for each firm are
provided for each of the last four
quarters. These market shares are
based on end-user customer purchase
volumes and not on manufacturer
orders.
End-of-quarter retail-channel (channel
1) inventory holdings for active products
are reported in two ways: units and
quarters of inventory (expressed relative
to the current quarter’s retail-channel
sales volume).
Estimates of dealer-channel margins for
active products are reported. "Margin"
is dealer-channel volume times the
dealer-channel markup.
Information Source: This research study
is compiled by your research vendor using a
variety of sources.
Cost: $2,500.
Sample Output
======================================================================= RESEARCH STUDY #12 (Market Statistics ) ======================================================================= Quarter 11 Quarter 12 Quarter 13 Quarter 14 ----------- ----------- ----------- ----------- --------------- INDUSTRY DEMAND --------------- Region 1 Demand 60,231 59,075 59,244 59,165 Region 2 Demand 21,988 23,306 23,136 22,930 ... --------------------- OVERALL MARKET SHARES --------------------- Firm 1 18.0 26.6 25.3 20.7 Firm 2 19.5 17.4 18.8 17.9 Firm 3 19.9 19.1 17.6 20.0 Firm 4 21.7 19.8 19.7 19.6 Firm 5 20.9 17.1 18.6 21.8 -------------------------------- DEALER CHANNEL INVENTORY [Units]
-------------------------------- Region 1: Product 1-1H 2,128 2,260 2,257 2,653 Product 2-1H 2,178 2,377 2,345 2,266 ... Region 2: Product 1-1H 3,853 3,943 3,383 3,818 ... ... ------------------------------------------------------------------------ DEALER CHANNEL INVENTORY [Quarters of Inventory at Current Sales Volume] ------------------------------------------------------------------------ Region 1: Product 1-1H 0.38 0.33 0.40 0.39 Product 2-1H 0.51 0.37 0.45 0.40 ... Region 2: ... ... --------------------- DEALER CHANNEL MARGIN --------------------- Region 1: Product 1-1H 1,459,436 1,608,804 1,743,830 1,244,650 ... ...

RG Chapman PhD, "LINKS Positioning Strategy Simulation" 27
Research Study #14: Regional Summary Analysis
"If you torture the data long enough, it will confess." – Anonymous
Purpose: This research study provides a regional summary analysis for each specified market
region, including current-quarter market shares, prices, and perceptions of product quality, service
quality, and availability of all active products:
"Product Quality" is perceived product
quality, reflecting customers'
perceptions of a product's
configuration and its reliability and
performance in actual usage.
"Service Quality" is perceived service
quality, reflecting customers'
perceptions of the service quality
associated with a product. Service
quality derives from experiences with
each firm's regional service (call)
centers.
"Availability" is perceived product
availability, reflecting customers'
perceptions of a product's top-of-mind
awareness, channel presence,
distribution accessibility, ease of
access, convenience to purchase,
and general presence/prominence in
the market place.
Information Source: Perceived product quality, perceived service quality, and perceived
availability are based on a survey of current set-top box customers. These perceptual ratings are
the percentages of survey respondents rating product quality, service quality, and availability as
"excellent" on a 4-point "poor"-“fair”-”good”-"excellent" rating scale.
Cost: $10,000 per region.
Additional Information: Your set-top box manufacturing firm sells to retailers, not directly to
final end-user customers. Retailers maintain inventory of your set-top box products as well as
selling your products to their customers. Thus, final end-user customers sales volume and
market share (for example, as reported in Research Study #14) aren’t equal to your firm’s sales
volume and market share to the retailers due to inventory holdings of retailers.
These results reflect final end-user customer activity. Thus, the prices reported are the prices
paid by final end-user customers. These prices include the retailers’ markups on the
manufacturers’ prices.
Sample Output
======================================================================= RESEARCH STUDY #14 (Regional Summary Analysis ) ======================================================================= REGION 1 ┌────────┬─────────────────────────────┬───────┬────┬────┬────┐ HYPERWARE│ Volume │ Market Share │ Price │ PQ │ SQ │ Av │ ┌─────────┼────────┼─────────────────────────────┼───────┼────┼────┼────┤ │ 1-1 │ 15,906 │ 9.9- ████████████ │ 707+│ 41 │ 21-│ 54+│ │ 1-2 │ 531 │ 0.3 ▒ │ 465 │ 2 │ 19 │ 1 │ │ 2-1 │ 9,391 │ 5.9 ███████ │ 439 │ 9 │ 29+│ 38 │ │ 2-2 │ 7,291 │ 4.6 ▒▒▒▒▒▒ │ 417-│ 8 │ 41+│ 23-│
│ 3-1r │ 32,519 │20.3+ ███████████████████████│ 699+│ 50+│ 28 │ 54+│ │ 3-2 │ 16,096 │10.1 ▒▒▒▒▒▒▒▒▒▒▒▒ │ 650 │ 34-│ 18-│ 43 │ │ 4-1 │ 13,238 │ 8.3- ██████████ │ 670+│ 32-│ 18-│ 10-│ │ 4-2 │ 6,881 │ 4.3+ ▒▒▒▒▒ │ 380-│ 8 │ 9-│ 12-│ │ 5-1 │ 12,162 │ 7.6+ █████████ │ 392 │ 9 │ 32+│ 23 │ │ 6-1 │ 7,427 │ 4.6 ▒▒▒▒▒▒ │ 390-│ 8 │ 39+│ 12-│ │ 7-1r │ 25,428 │15.9+ ██████████████████ │ 650+│ 69+│ 32+│ 35+│ │ 7-2 │ 13,225 │ 8.3- ▒▒▒▒▒▒▒▒▒▒ │ 653 │ 35 │ 20-│ 26 │ └─────────┴────────┴─────────────────────────────┴───────┴────┴────┴────┘ Notes: (1) "Volume" is sales volume in units. (2) Other variables listed above are market share, end-customer price ("Price"), perceived product quality ("PQ"), perceived service Quality, ("SQ"), and perceived availability ("Av"). (3) Changes of more than 2%, $20, 2%, 2%, and 2%, respectively, in these variables from the previous quarter are flagged with "+" (increase) and "-" (decrease) signals after the numerical values. (4) "r" after a firm#-product# denotes a reconfigured product this quarter.

RG Chapman PhD, "LINKS Positioning Strategy Simulation" 28
Research Study #20: Customer Satisfaction
"No sale is really complete until the product is worn out and the customer
is satisfied." – Leon Leonwood Bean, founder of L. L. Bean outdoor-clothing company
Purpose: This research study provides
customer satisfaction estimates of all
products in all regions for the last four
quarters.
Information Source: Customer
satisfaction is based on a customer survey
of current users. Customer satisfaction is
the percentage of survey respondents rating
their overall satisfaction with a product as
"excellent" on a 4-point "poor"-“fair”-“good”-"excellent" rating scale.
Cost: $10,000.
Research Study #23: Concept Test
"The final question needed to come to grips with the business purpose and business
mission is: ‘What is value to the customer?’ It may be the most important question. Yet it is
the one least often asked. One reason is that managers are quite sure that they know the
answer. Value is what they, in their business, define as quality. But this is almost always
the wrong definition. The customer never buys a product. By definition, the customer buys
the satisfaction of a want. He buys value. What a company’s different customers consider
value is so complicated that it can be answered only by the customers themselves.
Management should not even try to guess at the answers. It should always go to the
customers in a systematic quest for them." – Peter Drucker
Purpose: This research study provides concept test scores for a range of set-top box
configurations "around" a specified configuration in a specified region. This research study may
be useful after other research studies have been conducted (such as Conjoint Analysis) to search
for preferred concepts "around" a specified configuration.
Information Source: This research study
is based on end-user customer surveys.
Study Details: These concept test scores
are "top-box" scores. They represent the
percentage of end-user customers surveyed
assessing the hypothetical set-top box
concept as being "excellent" on a 4-point
"poor"-"fair"-"good"-"excellent" rating scale.
Concept test scan searches are conducted "around" the specified configuration. Here,
"around" means that 243 concept tests are executed (subject to prevailing set-top box technology
limits), one for each of the set-top box configuration attributes that are tested in concept tests
(Alpha, Beta, bandwidth, warranty, packaging, and memory disks), varying the values up and
Sample Output
======================================================================= RESEARCH STUDY #20 (Customer Satisfaction ) ======================================================================= Quarter 33 Quarter 34 Quarter 35 Quarter 36 ----------- ----------- ----------- ----------- -------- REGION 1 -------- Product 1-1H 23.0 18.8 27.2 25.8 Product 3-1H 16.0 22.8 26.8 23.4 Product 4-2H 25.2 27.2 29.3 20.0 Product 5-1H 31.5 29.5 29.9 21.9 ...
Sample Output
======================================================================= RESEARCH STUDY #23 (Concept Test ) ======================================================================= Product 1-1 Current Configuration [Region 1, Channel 1] H996020 .9% [Region 1] H885010 1.9% H885020 2.1% H885010 2.5% H885020 3.1% H886010 2.3% H886020 2.9% H886010 3.7% H886020 3.7% H895010 2.7% H895020 2.6% H895010 2.4% H895020 2.6%
H896010 2.3% H896020 2.4% H896010 3.2% H896020 3.0% ...

RG Chapman PhD, "LINKS Positioning Strategy Simulation" 29
down one from the specified configuration for each attribute. Concept test scores are reported
for scanned concepts whose scores exceed that of the designated configuration by at
least 1%.
As shown in the sample output, the concept test score for the specified configuration is
reported, along with all of the results for the concept test scanning search around that specified
configuration. Only those scanned concept scores exceeding the specified configuration by at
least 1% are reported. In this sample output, the configuration H996020 is apparently a rather
unattractive configuration in market region 1, thus accounting for the generally low concept test
scores for the specified configuration and for all of its scanned variants.
Cost: $15,000 per concept test per region for up to four concept tests in a quarter. Concept tests
beyond four in a quarter cost double the standard cost of $15,000 (per concept test per channel
per region).
Limitations: A maximum of eight (8) concept tests may be executed each quarter.
Additional Information: You need baseline concept test scores to interpret concept test scores.
A concept test score of 40% is interesting, but there is no way to tell if that score is associated
with a configuration that offers competitive advantage unless you have corresponding concept test
scores for existing products that are already on the market. Current configurations or the
configurations of leading products are obvious baselines. Of course, you would have to execute
concept tests on such baseline configurations (in addition to the hypothetical concepts of interest)
if you want baseline-configuration scores.
Research Study #24: Price Sensitivity Analysis
"Any sufficiently advanced technology is indistinguishable from magic." – Arthur C. Clarke
Purpose: This research study provides a price sensitivity analysis for a specific product in a
specific region. This research study permits the simultaneous testing of a reconfiguration of an
existing, actively-distributed product and an associated price level of the user’s choosing. Thus,
Research Study #24 is a focused test marketing experiment with user-specified configurations
and prices.
Information Source: This research study is based on surveys of final end-user customers, using
advanced marketing research techniques.
Study Details: These price sensitivity analyses isolate the impact of price on market share, while
holding other market share drivers constant (product quality, service quality, and availability).
Nine price levels are used in this research study. With no user-specified price input, these
price levels are automatically centered around the current price (the “Reference Price”) of the
product in each region for which this research study is executed. Values of -20%, -15%, -10%, -
5%, 0% (i.e., current price), +5%, +10%, 15%, and +20%, relative to the product's “Reference
Price,” are used.
If configuration and price are left at their default values (“?…?” and 0, respectively), then
Research Study #24 is executed with the existing product centered around the current price of
the specified product. Otherwise, the user-specified configurations and prices (with the
specified price being the “Reference Price”) are used. Market share predictions are provided for
all tested prices in Research Study #24.

RG Chapman PhD, "LINKS Positioning Strategy Simulation" 30
Research study output includes market
share and gross margin estimates in research
study requests with no configuration change.
With a configuration change, research study
output only includes estimated market shares.
Users will need to estimate their product and
other variable costs (and gross margin)
associated with any configuration change. In this research study, “Your Price” is
the manufacturer price. Your manufacturer
price is the price that you input for this research
study. In the LINKS retail channel, the LINKS
software automatically estimates the “Market
Price” (including the retail markup) that is
presented to the final end-user customer in
each price sensitivity analysis.
Cost: $20,000 per price sensitivity analysis (per
product per region). If you execute this research study for all products and regions in a 2-product
and 3-region LINKS environment, the total cost would be $120,000.
Sample Output With No Configuration Change:
======================================================================= RESEARCH STUDY #24 (Price Sensitivity Analysis ) ======================================================================= PRODUCT 6-1H PREDICTED GROSS MARGINS IN REGION 1, CHANNEL 1 [HYPERWARE] Configuration: H353022 Reference Price: 290
┌────────────┬──────┬──────┬──────┬──────┬──────┬──────┬──────┬──────┬──────┐ │Market Price│$ 351│$ 373│$ 395│$ 417│$ 438│$ 459│$ 481│$ 503│$ 525│ │Your Price │$ 232│$ 247│$ 261│$ 276│$ 290│$ 304│$ 319│$ 333│$ 348│ │Your Cost │$ 171│$ 171│$ 171│$ 171│$ 171│$ 171│$ 171│$ 171│$ 171│ │Your Margin │$ 60│$ 75│$ 89│$ 104│$ 118│$ 132│$ 147│$ 161│$ 176│ ├────────────┼──────┼──────┼──────┼──────┼──────┼──────┼──────┼──────┼──────┤ │Sales Volume│30,577│25,879│21,985│19,002│16,459│14,269│12,513│11,086│10,533│ │Market Share│ 9.9%│ 8.4%│ 7.1%│ 6.2%│ 5.3%│ 4.6%│ 4.1%│ 3.6%│ 3.4%│ ├────────────┼──────┼──────┼──────┼──────┼──────┼──────┼──────┼──────┼──────┤ │Margin Chang│-49.2%│-36.4%│-24.6%│-11.9%│ 0.0%│ 11.9%│ 24.6%│ 36.4%│ 49.2%│ │MS Change │ 85.8%│ 57.2%│ 33.6%│ 15.4%│ 0.0%│-13.3%│-24.0%│-32.6%│-36.0%│ │Net Change │ -5.5%│ -0.1%│ 0.7%│ 1.8%│ 0.0%│ -3.0%│ -5.3%│ -8.1%│ -4.5%│ ├────────────┼──────┼──────┼──────┼──────┼──────┼──────┼──────┼──────┼──────┤ │Gross Margin│$1,834│$1,940│$1,956│$1,976│$1,942│$1,883│$1,839│$1,784│$1,853│ │ (in $000s) │ │ │ │ ├──────┤ │ │ │ │ └────────────┴──────┴──────┴──────┴──────┘ └──────┴──────┴──────┴──────┘ These estimated per-unit costs of $198.11 include these cost components: Product Costs $144.47
Duties & Tariffs $ 0.00
Case Study: Amazon.com
Amazon.com has been charging customers
different prices for the same products. For
example, it has charged some users $23.97
and others $25.97 for a DVD version of "Men
in Black." Patty Smith, an Amazon
spokeswoman, said the different prices were
part of a test Amazon is conducting "to
measure what impacts a decision to purchase
or not to purchase." Ms. Smith said Amazon
test customers are selected randomly and the
prices they receive aren't based on any other
characteristics. Source: "Amazon.com Varies Price of Identical Items For
Test," The Wall Street Journal (September 7, 2000)
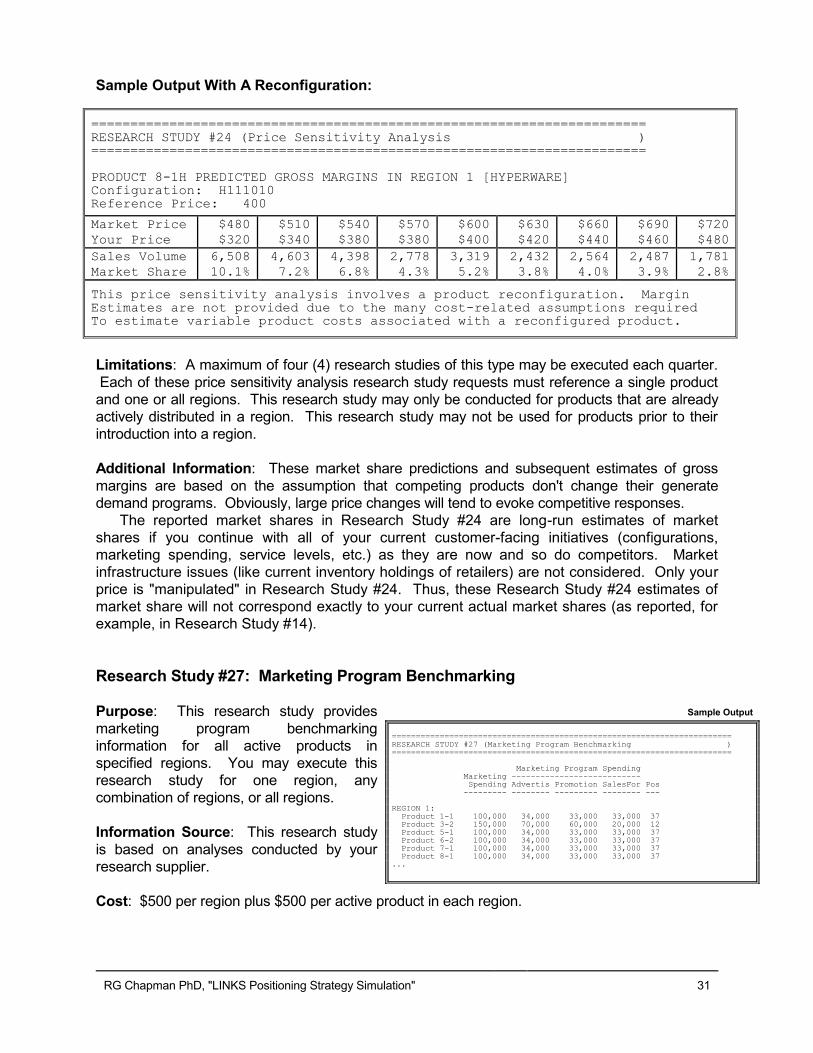
RG Chapman PhD, "LINKS Positioning Strategy Simulation" 31
Sample Output With A Reconfiguration:
======================================================================= RESEARCH STUDY #24 (Price Sensitivity Analysis ) ======================================================================= PRODUCT 8-1H PREDICTED GROSS MARGINS IN REGION 1 [HYPERWARE] Configuration: H111010 Reference Price: 400
Market Price
Your Price
$480
$320
$510
$340
$540
$380
$570
$380
$600
$400
$630
$420
$660
$440
$690
$460
$720
$480
Sales Volume
Market Share
6,508
10.1%
4,603
7.2%
4,398
6.8%
2,778
4.3%
3,319
5.2%
2,432
3.8%
2,564
4.0%
2,487
3.9%
1,781
2.8%
This price sensitivity analysis involves a product reconfiguration. Margin Estimates are not provided due to the many cost-related assumptions required To estimate variable product costs associated with a reconfigured product.
Limitations: A maximum of four (4) research studies of this type may be executed each quarter.
Each of these price sensitivity analysis research study requests must reference a single product
and one or all regions. This research study may only be conducted for products that are already
actively distributed in a region. This research study may not be used for products prior to their
introduction into a region.
Additional Information: These market share predictions and subsequent estimates of gross
margins are based on the assumption that competing products don't change their generate
demand programs. Obviously, large price changes will tend to evoke competitive responses.
The reported market shares in Research Study #24 are long-run estimates of market
shares if you continue with all of your current customer-facing initiatives (configurations,
marketing spending, service levels, etc.) as they are now and so do competitors. Market
infrastructure issues (like current inventory holdings of retailers) are not considered. Only your
price is "manipulated" in Research Study #24. Thus, these Research Study #24 estimates of
market share will not correspond exactly to your current actual market shares (as reported, for
example, in Research Study #14).
Research Study #27: Marketing Program Benchmarking
Purpose: This research study provides
marketing program benchmarking
information for all active products in
specified regions. You may execute this
research study for one region, any
combination of regions, or all regions.
Information Source: This research study
is based on analyses conducted by your
research supplier.
Cost: $500 per region plus $500 per active product in each region.
Sample Output
======================================================================= RESEARCH STUDY #27 (Marketing Program Benchmarking ) ======================================================================= Marketing Program Spending Marketing --------------------------- Spending Advertis Promotion SalesFor Pos --------- -------- --------- -------- ---
REGION 1: Product 1-1 100,000 34,000 33,000 33,000 37 Product 3-2 150,000 70,000 60,000 20,000 12 Product 5-1 100,000 34,000 33,000 33,000 37 Product 6-2 100,000 34,000 33,000 33,000 37 Product 7-1 100,000 34,000 33,000 33,000 37 Product 8-1 100,000 34,000 33,000 33,000 37 ...

RG Chapman PhD, "LINKS Positioning Strategy Simulation" 32
Study Details: For each active product in each specified market region, product-specific
marketing program benchmarks are provided: total marketing spending, advertising spending
("Advertis"), promotion spending, sales force spending ("SalesFor"), and marketing
communications positioning ("Posi").
Research Study #28: Marketing Program Experiment
"Half the money I spend on advertising is wasted, and the problem is I do not know which half." - Lord Leverhulme 1851-1925 (British founder of Unilever and philanthropist)
Purpose: This research study conducts a marketing program experiment. Inputs include a full
marketing program (marketing spending, marketing mix allocation, and positioning) for a product
in one or all regions. Outputs include customer perceptions of product quality, service quality, and
availability.
Information Source: This marketing program experiment is executed in a small but
representative part of the specified market region. This marketing program experiment is
executed using your specified marketing program and all other current marketing mix variables of
your product and all competitors' products. Your competitors will not be aware of the existence of
this marketing program experiment and they have no opportunity to intervene to attempt to
influence the results of this experiment. Competitors' marketing decision variables are held
constant at their values in the previous quarter.
Cost: $12,500 per marketing program experiment.
Sample Output:
======================================================================= RESEARCH STUDY #28 (Marketing Program Experiment ) =======================================================================
Marketing Program Inputs Perceptions
R MktgSp MktgMx Adve Prom SFor MP ProdQ ServQ Avail
Product 4-1 Product 4-1 Product 4-1
2 2 2
200K 100K 150K
502525 343333 202060
100K 34K 30K
50K 33K 30K
50K 33K 90K
73 12 37
27.1% 34.2% 14.3%
20.1% 15.9% 18.3%
23.5% 25.1% 43.9%
Notes: (1) In the heading, "R" refers to region, "C" refers to channel, "MktgSp" refers to total marketing spending (in L$000s), "MktgMx" refers to marketing mix allocation (2-digit %s of total marketing spending allocated to advertising, promotion, and sales force), "Adve" refers to implied advertising spending (in L$000s), "Prom" refers to implied promotion spending (in L$000s), "SFor" refers to implied sales force
spending (in L$000s), and "MP" refers to marketing positioning. (2) This research study may only be executed for products already actively distributed in a region. Blank results are reported for perceptions for products not actively distributed.
Execution Details: To specify "all" regions within a single marketing program experiment, enter
"0" (zero) as the region selection. This, of course, would involve multiple executions of marketing
program experiments with consequent cost implications. Marketing program experiments must be

RG Chapman PhD, "LINKS Positioning Strategy Simulation" 33
executed for a specific product. If you wish to execute multiple marketing program experiments,
you must specify them separately for each product.
Research Study #28 (Marketing Program Experiment) automatically includes three
experiments for each RS#28 input set. Research Study #28 includes experiments with the
specified marketing spending input plus additional experiments with 50% more and 50% less
than the specified marketing spending input. These three experiments are included at the
standard cost of Research Study #28.
Limitations: A maximum of seven (7) marketing program experiments may be conducted in any
quarter. Each marketing program experiment may reference one or all regions.
Other Comments: Marketing program experiments permit an assessment of the impact of
marketing spending, marketing mix allocation and positioning on key perceptual outputs (product
quality perceptions, service quality perceptions, and availability perceptions). Although not a final
outcome measure like market share, sales volume, or profitability, customer perceptions have the
advantage of being the direct consequences of a product's marketing program. Final outcome
measures like market share, sales volume, and profitability are influenced by many forces, not just
a product's marketing program.
Benchmarks are needed to assess the perceptual results in marketing experiments. You can
create your own benchmark by testing the marketing program along with variations of interest.
While such benchmarking requires the execution of a base marketing experiment (with current
marketing spending, marketing mix allocation, and positioning) in addition to the test variations of
interest, such benchmarking provides the standard against which marketing program variations
may be compared.
Marketing experiments have some randomness inherent in their results. This implies that you
would only change your marketing program (marketing spending, marketing mix allocation, and
positioning) if a particular marketing program variation yielded a noteworthy change in customer
perceptions.
Research Study #30: Conjoint Analysis
"No one tests the depth of the river with both feet." – Ashanti proverb
Purpose: This research study provides a conjoint analysis in one specified market region per
quarter. Conjoint analysis reverse engineers customers' implicit values (tradeoffs) for underlying
product "attributes" (including price). Conjoint analysis is a form of simultaneous concept testing
that presents a wide range of statistically designed/determined product/service concepts to
customers in customized surveys.
Information Source: This research study is based on customized customer surveys using
advanced marketing research and analysis techniques.
Additional Conjoint Analysis Resources: If you’re unfamiliar with conjoint analysis, you might
access and view this web-based video introduction to conjoint analysis:
“What Can Conjoint Analysis Do For You?”
https://www.youtube.com/watch?v=Su2qIrTmv1c
And, then please read the three-page tutorial that follows this Research Study #30 description.
Study Details: Conjoint analysis represents the equivalent of executing hundreds or thousands

RG Chapman PhD, "LINKS Positioning Strategy Simulation" 34
of individual concept tests simultaneously. As a natural extension of concept testing, conjoint
analysis has all of the general strengths and limitations associated with concept testing. For
example, conjoint analysis (like concept testing) is about customers’ stated preferences for
hypothetical descriptions of products or services. No real buying occurs in conjoint analysis (and
concept testing) research studies. Nevertheless, conjoint analysis has an excellent track record.
Many published research studies assess how well conjoint analysis studies predict buying
behavior. The results are clear: well-designed and well-executed conjoint analysis studies work!
In LINKS, conjoint analysis "attributes" include set-top box product configuration elements,
service levels (Perceived Service Quality), and price. The levels for these attributes are pre-
determined; you only have to specify the region for the conjoint analysis study.
A representative sample of customers for the designated market region are included in the
field surveying effort associated with conjoint analyses.
These "attribute" levels are used in conjoint analyses: Alpha levels of 1, 3, 5, 7, and 9; Beta
levels of 1, 3, 5, 7, and 9; bandwidth levels of 1, 2, 3, 4, 5, 6, and 7; warranty level of 0
quarters only; packaging levels of "Standard," "Premium," and "Environmentally Sensitive
Premium"; memory capacity of 0, 1, 2, and, 3; service levels of "0%", "10%", "20%", and
"30%" (representing various values of Perceived Service Quality); and, four price levels
which range from 10% less than the minimum current price in a region to 10% more than
the maximum current price in a region.
The estimated raw conjoint analysis trade-off weights are automatically rescaled to the 0-
100 interval for ease of interpretation. Note that these are relative weights only, with the "0"
and "100" weights corresponding to relatively low and relatively high attribute-level weights.
"100" is not a perfect or even the most desired level, only a highly attractive relative level
from among all of those offered to customers within the design of the conjoint analysis
study.
Cost: $75,000.
Limitations: This research study may only be executed in one region each quarter.
Additional Information – Estimated Relative Importances: Relative Importances" (the
normalized ranges of the attribute-level weights) are only summaries of the relative variations of
the attribute-level weights across each attribute. "Relative Importances" are never multiplied by
conjoint weights. In essence, the "weights are the weights" and you are never misled by looking
at the conjoint analysis trade-off weights. "Relative Importances," on the other hand, can easily
be misleading, since they depend on the attribute-level ranges used in the conjoint study design.
Be wary of the "Relative Importances." Always look to the weights. They never lie or mislead
providing, of course, that you don't extrapolate too much outside the range of the attribute-levels
in the design of the conjoint analysis study.
Additional Information – Estimated Conjoint Utility Weights: Estimated conjoint utilities are
only relative in nature. The overall utility for a particular product (configuration, service quality,
and price) can be estimated by summing the relevant part-worth utilities. In such calculations, it
may be necessary to interpolate or extrapolate depending on the attribute values for the product.
With an existing product, it is then possible to compare total utility to other possible product
configurations, service quality levels, and prices. In that way, it is possible to establish the price
premium that other products might command compared to the base product. Do this by choosing
prices that equate two products in overall conjoint utility terms. With equal overall utilities, equal
market shares might be expected in the long run. It follows that margins could be compared and
a search for more profitable configurations could follow.

RG Chapman PhD, "LINKS Positioning Strategy Simulation" 35
Specifically, suppose that you estimate an
existing product with a known 5.0% market share in
a particular channel and region has an overall utility
of 350 conjoint utility points. Then, another product
configuration, service quality, and price with the
same 350 conjoint utility points might be expected to
have the same market share in the long run. The
estimated margins for the base and comparison
products may be compared to determine the most
profitable offering. Note that the volumes are
identical, so the margins are the key comparison.
Conjoint analysis assesses underlying customer
values for products and services (product/service
positioning and pricing, in particular). As such, it
doesn't explicitly reference already existing
products/services. Conjoint analysis is a concept
testing style of marketing research, involving the
elicitation of customer reactions to hypothetical
products/services. Thus, conjoint analysis should
work fine in a new market even though the
customers have not yet personally experienced a
product/service category. There may be a little
more random noise in the conjoint analysis results
(reflecting customer inexperience with the category),
but the basic pattern of the findings should not be
affected materially whether markets are "new" or
"old."
Additional Information - $-Values of Estimated
Conjoint Analysis Utility Weights: The $-values reported in the LINKS conjoint analysis results
are a reinterpretation of the estimated conjoint utility weights. These $-values are calculated from
the implicit dollar value of a utility point derived from the estimated price weights, using only the
end-points of the price weights from the conjoint results. (This, of course, invokes a linearity
assumption, which could be inappropriate especially if there's a wide range of prices included in
the conjoint design.) For example, in the Sample Output shown above, the price weights indicate
that 100.0 utility points (100.0 - 0.0) corresponds to $290 ($457-167), so each utility point equals
about $2.90 in value to customers in region 1 in this Sample Output.
With the $-value per utility point estimated, the implied dollar value of various levels of the
other attributes in the conjoint design are estimated using a base point of $0 for one of the levels
for each conjoint attribute. The $-values show the implicit price differential associated with the
utility point differential compared to the base case.
For more details about such equivalent-value pricing, you may wish to access the following
short article by pointing your web browser at this case-sensitive URL:
http://www.LINKS-simulations.com/PAPERS/EVP.pdf
Additional Information - Example Interpretations: Some example interpretations follow for
the conjoint analysis results reported in the Sample Output for Research Study #30. In all
cases, these interpretations reflect the retail-channel prices reported in region 1 of these
Sample Results. You'd need to remove the retailer markup from these prices to convert
them to manufacturer-price equivalents. For example, with a retailer markup of 50% on the
Sample Output
==================================================== RESEARCH STUDY #30 (Conjoint Analysis )
==================================================== CONJOINT ANALYSIS RESULTS, REGION 12 [HYPERWARE] Relative Importances: Alpha 19.6% Beta 15.4% Bandwidth 16.2% Warranty 0.0% Packaging 7.0% Memory Capacity 7.6% Service 6.1% Price 28.1% Alpha: Level=1 8.3 [$ 0] Level=3 8.3 [$ 0] Level=5 12.0 [$ 10] Level=7 51.9 [$ 126] Level=9 77.8 [$ 201] Beta: Level=1 39.7 [$ 0] Level=3 63.2 [$ 68] Level=5 35.1 [$ -13] Level=7 11.9 [$ -80] Level=9 8.4 [$ -90] Bandwidth: Level=1 12.5 [$ 0] Level=2 14.9 [$ 6]
Level=3 18.6 [$ 17] Level=4 24.4 [$ 34] Level=5 33.5 [$ 60] Level=6 47.9 [$ 102] Level=7 70.0 [$ 166] Warranty: Level=0 31.7 [$ 0] Packaging: Level=Standard 20.7 [$ 0] Level=Premium 28.8 [$ 23] Level=Prem ES 45.5 [$ 71] Memory: Level=0 19.9 [$ 0] Level=1 25.7 [$ 16] Level=2 34.3 [$ 41] Level=3 46.9 [$ 78] Service: Level= 0% 18.2 [$ 0] Level=10% 31.9 [$ 39] Level=20% 36.6 [$ 53] Level=30% 40.0 [$ 63]
Price: Level=$ 167 100.0 Level=$ 262 20.2 Level=$ 339 6.5 Level=$ 457 0.0

RG Chapman PhD, "LINKS Positioning Strategy Simulation" 36
manufacturer’s price, these $-values would need to be reduced by one-third.
The conjoint weights and the implied $-values are relative not absolute figures. For
example, the estimated conjoint utility weight of 8.3 for Alpha=1 means nothing in and of
itself; 8.3 only has meaning when compared to some other conjoint utility weight.
Differences matter in interpreting conjoint analysis results, not absolute values.
In the Sample Output, the most preferred Beta level is approximately 3. Rather than saying
“exactly 3,” “approximately 3” reflects that we don’t know the conjoint weight for Beta=2 or
Beta=4 since those Beta values weren’t included in this conjoint analysis study design.
Compared to Alpha=1 (with an estimated conjoint weight 8.3), an Alpha level of 7 provides
43.6 extra utility points (51.9 – 8.3 = 43.6). With an estimated $-value per utility point of
$2.90 (from the paragraph above), this represents approximately $126 ($126 - 0 = $126) in
extra value to customers in region 12. That is, customers in region 12 would be indifferent
between the products {Alpha=1 and price=$X} and {Alpha=7 and price=$X+126} assuming
that Beta, bandwidth, warranty, packaging, memory disks, and service quality were equal
for both of these products. Here, “indifferent” means that long-run purchasing patterns (i.e.,
market shares) would be equal.
Expressed differently but equivalently, reconfiguring a product from Alpha=1 to Alpha=7
increases the product’s value by $126, so long-run purchasing patterns (i.e., market shares)
would remain the same if that reconfigured product had a price of $126 more than its
previous price prior to such a reconfiguration.
Suppose that an existing product in region 12 has Beta=5. A reconfiguration to Beta=3
adds 63.2 – 35.1 = 28.1 extra conjoint utility points which corresponds to $68 - (-$13) = $81
in equivalent value. Thus, this reconfigured product could have an $83 price increase and
customers would continue to purchase it at approximately the same rate as in the past (with
Beta=5 and an $81 lower price). These price-equivalent results must be gauged relative to the associated cost implications
with reconfigurations.
1. Don’t just look for the highest estimated conjoint utility weights and reconfigure a
product to those values. If costs change by $100 while the $-price equivalence of a
reconfigured product only adds $60 in utility value to customers, then such a
reconfiguration would be reducing margin by $40 to retain equivalent overall utility (and
long-run market share). Such a situation seems unwise. Rather, continue to search for
alternative reconfiguration opportunities where the potential margin increase is positive
not negative.
2. One-time reconfiguration costs and potential patent royalty payments (possibly, to
multiple competitors) must also be taken into account when attempting to base
reconfigurations on conjoint analysis results. For example, reconfiguring to improve
your product by 10 conjoint utility points (each worth $2.90 for a total equivalent-value of
$29.00) may not be worthwhile if the product’s sales volume is small. 5,000 units of
sales volume would take many quarters of time to payback $1,000,000+ one-time
reconfiguration costs.
3. Note that margin increases if product costs decrease. So, a reconfiguration to reduce
product costs while retaining the existing overall conjoint utility value is another viable
reconfiguration target.
The conjoint analysis results provided in the Sample Output don’t answer the question
“What price should you charge?” That would require “absolute” not merely “relative”
customer preference/utility information (and competitive choice simulators, which are not
part of the LINKS research study resources). See Research Study #24 (“Price Sensitivity
Analysis”) for a LINKS research study that provides market share estimates for existing
product and for possible new products, respectively.

RG Chapman PhD, "LINKS Positioning Strategy Simulation" 37
Interpreting Conjoint Analysis Results: A Tutorial
Conjoint analysis seeks to measure and quantify customers' values for underlying buying factors,
offering attributes, characteristics, and features (performance, quality, and service, for example)
and price. In effect, conjoint analysis reverse engineers customers' buying decisions. With
knowledge of customers' buying values, important product positioning and pricing questions such
as the following may be addressed:
(1) What buying factors are most important to customers? For example, how important is
"service" to customers?
(2) What buying factor levels are most valued by customers? For example, how important is
"service responsiveness - within one hour" to customers?
(3) How much will customers pay for particular buying factor levels? For example, what is the
implicit dollar premium that customers will pay for "service responsiveness - within one hour"
compared to "service responsiveness - within one day"?
There's even more to conjoint analysis than addressing just these questions (market share
prediction and simulations under various competitive "what-if" scenarios as well as customer
segmentation, for example) but a detailed discussion of these advanced issues is beyond the
scope of this brief tutorial.
Conjoint Analysis: The Underlying Premise
The fundamental premise in conjoint analysis is that buyers think about and make purchasing
decisions based on a brand’s underlying attributes or feature-sets. This premise will be more
reasonable as the "size" (economic commitment) of the product/service increases. Thus, this is
likely to be most reasonable for larger consumer durables and industrial products, or for
services involving relatively high prices. Consumer non-durables (low-priced, low-risk products)
cause problems for conjoint analysis because buyers may purchase with little thought about
underlying attributes, using "buy-it-and-try-it-before-deciding" buying. Of course, laboratory
tests, field tests, and test marketing experiments are feasible with consumer non-durables.
An Example
To provide an overview of conjoint analysis, we'll use a simplified version a hotel advance
reservation program example. Our focus is on interpreting the results of conjoint analysis
studies, not on their design or fielding.
In pricing service variations, it's natural to analyze customers' preparedness to pay premiums for
upgraded offerings. For example, in the hotel market place, we might be concerned with pricing
basic rooms compared to upgraded rooms with various special features and enhanced services.
Of course, there might be many more than just the two buying factors, room price and room type,
within a full-scale hotel market conjoint analysis study.5
5 An early major published conjoint analysis application in marketing involved 50 different hotel buying
factors (and a total of 167 levels of these buying factors) associated with business travel and business
travelers. This conjoint analysis application was a significant part of the background marketing research
and analysis that ultimately led to the launch of the Courtyard By Marriott hotel chain.

RG Chapman PhD, "LINKS Positioning Strategy Simulation" 38
Suppose that we had these conjoint analysis
trade-off weight estimates. These trade-off
weights might be for a single customer or they
might represent the average trade-off weights for
all customers in a particular segment.
These trade-off weights reflect predictable results
patterns. Higher room prices are associated with
lower utility and basic rooms are valued less than
upgraded rooms. Note the preference for
“Upgraded (A)” vs. “Upgraded (B)” room types.
Buying Factor
Attributes (and
Levels
Estimated Conjoint
Analysis Utility Trade-
Off Weights
Room Prices:
$100
$120
$140
$160
100
81
54
0
Room Type:
Basic
Upgraded (A)
Upgraded (B)
21
61
54
But, have we simply re-discovered the obvious? Yes, but we've accomplished more. These
trade-off weights express customer preferences in quantifiable terms. We haven't just learned \
that lower priced rooms are preferred; we've learned about the preference strength.
One way of summarizing these results is with relative importances, the normalized ranges of the
buying factor level weights. For these trade-off weights, the ranges are 100-0=100 (for Room
Price) and 61-21=40 (for Room Type). Normalizing these ranges to sum to 100% results in the
estimated relative importances of 71.4% and 28.6% for room price and room type, respectively.
Given these researcher-designated buying factor ranges ("$100" to "$160" and "Basic" to
"Upgraded (A)"), it appears that room price is substantially more important than room type to
these customers within these buying factor ranges.6
With regard to the specifics of customer preferences, customers prefer "Upgraded (A)" to
"Upgraded (B)" rooms. This, of course, isn't the final word on offering design and positioning. If
"Upgraded (A)" rooms are much more expensive than "Upgraded (B)" rooms to provide to
customers, it might be more profitable to offer only "Upgraded (B)" rooms at a more modest price
than "Upgraded (A)" rooms. If "Upgraded (A)" and "Upgraded (B)" rooms cost about the same to
deliver, then these results indicate the clear superiority of the "Upgraded (A)" offering. Rather
than relying on guessing (i.e., "sound managerial judgment"), these conjoint analysis results
provide the hotel manager with solid evidence as to the preferred market offering and the extent
to which customers are prepared to pay for various product/service options.
The real managerial payoff from these trade-off weights lies in estimating price premiums or
equivalent-value prices. For these sample results, let's express the room price results in terms of
a single trade-off between price and utility. We could be quite sophisticated and fit a regression
line through these data. Alternatively, let's just use the end-points and estimate an overall
average effect of room price on utility. (This simple approach overlooks the possibility of a non-
linear relationship between room price and utility.) For these room prices, a range of $60 ($160-
$100) is associated with a difference of 100-0=100 utility points. Thus, each utility point is
implicitly valued at $0.60 by these customers.
6 Gauging relative importances via normalized ranges of the buying factor level weights is customary in
conjoint analysis studies. This relative importance metric has an intuitively-appealing rationale. If all
estimated conjoint utility weights for the levels of an attribute are similar, the range for that attribute’s weights
is small and the associated normalized range of that attribute’s weights would also be small. This implies
that these particular attribute-levels are not particularly influential in driving overall customer preferences.

RG Chapman PhD, "LINKS Positioning Strategy Simulation" 39
Given the estimate of $0.60 per utility point, we can now calculate the implicit price premiums that
customers are prepared to pay for upgraded rooms compared to "Basic" rooms:
• For "Upgraded (A)" rooms, the 40 extra utility points (from 21 to 61) translate into an implicit
$24.00 room premium. A customer who is prepared to pay $110 for a "Basic" room should be
prepared to pay $134 for an "Upgraded (A)" room.
• For "Upgraded (B)" rooms, the 33 extra utility points (from 21 to 54) translate into an implicit
$19.80 room premium. A customer who is prepared to pay $110 for a "Basic" room should be
prepared to pay $129.80 for an "Upgraded (B)" room.
With these results, management is in an informed position to design and price hotel rooms.
Further Reflections on Equivalent-Value Pricing
Here are some additional reflections about equivalent-value pricing via conjoint analysis.
The base case offering for equivalent-value pricing should be a widely-demanded offering. It
would be risky to base equivalent-value prices on obscure or small-demand brands, since their
customers may exhibit peculiar demand tendencies that may not generalize to the broad
market of all customers.
Equivalent-value prices don’t account for demand or the number of competitors. Obviously,
this is a limitation. However, the equivalent-value price is a price that results in an offering
having an overall value equal to some other offering. That may not be the best possible thing
to do, or the best possible offering to which one should be compared. Nevertheless, the
equivalent-value price is a relevant reference point, rather like a break-even price level.
Since the equivalent-value price offers equivalent overall customer value (considering product
attributes and price), customers should be indifferent among offerings priced at their
equivalent-value prices. Assuming equal awareness and distribution access, approximately
equal market shares and sales volumes should follow — by definition. However, a vendor
may not be indifferent among alternative product attribute and price bundles. Profitability may
differ for alternative product attribute and price bundles, and a thoughtful vendor will search for
least-cost equivalent-value options.
Conjoint analyses quantify the desirability of product or service features, to assess price
sensitivity and to forecast demand and market share. Equivalent-value pricing analysis is
another important approach to representing the results of conjoint analyses. Equivalent-value
prices are not necessary the "best" possible prices, and they certainly aren't the "optimal" price
(whatever that means). Nevertheless, equivalent-value prices are key benchmarks about
which the thoughtful marketing professional must be knowledgeable. At a minimum, selecting
the equivalent-value price leads to a competitive price.
Source: Adapted from Randall G. Chapman, "Equivalent-Value Pricing," Pricing
Strategy & Practice: An International Journal, Vol. 2, No. 2 (1994), pp. 4-16.

RG Chapman PhD, "LINKS Positioning Strategy Simulation" 40
Research Study #31: Self-Reported Preferences
Purpose: This research study provides self-reported importance weights for a variety of generate
demand elements for each market region. In addition, self-reported attribute preferences for
various levels of raw materials Alpha and Beta are provided for each market region, as well as
Alpha-Beta positioning maps of customer ideal points for each market region.
Information Source: This research study is
based on end-user customer surveys.
Study Details:
These self-reported importance weights are
the averages across all survey respondents.
Seven-point rating scales are used in this end-
user customer surveying, where "1" is anchored
by "Not Important" and "7" is anchored by "Very
Important."
The self-reported attribute preferences
reflect the distribution of customers’ self-
reported preferences across the range of 0-9
kg. for raw materials Alpha and Beta.
The positioning maps graphically display
customer preferences for Alpha-Beta
combinations for category in each market
region. Current product Alpha-Beta
positionings are displayed relative to the
customer ideal-points in the market regions.
Cost: $20,000.
Other Comments: Self-reported importance
weights are easy things to ask survey
respondents. There is, however, considerable
debate about the usefulness of such measures.
Customers may have trouble distinguishing
low-importance and high-importance elements. Customers may report that everything is
important, failing to provide the differentiation that is of interest to marketing managers. It's also
not clear how to use self-reported importance weights to predict future buying behavior, since self-
reported importance weights aren't developed from actual behavior. Perhaps they're only meant
to be directional in nature, identifying only really low and really high importance factors.
Self-reported importance weights and self-reported attribute preferences are of uncertain
quality. It’s easy for customers to report “what they want” on such survey instruments, but the
statistical veracity of these self-reported weights and self-reported attribute preferences has been
questioned by many professional marketing researchers.
Additional Information: In this research study, self-reported attribute preferences are reported
only for Alpha and Beta and not for bandwidth, warranty, and packaging. Bandwidth, warranty,
and packaging are “more-is-better” product attributes. There’s no doubt as to the “best” (most
preferred) level of each of these product attributes. Rational end-user customers should naturally
Sample Output
========================================================== RESEARCH STUDY #31 (Self-Reported Preferences ) ========================================================== Region 1 Region 2 Region 3 -------- -------- -------- --------- HYPERWARE --------- Advertising 3.77 4.12 3.50 Alpha 2.95 3.16 3.04
Availability 3.77 4.12 3.50 Beta 3.20 2.95 3.16 Bandwidth 3.64 3.34 3.11 Marketing 3.77 4.12 3.53 Packaging 3.16 3.16 3.50 Price 4.72 4.79 5.00 Product Quality 3.50 3.77 4.12 Promotion 3.97 4.18 3.53 Sales Force 3.77 4.12 2.93 Service Quality 3.64 3.77 3.58 ----------------------------------- Self-Reported Attribute Preferences For Various Raw Materials Levels ----------------------------------- %s of Customers in a Region Preferring Particular Raw Materials Levels Region 2, Hyperware: Alpha 0 ██ 1.8% 1 ▒▒▒▒▒▒▒▒▒▒▒ 6.2% 2 ██████████████████ 11.9%
3 ▒▒▒▒▒▒▒▒▒▒▒▒▒▒▒▒▒▒▒▒▒▒▒▒▒▒▒▒▒▒▒▒▒ 21.7% 4 ██████████████████████████████████████ 24.5% 5 ▒▒▒▒▒▒▒▒▒▒▒▒▒▒▒▒▒▒▒▒▒▒▒▒▒▒▒▒▒▒▒ 18.0% 6 ███████████████ 10.9% 7 ▒▒▒▒▒▒ 4.2% 8 █ 1.1% 9 0.2% …

RG Chapman PhD, "LINKS Positioning Strategy Simulation" 41
always prefer the highest
possible level of bandwidth,
warranty, and packaging.
The self-reported attribute
preferences reported in this
research study represent one
approach to assessing customer
preferences for specific possible
Alpha and Beta levels in set-top
box products’ configurations.
These self-reported attribute
preferences provide a general
scan of customer preferences
across the full range of set-top
box technology for raw materials
Alpha and Beta. Based on the
results of this research study,
other research studies should be
executed to refine reconfiguration
options and possibilities. For
example, after reviewing the
results of this research study, one
or more research study #23
(“Concept Test”) reports might be
executed.
Relatively sharp preference
distributions for Alpha and Beta
are indicative of homogeneous
customers (who all want about the same raw material level) or strong preferences (they are quite
insistent about their requirements for raw materials). Relatively flat preference distributions for
raw materials signal heterogeneous customers (there is wide variation in customer preferences for
raw material levels) or weak preferences (they are tolerant to variations in raw materials).
Sample Output (continued)
========================================================== RESEARCH STUDY #31 (Self-Reported Preferences ) ========================================================== HYPERWARE ALPHA-BETA POSITIONING MAP Alpha │ Numbers are 9│ estimated │ region-specific │ Alpha-Beta 8│ customer │ preferences │ (ideal-points). 7│ 3 │ Letters are │ current product 6│ P configurations │ for Alpha-Beta. │ j 5│ eA1 Other product │ ZUK configuration │ elements (e.g., 4│ Bandwidth,
│ Warranty, and │ Packaging) are 3│ not reflected │ in this │ two-dimensional 2│ Alpha-Beta │ positioning map. │ 2 1│ │ │ 0│ │ └──────────────────────────────────────────────── Beta 0 1 2 3 4 5 6 7 8 9 1-1 A 2-1 F 3-1 K 4-1 P 5-1 U 6-1 Z 7-1 e 8-1 j

RG Chapman PhD, "LINKS Positioning Strategy Simulation" 42
Research Study #33: Value Maps
Purpose: Value maps display the relative standing of all actively distributed product in a market
region based on perceived benefits (on the horizontal axis) and price (on the vertical axis).
Information Source: This information is
derived from other research. Your research
supplier uses proprietary weights to combine
benefit-drivers (product quality perception,
service quality perception, and availability
perception) into an overall perceived benefits
measure for two-dimensional price-versus-
benefits value maps.
Cost: $3,000 per region.
Other Comments: LINKS value maps display
products based on benefits and prices. An
equivalent-value line showing customers'
trade-offs between benefits and price isn't
included. You'll need to superimpose your
own equivalent-value line on these value
maps.
The equivalent-value line's slope depends
on customers' relative weights for benefits and
price and it should be drawn with reference to
market shares, with the line being closer to
larger market-share products.
Sample Output
======================================================================= RESEARCH STUDY #33 (Value Maps ) ======================================================================= VALUE MAP REGION 3 [HYPERWARE] Price ┌──────────────────────────────┐ 806│ │ │ B │ │ C │ │ │ 711│ │ │ │ │ │ │ │ 616│ │ │ │
│ │ │ │ 521│ A │ │ │ │ │ │F E │ 427│ D │ └──────────────────────────────┘ 10.0 19.2 28.4 37.5 Perceived Benefits Legend For Products Displayed ---------------------------------- Product MS Price PQ SQ Av ------- --- ----- --- --- --- 1-1: A 11% 532 2% 21% 27% 2-1: B 23% 791 28% 21% 53% 3-1: C 7% 770 2% 41% 34% 4-1: D 22% 436 2% 22% 29% 5-1: E 17% 465 2% 18% 28% 6-1: F 17% 465 2% 19% 18% Notes: (1) Variables listed above are market share ("MS"), end-customer price ("Price"), perceived product quality ("PQ"), perceived service Quality ("SQ"), and perceived availability ("Av"). (2) "Perceived Benefits" is a combination of perceived product quality, perceived service quality, and perceived availability.

RG Chapman PhD, "LINKS Positioning Strategy Simulation" 43
Research Study #35: Market Structure Analysis
Purpose: This research study provides a market structure analysis of customer switching
behavior in a specified market region or regions. For each active brand, brand-switching matrices
estimate set-top box customers’ probabilities of purchasing available brands on the next purchase
occasion.
Information Source: This research study is based on end-user customer surveys.
Study Details: Since set-top boxes are durable
goods, direct observation of customer switching
behavior (from one purchase occasion to the next)
is infeasible. Much time can pass between repeat
purchase occasions of durable goods like set-top
boxes.
To estimate brand-switching probabilities,
your research supplier poses a series of
hypothetical switching behavior questions to
members of an on-going customer panel. These
questions include:
"What was the last brand of set-top box that
you purchased?"
"What set-top box brand do you plan to purchase next?"
"If that brand was unavailable, which set-top box brand would you purchase?"
The panel members’ answers to these questions provide the inputs from which your research
supplier estimates brand-switching probabilities.
Brand-switching probabilities identify major competitors through substitution patterns,
those competitors to whom and from whom customers tend to switch. Brand-switching
probabilities may also be useful for sales forecasting purposes, since they show customer flows
to and from each brand.
Cost: $5,000 per study (per market region).
Execution Details: To specify “all” regions within a single market structure analysis, enter “0”
(zero) as the region selection. This, of course, involves multiple executions of market structure
analyses with consequent cost implications.
Limitations: A maximum of four (4) research studies of this type may be executed each quarter.
Each market structure analysis research study request may reference a single region or all
regions simultaneously.
Additional Information: As may be noted in the sample output for this research study, brand-
switching probabilities in each row sum to 100% since prior purchasers of a particular brand must,
by definition, “switch” to one of the available set-top box brands on the next purchase occasion. If
different brands are available at the time of the next purchase or if the brands’ value-related
positionings change at the time of the next purchase, these brand-switching probabilities will
change.
Sample Output
========================================================== RESEARCH STUDY #35 (Market Structure Analysis ) ========================================================== BRAND-SWITCHING MATRIX, REGION 3 [HYPERWARE] -------------------------------------------- \ TO 1-1 1-2 2-1 2-2 3-1 3-2 4-1 4-2 FROM \ ---- ---- ---- ---- ---- ---- ---- ----
1-1 40.5 2.4 16.6 2.7 15.5 2.8 16.2 3.2 100% 1-2 16.3 31.4 14.3 2.5 14.9 2.5 15.4 2.6 100% 2-1 16.6 2.5 42.0 2.9 14.4 2.8 15.9 3.1 100% 2-2 16.2 2.7 17.0 29.8 13.6 2.8 15.0 3.0 100% 3-1 18.7 2.5 15.3 2.7 38.7 2.6 16.4 3.1 100% 3-2 18.4 2.5 13.8 2.9 15.9 26.8 16.8 2.9 100% 4-1 17.6 2.7 14.6 3.1 15.0 2.8 41.2 2.9 100% 4-2 16.1 2.3 14.6 2.9 15.5 2.3 14.3 31.9 100%

RG Chapman PhD, "LINKS Positioning Strategy Simulation" 44
Research Study #38: Retention Statistics
Purpose: This research study provides
retention rates for all actively marketed
products in all channels and regions markets
for the last four quarters.
Information Source: Retention rates are
estimated based on a customer survey of
current purchasers of set-top boxes.
Retention rates are customers’ stated
intentions of probability of future repurchase
of the just-purchased set-top box.
Cost: $10,000.
Other Comments: Retention rates are measures of long-run average customer loyalty to a just-
purchased product. They are estimates of the average current purchaser’s stated intention of
probability of repeat purchase. Retention rates are also used by marketing analysts to estimate
customer lifetime value (CLV).
Sample Output
====================================================================== RESEARCH STUDY #38 (Retention Statistics ) ====================================================================== Quarter 13 Quarter 14 Quarter 15 Quarter 16 ---------- ---------- ---------- ---------- -------- REGION 1 -------- CHANNEL 1: Product 1-1H 60.2 58.3 58.1 58.0 Product 1-2M 39.6 40.5 39.4 38.9 Product 2-1H 60.5 58.2 60.2 60.7 Product 2-2M 41.4 41.1 41.3 40.3 Product 3-1H 59.0 60.0 61.4 57.9 Product 3-2M 39.1 38.8 39.0 41.0 Product 4-1H 58.0 61.3 58.6 60.5 ...

RG Chapman PhD, "LINKS Positioning Strategy Simulation" 45
Interpreting Retention Statistics and Customer Lifetime Value: A Tutorial
Customer lifetime value (CLV) is calculated as the net present value of expected future cash flows
over the lifetime of an individual customer. The equation (shown below) explicitly accounts for
customer churn or turnover by adjusting the cash flow for each time period by the probability that
the customer will be retained (r):
GMt = gross contribution margin per customer in time period t
r = retention rate
d = discount rate
t = a time index (e.g., a quarterly time index)
Calculating Customer Lifetime Value
The steps in calculating CLV are as follows:
1. Determine annual profit (or cash) flow pattern for customers over time.
2. Establish customer defection/retention pattern.
3. Calculate customer NPV using firm’s discount rate.
It is preferable to calculate CLV using gross contribution margin per customer in the numerator.
However, in some instances, firms have difficulty assigning their costs to specific customers, so
gross contribution margin per customer is replaced by revenue per customer.
Different market segments may have very different cash flow characteristics (that is, different
gross contribution margins and retention rates). Hence, it is useful to calculate CLV separately for
the typical customer in each market segment.
Interpreting Customer Lifetime Value
The CLV framework is a useful way of thinking about managing customer relationships to
maximize shareholder value. From a managerial standpoint, there are three ways for a company
to increase aggregate CLV (and consequently shareholder value) next year: (1) Acquire new
customers; (2) Increase retention of existing customers; or, (3) Increase gross margin (through
cross-selling or changes in cost-structure, for example).
Firms generally consider customers with a high CLV to be most attractive and – if these
customers perceive the firm’s product to have a high value – it will be profitable for the firm to
invest in marketing to them. Firms generally undertake defensive strategies to retain customers
with a high CLV who do not perceive the firm’s product to have a high value because they are
vulnerable and may be lost to competitors.
Recent research has shown that the CLV framework (i.e., using forecasts of acquisition, retention,
and margins) can be used to calculate the value of the firm’s current and future customer base.
Gupta, Lehmann and Stuart (2004) used publicly available information from annual reports and
other financial statements to calculate a customer-based valuation of five companies. They
compared their estimates of customer value (post-tax) with the reported market value for each of
t
tt
T
t d
rGMCLV
)1(
)(
1

RG Chapman PhD, "LINKS Positioning Strategy Simulation" 46
the companies. Their estimates were reasonably close to the market values for three firms, and
significantly lower for two firms (Amazon and eBay). They inferred that these two firms are either
likely to achieve higher growth rates in customers or margins than they forecast, or they have
some other large option value that the CLV framework doesn’t capture.
Sample Customer Lifetime Value Calculation
An auto dealership tracks customers who use its service facility. New customers represent $50 in
1st-year margins, $100 in 2nd-year margins, $125 in 3rd-year margins, and $100 in margins in
subsequent years. The dealership estimates that customers defect at a rate of 20% per year.
That is, only 80% of new customers continue to use the automobile dealership's services in the
second year, only 60% of new customers continue to use the automobile dealership's services in
the third year. etc. Assume the firm’s discount rate is 20%. We can calculate the CLV for the
average customer as follows:
CLV = 50/1.20 + (100x0.80)/(1.20)
2 + (125x0.60)/(1.20)
3 + (100x0.40)/(1.20)
4 + (100x0.20)/(1.20)
5
= $167.96
Suppose the auto dealership was able to reduce customer defections from 20% to 15% per year.
Then, CLV for the average customer would be $205.10. Thus, a 5% reduction in the rate of
customer defections (a 5% increase in the customer retention rate) increases profitability by
22.1%. Note that, in this example, we discount cash flows back to “year 0” and assume there was
no acquisition cost at year 0.

RG Chapman PhD, "LINKS Positioning Strategy Simulation" 47
Research Study #39: Benchmarking - Product Variable Cost Estimates
Purpose: This research study provides product variable cost estimates of competitive products
for your industry. These product variable cost estimates must be requested for one or more
specific firms in your industry.
Information Source: These product
variable cost estimates are provided via
an information sharing arrangement
managed by the Set-Top Box Trade
Industry Association.
Cost: $500 per actively distributed
product. When you specify a particular
firm for this research study, product variable cost estimates are provided for all that firm’s actively
distributed products.
Additional Information: As may be noted from the Sample Output, total product (variable) cost
is reported for each product as well as the associated cost elements of configuration cost, labor
cost, and production cost.
Sample Output
======================================================================= RESEARCH STUDY #39 (Benchmarking - Product Variable Cost Estimates ) ======================================================================= Total Configuration Labor Production Product Cost Cost Cost Cost ------------- ----- ---------- ======= Product 1-1H 122.43 30.00 20.00 172.43 Product 1-2H 214.32 30.00 20.00 268.32 Product 2-1H 342.47 30.00 20.00 392.57 …

RG Chapman PhD, "LINKS Positioning Strategy Simulation" 48
Decision Forms
"The secret of getting ahead is getting started. The secret of getting
started is breaking your complex, overwhelming tasks into small
manageable tasks, and then starting on the first one." – Mark Twain
Use the LINKS decision forms on the following two pages during your team deliberations to record
your decisions in each simulation quarter. Then, input these decisions into LINKS via the LINKS
Simulation Database:
http://www.LINKS-simulations.com
With the exception of research studies orders (which must be made every quarter), all LINKS
decisions are standing orders. (i.e., permanent until explicitly changed). You only need to enter
decision changes. If you are satisfied with a current decision, there is no need to change it.

RG Chapman PhD, "LINKS Positioning Strategy Simulation" 49
Positioning Strategy Decisions (1 of 3) Firm Quarter
Product Configuration Product 1 Product 2 Product 3
Category {"H"=hyperware} H H H
Alpha {0-9 kilograms}
Beta {0-9 kilograms}
Bandwidth {1-7 terahertz}
Warranty {0 quarters} 0 0 0
Packaging {"1"=standard, "2"=premium, "3"=ESpremium}
Memory Capacity {0-3 disks}
Generate Demand, Product 1 Region 1 Region 2 Region 3
Active Product? {Yes|No}
Price
Marketing Spending
Marketing Mix Allocation
Positioning
Sales Volume Forecast
Generate Demand, Product 2 Region 1 Region 2 Region 3
Active Product? {Yes|No}
Price
Marketing Spending
Marketing Mix Allocation
Positioning
Sales Volume Forecast
Generate Demand, Product 3 Region 1 Region 2 Region 3
Active Product? {Yes|No}
Price
Marketing Spending
Marketing Mix Allocation
Positioning
Sales Volume Forecast
Reminders:
(1) Only input changes. If you're happy with the current values of these decisions, leave the
appropriate decision entries blank.
(2) All decision inputs change the existing values to the values that you specify. Do not enter "+"
or "-" values. Rather, enter new values only (new values replace the existing value of the
decision variable with your designated value).

RG Chapman PhD, "LINKS Positioning Strategy Simulation" 50
Positioning Strategy Decisions (2 of 3) Firm Quarter
Service Decisions Region 1 Region 2 Region 3
Service Outsourcing
Firm Name {maximum of 40 characters}
Research Studies Decisions
1 Benchmarking - Earnings
2 Benchmarking - Balance Sheets Firm(s)?
3 Benchmarking - Product Development
9 Benchmarking – Generate Demand
11 Benchmarking - Operating Statistics
12 Market Statistics
14 Regional Summary Analysis Region(s)?
20 Customer Satisfaction
23 Concept Test Region? Configuration?
Region? Configuration?
Region? Configuration?
Region? Configuration?
Region? Configuration?
Region? Configuration?
Region? Configuration?
Region? Configuration?
24 Price
Sensitivity
Analysis
Product? Region? Configuration? Price?
Product? Region? Configuration? Price?
Product? Region? Configuration? Price?
Product? Region? Configuration? Price?
27 Marketing Program Benchmarking Region(s)?
30 Conjoint Analysis Region?
31 Self-Reported Preferences
33 Value Maps Region(s)?
35 Market Structure Analysis Region(s)?
38 Retention Statistics
39 Benchmarking - Product Variable Cost Estimates Firm(s)?
Reminders:
(1) Circle the number of each research study that you wish to order. If additional information is required for a
research study, provide that information in the designated space(s).
(2) Research requests are for one quarter only; reorder research studies each quarter, as desired.
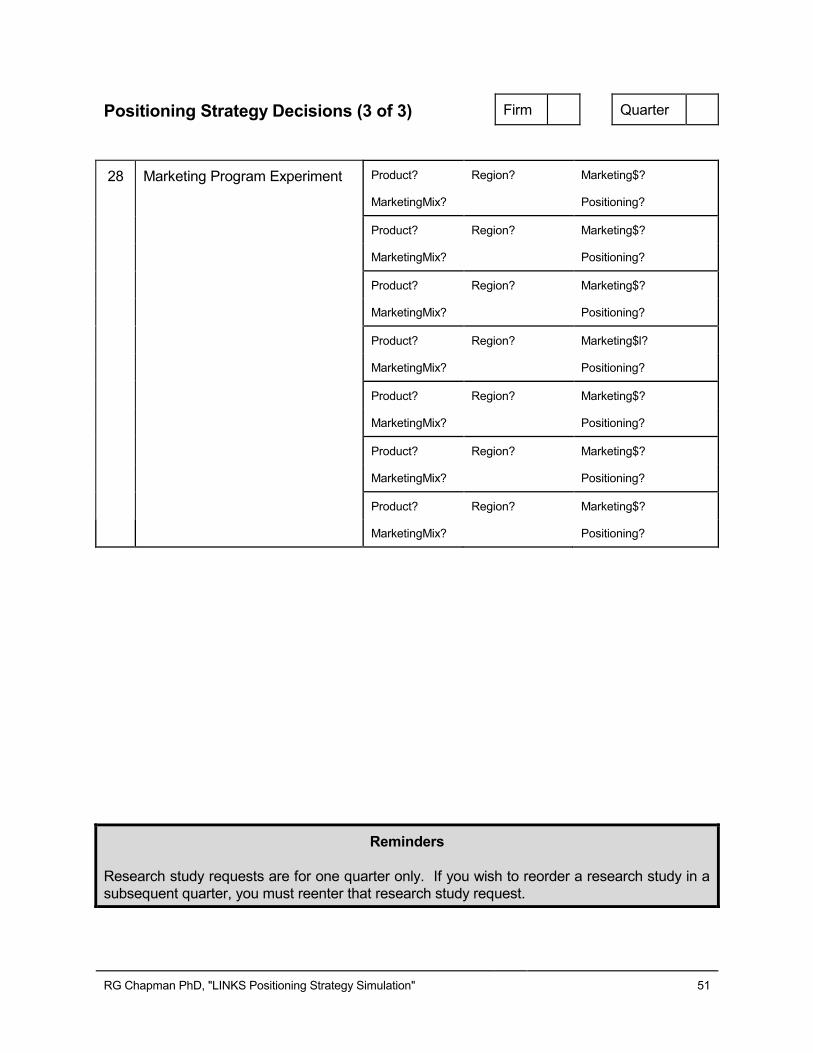
RG Chapman PhD, "LINKS Positioning Strategy Simulation" 51
Positioning Strategy Decisions (3 of 3) Firm Quarter
28 Marketing Program Experiment Product? Region? Marketing$?
MarketingMix? Positioning?
Product? Region? Marketing$?
MarketingMix? Positioning?
Product? Region? Marketing$?
MarketingMix? Positioning?
Product? Region? Marketing$l?
MarketingMix? Positioning?
Product? Region? Marketing$?
MarketingMix? Positioning?
Product? Region? Marketing$?
MarketingMix? Positioning?
Product? Region? Marketing$?
MarketingMix? Positioning?
Reminders
Research study requests are for one quarter only. If you wish to reorder a research study in a
subsequent quarter, you must reenter that research study request.
RG Chapman PhD, "LINKS Positioning Strategy Simulation" 52
Financial Reports "In a good wind, even turkeys can fly." – Chinese saying
The LINKS Positioning Strategy Simulation begins in quarter 1 with all firms in the identical
position (same products, configurations, prices, marketing spending levels, capital structure, etc.).
Since there is no randomness in the simulation in quarter 1, all firms are identical as the
simulation begins. This starting position obviously facilitates evaluation, since all firms start at the
same place. After quarter 1, the decisions of the competing firms in your industry and natural
statistical randomness will lead to differences in competitive positions and results.
To provide an overall roadmap for thinking about the drivers of profitability in LINKS, the charts in
Exhibits 1 and 2 decompose net income into its underlying components. In Exhibit 1, the principal
drivers of net income are revenues and costs. Taxes and non-operating income play lesser roles.
Exhibit 2 provides a breakdown of the drivers of volume, one of the two key drivers of revenues.
Collectively, these exhibits provide a sense of the DNA of net income in LINKS.
The "Corporate P&L Statement" aggregates product-specific profit-and-loss statements into an
overall corporate P&L statement. Some line-items appear on the "Corporate P&L Statement"
only, because it isn't possible to unambiguously allocate those costs to specific products in
specific regions. Definitions of non-obvious line-items on the "Corporate P&L Statement" follow:
Administrative overhead ("Administrative O/H") is $300,000 per quarter per product per region.
"Consulting Fees" are positive or negative adjustments to income or expenses.
Conversations with your instructor/coach are normally without charge, so don't worry about
"Consulting Fees" associated with such consultations. "Consulting Fees" represent a
convenient mechanism for making adjustments to income or expenses. For example, a
research billing problem can be corrected via an appropriate negative "Consulting Fee."
Corporate overhead ("Corporate O/H") is $750,000 per product per quarter. This per-product
charge is incurred if a product is actively distributed in one or more regions.
"Duties & Tariffs" are a percentage of the average selling price for finished goods that are
imported into any region. If a firm has a manufacturing plant in a region, there are no duties
and tariffs payable. The current duties and tariffs rates are 0%, 8%, and 12%, respectively,
for regions 1, 2, and 3. By definition, all finished goods sold in market region 1 are "local,"
since your firm's manufacturing plant is located in market region 1. "Duties & Tariffs" are
levied on sales in a market region (orders from customers).
“Forecast Inaccuracy” records the costs associated with forecasting errors.
"Information Technology" records all IT charges including a $1,000/page charge for all
financial/operating reports. This charge is per-firm and is not related to the number of team
members. Each quarter's charge is based on the previous quarter's actual page counts.
"Non-Operating Income" derives either from interest earned on "Marketable Securities" (from
the previous quarter's "Balance Sheet") or from interest paid on "Loans" (from the previous
quarter's "Balance Sheet").
"Patent Royalties" include patent royalties that your firm pays to other firms, as well as patent
royalties received from other firms.

RG Chapman PhD, "LINKS Positioning Strategy Simulation" 53
Exhibit 1: Net Income Drivers in LINKS
Net Income
Revenues
Costs
Non-Operating
Income
Taxes
Volume
Price
Fixed Costs
Variable Costs
Interest Rates
Loans
Marketable Securities
Patent Royalties

RG Chapman PhD, "LINKS Positioning Strategy Simulation" 54
Exhibit 2: Volume Drivers in LINKS
Competitors’ Marketing
Programs
Exogenous Factors (Customers, Economy,
Regulatory Environment,
Technology, Etc.)
Volume
Perceived Price
“Availability”
Perception
Uncontrollables
“Service Quality”
Perception
“Product Quality”
Perception
Product Configuration
Failure Rate
R&D Spending
Marketing Program (Marketing Spending, Marketing
Mix Allocation, Positioning)
Service Outsourcing Program
Manufacturer Price
Price Volatility (Over Time)
Channel Markup

RG Chapman PhD, "LINKS Positioning Strategy Simulation" 55
"Research Studies" reflects the total costs associated with last quarter's research study
requests. The current quarter's research studies are executed after the current quarter's
financial reports are prepared so research study billings are lagged a quarter.
"Taxes" represents the corporate taxes payable in the market region in which your firm has its
manufacturing plant. Your manufacturing plant is located in market region 1, which has a
corporate tax rate of 50%.
“Total Fixed Costs" is the sum of all fixed costs. "Total Fixed Costs" does not sum correctly
down and across since some fixed costs aren’t allocated to specific products.
On the "Balance Sheet":
"Cash" represents your cash balance.
Cash in excess of 10% of revenues is
automatically invested in short-term
"Marketable Securities" which earn 1.5%
per quarter in "Non-Operating Income" on
the "Corporate P&L Statement" in the
following quarter. If cash falls below 5%
of revenues, a loan is automatically
arranged to increase cash to 5% of
revenues. You pay interest of 3% per
quarter on "Loans" and this interest
payment is recorded as "Non-Operating
Income" (a negative value of "Non-
Operating Income") in the following
quarter's "Corporate P&L Statement."
"Corporate Capitalization" is the Ldollar-
value of the original capital invested by
your shareholders to start your firm.
"Dividends" are cash payments to shareholders. In any quarter in which "Net Income" is
positive, 30% of the "Net Income" is allocated to "Dividends."
"Plant Investment" represents the Ldollar-value of your firm's investment in a manufacturing
plant to produce set-top box products. The normal per-unit production charges that you pay
for producing set-top boxes includes a component to cover the maintenance and depreciation
of your plant. Thus, your "Plant Investment" value will also be the same through time.
The "Forecasting Accuracy Report" provides details of the forecasting
accuracy associated with each of your forecasts. In addition, the sales
history for all of your firm's products (product-unit sales by product,
channel, and region) for the last six quarters is displayed at the end of
this report.
The "Set-Top Box Industry Bulletin" provides current-quarter industry-
related information. Information reported in the "Bulletin" includes things
that an actual manager in the set-top box industry could easily observe
without additional cost or with nominal effort during the course of events that comprise a normal
quarter's work.
FAQ
"Are costs expensed at the beginning of the
quarter or the end of the quarter? The answer
influences our spending decisions, since we
obviously don't want to spend money before we
have it." Assume that all revenues and costs
happen uniformly throughout the quarter. That
is, with a 90-day quarter, about 1/90 of the
quarter's revenues and costs are attributable to
each day's operations. Thus, you do have
revenue coming in regularly throughout the
quarter to pay for your various within-quarter
operating costs. There's no need to worry about
within-quarter cash flow issues with regard to
covering your operating costs and within-quarter
spending. Also, note that you do have access to
loans, as necessary, to cover shortages in cash.

RG Chapman PhD, "LINKS Positioning Strategy Simulation" 56
The following pages provide samples of the standard LINKS financial
and operating reports. In addition to these reports, you'll receive the
results of any research studies that you order on additional pages after
the last page of your financial and operating reports.
These samples are provided to familiarize you with the style and format of the reports that are
provided to your firm after each LINKS round. The data reported in these sample reports are only
illustrative of reports formatting. These data aren’t specific to your particular LINKS industry.
Please do not interpret these samples as suggested guidelines or benchmarks for good decisions
and performance within LINKS.
If you’d like some further background on interpreting LINKS financial statements, please access
Tutorial #1 (“P&L Statements”) on the LINKS website and spend 45 minutes or so working
through it prior to (or close to) the beginning of your LINKS event.

RG Chapman PhD, "LINKS Positioning Strategy Simulation" 57
***************************************************************************** FIRM 7: ?????????????????????????????????????????????????? INDUSTRY USC PERFORMANCE EVALUATION REPORT, QUARTER 7 PAGE 1
*****************************************************************************
For Your Information
You receive the LINKS scorecard (shown above) automatically each quarter as the first page
of your financial and operating reports. This scorecard provides comparatives to assess
how your firm's data compares to the industry averages and industry bests on every Key
Performance Indicator (KPI).
Historical plots of all KPIs are provided in your firm’s supplementary results Excel
spreadsheet (“KPIcharts” worksheet), accessible within the LINKS Simulation Database on
the LINKS website. Data from the past six quarters are displayed, to the extent available in
your industry's historical archives, to create quarter-by-quarter plots for each of the LINKS
performance evaluation metrics (KPIs) compared to the relevant quarter-specific industry
best, industry average, and industry worst for your LINKS industry.
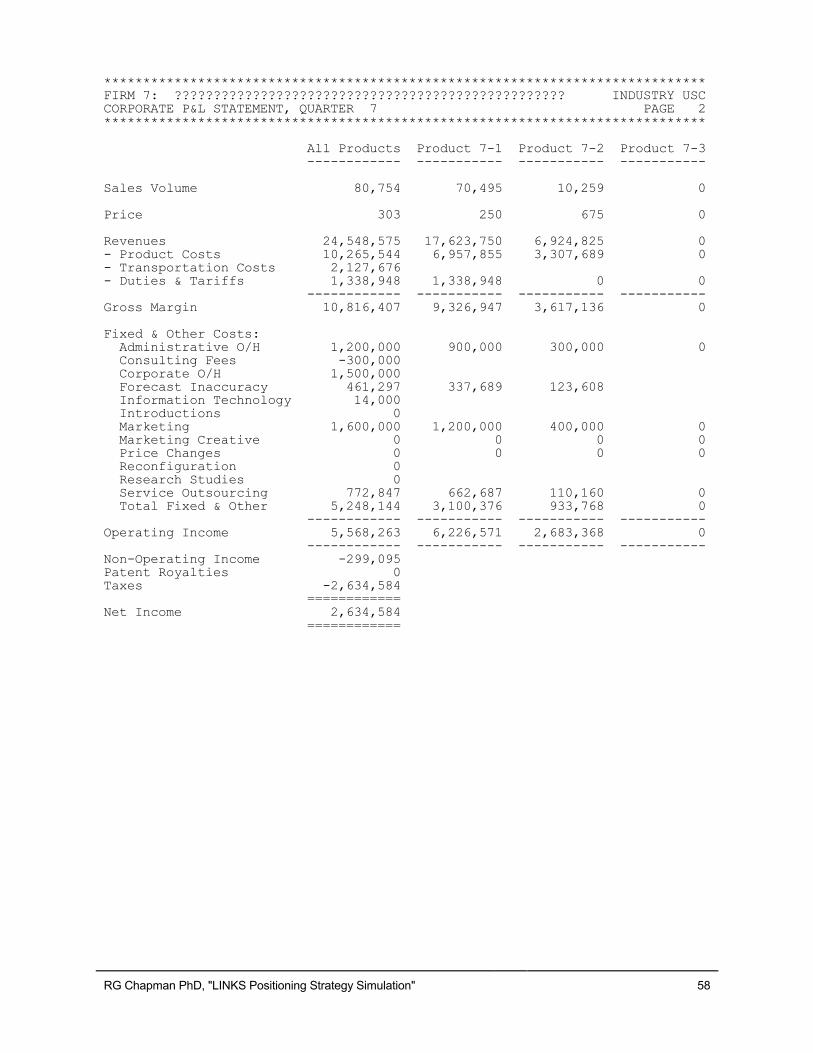
RG Chapman PhD, "LINKS Positioning Strategy Simulation" 58
***************************************************************************** FIRM 7: ?????????????????????????????????????????????????? INDUSTRY USC CORPORATE P&L STATEMENT, QUARTER 7 PAGE 2
***************************************************************************** All Products Product 7-1 Product 7-2 Product 7-3 ------------ ----------- ----------- ----------- Sales Volume 80,754 70,495 10,259 0 Price 303 250 675 0 Revenues 24,548,575 17,623,750 6,924,825 0 - Product Costs 10,265,544 6,957,855 3,307,689 0 - Transportation Costs 2,127,676 - Duties & Tariffs 1,338,948 1,338,948 0 0 ------------ ----------- ----------- ----------- Gross Margin 10,816,407 9,326,947 3,617,136 0 Fixed & Other Costs:
Administrative O/H 1,200,000 900,000 300,000 0 Consulting Fees -300,000 Corporate O/H 1,500,000 Forecast Inaccuracy 461,297 337,689 123,608 Information Technology 14,000 Introductions 0 Marketing 1,600,000 1,200,000 400,000 0 Marketing Creative 0 0 0 0 Price Changes 0 0 0 0 Reconfiguration 0 Research Studies 0 Service Outsourcing 772,847 662,687 110,160 0 Total Fixed & Other 5,248,144 3,100,376 933,768 0 ------------ ----------- ----------- ----------- Operating Income 5,568,263 6,226,571 2,683,368 0 ------------ ----------- ----------- ----------- Non-Operating Income -299,095
Patent Royalties 0 Taxes -2,634,584 ============ Net Income 2,634,584 ============

RG Chapman PhD, "LINKS Positioning Strategy Simulation" 59
***************************************************************************** FIRM 7: ?????????????????????????????????????????????????? INDUSTRY USC HISTORICAL CORPORATE P&L STATEMENT, QUARTER 7 PAGE 3
***************************************************************************** Previous (Quarter 6) Current (Quarter 7) --------------------- --------------------- Sales Volume 64,831 80,754 Price 309 303 Revenues 20,091,400 100.0% 24,548,575 100.0% - Product Costs 8,544,308 42.5% 10,245,544 41.8% - Transportation Costs 1,427,910 7.1% 2,127,676 8.7% - Duties & Tariffs 684,488 3.4% 1,338,948 5.5% ------------ ------ ------------ ------ Gross Margin 9,434,694 47.0% 10,816,407 44.1% Fixed & Other Costs:
Administrative O/H 1,200,000 6.0% 1,200,000 4.9% Consulting Fees -300,000 -1.5% -300,000 -1.2% Corporate O/H 1,500,000 7.5% 1,500,000 6.1% Forecast Inaccuracy 776,252 3.9% 461,297 1.9% Information Technology 14,000 0.1% 14,000 0.1% Introductions 0 0.0% 0 0.0% Marketing 1,600,000 8.0% 1,600,000 6.5% Marketing Creative 0 0.0% 0 0.0% Price Changes 0 0.0% 0 0.0% Reconfiguration 0 0.0% 0 0.0% Research Studies 0 0.0% 0 0.0% Service Outsourcing 760,837 3.8% 772,847 3.1% Total Fixed & Other 5,551,089 27.6% 5,248,144 21.4% ------------ ------ ------------ ------ Operating Income 3,883,605 19.3% 5,568,263 22.7% ------------ ------ ------------ ------ Non-Operating Income -353,176 -1.8% -299,095 -1.2%
Patent Royalties 0 0.0% 0 0.0% Taxes -1,765,214 -8.8% -2,634,584 -10.7% ============ ====== ============ ====== Net Income 1,765,215 8.8% 2,634,584 10.7% ============ ====== ============ ======

RG Chapman PhD, "LINKS Positioning Strategy Simulation" 60
***************************************************************************** FIRM 7: ?????????????????????????????????????????????????? INDUSTRY USC PRODUCT 7-1 P&L STATEMENT, QUARTER 7 PAGE 4
***************************************************************************** All Regions Region 1 Region 2 Region 3 (TOTAL ) ( U.S.A.) ( Europe) ( Pacific) ------------ ------------ ------------ ------------ Active? Yes Yes Yes Sales Volume 70,495 21,456 13,222 35,817 Price 250 250 250 250 Revenues 17,623,750 5,364,000 3,305,500 8,954,250 - Product Costs 6,957,855 2,117,707 1,305,011 3,535,137 - Duties & Tariffs 1,338,948 0 264,439 1,074,509 ------------ ------------ ------------ ------------ Gross Margin 9,326,947 3,246,293 1,736,050 4,344,604
Fixed Costs: Administrative O/H 900,000 300,000 300,000 300,000 Forecast Inaccuracy 337,689 175,517 148,570 13,602 Marketing 1,200,000 400,000 400,000 400,000 Marketing Creative 0 0 0 0 Price Changes 0 0 0 0 Service Outsourcing 662,687 200,880 137,028 324,779 Total Fixed Costs 3,100,376 1,076,397 985,598 1,038,381 ------------ ------------ ------------ ------------ Operating Income 6,226,571 2,169,896 750,452 3,306,223 ============================================================================= Sales Volume Forecast 34,009 19,770 34,193 CSR Service Outsourcing 2 Standard 2 Standard 2 Standard
Marketing Mix Allocation 403030 403030 403030 Marketing Positioning 75 75 75 Product 7-1 Configuration: H111010
For Your Information
The standard LINKS quarterly reports include separate product P&L statements for each of
your products. Only the report for product 1 is included in this sample display.

RG Chapman PhD, "LINKS Positioning Strategy Simulation" 61
***************************************************************************** FIRM 2: ?????????????????????????????????????????????????? INDUSTRY DEF BALANCE SHEET, QUARTER 7 PAGE 7
***************************************************************************** ASSETS ------ Cash 1,227,428 Marketable Securities 0 Finished Goods Inventory 0 Plant Investment 100,000,000 Total Assets 101,227,428 LIABILITIES AND EQUITIES ------------------------ Corporate Capitalization 80,000,000 Dividends, Current Quarter -790,375 Dividends, Cumulative Prior To This Quarter -4,771,463 Loans 8,249,800 Retained Earnings, Current Quarter 2,634,584
Retained Earnings, Cumulative Prior To This Quarter 15,904,882 Total Liabilities and Equities 101,227,428 *****************************************************************************
FIRM 7: Set-Top Box Unlimited INDUSTRY ABC PRODUCT COST REPORT, QUARTER 17 PAGE 8 ***************************************************************************** ORIGINAL (PLANT) Product Product Product MANUFACTURING COST 4-1 4-2 4-3 ------------------ ------- ------- ------- Alpha 3.00 9.00 3.00 Beta 4.00 28.00 4.00 Bandwidth 10.50 118.00 10.50 Warranty 0.00 0.00 0.00 Packaging 10.00 14.00 10.00 Memory Capacity 0.00 0.00 0.00 Gamma 17.00 17.00 17.00 Epsilon 24.00 24.00 24.00 Labor Cost 30.00 30.00 30.00 Production Cost 20.00 20.00 20.00 ------- ------- -------
118.50 260.00 118.50

RG Chapman PhD, "LINKS Positioning Strategy Simulation" 62
***************************************************************************** FIRM 1: ?????????????????????????????????????????????????? INDUSTRY STU TRANSPORTATION COST REPORT, QUARTER 27 PAGE 9
***************************************************************************** ============ Surface Air Emergency SUB-ASSEMBLY ------------- ------------- ------------- COMPONENTS Cost Volume Cost Volume Cost Volume Total Cost ============ ----- ------- ----- ------- ----- ------- ---------- Plant/DC1: Gamma 4.00 0 4.00 0 4.00 112,457 449,828 Epsilon 6.00 0 6.00 0 6.00 112,230 673,380 CUSTOMER SHIPMENTS Region 1 ( 43,827 units @ $ 4.00/unit) 175,308 Region 2 ( 26,586 units @ $18.00/unit) 478,548 Region 3 ( 39,295 units @ $26.00/unit) 1,021,670 TOTAL TRANSPORTATION COSTS 2,798,734
***************************************************************************** FIRM 7: ?????????????????????????????????????????????????? INDUSTRY USC SERVICE CENTER OPERATIONS REPORT, QUARTER 7 PAGE 10 ***************************************************************************** All Region Region Region Regions 1 2 3 ------- ------- ------- -------
PRODUCT 7-1 Calls 56,490 20,088 11,419 24,983 CSR Cost/Call 11.73 10.00 12.00 13.00 PRODUCT 7-2 Calls 11,016 11,016 0 0 CSR Cost/Call 10.00 10.00 0.00 0.00 PRODUCT 7-3 Calls 0 0 0 0 CSR Cost/Call 0.00 0.00 0.00 0.00

RG Chapman PhD, "LINKS Positioning Strategy Simulation" 63
***************************************************************************** FIRM 7: ?????????????????????????????????????????????????? INDUSTRY USC FORECASTING ACCURACY REPORT, QUARTER 7 PAGE 11
***************************************************************************** Region Forecast Actual Accuracy ------ ---------- ---------- -------- Product 7-1 1 34,009 21,456 41.5% Product 7-1 2 19,770 13,222 50.5% Product 7-1 3 34,193 35,817 95.5% Product 7-2 1 14,486 10,259 58.8% SUMMARY: For 4 forecasts, average forecasting accuracy is 61.6% Note: Forecasts count within the calculation of forecasting accuracy only if the "actual" value being forecast is greater than 100 for sales volumes (to not penalize you for "small" forecasts). Otherwise, the relevant values of "forecast" and "actual" are only reported for reference purposes, but such forecasts are not counted for forecasting accuracy scoring. This is the
reason why the number of forecasts referenced in "SUMMARY" may be less than the detailed line-by-line reporting of forecasts. ------------- Quarter Quarter Quarter Quarter Quarter Quarter SALES HISTORY 2 3 4 5 6 7 ------------- -------- -------- -------- -------- -------- -------- REGION 1 Product 7-1H 39,666 29,431 36,653 32,806 29,298 21,456 Product 7-2H 8,494 12,109 6,716 7,801 9,138 10,259 REGION 2 Product 7-1H 18,599 13,503 11,906 23,409 10,736 13,222 REGION 3 Product 7-1H 26,776 38,181 22,727 37,882 15,659 35,817

RG Chapman PhD, "LINKS Positioning Strategy Simulation" 64
***************************************************************************** FIRM 7: ?????????????????????????????????????????????????? INDUSTRY USC SET-TOP BOX INDUSTRY BULLETIN, QUARTER 7 PAGE 12
***************************************************************************** Welcome to the quarter 7 issue of the Set-Top Box Industry Bulletin. Notable set-top box industry developments are highlighted in the Bulletin. INDUSTRY NEWS HEADLINES Total industry USC profits were 20,358,166 this quarter. Firm 5 leads industry USC in market share (16.0%). Firm 3 has the second-highest market share in industry USC (15.2%). Total industry USC research study spending was 0 this quarter. PRODUCT LAUNCHES AND "UNLAUNCHES"
No products were introduced this quarter. No products were "unlaunched" (dropped) this quarter. RECONFIGURATIONS No products were reconfigured this quarter.

RG Chapman PhD, "LINKS Positioning Strategy Simulation" 65
Performance Evaluation "If you're riding ahead of the herd, take a look back every now
and then to make sure it's still there." – Cowboy philosophy
Profitability measures obviously matter in assessing the long-run performance of a business.
However, "other things" are leading indicators of future profitability and root causes of profitability.
As you’ll note from the details that follow, current performance and change in performance are
considered in the LINKS multi-dimensional performance evaluation scorecard.
The LINKS scorecard is perhaps described more aptly as a boardroom-level scorecard. It
focuses on top-line boardroom kinds of financial, operational, and customer performance
measures and sub-measures. The LINKS scorecard includes the measures and weights
described in Exhibits 3-5. Each firm in your set-top box industry submits their raw data to the Set-
Top Box Trade Association, which provides your firm's personal scorecard every quarter.
The LINKS scorecard is based on a ranking of performance on each sub-measure. These rank-
order comparisons across all competing firms within your industry avoid the undue influence of
particularly extreme values of individual sub-measures. This LINKS scorecard is a within-industry
performance evaluation system. Comparisons across industries are problematic due to variations
in environmental and competitive milieu.
Your firm receives weighted points for each competitor for whom your performance on a sub-
measure is better. For example, if your firm's ratio of "Net Profits" to "Revenues" is better than
three other firms' ratios, your firm receives 9 points. (Of course, the top-performing firm on "Net
Income" to "Revenues" ratio in a 6-firm industry would receive 15 points.) In general, the
maximum available points on any sub-measure are W*(N-1) where "W" is the sub-measure's
weight and "N" is the number of firms in the industry. Points accumulate each quarter throughout
the LINKS exercise.
To avoid an overemphasis on minor quarter-to-quarter variations in the calculation of the ranking
of firms on the performance sub-measures in the LINKS scorecard, minor differences in the sub-
measures are treated as ties in the calculation of ranking points. The thresholds for differences to
be treated as meaningful are listed in Exhibits 3-5 for each sub-measure. For example,
differences of 0.2% or less for "Ratio of Net Income to Revenues" are considered to be
statistically insignificant, and firms within 0.2% of each other would be treated as being tied.
Thus, two firms with ratios of Net Income to Revenues of 4.5% and 4.6% would be treated as
being tied in the calculation of ranking position and associated points received in any quarter.
You receive the LINKS scorecard automatically each quarter as the first page of your financial and
operating reports. This scorecard provides comparatives to assess how your firm's data
compares to the industry averages on every KPI. In addition, historical plots of past performance
are provided. Data from the past six quarters are used, to the extent available in your industry's
historical archives, to create quarter-by-quarter plots for each of the LINKS performance
evaluation metrics. For each metric and quarter, the range of values the range of values across
all firms in your LINKS industry is shown and your firm's position in these ranges is identified.

RG Chapman PhD, "LINKS Positioning Strategy Simulation" 66
Exhibit 3: Scorecard Financial Measures
Sub-Measures Weight Sub-Measure Details
Ratio of Net Income
to Revenues
3 Current profitability is the best overall signal of business
performance, hence its high weight. Firms are "tied" if their scores
are within 0.2% of each other.
Change in Ratio of
Net Income to
Revenues
1 Improvement in profitability is important but less important than
current profitability. Firms are "tied" if their scores are within 0.2%
of each other.
Exhibit 4: Scorecard Operational Measures
Sub-Measures Weight Sub-Measure Details
Forecasting
Accuracy
2 Forecasting accuracy is a relatively pure signal of management
skill and expertise (in this case, in the area of understanding
customers and customer demand generating forces). Firms are
"tied" if their scores are within 0.5% of each other.
Ratio of (Marketing
+ Service
Spending) to
Revenues
-1 Service spending is service outsourcing costs. Marketing spending
is an easy way to boost short-run sales volume without necessarily
contributing to long-run profitability. Relative to revenues,
spending less in marketing and service is desirable. Firms are
"tied" if their scores are within 0.2% of each other.
Exhibit 5: Scorecard Customer Measures
Sub-Measures Weight Sub-Measure Details
Change in Market
Share
1 Change in market share is an overall measure of customer
reaction to the firm's offerings. ("Market share" equals customer
purchases in all channels and regions.) Firms are "tied" if their
scores are within 0.1% of each other.
Customer
Satisfaction
1 Customer satisfaction is a clear measure of customer performance
and a long-run leading indicator of repeat purchasing behavior and
customer retention. Average customer satisfaction across all
products, channels, and regions is used here. Firms are "tied" if
their scores are within 0.5% of each other.
Notes: Positive "weights" are associated with sub-measures where "more is better" and negative "weights" are
associated with sub-measures where "less is better." "Change" measures are based on quarter-to-quarter changes.
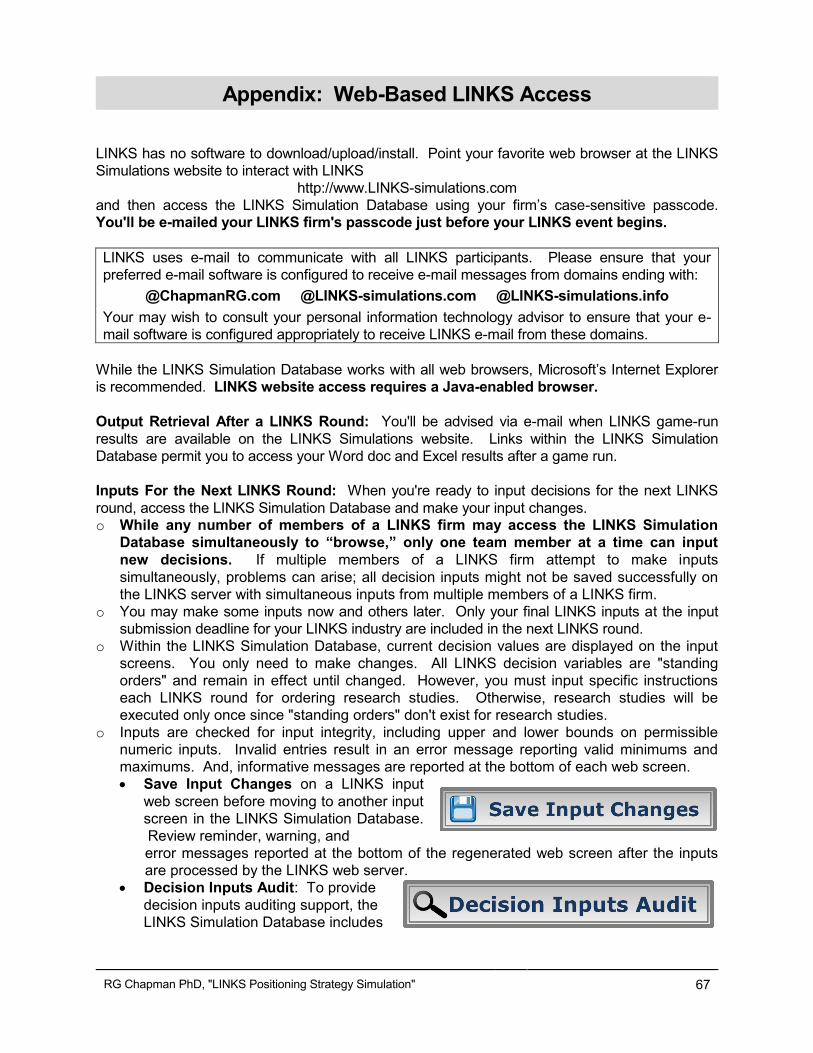
RG Chapman PhD, "LINKS Positioning Strategy Simulation" 67
Appendix: Web-Based LINKS Access
LINKS has no software to download/upload/install. Point your favorite web browser at the LINKS
Simulations website to interact with LINKS
http://www.LINKS-simulations.com
and then access the LINKS Simulation Database using your firm’s case-sensitive passcode. You'll be e-mailed your LINKS firm's passcode just before your LINKS event begins.
LINKS uses e-mail to communicate with all LINKS participants. Please ensure that your
preferred e-mail software is configured to receive e-mail messages from domains ending with:
@ChapmanRG.com @LINKS-simulations.com @LINKS-simulations.info
Your may wish to consult your personal information technology advisor to ensure that your e-
mail software is configured appropriately to receive LINKS e-mail from these domains.
While the LINKS Simulation Database works with all web browsers, Microsoft’s Internet Explorer
is recommended. LINKS website access requires a Java-enabled browser.
Output Retrieval After a LINKS Round: You'll be advised via e-mail when LINKS game-run
results are available on the LINKS Simulations website. Links within the LINKS Simulation
Database permit you to access your Word doc and Excel results after a game run.
Inputs For the Next LINKS Round: When you're ready to input decisions for the next LINKS
round, access the LINKS Simulation Database and make your input changes. o While any number of members of a LINKS firm may access the LINKS Simulation
Database simultaneously to “browse,” only one team member at a time can input
new decisions. If multiple members of a LINKS firm attempt to make inputs
simultaneously, problems can arise; all decision inputs might not be saved successfully on
the LINKS server with simultaneous inputs from multiple members of a LINKS firm.
o You may make some inputs now and others later. Only your final LINKS inputs at the input
submission deadline for your LINKS industry are included in the next LINKS round.
o Within the LINKS Simulation Database, current decision values are displayed on the input
screens. You only need to make changes. All LINKS decision variables are "standing
orders" and remain in effect until changed. However, you must input specific instructions
each LINKS round for ordering research studies. Otherwise, research studies will be
executed only once since "standing orders" don't exist for research studies.
o Inputs are checked for input integrity, including upper and lower bounds on permissible
numeric inputs. Invalid entries result in an error message reporting valid minimums and
maximums. And, informative messages are reported at the bottom of each web screen.
Save Input Changes on a LINKS input
web screen before moving to another input
screen in the LINKS Simulation Database.
Review reminder, warning, and
error messages reported at the bottom of the regenerated web screen after the inputs
are processed by the LINKS web server.
Decision Inputs Audit: To provide
decision inputs auditing support, the
LINKS Simulation Database includes
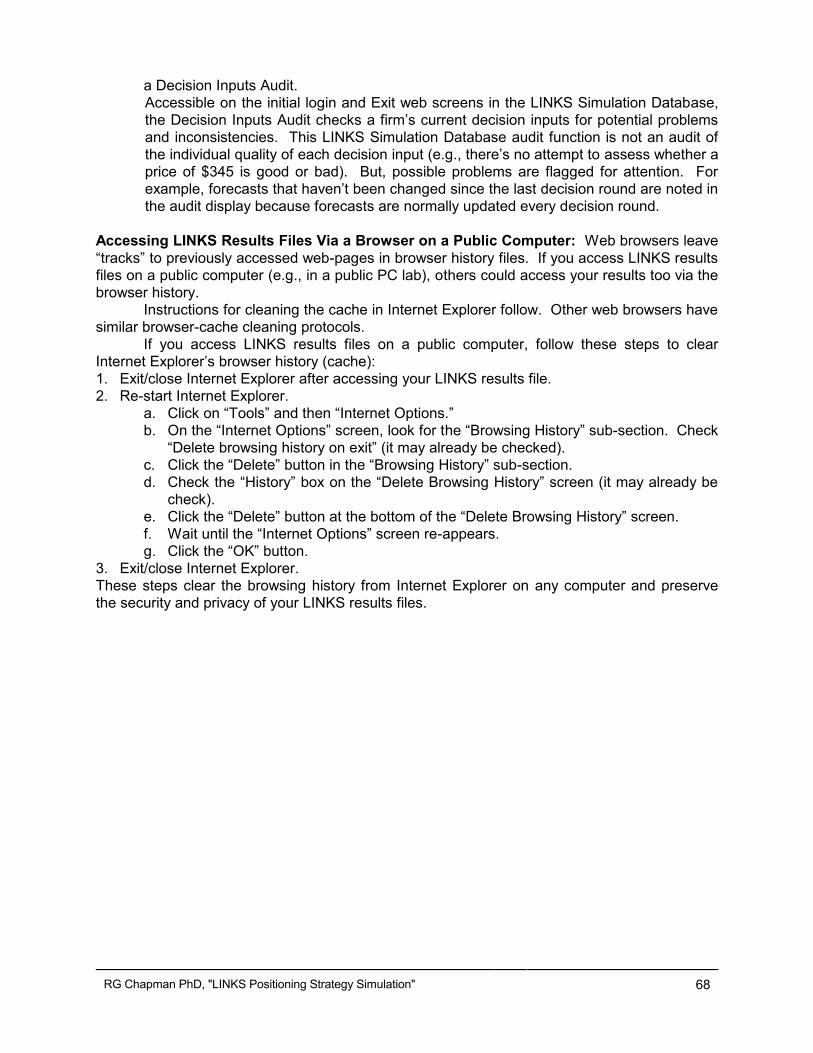
RG Chapman PhD, "LINKS Positioning Strategy Simulation" 68
a Decision Inputs Audit.
Accessible on the initial login and Exit web screens in the LINKS Simulation Database,
the Decision Inputs Audit checks a firm’s current decision inputs for potential problems
and inconsistencies. This LINKS Simulation Database audit function is not an audit of
the individual quality of each decision input (e.g., there’s no attempt to assess whether a
price of $345 is good or bad). But, possible problems are flagged for attention. For
example, forecasts that haven’t been changed since the last decision round are noted in
the audit display because forecasts are normally updated every decision round.
Accessing LINKS Results Files Via a Browser on a Public Computer: Web browsers leave
“tracks” to previously accessed web-pages in browser history files. If you access LINKS results
files on a public computer (e.g., in a public PC lab), others could access your results too via the
browser history.
Instructions for cleaning the cache in Internet Explorer follow. Other web browsers have
similar browser-cache cleaning protocols.
If you access LINKS results files on a public computer, follow these steps to clear
Internet Explorer’s browser history (cache):
1. Exit/close Internet Explorer after accessing your LINKS results file.
2. Re-start Internet Explorer.
a. Click on “Tools” and then “Internet Options.”
b. On the “Internet Options” screen, look for the “Browsing History” sub-section. Check
“Delete browsing history on exit” (it may already be checked).
c. Click the “Delete” button in the “Browsing History” sub-section.
d. Check the “History” box on the “Delete Browsing History” screen (it may already be
check).
e. Click the “Delete” button at the bottom of the “Delete Browsing History” screen.
f. Wait until the “Internet Options” screen re-appears.
g. Click the “OK” button.
3. Exit/close Internet Explorer.
These steps clear the browsing history from Internet Explorer on any computer and preserve
the security and privacy of your LINKS results files.