linux kernel debugging - univerzita karlova · linux kernel debugging. advanced operating systems...
TRANSCRIPT

http://d3s.mff.cuni.czAdvanced Operating Systems 2018/2019
CHARLES UNIVERSITY IN PRAGUE
faculty of mathematics and physicsfaculty of mathematics and physics
Vlastimil Babka
Linux Kernel DebuggingLinux Kernel Debugging
Advanced Operating Systems 2018/2019 2Debugging
Agenda – Debugging ScenariosAgenda – Debugging Scenarios
Debugging during individual kernel development
Debug prints – printk() facilitiy
Debugger (gdb) support
Debugging production kernels
Post-mortem analysis: interpreting kernel oops/panic output, creating and analyzing kernel crash dumps
Kernel observability – dynamic debug, tracing (previous lecture), alt-sysrq dumps, live crash session
Finding (latent) bugs during collaborative development
Optional runtime checks configurable during build
Testing and fuzzing
Static analysis
Advanced Operating Systems 2018/2019 3Debugging
Kernel oops/panic/warningKernel oops/panic/warning
Printed in console (dmesg) typically on fatal CPU exceptionsLots of mostly architecture-specific information
May be enough to find the root cause of a bug without a core dump
Oops leaves the system runningKills just the current process (which however includes kernel threads!)
System can still be left in an inconsistent state (locks remain locked…)
Warning doesn’t kill anything, just taints the kernel with W
Panic kills the system completelyOops in interrupt context, or with panic_on_oops enabled, manual panic() calls
HW failure, critical memory allocation failure, init or idle task killed
May trigger crash dump if configured, or reboot after delay
Advanced Operating Systems 2018/2019 4Debugging
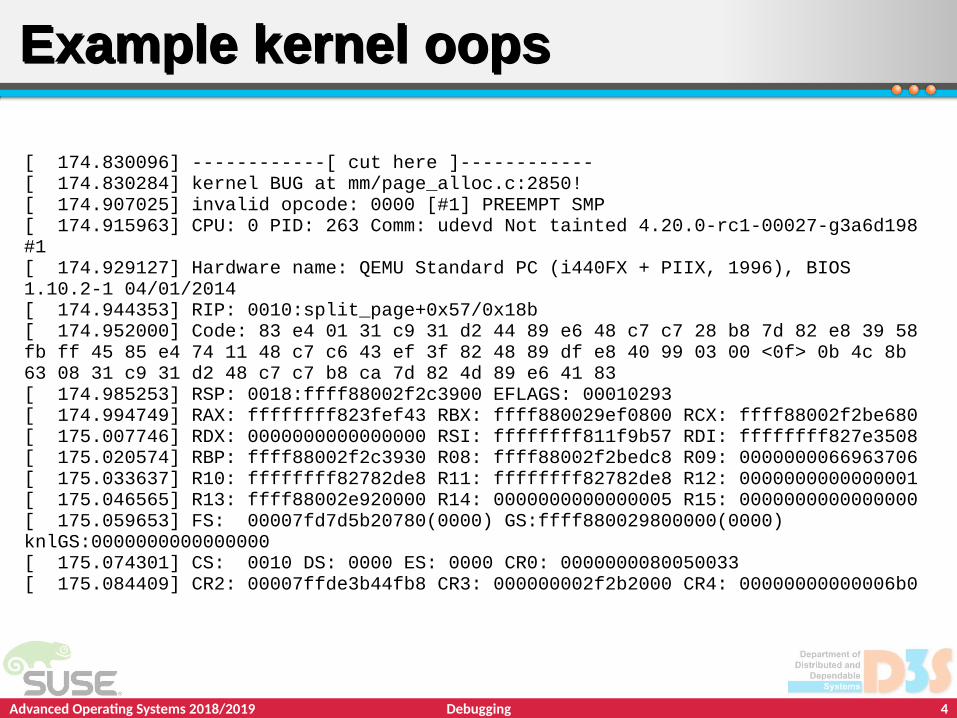
[ 174.830096] ------------[ cut here ]------------[ 174.830284] kernel BUG at mm/page_alloc.c:2850![ 174.907025] invalid opcode: 0000 [#1] PREEMPT SMP[ 174.915963] CPU: 0 PID: 263 Comm: udevd Not tainted 4.20.0-rc1-00027-g3a6d198 #1[ 174.929127] Hardware name: QEMU Standard PC (i440FX + PIIX, 1996), BIOS 1.10.2-1 04/01/2014[ 174.944353] RIP: 0010:split_page+0x57/0x18b[ 174.952000] Code: 83 e4 01 31 c9 31 d2 44 89 e6 48 c7 c7 28 b8 7d 82 e8 39 58 fb ff 45 85 e4 74 11 48 c7 c6 43 ef 3f 82 48 89 df e8 40 99 03 00 <0f> 0b 4c 8b 63 08 31 c9 31 d2 48 c7 c7 b8 ca 7d 82 4d 89 e6 41 83[ 174.985253] RSP: 0018:ffff88002f2c3900 EFLAGS: 00010293[ 174.994749] RAX: ffffffff823fef43 RBX: ffff880029ef0800 RCX: ffff88002f2be680[ 175.007746] RDX: 0000000000000000 RSI: ffffffff811f9b57 RDI: ffffffff827e3508[ 175.020574] RBP: ffff88002f2c3930 R08: ffff88002f2bedc8 R09: 0000000066963706[ 175.033637] R10: ffffffff82782de8 R11: ffffffff82782de8 R12: 0000000000000001[ 175.046565] R13: ffff88002e920000 R14: 0000000000000005 R15: 0000000000000000[ 175.059653] FS: 00007fd7d5b20780(0000) GS:ffff880029800000(0000) knlGS:0000000000000000[ 175.074301] CS: 0010 DS: 0000 ES: 0000 CR0: 0000000080050033[ 175.084409] CR2: 00007ffde3b44fb8 CR3: 000000002f2b2000 CR4: 00000000000006b0
Example kernel oopsExample kernel oops
Advanced Operating Systems 2018/2019 5Debugging
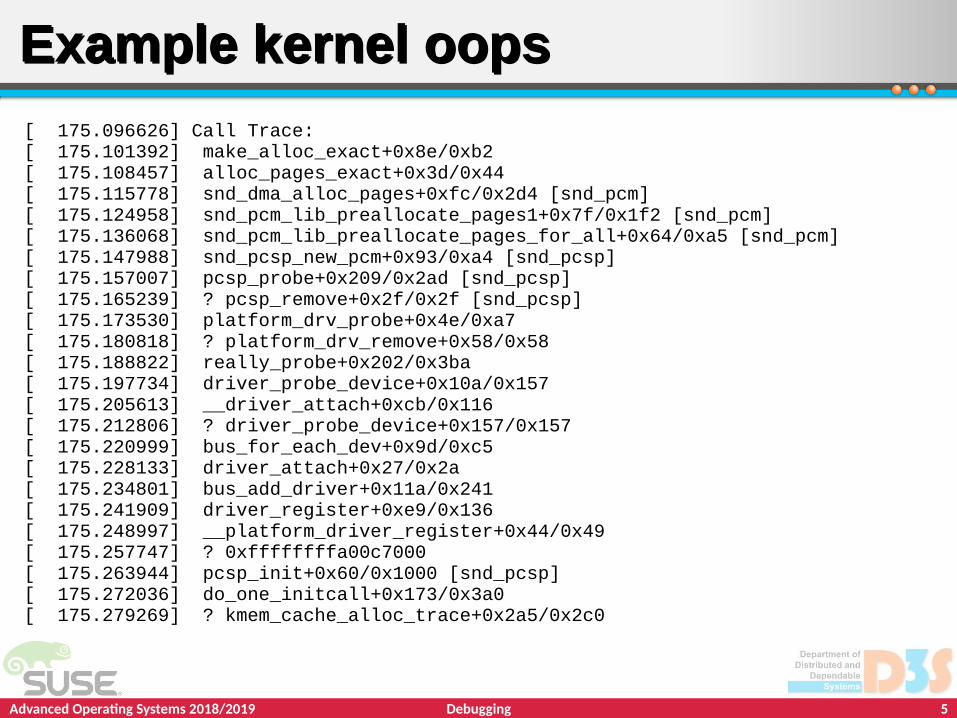
[ 175.096626] Call Trace:[ 175.101392] make_alloc_exact+0x8e/0xb2[ 175.108457] alloc_pages_exact+0x3d/0x44[ 175.115778] snd_dma_alloc_pages+0xfc/0x2d4 [snd_pcm][ 175.124958] snd_pcm_lib_preallocate_pages1+0x7f/0x1f2 [snd_pcm][ 175.136068] snd_pcm_lib_preallocate_pages_for_all+0x64/0xa5 [snd_pcm][ 175.147988] snd_pcsp_new_pcm+0x93/0xa4 [snd_pcsp][ 175.157007] pcsp_probe+0x209/0x2ad [snd_pcsp][ 175.165239] ? pcsp_remove+0x2f/0x2f [snd_pcsp][ 175.173530] platform_drv_probe+0x4e/0xa7[ 175.180818] ? platform_drv_remove+0x58/0x58[ 175.188822] really_probe+0x202/0x3ba[ 175.197734] driver_probe_device+0x10a/0x157[ 175.205613] __driver_attach+0xcb/0x116[ 175.212806] ? driver_probe_device+0x157/0x157[ 175.220999] bus_for_each_dev+0x9d/0xc5[ 175.228133] driver_attach+0x27/0x2a[ 175.234801] bus_add_driver+0x11a/0x241[ 175.241909] driver_register+0xe9/0x136[ 175.248997] __platform_driver_register+0x44/0x49[ 175.257747] ? 0xffffffffa00c7000[ 175.263944] pcsp_init+0x60/0x1000 [snd_pcsp][ 175.272036] do_one_initcall+0x173/0x3a0[ 175.279269] ? kmem_cache_alloc_trace+0x2a5/0x2c0
Example kernel oopsExample kernel oops

Advanced Operating Systems 2018/2019 6Debugging
[ 175.287789] ? do_init_module+0x27/0x1ff[ 175.295143] do_init_module+0x5f/0x1ff[ 175.302240] load_module+0x1dad/0x23e9[ 175.309116] ? kernel_read_file+0x260/0x272[ 175.317219] __se_sys_finit_module+0x97/0xa7[ 175.325160] ? __se_sys_finit_module+0x97/0xa7[ 175.333382] __x64_sys_finit_module+0x1b/0x1e[ 175.341454] do_syscall_64+0x39c/0x4df[ 175.348394] entry_SYSCALL_64_after_hwframe+0x49/0xbe[ 175.357783] RIP: 0033:0x7fd7d51f54a9[ 175.364266] Code: 00 c3 66 2e 0f 1f 84 00 00 00 00 00 0f 1f 44 00 00 48 89 f8 48 89 f7 48 89 d6 48 89 ca 4d 89 c2 4d 89 c8 4c 8b 4c 24 08 0f 05 <48> 3d 01 f0 ff ff 73 01 c3 48 8b 0d bf 79 2b 00 f7 d8 64 89 01 48[ 175.398068] RSP: 002b:00007ffde3b4d318 EFLAGS: 00000246 ORIG_RAX: 0000000000000139[ 175.411608] RAX: ffffffffffffffda RBX: 0000000000a91190 RCX: 00007fd7d51f54a9[ 175.424442] RDX: 0000000000000000 RSI: 00007fd7d54c10aa RDI: 000000000000000d[ 175.437048] RBP: 00007fd7d54c10aa R08: 0000000000000000 R09: 0000000000a91190[ 175.449913] R10: 000000000000000d R11: 0000000000000246 R12: 0000000000000000[ 175.462625] R13: 0000000000020000 R14: 0000000000000000 R15: 0000000000a91190[ 175.475555] Modules linked in: drm_panel_orientation_quirks snd_pcsp(+) snd_pcm agpgart cfbfillrect snd_timer cfbimgblt cfbcopyarea snd fb_sys_fops syscopyarea sysfillrect soundcore sysimgblt serio_raw fb fbdev i2c_piix4 evbug[ 175.573671] ---[ end trace 3dad41c41965c82c ]---
Source: https://lore.kernel.org/lkml/20181126002805.GI18977@shao2-debian/
Example kernel oopsExample kernel oops
Advanced Operating Systems 2018/2019 7Debugging
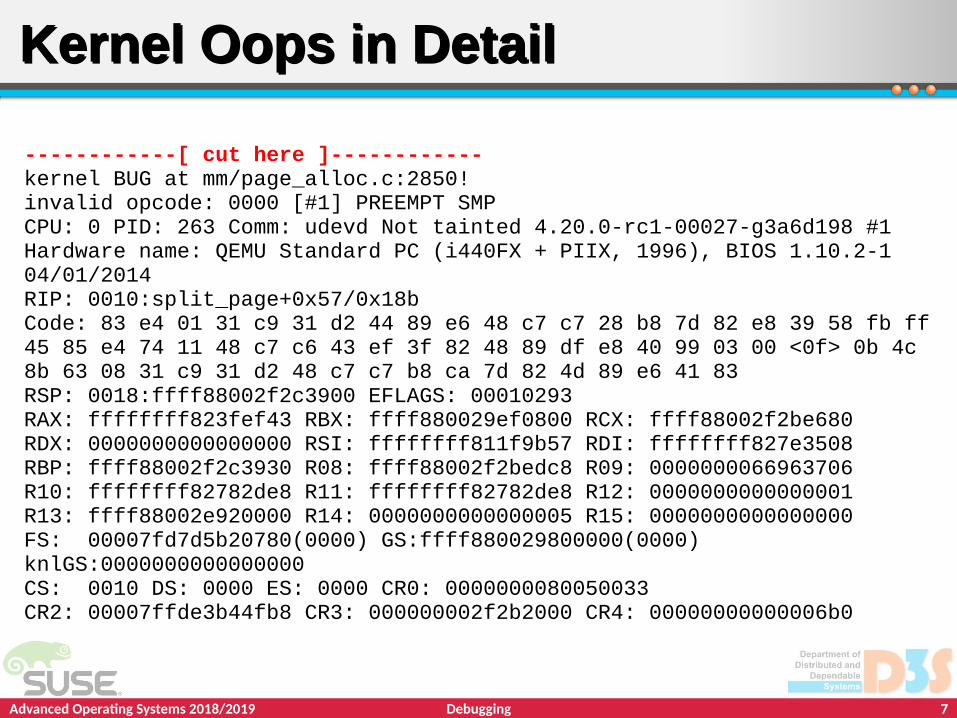
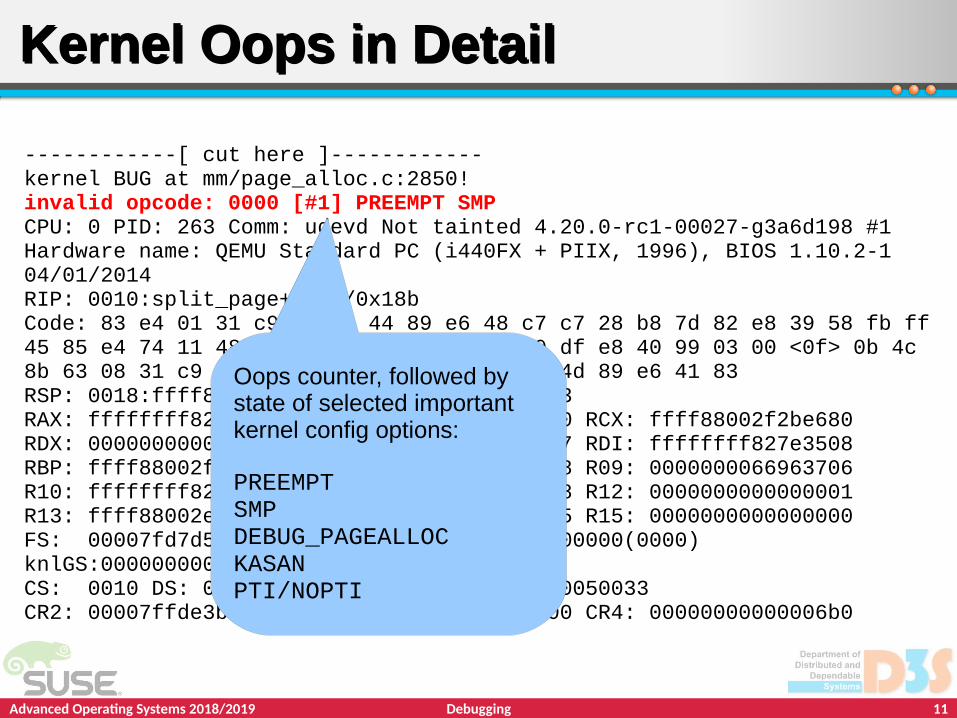
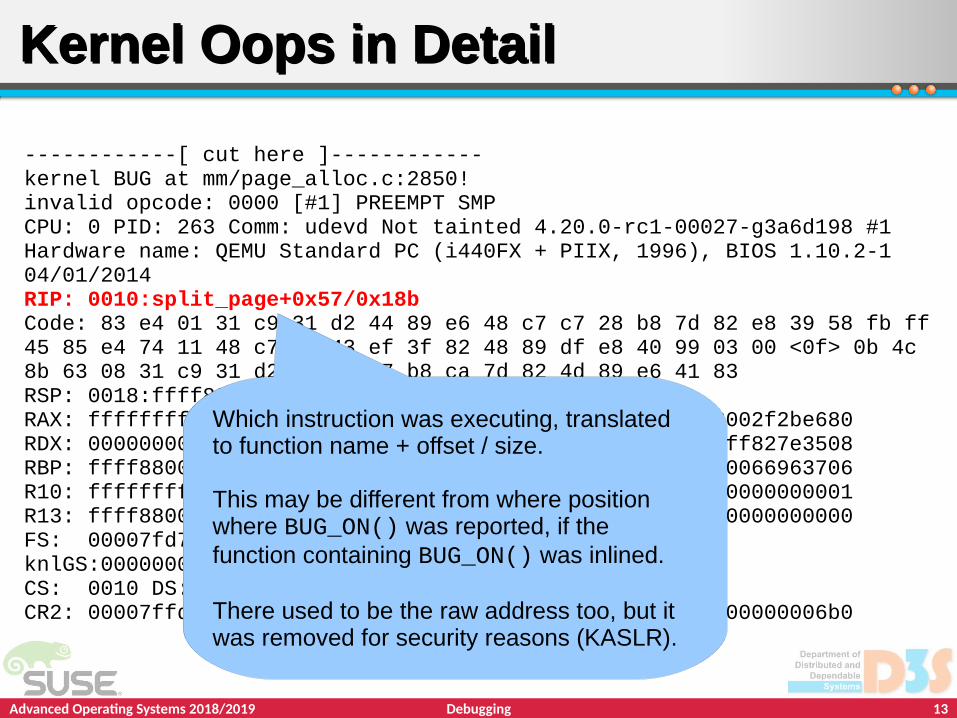
------------[ cut here ]------------kernel BUG at mm/page_alloc.c:2850!invalid opcode: 0000 [#1] PREEMPT SMPCPU: 0 PID: 263 Comm: udevd Not tainted 4.20.0-rc1-00027-g3a6d198 #1Hardware name: QEMU Standard PC (i440FX + PIIX, 1996), BIOS 1.10.2-1 04/01/2014RIP: 0010:split_page+0x57/0x18bCode: 83 e4 01 31 c9 31 d2 44 89 e6 48 c7 c7 28 b8 7d 82 e8 39 58 fb ff 45 85 e4 74 11 48 c7 c6 43 ef 3f 82 48 89 df e8 40 99 03 00 <0f> 0b 4c 8b 63 08 31 c9 31 d2 48 c7 c7 b8 ca 7d 82 4d 89 e6 41 83RSP: 0018:ffff88002f2c3900 EFLAGS: 00010293RAX: ffffffff823fef43 RBX: ffff880029ef0800 RCX: ffff88002f2be680RDX: 0000000000000000 RSI: ffffffff811f9b57 RDI: ffffffff827e3508RBP: ffff88002f2c3930 R08: ffff88002f2bedc8 R09: 0000000066963706R10: ffffffff82782de8 R11: ffffffff82782de8 R12: 0000000000000001R13: ffff88002e920000 R14: 0000000000000005 R15: 0000000000000000FS: 00007fd7d5b20780(0000) GS:ffff880029800000(0000) knlGS:0000000000000000CS: 0010 DS: 0000 ES: 0000 CR0: 0000000080050033CR2: 00007ffde3b44fb8 CR3: 000000002f2b2000 CR4: 00000000000006b0
Kernel Oops in DetailKernel Oops in Detail
Advanced Operating Systems 2018/2019 8Debugging
------------[ cut here ]------------kernel BUG at mm/page_alloc.c:2850!invalid opcode: 0000 [#1] PREEMPT SMPCPU: 0 PID: 263 Comm: udevd Not tainted 4.20.0-rc1-00027-g3a6d198 #1Hardware name: QEMU Standard PC (i440FX + PIIX, 1996), BIOS 1.10.2-1 04/01/2014RIP: 0010:split_page+0x57/0x18bCode: 83 e4 01 31 c9 31 d2 44 89 e6 48 c7 c7 28 b8 7d 82 e8 39 58 fb ff 45 85 e4 74 11 48 c7 c6 43 ef 3f 82 48 89 df e8 40 99 03 00 <0f> 0b 4c 8b 63 08 31 c9 31 d2 48 c7 c7 b8 ca 7d 82 4d 89 e6 41 83RSP: 0018:ffff88002f2c3900 EFLAGS: 00010293RAX: ffffffff823fef43 RBX: ffff880029ef0800 RCX: ffff88002f2be680RDX: 0000000000000000 RSI: ffffffff811f9b57 RDI: ffffffff827e3508RBP: ffff88002f2c3930 R08: ffff88002f2bedc8 R09: 0000000066963706R10: ffffffff82782de8 R11: ffffffff82782de8 R12: 0000000000000001R13: ffff88002e920000 R14: 0000000000000005 R15: 0000000000000000FS: 00007fd7d5b20780(0000) GS:ffff880029800000(0000) knlGS:0000000000000000CS: 0010 DS: 0000 ES: 0000 CR0: 0000000080050033CR2: 00007ffde3b44fb8 CR3: 000000002f2b2000 CR4: 00000000000006b0
Kernel Oops in DetailKernel Oops in Detail
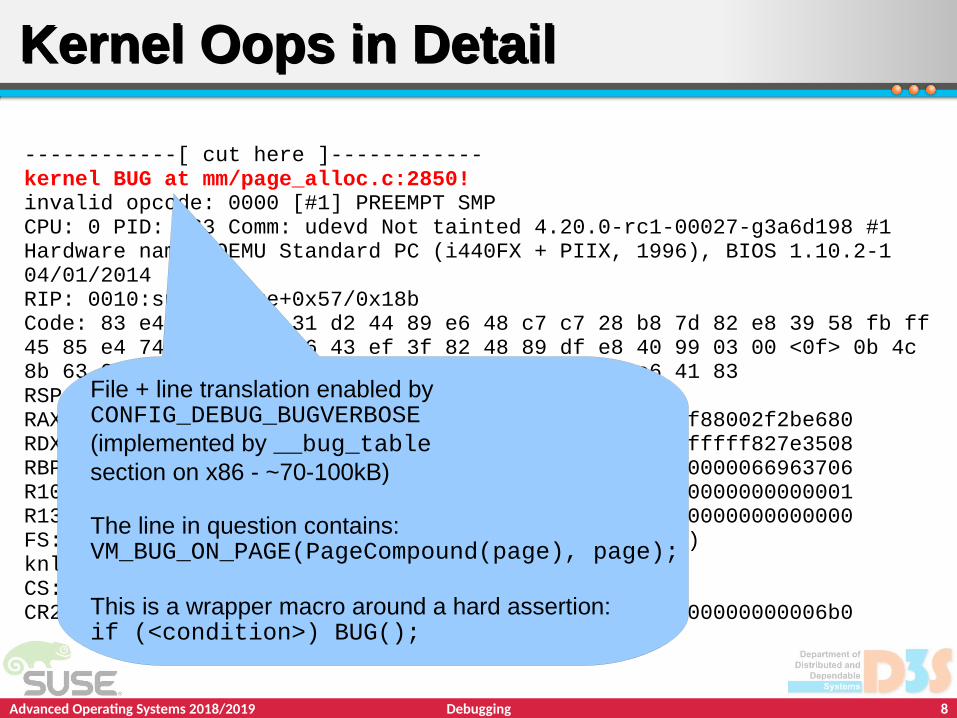
File + line translation enabled byCONFIG_DEBUG_BUGVERBOSE(implemented by __bug_tablesection on x86 - ~70-100kB)
The line in question contains:VM_BUG_ON_PAGE(PageCompound(page), page);
This is a wrapper macro around a hard assertion:if (<condition>) BUG();
Advanced Operating Systems 2018/2019 9Debugging
------------[ cut here ]------------kernel BUG at mm/page_alloc.c:2850!invalid opcode: 0000 [#1] PREEMPT SMPCPU: 0 PID: 263 Comm: udevd Not tainted 4.20.0-rc1-00027-g3a6d198 #1Hardware name: QEMU Standard PC (i440FX + PIIX, 1996), BIOS 1.10.2-1 04/01/2014RIP: 0010:split_page+0x57/0x18bCode: 83 e4 01 31 c9 31 d2 44 89 e6 48 c7 c7 28 b8 7d 82 e8 39 58 fb ff 45 85 e4 74 11 48 c7 c6 43 ef 3f 82 48 89 df e8 40 99 03 00 <0f> 0b 4c 8b 63 08 31 c9 31 d2 48 c7 c7 b8 ca 7d 82 4d 89 e6 41 83RSP: 0018:ffff88002f2c3900 EFLAGS: 00010293RAX: ffffffff823fef43 RBX: ffff880029ef0800 RCX: ffff88002f2be680RDX: 0000000000000000 RSI: ffffffff811f9b57 RDI: ffffffff827e3508RBP: ffff88002f2c3930 R08: ffff88002f2bedc8 R09: 0000000066963706R10: ffffffff82782de8 R11: ffffffff82782de8 R12: 0000000000000001R13: ffff88002e920000 R14: 0000000000000005 R15: 0000000000000000FS: 00007fd7d5b20780(0000) GS:ffff880029800000(0000) knlGS:0000000000000000CS: 0010 DS: 0000 ES: 0000 CR0: 0000000080050033CR2: 00007ffde3b44fb8 CR3: 000000002f2b2000 CR4: 00000000000006b0
Kernel Oops in DetailKernel Oops in Detail
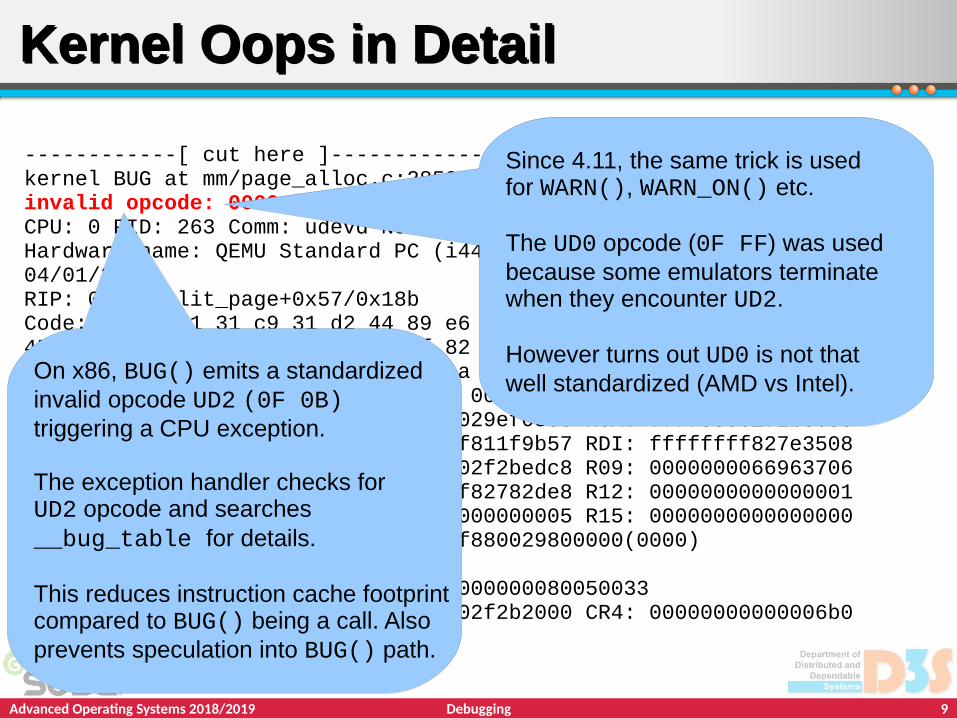
On x86, BUG() emits a standardizedinvalid opcode UD2 (0F 0B)triggering a CPU exception.
The exception handler checks forUD2 opcode and searches__bug_table for details.
This reduces instruction cache footprintcompared to BUG() being a call. Alsoprevents speculation into BUG() path.
Since 4.11, the same trick is usedfor WARN(), WARN_ON() etc.
The UD0 opcode (0F FF) was usedbecause some emulators terminatewhen they encounter UD2.
However turns out UD0 is not thatwell standardized (AMD vs Intel).
Advanced Operating Systems 2018/2019 10Debugging
------------[ cut here ]------------kernel BUG at mm/page_alloc.c:2850!invalid opcode: 0000 [#1] PREEMPT SMPCPU: 0 PID: 263 Comm: udevd Not tainted 4.20.0-rc1-00027-g3a6d198 #1Hardware name: QEMU Standard PC (i440FX + PIIX, 1996), BIOS 1.10.2-1 04/01/2014RIP: 0010:split_page+0x57/0x18bCode: 83 e4 01 31 c9 31 d2 44 89 e6 48 c7 c7 28 b8 7d 82 e8 39 58 fb ff 45 85 e4 74 11 48 c7 c6 43 ef 3f 82 48 89 df e8 40 99 03 00 <0f> 0b 4c 8b 63 08 31 c9 31 d2 48 c7 c7 b8 ca 7d 82 4d 89 e6 41 83RSP: 0018:ffff88002f2c3900 EFLAGS: 00010293RAX: ffffffff823fef43 RBX: ffff880029ef0800 RCX: ffff88002f2be680RDX: 0000000000000000 RSI: ffffffff811f9b57 RDI: ffffffff827e3508RBP: ffff88002f2c3930 R08: ffff88002f2bedc8 R09: 0000000066963706R10: ffffffff82782de8 R11: ffffffff82782de8 R12: 0000000000000001R13: ffff88002e920000 R14: 0000000000000005 R15: 0000000000000000FS: 00007fd7d5b20780(0000) GS:ffff880029800000(0000) knlGS:0000000000000000CS: 0010 DS: 0000 ES: 0000 CR0: 0000000080050033CR2: 00007ffde3b44fb8 CR3: 000000002f2b2000 CR4: 00000000000006b0
Kernel Oops in DetailKernel Oops in Detail
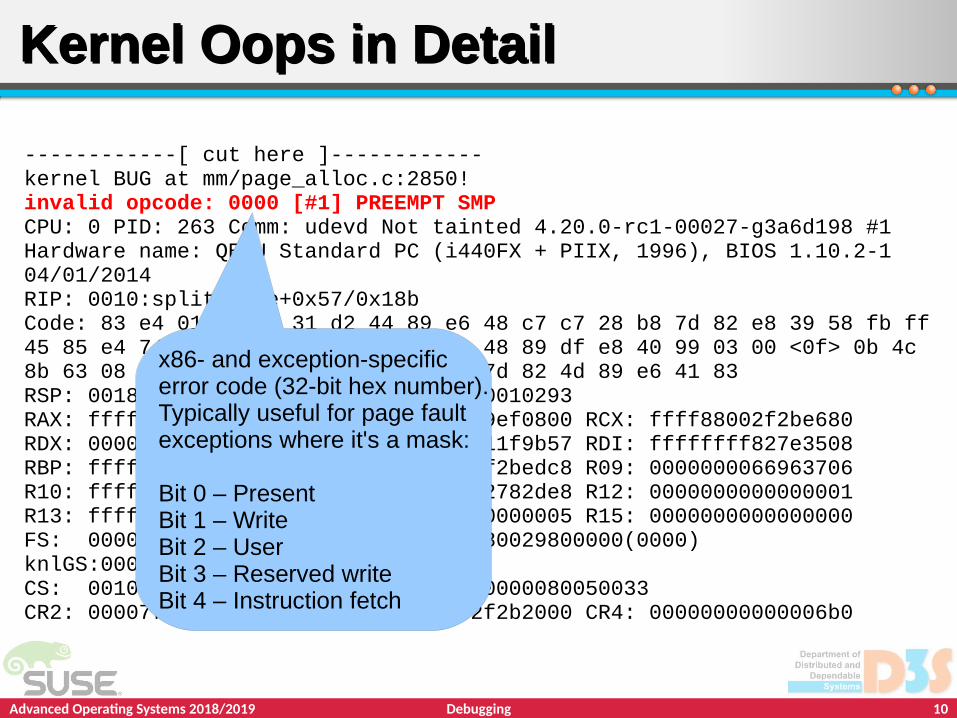
x86- and exception-specificerror code (32-bit hex number).Typically useful for page faultexceptions where it's a mask:
Bit 0 – PresentBit 1 – WriteBit 2 – UserBit 3 – Reserved writeBit 4 – Instruction fetch
Advanced Operating Systems 2018/2019 11Debugging
------------[ cut here ]------------kernel BUG at mm/page_alloc.c:2850!invalid opcode: 0000 [#1] PREEMPT SMPCPU: 0 PID: 263 Comm: udevd Not tainted 4.20.0-rc1-00027-g3a6d198 #1Hardware name: QEMU Standard PC (i440FX + PIIX, 1996), BIOS 1.10.2-1 04/01/2014RIP: 0010:split_page+0x57/0x18bCode: 83 e4 01 31 c9 31 d2 44 89 e6 48 c7 c7 28 b8 7d 82 e8 39 58 fb ff 45 85 e4 74 11 48 c7 c6 43 ef 3f 82 48 89 df e8 40 99 03 00 <0f> 0b 4c 8b 63 08 31 c9 31 d2 48 c7 c7 b8 ca 7d 82 4d 89 e6 41 83RSP: 0018:ffff88002f2c3900 EFLAGS: 00010293RAX: ffffffff823fef43 RBX: ffff880029ef0800 RCX: ffff88002f2be680RDX: 0000000000000000 RSI: ffffffff811f9b57 RDI: ffffffff827e3508RBP: ffff88002f2c3930 R08: ffff88002f2bedc8 R09: 0000000066963706R10: ffffffff82782de8 R11: ffffffff82782de8 R12: 0000000000000001R13: ffff88002e920000 R14: 0000000000000005 R15: 0000000000000000FS: 00007fd7d5b20780(0000) GS:ffff880029800000(0000) knlGS:0000000000000000CS: 0010 DS: 0000 ES: 0000 CR0: 0000000080050033CR2: 00007ffde3b44fb8 CR3: 000000002f2b2000 CR4: 00000000000006b0
Kernel Oops in DetailKernel Oops in Detail
Oops counter, followed bystate of selected importantkernel config options:
PREEMPTSMPDEBUG_PAGEALLOCKASANPTI/NOPTI

Advanced Operating Systems 2018/2019 12Debugging
------------[ cut here ]------------kernel BUG at mm/page_alloc.c:2850!invalid opcode: 0000 [#1] PREEMPT SMPCPU: 0 PID: 263 Comm: udevd Not tainted 4.20.0-rc1-00027-g3a6d198 #1Hardware name: QEMU Standard PC (i440FX + PIIX, 1996), BIOS 1.10.2-1 04/01/2014RIP: 0010:split_page+0x57/0x18bCode: 83 e4 01 31 c9 31 d2 44 89 e6 48 c7 c7 28 b8 7d 82 e8 39 58 fb ff 45 85 e4 74 11 48 c7 c6 43 ef 3f 82 48 89 df e8 40 99 03 00 <0f> 0b 4c 8b 63 08 31 c9 31 d2 48 c7 c7 b8 ca 7d 82 4d 89 e6 41 83RSP: 0018:ffff88002f2c3900 EFLAGS: 00010293RAX: ffffffff823fef43 RBX: ffff880029ef0800 RCX: ffff88002f2be680RDX: 0000000000000000 RSI: ffffffff811f9b57 RDI: ffffffff827e3508RBP: ffff88002f2c3930 R08: ffff88002f2bedc8 R09: 0000000066963706R10: ffffffff82782de8 R11: ffffffff82782de8 R12: 0000000000000001R13: ffff88002e920000 R14: 0000000000000005 R15: 0000000000000000FS: 00007fd7d5b20780(0000) GS:ffff880029800000(0000) knlGS:0000000000000000CS: 0010 DS: 0000 ES: 0000 CR0: 0000000080050033CR2: 00007ffde3b44fb8 CR3: 000000002f2b2000 CR4: 00000000000006b0
Kernel Oops in DetailKernel Oops in Detail
Taint flags: POFCE – same as per-module G – no proprietary module (not P) R – module was force-unloaded D – there was an oops before W – there was a warning before L – soft-lockup has occurred before B – bad page was encountered K – kernel has been live patched T – kernel structures randomized M – system has reported a MCE A – ACPI table was overriden I – firmware bug workaround S – “CPU out of spec” X – distro-defined (auxiliary) U – userspace-defined
Information about CPU, processin whose context the bug
happened, kernel version, HW.
Advanced Operating Systems 2018/2019 13Debugging
------------[ cut here ]------------kernel BUG at mm/page_alloc.c:2850!invalid opcode: 0000 [#1] PREEMPT SMPCPU: 0 PID: 263 Comm: udevd Not tainted 4.20.0-rc1-00027-g3a6d198 #1Hardware name: QEMU Standard PC (i440FX + PIIX, 1996), BIOS 1.10.2-1 04/01/2014RIP: 0010:split_page+0x57/0x18bCode: 83 e4 01 31 c9 31 d2 44 89 e6 48 c7 c7 28 b8 7d 82 e8 39 58 fb ff 45 85 e4 74 11 48 c7 c6 43 ef 3f 82 48 89 df e8 40 99 03 00 <0f> 0b 4c 8b 63 08 31 c9 31 d2 48 c7 c7 b8 ca 7d 82 4d 89 e6 41 83RSP: 0018:ffff88002f2c3900 EFLAGS: 00010293RAX: ffffffff823fef43 RBX: ffff880029ef0800 RCX: ffff88002f2be680RDX: 0000000000000000 RSI: ffffffff811f9b57 RDI: ffffffff827e3508RBP: ffff88002f2c3930 R08: ffff88002f2bedc8 R09: 0000000066963706R10: ffffffff82782de8 R11: ffffffff82782de8 R12: 0000000000000001R13: ffff88002e920000 R14: 0000000000000005 R15: 0000000000000000FS: 00007fd7d5b20780(0000) GS:ffff880029800000(0000) knlGS:0000000000000000CS: 0010 DS: 0000 ES: 0000 CR0: 0000000080050033CR2: 00007ffde3b44fb8 CR3: 000000002f2b2000 CR4: 00000000000006b0
Kernel Oops in DetailKernel Oops in Detail
Which instruction was executing, translatedto function name + offset / size.
This may be different from where positionwhere BUG_ON() was reported, if thefunction containing BUG_ON() was inlined.
There used to be the raw address too, but itwas removed for security reasons (KASLR).

Advanced Operating Systems 2018/2019 14Debugging
------------[ cut here ]------------kernel BUG at mm/page_alloc.c:2850!invalid opcode: 0000 [#1] PREEMPT SMPCPU: 0 PID: 263 Comm: udevd Not tainted 4.20.0-rc1-00027-g3a6d198 #1Hardware name: QEMU Standard PC (i440FX + PIIX, 1996), BIOS 1.10.2-1 04/01/2014RIP: 0010:split_page+0x57/0x18bCode: 83 e4 01 31 c9 31 d2 44 89 e6 48 c7 c7 28 b8 7d 82 e8 39 58 fb ff 45 85 e4 74 11 48 c7 c6 43 ef 3f 82 48 89 df e8 40 99 03 00 <0f> 0b 4c 8b 63 08 31 c9 31 d2 48 c7 c7 b8 ca 7d 82 4d 89 e6 41 83RSP: 0018:ffff88002f2c3900 EFLAGS: 00010293RAX: ffffffff823fef43 RBX: ffff880029ef0800 RCX: ffff88002f2be680RDX: 0000000000000000 RSI: ffffffff811f9b57 RDI: ffffffff827e3508RBP: ffff88002f2c3930 R08: ffff88002f2bedc8 R09: 0000000066963706R10: ffffffff82782de8 R11: ffffffff82782de8 R12: 0000000000000001R13: ffff88002e920000 R14: 0000000000000005 R15: 0000000000000000FS: 00007fd7d5b20780(0000) GS:ffff880029800000(0000) knlGS:0000000000000000CS: 0010 DS: 0000 ES: 0000 CR0: 0000000080050033CR2: 00007ffde3b44fb8 CR3: 000000002f2b2000 CR4: 00000000000006b0
Kernel Oops in DetailKernel Oops in Detail
A bunch of instructions around the RIP.RIP position denoted by < >
Recall that 0F 0B is opcode for UD2.
We can disassemble the code listing bypiping the oops into./scripts/decodecodein the kernel source tree.

Advanced Operating Systems 2018/2019 15Debugging
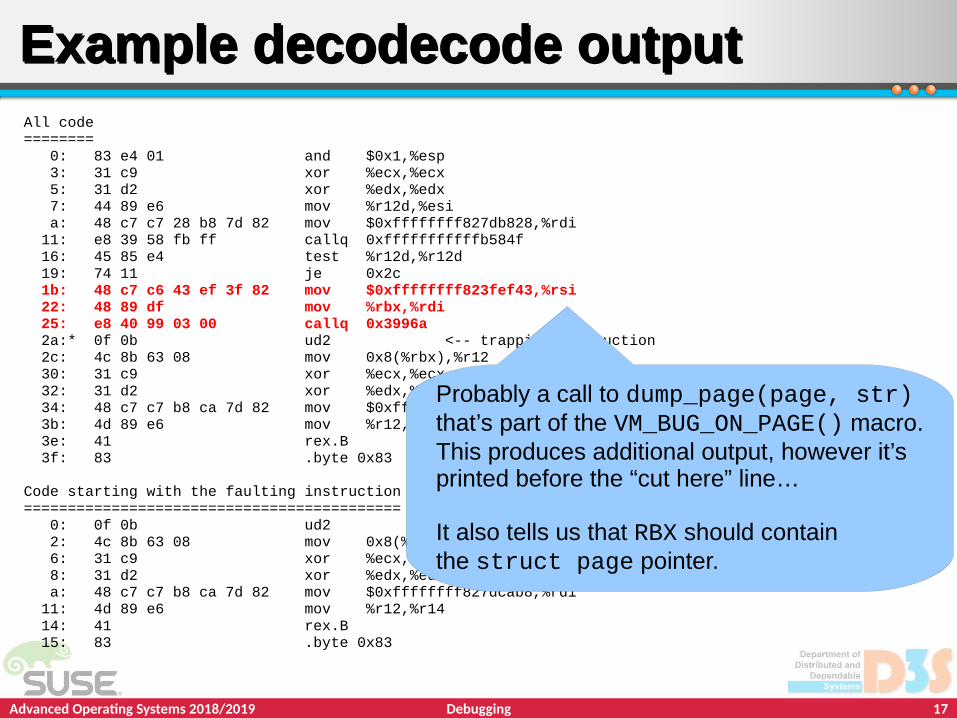
Example decodecode outputExample decodecode outputAll code======== 0: 83 e4 01 and $0x1,%esp 3: 31 c9 xor %ecx,%ecx 5: 31 d2 xor %edx,%edx 7: 44 89 e6 mov %r12d,%esi a: 48 c7 c7 28 b8 7d 82 mov $0xffffffff827db828,%rdi 11: e8 39 58 fb ff callq 0xfffffffffffb584f 16: 45 85 e4 test %r12d,%r12d 19: 74 11 je 0x2c 1b: 48 c7 c6 43 ef 3f 82 mov $0xffffffff823fef43,%rsi 22: 48 89 df mov %rbx,%rdi 25: e8 40 99 03 00 callq 0x3996a 2a:* 0f 0b ud2 <-- trapping instruction 2c: 4c 8b 63 08 mov 0x8(%rbx),%r12 30: 31 c9 xor %ecx,%ecx 32: 31 d2 xor %edx,%edx 34: 48 c7 c7 b8 ca 7d 82 mov $0xffffffff827dcab8,%rdi 3b: 4d 89 e6 mov %r12,%r14 3e: 41 rex.B 3f: 83 .byte 0x83
Code starting with the faulting instruction=========================================== 0: 0f 0b ud2 2: 4c 8b 63 08 mov 0x8(%rbx),%r12 6: 31 c9 xor %ecx,%ecx 8: 31 d2 xor %edx,%edx a: 48 c7 c7 b8 ca 7d 82 mov $0xffffffff827dcab8,%rdi 11: 4d 89 e6 mov %r12,%r14 14: 41 rex.B 15: 83 .byte 0x83

Advanced Operating Systems 2018/2019 16Debugging
Example decodecode outputExample decodecode outputAll code======== 0: 83 e4 01 and $0x1,%esp 3: 31 c9 xor %ecx,%ecx 5: 31 d2 xor %edx,%edx 7: 44 89 e6 mov %r12d,%esi a: 48 c7 c7 28 b8 7d 82 mov $0xffffffff827db828,%rdi 11: e8 39 58 fb ff callq 0xfffffffffffb584f 16: 45 85 e4 test %r12d,%r12d 19: 74 11 je 0x2c 1b: 48 c7 c6 43 ef 3f 82 mov $0xffffffff823fef43,%rsi 22: 48 89 df mov %rbx,%rdi 25: e8 40 99 03 00 callq 0x3996a 2a:* 0f 0b ud2 <-- trapping instruction 2c: 4c 8b 63 08 mov 0x8(%rbx),%r12 30: 31 c9 xor %ecx,%ecx 32: 31 d2 xor %edx,%edx 34: 48 c7 c7 b8 ca 7d 82 mov $0xffffffff827dcab8,%rdi 3b: 4d 89 e6 mov %r12,%r14 3e: 41 rex.B 3f: 83 .byte 0x83
Code starting with the faulting instruction=========================================== 0: 0f 0b ud2 2: 4c 8b 63 08 mov 0x8(%rbx),%r12 6: 31 c9 xor %ecx,%ecx 8: 31 d2 xor %edx,%edx a: 48 c7 c7 b8 ca 7d 82 mov $0xffffffff827dcab8,%rdi 11: 4d 89 e6 mov %r12,%r14 14: 41 rex.B 15: 83 .byte 0x83
Part of the PageCompound(page)test that was unexpectedly true.R12=0 would skip over the UD2,but the register contains 0x1.We can’t see how R12 was set.
Advanced Operating Systems 2018/2019 17Debugging
Example decodecode outputExample decodecode outputAll code======== 0: 83 e4 01 and $0x1,%esp 3: 31 c9 xor %ecx,%ecx 5: 31 d2 xor %edx,%edx 7: 44 89 e6 mov %r12d,%esi a: 48 c7 c7 28 b8 7d 82 mov $0xffffffff827db828,%rdi 11: e8 39 58 fb ff callq 0xfffffffffffb584f 16: 45 85 e4 test %r12d,%r12d 19: 74 11 je 0x2c 1b: 48 c7 c6 43 ef 3f 82 mov $0xffffffff823fef43,%rsi 22: 48 89 df mov %rbx,%rdi 25: e8 40 99 03 00 callq 0x3996a 2a:* 0f 0b ud2 <-- trapping instruction 2c: 4c 8b 63 08 mov 0x8(%rbx),%r12 30: 31 c9 xor %ecx,%ecx 32: 31 d2 xor %edx,%edx 34: 48 c7 c7 b8 ca 7d 82 mov $0xffffffff827dcab8,%rdi 3b: 4d 89 e6 mov %r12,%r14 3e: 41 rex.B 3f: 83 .byte 0x83
Code starting with the faulting instruction=========================================== 0: 0f 0b ud2 2: 4c 8b 63 08 mov 0x8(%rbx),%r12 6: 31 c9 xor %ecx,%ecx 8: 31 d2 xor %edx,%edx a: 48 c7 c7 b8 ca 7d 82 mov $0xffffffff827dcab8,%rdi 11: 4d 89 e6 mov %r12,%r14 14: 41 rex.B 15: 83 .byte 0x83
Probably a call to dump_page(page, str)that’s part of the VM_BUG_ON_PAGE() macro.This produces additional output, however it’sprinted before the “cut here” line…
It also tells us that RBX should containthe struct page pointer.

Advanced Operating Systems 2018/2019 18Debugging
------------[ cut here ]------------kernel BUG at mm/page_alloc.c:2850!invalid opcode: 0000 [#1] PREEMPT SMPCPU: 0 PID: 263 Comm: udevd Not tainted 4.20.0-rc1-00027-g3a6d198 #1Hardware name: QEMU Standard PC (i440FX + PIIX, 1996), BIOS 1.10.2-1 04/01/2014RIP: 0010:split_page+0x57/0x18bCode: 83 e4 01 31 c9 31 d2 44 89 e6 48 c7 c7 28 b8 7d 82 e8 39 58 fb ff 45 85 e4 74 11 48 c7 c6 43 ef 3f 82 48 89 df e8 40 99 03 00 <0f> 0b 4c 8b 63 08 31 c9 31 d2 48 c7 c7 b8 ca 7d 82 4d 89 e6 41 83RSP: 0018:ffff88002f2c3900 EFLAGS: 00010293RAX: ffffffff823fef43 RBX: ffff880029ef0800 RCX: ffff88002f2be680RDX: 0000000000000000 RSI: ffffffff811f9b57 RDI: ffffffff827e3508RBP: ffff88002f2c3930 R08: ffff88002f2bedc8 R09: 0000000066963706R10: ffffffff82782de8 R11: ffffffff82782de8 R12: 0000000000000001R13: ffff88002e920000 R14: 0000000000000005 R15: 0000000000000000FS: 00007fd7d5b20780(0000) GS:ffff880029800000(0000) knlGS:0000000000000000CS: 0010 DS: 0000 ES: 0000 CR0: 0000000080050033CR2: 00007ffde3b44fb8 CR3: 000000002f2b2000 CR4: 00000000000006b0
Kernel Oops in DetailKernel Oops in DetailValues of the general registers at the trappingInstruction. We can recognize kernel addresses:FFFFFFFF8xxxxxxx – kernel code + dataFFFFFFFFAxxxxxxx – kernel modules code + dataFFFF88xxxxxxxxxx – direct mapped phys. mem.FFFFEAxxxxxxxxxx – array of struct pages
R12 – the value that should have been 0RBX – should be a struct page, but in the wrong range

Advanced Operating Systems 2018/2019 19Debugging
------------[ cut here ]------------kernel BUG at mm/page_alloc.c:2850!invalid opcode: 0000 [#1] PREEMPT SMPCPU: 0 PID: 263 Comm: udevd Not tainted 4.20.0-rc1-00027-g3a6d198 #1Hardware name: QEMU Standard PC (i440FX + PIIX, 1996), BIOS 1.10.2-1 04/01/2014RIP: 0010:split_page+0x57/0x18bCode: 83 e4 01 31 c9 31 d2 44 89 e6 48 c7 c7 28 b8 7d 82 e8 39 58 fb ff 45 85 e4 74 11 48 c7 c6 43 ef 3f 82 48 89 df e8 40 99 03 00 <0f> 0b 4c 8b 63 08 31 c9 31 d2 48 c7 c7 b8 ca 7d 82 4d 89 e6 41 83RSP: 0018:ffff88002f2c3900 EFLAGS: 00010293RAX: ffffffff823fef43 RBX: ffff880029ef0800 RCX: ffff88002f2be680RDX: 0000000000000000 RSI: ffffffff811f9b57 RDI: ffffffff827e3508RBP: ffff88002f2c3930 R08: ffff88002f2bedc8 R09: 0000000066963706R10: ffffffff82782de8 R11: ffffffff82782de8 R12: 0000000000000001R13: ffff88002e920000 R14: 0000000000000005 R15: 0000000000000000FS: 00007fd7d5b20780(0000) GS:ffff880029800000(0000) knlGS:0000000000000000CS: 0010 DS: 0000 ES: 0000 CR0: 0000000080050033CR2: 00007ffde3b44fb8 CR3: 000000002f2b2000 CR4: 00000000000006b0
Kernel Oops in DetailKernel Oops in Detail
Segment registers, and selected control registers:FS – userspace thread-local storageGS – kernel percpu base
CR0: enables protected mode, paging...CR2: the faulting virtual addressCR3: physical address of top-level page tableCR4: a mask for enabling various extensions

Advanced Operating Systems 2018/2019 20Debugging
------------[ cut here ]------------kernel BUG at mm/page_alloc.c:2850!invalid opcode: 0000 [#1] PREEMPT SMPCPU: 0 PID: 263 Comm: udevd Not tainted 4.20.0-rc1-00027-g3a6d198 #1Hardware name: QEMU Standard PC (i440FX + PIIX, 1996), BIOS 1.10.2-1 04/01/2014RIP: 0010:split_page+0x57/0x18bCode: 83 e4 01 31 c9 31 d2 44 89 e6 48 c7 c7 28 b8 7d 82 e8 39 58 fb ff 45 85 e4 74 11 48 c7 c6 43 ef 3f 82 48 89 df e8 40 99 03 00 <0f> 0b 4c 8b 63 08 31 c9 31 d2 48 c7 c7 b8 ca 7d 82 4d 89 e6 41 83RSP: 0018:ffff88002f2c3900 EFLAGS: 00010293RAX: ffffffff823fef43 RBX: ffff880029ef0800 RCX: ffff88002f2be680RDX: 0000000000000000 RSI: ffffffff811f9b57 RDI: ffffffff827e3508RBP: ffff88002f2c3930 R08: ffff88002f2bedc8 R09: 0000000066963706R10: ffffffff82782de8 R11: ffffffff82782de8 R12: 0000000000000001R13: ffff88002e920000 R14: 0000000000000005 R15: 0000000000000000FS: 00007fd7d5b20780(0000) GS:ffff880029800000(0000) knlGS:0000000000000000CS: 0010 DS: 0000 ES: 0000 CR0: 0000000080050033CR2: 00007ffde3b44fb8 CR3: 000000002f2b2000 CR4: 00000000000006b0
Kernel Oops in DetailKernel Oops in Detail
Here used to be raw stack contents, but removedin 4.9:
"The stack dump actually goes back to forever,and it used to be useful back in 1992 or so.But it used to be useful mainly because stackswere simpler and we didn't have very good call tracesanyway. I definitely remember having usedthem - I just do not remember having usedthem in the last ten+ years.” - Linus

Advanced Operating Systems 2018/2019 21Debugging
Call Trace: make_alloc_exact+0x8e/0xb2 alloc_pages_exact+0x3d/0x44 snd_dma_alloc_pages+0xfc/0x2d4 [snd_pcm] snd_pcm_lib_preallocate_pages1+0x7f/0x1f2 [snd_pcm] snd_pcm_lib_preallocate_pages_for_all+0x64/0xa5 [snd_pcm] snd_pcsp_new_pcm+0x93/0xa4 [snd_pcsp] pcsp_probe+0x209/0x2ad [snd_pcsp] pcsp_remove+0x2f/0x2f [snd_pcsp] platform_drv_probe+0x4e/0xa7 platform_drv_remove+0x58/0x58 really_probe+0x202/0x3ba driver_probe_device+0x10a/0x157 __driver_attach+0xcb/0x116 ? driver_probe_device+0x157/0x157 bus_for_each_dev+0x9d/0xc5 driver_attach+0x27/0x2a bus_add_driver+0x11a/0x241 driver_register+0xe9/0x136 __platform_driver_register+0x44/0x49 ? 0xffffffffa00c7000 pcsp_init+0x60/0x1000 [snd_pcsp] do_one_initcall+0x173/0x3a0 ? kmem_cache_alloc_trace+0x2a5/0x2c0
Kernel Oops in DetailKernel Oops in Detail
Backtrace reconstructed by unwinding the stack,showing the return addresses from individual call frames.Raw addresses were also removed in 4.9.The downside is that multiple functions can have thesame name. Gdb will only show one symbol./scripts/faddr2line is smarter
Brackets denote [module].“?” means a pointer to function was found on stack butdoesn't fit in the stack frame; could be leftover fromprevious execution, or unwinder failure.

Advanced Operating Systems 2018/2019 22Debugging
How is stack unwinding implemented?How is stack unwinding implemented?
“Guess”: All code lies in a designated range of addresses
There is a symbol table to convert addresses to individual function names
Every value on stack that looks like a pointer to this range can be a return address
Simple, but relatively slow and with many false positives (everything is marked “?”)
Use RBP when CONFIG_FRAME_POINTER is enabled
RBP will always point to the previous frame’s stored RBP value, and return address lies next to it
Simple pointer chase with collecting the return addresses, thus fast
Fast, reliable, but maintaining RBP has performance impact on the kernel (5-10%)
Using debuginfo to locate the stack frames from current RIP value
DWARF Call Frame Info (CFI) – unwinder was in mainline for a while, but then removed (slow, sometimes unreliable, requires assembler annotations)
ORC – uses custom unwinder data generated by objtool during build – since 4.14, also for reliable stack traces needed by some of the live patching consistency models
Relatively fast, reliable, no performance impact on kernel (2-4 MB memory overhead)
Advanced Operating Systems 2018/2019 23Debugging
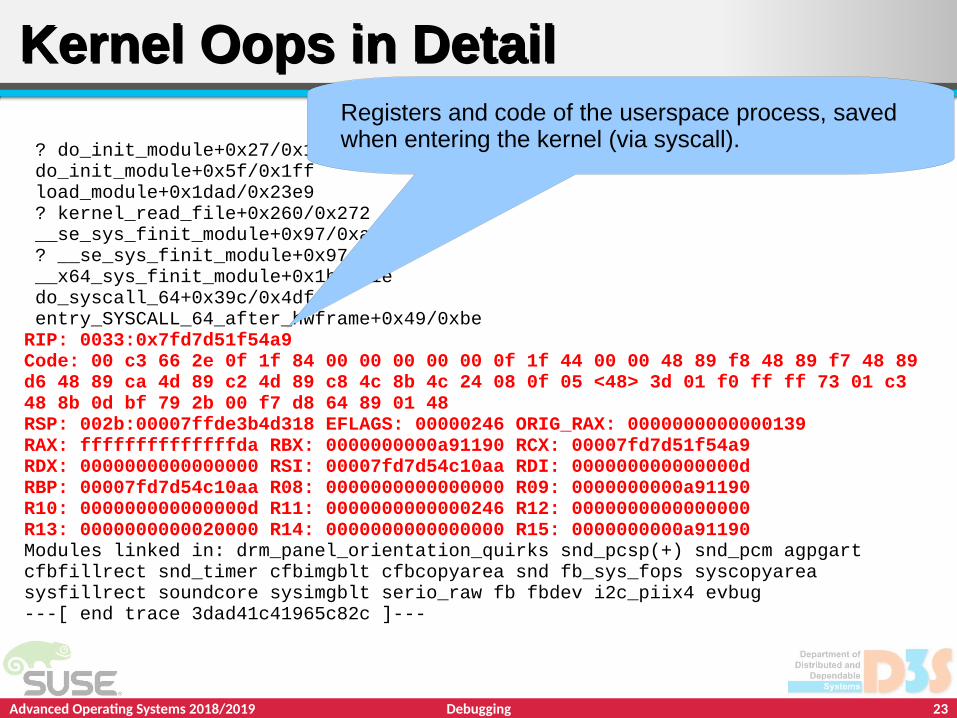
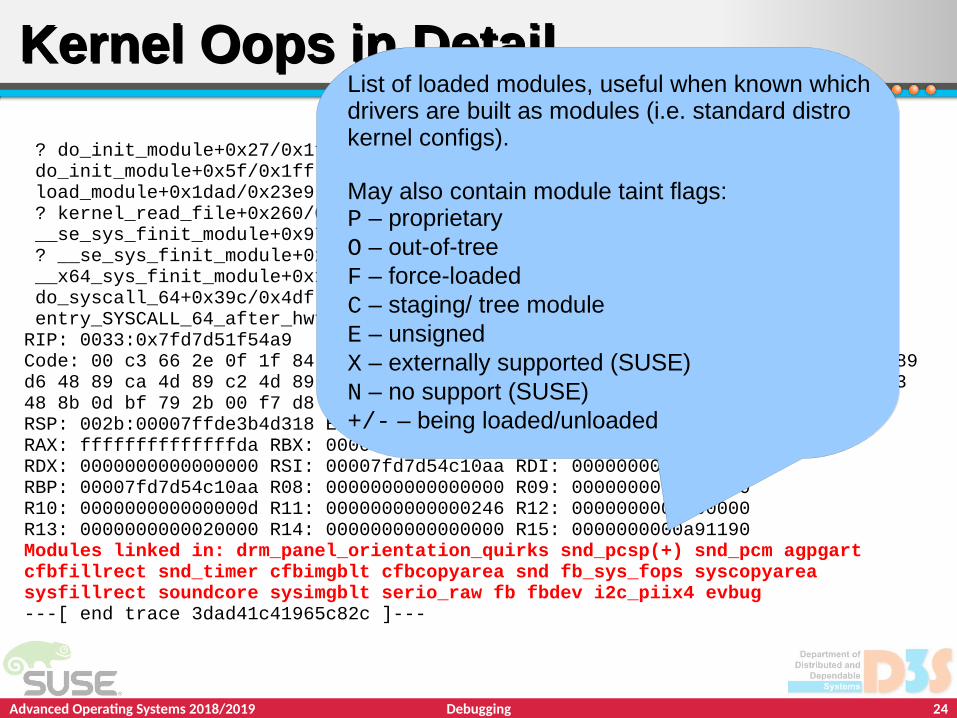
? do_init_module+0x27/0x1ff do_init_module+0x5f/0x1ff load_module+0x1dad/0x23e9 ? kernel_read_file+0x260/0x272 __se_sys_finit_module+0x97/0xa7 ? __se_sys_finit_module+0x97/0xa7 __x64_sys_finit_module+0x1b/0x1e do_syscall_64+0x39c/0x4df entry_SYSCALL_64_after_hwframe+0x49/0xbeRIP: 0033:0x7fd7d51f54a9Code: 00 c3 66 2e 0f 1f 84 00 00 00 00 00 0f 1f 44 00 00 48 89 f8 48 89 f7 48 89 d6 48 89 ca 4d 89 c2 4d 89 c8 4c 8b 4c 24 08 0f 05 <48> 3d 01 f0 ff ff 73 01 c3 48 8b 0d bf 79 2b 00 f7 d8 64 89 01 48RSP: 002b:00007ffde3b4d318 EFLAGS: 00000246 ORIG_RAX: 0000000000000139RAX: ffffffffffffffda RBX: 0000000000a91190 RCX: 00007fd7d51f54a9RDX: 0000000000000000 RSI: 00007fd7d54c10aa RDI: 000000000000000dRBP: 00007fd7d54c10aa R08: 0000000000000000 R09: 0000000000a91190R10: 000000000000000d R11: 0000000000000246 R12: 0000000000000000R13: 0000000000020000 R14: 0000000000000000 R15: 0000000000a91190Modules linked in: drm_panel_orientation_quirks snd_pcsp(+) snd_pcm agpgart cfbfillrect snd_timer cfbimgblt cfbcopyarea snd fb_sys_fops syscopyarea sysfillrect soundcore sysimgblt serio_raw fb fbdev i2c_piix4 evbug---[ end trace 3dad41c41965c82c ]---
Kernel Oops in DetailKernel Oops in DetailRegisters and code of the userspace process, savedwhen entering the kernel (via syscall).
Advanced Operating Systems 2018/2019 24Debugging
? do_init_module+0x27/0x1ff do_init_module+0x5f/0x1ff load_module+0x1dad/0x23e9 ? kernel_read_file+0x260/0x272 __se_sys_finit_module+0x97/0xa7 ? __se_sys_finit_module+0x97/0xa7 __x64_sys_finit_module+0x1b/0x1e do_syscall_64+0x39c/0x4df entry_SYSCALL_64_after_hwframe+0x49/0xbeRIP: 0033:0x7fd7d51f54a9Code: 00 c3 66 2e 0f 1f 84 00 00 00 00 00 0f 1f 44 00 00 48 89 f8 48 89 f7 48 89 d6 48 89 ca 4d 89 c2 4d 89 c8 4c 8b 4c 24 08 0f 05 <48> 3d 01 f0 ff ff 73 01 c3 48 8b 0d bf 79 2b 00 f7 d8 64 89 01 48RSP: 002b:00007ffde3b4d318 EFLAGS: 00000246 ORIG_RAX: 0000000000000139RAX: ffffffffffffffda RBX: 0000000000a91190 RCX: 00007fd7d51f54a9RDX: 0000000000000000 RSI: 00007fd7d54c10aa RDI: 000000000000000dRBP: 00007fd7d54c10aa R08: 0000000000000000 R09: 0000000000a91190R10: 000000000000000d R11: 0000000000000246 R12: 0000000000000000R13: 0000000000020000 R14: 0000000000000000 R15: 0000000000a91190Modules linked in: drm_panel_orientation_quirks snd_pcsp(+) snd_pcm agpgart cfbfillrect snd_timer cfbimgblt cfbcopyarea snd fb_sys_fops syscopyarea sysfillrect soundcore sysimgblt serio_raw fb fbdev i2c_piix4 evbug---[ end trace 3dad41c41965c82c ]---
Kernel Oops in DetailKernel Oops in DetailList of loaded modules, useful when known whichdrivers are built as modules (i.e. standard distrokernel configs).
May also contain module taint flags:P – proprietaryO – out-of-treeF – force-loadedC – staging/ tree moduleE – unsignedX – externally supported (SUSE)N – no support (SUSE)+/- – being loaded/unloaded
Advanced Operating Systems 2018/2019 25Debugging
? do_init_module+0x27/0x1ff do_init_module+0x5f/0x1ff load_module+0x1dad/0x23e9 ? kernel_read_file+0x260/0x272 __se_sys_finit_module+0x97/0xa7 ? __se_sys_finit_module+0x97/0xa7 __x64_sys_finit_module+0x1b/0x1e do_syscall_64+0x39c/0x4df entry_SYSCALL_64_after_hwframe+0x49/0xbeRIP: 0033:0x7fd7d51f54a9Code: 00 c3 66 2e 0f 1f 84 00 00 00 00 00 0f 1f 44 00 00 48 89 f8 48 89 f7 48 89 d6 48 89 ca 4d 89 c2 4d 89 c8 4c 8b 4c 24 08 0f 05 <48> 3d 01 f0 ff ff 73 01 c3 48 8b 0d bf 79 2b 00 f7 d8 64 89 01 48RSP: 002b:00007ffde3b4d318 EFLAGS: 00000246 ORIG_RAX: 0000000000000139RAX: ffffffffffffffda RBX: 0000000000a91190 RCX: 00007fd7d51f54a9RDX: 0000000000000000 RSI: 00007fd7d54c10aa RDI: 000000000000000dRBP: 00007fd7d54c10aa R08: 0000000000000000 R09: 0000000000a91190R10: 000000000000000d R11: 0000000000000246 R12: 0000000000000000R13: 0000000000020000 R14: 0000000000000000 R15: 0000000000a91190Modules linked in: drm_panel_orientation_quirks snd_pcsp(+) snd_pcm agpgart cfbfillrect snd_timer cfbimgblt cfbcopyarea snd fb_sys_fops syscopyarea sysfillrect soundcore sysimgblt serio_raw fb fbdev i2c_piix4 evbug---[ end trace 3dad41c41965c82c ]---
Kernel Oops in DetailKernel Oops in Detail
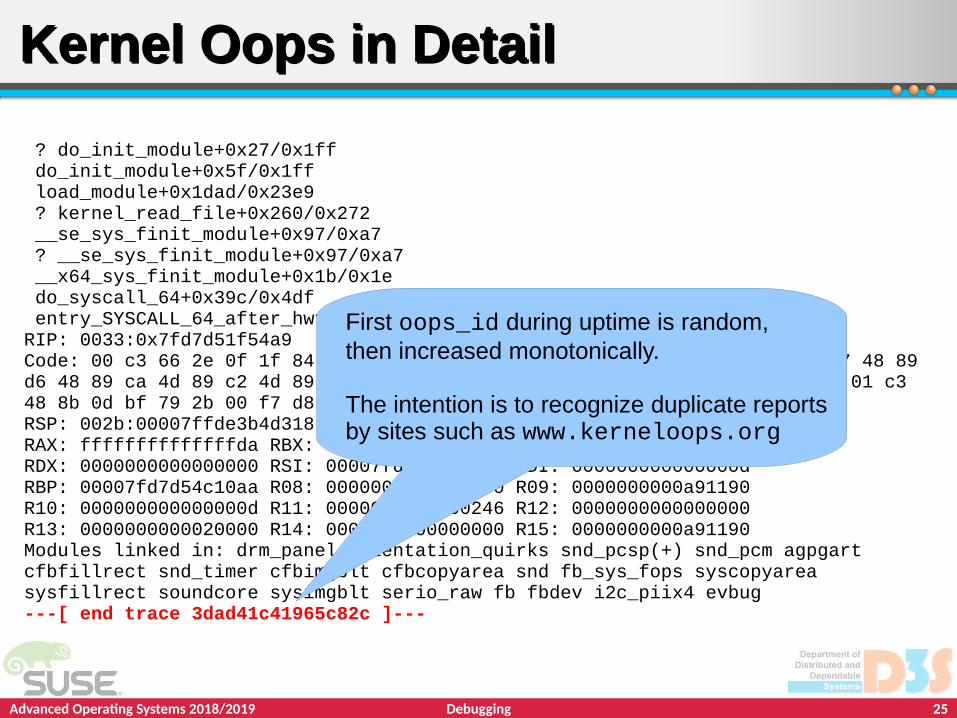
First oops_id during uptime is random,then increased monotonically.
The intention is to recognize duplicate reportsby sites such as www.kerneloops.org

Advanced Operating Systems 2018/2019 26Debugging
What else can produce oops/panic?What else can produce oops/panic?
BUG_ON() as seen in the example – hard assertionWARN_ON[_ONCE]() - soft assertion, unless panic_on_warn is enabled
Memory paging related faults – check CR2 register!BUG: unable to handle kernel paging request
... handle NULL pointer dereference (when bad_addr < PAGE_SIZE) – a structure’s field might be accessed with non-zero offset
Corrupted page table (reserved bits set, etc.)
Kernel trying to execute NX-protected page
Kernel trying to execute/access userspace page (Intel SMEP/SMAP feature)
Failed bounds check in kernel mode (Intel MPX feature)
Kernel stack overflow
General protection fault, unhandled double fault
FPU, SIMD exceptions from kernel mode
Advanced Operating Systems 2018/2019 27Debugging
What else can produce oops/panic?What else can produce oops/panic?
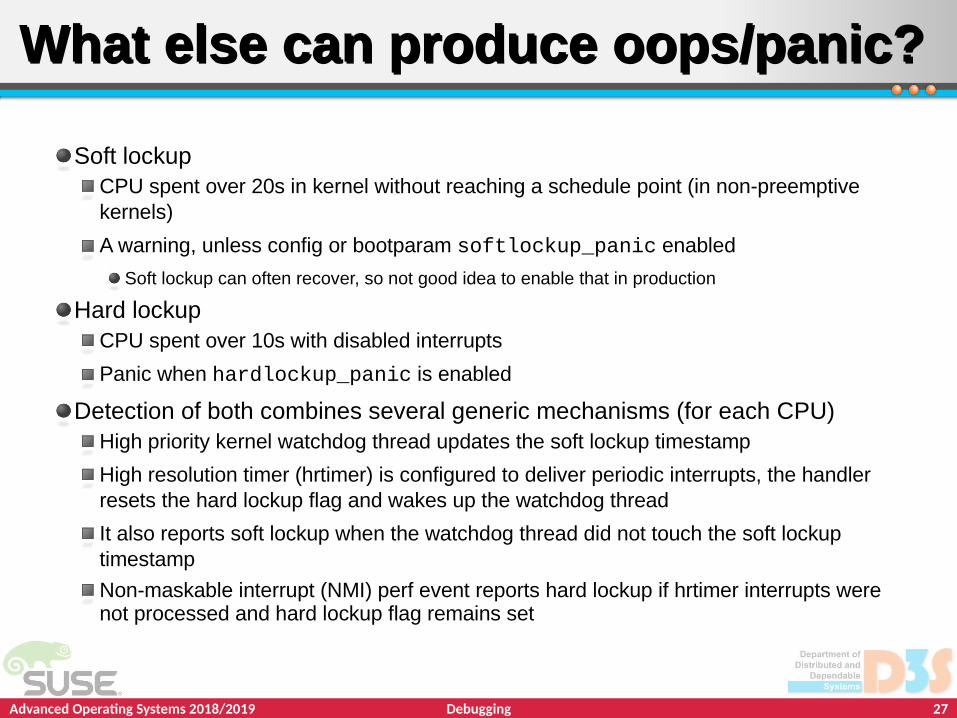
Soft lockupCPU spent over 20s in kernel without reaching a schedule point (in non-preemptive kernels)
A warning, unless config or bootparam softlockup_panic enabled
Soft lockup can often recover, so not good idea to enable that in production
Hard lockupCPU spent over 10s with disabled interrupts
Panic when hardlockup_panic is enabled
Detection of both combines several generic mechanisms (for each CPU)High priority kernel watchdog thread updates the soft lockup timestamp
High resolution timer (hrtimer) is configured to deliver periodic interrupts, the handler resets the hard lockup flag and wakes up the watchdog thread
It also reports soft lockup when the watchdog thread did not touch the soft lockup timestamp
Non-maskable interrupt (NMI) perf event reports hard lockup if hrtimer interrupts were not processed and hard lockup flag remains set

Advanced Operating Systems 2018/2019 28Debugging
What else can produce oops/panic?What else can produce oops/panic?
Hung task checkINFO: task … blocked for more than 120 seconds
khungtaskd periodically processes tasks in uninterruptible sleep and checks if their switch count changed
RCU stall detector
Detects when RCU grace period is too long (21s)CPU looping in RCU critical section or disabled interrupts, preemption or bottom halves, no scheduling points in non-preempt kernels
RT task preempting non-RT task in RCU critical section
Several other debugging config options (later)

Advanced Operating Systems 2018/2019 29Debugging
Creating and analyzing crash dumps

Advanced Operating Systems 2018/2019 30Debugging
Obtaining crash dumpsObtaining crash dumps
Several historical methods
diskdump, netdump, LKCD project…
Not very reliable (some parts of crashed kernel must still work) nor universal, needs dedicated server on same network etc.
Out of tree patches, included in old enterprise distros
Current solution: kexec-based kdump
Crash kernel loaded into a boot-reserved memory areaSize specified as boot parameter, no universally good value
On panic, kexec switches to the crash kernel without reboot
Memory of crashed kernel available as /proc/vmcore
Kdump utility can save to disk, network, filter pages...kexec (8), kdump (5), makedumpfile (8)
In VM guest environment, hypervisor dumps also possible

Advanced Operating Systems 2018/2019 31Debugging
Analyzing kernel crash dumpsAnalyzing kernel crash dumps
gdb can be used to open ELF based dumps
But those are not easily compressed and filtered
gdb has no understanding of kernel internals or virtual/physical mapping
There are some Python scripts under scripts/gdb in the Linux source
Can obtain per-cpu variables, dmesg, modules, tasks
A better tool for Linux kernel crash dumps - crash

Advanced Operating Systems 2018/2019 32Debugging
crash – introductioncrash – introduction
crash: the tool of choice for Linux crash dumps
Created by David Anderson from Red Hat
Understands all dump formats – kdump (compressed), netdump, diskdump, xendump, KVM dump, s390, LKCD, ...
Understands some kernel internals: memory mapping, tasks, SLAB/SLUB objects, …
Can e.g. walk linked lists, pipe output for further postprocessing
Extensible with Eppic – a C intepreter tailored to work with C structures stored in a dump, or Python (pykdump)

Advanced Operating Systems 2018/2019 33Debugging
crash – disadvantagescrash – disadvantages
crash has also disadvantages...
Uses gdb internally, but mostly just invokes some gdb query and postprocesses its output
Backtraces are not like from gdb (no debuginfo)
Some things are done both in crash and gdbThe codebase is hard to maintain, gdb stuck at old version
Machine running crash must be of same architecture as the dump
pykdump works by executing crash commands and parsing their output

Advanced Operating Systems 2018/2019 34Debugging
Invoking crashInvoking crash
On core dumpcrash vmlinux.gz vmlinux.debug vmcore
On live systemcrash vmlinux.gz vmlinux.debug
Options
-s silent, output not paged to less
-i file execute commands from file
--mod dir search for module debuginfo in dir
--minimal only basic commands (for broken dumps)
Advanced Operating Systems 2018/2019 35Debugging
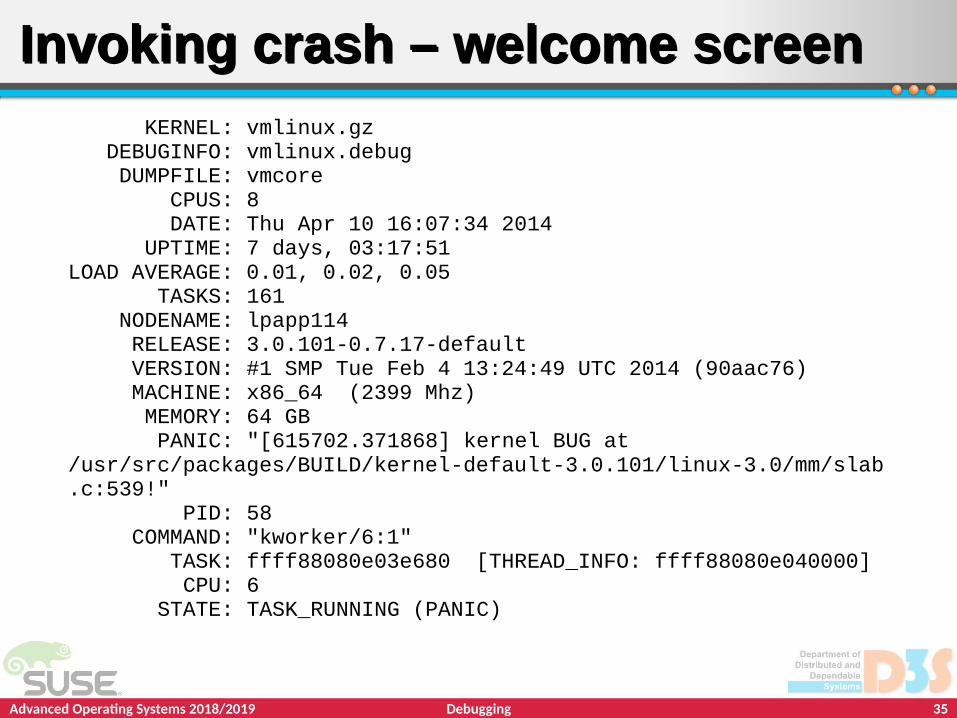
Invoking crash – welcome screenInvoking crash – welcome screen KERNEL: vmlinux.gz DEBUGINFO: vmlinux.debug DUMPFILE: vmcore CPUS: 8 DATE: Thu Apr 10 16:07:34 2014 UPTIME: 7 days, 03:17:51LOAD AVERAGE: 0.01, 0.02, 0.05 TASKS: 161 NODENAME: lpapp114 RELEASE: 3.0.101-0.7.17-default VERSION: #1 SMP Tue Feb 4 13:24:49 UTC 2014 (90aac76) MACHINE: x86_64 (2399 Mhz) MEMORY: 64 GB PANIC: "[615702.371868] kernel BUG at /usr/src/packages/BUILD/kernel-default-3.0.101/linux-3.0/mm/slab.c:539!" PID: 58 COMMAND: "kworker/6:1" TASK: ffff88080e03e680 [THREAD_INFO: ffff88080e040000] CPU: 6 STATE: TASK_RUNNING (PANIC)
Advanced Operating Systems 2018/2019 36Debugging
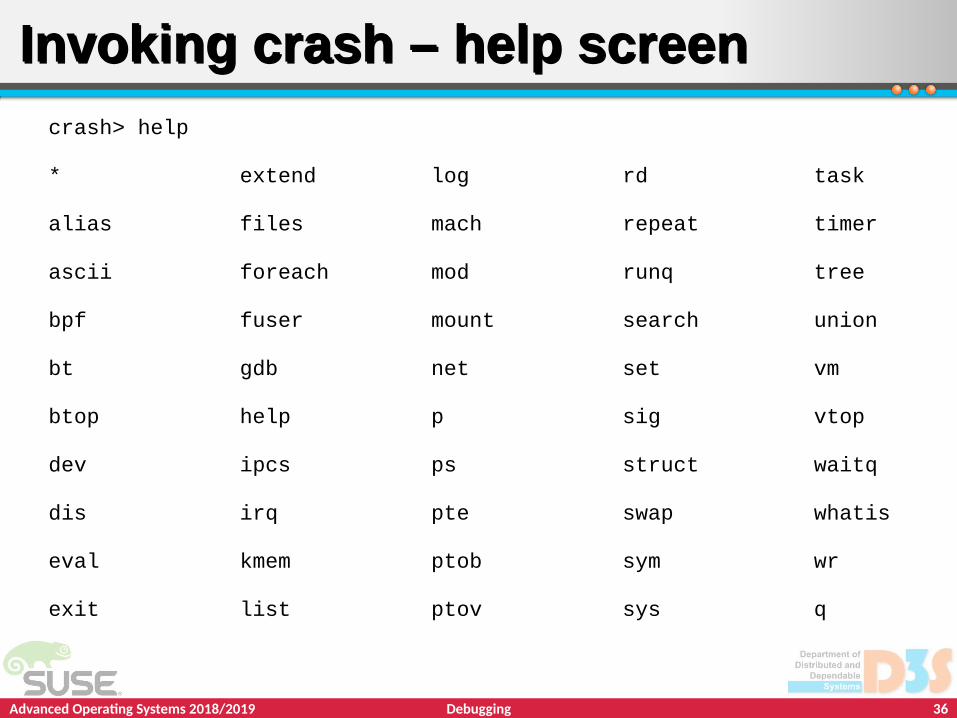
Invoking crash – help screenInvoking crash – help screencrash> help
* extend log rd task alias files mach repeat timer ascii foreach mod runq tree bpf fuser mount search union bt gdb net set vm btop help p sig vtop dev ipcs ps struct waitq dis irq pte swap whatis eval kmem ptob sym wr exit list ptov sys q

Advanced Operating Systems 2018/2019 37Debugging
Basic crash commandsBasic crash commands
dmesg (log) – same as the shell command
mod -t [mod] – module taint flags
ps – list processes (kernel/user), count by state, sort by last scheduled time…
dis [-l] [-r] [addr|sym] – disassemble code
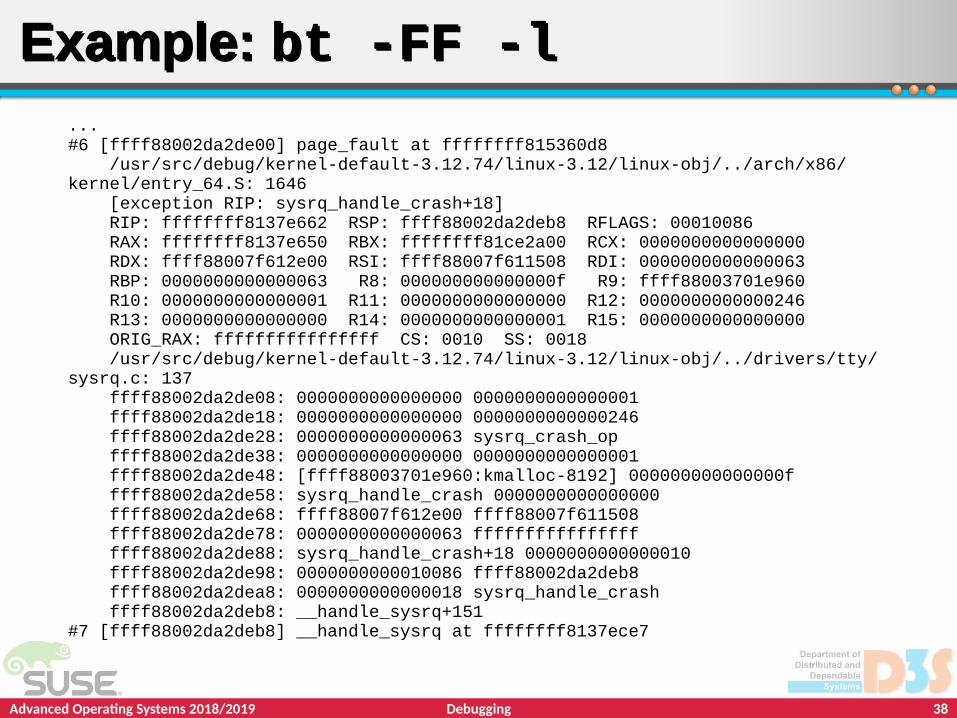
bt [task|pid] [-a] – show backtrace(s)
-l – include file/line transition
-FF – translate addresses to symbols/slab objects
Advanced Operating Systems 2018/2019 38Debugging
Example: bt -FF -lExample: bt -FF -l...#6 [ffff88002da2de00] page_fault at ffffffff815360d8 /usr/src/debug/kernel-default-3.12.74/linux-3.12/linux-obj/../arch/x86/kernel/entry_64.S: 1646 [exception RIP: sysrq_handle_crash+18] RIP: ffffffff8137e662 RSP: ffff88002da2deb8 RFLAGS: 00010086 RAX: ffffffff8137e650 RBX: ffffffff81ce2a00 RCX: 0000000000000000 RDX: ffff88007f612e00 RSI: ffff88007f611508 RDI: 0000000000000063 RBP: 0000000000000063 R8: 000000000000000f R9: ffff88003701e960 R10: 0000000000000001 R11: 0000000000000000 R12: 0000000000000246 R13: 0000000000000000 R14: 0000000000000001 R15: 0000000000000000 ORIG_RAX: ffffffffffffffff CS: 0010 SS: 0018 /usr/src/debug/kernel-default-3.12.74/linux-3.12/linux-obj/../drivers/tty/sysrq.c: 137 ffff88002da2de08: 0000000000000000 0000000000000001 ffff88002da2de18: 0000000000000000 0000000000000246 ffff88002da2de28: 0000000000000063 sysrq_crash_op ffff88002da2de38: 0000000000000000 0000000000000001 ffff88002da2de48: [ffff88003701e960:kmalloc-8192] 000000000000000f ffff88002da2de58: sysrq_handle_crash 0000000000000000 ffff88002da2de68: ffff88007f612e00 ffff88007f611508 ffff88002da2de78: 0000000000000063 ffffffffffffffff ffff88002da2de88: sysrq_handle_crash+18 0000000000000010 ffff88002da2de98: 0000000000010086 ffff88002da2deb8 ffff88002da2dea8: 0000000000000018 sysrq_handle_crash ffff88002da2deb8: __handle_sysrq+151 #7 [ffff88002da2deb8] __handle_sysrq at ffffffff8137ece7
Advanced Operating Systems 2018/2019 39Debugging
Important inspection commandsImportant inspection commands
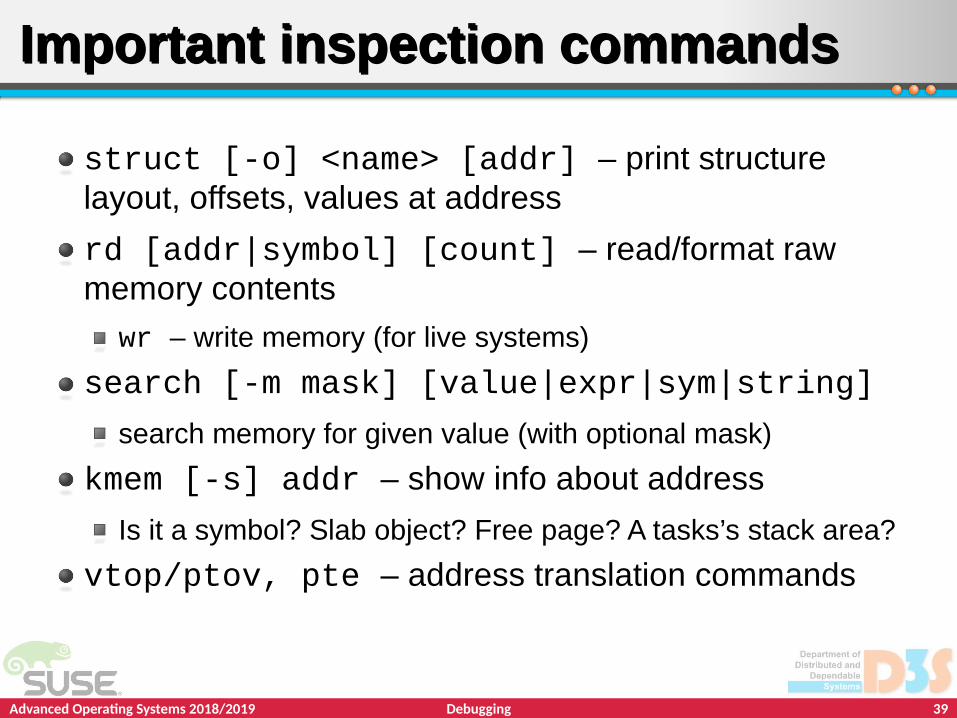
struct [-o] <name> [addr] – print structure layout, offsets, values at address
rd [addr|symbol] [count] – read/format raw memory contents
wr – write memory (for live systems)
search [-m mask] [value|expr|sym|string]
search memory for given value (with optional mask)
kmem [-s] addr – show info about address
Is it a symbol? Slab object? Free page? A tasks’s stack area?
vtop/ptov, pte – address translation commands
Advanced Operating Systems 2018/2019 40Debugging
More complex inspectionMore complex inspection
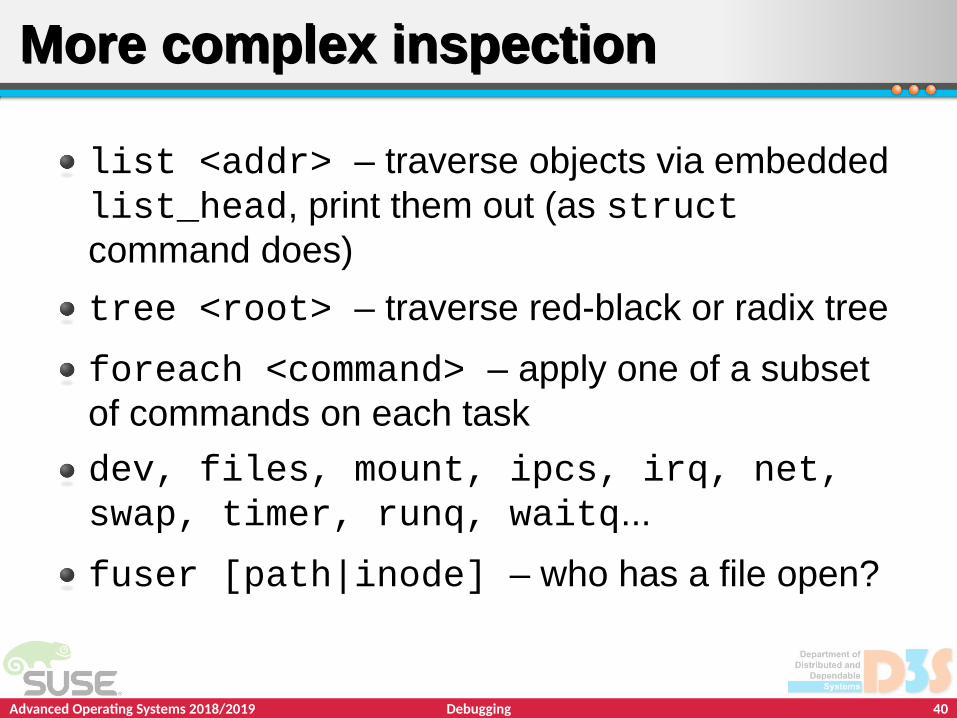
list <addr> – traverse objects via embedded list_head, print them out (as struct command does)
tree <root> – traverse red-black or radix tree
foreach <command> – apply one of a subset of commands on each task
dev, files, mount, ipcs, irq, net, swap, timer, runq, waitq...
fuser [path|inode] – who has a file open?

Advanced Operating Systems 2018/2019 41Debugging
How to use all these commands?How to use all these commands?
Note: no general and complete recipe
Mostly from own experience, or learn from others’ analyses
Subystem-specific knowledge, lots of staring into source code
First, understand the immediate cause
Often, some unexpected/wrong value somewhere in memoryNPE because certain structure’s field was NULL/bogus
Page table corruption, SLAB corruption, strange lock value...
Try to determine what could cause the value
Single bit flip? RAM error (yes, they do happen without ECC)Often manifests as multiple different bugs from same machine
Wrong use by upper layers? For example, SLAB corruption is almost never a bug in SLAB code, but e.g. result of double-free
Advanced Operating Systems 2018/2019 42Debugging
Try to determine what could cause the valueTry to determine what could cause the value
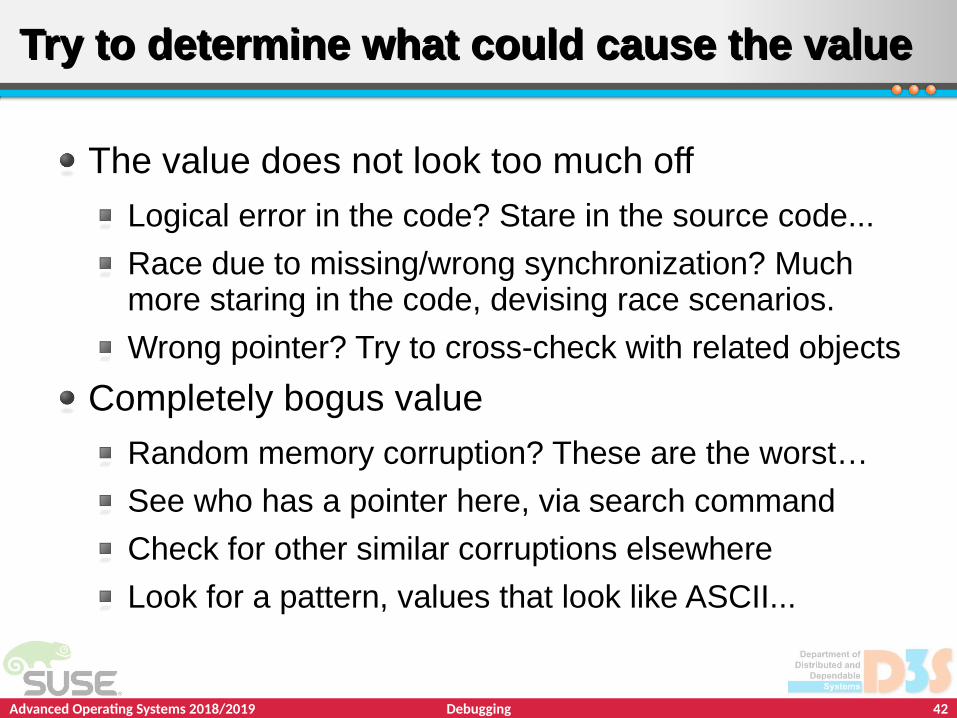
The value does not look too much off
Logical error in the code? Stare in the source code...
Race due to missing/wrong synchronization? Much more staring in the code, devising race scenarios.
Wrong pointer? Try to cross-check with related objects
Completely bogus value
Random memory corruption? These are the worst…
See who has a pointer here, via search command
Check for other similar corruptions elsewhere
Look for a pattern, values that look like ASCII...

Advanced Operating Systems 2018/2019 43Debugging
Example of a real bug analysisExample of a real bug analysis
struct shm_file_data shp = ...
shp = shm_lock(ns, sfd->id);
BUG_ON(IS_ERR(shp)); ← this triggered a crash dump
Determine from dump that shm_lock returned -EINVAL
Analyze code, see that -EINVAL is returned when sfd->id was not found in the shmem id registry (IDR)
Analyze dump to determine sfd and the id, which is 13008988
Check valid id’s (crash command ipcs -m) reveals our id is in the range of existing id’s, so probably not completely bogus
Could be use-after-free (i.e. deleted from the IDR but still used)
Or a memory corruption, the closest id is 13008943

Advanced Operating Systems 2018/2019 44Debugging
Example of a real bug analysisExample of a real bug analysis
Cross-check of related structures (some data is duplicated for faster access)// structure associated with a memory mapping
struct shm_file_data {
id = 13008988,
ns = 0xffffffff81a46920 <init_ipc_ns>,
file = 0xffff88037a645680,
vm_ops = 0xffffffff816268a0 <shmem_vm_ops>
}
// kernel representation of shmem object, from the IDR
struct shmid_kernel {
...
id = 13008943,
shm_file = 0xffff88037a645680,
...
The file pointers match, so the id’s should also be the same, thus one of them was almost certainly corrupted (file reuse at same address is less likely)
Other shm_file_data objects exist with id 13008943, so the IDR is probably correct
Advanced Operating Systems 2018/2019 45Debugging
Example of a real bug analysisExample of a real bug analysis
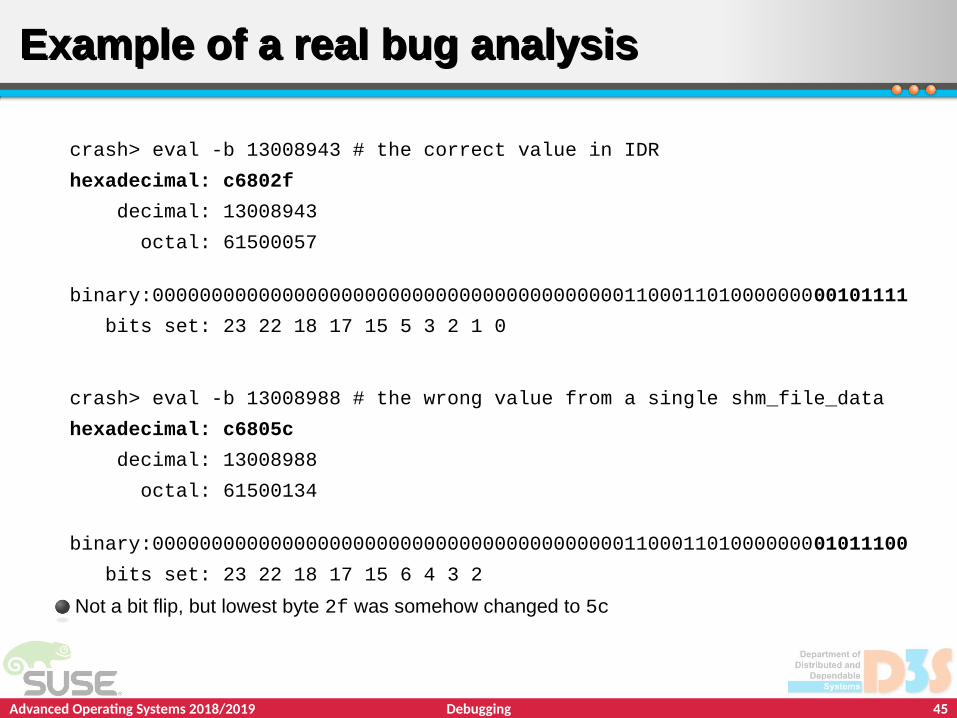
crash> eval -b 13008943 # the correct value in IDR
hexadecimal: c6802f
decimal: 13008943
octal: 61500057
binary:0000000000000000000000000000000000000000110001101000000000101111
bits set: 23 22 18 17 15 5 3 2 1 0
crash> eval -b 13008988 # the wrong value from a single shm_file_data
hexadecimal: c6805c
decimal: 13008988
octal: 61500134
binary:0000000000000000000000000000000000000000110001101000000001011100
bits set: 23 22 18 17 15 6 4 3 2
Not a bit flip, but lowest byte 2f was somehow changed to 5c

Advanced Operating Systems 2018/2019 46Debugging
Example of a real bug analysisExample of a real bug analysis
Lowest byte 2f was changed to 5c
In ASCII that means ‘/’ changed to ‘\’
Rewriting paths between Linux and Windows?
CIFS module (Samba client) has a function for that - convert_delimiter()
Code inspection found another function cifs_build_path_to_root() could call it on a buffer before adding a terminating null
Advanced Operating Systems 2018/2019 47Debugging
Alternative crash-python tool built on gdbAlternative crash-python tool built on gdb
Overcome crash disadvantages
Especially poor stack traces and complicated scripting
Extend gdb Python API so that the whole target can be provided by Python code
Use libkdumpfile+libaddrxlat via its Python API to read from kdumps and translate virtual addresses
Write gdb target on top (provide tasks etc)
All kernel-specific knowledge built in Python on top of gdb API for symbols, types and values
Implement equivalents to crash commands
Building blocks reusable for further ad-hoc scripting
Advanced Operating Systems 2018/2019 48Debugging
Debugging during kernel development
Advanced Operating Systems 2018/2019 49Debugging
Debug printsDebug prints
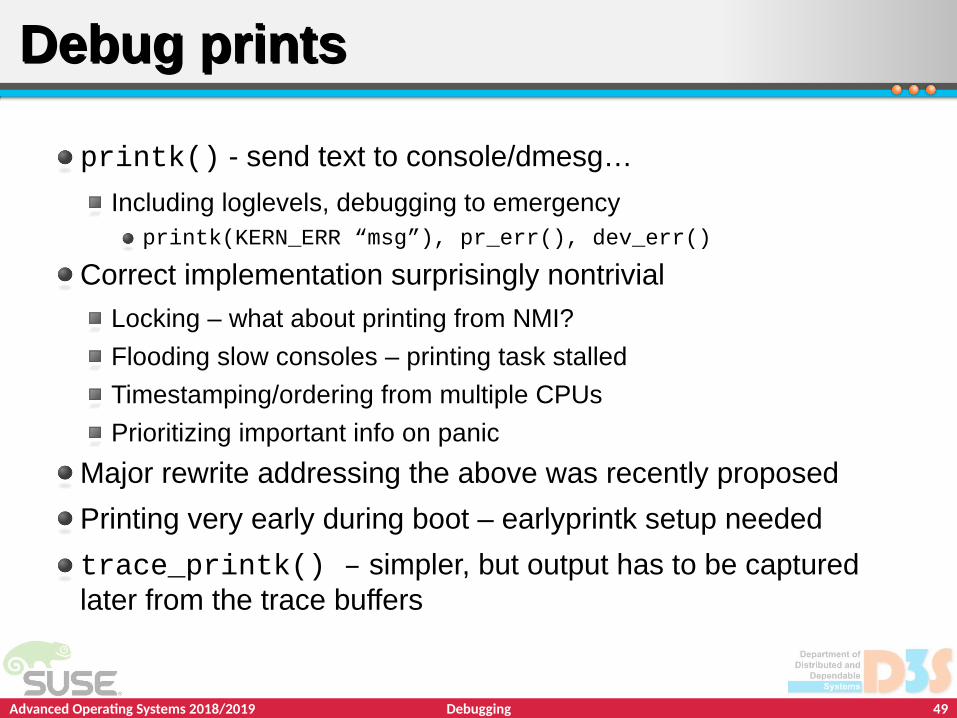
printk() - send text to console/dmesg…
Including loglevels, debugging to emergencyprintk(KERN_ERR “msg”), pr_err(), dev_err()
Correct implementation surprisingly nontrivial
Locking – what about printing from NMI?
Flooding slow consoles – printing task stalled
Timestamping/ordering from multiple CPUs
Prioritizing important info on panic
Major rewrite addressing the above was recently proposed
Printing very early during boot – earlyprintk setup needed
trace_printk() – simpler, but output has to be captured later from the trace buffers

Advanced Operating Systems 2018/2019 50Debugging
Dynamic debug printsDynamic debug prints
The lowest level messages are actually compiled out with pr_debug() and dev_dbg() wrappers
Unless #define DEBUG is active when compiling the file
Or CONFIG_DYNAMIC_DEBUG (dyndbg) is enabled
With dyndbg, debug messages can be switched on/off at runtime via simple query language
/sys/kernel/debug/dynamic_debug/control or boot/modprobe parameters
Module, file, function, line (range), format string granularity
Flags to include func/line/module/thread id when printing
Switching on/off uses live code patching (static keys) to minimize runtime impact (still, around 2% text size impact)
Ftrace uses the same mechanism for tracepoints

Advanced Operating Systems 2018/2019 51Debugging
Live kernel debugging - /proc/kcoreLive kernel debugging - /proc/kcore
/proc/kcore enabled by CONFIG_PROC_KCORE
Provides virtual ELF “core dump” file
Usable by gdb and crash for read-only inspection
Printing values of global variables
Inspecting structures like in a crash dump
/dev/mem – can be configured read/write
crash can set variables and modify structures
For full live debugging, we need also to control execution, which is trickier
Provide a server for gdb client that doesn't rely on the rest of the kernel functionality

Advanced Operating Systems 2018/2019 52Debugging
Live kernel debugging - kgdbLive kernel debugging - kgdb
kgdb was merged in 2.6.26 (2008)
Provides a server for remote gdb client
Over serial port – CONFIG_KGDB_SERIAL_CONSOLE
Over network using NETPOLL – not mainline (KDBoE)
Enable on server
Boot with kgdboc=ttyS0,115200
echo g > /proc/sysrq-trigger or kgdbwait boot param
Use from a client% gdb ./vmlinux
(gdb) set remotebaud 115200
(gdb) target remote /dev/ttyS0
Allows limited gdb debugging similar to a userspace program
Advanced Operating Systems 2018/2019 53Debugging
Live kernel debugging - kdbLive kernel debugging - kdb
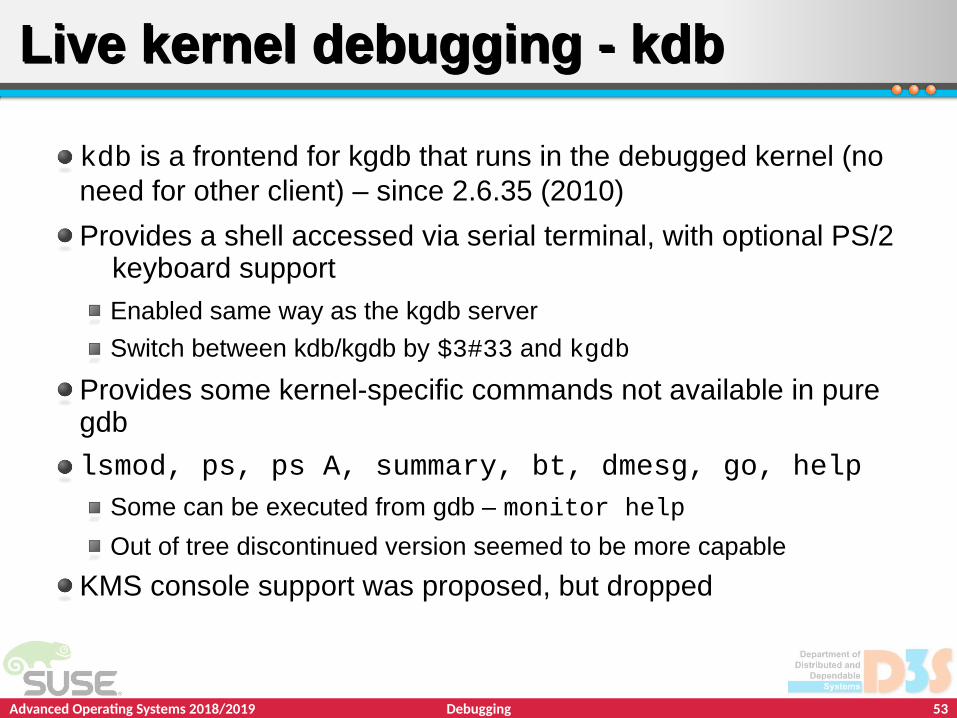
kdb is a frontend for kgdb that runs in the debugged kernel (no need for other client) – since 2.6.35 (2010)
Provides a shell accessed via serial terminal, with optional PS/2 keyboard support
Enabled same way as the kgdb server
Switch between kdb/kgdb by $3#33 and kgdb
Provides some kernel-specific commands not available in pure gdb
lsmod, ps, ps A, summary, bt, dmesg, go, helpSome can be executed from gdb – monitor help
Out of tree discontinued version seemed to be more capable
KMS console support was proposed, but dropped

Advanced Operating Systems 2018/2019 54Debugging
Live debugging - User-Mode Linux (UML)Live debugging - User-Mode Linux (UML)
Special pseudo-hardware architecture
Otherwise compatible with the target architecture
Running Linux kernel as a user space process
Originally a virtualization effort
Useful for debugging and kernel development
A plain standard gdb can be used to attach to the running kernel
Guest threads are threads of the UML processSlightly more complicated to follow processes
Advanced Operating Systems 2018/2019 55Debugging
Magic SysRq hot keysMagic SysRq hot keys
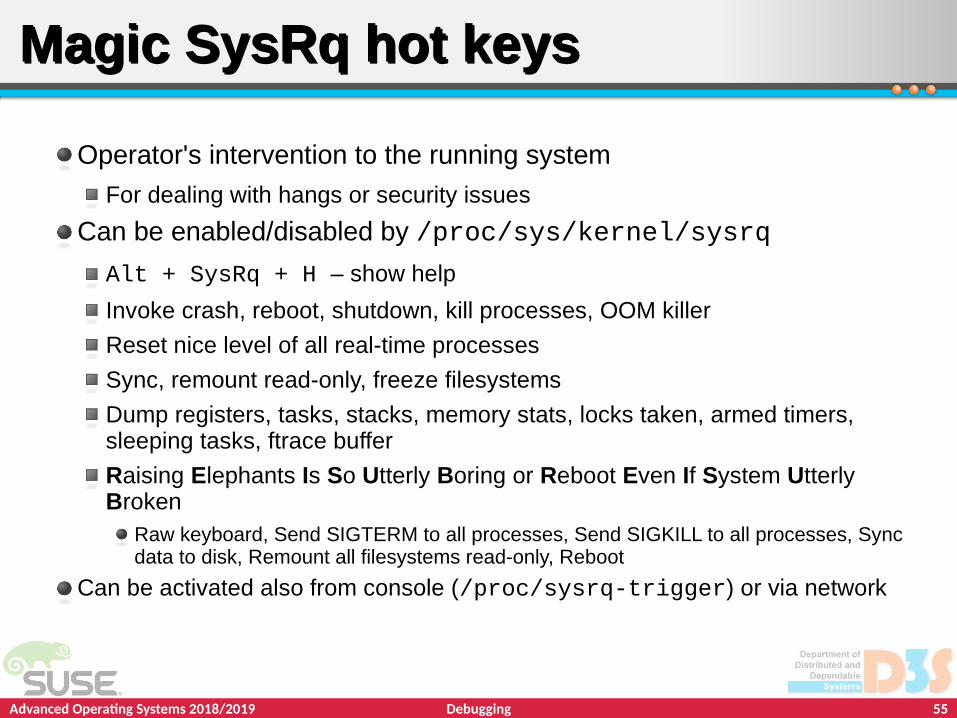
Operator's intervention to the running system
For dealing with hangs or security issues
Can be enabled/disabled by /proc/sys/kernel/sysrq
Alt + SysRq + H – show help
Invoke crash, reboot, shutdown, kill processes, OOM killer
Reset nice level of all real-time processes
Sync, remount read-only, freeze filesystems
Dump registers, tasks, stacks, memory stats, locks taken, armed timers, sleeping tasks, ftrace buffer
Raising Elephants Is So Utterly Boring or Reboot Even If System Utterly Broken
Raw keyboard, Send SIGTERM to all processes, Send SIGKILL to all processes, Sync data to disk, Remount all filesystems read-only, Reboot
Can be activated also from console (/proc/sysrq-trigger) or via network
Advanced Operating Systems 2018/2019 56Debugging
Finding (latent) bugs
Advanced Operating Systems 2018/2019 57Debugging
Kernel debugging config optionsKernel debugging config options
Kernel can be built with additional debugging options enabled
Extra checks that can catch errors sooner, or provide extra information, at the cost of CPU and/or memory overhead
Can also hide errors such as race conditions...
Many of them under “Kernel hacking” in make menuconfig
Others placed in the given subsystem/driver
Useful when hunting a particular bug, but mainly for regression testing

Advanced Operating Systems 2018/2019 58Debugging
Kernel debugging config optionsKernel debugging config options
DEBUG_LIST – catch some list misuses, poisoning
DEBUG_VM – enable VM_BUG_ON checks
PAGE_OWNER – track who allocated which pages in order to find a memory leak
DEBUG_PAGEALLOC – unmap (or poison) pages after they are freed
DEBUG_SLAB – detect some cases of double free, or use-after-free (by poisoning), buffer overflow (red-zoning)
SLUB_DEBUG variant can enable/disable debugging at boot
DEBUG_KMEMLEAK – detect leaks with a conservative garbage collection based algorithm
KASAN – Find out of bounds accesses and use-after-free bugs at the cost of 1/8 memory and 3x slower performance (~valgrind)
UBSAN – Find out presence of undefined behavior (per C standard)

Advanced Operating Systems 2018/2019 59Debugging
Kernel debugging config optionsKernel debugging config options
DEBUG_STACKOVERFLOW – check if random corruption involving struct thread_info is caused by too deep call chains
DEBUG_SPINLOCK and others for different locks – catch missing init, freeing of live locks, some deadlocks
LOCK_STAT – for lock contention, perf lock
PROVE_LOCKING - “lockdep” mechanism for online proving that deadlocks cannot happen and report that deadlock can occur before it actually does
Various subsystem specific options that enable both KERN_DEBUG printk()’s and extra checks

Advanced Operating Systems 2018/2019 60Debugging
Kernel FuzzingKernel Fuzzing
Try to trigger bugs by exposing the program to various inputs (i.e. chains of syscalls in the case of kernel)
trinity – mostly random syscalls and parameters, only avoids known invalid input (flags) to not waste time on it
syzkaller – unsupersized coverage-guided fuzzer from Google
For Akaros, FreeBSD, Fuchsia, gVisor, Linux, NetBSD, OpenBSD, Windows.
More efficient in finding corner-cases, but needs instrumentation
Often can generate a short reproducer with the report
syzbot - https://syzkaller.appspot.com/
CI for automated fuzzing, reporting and tracking of found bugs
Linux: 1173 fixed, 466 open
Often used with debug options enabled, such as KASAN, UBSAN, lockdep, and more being developed (KMSAN...)

Advanced Operating Systems 2018/2019 61Debugging
Kernel testing (CI) initiativesKernel testing (CI) initiatives
Developers can’t possibly test their code in all possible architectures and configurations
Automated testing and reporting very useful for development (linux-next) and stabilization (rc versions)
LKP (Linux Kernel Performance) a.k.a. 0-day bot by Intel – tests linux-next, developer git trees, patches on mailing lists, replies with bug reports
kernelci.org by Linaro – for various ARM SoCs

Advanced Operating Systems 2018/2019 62Debugging
Linux Kernel Static AnalysisLinux Kernel Static Analysis
Sparse – semantic checker for types and locks relying on attributes
Types – bitwise, kernel, user, iomem
Locks – acquire, release, must_hold
Smatch – built upon sparse, can report e.g. missing NULL checks, array overflow
Coccinelle – allows finding code matching a pattern as well as changing it
Coverity – proprietary static analysis tool, scans Linux for free, but limited access to results