liquefaction behavior and post-liquefaction volumetric
TRANSCRIPT
Digest 2016, December 2016, 2013-2037
Liquefaction Behavior and Post-Liquefaction Volumetric Strain Properties of Low Plasticity Silt Sand Mixtures †1 Eyyüb KARAKAN1 Selim ALTUN2 ABSTRACT
In this paper, the liquefaction behavior of silt-sand mixtures and post-liquefaction volumetric deformation properties were investigated. The study was performed on silt sand mixtures which were obtained during a foundation excavation in Bayraklı region of Izmir city in Turkey. In the study, undrained cyclic triaxial tests were conducted on samples having 8 different silt contents (0, 5, 10, 20, 40, 60, 80, 100%) in conformity with JGS 0542-2000 standard in order to reveal the effect of silt content on the liquefaction resistance of the samples. At the end of tests, output water amounts were measured with the help of a burette by opening the drainage valves in order to determine the volumetric deformation properties of the samples. In the liquefaction experiments, along with the increased silt contents the liquefaction criteria were determined by the void ratio concept between the coarse and fine grains instead of the relative density concept. With this perspective, threshold silt content in the liquefaction resistance of silt sand mixtures was also determined. The post-liquefaction volumetric deformation behavior of the samples was interpreted depending on the silt content.
Keywords: Silt sand mixtures, liquefaction, volumetric deformation, intergranular - interfine void ratios.
1. INTRODUCTION
Even the behavior of clean sands under cyclic loading has been investigated extensively for fifty years, an interest has risen on the cyclic behavior of soils with fines, especially silty sands, in the last two decades. The literature on the liquefaction phenomenon indicated that this type of soil was highly susceptible to liquefaction compared to clean sand. However, the results published in the literature concerning the effect of fines content on the liquefaction resistance of silty sands are still contradictory. Among the studies which were conducted in the field considering the liquefaction potential of sands with fines, it was seen that the presence of fines increased the liquefaction resistance [1, 2]. On the opposite side, the results of laboratory experiments indicated that a different tendency was shown when fines content was lower than 30% [3, 4]. While Koester [4] claimed that the liquefaction
1 Kilis 7 Aralık University, Kilis, Turkey - [email protected] 2 Ege University, İzmir, Turkey - [email protected]
† Published in Teknik Dergi Vol. 27, No. 4 October 2016, pp: 7593-7617
Liquefaction Behavior and Post-Liquefaction Volumetric Strain Properties ...
2014
behavior was affected more significantly by the fines content rather than the plasticity index of the soil, Ishihara [5] and Prakash and Guo [6] reported that the fine grained soils with high plasticity may be less susceptible to liquefaction. Finn et al. [7] remarked that researchers achieved varying results while investigating the effect of fines content on the liquefaction resistance as different criteria were accepted by them.
The effect of fines content on the liquefaction resistance depends on the particle diameter. The results of laboratory experiments showed that the voids between the sand particles had no effect on the soil resistance in the soils with fines content less than 30%. This result decreases the global void ratio (e0). Therefore, liquefaction resistance decreases in the soils at the same global void ratio with the increment of fines content and the sand skeleton (eSK) at different intergranular void ratios shows more dominant behavior [8, 9, 10, 11]. In the same way, if the fine particles are more dominant in the sand matrix then general behavior largely depends on the fines content. Amini and Qi [12] stated that the cyclic resistances of silty sand mixtures steadily increased as the fines content increased but Belkhatir et al. [13] and Stamatopoulos [14] stated that the cyclic resistances of silty sand mixtures would decrease along with the increase of fines content. On the other side, Koester [4]; Papadopoulou and Tika, [15]; Polito and Martin, [8]; Xenaki and Athanasopoulos, [16] observed that the increase of fines content first decreased and then increased the cyclic resistances of silty sand mixtures up to a threshold fines content value.
In the silty sand mixtures, the threshold silt content value is a significant parameter which determines the transition from sand to silt. This threshold value varies depending on the sand type, fines type and the global void ratio. Therefore, the effect of silt content on liquefaction resistance of silt sand mixtures may yield to different results if the global void ratio is used. Especially, Troncoso [4] determined that the liquefaction resistance decreased as the fines content increased up to 30%. On the other side, Xenaki and Athanasopoulos [16] concluded that critical fines content was 44%. In the results of work reported by Polito [17], it was shown that the threshold silt content value of non-plastic silt sand mixtures was between of 25<FCth<45 where FCth denotes the threshold value of silt content.
The effect of fines content is a significant parameter on the behavior of silt sand mixtures under cyclic loadings. However, there is a controversy on the published literature concerning the effect of fines content on the liquefaction of soils. If the fines content is remarkably low, the fines in the soil matrix remain passive and float in the voids. Therefore, using new index parameters such as intergranular and interfine void ratios are very significant in terms of assessing the shear strength of silt sand mixtures [9, 18]. Consequently, there is a need for estimating the effect of two sub-matrices namely as coarse and fine matrices on the strain transformation behavior of silt sand mixtures.
The main objective of this study is to determine the effect of fines content on the dynamic behavior of natural silty sand collected from a foundation excavation in Bayraklı (Izmir, Turkey) and to evaluate the role of intergranular-interfine void ratios in the liquefaction resistance of silt sand mixtures. The second objective of this study is to reveal the volumetric deformation properties of silt sand mixtures considering the silt content of the mixture by measuring the volume of water collected in the burette at the end of dynamic cyclic triaxial tests. The results of undrained cyclic triaxial compression tests conducted on the silt sand mixtures with various fines content were presented and discussed within this scope.
Eyyüb KARAKAN, Selim ALTUN
2015
1.1. Threshold Fines Content Ratio
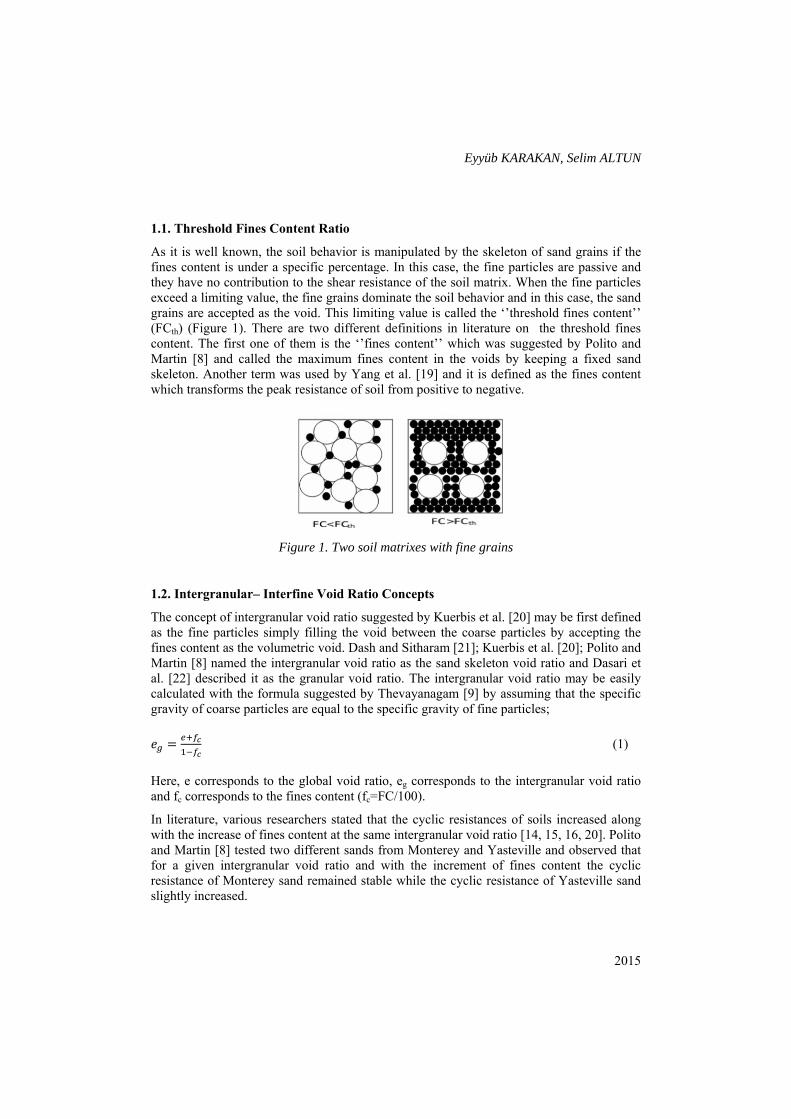
As it is well known, the soil behavior is manipulated by the skeleton of sand grains if the fines content is under a specific percentage. In this case, the fine particles are passive and they have no contribution to the shear resistance of the soil matrix. When the fine particles exceed a limiting value, the fine grains dominate the soil behavior and in this case, the sand grains are accepted as the void. This limiting value is called the ‘’threshold fines content’’ (FCth) (Figure 1). There are two different definitions in literature on the threshold fines content. The first one of them is the ‘’fines content’’ which was suggested by Polito and Martin [8] and called the maximum fines content in the voids by keeping a fixed sand skeleton. Another term was used by Yang et al. [19] and it is defined as the fines content which transforms the peak resistance of soil from positive to negative.
Figure 1. Two soil matrixes with fine grains
1.2. Intergranular– Interfine Void Ratio Concepts
The concept of intergranular void ratio suggested by Kuerbis et al. [20] may be first defined as the fine particles simply filling the void between the coarse particles by accepting the fines content as the volumetric void. Dash and Sitharam [21]; Kuerbis et al. [20]; Polito and Martin [8] named the intergranular void ratio as the sand skeleton void ratio and Dasari et al. [22] described it as the granular void ratio. The intergranular void ratio may be easily calculated with the formula suggested by Thevayanagam [9] by assuming that the specific gravity of coarse particles are equal to the specific gravity of fine particles; = (1)
Here, e corresponds to the global void ratio, eg corresponds to the intergranular void ratio and fc corresponds to the fines content (fc=FC/100).
In literature, various researchers stated that the cyclic resistances of soils increased along with the increase of fines content at the same intergranular void ratio [14, 15, 16, 20]. Polito and Martin [8] tested two different sands from Monterey and Yasteville and observed that for a given intergranular void ratio and with the increment of fines content the cyclic resistance of Monterey sand remained stable while the cyclic resistance of Yasteville sand slightly increased.
Liquefaction Behavior and Post-Liquefaction Volumetric Strain Properties ...
2016
The second explanation may be defined as the interfine void ratio. The sand grains are accepted to exist separated from the mixture if they contain a high amount of fine particles and in this case, the interfine void ratio may be used as a parameter. = (2)
2. TESTING PROCEDURE
2.1. Materials Used
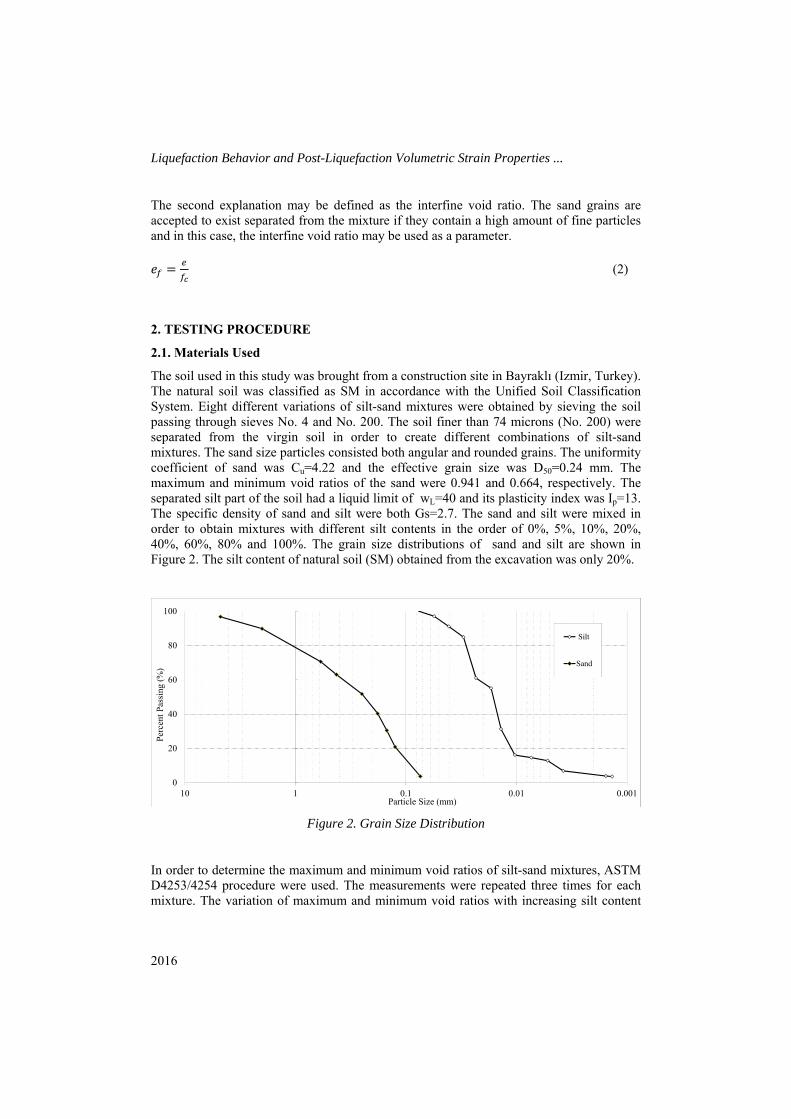
The soil used in this study was brought from a construction site in Bayraklı (Izmir, Turkey). The natural soil was classified as SM in accordance with the Unified Soil Classification System. Eight different variations of silt-sand mixtures were obtained by sieving the soil passing through sieves No. 4 and No. 200. The soil finer than 74 microns (No. 200) were separated from the virgin soil in order to create different combinations of silt-sand mixtures. The sand size particles consisted both angular and rounded grains. The uniformity coefficient of sand was Cu=4.22 and the effective grain size was D50=0.24 mm. The maximum and minimum void ratios of the sand were 0.941 and 0.664, respectively. The separated silt part of the soil had a liquid limit of wL=40 and its plasticity index was Ip=13. The specific density of sand and silt were both Gs=2.7. The sand and silt were mixed in order to obtain mixtures with different silt contents in the order of 0%, 5%, 10%, 20%, 40%, 60%, 80% and 100%. The grain size distributions of sand and silt are shown in Figure 2. The silt content of natural soil (SM) obtained from the excavation was only 20%.
Figure 2. Grain Size Distribution
In order to determine the maximum and minimum void ratios of silt-sand mixtures, ASTM D4253/4254 procedure were used. The measurements were repeated three times for each mixture. The variation of maximum and minimum void ratios with increasing silt content
0
20
40
60
80
100
0.0010.010.1110
Perc
ent P
assin
g (%
)
Particle Size (mm)
Silt
Sand
Eyyüb KARAKAN, Selim ALTUN
2017
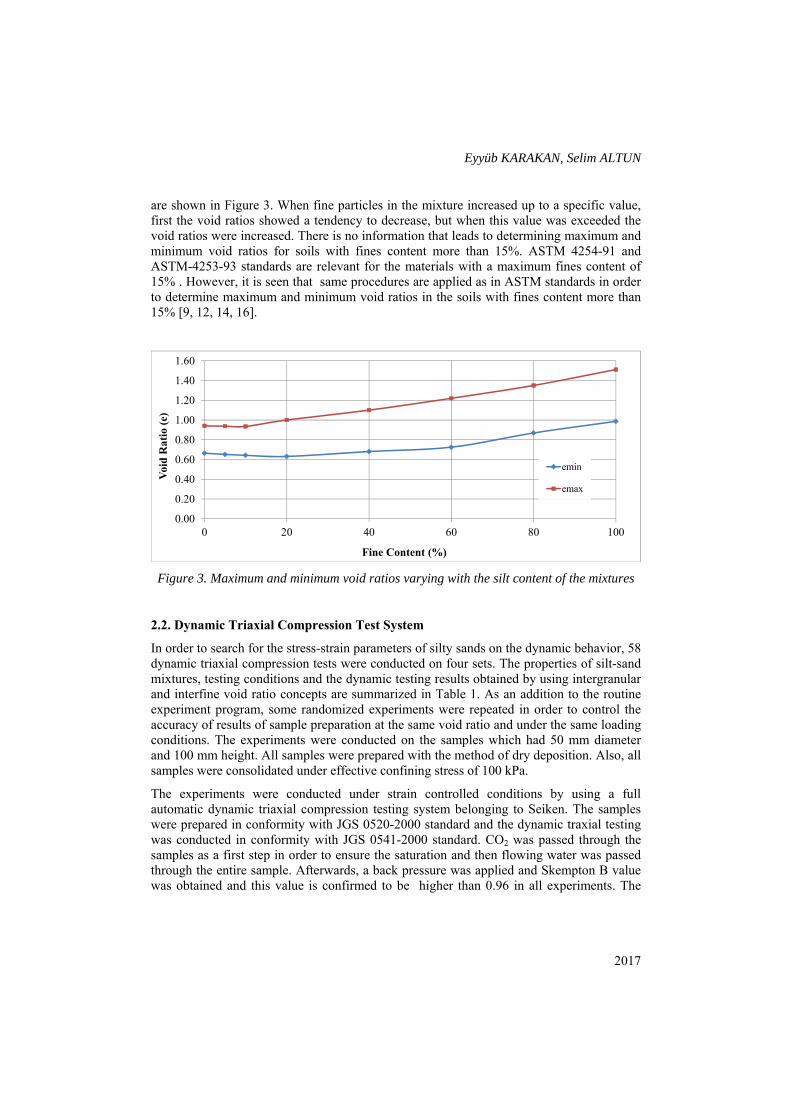
are shown in Figure 3. When fine particles in the mixture increased up to a specific value, first the void ratios showed a tendency to decrease, but when this value was exceeded the void ratios were increased. There is no information that leads to determining maximum and minimum void ratios for soils with fines content more than 15%. ASTM 4254-91 and ASTM-4253-93 standards are relevant for the materials with a maximum fines content of 15% . However, it is seen that same procedures are applied as in ASTM standards in order to determine maximum and minimum void ratios in the soils with fines content more than 15% [9, 12, 14, 16].
Figure 3. Maximum and minimum void ratios varying with the silt content of the mixtures
2.2. Dynamic Triaxial Compression Test System
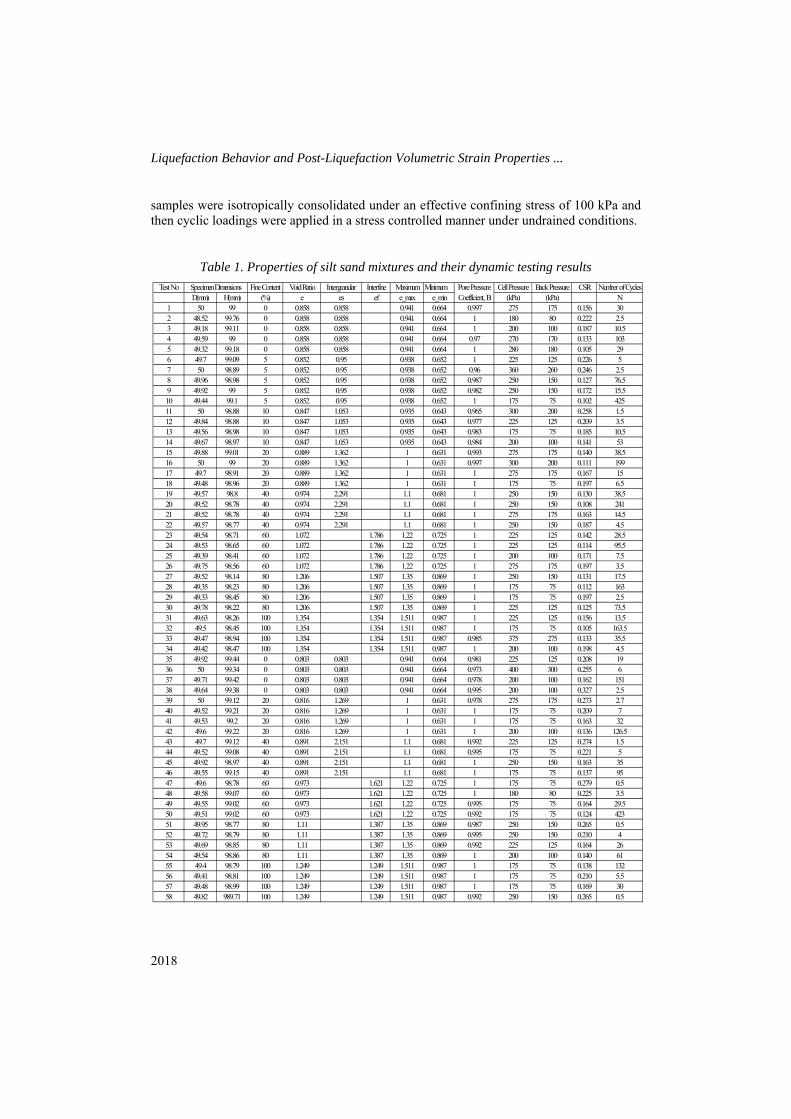
In order to search for the stress-strain parameters of silty sands on the dynamic behavior, 58 dynamic triaxial compression tests were conducted on four sets. The properties of silt-sand mixtures, testing conditions and the dynamic testing results obtained by using intergranular and interfine void ratio concepts are summarized in Table 1. As an addition to the routine experiment program, some randomized experiments were repeated in order to control the accuracy of results of sample preparation at the same void ratio and under the same loading conditions. The experiments were conducted on the samples which had 50 mm diameter and 100 mm height. All samples were prepared with the method of dry deposition. Also, all samples were consolidated under effective confining stress of 100 kPa.
The experiments were conducted under strain controlled conditions by using a full automatic dynamic triaxial compression testing system belonging to Seiken. The samples were prepared in conformity with JGS 0520-2000 standard and the dynamic traxial testing was conducted in conformity with JGS 0541-2000 standard. CO2 was passed through the samples as a first step in order to ensure the saturation and then flowing water was passed through the entire sample. Afterwards, a back pressure was applied and Skempton B value was obtained and this value is confirmed to be higher than 0.96 in all experiments. The
0.00
0.20
0.40
0.60
0.80
1.00
1.20
1.40
1.60
0 20 40 60 80 100
Void
Rat
io (e
)
Fine Content (%)
emin
emax
Liquefaction Behavior and Post-Liquefaction Volumetric Strain Properties ...
2018
samples were isotropically consolidated under an effective confining stress of 100 kPa and then cyclic loadings were applied in a stress controlled manner under undrained conditions.
Table 1. Properties of silt sand mixtures and their dynamic testing results
Test No Fine Content Void Ratio Intergranular Interfine Maximum Minimum Cell Pressure Back Pressure CSR Number of CyclesD(mm) H(mm) (%) e es ef e_max e_min (kPa) (kPa) N
1 50 99 0 0.858 0.858 0.941 0.664 0.997 275 175 0.156 302 48.52 99.76 0 0.858 0.858 0.941 0.664 1 180 80 0.222 2.53 49.18 99.11 0 0.858 0.858 0.941 0.664 1 200 100 0.187 10.54 49.59 99 0 0.858 0.858 0.941 0.664 0.97 270 170 0.133 1035 49.32 99.18 0 0.858 0.858 0.941 0.664 1 280 180 0.105 296 49.7 99.09 5 0.852 0.95 0.938 0.652 1 225 125 0.226 57 50 98.89 5 0.852 0.95 0.938 0.652 0.96 360 260 0.246 2.58 49.96 98.98 5 0.852 0.95 0.938 0.652 0.987 250 150 0.127 76.59 49.92 99 5 0.852 0.95 0.938 0.652 0.982 250 150 0.172 15.510 49.44 99.1 5 0.852 0.95 0.938 0.652 1 175 75 0.102 42511 50 98.88 10 0.847 1.053 0.935 0.643 0.965 300 200 0.258 1.512 49.84 98.88 10 0.847 1.053 0.935 0.643 0.977 225 125 0.209 3.513 49.56 98.98 10 0.847 1.053 0.935 0.643 0.983 175 75 0.185 10.514 49.67 98.97 10 0.847 1.053 0.935 0.643 0.984 200 100 0.141 5315 49.88 99.01 20 0.889 1.362 1 0.631 0.993 275 175 0.140 38.516 50 99 20 0.889 1.362 1 0.631 0.997 300 200 0.111 19917 49.7 98.91 20 0.889 1.362 1 0.631 1 275 175 0.167 1518 49.48 98.96 20 0.889 1.362 1 0.631 1 175 75 0.197 6.519 49.57 98.8 40 0.974 2.291 1.1 0.681 1 250 150 0.130 38.520 49.52 98.78 40 0.974 2.291 1.1 0.681 1 250 150 0.108 24121 49.52 98.78 40 0.974 2.291 1.1 0.681 1 275 175 0.163 14.522 49.57 98.77 40 0.974 2.291 1.1 0.681 1 250 150 0.187 4.523 49.54 98.71 60 1.072 1.786 1.22 0.725 1 225 125 0.142 28.524 49.53 98.65 60 1.072 1.786 1.22 0.725 1 225 125 0.114 95.525 49.39 98.41 60 1.072 1.786 1.22 0.725 1 200 100 0.171 7.526 49.75 98.56 60 1.072 1.786 1.22 0.725 1 275 175 0.197 3.527 49.52 98.14 80 1.206 1.507 1.35 0.869 1 250 150 0.131 17.528 49.35 98.23 80 1.206 1.507 1.35 0.869 1 175 75 0.112 16329 49.33 98.45 80 1.206 1.507 1.35 0.869 1 175 75 0.197 2.530 49.78 98.22 80 1.206 1.507 1.35 0.869 1 225 125 0.125 73.531 49.63 98.26 100 1.354 1.354 1.511 0.987 1 225 125 0.156 13.532 49.5 98.45 100 1.354 1.354 1.511 0.987 1 175 75 0.105 163.533 49.47 98.94 100 1.354 1.354 1.511 0.987 0.985 375 275 0.133 35.534 49.42 98.47 100 1.354 1.354 1.511 0.987 1 200 100 0.198 4.535 49.92 99.44 0 0.803 0.803 0.941 0.664 0.981 225 125 0.208 1936 50 99.34 0 0.803 0.803 0.941 0.664 0.973 400 300 0.255 637 49.71 99.42 0 0.803 0.803 0.941 0.664 0.978 200 100 0.162 15138 49.64 99.38 0 0.803 0.803 0.941 0.664 0.995 200 100 0.327 2.539 50 99.12 20 0.816 1.269 1 0.631 0.978 275 175 0.273 2.740 49.52 99.21 20 0.816 1.269 1 0.631 1 175 75 0.209 741 49.53 99.2 20 0.816 1.269 1 0.631 1 175 75 0.163 3242 49.6 99.22 20 0.816 1.269 1 0.631 1 200 100 0.136 126.543 49.7 99.12 40 0.891 2.151 1.1 0.681 0.992 225 125 0.274 1.544 49.52 99.08 40 0.891 2.151 1.1 0.681 0.995 175 75 0.221 545 49.92 98.97 40 0.891 2.151 1.1 0.681 1 250 150 0.163 3546 49.55 99.15 40 0.891 2.151 1.1 0.681 1 175 75 0.137 9547 49.6 98.78 60 0.973 1.621 1.22 0.725 1 175 75 0.279 0.548 49.58 99.07 60 0.973 1.621 1.22 0.725 1 180 80 0.225 3.549 49.55 99.02 60 0.973 1.621 1.22 0.725 0.995 175 75 0.164 29.550 49.51 99.02 60 0.973 1.621 1.22 0.725 0.992 175 75 0.124 42351 49.95 98.77 80 1.11 1.387 1.35 0.869 0.987 250 150 0.265 0.552 49.72 98.79 80 1.11 1.387 1.35 0.869 0.995 250 150 0.210 453 49.69 98.85 80 1.11 1.387 1.35 0.869 0.992 225 125 0.164 2654 49.54 98.86 80 1.11 1.387 1.35 0.869 1 200 100 0.140 6155 49.4 98.79 100 1.249 1.249 1.511 0.987 1 175 75 0.138 13256 49.41 98.81 100 1.249 1.249 1.511 0.987 1 175 75 0.210 5.557 49.48 98.99 100 1.249 1.249 1.511 0.987 1 175 75 0.169 3058 49.82 989.71 100 1.249 1.249 1.511 0.987 0.992 250 150 0.265 0.5
Specimen Dimensions Pore Pressure Coefficient, B
Eyyüb KARAKAN, Selim ALTUN
2019
(a)
(b)
(c)
(d)
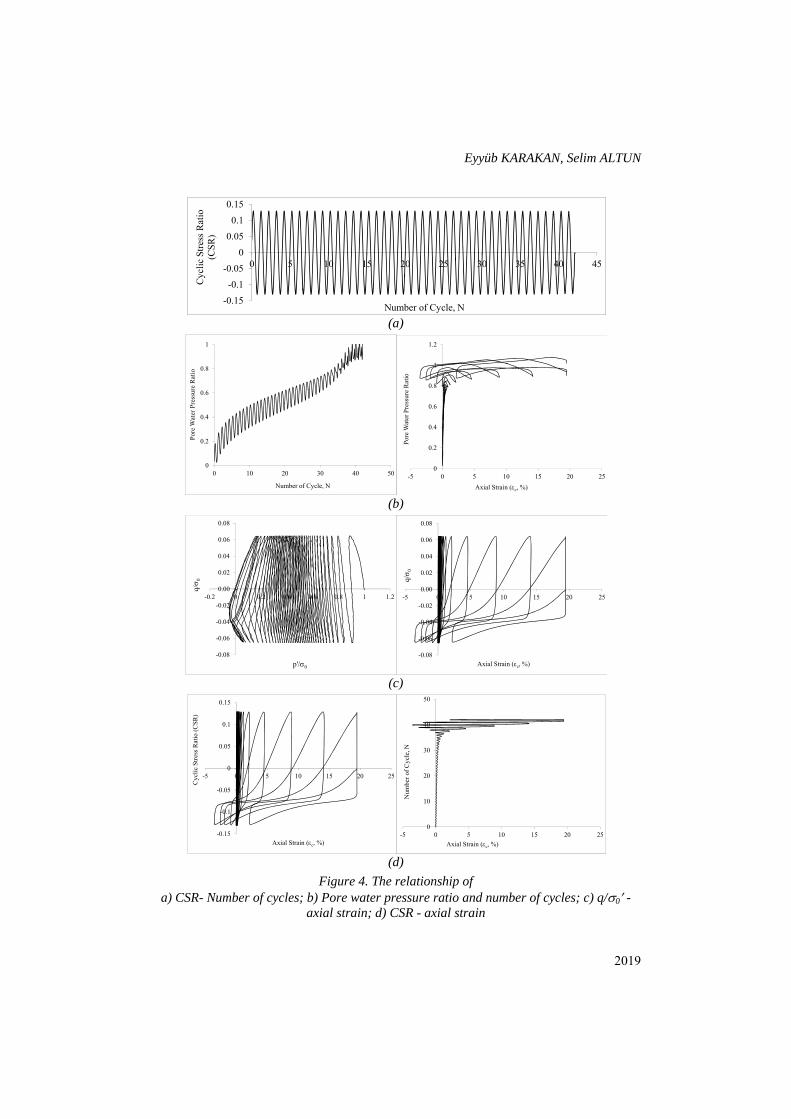
Figure 4. The relationship of a) CSR- Number of cycles; b) Pore water pressure ratio and number of cycles; c) q/0 -
axial strain; d) CSR - axial strain
-0.15-0.1
-0.050
0.050.1
0.15
0 5 10 15 20 25 30 35 40 45
Cycl
ic S
tress
Rat
io
(CSR
)
Number of Cycle, N
0
0.2
0.4
0.6
0.8
1
0 10 20 30 40 50
Pore
Wat
er P
ress
ure
Ratio
Number of Cycle, N
0
0.2
0.4
0.6
0.8
1
1.2
-5 0 5 10 15 20 25
Pore
Wat
er P
ress
ure
Rat
io
Axial Strain (c, %)
-0.08
-0.06
-0.04
-0.02
0.00
0.02
0.04
0.06
0.08
-0.2 0 0.2 0.4 0.6 0.8 1 1.2
q/ 0
p'/0
-0.08
-0.06
-0.04
-0.02
0.00
0.02
0.04
0.06
0.08
-5 0 5 10 15 20 25
q/ 0
Axial Strain (c, %)
-0.15
-0.1
-0.05
0
0.05
0.1
0.15
-5 0 5 10 15 20 25
Cycl
ic S
tress
Rat
io (C
SR)
Axial Strain (c, %)
0
10
20
30
40
50
-5 0 5 10 15 20 25
Num
ber o
f Cyc
le, N
Axial Strain (c, %)
Liquefaction Behavior and Post-Liquefaction Volumetric Strain Properties ...
2020
The cyclic loadings were recorded continuously and excess pore water pressure, cyclic axial strain and cyclic stress ratio were obtained for each sample. Two criteria are taken in to account in JGS 0542-2000 standard in order to define the liquefaction stage. If the amplitude of cyclic loading is high, the number of cycles to attain liquefaction is accepted as the maximum excess pore water pressure required in order to reach to 95% of effective confining stress otherwise, the number of cycles to liquefaction is determined when 5% of double amplitude of axial strain was achieved in the sample. Typical test results which were obtained from a dynamic triaxial compression test conducted on silt-sand mixture is shown in Figure 4 (a)-(d). The cyclic deviator stress ratio applied to the sample versus the number of cycles is shown in Figure 4a. 42 cycles which involved a continuous sequence of compression and expansion were continuously applied to simulate dynamic conditions. The severity of cyclic loading was changed in order to be able to produce different cyclic stress ratios (CSR) and their corresponding number of cycles to liquefaction. In this study, the number of cycles applied varied between 1 and 1000 cycles. In Figure 4b, the variation of pore water pressure ratio with the number of cycles and the variation of the pore water pressure ratio with axial strain are shown. The pore water pressure ratio had continuously increased with the number of cycles applied to the samples. In Figure 4b, the rate of normalized stress are at the pressure side due to that cyclic axial strain was positive (Figure 4c). The normalized stress path is shown in Figure 4c. While the cyclic stress ratio applied corresponded to low deformation levels, the samples maintained their stability after that the soil liquefied along with the increased number of cycles under enlarged deformations. After 35 cycles, the pore water pressure ratio reached to 90% and after this point the cyclic axial strain changed considerably (Figure 4d).
3. DYNAMIC TRIAXIAL COMPRESSION TEST RESULTS
3.1. Liquefaction Behavior of Silt Sand Mixtures Under Undrained Cyclic Loading Condition
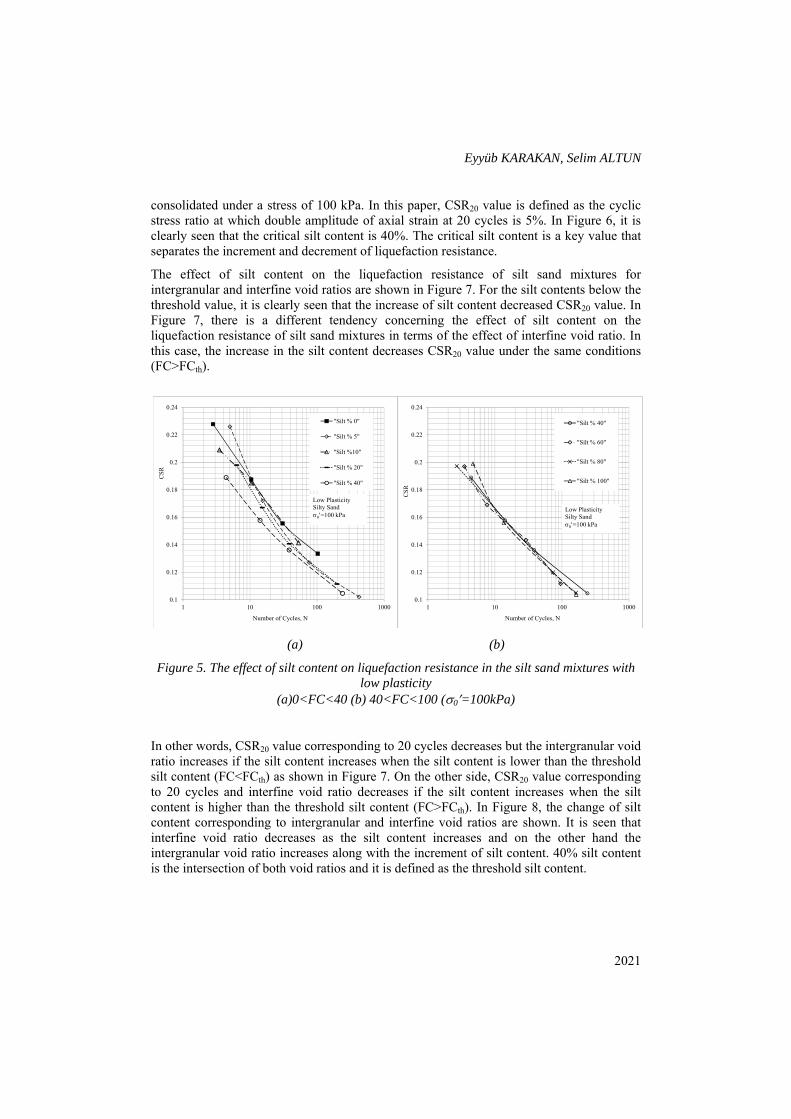
In this part, the effect of silt content, global void ratio concept, intergranular-interfine void ratio concepts on the liquefaction resistance of the silt sand mixtures are discussed. In order to understand the effect of void ratio depending on the cyclic axial strain ratio (CSR), a large number of dynamic triaxial tests were conducted. In this paper, the liquefaction resistances of silt sand mixtures are shown in Figure 5 as CSR-N curves. Figure 5 shows the effect of silt content on the liquefaction resistances of silt sand mixtures for a constant value of global void ratio. It was seen that the liquefaction resistance decreased along with the increase of silt content up to 40% in the silt sand mixtures with low plasticity for a constant value of global void ratio. This value is defined as the threshold silt content (FCth). If the silt content is above 40%, the tendency becomes reversed and the liquefaction resistance increases (Figure 5a, 5b).
It was determined that the liquefaction resistance decreased in the low plasticity silty sands along with the increase of silt content up to 40% for the a stable value of global void ratio. After this critical value the framework offered by Tevayanagam [9] contradicts with the threshold value, this tendency reverse and the liquefaction resistance increases as the silt content increases. The cyclic stress ratios (CSR20) corresponding to 20 cycles of loading are obtained from Figure 5&6 for the samples which had different silt contents and
Eyyüb KARAKAN, Selim ALTUN
2021
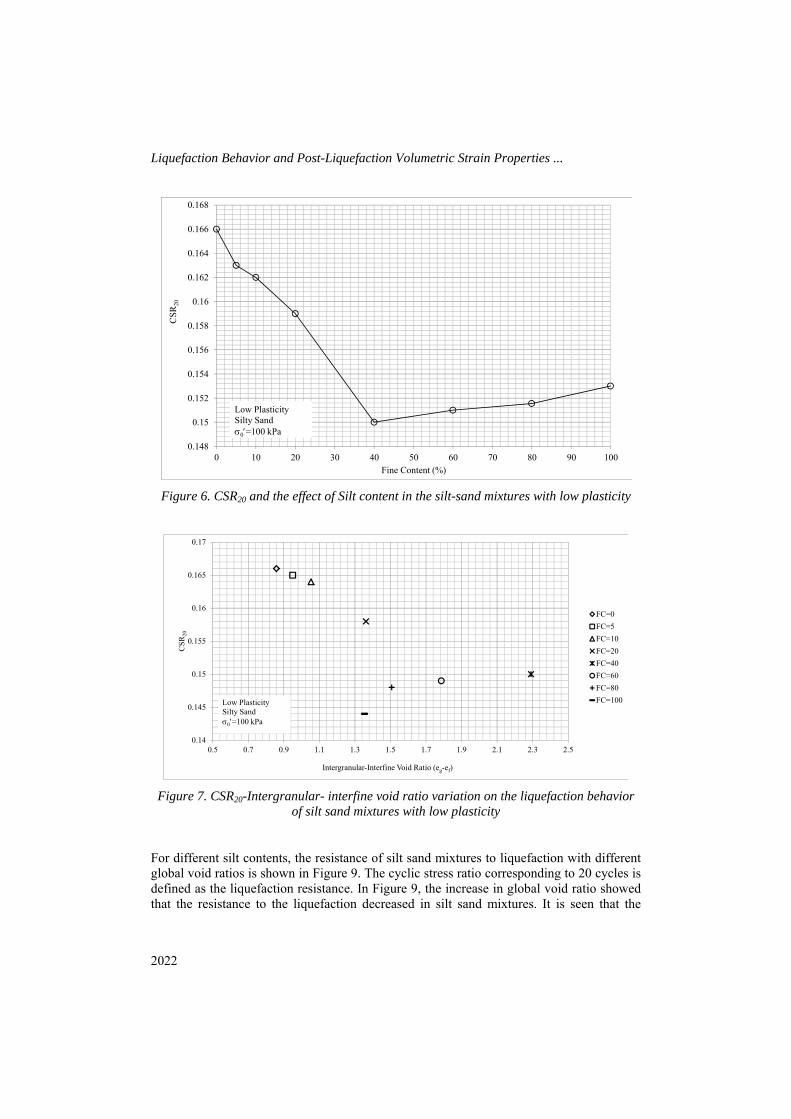
consolidated under a stress of 100 kPa. In this paper, CSR20 value is defined as the cyclic stress ratio at which double amplitude of axial strain at 20 cycles is 5%. In Figure 6, it is clearly seen that the critical silt content is 40%. The critical silt content is a key value that separates the increment and decrement of liquefaction resistance.
The effect of silt content on the liquefaction resistance of silt sand mixtures for intergranular and interfine void ratios are shown in Figure 7. For the silt contents below the threshold value, it is clearly seen that the increase of silt content decreased CSR20 value. In Figure 7, there is a different tendency concerning the effect of silt content on the liquefaction resistance of silt sand mixtures in terms of the effect of interfine void ratio. In this case, the increase in the silt content decreases CSR20 value under the same conditions (FC>FCth).
(a) (b)
Figure 5. The effect of silt content on liquefaction resistance in the silt sand mixtures with low plasticity
(a)0<FC<40 (b) 40<FC<100 (0=100kPa)
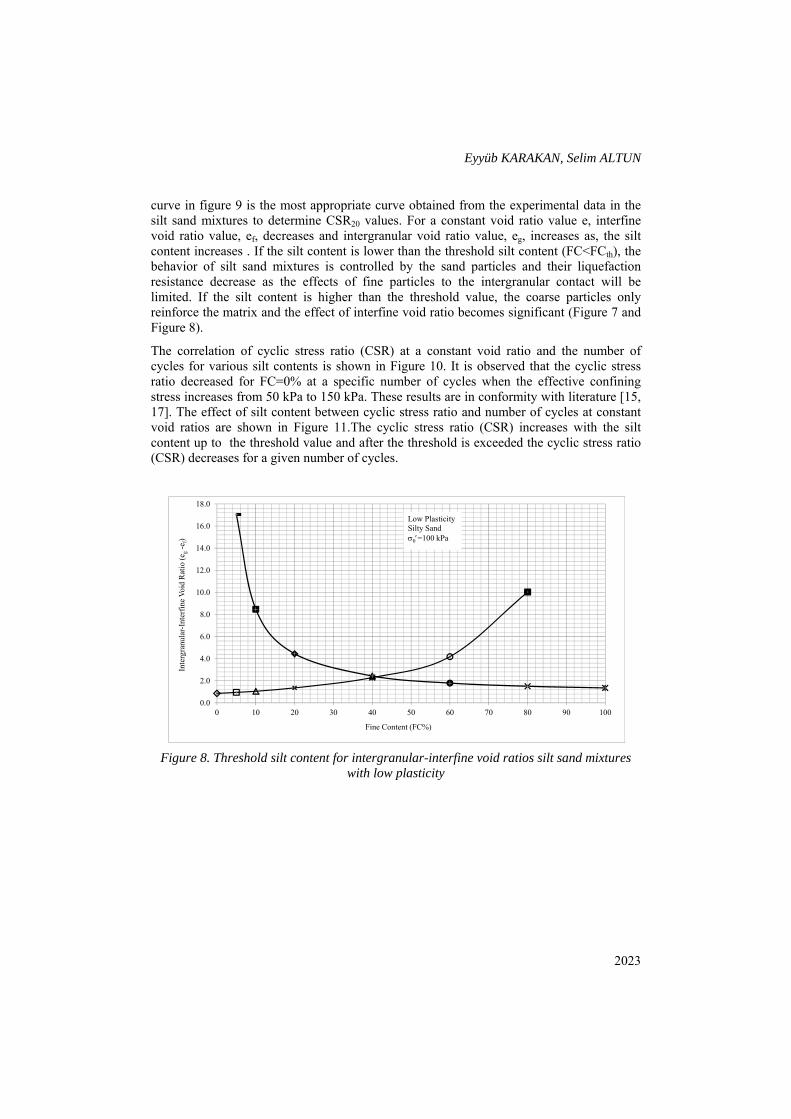
In other words, CSR20 value corresponding to 20 cycles decreases but the intergranular void ratio increases if the silt content increases when the silt content is lower than the threshold silt content (FC<FCth) as shown in Figure 7. On the other side, CSR20 value corresponding to 20 cycles and interfine void ratio decreases if the silt content increases when the silt content is higher than the threshold silt content (FC>FCth). In Figure 8, the change of silt content corresponding to intergranular and interfine void ratios are shown. It is seen that interfine void ratio decreases as the silt content increases and on the other hand the intergranular void ratio increases along with the increment of silt content. 40% silt content is the intersection of both void ratios and it is defined as the threshold silt content.
0.1
0.12
0.14
0.16
0.18
0.2
0.22
0.24
1 10 100 1000
CSR
Number of Cycles, N
"Silt % 0"
"Silt % 5"
"Silt %10"
"Silt % 20"
"Silt % 40"
Low Plasticity Silty Sand0=100 kPa
0.1
0.12
0.14
0.16
0.18
0.2
0.22
0.24
1 10 100 1000
CSR
Number of Cycles, N
"Silt % 40"
"Silt % 60"
"Silt % 80"
"Silt % 100"
Low PlasticitySilty Sand0=100 kPa
Liquefaction Behavior and Post-Liquefaction Volumetric Strain Properties ...
2022
Figure 6. CSR20 and the effect of Silt content in the silt-sand mixtures with low plasticity
Figure 7. CSR20-Intergranular- interfine void ratio variation on the liquefaction behavior
of silt sand mixtures with low plasticity
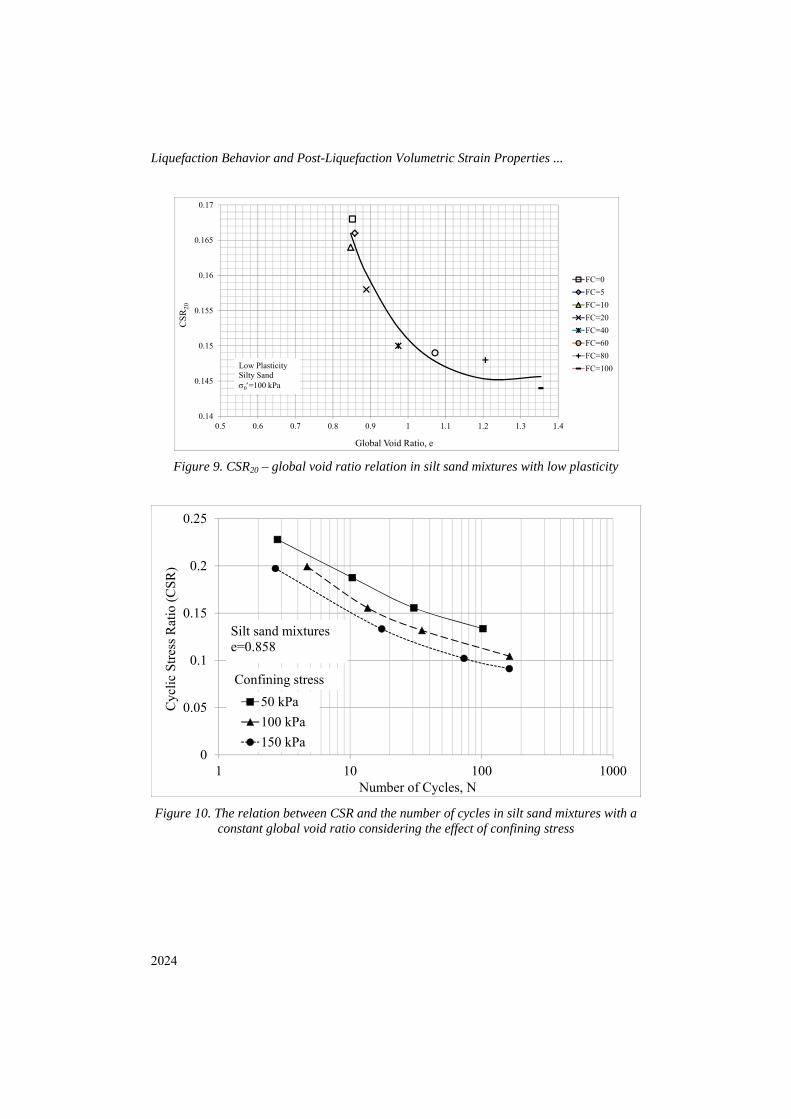
For different silt contents, the resistance of silt sand mixtures to liquefaction with different global void ratios is shown in Figure 9. The cyclic stress ratio corresponding to 20 cycles is defined as the liquefaction resistance. In Figure 9, the increase in global void ratio showed that the resistance to the liquefaction decreased in silt sand mixtures. It is seen that the
0.148
0.15
0.152
0.154
0.156
0.158
0.16
0.162
0.164
0.166
0.168
0 10 20 30 40 50 60 70 80 90 100
CSR 2
0
Fine Content (%)
Low PlasticitySilty Sand0=100 kPa
0.14
0.145
0.15
0.155
0.16
0.165
0.17
0.5 0.7 0.9 1.1 1.3 1.5 1.7 1.9 2.1 2.3 2.5
CSR 2
0
Intergranular-Interfine Void Ratio (eg-ef)
FC=0FC=5FC=10FC=20FC=40FC=60FC=80FC=100Low Plasticity
Silty Sand0=100 kPa
Eyyüb KARAKAN, Selim ALTUN
2023
curve in figure 9 is the most appropriate curve obtained from the experimental data in the silt sand mixtures to determine CSR20 values. For a constant void ratio value e, interfine void ratio value, ef, decreases and intergranular void ratio value, eg, increases as, the silt content increases . If the silt content is lower than the threshold silt content (FC<FCth), the behavior of silt sand mixtures is controlled by the sand particles and their liquefaction resistance decrease as the effects of fine particles to the intergranular contact will be limited. If the silt content is higher than the threshold value, the coarse particles only reinforce the matrix and the effect of interfine void ratio becomes significant (Figure 7 and Figure 8).
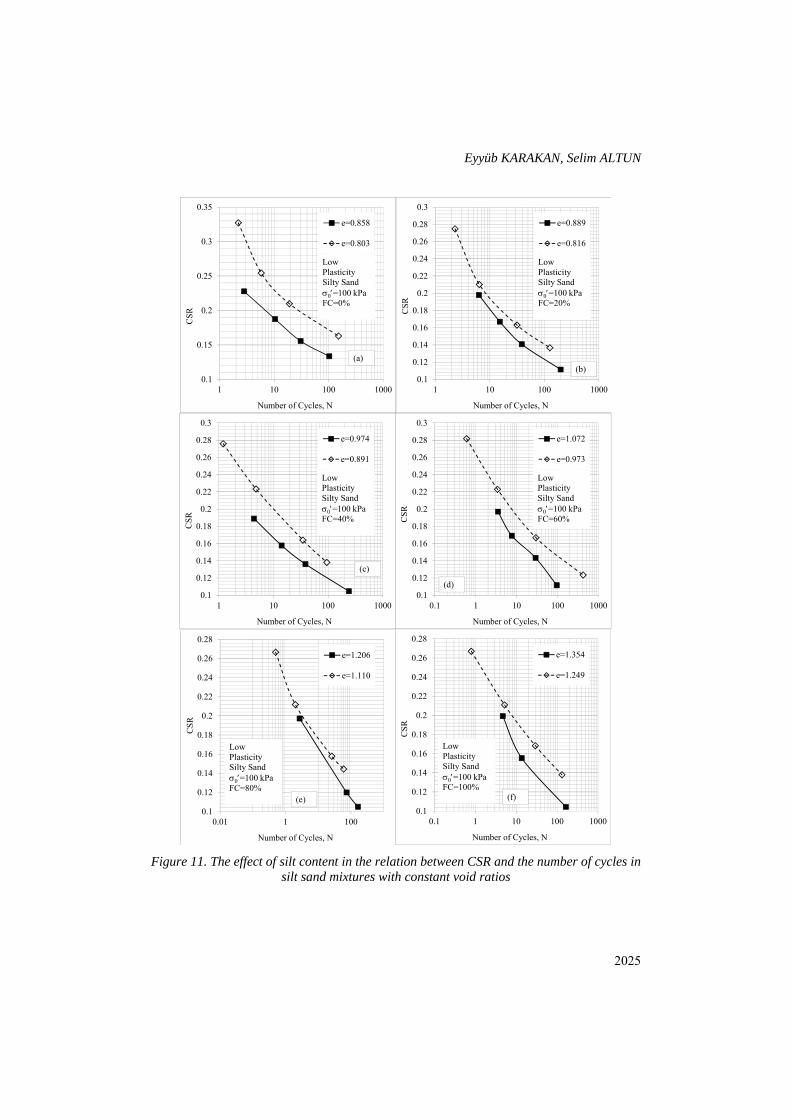
The correlation of cyclic stress ratio (CSR) at a constant void ratio and the number of cycles for various silt contents is shown in Figure 10. It is observed that the cyclic stress ratio decreased for FC=0% at a specific number of cycles when the effective confining stress increases from 50 kPa to 150 kPa. These results are in conformity with literature [15, 17]. The effect of silt content between cyclic stress ratio and number of cycles at constant void ratios are shown in Figure 11.The cyclic stress ratio (CSR) increases with the silt content up to the threshold value and after the threshold is exceeded the cyclic stress ratio (CSR) decreases for a given number of cycles.
Figure 8. Threshold silt content for intergranular-interfine void ratios silt sand mixtures
with low plasticity
0.0
2.0
4.0
6.0
8.0
10.0
12.0
14.0
16.0
18.0
0 10 20 30 40 50 60 70 80 90 100
Inte
rgra
nula
r-Int
erfin
e Voi
d Ra
tio (e
g-e
f)
Fine Content (FC%)
Low PlasticitySilty Sand0=100 kPa
Liquefaction Behavior and Post-Liquefaction Volumetric Strain Properties ...
2024
Figure 9. CSR20 – global void ratio relation in silt sand mixtures with low plasticity
Figure 10. The relation between CSR and the number of cycles in silt sand mixtures with a
constant global void ratio considering the effect of confining stress
0.14
0.145
0.15
0.155
0.16
0.165
0.17
0.5 0.6 0.7 0.8 0.9 1 1.1 1.2 1.3 1.4
CSR 2
0
Global Void Ratio, e
FC=0FC=5FC=10FC=20FC=40FC=60FC=80FC=100Low Plasticity
Silty Sand0=100 kPa
0
0.05
0.1
0.15
0.2
0.25
1 10 100 1000
Cycl
ic S
tress
Rat
io (C
SR)
Number of Cycles, N
50 kPa100 kPa150 kPa
Silt sand mixturese=0.858
Confining stress
Eyyüb KARAKAN, Selim ALTUN
2025
Figure 11. The effect of silt content in the relation between CSR and the number of cycles in
silt sand mixtures with constant void ratios
0.1
0.15
0.2
0.25
0.3
0.35
1 10 100 1000
CSR
Number of Cycles, N
e=0.858
e=0.803
Low Plasticity Silty Sand0=100 kPaFC=0%
(a)
0.1
0.12
0.14
0.16
0.18
0.2
0.22
0.24
0.26
0.28
0.3
1 10 100 1000CS
RNumber of Cycles, N
e=0.889
e=0.816
Low Plasticity Silty Sand0=100 kPaFC=20%
(b)
0.1
0.12
0.14
0.16
0.18
0.2
0.22
0.24
0.26
0.28
0.3
1 10 100 1000
CSR
Number of Cycles, N
e=0.974
e=0.891
Low Plasticity Silty Sand0=100 kPaFC=40%
(c)
0.1
0.12
0.14
0.16
0.18
0.2
0.22
0.24
0.26
0.28
0.3
0.1 1 10 100 1000
CSR
Number of Cycles, N
e=1.072
e=0.973
Low Plasticity Silty Sand0=100 kPaFC=60%
(d)
0.1
0.12
0.14
0.16
0.18
0.2
0.22
0.24
0.26
0.28
0.01 1 100
CSR
Number of Cycles, N
e=1.206
e=1.110
Low Plasticity Silty Sand0=100 kPaFC=80%
(e)0.1
0.12
0.14
0.16
0.18
0.2
0.22
0.24
0.26
0.28
0.1 1 10 100 1000
CSR
Number of Cycles, N
e=1.354
e=1.249
Low Plasticity Silty Sand0=100 kPaFC=100%
(f)
Liquefaction Behavior and Post-Liquefaction Volumetric Strain Properties ...
2026
3.2. Volumetric Change in Reconsolidation Process Following Undrained Cyclic Loading
It is known that the sands exposed to earthquake loads shows contractive behavior. The consolidation of soil after the earthquake reveals itself as the total and differential settlement on the ground surface. The settlements which occurred due to the earthquakes lead to substantial damages on the structures with shallow foundations and lifelines. Dry sandy soils consolidate quickly and therefore the settlement occurs immediately at the end of earthquake. The settlement of saturated sandy soils takes longer time depending on the existence of fine particles. In these soils, the settlement occurs along with the dissipation of excess pore water pressure due to the earthquake. The dissipation of excess pore water pressure depends on the parameters such as the fines content, relative density of soil, drainage length and effective confining stress.
Lee and Albaisa [23], Tatsuoka et al. [24] and Ishihara et al. [25] conducted dynamic triaxial compression tests on sand soils and investigated the volumetric change occurring due to the formation of excess pore water pressure. It was shown that the post-liquefaction volumetric strain in the soils did not only affect the unit weights of soils but also it affected the maximum shear strain which occurred along the cyclic loadings in the dynamic triaxial compression tests. Based on this knowledge, Tokimatsu and Seed [26] developed a method to estimate the post-liquefaction settlements. Ishihara and Yoshimine [27] developed a method for the estimation of settlements on the soil surface depending on the safety factor by taking maximum shear strain as the basic parameter alternating the post-liquefaction volumetric strain.
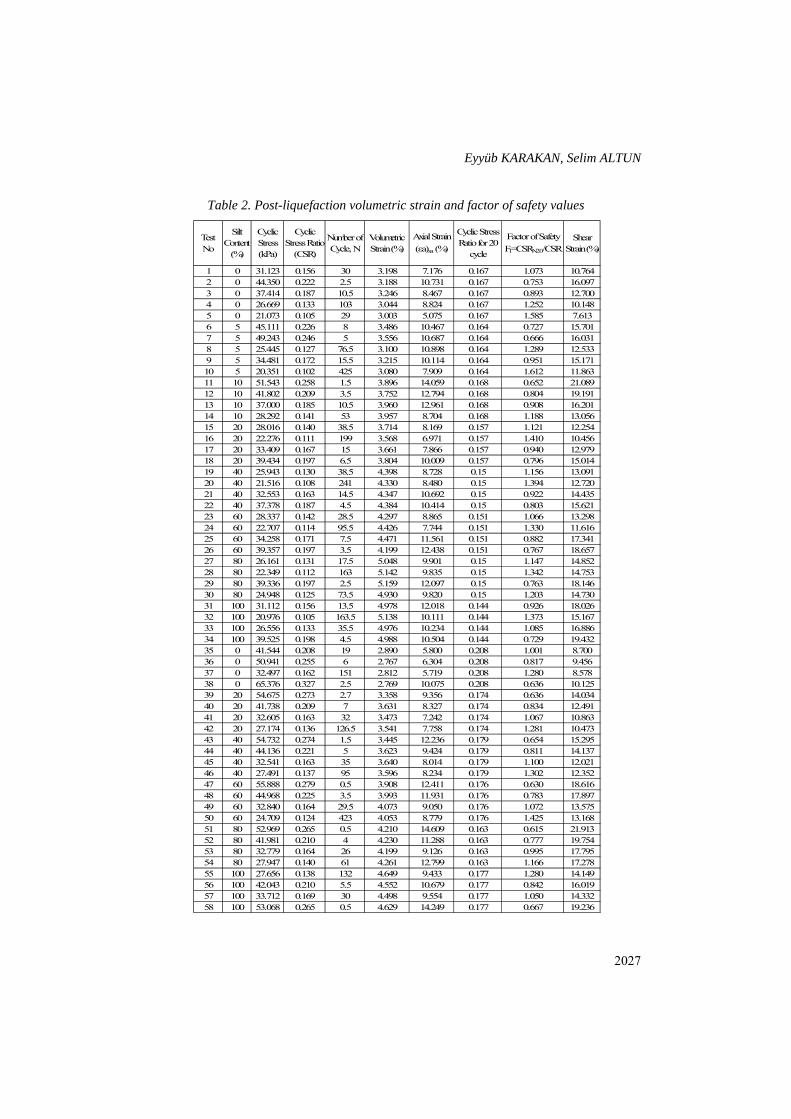
Several tests were performed to determine the volumetric change of sands as a result of cyclic shear strains under undrained conditions along the distribution of pore water pressure development. The silt sand mixtures with varying silt contents were isotropically consolidated under 100 kPa effective confining stress and they were subjected to shear strains under strain controlled and undrained conditions The experimental conditions, loading conditions, shear stress and volumetric strain values are shown in Table 2. The volumetric changes of strain was measured by opening drain valves for the dissipation of pore water pressure which developed after the completion of loading in undrained conditions. The volumetric change of strain was correlated with the settlement characteristics of liquefied soils after dynamic loading.
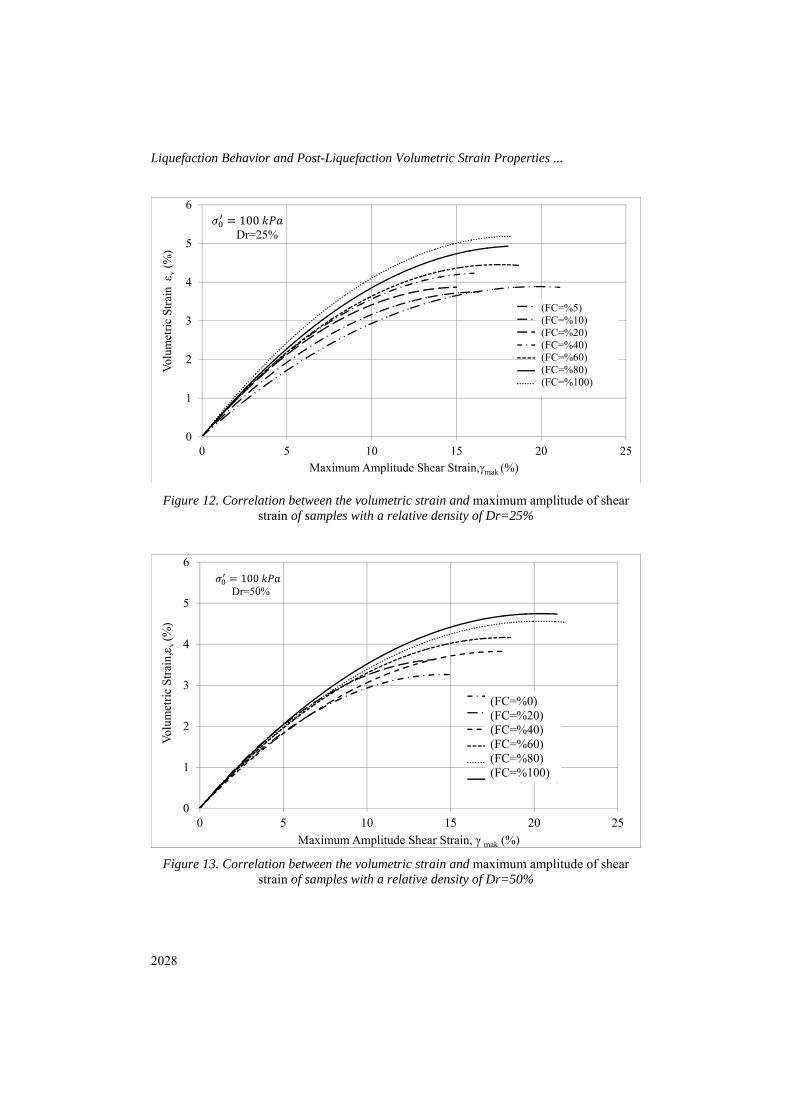
Along the reconsolidation process, maximum amplitude of shear strain, mak, were graphed with, v, volumetric strain. Dynamic triaxial compression tests were conducted on silt sand mixtures with low plasticity where two different relative densities and eight different silt contents were available. The curves obtained according to the relative densities of 25% and 50% are shown in Figures 12 and 13, respectively.
The experiments were conducted for two different relative densities (Dr=25% and Dr=50%) and the variation of maximum amplitude of shear strain with the volumetric strain is shown for the samples having different fines content. Here, it was seen that the volumetric strains increased as the fines content increased for a constant maximum amplitude of shear strain. In literature, Tatsuoka et al. [28], Sasaki et al. [29], and Kokusho et al. [30] also showed that the volumetric strain value increased and the relative density decreased for clean sands as a result of dynamic triaxial and torsional shear tests.
Eyyüb KARAKAN, Selim ALTUN
2027
Table 2. Post-liquefaction volumetric strain and factor of safety values
Test No
Silt Content
(%)
Cyclic Stress (kPa)
Cyclic Stress Ratio
(CSR)
Number of Cycle, N
Volumetric Strain (%)
Axial Strain (εa)sa (%)
Cyclic Stress Ratio for 20
cycle
Factor of Safety Fl=CSRN20/CSR
Shear Strain (%)
1 0 31.123 0.156 30 3.198 7.176 0.167 1.073 10.7642 0 44.350 0.222 2.5 3.188 10.731 0.167 0.753 16.0973 0 37.414 0.187 10.5 3.246 8.467 0.167 0.893 12.7004 0 26.669 0.133 103 3.044 8.824 0.167 1.252 10.1485 0 21.073 0.105 29 3.003 5.075 0.167 1.585 7.6136 5 45.111 0.226 8 3.486 10.467 0.164 0.727 15.7017 5 49.243 0.246 5 3.556 10.687 0.164 0.666 16.0318 5 25.445 0.127 76.5 3.100 10.898 0.164 1.289 12.5339 5 34.481 0.172 15.5 3.215 10.114 0.164 0.951 15.17110 5 20.351 0.102 425 3.080 7.909 0.164 1.612 11.86311 10 51.543 0.258 1.5 3.896 14.059 0.168 0.652 21.08912 10 41.802 0.209 3.5 3.752 12.794 0.168 0.804 19.19113 10 37.000 0.185 10.5 3.960 12.961 0.168 0.908 16.20114 10 28.292 0.141 53 3.957 8.704 0.168 1.188 13.05615 20 28.016 0.140 38.5 3.714 8.169 0.157 1.121 12.25416 20 22.276 0.111 199 3.568 6.971 0.157 1.410 10.45617 20 33.409 0.167 15 3.661 7.866 0.157 0.940 12.97918 20 39.434 0.197 6.5 3.804 10.009 0.157 0.796 15.01419 40 25.943 0.130 38.5 4.398 8.728 0.15 1.156 13.09120 40 21.516 0.108 241 4.330 8.480 0.15 1.394 12.72021 40 32.553 0.163 14.5 4.347 10.692 0.15 0.922 14.43522 40 37.378 0.187 4.5 4.384 10.414 0.15 0.803 15.62123 60 28.337 0.142 28.5 4.297 8.865 0.151 1.066 13.29824 60 22.707 0.114 95.5 4.426 7.744 0.151 1.330 11.61625 60 34.258 0.171 7.5 4.471 11.561 0.151 0.882 17.34126 60 39.357 0.197 3.5 4.199 12.438 0.151 0.767 18.65727 80 26.161 0.131 17.5 5.048 9.901 0.15 1.147 14.85228 80 22.349 0.112 163 5.142 9.835 0.15 1.342 14.75329 80 39.336 0.197 2.5 5.159 12.097 0.15 0.763 18.14630 80 24.948 0.125 73.5 4.930 9.820 0.15 1.203 14.73031 100 31.112 0.156 13.5 4.978 12.018 0.144 0.926 18.02632 100 20.976 0.105 163.5 5.138 10.111 0.144 1.373 15.16733 100 26.556 0.133 35.5 4.976 10.234 0.144 1.085 16.88634 100 39.525 0.198 4.5 4.988 10.504 0.144 0.729 19.43235 0 41.544 0.208 19 2.890 5.800 0.208 1.001 8.70036 0 50.941 0.255 6 2.767 6.304 0.208 0.817 9.45637 0 32.497 0.162 151 2.812 5.719 0.208 1.280 8.57838 0 65.376 0.327 2.5 2.769 10.075 0.208 0.636 10.12539 20 54.675 0.273 2.7 3.358 9.356 0.174 0.636 14.03440 20 41.738 0.209 7 3.631 8.327 0.174 0.834 12.49141 20 32.605 0.163 32 3.473 7.242 0.174 1.067 10.86342 20 27.174 0.136 126.5 3.541 7.758 0.174 1.281 10.47343 40 54.732 0.274 1.5 3.445 12.236 0.179 0.654 15.29544 40 44.136 0.221 5 3.623 9.424 0.179 0.811 14.13745 40 32.541 0.163 35 3.640 8.014 0.179 1.100 12.02146 40 27.491 0.137 95 3.596 8.234 0.179 1.302 12.35247 60 55.888 0.279 0.5 3.908 12.411 0.176 0.630 18.61648 60 44.968 0.225 3.5 3.993 11.931 0.176 0.783 17.89749 60 32.840 0.164 29.5 4.073 9.050 0.176 1.072 13.57550 60 24.709 0.124 423 4.053 8.779 0.176 1.425 13.16851 80 52.969 0.265 0.5 4.210 14.609 0.163 0.615 21.91352 80 41.981 0.210 4 4.230 11.288 0.163 0.777 19.75453 80 32.779 0.164 26 4.199 9.126 0.163 0.995 17.79554 80 27.947 0.140 61 4.261 12.799 0.163 1.166 17.27855 100 27.656 0.138 132 4.649 9.433 0.177 1.280 14.14956 100 42.043 0.210 5.5 4.552 10.679 0.177 0.842 16.01957 100 33.712 0.169 30 4.498 9.554 0.177 1.050 14.33258 100 53.068 0.265 0.5 4.629 14.249 0.177 0.667 19.236
Liquefaction Behavior and Post-Liquefaction Volumetric Strain Properties ...
2028
Figure 12. Correlation between the volumetric strain and maximum amplitude of shear
strain of samples with a relative density of Dr=25%
Figure 13. Correlation between the volumetric strain and maximum amplitude of shear
strain of samples with a relative density of Dr=50%
0
1
2
3
4
5
6
0 5 10 15 20 25
Volu
met
ric S
train
v
(%)
Maximum Amplitude Shear Strain,mak (%)
Polinom. (FC=%5)Polinom. (FC=%10)Polinom. (FC=%20)Polinom. (FC=%40)Polinom. (FC=%60)Polinom. (FC=%80)Polinom. (FC=%100)
Dr=25%
(FC=%5)(FC=%10)(FC=%20)(FC=%40)(FC=%60)(FC=%80)(FC=%100)
0
1
2
3
4
5
6
0 5 10 15 20 25
Volu
met
ric S
train
,v (%
)
Maximum Amplitude Shear Strain, mak (%)
Polinom. (FC=%0)
Polinom. (FC=%20)
Polinom. (FC=%40)
Polinom. (FC=%60)
Polinom. (FC=%80)
Polinom. (FC=%100)
Dr=50%
(FC=%0)(FC=%20)(FC=%40)(FC=%60)(FC=%80)(FC=%100)
Eyyüb KARAKAN, Selim ALTUN
2029
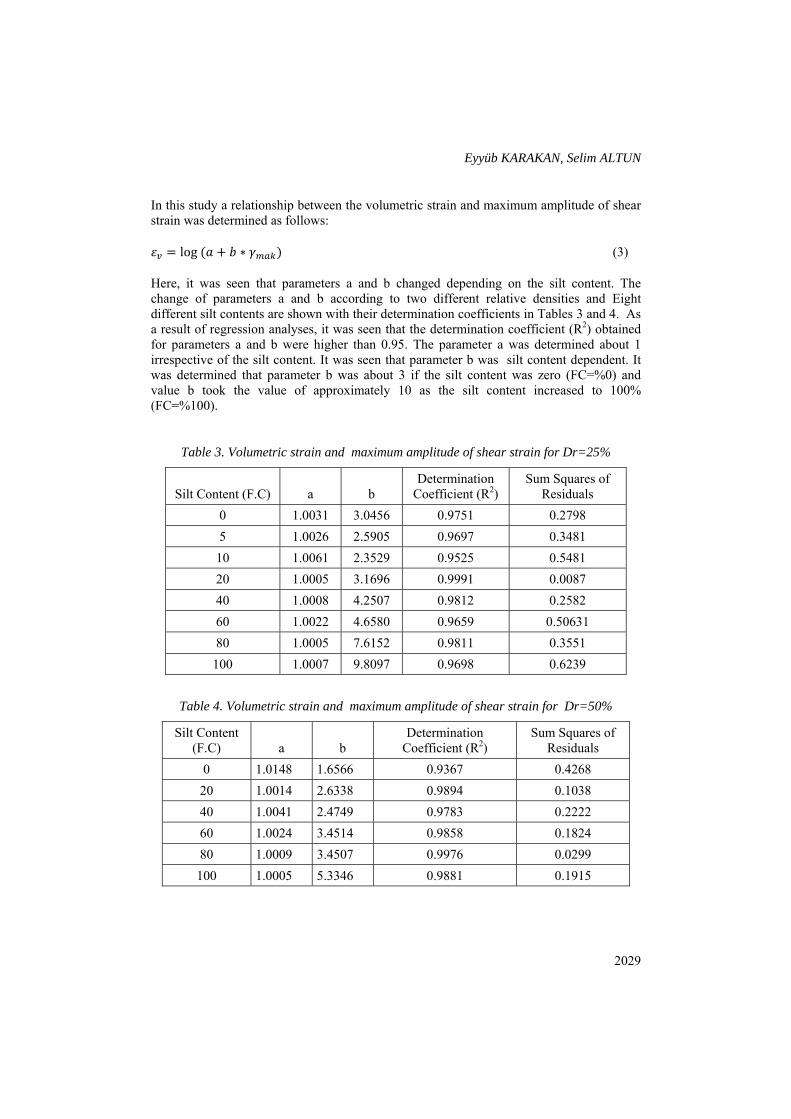
In this study a relationship between the volumetric strain and maximum amplitude of shear strain was determined as follows: = log ( + ∗ ) (3)
Here, it was seen that parameters a and b changed depending on the silt content. The change of parameters a and b according to two different relative densities and Eight different silt contents are shown with their determination coefficients in Tables 3 and 4. As a result of regression analyses, it was seen that the determination coefficient (R2) obtained for parameters a and b were higher than 0.95. The parameter a was determined about 1 irrespective of the silt content. It was seen that parameter b was silt content dependent. It was determined that parameter b was about 3 if the silt content was zero (FC=%0) and value b took the value of approximately 10 as the silt content increased to 100% (FC=%100).
Table 3. Volumetric strain and maximum amplitude of shear strain for Dr=25%
Silt Content (F.C) a b Determination
Coefficient (R2) Sum Squares of
Residuals 0 1.0031 3.0456 0.9751 0.2798 5 1.0026 2.5905 0.9697 0.3481
10 1.0061 2.3529 0.9525 0.5481 20 1.0005 3.1696 0.9991 0.0087 40 1.0008 4.2507 0.9812 0.2582 60 1.0022 4.6580 0.9659 0.50631 80 1.0005 7.6152 0.9811 0.3551
100 1.0007 9.8097 0.9698 0.6239
Table 4. Volumetric strain and maximum amplitude of shear strain for Dr=50%
Silt Content (F.C) a b
Determination Coefficient (R2)
Sum Squares of Residuals
0 1.0148 1.6566 0.9367 0.4268 20 1.0014 2.6338 0.9894 0.1038 40 1.0041 2.4749 0.9783 0.2222 60 1.0024 3.4514 0.9858 0.1824 80 1.0009 3.4507 0.9976 0.0299 100 1.0005 5.3346 0.9881 0.1915
Liquefaction Behavior and Post-Liquefaction Volumetric Strain Properties ...
2030
3.3. Correlation between Maximum Amplitude of Shear Strain and Factor of Safety for Silty Sands
In order to estimate the settlement after the liquefaction of soils, it is necessary to know maximum amplitude of shear strain that occurred during the earthquake. The cyclic resistance, is defined as the condition where effective confining stress is equal to the pore water pressure when a specific level of shear strain is achieved. This case may be defined as the initiation of liquefaction or development of 100% pore water pressure. In the laboratory, this procedure corresponds to the double amplitude of axial strain of 5% or it corresponds to 20 cycles. Consequently, the factor of safety defined in liquefaction studies is as follows;
= , = = (4)
Here, CSRL is CSR value which corresponds to 20 cycles required for liquefaction. In equation 4, dl indicates the required axial strain which leads to liquefaction or the axial strain at 5% double amplitude for 20 cycles and d indicates the earthquake dependent shear stress due to the progress of axial strain amplitude. In the above equation, if factor of safety is one it indicates that double amplitude of axial strain of 5% is achieved by cyclic softening and if the factor of safety was smaller than one indicates double amplitude of axial strain lower than 5% caused the softening of the soil . Therefore, the factor of safety is assessed as a function of double amplitude of axial strain and if the factor of safety in a region is known development of double amplitude of axial strain during liquefaction may be predicted. It is accepted that single amplitude of axial strain is the maximum shear strain that the soil is subjected to during liquefaction.
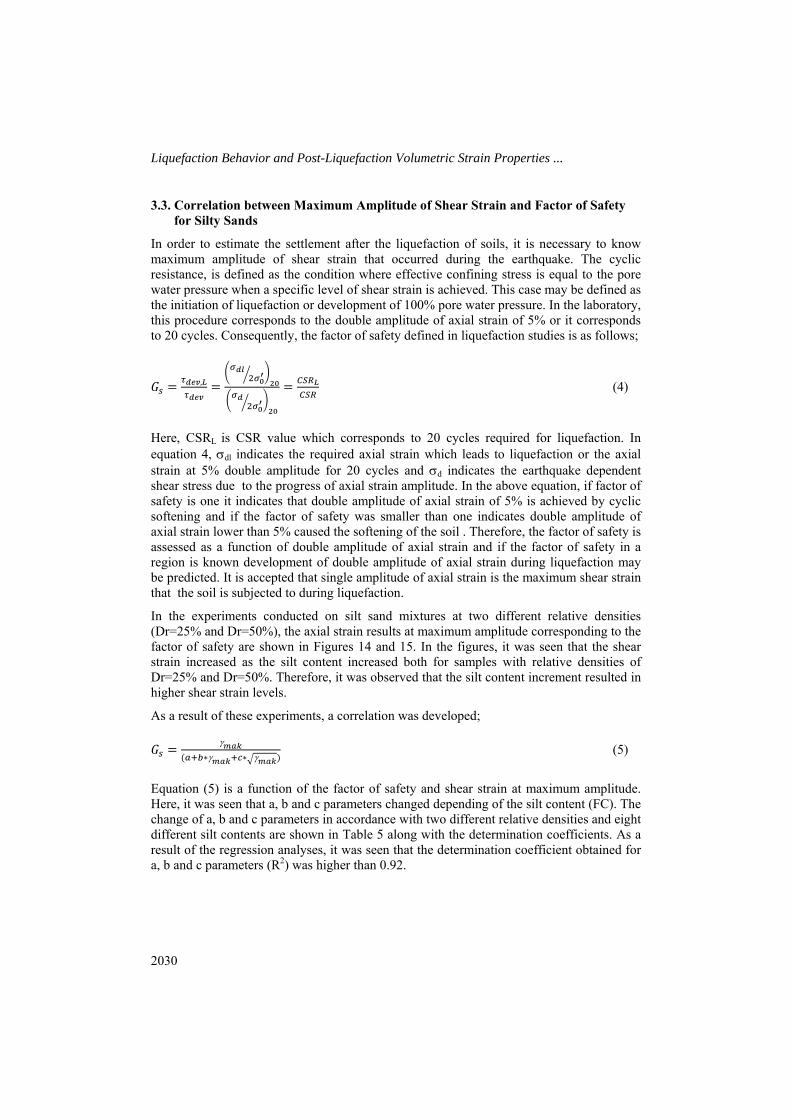
In the experiments conducted on silt sand mixtures at two different relative densities (Dr=25% and Dr=50%), the axial strain results at maximum amplitude corresponding to the factor of safety are shown in Figures 14 and 15. In the figures, it was seen that the shear strain increased as the silt content increased both for samples with relative densities of Dr=25% and Dr=50%. Therefore, it was observed that the silt content increment resulted in higher shear strain levels.
As a result of these experiments, a correlation was developed; = ( ∗ ∗ ) (5)
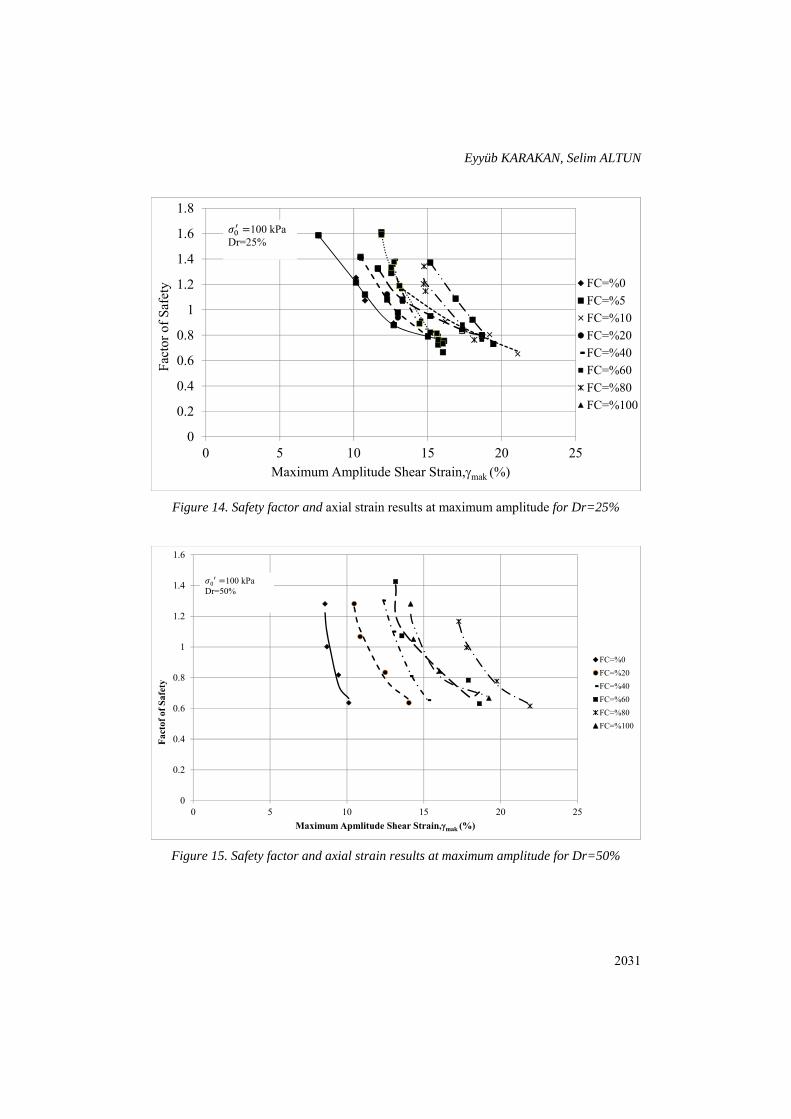
Equation (5) is a function of the factor of safety and shear strain at maximum amplitude. Here, it was seen that a, b and c parameters changed depending of the silt content (FC). The change of a, b and c parameters in accordance with two different relative densities and eight different silt contents are shown in Table 5 along with the determination coefficients. As a result of the regression analyses, it was seen that the determination coefficient obtained for a, b and c parameters (R2) was higher than 0.92.
Eyyüb KARAKAN, Selim ALTUN
2031
Figure 14. Safety factor and axial strain results at maximum amplitude for Dr=25%
Figure 15. Safety factor and axial strain results at maximum amplitude for Dr=50%
0
0.2
0.4
0.6
0.8
1
1.2
1.4
1.6
1.8
0 5 10 15 20 25
Fact
or o
f Saf
ety
Maximum Amplitude Shear Strain,mak (%)
FC=%0FC=%5FC=%10FC=%20FC=%40FC=%60FC=%80FC=%100
100 kPaDr=25%
0
0.2
0.4
0.6
0.8
1
1.2
1.4
1.6
0 5 10 15 20 25
Fact
of o
f Saf
ety
Maximum Apmlitude Shear Strain,mak (%)
FC=%0FC=%20FC=%40FC=%60FC=%80FC=%100
100 kPaDr=50%
Liquefaction Behavior and Post-Liquefaction Volumetric Strain Properties ...
2032
Table 5. Safety factor and shear strain coefficients at maximum amplitude for Dr=50%
Silt Content
(FC) a b c Determination
Coefficient (R2) Sum Squares of Residuals
0 -583.247 -53.1311 357.1486 0.9237 0.0172 20 -42.4158 2.632625 7.159983 0.9800 0.0046 40 312.1531 31.19776 -195.77 0.9983 0.0004 60 -716.301 -40.6086 347.3401 0.9490 0.0187 80 -189.093 -2.30841 58.69417 0.9916 0.0014 100 -373,164 -17.1754 166.9142 0.9349 0.0136
3.4. Correlation between Factor of Safety and Volumetric Strain for Silty Sands
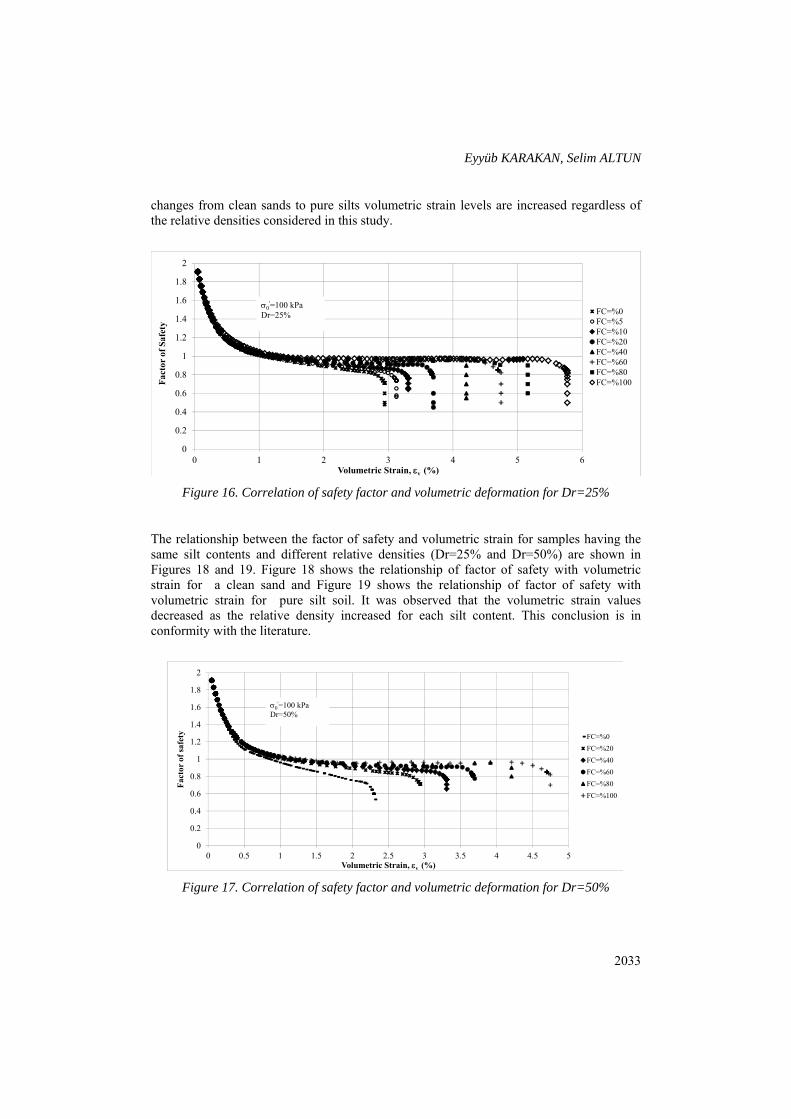
In the liquefaction analyses held by the traditional methods, determining the shear strain at maximum amplitude is not necessarily needed if the factor of safety is known and the post-liquefaction volumetric strain may be directly estimated. Within the scope of this study, the volumetric strain versus the factor of safety for the samples having different silt contents and relative densities were obtained and graphed in Figures 16 and 17. Here, it was shown that volumetric strain values did not change for two different relative densities for the samples with the same silt content. It was observed that the factor of safety varied between 0.6 and 1.6 cyclic stress ratio (CSR)depending on the samples having the same silt content and consolidated under the same effective confining stresses. Large deformation values were obtained as the samples were subjected to cyclic loading until the sample collapsed and it was observed that the values of volumetric strain were very close to each other between the observed factor of safety range. For example; if the experiments no. 1 and 2 in Table 2 are compared, cyclic stress ratio (CSR) values were 0.156 and 0.222, respectively. The factor of safety obtained depending on the CSR values were between 1.073 and 0.753, respectively. However, the volumetric strain values at the end of experiment were between 3.198 and 3.188, respectively. The difference between the volumetric strain values was only 0.01%. Therefore, similar volumetric strain values were obtained in the experiments which have different CSR values for the samples having the same silt contents. In Figures 16 and 17, it is shown that the volumetric strains were close to each other at a specific factor of safety range for the samples having the same silt contents.
It was also observed that the increase in the silt content also increased the strain values. As a comparison, the experiment sets no. 1 and 31 were discussed. The silt content was (FC=%0) and cyclic stress ratio was (CSR=0.156) in experiment no. 1. In experiment no. 31, the silt content (FC=%100) and cyclic stress ratio (CSR=0.156) had the same values with the experiment no. 1. It is seen that volumetric strain values were 3.198% and 4.978%, respectively for the experiments no. 1 and 31. A difference of 1.780% was achieved among the volumetric strain values. This condition showed that the water retention capacities of fine particles increased as the silt content increased in the soil and greater water discharge occurred by opening the drain valves at the end of loading and caused larger volumetric changes. Figure 16 and 17 point out that if the fines content increase and the soil type
Eyyüb KARAKAN, Selim ALTUN
2033
changes from clean sands to pure silts volumetric strain levels are increased regardless of the relative densities considered in this study.
Figure 16. Correlation of safety factor and volumetric deformation for Dr=25%
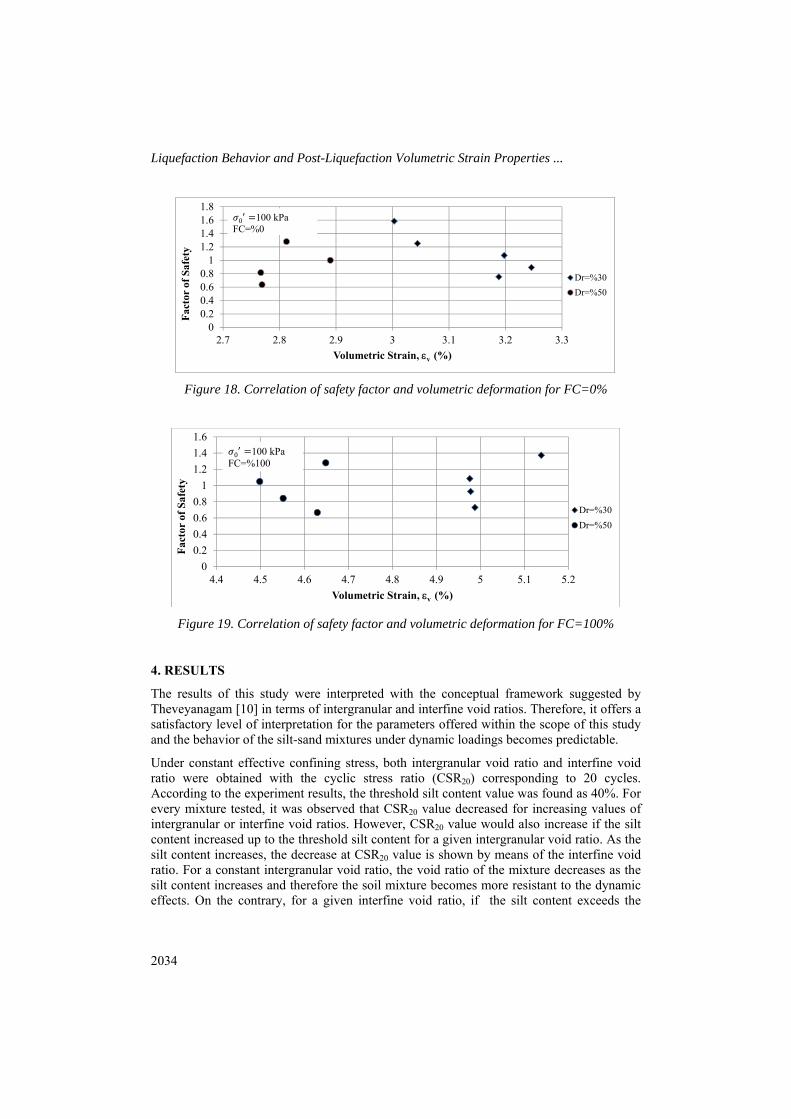
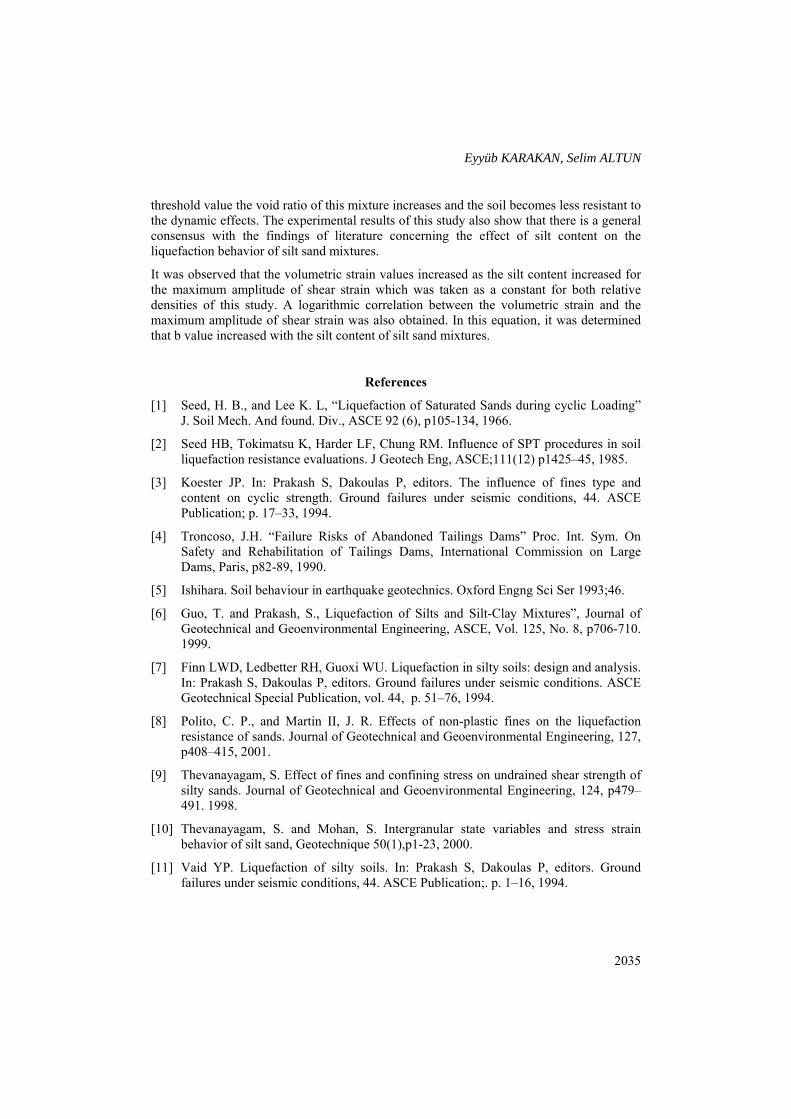
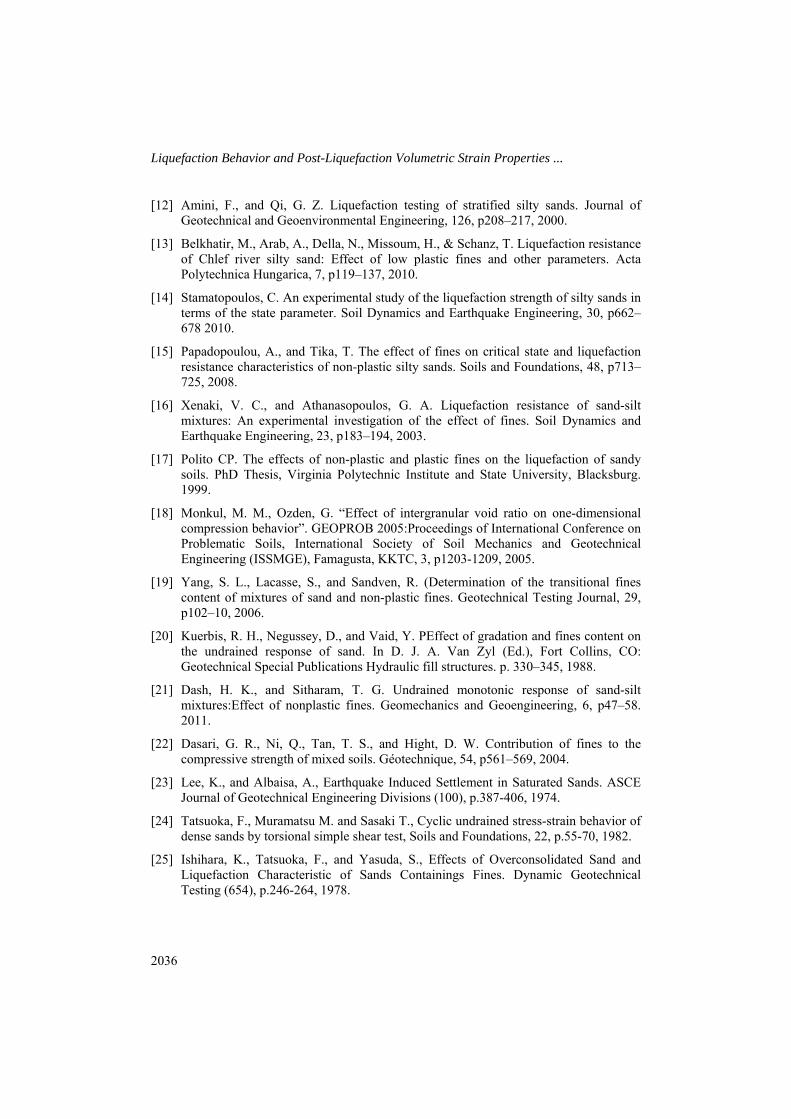
The relationship between the factor of safety and volumetric strain for samples having the same silt contents and different relative densities (Dr=25% and Dr=50%) are shown in Figures 18 and 19. Figure 18 shows the relationship of factor of safety with volumetric strain for a clean sand and Figure 19 shows the relationship of factor of safety with volumetric strain for pure silt soil. It was observed that the volumetric strain values decreased as the relative density increased for each silt content. This conclusion is in conformity with the literature.
Figure 17. Correlation of safety factor and volumetric deformation for Dr=50%
0
0.2
0.4
0.6
0.8
1
1.2
1.4
1.6
1.8
2
0 1 2 3 4 5 6
Fact
or o
f Saf
ety
Volumetric Strain, v (%)
FC=%0FC=%5FC=%10FC=%20FC=%40FC=%60FC=%80FC=%100
0'=100 kPa
Dr=25%
0
0.2
0.4
0.6
0.8
1
1.2
1.4
1.6
1.8
2
0 0.5 1 1.5 2 2.5 3 3.5 4 4.5 5
Fact
or o
f saf
ety
Volumetric Strain, v (%)
FC=%0FC=%20FC=%40FC=%60FC=%80FC=%100
0'=100 kPa
Dr=50%
Liquefaction Behavior and Post-Liquefaction Volumetric Strain Properties ...
2034
Figure 18. Correlation of safety factor and volumetric deformation for FC=0%
Figure 19. Correlation of safety factor and volumetric deformation for FC=100%
4. RESULTS
The results of this study were interpreted with the conceptual framework suggested by Theveyanagam [10] in terms of intergranular and interfine void ratios. Therefore, it offers a satisfactory level of interpretation for the parameters offered within the scope of this study and the behavior of the silt-sand mixtures under dynamic loadings becomes predictable.
Under constant effective confining stress, both intergranular void ratio and interfine void ratio were obtained with the cyclic stress ratio (CSR20) corresponding to 20 cycles. According to the experiment results, the threshold silt content value was found as 40%. For every mixture tested, it was observed that CSR20 value decreased for increasing values of intergranular or interfine void ratios. However, CSR20 value would also increase if the silt content increased up to the threshold silt content for a given intergranular void ratio. As the silt content increases, the decrease at CSR20 value is shown by means of the interfine void ratio. For a constant intergranular void ratio, the void ratio of the mixture decreases as the silt content increases and therefore the soil mixture becomes more resistant to the dynamic effects. On the contrary, for a given interfine void ratio, if the silt content exceeds the
00.20.40.60.8
11.21.41.61.8
2.7 2.8 2.9 3 3.1 3.2 3.3
Fact
or o
f Saf
ety
Volumetric Strain, v (%)
Dr=%30Dr=%50
100 kPaFC=%0
00.20.40.60.8
11.21.41.6
4.4 4.5 4.6 4.7 4.8 4.9 5 5.1 5.2
Fact
or o
f Saf
ety
Volumetric Strain, v (%)
Dr=%30Dr=%50
100 kPaFC=%100
Eyyüb KARAKAN, Selim ALTUN
2035
threshold value the void ratio of this mixture increases and the soil becomes less resistant to the dynamic effects. The experimental results of this study also show that there is a general consensus with the findings of literature concerning the effect of silt content on the liquefaction behavior of silt sand mixtures.
It was observed that the volumetric strain values increased as the silt content increased for the maximum amplitude of shear strain which was taken as a constant for both relative densities of this study. A logarithmic correlation between the volumetric strain and the maximum amplitude of shear strain was also obtained. In this equation, it was determined that b value increased with the silt content of silt sand mixtures.
References
[1] Seed, H. B., and Lee K. L, “Liquefaction of Saturated Sands during cyclic Loading” J. Soil Mech. And found. Div., ASCE 92 (6), p105-134, 1966.
[2] Seed HB, Tokimatsu K, Harder LF, Chung RM. Influence of SPT procedures in soil liquefaction resistance evaluations. J Geotech Eng, ASCE;111(12) p1425–45, 1985.
[3] Koester JP. In: Prakash S, Dakoulas P, editors. The influence of fines type and content on cyclic strength. Ground failures under seismic conditions, 44. ASCE Publication; p. 17–33, 1994.
[4] Troncoso, J.H. “Failure Risks of Abandoned Tailings Dams” Proc. Int. Sym. On Safety and Rehabilitation of Tailings Dams, International Commission on Large Dams, Paris, p82-89, 1990.
[5] Ishihara. Soil behaviour in earthquake geotechnics. Oxford Engng Sci Ser 1993;46.
[6] Guo, T. and Prakash, S., Liquefaction of Silts and Silt-Clay Mixtures”, Journal of Geotechnical and Geoenvironmental Engineering, ASCE, Vol. 125, No. 8, p706-710. 1999.
[7] Finn LWD, Ledbetter RH, Guoxi WU. Liquefaction in silty soils: design and analysis. In: Prakash S, Dakoulas P, editors. Ground failures under seismic conditions. ASCE Geotechnical Special Publication, vol. 44, p. 51–76, 1994.
[8] Polito, C. P., and Martin II, J. R. Effects of non-plastic fines on the liquefaction resistance of sands. Journal of Geotechnical and Geoenvironmental Engineering, 127, p408–415, 2001.
[9] Thevanayagam, S. Effect of fines and confining stress on undrained shear strength of silty sands. Journal of Geotechnical and Geoenvironmental Engineering, 124, p479–491. 1998.
[10] Thevanayagam, S. and Mohan, S. Intergranular state variables and stress strain behavior of silt sand, Geotechnique 50(1),p1-23, 2000.
[11] Vaid YP. Liquefaction of silty soils. In: Prakash S, Dakoulas P, editors. Ground failures under seismic conditions, 44. ASCE Publication;. p. 1–16, 1994.
Liquefaction Behavior and Post-Liquefaction Volumetric Strain Properties ...
2036
[12] Amini, F., and Qi, G. Z. Liquefaction testing of stratified silty sands. Journal of Geotechnical and Geoenvironmental Engineering, 126, p208–217, 2000.
[13] Belkhatir, M., Arab, A., Della, N., Missoum, H., & Schanz, T. Liquefaction resistance of Chlef river silty sand: Effect of low plastic fines and other parameters. Acta Polytechnica Hungarica, 7, p119–137, 2010.
[14] Stamatopoulos, C. An experimental study of the liquefaction strength of silty sands in terms of the state parameter. Soil Dynamics and Earthquake Engineering, 30, p662–678 2010.
[15] Papadopoulou, A., and Tika, T. The effect of fines on critical state and liquefaction resistance characteristics of non-plastic silty sands. Soils and Foundations, 48, p713–725, 2008.
[16] Xenaki, V. C., and Athanasopoulos, G. A. Liquefaction resistance of sand-silt mixtures: An experimental investigation of the effect of fines. Soil Dynamics and Earthquake Engineering, 23, p183–194, 2003.
[17] Polito CP. The effects of non-plastic and plastic fines on the liquefaction of sandy soils. PhD Thesis, Virginia Polytechnic Institute and State University, Blacksburg. 1999.
[18] Monkul, M. M., Ozden, G. “Effect of intergranular void ratio on one-dimensional compression behavior”. GEOPROB 2005:Proceedings of International Conference on Problematic Soils, International Society of Soil Mechanics and Geotechnical Engineering (ISSMGE), Famagusta, KKTC, 3, p1203-1209, 2005.
[19] Yang, S. L., Lacasse, S., and Sandven, R. (Determination of the transitional fines content of mixtures of sand and non-plastic fines. Geotechnical Testing Journal, 29, p102–10, 2006.
[20] Kuerbis, R. H., Negussey, D., and Vaid, Y. PEffect of gradation and fines content on the undrained response of sand. In D. J. A. Van Zyl (Ed.), Fort Collins, CO: Geotechnical Special Publications Hydraulic fill structures. p. 330–345, 1988.
[21] Dash, H. K., and Sitharam, T. G. Undrained monotonic response of sand-silt mixtures:Effect of nonplastic fines. Geomechanics and Geoengineering, 6, p47–58. 2011.
[22] Dasari, G. R., Ni, Q., Tan, T. S., and Hight, D. W. Contribution of fines to the compressive strength of mixed soils. Géotechnique, 54, p561–569, 2004.
[23] Lee, K., and Albaisa, A., Earthquake Induced Settlement in Saturated Sands. ASCE Journal of Geotechnical Engineering Divisions (100), p.387-406, 1974.
[24] Tatsuoka, F., Muramatsu M. and Sasaki T., Cyclic undrained stress-strain behavior of dense sands by torsional simple shear test, Soils and Foundations, 22, p.55-70, 1982.
[25] Ishihara, K., Tatsuoka, F., and Yasuda, S., Effects of Overconsolidated Sand and Liquefaction Characteristic of Sands Containings Fines. Dynamic Geotechnical Testing (654), p.246-264, 1978.
Eyyüb KARAKAN, Selim ALTUN
2037
[26] Tokimatsu, K. and H.B. Seed, Evaluation of settlements in sands due to earthquake shaking, J. Geot. Engrg., 113 (8), p861-878, 1987.
[27] Ishihara, K. and Yoshimine, M.. Evaluation of settlements in sand deposits following liquefaction during earthquakes. Soils and Foundations. Vol. 32(1): p173-188, 1992.
[28] Tatsuoka, F., Muramatsu M. and Sasaki T.,. Cyclic undrained stress-strain behavior of dense sands by torsional simple shear test, Soils and Foundations, 22, p.55-70, 1982.
[29] Kondoh, M., Sasaki, Y. and Matsumoto, H. Effects of fines contents on soil liquefaction strength, Proceedings Annual Meeting of the Japanese Society of Soil Mechanics and Foundation Engineering, Tsukuba,Japan 1987.
[30] Kokusho, T., Yoshida, Y., Nishi, K. and Esashi, Y. Evaluation of Seismic Stability of Sand Layer (Part I) Report 383025, Electric Power Central Research Institute. 1983.

Liquefaction Behavior and Post-Liquefaction Volumetric Strain Properties ...
2038