liquefaction potential evaluation for a site - wit press · liquefaction potential evaluation for a...
TRANSCRIPT
Liquefaction potential evaluation for a site
S. Mittal1 & M. K. Gupta2 1Department of Civil Engineering, IIT Roorkee, India 2Department of Earthquake Engineering, IIT Roorkee, India
Abstract
Many previous works have attempted to predict the occurrence of liquefaction in the field. A comprehensive work has been done on small samples under triaxial and simple shear conditions. A few investigations have been done on large size samples and also on vibration tables. In the present study, the large size sample tests have been conducted in field and the prediction of liquefaction occurrence has been studied. To study the effect of side wall on the test specimen in large size samples, some tests have been conducted in a field pit also. A case study has also been discussed that how the bridge survived seismic shocks at the time of actual occurrence of earthquake the foundation of which was designed based on the suggested measures discussed in this paper. Keywords: liquefaction, progressive failure, potential evaluation, embankment design, vibration table, shake table.
1 Introduction
If soil is saturated at the instant of collapse, the weight of soil particles is temporarily transferred from the points of contact with their neighbours into the water (Terzaghi and Peck [13]). Dynamic triaxial and simple shear tests on small sample were conducted in USA, Japan and U.K. (Castro [2]), while large size sample tests (vibration table studies) were carried out in India and USSR (Gupta and Prakash [7]). Cyclic loading triaxial compression tests on small sample and also vibration table tests on large size sample have thrown considerable light on the factors inducing liquefaction of saturated sands and both provide methods to predict liquefaction potential which uses data obtained in these tests (Gupta [5]). But the results are affected by the method of test and test equipment used and also on method of analysis. Hence no uniform agreement could be achieved till today. Seed and Idriss [11, 12] have also
Earthquake Resistant Engineering Structures VI 235
© 2007 WIT PressWIT Transactions on The Built Environment, Vol 93, www.witpress.com, ISSN 1743-3509 (on-line) doi:10.2495/ERES070231
performed considerable research on the phenomenon of liquefaction with cyclic loading triaxial compression tests and simple shear tests (Seed and Lee [9], Lee and Seed [10]). When the strains become excessive (generally about 20%) the sample has been considered to have failed. It has been reported that these tests suffer from draw back of redistribution of void ratio during the test and also simulation of field behaviour (Castro and Poulous [3], Gupta and Prakash [7]). Also one of the important aspects of liquefaction is progressive failure (Gupta [5]). This is not simulated in tests under small sample triaxial or simple shear tests. Also a comprehensive study on large size sample on a horizontal vibration table to predict possibility and extent of liquefaction has been done at Indian Institute of Technology (I.I.T.), Roorkee, India during past 4 decades (Mittal [8], Agrawal [1]). The method of predicting liquefaction potential developed by Gupta [5] uses the test data obtained on large size sample under horizontal sinusoidal vibrations and takes care of progressive nature of liquefaction, while all other available methods do not consider this. Although the vibration table tests in a tank suffer from the draw back that there is reflection of waves from sides of the tank, yet these types of tests have predicted the field behaviour with reasonable accuracy. The present study was carried out to explore the confidence level in these studies by comparing laboratory tests on soil sample deposited in tank and with other tests carried out on natural deposit in field. This study indicates that the tests conducted in tank in laboratory represent the field conditions more realistically and hence may be considered as standard method of determination of liquefaction potential at sites.
1.1 Laboratory tests on large size sample
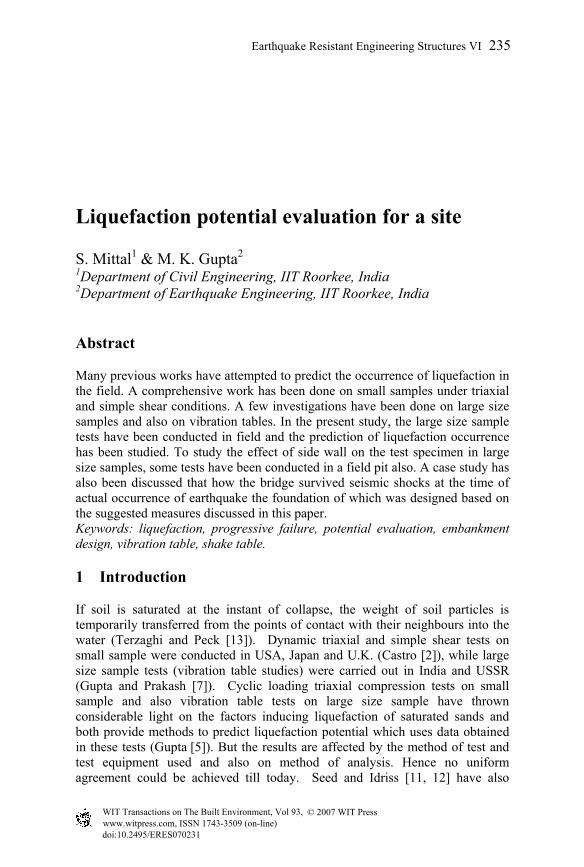
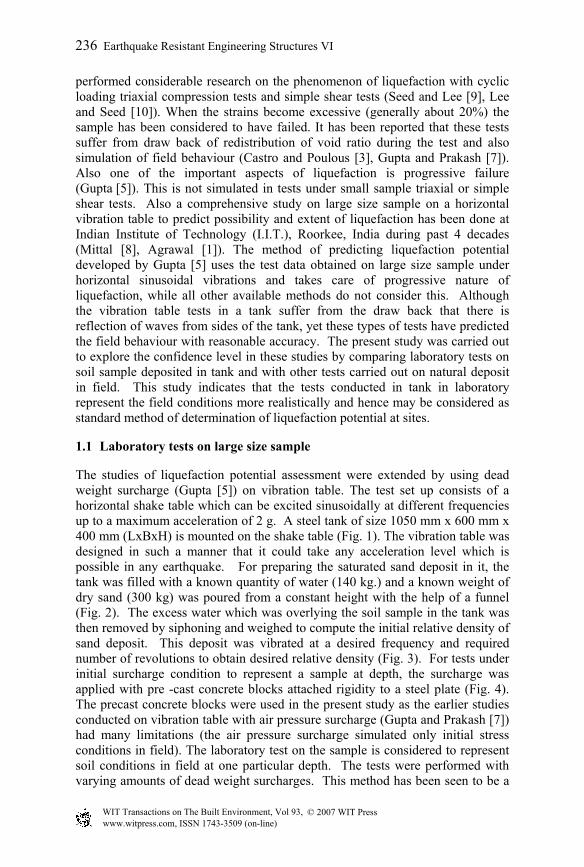
The studies of liquefaction potential assessment were extended by using dead weight surcharge (Gupta [5]) on vibration table. The test set up consists of a horizontal shake table which can be excited sinusoidally at different frequencies up to a maximum acceleration of 2 g. A steel tank of size 1050 mm x 600 mm x 400 mm (LxBxH) is mounted on the shake table (Fig. 1). The vibration table was designed in such a manner that it could take any acceleration level which is possible in any earthquake. For preparing the saturated sand deposit in it, the tank was filled with a known quantity of water (140 kg.) and a known weight of dry sand (300 kg) was poured from a constant height with the help of a funnel (Fig. 2). The excess water which was overlying the soil sample in the tank was then removed by siphoning and weighed to compute the initial relative density of sand deposit. This deposit was vibrated at a desired frequency and required number of revolutions to obtain desired relative density (Fig. 3). For tests under initial surcharge condition to represent a sample at depth, the surcharge was applied with pre -cast concrete blocks attached rigidity to a steel plate (Fig. 4). The precast concrete blocks were used in the present study as the earlier studies conducted on vibration table with air pressure surcharge (Gupta and Prakash [7]) had many limitations (the air pressure surcharge simulated only initial stress conditions in field). The laboratory test on the sample is considered to represent soil conditions in field at one particular depth. The tests were performed with varying amounts of dead weight surcharges. This method has been seen to be a
236 Earthquake Resistant Engineering Structures VI
© 2007 WIT PressWIT Transactions on The Built Environment, Vol 93, www.witpress.com, ISSN 1743-3509 (on-line)

realistic approach. The points in favour of this method are as follows: (1) the sample is prepared and consolidated under anisotropic conditions; (2) deformation occurs under plane strain conditions; (3) visually observed behavior of loose sands on vibration table is similar to what has been observed during an earthquake; (4) it is possible to trace actual pore water pressure distribution in a large mass of saturated sand during liquefaction; and (5) progressive nature of development of liquefaction during an earthquake is taken care of in the analysis which uses the vibration table test data.
Figure 1: A view of shake table. Figure 2: Rainfall technique of sample preparation.
The method suffers from the following limitations: (1) the shear stress can not be rigorously controlled in these tests as could be done in small sample in triaxial or simple shear apparatus; (2) uniform shear stress is not developed throughout the sand sample; and (3) grouping earthquake into suitable number of cycles requires an engineering judgment. To gain more confidence in use of steel tank for determination of liquefaction potential, a study has been done in a test pit also made in the natural soil. The details of this study and the comparison between test pit data and steel tank data are discussed in the subsequent paragraph.
2 Tests conducted
2.1 Soil used and its properties
In all the tests, the soil used was locally available Solani river sand. The grain size analysis of sand is shown in Fig. 5. Mean grain size of the sand is 0.15 mm
Earthquake Resistant Engineering Structures VI 237
© 2007 WIT PressWIT Transactions on The Built Environment, Vol 93, www.witpress.com, ISSN 1743-3509 (on-line)

and its uniformity coefficient is 1.9. According to Indian Standard Classification, the sand belongs to SP Group. The other properties of sand are shown below in Table 1.
Figure 3: Results showing relative density (Dri) versus no. of cycles.
Table 1: Properties of sand used.
Specific gravity Gs : 2.59 Maximum void ratio (emax) : 0.84 Minimum void ratio (emm) : 0.44
2.2 Vibration table
The test set up was same as used by Gupta [5] and also discussed in above lines. The tests were performed on the artificially saturated sand samples prepared as described above to study the effect of: (a) sample size (b) acceleration (c) initial relative density and (d) over burden pressure. To study the effect of sample size, the tests were conducted in 3 different sizes of tanks keeping other parameters constant. The tank sizes adopted were 1050 x 600 x 400 mm3, 800 x 600 x 400 mm3 and 600 x 600 x 400 mm3. It was found that higher tank size gives maximum increase in pore pressure, and the difference in rise in pore pressure between tanks of 1050 x 600 x 400 mm3 and 600 x 600 x 400 mm3 is marginal (Fig. 6). Hence, the tank of size as 1050 x 600 x 400 mm3 may be considered as reasonable size for liquefaction study. Figure 7 shows the plot between pore pressure and acceleration for different initial relative densities of the sample and a particular surcharge condition of 2.3 kN/m2. One of the curves shows
© 2007 WIT PressWIT Transactions on The Built Environment, Vol 93, www.witpress.com, ISSN 1743-3509 (on-line)
238 Earthquake Resistant Engineering Structures VI
increasing trend of pore pressure with the increase in acceleration up to a certain value of acceleration only. Then it starts decreasing. It means that at this level of pore pressure, the soil mass had completely liquefied. It is also noticed in the tests that the pore pressure is increased with increase in acceleration and the complete liquefaction did not occur up to an acceleration of 50%. The sand is seen to have liquefied during upward flow of water. Thus it can be stated that complete liquefaction occurred first at some depth below the surface and upper layers were liquefied subsequently. Figure 8 shows the plot between pore pressure and relative density with acceleration as 20% and 50% for surcharge as 2.3 kN/m2. The pore pressure line indicating the complete liquefaction is also drawn. It can be observed from this figure that with increase in initial relative density, the increment trend in excess pore pressure decreases and there is no rise in pore pressure after 90% relative density. In case of higher accelerations also, no increase in pore water pressure is observed beyond 90% sample density. A few tests were also tried for the sample density as 92%. At this density, the negative pore pressures were observed at acceleration of 60%g. Thus it can be stated that with the increase in intensity of acceleration and at higher relative densities, the dilation of soil takes place. It can be possible because the sand particles are supposed to be in tension, and also the interlocking of particles is broken and the expansion of soil mass in volume takes place. This phenomenon was observed in zero surcharge condition also. Therefore, in such circumstances, it is obvious that liquefaction will not occur and there will be increase in apparent effective stress. Castro [2] also reported that during the test on medium dense to dense sands under cyclic loading conditions in triaxial tests, dilation of sample is observed. He further concluded that if the sand is at relative density of more than 50% it may not liquefy (Green and Ferguson [4]).
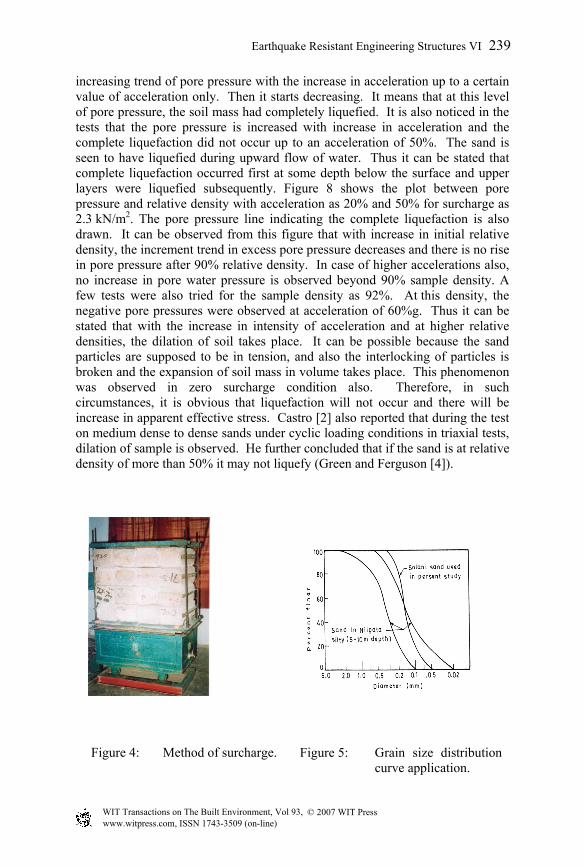
Figure 4: Method of surcharge. Figure 5: Grain size distribution curve application.
© 2007 WIT PressWIT Transactions on The Built Environment, Vol 93, www.witpress.com, ISSN 1743-3509 (on-line)
Earthquake Resistant Engineering Structures VI 239

Figure 6: Effect of tank size.
Figure 7: Pore pressure versus relative density.
Figure 8: Pore pressure versus acceleration.
The tests were conducted under three different overburden pressure, e.g. 2.3 kN/m2, 17 kN/m2 and 25 kN/m2. Figure 9 shows the plot between excess
240 Earthquake Resistant Engineering Structures VI
© 2007 WIT PressWIT Transactions on The Built Environment, Vol 93, www.witpress.com, ISSN 1743-3509 (on-line)
pore pressure and effective overburden pressure for acceleration of 50%g for different initial relative densities. Line AB shows complete liquefaction. For any point on this line, excess pore water pressure is equal to initial effective overburden pressure. Zone of complete liquefaction is also shown. From this figure, it is evident that pore pressure increases with increase in surcharge. But it can be anticipated that with further increase in overburden pressure, there will be no further rise in pore pressure. At this stage, the inter granular stresses are large to provide enough resistance against shear of sand particles and causing less pore pressure increase.
Figure 9: Pore pressure versus overburden pressure.
3 Field pit tests
The test consists of a pit in natural ground in which the sand sample is prepared. A mechanism to impart vibration to the deposit, an acceleration recording device and a pore water pressure measuring device were also provided. The test pit was 700 mm long, 550 mm wide and 400 mm deep (Fig. 10). The pit is made in the field and all the side walls are of the local soil. In order to make the pit impervious a thin coating of clay is done on all the four sides as well as the bottom. Further a very thin polythene membrane is stuck over the clay coating to check the mixing of clay with sand and to further check any seepage from the pit. The vibrations were imparted by exciting a concrete block with the help of an oscillator and a motor mounted over it (Fig. 11). The block is made of concrete at one side of pit and top of the block is at ground level. The size of block is 700 mm x 550 mm x 400 mm deep. The oscillator consists of shaft in pair, geared together and driven by a motor. Equal eccentric masses are mounted on the shaft at equal eccentricity (e) from the center of the shaft. The gears are so arranged that the shafts rotate in opposite directions. When the masses are in same horizontal plane, the horizontal component of centrifugal force cancels out, and the oscillator produces pure vertical sinusoidal vibrations. On the other hand
© 2007 WIT PressWIT Transactions on The Built Environment, Vol 93, www.witpress.com, ISSN 1743-3509 (on-line)
Earthquake Resistant Engineering Structures VI 241

if they are in same vertical plane, pure horizontal sinusoidal vibrations are produced. For variation of frequency in the test a D.C. motor was used in these investigations. For producing desired acceleration, the eccentricity is kept fixed and speed of motor is increased till the desired acceleration is achieved. The accelerations of 5%g, 10%g, and 30%g were achieved at frequency of 3 cps, 5 cps and 10 cps respectively. The accelerations are recorded with the help of an acceleration pick up. The signal is amplified through a universal amplifier and recorded on pen recording oscillograph. Increase in pore pressure during vibration is measured and recorded. The measurement is done with the help of a simple glass tube piezometer placed in the pit through a rubber tube 3 mm in diameter. At the end of the tube a porous stone is fixed to check the choking of tube with sand. There is a time lag in recording the increase in pore pressure with the generation of pore pressure. Thus maximum pore pressure recorded in the simple glass tube piezometer involves an error. The values recorded in this method are corrected as suggested by Gupta [5].
Figure 10: Sectional layout of
Figure 11: Test set up and vibrationproducing device.
4 Case study: design of road embankment
Liquefaction possibility was determined for bridge site using the laboratory and field pit test method described in this paper. The vibration table tests were conducted on soil sample obtained from the site. The site was located in Assam, India. The study indicates that during an expected earthquake the soil layers in about 15 m depth would liquefy (Fig. 12) and a dense effective over burden pressure of about 5 t/m2 may make the deposit safe against liquefaction (Fig. 13). Based on this information, the guide bund and approach road embankments were designed with suitable beams. Fig. 14 shows a typical section of the embankment. During the earthquake of Aug. 6, 1988 (magnitude = 6.8 with duration of 2 minutes), the road embankment and guide bunds designed by proposed technology performed satisfactorily.
test pit.

Figure 12: Liquefaction analysis of soil deposit.
Figure 13: Liquefaction analysis of soil deposit with 5 m dense overburden.
Figure 14: Typical section of approach road.
5 Conclusions
Based on the above study, following conclusions are drawn. (1) The size of tank (1050 mm x 600 mm x 400 mm) for evaluation of liquefaction potential from large sample tests gives maximum increase in pore pressure hence it can be recommended as a reasonable size of tank. (2) With increase in relative density, the increment in pore pressure decreases under vibration and chances of liquefaction are reduced. The sand may not liquefy if it is at relative density of more than 90%. In such circumstances, there is the reduction in shear strength
© 2007 WIT PressWIT Transactions on The Built Environment, Vol 93, www.witpress.com, ISSN 1743-3509 (on-line)
Earthquake Resistant Engineering Structures VI 243
under vibration in the sand particles on account of reduction in friction between sand particles. (3) Dead weight overburden pressure affects the liquefaction behaviour in a characteristic manner. The sand has been observed to have liquefied at some acceleration with increasing overburden pressure initially till a certain overburden pressure is reached. However, with further increase in overburden pressure beyond this value, the increase in pore pressure decreases and chances of liquefaction are reduced. (4) The dead weight surcharge device as adopted in the present investigation can be taken to represent the field conditions with sufficient degree of confidence. (5) There is a threshold value of acceleration below which the sand remains stable and beginning of pore water pressure starts only at acceleration larger than this. (6) The method proposed in the present study can be used to evaluate liquefaction potential at any site.
References
[1] Agrawal, S.K. (1990), “Large size sample test in field for study of liquefaction of sands”, ME Dissertation, University of Roorkee, India.
[2] Castro, G. (1975), “Liquefaction and cyclic mobility of saturated sands”, ASCE, Vol. 100, GT6, June 1975, pp.551-569.
[3] Castro, G. & Poulos, S.J. (1977), “Factors affecting liquefaction and cyclic mobility” ASCE, Vol. 103, GT pp 501-516
[4] Green P.A. and Ferguson, S. (1971), “On liquefaction phenomenon by Prof. A. Casagrande, Report of Lecture”, Geotechnique (London), Vol. XXI, No.3, pp. 197-202.
[5] Gupta, M.K. (1977), “Liquefaction off sands during earthquakes”, PhD Thesis, University of Roorkee, India.
[6] Gupta, M.K. and Prakash, S. (1978), “Investigations on liquefaction of sands”, Indian Geotechnical journal, Vol. 10, No. 4, pp.332-347
[7] Gupta, M.K. & Prakash, S. (1980), “Investigations on Liquefaction of sands”, Journal of Indian Geotechnical Society, Vol. 10, No. 4 2.
[8] Mittal, S. (1988), “Vibration table studies for prediction of liquefaction a critical study”, ME Dissertation, University of Roorkee, Roorkee, India.
[9] Seed, H.B. and Lee, K.L. (1966), “Liquefaction of saturated sands during cyclic loading”, Journal of Soil mechanics and Foundation division, ASCE, Vol. 92, No. SM1, pp 47-70
[10] Lee, K.L. and Seed, H.B. (1967), “Cyclic stress condition causing liquefaction of sand”, Journal of Soil Mechanics and Foundation Division, ASCE, Vol. 93, No.SM3, pp.83-108.
[11] Seed, H.B. and Idriss, I.M. (1967), “Analysis of soil liquefaction, Niigata Earthquake”, Journal of Soil Mechanics and Foundation Division, ASCE, Vol. 93, No.SM3, pp.83-108.
[12] Seed, H.B. and Idriss, I.M. (1970), “A simplified procedure for evaluating soil liquefaction potential”, University of California, Berkeley, Earthquake Engg. Research Centre, Report No.EERC 70-9
[13] Terzaghi, K. and Peck, R.B. (1948), “Soil mechanics in engineering practice”, John Wiley and Sons Inc, New York
© 2007 WIT PressWIT Transactions on The Built Environment, Vol 93, www.witpress.com, ISSN 1743-3509 (on-line)
244 Earthquake Resistant Engineering Structures VI