liquefaction simulation for the osaka gulf … · ... (print), 2186-2990 (online), ... supported in...
TRANSCRIPT
1
LIQUEFACTION SIMULATION FOR THE OSAKA GULF COAST
USING THE LIQCA PROGRAM
*Tetsuya Okano1, Keita Sugito2 and Ryoichi Fukagawa3
1,2 Graduate School of Science and Engineering, Ritsumeikan University, Japan, 3 Department of Civil
Engineering, Ritsumeikan University, Japan
*Corresponding Author, Received: 10June 2017, Revised: 17 Aug. 2017, Accepted: 20 Sept. 2017
ABSTRACT: A Nankai megathrust earthquake is expected to occur in the Kansai area within the next 30–40
years. According to the worst-case estimations by The Headquarters for Earthquake Research Promotion [1],
the earthquake will cause economic losses of approximately 220 trillion yen, and 134,000 buildings will be
damaged by liquefaction. To estimate future damage to the Osaka gulf coast, we conduct liquefaction
simulations based on the LIQCA program developed by the research group at Kyoto University. The
liquefiable layers are composed of relatively loose sand and the underground water level is high. The input
earthquake motion is the L2 spectrum Ⅰ earthquake-resistant standard spectrum, according to the Design
Standards for Railway Structures and Commentary [2]. We consider not only the increase of excess pore
water pressure, but also its dissipation. The calculated effective stresses in the sand layers approached 0, after
which the sand layers liquefied and unevenness occurred at the ground surface. We evaluated the damage due
to liquefaction by calculating vertical displacements and unevenness of the ground surface. Countermeasures
are proposed for the shallow sand layers to reduce future liquefaction damage.
Keywords: Liquefaction, Simulation, Nankai megathrust earthquake, Gulf coast, Unevenness
1. INTRODUCTION
A Nankai megathrust earthquake is predicted
for the Kansai area within the next 30-40 years.
The most recent Nankai megathrust earthquake
occurred in 1946 and the recurrence interval of this
type of earthquake is over 100 years, according to
The Headquarters for Earthquake Research
Promotion [1]. If a Nankai megathrust earthquake
were to occur, the economic losses would be
approximately 220 trillion yen, and 134,000
buildings would be damaged by liquefaction in the
worst-case scenario [3], [4]. In addition, a Tokai
megathrust earthquake has not occurred for 168
years, even though the recurrence interval of a
Tokai megathrust earthquake is also 100 years. It
is expected that a Tokai megathrust earthquake
would induce the occurrence of a Nankai
megathrust earthquake earlier than suggested by its
recurrence interval. A Nankai megathrust
earthquake would cause huge damage to the
Kansai area. Within this area, Osaka city has a
significant effect on the national economy and it
contains many embankment areas, which tend to
liquefy more than other natural ground types. In
addition, the high ground water levels of Osaka
city would enhance liquefaction.
Therefore, it is important to fully comprehend
soil liquefaction characteristics. This paper
presents an evaluation of ground liquefaction
characteristics for the Osaka Gulf coast. A
liquefaction analysis is implemented to assess the
liquefaction characteristics. For the scope of this
study, the Computer Program for Liquefaction
Analysis (LIQCA) is used. This software was
developed by the LIQCA Liquefaction Geo-
Research Institute (LIQCARI), consisting of
researchers from Kyoto and Gifu universities.
2. SIMULATION CONDITIONS
The subject of analysis in this research is a site
on the Osaka Gulf coast. A cross sectional view of
the study area is shown in Figure 1. The cross
section contains an embankment layer, which is
approximately 0.4 m to 0.5 m thick. The ground
water level is GL-2.3 m.
In this study, we consider the effect of a clay
layer (Ac1) and a structure on the liquid sand layer.
The influence of the Ac1 layer between the sand
layers Bs and As1 is evaluated by considering the
thickness of the Ac1 layer. In addition, the
influence of a structure is evaluated by comparing
the point that bears the load of the structure and the
point that does not bear any load. Point A is most
affected by the load of the structure and the clay
layer Ac1 is thinnest at this point. Point B does not
bear the load of the structure and the clay layer
Ac1 is thick here. Point C bears some of the load
of the structure and the clay layer Ac1 is
moderately thick at this point. By comparing the
results at these three points, we consider the effect
of the clay layer between the liquefaction target
layers and the liquefaction damage due to the
structure.
International Journal of GEOMATE, July, 2018 Vol.15, Issue 47, pp.1-6 Geotec., Const. Mat. & Env., DOI: https://doi.org/10.21660/2018.47.7308
ISSN: 2186-2982 (Print), 2186-2990 (Online), Japan

International Journal of GEOMATE, July, 2018 Vol.15, Issue 47, pp.1-6
2
Table 1 Material parameters of the R-O model
Bs
Ac1
Ac2
Ac3
Tc1 Tsg2 Tc2 Oc
Un-sat. Sat. Sat. Sat. Sat. Sat.
ρ 1.8 1.6 1.6 1.8 1.6 1.6
k 1.4
×10-6
9.0
×10-10
2.6
×10-7
1.2
×10-5
1.0
×10-7
7.5
×10-9 e0 0.658 1.038 0.724 0.777 1.098 1.799
Vs 120 120 200 260 208 208
ν 0.49 0.496 0.494 0.488 0.492 0.492 c
(kPa) 0 33 198 0 149 149
φ (deg)
30.9 0 0 34.0 0 0
a 6977 2241 4939 8530 4533 4165
b 0.5 0.5 0.5 0.5 0.5 0.5
α 1.89 - 2.3 2 1.4 1.5
r 1.92 - 2.1 3 1.7 1.6
Table 2 Material parameters of the cyclic elasto-
plastic constitutive model
Bs As1 As2 Tsg1
Sat. Sat. Sat. Sat.
ρ 1.8 1.8 1.8 1.8
k 1.5E-6 1.5E-6 1.1E-6 5.2E-6 e0 0.658 0.990 0.673 0.505
Vs 140 120 170 240
λ 0.002 0.002 0.1 0.001 κ 0.025 0.02 0.02 0.001
OCR* 1.3 1.0 1.0 1.6
G0/σ'm0 935.5 445.3 646.1 1104 M*m 0.909 0.909 0.909 0.909
M*f 1.012 0.966 0.958 1.215
B*0 3500 2500 5000 10000 B*1 80 50 100 200
Cf 0 0 0 0
γP* 0.02 0.002 0.02 0.005 γE*r 0.001 0.3 0.3 0.001
D*0 1 1.5 4 4
n 7 2 6 8 Cd 2000 2000 2000 2000
The cross section in Figure 1 includes a
structure in the form of a building, modeled as a
point load in the LIQCA program. It is
hypothesized that this point load will affect
liquefaction damage. We evaluate the effect of the
load on liquefaction through the presence and
absence of the load.
Analysis parameters are based on the Design
Standards for Railway Structures and Commentary
[2]. LIQCA specific parameters are based on their
operating manual. Dynamic parameters are
determined using element simulation.
At first, all soil layers are classified as those
that determine the target of liquefaction
(‘Liquefaction-Layers’) and those that determine
the non-target of liquefaction (‘Non-Liquefaction-
Layers’) based on [2]. Non-Liquefaction Layers
are modeled using the Ramberg-Osgood (R-O)
model. Liquefaction-Layers are modeled using the
cyclic elasto-plasticity constitutive model. The
parameters of these models are shown in Table 1
and Table 2, respectively.
The coefficients of permeability k of Bs, As1, As2,
and Tsg1 are determined based on a permeability
test conducted in the study area. The rest are
determined based on the Creager method. The
shear wave velocity, Vs, is determined from the
Design Standards for Railway Structures and
Commentary [2]. The Oc layer is considered as an
engineering base surface. The unit weight γ in the
Bs, As1, As2, and Tsg1 layers is determined from
a mean density soil test in the study area; the rest
are determined from the Design Standards for
Railway Structures and Commentary [2]. Other
specific parameters and the dynamic parameters
are determined using the LIQCA program and
element simulation.
Fig. 1 Cross section of the study area showing the different soil layers.

International Journal of GEOMATE, July, 2018 Vol.15, Issue 47, pp.1-6
3
2.1 Input Seismic Vibration
The input seismic vibration is the H24 L2
earthquake-resistant standard spectrum, shown in
Figure 2. It is designed by the Design Standards
for Railway Structures and Commentary [2].
Fig. 2 Input seismic vibration.
2.2 Element Simulation
The specific parameters of Liquefaction-Layers
are determined by fitting the liquefaction strength
curves from the Design Standards for Railway
Structures and Commentary [2]. The specific
parameters of Non-Liquefaction-Layers are
determined by fitting the dynamic deformation
characteristics from the Yasuda-Yamaguchi
equations [5].
The liquefaction resistance is regulated by the
number of cycles. The liquefaction layer is
supported in a simple shear test with a double
amplitude of axial strain (DA) of 7.5%, and the
number of cycles regulating the strength of the
liquefaction is 20. The cyclic shear stress ratios of
Bs, As1, As2, and Tsg1 are 0.43, 0.35, 0.31, and
0.31, respectively.
2.3 Initial Conditions
We conduct an initial effective stress analysis,
where the mean effective stress with static
overburden pressure is analyzed for the case where
the coefficient of earth pressure, K0, is 0.5. All
layers are modeled using the Drucker-Prager type
plasticity models. Poisson’s ratios are determined
as 0.33 for K0 =0.5. The Young’s modulus, E, was
determined by considering the influence of the
effective overburden pressure (Eq. 1), as follows:
𝐸 = 𝐸0𝜎𝑚0𝑛 (1)
𝑬𝟎 : Constant of proportionality of Young's
modulus (kN/m2)
𝝈′𝒎𝟎 : Average effective stress in initial stress
state (kN/m2)
The side boundary condition is the vertical
roller support and the bottom boundary condition
is fixed. After the effective stress analysis, all
displacements and pore water pressures are set to 0.
3. SIMULATION RESULTS
Here, we consider the results in terms of
displacements and acceleration, the effective stress
reduction ratio, the angle of rotation, and the
relationship between effective stress reduction and
volume strain, respectively.
3.1 Displacements and Acceleration
Figures 3, 4, and 5 show the time series of the
horizontal acceleration response, the horizontal
displacement response, and the vertical
displacement response, respectively. Table 3
shows the maximum absolute values of
displacement and acceleration on the ground
surface during shaking. Table 4 shows the
displacements on the ground surface during the
dissipation stage of excess pore water pressure.
Each horizontal acceleration of the output node
is converged. Once again, every output node is
selected from the ground surface on the
longitudinal plane. After all horizontal
accelerations are converged, a dissipation stage of
excess pore water pressure analysis is conducted.
The time series of horizontal acceleration show the
same trend and the maximum absolute value of
horizontal acceleration is approximately 2.0 m/s2
(Figure 3).
Each horizontal displacement of the output
node is converged, as with the horizontal
accelerations. The maximum absolute value of the
horizontal displacement of three output points is
approximately 0.847 m. Although the time series
of horizontal displacement show the same trend,
the final displacements are different (Figure 4).
The further to the right the point is on the
longitudinal plane, the larger the horizontal
displacement.
Again, each vertical displacement of the output
node is converged. The vertical sinking was largest
at point A, where the clay layer, Ac1, is thinnest
(Figure 5). Point B rose slightly due to lateral flow
from the thinnest point of the clay layer.
Looking at the time series, when maximum
acceleration occurred and the excess pore water
pressure rose sharply, the ground surface vibrated
slightly. After that, with dissipation of the excess
pore water pressure, points A and C experienced
vertical sinking. In response to this, the ground
surface at point B rose, but subsequently there was
slight vertical settlement following dissipation of
the excess pore water pressure of the target layer
under point B.
Regarding the effect of the structure, the
-600
-400
-200
0
200
400
600
0 50 100 150
耐震標準スペクトルⅠ Amax
=524.10(gal)
acc-y(cm/s2)
acc
-y(cm/s2)
time(s)

International Journal of GEOMATE, July, 2018 Vol.15, Issue 47, pp.1-6
4
ground surface of point A and point C dropped
significantly under the load. Because of this
reaction, the ground surface at point B underwent
significant flow. Since the ground surface at point
A received a larger load than point C, point A
dropped further.
After this, the excess pore water pressure
dissipated to between 1×10⁴ and 1×10⁸ seconds
and the ground surface at all points experienced
sinking.
Fig. 3 Time series of the horizontal acceleration
response.
Fig. 4 Time series of the horizontal displacement
response.
Fig. 5 Time series of the vertical displacement
response.
Table 3 Maximum absolute value of
displacements and acceleration on the ground
surface during shaking
Displacement (m) Acceleration (m/s2)
Horizontal Vertical Horizontal
A 0.847 -0.355 2.020
B 0.440 0.088 1.649
C 0.631 -0.163 2.079
Table 4 Displacements on the ground surface
during the dissipation stage of excess pore water
pressure
Horizontal
displacement (m)
Vertical
displacement (m)
A 0.846 -0.355
B 0.437 0.042
C 0.626 -0.162
3.2 Effective Stress Reduction Ratio
Figures 6, 7, 8, and 9 show the effective stress
reduction ratio of Bs, As1, As2, and Tsg1,
respectively. Table 5 shows the effective stress
reduction ratios during shaking. There is no Bs
layer at the B output point, so the table does not
include the effective stress reduction ratio of the
Bs layer.
The excess pore water pressures of the sand,
As1, As2, and Tsg1 layers rose more than that of
the Bs layer. Because the Bs layer is closer to the
ground water level than other sand layers, the
excess pore water pressure of the Bs layer
dissipated more quickly than that of the other
layers.
Regarding the difference between the output
points, point B required more time for dissipation
of the excess pore water pressure than other points.
We consider that the thickness of the upper clay
layer is related to the time required for dissipation
of the excess pore water pressure. A thicker clay
layer results in a longer dissipation time for the
sand layer.
Because As1, As2, and Tsg1 layers are above the
clay layer, Ac1, their dissipation times are longer
than that of the Bs layer.
Fig. 6 The effective stress reduction ratio of the Bs
layer.
Fig. 7 The effective stress reduction ratio of the
As1 layer.
Fig. 8 The effective stress reduction ratio of the As2 layer.
-3.0
-2.0
-1.0
0.0
1.0
2.0
3.0
0 50 100 150 200
ABC
Horiz
onta
l acc
. (m
/s2 )
Time (s)
-0.4
-0.2
0
0.2
0.4
0.6
0.8
1
0 50 100 150 200
ABC
Hori
zont
al d
is. (
m)
Time (s)
-0.4
-0.3
-0.1
0.0
0.1
0.3
1E+0 1E+2 1E+4 1E+6 1E+8
ABCV
ertical dis. (m)
Time (s)
0.0
0.2
0.4
0.6
0.8
1.0
1E+0 1E+2 1E+4 1E+6 1E+8
A
C
1-σ' m/σ
' m0
step (s)
0.0
0.2
0.4
0.6
0.8
1.0
1E+0 1E+2 1E+4 1E+6 1E+8
A
B
C
1-σ'm/σ
' m0
step (s)
0.0
0.2
0.4
0.6
0.8
1.0
1E+0 1E+2 1E+4 1E+6 1E+8
A
B
C
1-σ'm/σ
' m0
Time (s)
International Journal of GEOMATE, July, 2018 Vol.15, Issue 47, pp.1-6
5
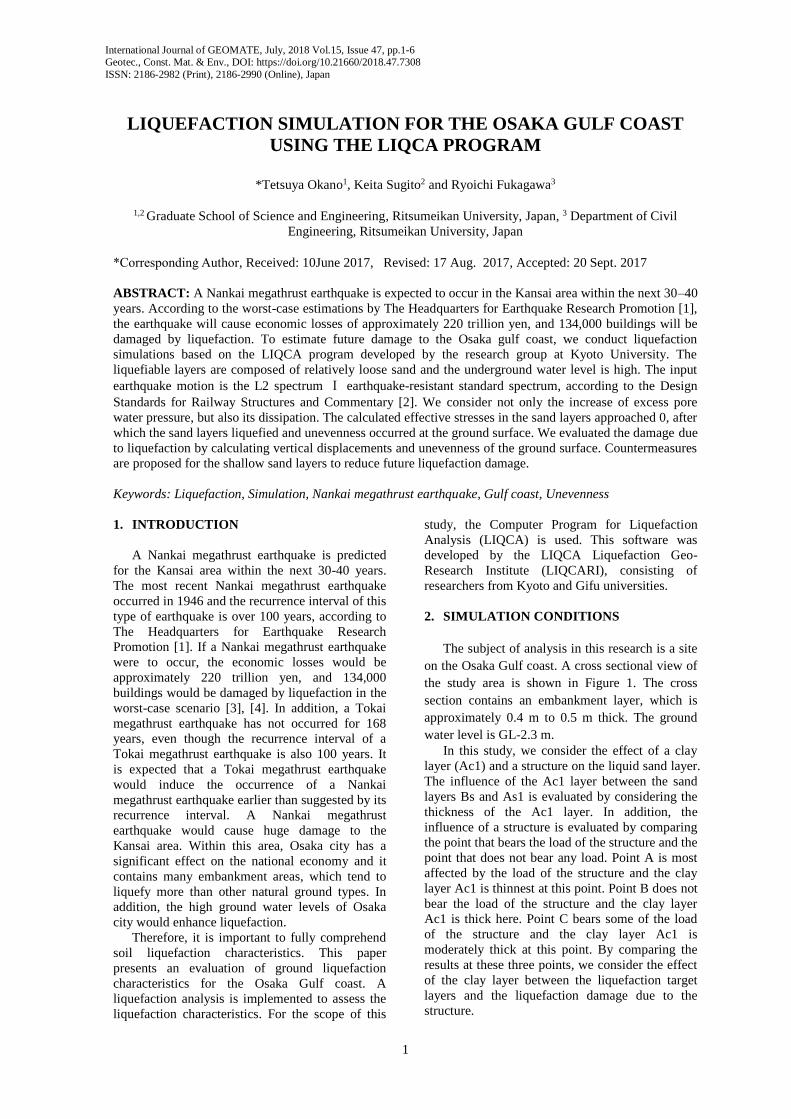
Fig. 9 The effective stress reduction ratio of the
Tsg1 layer.
Table 5 Effective stress reduction ratios during
shaking
Bs As1 As2 Tsg1
A 2.9% 61.3% 98.8% 98.8%
B - 79.5% 96.1% 96.7%
C 21.1% 55.4% 99.0% 99.0%
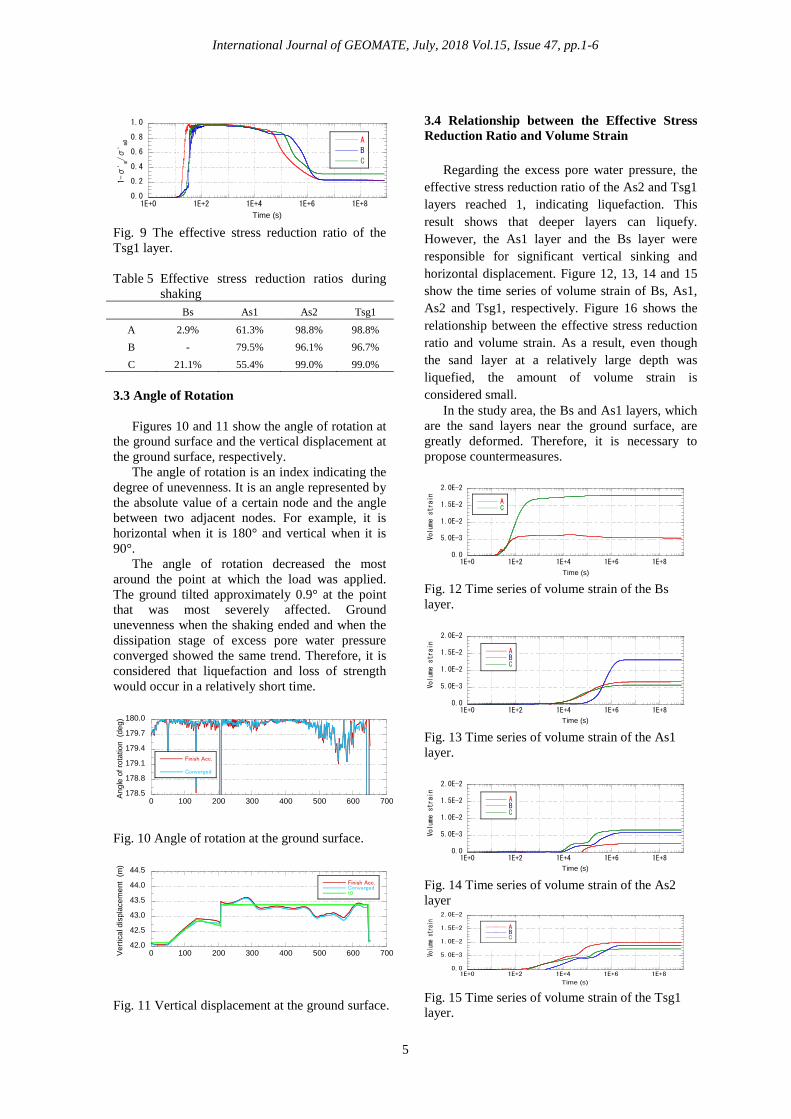
3.3 Angle of Rotation
Figures 10 and 11 show the angle of rotation at
the ground surface and the vertical displacement at
the ground surface, respectively.
The angle of rotation is an index indicating the
degree of unevenness. It is an angle represented by
the absolute value of a certain node and the angle
between two adjacent nodes. For example, it is
horizontal when it is 180° and vertical when it is
90°.
The angle of rotation decreased the most
around the point at which the load was applied.
The ground tilted approximately 0.9° at the point
that was most severely affected. Ground
unevenness when the shaking ended and when the
dissipation stage of excess pore water pressure
converged showed the same trend. Therefore, it is
considered that liquefaction and loss of strength
would occur in a relatively short time.
Fig. 10 Angle of rotation at the ground surface.
Fig. 11 Vertical displacement at the ground surface.
3.4 Relationship between the Effective Stress
Reduction Ratio and Volume Strain
Regarding the excess pore water pressure, the
effective stress reduction ratio of the As2 and Tsg1
layers reached 1, indicating liquefaction. This
result shows that deeper layers can liquefy.
However, the As1 layer and the Bs layer were
responsible for significant vertical sinking and
horizontal displacement. Figure 12, 13, 14 and 15
show the time series of volume strain of Bs, As1,
As2 and Tsg1, respectively. Figure 16 shows the
relationship between the effective stress reduction
ratio and volume strain. As a result, even though
the sand layer at a relatively large depth was
liquefied, the amount of volume strain is
considered small.
In the study area, the Bs and As1 layers, which
are the sand layers near the ground surface, are
greatly deformed. Therefore, it is necessary to
propose countermeasures.
Fig. 12 Time series of volume strain of the Bs
layer.
Fig. 13 Time series of volume strain of the As1
layer.
Fig. 14 Time series of volume strain of the As2
layer
Fig. 15 Time series of volume strain of the Tsg1
layer.
0.0
0.2
0.4
0.6
0.8
1.0
1E+0 1E+2 1E+4 1E+6 1E+8
A
B
C
1-σ' m/σ
' m0
Time (s)
178.5
178.8
179.1
179.4
179.7
180.0
0 100 200 300 400 500 600 700
Finish Acc.
Converged
An
gle
of
rota
tio
n
(de
g)
42.0
42.5
43.0
43.5
44.0
44.5
0 100 200 300 400 500 600 700
Finish Acc.Convergedt0
Ve
rtic
al dis
pla
ce
me
nt
(m
)
0.0
5.0E-3
1.0E-2
1.5E-2
2.0E-2
1E+0 1E+2 1E+4 1E+6 1E+8
AC
Volu
me
stra
in
Time (s)
0.0
5.0E-3
1.0E-2
1.5E-2
2.0E-2
1E+0 1E+2 1E+4 1E+6 1E+8
ABC
Volume strain
Time (s)
0.0
5.0E-3
1.0E-2
1.5E-2
2.0E-2
1E+0 1E+2 1E+4 1E+6 1E+8
ABC
Volume strain
Time (s)
0.0
5.0E-3
1.0E-2
1.5E-2
2.0E-2
1E+0 1E+2 1E+4 1E+6 1E+8
ABC
Volu
me s
trai
n
Time (s)

International Journal of GEOMATE, July, 2018 Vol.15, Issue 47, pp.1-6
6
Fig. 16 Relationship between volume strain and
the effective stress reduction ratio.
4. CONCLUSION
Liquefaction simulations using the LIQCA
program showed that the ground surface on the
Osaka gulf coast would sink by a maximum of
0.355 m and move horizontally by a maximum of
0.847 m due to liquefaction. In addition, if there is
a structure on the ground surface, the sand would
liquefy due to a sudden loss of strength.
Conversely, parts of the ground surface would rise
as a reaction to the sinking elsewhere.
Shallow sand layers were displaced more than
deep sand layers by liquefaction. Regarding the
effective stress reduction ratio, the shallow sand
layers did not liquefy much, although they did
experience significant sinking. The shallow sand
layers moved horizontally because Liquefaction-
Layers lose strength due to liquefaction. Therefore,
the possibility of damage of liquefaction on the
ground at Osaka Gulf Coast is considered high.
5. REFERENCES
[1] The Headquarters for Earthquake Research
Promotion, “Past earthquake occurrence
situation”, Earthquakes occurring in the
Nankai Trough, http://www.jishin.go.jp/main/ yosokuchizu/kaiko/k_nankai.htm (accessed
2017-06-05)
[2] Railway Technical Research Institute, Design
Standards for Railway Structures and
Commentary, 2012.
[3] Nihon Keizai Shimbun, Inc., “Estimated
damage amount of the Nankai Trough massive
earthquake”, Nankai Trough Earthquake,
damage amount of up to 220 trillion yen
Halved by reduction http://www.nikkei.com/ article/DGXNASDG1802L_Y3A310C100000
0/ (accessed 2017-06-05)
[4] Disaster Management, Cabinet office, “Aspect
of Immediate Disaster”, About the damage
estimate of the Nankai Trough massive
earthquake, http://www.bousai.go.jp/jishin/ nankai/taisaku_wg/pdf/20130318_shiryo2_1.p
df, (accessed 2017-0605)
[5] Yasuda S. and Yamaguchi I., “Dynamic soil
properties of undisturbed samples.”,
Proceedings of 20th Japan National
Conference on Geotechnical, 1985, pp539:542.
0.0
0.2
0.4
0.6
0.8
1.0
0.0 4.0E-3 8.0E-3 1.2E-2 1.6E-2 2.0E-2
BsAs1
As2
Tsg1
Eff
ective
str
ess
redu
ction
rat
io
Volume strain
Copyright © Int. J. of GEOMATE. All rights reserved,
including the making of copies unless permission is
obtained from the copyright proprietors.