liquid gating ptfe membranes to reduce fouling
TRANSCRIPT

The University of MaineDigitalCommons@UMaine
Electronic Theses and Dissertations Fogler Library
Spring 5-13-2017
Liquid Gating PTFE Membranes to ReduceFoulingJonathan C. OvertonUniversity of Maine, [email protected]
Follow this and additional works at: http://digitalcommons.library.umaine.edu/etd
Part of the Biology and Biomimetic Materials Commons, and the Membrane Science Commons
This Open-Access Thesis is brought to you for free and open access by DigitalCommons@UMaine. It has been accepted for inclusion in ElectronicTheses and Dissertations by an authorized administrator of DigitalCommons@UMaine.
Recommended CitationOverton, Jonathan C., "Liquid Gating PTFE Membranes to Reduce Fouling" (2017). Electronic Theses and Dissertations. 2656.http://digitalcommons.library.umaine.edu/etd/2656

LIQUID GATING PTFE MEMBRANES TO REDUCE FOULING
By
Jonathan C. Overton
B.S. Oklahoma State University, 2015
A THESIS
Submitted in Partial Fulfillment of the
Requirements for the Degree of
Master of Science
(in Biological Engineering)
The Graduate School
University of Maine
May 2017
Advisory Committee:
Caitlin Howell, Professor of Biological Engineering, Advisor
Paul Millard, Professor of Biological Engineering
Douglas Bousfield, Professor of Biological Engineering

LIQUID GATING PTFE MEMBRANES TO REDUCE FOULING
By Jonathan C. Overton
Thesis Advisor: Dr. Caitlin Howell
An Abstract of the Thesis Presented
in Partial Fulfillment of the Requirements for the
Degree of Master of Science
(in Biological Engineering)
May 2017
In the processing industry, fouling due to the accumulation of bioparticles or bacteria on
the surface of membranes results in decreased capacity, and subsequently requires
filtration membranes to require periodic cleaning, causing increased operating costs. In
this work, we evaluate the recently discovered concept of liquid-gated membranes
(LGMs) in both filtration characteristics, as well as their ability to facilitate passive
cleaning of membranes fouled with whey proteins. Additionally, we show that biofilms
formed on the surface of these membranes can be removed through exposure to an air-
water interface through a simple dipping step. We further analyze the mechanisms of
fouling in LGMs and determine how passive recovery is achieved. Through this work, we
provide a basic understanding of LGMs for industry applications. This work will serve as
a platform to future studies to fully quantify and evaluate the potential of LGMs to reduce
operating costs in filtration processes.

ii
ACKNOWLEDGEMENTS
I would like to first thank Dr. Caitlin Howell for her advising, feedback, and support of
this project. I am very appreciative of her constant guidance and communication
throughout the completion of this work. I also appreciate the input and support of my
other committee members, Dr. Doug Bousfield and Dr. Paul Millard. Your feedback and
analysis has helped to shape this project.
I would additionally like to thank my lab teammates, Abigail Weigang and Austin
Steward, for assisting with data acquisition for this project. I am grateful for the
assistance of Amos Cline and Alex Collins with helping me to design and install
instrumentation and prepare the lab for this work. I also thank Kelly Edwards for training
me in use of the SEM, his work has helped immensely. A final thank you is due to
Keegan McKim for his editing and proofreading of this thesis.
Funding for this project came from the University of Maine Vice President of Research
and the University of Maine Department of Chemical and Biological Engineering, as well
as the Wyss Institute for Biologically Inspired Engineering at Harvard University.

iii
TABLE OF CONTENTS
ACKNOWLEDGEMENTS................................................................................................ii
LIST OF TABLES.............................................................................................................vii
LIST OF FIGURES..........................................................................................................viii
Chapter
1. INTRODUCTION AND LITERATURE REVIEW
1.1. Thesis Perspective and Overview...........................................................................1
1.2. Objectives of This Study........................................................................................2
1.3. Literature Review...................................................................................................3
1.3.1. Membrane Applications…………………………………………………...3
1.3.2. Membrane Filtration………………………………………………………4
1.3.3. Membrane Fouling………………………………………………………...6
1.3.3.1. Particle Fouling……………………………………………………6
1.3.3.2. Biofilm Fouling……………………………………………………8
1.3.4. Preventing Membrane Fouling……………………………………………9
1.3.5. Removing Membrane Fouling…………………………………………...10
1.3.6. Super Hydrophobic Surfaces…………………………………………….11
1.3.7. Liquid Gated Membranes………………………………………………..14
1.3.8. Chemistry of Materials…………………………………………………..16
1.3.8.1. Polytetrafluoroethylene (PTFE)………………………………….16
1.3.8.2. Krytox Performance Lubricants………………………………….16
2. GENERAL METHODOLOGY
2.1. Creation of Liquid-Gated Membranes…………………………………………...18
2.2. Dead-End Filtration System…………………………..…………………………19
2.3. Bacterial Growth Conditions…………………………………………………….19
2.3.1. Culture Maintenance and Strain Information…………………………….19
2.3.2. Planktonic Growth……………………………………………………….20
2.3.3. Biofilm Growth…………………………………………………………..20
2.4. Scanning Electron Microscopy (SEM)…………………………………....…….21

iv
3. CHARACTERIZATION OF LIQUID-GATED MEMBRANES
3.1. Chapter Abstract……………………………………………………………..….22
3.2. Introduction………………………………………………………………...……23
3.3. Materials and Methods…………………………………………………………..23
3.3.1. Approximation of Lubricant Layer Thickness……………………………23
3.3.2. Determination of Clean Water Flux………………………………………24
3.3.3. Determination of Entry Pressure…………………………………………25
3.3.4. Filtration of Particles…………………………………………………......26
3.3.4.1. Microparticle Filtration…………………………………………..26
3.3.4.2. Filtration of Staphylococcus epidermidis………………………...26
3.3.5. Filtration of Whey Protein………………………………………………..26
3.4. Results……………………………………………………………………...……27
3.4.1. Approximation of Lubricant Layer Thickness……………………………27
3.4.2. Determination of Clean Water Flux………………………………………28
3.4.3. Determination of Entry Pressure…………………………………………29
3.4.4. Filtration of Particles…………………………………………………......30
3.4.4.1. Microparticle Filtration…………………………………………..30
3.4.4.2. Filtration of Staphylococcus epidermidis………………………...31
3.4.5. Filtration of Whey Protein………………………………………………..31
3.5. Discussion……………………………………………………………………….32
3.5.1. Approximation of Lubricant Layer Thickness……………………………32
3.5.2. Determination of Clean Water Flux………………………………………33
3.5.3. Determination of Entry Pressure…………………………………………33
3.5.4. Filtration of Particles…………………………………………………......34
3.5.4.1. Microparticle Filtration…………………………………………..34
3.5.4.2. Filtration of Staphylococcus epidermidis………………………...35
3.5.5. Filtration of Whey Protein………………………………………………..36
3.6. Conclusion………………………………………………………………………36

v
4. FLUX RECOVERY IN PROTEIN-FOULED LIQUID-GATED
MEMBRANES
4.1. Chapter Abstract……………………………………………………………...…38
4.2. Introduction………………………………………………………………….…..39
4.3. Materials and Methods………………………………………………………..…40
4.3.1. Passive Flux Recovery…………………………………………………...40
4.3.2. Flux Recovery through Backflushing……………………………………40
4.3.3. Passive Flux Recovery Combined with Backflushing…………………...40
4.3.4. Passive Flux Recovery over Repeated Cycles…………………………...41
4.4. Results……………………………………………………………………...……41
4.4.1. Passive Flux Recovery…………………………………………………...41
4.4.2. Flux Recovery through Backflushing……………………………………44
4.4.3. Passive Flux Recovery Combined with Backflushing…………………...44
4.4.4. Passive Flux Recovery over Repeated Cycles…………………………...45
4.5. Discussion……………………………………………………………………….45
4.5.1. Passive Flux Recovery…………………………………………………...45
4.5.2. Flux Recovery through Backflushing……………………………………46
4.5.3. Passive Flux Recovery Combined with Backflushing…………………...47
4.5.4. Passive Flux Recovery over Repeated Cycles…………………………...48
4.6. Conclusions…………………………………………………………………..….49
5. FLUX RECOVERY IN BACTERIA-FOULED LIQUID-GATED
MEMBRANES
5.1. Chapter Abstract…………………………………………………………...……50
5.2. Introduction……………………………………………………………………...50
5.3. Materials and Methods…………………………………………………………..51
5.3.1. Biofilm Growth on the Surface of LGMs……………………...…………51
5.3.2. Flux Through Biofilm-Fouled LGMs…………………………………….52
5.3.3. Flux Recovery in LGMs Fouled with Planktonic S. epidermidis…………53

vi
5.4. Results………………………………………………………...…………………54
5.4.1. Biofilm Growth on the Surface of LGMs……………………...…………54
5.4.2. Flux Through Biofilm-Fouled LGMs…………………………………….55
5.4.3. Flux Recovery in LGMs Fouled with Planktonic S. epidermidis…………56
5.5. Discussion…………………………………………………...…………………..57
5.5.1. Biofilm Growth on the Surface of LGMs……………………...…………57
5.5.2. Flux Through Biofilm-Fouled LGMs…………………………………….58
5.5.3. Flux Recovery in LGMs Fouled with Planktonic S. epidermidis…………59
5.6. Conclusions…………………………………………………………...…………60
6. MECHANISM OF FLUX RECOVERY IN LIQUID-GATED
MEMBRANES
6.1. Chapter Abstract………………………………………………………………...61
6.2. Introduction…………………………………………………………………...…62
6.3. Materials and Methods…………………………………………..………………63
6.3.1. Fitting of Flux Decline Equations……………………………………..….63
6.4. Results…………………………………………………...………………………65
6.4.1. Fitting of Flux Decline Equations………………………………………...65
6.5. Discussion………………………………………….……………………………68
6.5.1. Fitting of Flux Decline Equations………………………………………..68
6.6. Conclusions……………………………………...………………………………70
7. CONCLUSIONS
7.1. Review…………………………………………………………………..………71
7.2. Future Directions……………………………………………………………..…72
7.3. Summary………………………………………………………………………...72
WORKS CITED.................................................................................................................74
APPENDIX A. STANDARD CURVES FOR MICROPARTICLES
AND WHEY PROTEIN....................................................................................................80
APPENDIX B. FLUX DECLINE CURVES FOR WHEY PROTEIN
FILTRATION………………..…………………………………………………………..81
BIOGRAPHY OF THE AUTHOR....................................................................................84

vii
LIST OF TABLES
Table 6.1. Fit of Fouling Models to Initial Filtration…………………………….………65
Table 6.2. Fit of Fouling Models to Filtration After Recovery………………………….66
Table 6.3. Fit of Fouling Models to Short Fouling Times: Initial Filtration…………….66
Table 6.4. Fit of Fouling Models to Short Fouling Times: After Recovery……………..67
Table 6.5. Fit of Fouling Models over Repeated Filtration Cycles……………………...67
Table 6.6. Fit of Fouling Models During Filtration of Planktonic Bacteria……………..68

viii
LIST OF FIGURES
Figure 1.1. Configuration of a Dead-End Filtration System…...........................................5
Figure 1.2. Configuration of a Cross-Flow Filtration System………………………...…..5
Figure 1.3. Four Models of Membrane Fouling……………………………………..……6
Figure 1.4. Mechanics of Biofilm Formation………………………………………..……8
Figure 1.5. Schematic of Lotus-Inspired Hydrophobicity……………………………….11
Figure 1.6. Schematic of Nepenthes-Inspired Hydrophobicity………………………..…13
Figure 1.7. Schematic of the formation of a wrapping layer of
immobilized liquid due to the exposure to an air-water interface …………………..…..14
Figure 1.8. Schematic of Liquid-Gated Membrane………..…………………...………..15
Figure 1.9. Structure of PTFE………..………..………..………………………………..16
Figure 1.10. Structure of Krytox® Performance Lubricants………..………..…...……..17
Figure 2.1. Comparison of Control Membranes and LGMs………..………..…………..18
Figure 2.2. Schematic of Dead-End Filtration System………..………..………..………19
Figure 3.1. Lubricant Layer Thickness after Different Draining Methods………..…..…27
Figure 3.2. Sliding Angle after Different Draining Methods………..………..………….28
Figure 3.3. Deionized Water Flow Rate through LGMs………..………..………..…….29
Figure 3.4. Air and Liquid Entry Pressure in LGMs………..………..………..………...30
Figure 3.5. Effluent Microparticle Concentration………..………..………..……………30
Figure 3.6. Effluent S. epidermidis Concentration………..………..………..…………..31
Figure 3.7. Effluent Whey Protein Concentration………..………..………..…………...32
Figure 4.1. Demonstration of Evaluation of Flux Recovery………..………..…………..42
Figure 4.2. Passive Flux Recovery in Whey-Fouled LGMs………..………..…………..43
Figure 4.3. Flux Recovery in Whey-Fouled LGMs During Backflush………..………...44
Figure 4.4. Flux Recovery in Whey-Fouled LGMs by Combined Rest and
Backflush...........................................................................................................................44

ix
Figure 4.5. Flux Recovery over Multiple Cycles of Whey Filtration………..…………..45
Figure 5.1. Biofilm Coverage of Different Species on LGMs………..…………...……..54
Figure 5.2. Biofilm Coverage of S. epidermidis on LGMs of Different Pore Size……...55
Figure 5.3. Flux through LGMs Fouled with Biofilms and Cleaned through
Various Methods……….………………………………………………………………..56
Figure 5.4. Passive Flux Recovery in LGMs Fouled with Planktonic S. epidermidis…...56
Figure A.1. Standard Curve for Microparticle Concentration………………………...…80
Figure A.2. Standard Curve for Whey Protein Concentration……………………...……80
Figure B.1. Flux Decline Curves for Non-Lubricated Controls Cleaned by
Passive Rest…………………………………...…………………………………………81
Figure B.2. Flux Decline Curves for LGMs Created with Krytox 103
Cleaned by Passive Rest…................................................................................................82
Figure B.3. Flux Decline Curves for LGMs Created with Krytox 107
Cleaned by Passive Rest…................................................................................................83

1
Chapter 1
INTRODUCTION AND LITERATURE REVIEW
1.1 Thesis Perspective and Overview
The use of membrane filtration systems is almost ubiquitous in bioprocessing
operations such as product separation, juice clarification, and wastewater treatment. The
physical separation of solutes based on size allows for highly selective separation systems
to be designed without the considerations for molecule charge, solubility, and density that
other separation processes such as centrifugation, precipitation, adsorption,
chromatography, electrophoresis, and liquid-liquid extractions require. In theory,
membrane separation systems can be run continuously at high flow rates. However, in
application, membrane applications have been hindered by fouling on the membrane
surface. This fouling increases the pressure differential required to operate the membrane
and reduces the flow rate of the membrane system. In industrial application, this reduces
the productivity of the system, and therefore the profitability.
Due to the build-up of fouling, sustained membrane operation requires intermittent
cleaning of the membrane surface to allow for continued operation at higher flow rates.
Current “active” cleaning processes often damage the membrane, reduce the lifespan, and
fail to remove all fouling from the membrane surface. In recent years, many technologies
have been developed to reduce or remove fouling effects. These approaches have focused
on modifying membrane surfaces to reduce the binding of molecules or inducing shear
forces at the membrane interface to reduce the formation of cake layers. However, these
approaches are often transient or rely on expensive fabrication techniques. The membrane

2
industry needs an inexpensive solution to fouling that allows for cost-effective recovery
of flux. In this thesis, the filtration characteristics of the newly discovered liquid-gated
membranes are evaluated and the ability of these membranes to clean both protein and
bacterial foulants through passive and active methods is assessed. This thesis further
serves to bridge the gap between scientific evaluation and industry application of liquid-
gated membranes.
1.2. Objectives of This Study
The purpose of this work was to further the understanding of immobilized liquid-layers
and their application to membrane surfaces in the form of liquid-gated membranes. Basic
characterization of these membranes was performed to better understand the effects of
liquid layers on filtration properties. Furthermore, the effectiveness of liquid-gated
membranes at reducing the attachment or adhesion strength of membrane foulants, such
as proteins and bacteria was evaluated. It was found that allowing lubricated membranes
fouled with proteins to rest for a time period resulted in the recovery of membrane flux,
suggesting a cleaning action during the resting step. Further work was performed to
quantify this recovery and clarify the mechanism through which recovery is achieved.

3
1.3. Literature Review
1.3.1. Membrane Applications
Membranes are used for the removal or isolation of particles from liquid in a number of
industries. For example, membranes are commonly used in the separation and
purification of value added products, such as proteins [1,2] and biologically produced
commodity chemicals.[3–6] Additionally, membranes are often used in the dairy industry
to separate proteins and bacteria from milk.[7–9] Membrane filtration is further used in the
beverage industry to remove suspended cells and other particles accumulated during the
harvest and processing of juices.[10–15] Additionally, membranes have been found to be
effective in treating water for recirculation in pulp and paper mills, reducing the amount
of freshwater required per ton of paper.[16,17] Membranes can also be used to purify
drinking water through the removal of microorganisms, salts, and other particles;
however, membranes used to filter surface water are highly susceptible to fouling due to
their small pore size and the high fouling capacity of surface water. [18–21] Membranes can
be further used to purify complex industrial wastewater in Anaerobic Membrane
Bioreactors (AnMBR), where the solid retention time of the sludge is separated from the
hydraulic retention time.[22] This allows bacteria to degrade contaminants over long time
periods while constant production of clean water is still achieved, but membranes in this
setup are highly susceptible to fouling through formation of biofilms and cake layers at
the membrane interface.[23–31]

4
1.3.2 Membrane Filtration
The main force that drives membrane filtration is pressure differential across the
membrane. Because of this, there are two modes of operation for membrane processes:
constant pressure filtration and constant flow rate filtration. In constant pressure
filtration, the transmembrane pressure (TMP) is held constant. In the absence of fouling
the membrane flow rate is constant (Equation 1.1), however, when fouling is present, the
membrane resistance increases due to increasing fouling resistance and subsequently the
flow rate decreases according to (Equation 1.2).[32]
Q = ��
�(��) (1.1)
where Q is the flow rate through the membrane ΔP is the transmembrane pressure, µ is the viscosity of the liquid being filtered, and Rm is the resistance of the membrane to flow.
Q = ��
�(�����) (1.2)
Where Q is the flow rate through the membrane ΔP is the transmembrane pressure, µ is the viscosity of the liquid being filtered, Rm is the resistance of the membrane to flow, and Rf is the resistance due to fouling.
In constant flow rate filtration, the flow rate across the membrane is maintained at a set
value, often through volume displacement methods. In this configuration, TMP is
increased to overcome elevated membrane resistance as fouling occurs.
Each mode of operation can be run as either dead-end filtration or cross-flow filtration. In
dead-end filtration fluid flow is perpendicular to the membrane surface as seen in Figure
1.1.

5
Figure 1.1. Configuration of a dead-end filtration system. Particles (circles) flow with the feed stream and perpendicular to the membrane (squares).
In cross-flow filtration, fluid flows tangential to the membrane surface, as well as
perpendicular to the membrane, (Figure 1.2). The shear of fluid flow across the
membrane surface helps to reduce the accumulation of a cake layer on the membrane
during filtration.[32] A pressure gradient is applied across the membrane to drive flow
through the membrane.
Figure 1.2. Configuration of a cross-flow filtration system. Particles (circles) flow with the feed stream tangential to the membrane (squares). Particles are concentrated as liquid is removed across the membrane. A pressure differential allows for some of the feed stream to be pulled across the membrane.

6
1.3.3. Membrane Fouling
Membrane fouling poses a major issue in membrane technology as accumulation of
foulants leads to reduced membrane flux resulting in a loss of process productivity.[33]
The three major categories of fouling are adsorption of macromolecules, adsorption of
inorganic particles (scaling), and fouling due to the adhesion and accumulation of
bacteria and biofilms (biofouling). Biofouling can be caused by either the direct growth
of organisms on the membrane surface[34] or the deposition of polysaccharides and
proteins on the surface.[35]
1.3.3.1. Particle Fouling
Currently, four models exist to describe the way in which fouling by particles, either
inorganic or organic, occurs. These models are standard blocking, complete blocking,
cake filtration, and intermediate blocking as seen in Figure 1.3.[36,37]
Figure 1.3. Four models for particle fouling. Standard blocking (A) where the pore (represented by squares) is lined with small particles (circles), complete blocking (B) where the pore is entirely blocked by a particle, cake filtration (C) where a layer of particles results in blocking of the pore, and intermediate blocking (D) where particles build-up on the membrane surface and some particles block pores.

7
Each of these four models can be mathematically represented by applying a different
value of ‘n’ to the constant pressure filtration equation,
���
���=
��
��
� (1.3)
where n is a constant dependent on the type of fouling that occurs, t is the time of filtration, and V is the volume filtered.
Standard blocking, where n is equal to 1.5, is the deposition of particles along the wall of
the pore. As such, the cross section of each pore decreases over time. The value of 1.5 is
calculated with the assumption that membrane pores are consistent in length and
diameter. In complete blocking, all molecules that contact the membrane surface are
assumed to entirely cover the pore of the membrane and no stacking of molecules occurs.
The value of n in this model is 2.[36,37] The cake filtration model has an n-value of 0. In
the cake filtration model particles accumulate on the surface of the membrane and stack
on each other reducing the permeability of the layer as more particles are added, in
addition to blocking the pores.[36,37] As a greater volume is filtered, the resistance of the
membrane is increased. Intermediate blocking serves as a model that helps to bridge
between standard blocking and cake filtration. In intermediate blocking, particles that
contact the surface are assumed to partially occlude the pore, and in this model, may
stack on top of already deposited particles. This model effectively describes the
probability of a pore being blocked by deposition of a particle on the membrane surface
and the n-value for this model is 1.[36] By fitting the decay of membrane flux to
dimensionalized versions of these models and calculating a value for n, it is possible to
determine what type of fouling is present in a membrane system.[38–40]

8
1.3.3.2.Biofilm Fouling
The formation of biofilms on membrane surfaces is a complex phenomenon that results
in a layer of bacteria and proteins that is difficult to remove.[41,42] In general, bacterial
adhesion can be classified as reversible or irreversible, depending on whether they can be
gently removed by a surface rinse.[41] Reversible adhesion can be a result of cellular
surface proteins or chemiosmotic forces while irreversible attachment is achieved through
the excretion of extracellular polysaccharides and protein interactions with specific
ligands. Irreversible attachment most frequently results in the formation of a biofilm as
seen in Figure 1.4.[43,44]
Figure 1.4. Mechanics of Biofilm Formation. Initial attachment (A) leads to the formation of microcolonies (B) followed by the attachment of other species and growth of the initial biofilm (C), with the final result being a mature, multi-species biofilm (D). Reprinted from Rickard et al.[44] (2003) with permission from Elsevier.

9
Flagella, present in certain species, can play a role in both reversible and irreversible
adhesion to solids.[45–47] Bacteria that adhere to a solid surface will either eventually
begin to secrete extracellular polymeric substances (EPS), resulting in a biofilm, or leave
the surface and return to a planktonic state.[48]
One challenge in removing these biofilms is that shear stress has been shown to increase
the adhesion strength of bacteria. For example, when exposed to shear stress Escherichia
coli activate catch-bonds, resulting in an increased resistance to shear.[49] Additionally,
bacteria in biofilms are more resistant to chemical removal methods through reduced
diffusivity of anti-bacterial agents[50,51] and phenotypic changes of bacteria in biofilms.[51–
53] The development of a surface that allows for low-energy removal of adhered biofilms
is required to improve processes hindered by biofilms.
1.3.4. Preventing Membrane Fouling
One method to prevent the accumulation of foulants on the surface of membranes is gas
sparging. In gas sparging, a gas is injected across the surface of the membrane and
reduces the adhesion of macromolecules to the membrane surface.[54–58] However, Ghosh
et al. showed that the effectiveness of gas sparging can be impacted by the configuration
of the membrane,[59] illustrating the inability of gas sparging to prevent membrane
fouling in all applications. Another method to prevent foulant accumulation is using
cross-flow filtration to reduce the accumulation of foulants on the membrane surface.[60]
In cross-flow filtration, the flow of the feed stream is parallel to the membrane surface, as
previously described (Section 3.2). This leads to a reduction in the accumulation of
colloidal foulants on the membrane surface; however, fouling still occurs within the
membrane pores, leading to flux decline which requires additional cleaning to recover

10
flux.[61] Additional methods to mitigate fouling during membrane filtration include pre-
treating the feed stream with coagulants,[62] mechanically vibrating the membrane,[29] and
chemically modifying the membrane surface.[63,64]
1.3.5. Removing Membrane Fouling
Once fouling has occurred, several methods exist to clean membranes and can generally
be classified as physical methods or chemical methods. Physical cleaning includes the
use of scraping, such as in continuous rotary filtration systems, where a layer of foulant is
removed from the rotating drum by a blade.[32] Another method of physical cleaning is a
backflush step, where water flows through the membrane in reverse to help push foulants
out of the pores and off of the membrane surface.[61] Backflushing can be performed
either after a membrane is fouled[65] or at set intervals throughout filtration to help reduce
the accumulation of foulants.[2,66] Ultra-sonic vibration (sonication) of membranes has
also been used to clean fouled membranes[67–69] although the use of sonication has been
shown to cause damage to the membrane, reducing its longevity.[68]
Chemical surface cleaning can be performed using a variety of chemical agents to
remove foulants. Hydrochloric acid, phosphoric acid, oxalic acid, sodium hydroxide,
ammonia, ammonium chloride, bleach, detergents and surfactants have all been used to
remove foulants from membrane surfaces.[70–74] The use of harsh chemicals has been
shown to cause damage to membranes and reduce the operational lifespan of the
membrane.[74,75]

11
1.3.6. Super Hydrophobic Surfaces
Super hydrophobic surfaces are being investigated as a new method to create non-fouling
surfaces. Early methods to create liquid-repellent surfaces relied on the use of surface
structures to cause liquid repulsion via the Cassie-Baxter model. These methods were
inspired by the leaves of the Lotus plant[76] and have worked well against liquids with
high surface tension at ambient temperatures. However, these surfaces fail to repel liquids
with low surface tension, under high pressure[77], high temperature [78], and high
humidity.[79] In addition, the flagella of E. coli are able to penetrate these microstructures
and aid in the formation of a biofilm on these microstructured surfaces.[80] To better
understand the failures of these materials under non-ambient conditions, the underlying
physics of Lotus leaf inspired surfaces must be understood. These surfaces rely on the
presence of pockets of air supporting the water droplet on top of the surface (Cassie-
Baxter state) as shown in Figure 1.5A. When exposed to conditions that compress the
pocket of air, the droplets are allowed to wet the surface, which signifies a transition into
the Wenzel state as seen in Figure 1.5B.
Figure 1.5. Schematic of Lotus-Inspired Hydrophobicity. Schematic of the Cassie-Baxter (A) and Wenzel (B) states for a contaminating liquid (orange). Adapted from Sotiri et al. 2016.

12
Research has been performed to make Lotus-inspired surfaces repel low surface tension
liquids[81,82], however, due to the inherent dependence on physical surface structure,
Lotus-inspired designs can lose the ability to repel liquids when surface damage
occurs[77]. This drawback limits the applications of Lotus-inspired designs in industry. To
overcome the shortcomings of Lotus-inspired designs a new model for super-
hydrophobic surfaces was necessary. Inspired by the carnivorous Nepenthes pitcher plant,
which uses highly wettable microstructures to create a smooth liquid surface, causing
insects to slide into the cup of the plant, Slippery Liquid-Infused Porous Surfaces
(SLIPS) were introduced by Wong et al.[83,84] Omniphobic SLIPS rely on the creation of
an immobilized layer (IL) of immiscible material on the substrate surface. To maintain a
stable liquid layer, the following thermodynamic conditions must be met by the system:
��� + �� < ��� + ��
where γSB is the interfacial tension of the substrate (S) and infusing liquid (B), γSA the interfacial tension of the substrate and the contaminating liquid (A), γA the surface tension of the contaminating liquid (A), and γB the surface tension of the infusing liquid (B).
This means that it is more energetically favorable for the infusing liquid to wet the
substrate surface than the contaminating liquid, causing the contaminating liquid to sit on
top of the immobilized liquid as described in Figure 1.6. These energetic conditions can
be accomplished through entrapping the infusing liquid through capillary forces and
increasing the affinity of the substrate surface for the infusing liquid. Physical entrapment
is created by creating surface roughness at the micro-, nano-, and molecular scales. The
affinity of the substrate and infusing liquid can be increased through functionalization of
the substrate surface with chemical modifiers. When these thermodynamic conditions are
met, a homogenous, stable, and highly repellent surface is created. These surfaces have

13
been shown to maintain repellent characteristics at pressures as high as 676 atm[84] and
with mechanical surface damage up to 33% of the total surface area.[85]
Figure 1.6. Schematic of Nepenthes-Inspired Hydrophobicity Schematic of contaminating liquid (circle) on top of a liquid immobilized (top rectangle) to a solid surface (bottom rectangle). Adapted from Sotiri et al. 2016.
SLIPS have been shown to be stable when exposed to shear rates relevant to the
healthcare industry, however, exposure to an air water interface has been shown to strip
lubricant from the IL.[86] This lubricant loss is due to the creation of a lubricant wrapping
layer forming at the air-water interface, allowing the lubricant to move with the air-liquid
interface and therefore be removed as seen in Figure 1.7.[87,88] SLIPS have been
fabricated using immobilized liquids of silicone oil,[84,89] canola oil,[90] coconut oil,[90]
olive oil,[90] and perfluoropolyethers[91] immobilized on a variety of solids with
preexisting porous structures or porous structures created during modification.[90,92]

14
Figure 1.7. Schematic of the formation of a wrapping layer of immobilized liquid due to the exposure to an air-water interface. This allows immobilized liquid to be removed from the solid substrate. Reprinted with permission from Howell et al.[86] Copyright (2015) American Chemical Society.
Surfaces with ILs have been shown to reduce the adhesion of proteins,[93,94] salts,[95,96]
and bacteria.[89,91] In addition, SLIPS fabricated with polytetrafluoroethylene (PTFE) and
perfluorinated liquids was shown to reduce biofilm adhesion of Staphylococcus aureus
by 97.2% under static conditions for 48 hours, and biofilm adhesion of Pseudomonas
aeruginosa by 99.6% at a flow rate of 10 mL min-1 over a 7 day period.[91] A significant
advantage of using these surfaces to repel bacteria is that bacteria are not killed,[91] but
rather repelled from the surface, reducing the likelihood of applying a selection pressure
which could lead to the development of bacterial resistance. However, the interactions of
ILs with bacteria are complex and not well understood, especially under dynamic
conditions, and the adhesion strength of bacteria appears to be strain dependent.[97]
Further work is necessary to better understand the interactions between bacteria and ILs.
1.3.7. Liquid Gated Membranes
Hou et al. introduced the concept of liquid-gated membranes (LGMs), created with
polytetrafluoroethylene (PTFE) and Krytox lubricants, and showed that LGMs did not
allow the adhesion of salt, dye, and protein to a microchannel lined with an IL.[96] They
further showed that the entry pressure of deionized (DI) water was reduced in LGMs

15
compared to non-lubricated controls. As seen in Figure 1.8, a notable feature of LGMs is
that when a critical pressure is applied, the infusing liquid lines the sides of the pores and
when pressure is released, the infusing liquid refills the pore as it returns to equilibrium.
While their work served to introduce and characterize the concept of LGMs in small scale
systems, it failed to quantify fouling rates or evaluate the increase in cleaning efficiency
in LGMs, compared to non-lubricated controls. In order for LGMs to be incorporated into
industry processes, it is essential that their interactions with proteins and bacteria, as well
as the efficiency of common membrane cleaning techniques be evaluated for LGMs. An
important step to better understand LGMs is modelling, which can be achieved through
the use of core-annular flow equations.[98] Using these equations, Bazyar et al. show that
the time required for the pores to be refilled was more dependent on the thickness of the
layer lining the pore than the viscosity of the infusing liquid for viscosities ranging from
4.4 to 800 cSt. The thickness of this layer was further shown to be dependent on the
pressure applied to the membrane.[98]
Figure 1.8. Schematic of liquid-gated membrane (LGM) before (left) and after (right) critical pressure is applied. Adapted from Hou et al. 2015.

16
1.3.8. Chemistry of Materials
1.3.8.1 Polytetrafluoroethylene (PTFE)
Polytetrafluoroethylene (PTFE) is a straight-chain polymer of tetrafluoroethylene (Figure
1.9) and is known for its high maximum use temperature (> 260 °C), hydrophobicity, and
relatively low coefficient of friction.[99] The hydrophobicity of PTFE presents an issue
when used for filtration of biological materials since proteins with hydrophobic domains
tend to cling to PTFE due to hydrophobic interactions. Additionally, the hydrophobicity
of PTFE membranes results in a higher energy requirement to push water through the
membrane. To overcome the hydrophobicity of PTFE membranes and reduce the energy
to push water through the membrane, chemical modifications to the PTFE surface are
made. Some of these modifications include plasma treatment with a C2H2:N2 mixture[100]
or the creation of a thin film of dihydroxyphenylalanine (DOPA) or 3,4-
dihydroxyphenethylamine (dopamine) on the membrane surface.[101] While these
methods increase the pure water flux through the membrane, large-scale fabrication of
these membranes would be complex and costly, resulting in increased membrane cost to
consumers.
Figure 1.9. Structure of PTFE. Chemical structure of PTFE monomer.
1.3.8.2. Krytox Performance Lubricants
Krytox performance lubricants® are perfluoropolyethers and are currently widely used as
machine oils. The Krytox lubricants used in this work were Krytox 103 and Krytox 107

17
which have viscosities of 82 cSt and 1535 cSt, respectively.[102] These lubricants consist
of approximately 21.6% carbon, 9.4% oxygen, and 69% fluorine by weight.[103] The
Chemical Abstracts Index name for Krytox is oxirane, trifluoro (trifluoromethyl)-
homopolymer. The CAS Registry Number is 60164-51-4.[102] The structure of a Krytox
monomer is shown in Figure 1.10. To create oils of varying viscosities, the length of the
polymer is altered between 10 and 60 units.[102] Due to its saturation with fluorine, Krytox
is not miscible with many common solvents including acetone, ethanol, and water,
making it a good machine lubricant.[104] However, due to the saturation of Krytox with
fluorine, it is completely miscible in fluorinated solvents such as perfluorohexane,
perfluoroctane, and hexafluorobenzene.[104] It has previously been shown that heavily
fluorinated compounds, such as Fluorinert FC-70, are able to penetrate into PTFE
films,[105] due to a partitioning of fluorinated liquids into a fluorinated solid matrix caused
by weak van der Waals interactions per area of molecular contact.[106] This penetration
allows fluorinated liquids to saturate a solid matrix. This phenomenon can be used to
create an immobilized layer of fluorinated liquid on the surface of the solid substrate. In
the same vein, Krytox performance lubricants are able to penetrate into PTFE porous
membranes.[91]
Figure 1.10. Structure of Krytox ® Performance Lubricants. Chemical structure of
Krytox lubricant monomer.

18
CHAPTER 2
GENERAL METHODOLOGY
2.1. Creation of Liquid-Gated Membranes
To create liquid-gated membranes 200 µL of Krytox perfluoropolyether performance
lubricants of varying viscosities were added drop-by-drop to the surface of PTFE
membranes. After allowing the lubricant to wet the entire membrane, marked by a change
in transparency of the membrane from opaque to transparent as seen in Figure 2.1, the
membrane was suspended vertically allowing excess lubricant to drip off the membrane.
After this, the membrane was wiped gently with a paper towel to further remove excess
lubricant. Membranes were lubricated immediately before use to increase consistency
across experiments.
Figure 2.1. Comparison of Control Membranes and LGMS. Non-gated membrane (left) and a liquid-gated membrane (right). Note the slight difference in transparency and surface shininess between non-gated membranes and LGMs.
19
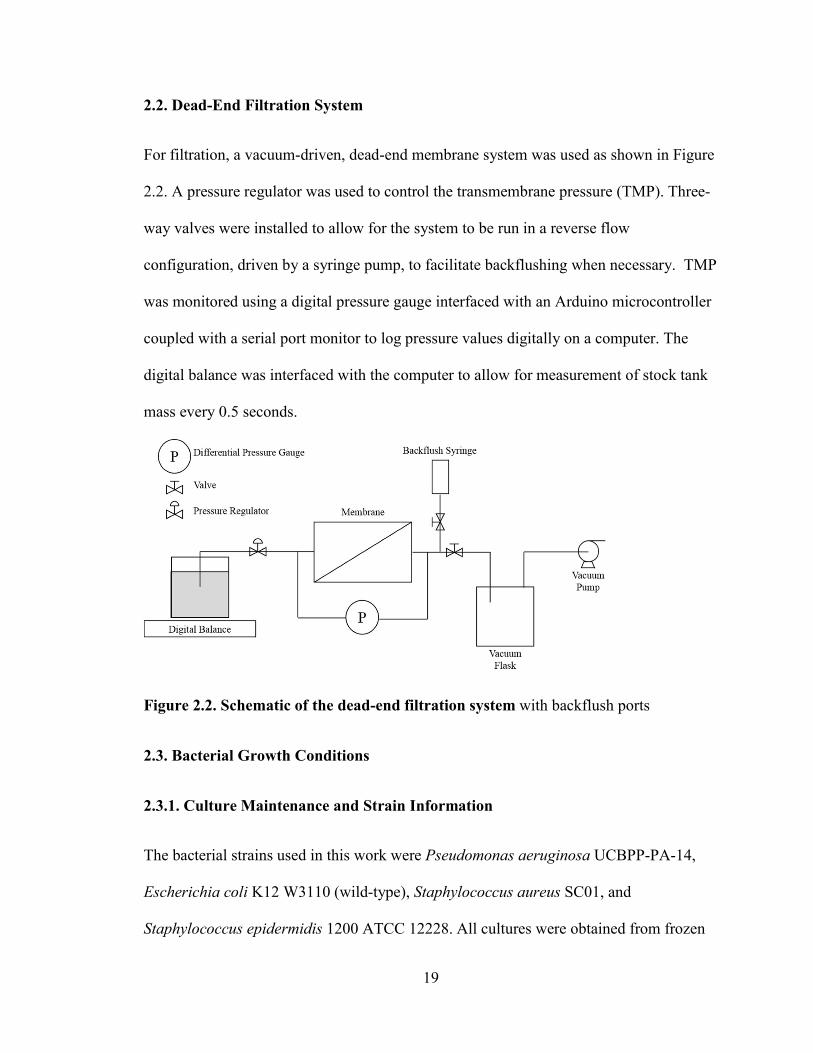
2.2. Dead-End Filtration System
For filtration, a vacuum-driven, dead-end membrane system was used as shown in Figure
2.2. A pressure regulator was used to control the transmembrane pressure (TMP). Three-
way valves were installed to allow for the system to be run in a reverse flow
configuration, driven by a syringe pump, to facilitate backflushing when necessary. TMP
was monitored using a digital pressure gauge interfaced with an Arduino microcontroller
coupled with a serial port monitor to log pressure values digitally on a computer. The
digital balance was interfaced with the computer to allow for measurement of stock tank
mass every 0.5 seconds.
Figure 2.2. Schematic of the dead-end filtration system with backflush ports
2.3. Bacterial Growth Conditions
2.3.1. Culture Maintenance and Strain Information
The bacterial strains used in this work were Pseudomonas aeruginosa UCBPP-PA-14,
Escherichia coli K12 W3110 (wild-type), Staphylococcus aureus SC01, and
Staphylococcus epidermidis 1200 ATCC 12228. All cultures were obtained from frozen

20
stocks and then quadrant streaked onto Miller’s Luria-Bertani broth (LB) with 15 g L-1
agar (P. aeruginosa and E. coli) or tryptic soy agar (TSA) (S. aureus and S. epidermidis)
and grown at 37 °C for 24 hours. These stock cultures were then stored at 4 °C for no
more than two weeks before being transferred to a new agar plate through quadrant
streaking of isolated colonies. New cultures were obtained from frozen stocks every 8
weeks to reduce the risk of contamination and genetic drift.
2.3.2. Planktonic Growth
Planktonic cultures of S. epidermidis and S. aureus were grown in flasks with 25 g L-1
tryptic soy broth (TSB) at 37 °C with an agitation of 100 RPM. Planktonic P. aeruginosa
and E. coli were grown in flasks with 25 g L-1 LB at 37 °C with agitation of 100 RPM.
Culture growth was monitored by determining the optical density (OD) of 1 mL samples
of media through measurement of the absorbance at a wavelength of 590 nm (A590).
Samples with an A590 over 0.7 were diluted and measured again until the A590 was less
than 0.7 to reduce instrument error. A590 values of the diluted sample were than
multiplied by the dilution to determine the true A590 of the sample.
2.3.3. Biofilm Growth
Planktonic stock cultures were grown to allow for inoculation of biofilm dishes with
bacteria in the exponential growth phase. To grow planktonic stock cultures, 2 mL of
planktonic growth medium was transferred to a vented tube and then inoculated with 2 to
3 isolated colonies from the stock plate cultures and then allowed to grow for 18 to 24
hours at 37 °C with an agitation of 100 RPM.
To grow biofilms on membrane surfaces, membranes were placed at the bottom of square

21
petri dishes and weighed down with silicone beads. 50 mL of biofilm forming media for
the selected bacteria was aseptically transferred to the petri dish. The petri dish was then
inoculated with 0.5 mL (1:100 v/v) of planktonic stock culture and placed in the
incubator at 37 °C for 48 hours. Biofilm media for P. aeruginosa was 25 g L-1 LB with
2.0 g L-1 of Na3C6H5O7 added to induce biofilm formation. Both S. epidermidis and S.
aureus biofilms were induced by the addition of 15 g L-1 NaCl to 25 g L-1 of TSA. E. coli
biofilms were grown in 15 g L-1 M63 media supplemented with 10 mL L-1 of 20%
glycerol solution and 1 mL L-1 of 1 M MgSO4. The final pH of M63 medium was
adjusted to 7 using 1M sodium hydroxide and hydrochloric acid.
2.4. Scanning Electron Microscopy (SEM)
Bacterial and protein samples for scanning electron microscopy (SEM) were fixed in a
2.5% glutaraldehyde in a 1M phosphate buffer solution (PBS) for 15 minutes. Samples
were then serially dehydrated by 15 minute soaks in sequential baths of 50, 60, 70, 80,
90, 95, and 100% ethanol. Dehydrated samples were flushed with supercritical CO2 using
a critical-point drier to replace the liquid within the cells without disrupting surface
structures. Samples were then fixed to carbon stubs and secured with silver paint to
ensure conductivity of the sample edges. Using a sputter coater, a gold layer with a
thickness of 23 nm was placed onto samples in an argon environment. SEM was
performed digitally with an Amray 1820 detecting secondary electrons with an
acceleration of 10 kV. Magnifications of 500x, 2500x, 5000x, and 10000x were used for
imaging.

22
CHAPTER 3
CHARACTERIZATION OF LIQUID-GATED MEMBRANES
3.1. Chapter Abstract
Basic characterization of membranes lubricated with either Krytox 103 or Krytox 107
was performed using non-lubricated membranes as a control group. The thickness of the
lubricant layer was quantified for a variety of methods of adding lubricant and removing
the excess lubricant from the membrane surface. The flow rate of water through the
membrane as well as the pressures required for both air and water to flow through the
membrane were also measured. Filtration of microparticles, Staphylococcus epidermidis,
and whey protein was performed to determine if the presence of a lubricating layer
affected the filtration characteristics of liquid-gated membranes. The most consistent
layer of lubricant, estimated to be 20 µm thick, was achieved by gently wiping
membranes. This layer was shown to retain its slipperiness through sliding angle
measurements. Consistent with previous data, the air entry pressure for lubricated
membranes was higher than non-lubricated membranes and the liquid entry pressure was
reduced in lubricated membranes. There was no significant difference in the flow rate of
DI water through lubricated membranes compared to non-lubricated controls.
Additionally, there was no difference in the effluent concentration of both microparticles
and whey protein between non-lubricated membranes and membranes with either Krytox
103 or 107. However, there were differences in effluent S. epidermidis concentrations
between non-lubricated and lubricated membranes, suggesting more complex interactions
between the surface structures of the bacteria and the liquid layer.

23
3.2. Introduction
This chapter serves to provide basic characterization of liquid-gated membranes and
determine if the presence of a gating liquid changes the filtration characteristics of 1 µm
PTFE membranes. Existing literature on LGMs provides basic details on functionality of
LGMs, however, evaluation of how the presence of a liquid layer lining the inside of a
pore[96,98] changes the filtration characteristics has not yet been performed. To date, there
is no published data on the thickness of the lubricant layer over the surface of the
membrane or effluent concentrations of particles filtered through the membrane. By
better quantifying the basic characteristics of these membranes a deeper understanding of
liquid-gated membranes will be reached, allowing for better assessment of membrane
performance as presented later in this work.
3.3. Materials and Methods
3.3.1. Approximation of Lubricant Layer Thickness
The thickness of the lubricant layer above the membrane surface was determined using
the assumptions that all membrane pores are entirely filled with lubricant and that the
lubricant forms a uniform, cylindrical layer on the membrane surface. This assumption
neglects edge effects and lubricant curvature. To approximate lubricant layer thickness,
first the void volume of the membrane was approximated according to:
V���� = (r�)�t�π −��
����� (3.1)
where Vvoid is the void volume of the membrane in cm3, rm is the radius of the membrane in cm, tm is the thickness of the membrane in cm, mm is the mass of the membrane in g, and ρm is the density of PTFE in g cm-3.

24
After void volume was calculated the volume of Krytox lubricant added to the membrane
was calculated with the following equation:
V�� =���������
��� (3.2)
where Vkr is the volume of krytox applied to the membrane in cm3, mwet is the mass of the membrane after Krytox application in g, mdry is the mass of the clean membrane in g, and ρkr is the density of Krytox in g cm-3.
Using equations 3.1 and 3.2, the thickness of the lubricant layer can be approximated
according to:
t�� =���������
�∗(��)�∗ 1000 (3.3)
where tlu is the thickness of the lubricant layer in µm.
The mass of the membrane was first measured for a clean membrane and then again
measured immediately after the application of 0.200 mL of lubricant to the membrane
surface. Drainage steps of either vertical suspension for 30 seconds or wiping the surface
were performed and the mass of the membrane was recorded after the drainage step to
allow for calculation of the final layer thickness. Each drainage method was tested in
triplicate. To confirm that the lubricant layer remained thick enough to prevent contact
between the membrane and water sliding angle was measured using an inclinometer.
Membranes with a sliding angle of less than 10 degrees were considered to be “slippery”.
3.3.2. Determination of Clean Water Flux
To determine the water flux through clean membranes, membranes were inserted into the
previously described dead-end filtration setup (Section 2.2). The stock tank was filled
with clean DI water. Pressure was maintained at 68.95 ± 0.83 kPa using the pressure
25
regulator for 45 seconds, allowing the system to reach steady state. Mass data was
recorded for 45 seconds after steady state was reached in order to determine flow rate
across the membrane. Flow rate was determined by calculating the change in mass in the
receiving flask per unit time. Each membrane treatment was performed in triplicate.
3.3.3. Determination of Entry Pressure
The entry pressures of both air and DI water were determined by using the pressure
regulator to increase the TMP by increments of 1.72 kPa starting at 0 kPa (ambient
conditions). After each increment of pressure, the system was allowed to come to steady
state during a one-minute waiting period. For air entry pressure, water was placed at the
bottom of a vertical tube and the surface of the water marked on the tube. After each
incremental increase of TMP and the waiting period, the water level was checked. When
the water level rose above the line the pressure was recorded as the entry pressure for air.
To determine liquid entry pressure, the vertical tube was filled with water and placed in a
stock tank sitting on the digital scale. The scale was tared before the pressure was
increased. The liquid entry pressure was recorded when the mass of the scale decreased
to -0.10 grams. Both air and liquid entry pressures were determined for three replicates of
each treatment to allow for statistical analysis and ensure the repeatability of results
obtained.

26
3.3.4. Filtration of Particles
3.3.4.1. Microparticle Filtration
Filtration of various suspended particles was performed to determine how the presence of
a liquid gate affects the filtration characteristics of the membrane. To measure the
filtration of particles with tightly controlled diameters, 5 mL of a 0.0054% suspension of
1 µm latex microparticles was filtered through the membrane using a syringe pump at
flow rates of 0.007 mL s-1 and 0.032 mL s-1. Stock and effluent concentrations of
microparticles were measured using absorbance at a wavelength of 590 nm (A590).
3.3.4.2. Filtration of S. epidermidis
To better clarify if the presence of surface structures and charge would effect filtration
characteristics, S. epidermidis, which has a cell diameter of approximately 1 µm and is
coccoid in shape, was filtered through 1 µm PTFE membranes. For these experiments,
the relative S. epidermidis concentration was measured using A590. Planktonic cultures of
S. epidermidis were grown to an OD of 1.4 ± 0.016 at 37°C before filtration was
performed. The culture broth was brought to room temperature prior to filtration.
3.3.5. Filtration of Whey Protein
To investigate if liquid-gating affected the filtration characteristics of proteins,
concentration of both the 2.5 g L-1 whey stock solution and effluent was measured using
the constant-pressure, dead-end filtration system. For these experiments, a the whey
protein solution was filtered at a TMP of 68.95 ± 0.83 kPa. All experiments were
performed in triplicate to ensure that results were repeatable. Concentration of whey

27
protein in solution was measured using the absorbance of 1 mL of sample at 540 nm.
Standard curves for concentrations of microparticles and whey protein are shown in
Appendix A.
3.4. Results
3.4.1. Approximation of Lubricant Layer Thickness
Figure 3.1 shows the thickness of a Krytox 103 lubricant layer on 1 µm PTFE
membranes. The thickness of the layer is thinnest after wiping the membrane and has the
most variation after a drainage time of 30 seconds.
Figure 3.1. Lubricant Layer Thickness After Different Draining Methods Lubricant layer thickness immediately after lubricant addition, after 30 seconds of drainage, and after membrane wiping for Krytox 103 on 1 µm PTFE membranes. To confirm that lubricated membranes were still fully lubricated after drainage or wiping,
sliding angle was measured. Figure 3.2 shows the sliding angle of a 25 µL drop of DI
water on 1 µm PTFE membranes after lubrication and either vertical drainage or wiping

28
to remove excess lubricant. The highest sliding angle is for non-lubricated PTFE, and the
lowest is for membranes immediately after addition of lubricant. The sliding angle value
after 30 seconds of drainage is similar to that of wiped membranes.
Figure 3.2. Sliding Angle After Different Draining Methods A) Sliding angle values for 1 µm PTFE membranes before lubricant addition, after lubricant addition, after 30 seconds of vertical draining of excess lubricant, and after gently wiping the membrane to reduce excess lubricant. B) Schematic of system used to determine sliding angle. A sliding angle of less than 10° was considered to be slippery, while a sliding angle of over 10° was considered to be non-slippery.
3.4.2. Determination of Clean Water Flux
There was no statistical difference in the flow rate of DI water through any of the
membranes. However, in general, membranes lubricated with Krytox 103 had a slightly
higher flow rate than non-lubricated controls while membranes with Krytox 107 as a
gating liquid had a slightly lower flow rate, as seen in Figure 3.3.

29
Figure 3.3. Deionized Water Flow Rate Through LGMs Flow rate of DI water through both non-lubricated membranes and membranes lubricated with either Krytox 103 or Krytox 107.
3.4.3. Determination of Entry Pressure
There was a statistical difference (p = 0.0000 and 0.0000, respectively) between air entry
pressures of non-lubricated membranes and both Krytox 103 and Krytox 107 lubricated
membranes. However, there was no statistical difference between air entry pressures in
Krytox 103 and Krytox 107 lubricated membranes. Both Krytox 103 and Krytox 107
lubricated membranes demonstrated higher air-entry pressures than non-lubricated
controls (Figure 3.4A). There was a statistical difference in liquid entry pressures
between non-lubricated membranes and membranes lubricated with both Krytox 103 (p =
0.010) and with Krytox 107 (p = 0.001). There was no difference between membranes
lubricated with Krytox 103 and membranes lubricated with Krytox 107 (p = 0.071). As

30
seen in Figure 3.4B, both Krytox 103 and Krytox 107 lubricated membranes exhibited
lower liquid entry pressures than non-lubricated controls.
Figure 3.4. Air and Liquid Entry Pressures in LGMs A) Air entry pressure in both non-lubricated membranes and membranes lubricated with either Krytox 103 or Krytox 107. B) Entry pressure of DI water in both non-lubricated membranes and membranes lubricated with either Krytox 103 or Krytox 107.
3.4.4. Filtration of Particles
3.4.4.1. Microparticle Filtration
At a flow rate of 0.007 mL s-1 no statistical difference between effluent microparticle
concentrations between non-lubricated membranes and either of the lubricated
membranes (Figure 3.5A). The lack of statistical difference between all treatments was
also observed for filtration of microparticles at a flow rate of 0.032 mL s-1, as seen in
Figure 3.5B.
Figure 3.5. Effluent Microparticle Concentration A) Effluent microparticle (MP) concentrations at flow rates of 0.007 mL s-1 normalized to stock concentration. B) 0.032 mL s-1 normalized to stock microparticle concentration.

31
3.4.4.2. Filtration of S. epidermidis
There was a significant difference in effluent S. epidermidis concentrations between non-
lubricated membranes and both Krytox 103 lubricated membranes (p = 0.003) as well as
Krytox 107 lubricated membranes (p = 0.002) at a flow rate of 0.007 mL s-1. As shown in
Figure 3.6A, both lubricated membranes allowed more S. epidermidis cells to go through
compared to non-lubricated controls at a flow rate of 0.007 mL s-1. At a flow rate of
0.032 mL s-1 there was only a statistically higher amount of S. epidermis cells in the
effluent of non-lubricated membranes and Krytox 103 lubricated membranes (p = 0.036).
There was no significant difference between membranes lubricated with Krytox 103 and
Krytox 107, nor was there a difference between membranes lubricated with Krytox 107
and non-lubricated controls (Figure 3.6).
Figure 3.6. Effluent S. epidermidis concentration for different membrane treatments at a flow rate of 0.007 mL s-1 (left) and 0.032 mL s-1 (right) normalized to the stock concentration.
3.4.5. Filtration of Whey Protein
The effluent whey concentration was not significantly different between non-lubricated
membranes and either of the lubricated membranes as seen in Figure 3.7. There was also

32
no difference between membranes lubricated with Krytox 103 and membranes lubricated
with Krytox 107.
Figure 3.7. Effluent whey concentrations of non-lubricated and lubricated membranes normalized to stock whey concentrations. Filtration was performed at a TMP of 68.95 ± 0.83 kPa.
3.5. Discussion
3.5.1. Approximation of Lubricant Layer Thickness
The layer thickness was estimated to be 80 µm immediately after addition of Krytox 103
to the surface. However, after vertically suspending the membrane for 30 seconds, the
thickness of the lubricant layer was around 25 µm. After wiping the membrane gently, it
was approximately 20 µm. Consistent with expectations, wiping the membrane removed
the most excess lubricant. Additionally, the overall variance of the layer thickness across
the three samples was lowest after wiping excess Krytox from the surface. This suggests
that wiping is a more repeatable and consistent method. To ensure that membranes were
still “slippery” after drainage, sliding angle was measured. Here, “slippery” was

33
classified as having a sliding angle of less than 10 degrees.[84] Non-lubricated membranes
had a sliding angle of 13 degrees. The lowest sliding angle was observed when
membranes had excess lubricant immediately after lubricant addition, at 2.3 degrees. Of
the lubricated membranes, the highest sliding angle was 7.2 degrees for membranes with
excess lubricant wiped off. However, this sliding angle was still under 10 degrees,
meaning that membranes remain lubricated after wiping away excess lubricant.
Additionally, the lowest variance in sliding angle was seen after wiping excess lubricant
away. Due to this reduced variance with only slight increase in sliding angle, wiping
excess lubricant away was selected as the method to use throughout the rest of this work.
3.5.2. Determination of Clean Water Flux
The lack of statistically significant flow rates between non-lubricated and lubricated
membranes suggests that the presence of a liquid gate does not affect the flow rate of the
membrane at a TMP of 68.95 kPa. This is an interesting result since the lining of pores
with gating liquid was expected to have an impact on the permeability of the membranes
due to a restriction of pore diameter.[98] However, the lack of significant reduction in flow
rate despite the restriction of pore size by the gating liquid could be explained by a
reduction in friction at the interface of water and lubricant compared to lubricant and bare
PTFE.
3.5.3. Determination of Entry Pressure
Consistent with previous results, when a liquid-gate there was a significant increase in air
entry pressure as well as a reduction in liquid entry pressure.[96] This agrees with previous
work suggesting that below the entry pressure for air, membrane pores are fully blocked

34
by the gating liquid, compared to fully open pores in non-lubricated membranes, which
allow air flow at pressures very close to 0 kPa.[96,98] Additionally, this result lends support
to the working assumption that the behavior of liquid-gated membranes with excess
lubricant wiped from the surface would be similar to the performance of liquid-gated
membranes with no wiping of excess lubricant such as those used in Hou et al. and
Bazyar et al.[96] in terms of pore gating and basic membrane characterization. A reduced
amount of Krytox necessary for lubrication would help to reduce the cost of gating
membranes.
3.5.4. Filtration of Particles
3.5.4.1. Microparticle Filtration
The lack of difference in filtration of microparticles between non-lubricated and
lubricated membranes suggests that the presence of a liquid gate does not change the
filtration characteristics for neutrally charged particles of a consistent size. Considering
that the thickness of the lubricant layer is on the scale of 0.1 - 0.3 µm during the flow of
gas through lubricant lined pores,[98] it was not expected that the same number of
particles would go through the membrane. However, this result may be explained by
considering both the slipperiness of the liquid layer as well as the tendency for liquids to
deform when acted upon by a force. It is possible that particles were allowed through by
either pushing the immobilized liquid out of the way, or through a reduction in friction
between the latex microparticles and the pore wall.

35
3.5.4.2. Filtration of S. epidermidis
While the filtration of S. epidermidis was designed to serve as an analog to the filtration
of microparticles, the results were markedly different. As opposed to microparticle
filtration (Section 5.4.1), there were significant differences in effluent concentration
when a liquid gate was present. This different result could be caused by the presence of
both surface charge and surface structures in S. epidermidis compared to microparticles.
It is possible that the surface structures of S. epidermidis caused more cells to be caught
in non-lubricated membranes due to attachment to bare PTFE, reducing the number of
cells that went through the membrane. The reduced attachment of S. epidermidis to an
immobilized liquid layer[97] could allow more cells to pass through the membrane pores,
resulting in increased effluent concentration. It is important to note, however, that the
lack of significant difference in filtration between non-lubricated and Krytox 107
lubricated membranes at a flow rate of 0.032 mL s-1 is unexpected considering the results
of the lower flow (0.007 mL s-1) rate test. It was expected that the layer of lubricant lining
the pore would be thinner at higher flow rates,[98] leading to an increased effluent
concentration. Instead, when exposed to a higher flow rate, fewer microparticles passed
through the membrane. Directly comparing the means of these groups at the higher flow
rate shows that Krytox 107 lubricated membranes (µ = 0.815) had a higher mean than
non-lubricated membranes (µ = 0.755), however with a sample size of three, no
significant difference was calculated. Future work to replicate this experiment with
increased sample size should be performed.

36
3.5.5. Filtration of Whey Protein
The lack of statistical difference between non-lubricated and lubricated membranes
suggests that the presence of a liquid layer does not have a significant effect on the
filtration of whey protein. This result was expected due to the very small size of the
proteins relative to the pore, as well as the lubricating properties of the immobilized
Krytox performance lubricant. This is an important result since the similar filtration
characteristics for whey protein between non-lubricated and lubricated membranes allows
for more direct comparison of the performance of the two membranes during fouling
tests.
3.6 Conclusions
In this chapter, basic characterization of LGMs was performed. Approximation of the
lubricant layer thickness showed that wiping excess lubricant from the membrane surface
resulted in a layer of approximately 20 µm and had less variability than draining excess
lubricant from the membrane for 30 seconds. Additionally, it was shown that there is no
significant difference in DI water flux through clean membranes when gated with Krytox
103 or Krytox 107 compared to non-lubricated controls, as well as between LGMs with
different viscosity lubricants. Liquid-gating reduced the entry pressure of DI water into
the membrane. This may help to overcome the issue of increased operating costs for
hydrophobic PTFE membranes due to increased energy costs compared to hydrophilic
membranes. Contrary to initial expectations, the presence of a lubricant layer lining
membrane pores did not change the effluent concentration compared to controls when
filtering 1 µm microparticles. This could be caused by either reduced friction between the

37
membrane and particles or particles displacing the liquid layer during filtration.
Additionally, filtration of S. epidermidis particles was not consistent with the results of
the microparticle experiment. This may be due to surface structures and charge of S.
epidermidis interacting with Krytox in ways that the inert latex microparticles did not.
There was no difference in effluent whey concentration between lubricated and non-
lubricated membranes. This is a positive result suggesting that there is potential to apply
LGMs to existing filtration technology without a drastic change to the membrane sizing
and selection process. The basic characterization of LGMs provided in this chapter boosts
the general understanding of LGMs and provides a basic framework for future
experiments involving the filtration of particles through LGMs.

38
Chapter 4
FLUX RECOVERY IN PROTEIN-FOULED LIQUID-GATED MEMBRANES
4.1. Chapter Abstract
Flux recovery in LGMs after fouling with whey protein was obtained by allowing
membranes to sit with no TMP for resting intervals of 1, 15, and 30 minutes. It was found
that lubricated membranes recovered significantly more flux than non-lubricated controls
after resting steps of both 15 and 30 minutes. Membranes lubricated with Krytox 103
recovered 16% and 15% of initial membrane flux after resting intervals of 15 and 30
minutes, respectively. Membranes gated with Krytox 107 recovered 32% and 60% of
initial flux after rest intervals of 15 and 30 minutes, respectively. The mechanism of
passive cleaning is not clear from this data; however, work will be presented in Chapter 6
to attempt to address this question. Additional tests were performed to determine if
liquid-gating increased the recovery of flux during a backflush step both with and without
prior resting. In all cases, it was found that LGMs performed similar to or worse than
non-lubricated controls, indicating that liquid-gating does not significantly improve the
effect of a backflush cleaning step. Finally, LGMs were evaluated for the ability to
undergo passive cleaning during multiple cycles of fouling and subsequent cleaning. It
was found that flux recovery decreased approximately 4.1% with each cycle, or from
72% to 21% over 12 cycles in LGMs created with Krytox 107. This decline in recovery
suggests either lubricant loss, the membrane cake layer is being compacted, or some
combination of both mechanisms.

39
4.2. Introduction
A number of industrial applications of microfiltration membranes result in membrane
fouling due to deposition of proteins on the membrane surface or within membrane
pores.[7,107,108] Several methods have been developed to both reduce protein fouling and
remove proteins once fouling has occurred. However, these methods require energy input
into the system and can potentially reduce the lifespan of the membrane.[38,75,109] This
additional energy input increases the cost of process operation, and subsequently, the cost
to the consumer. The development of passive cleaning processes, where no additional
energy is required and membrane lifespan is not reduced, would increase process
efficiency and reduce consumer cost.
To date, studies concerning LGMs have focused primarily on the method of gating and
the prevention of fouling.[96,98] However, the complete prevention of fouling reported by
Hou et al. occurred in long, straight, liquid-lined microchannels rather than the highly
tortuous pores of PTFE. Fouling of LGMs by proteins during dead-end filtration has not
yet been reported. This chapter evaluates the ability of LGMs to resist protein fouling
during filtration of whey protein in solution. Additionally, a passive cleaning method is
evaluated for flux recovery in protein-fouled membranes and compared to a standard
backflush cleaning step. The longevity of this passive recovery over subsequent filtration
and resting cycles is also determined.

40
4.3. Materials and Methods
4.3.1. Passive Flux Recovery
Filtration of a 2.5 g L-1 whey solution was performed for 15 minutes at a TMP of 68.95 ±
0.83 kPa. After 15 minutes of filtration membranes were fully fouled and filtration was
stopped. Resting steps of 1, 15, or 30 minutes were performed. After completion of the
resting step, filtration was again performed for 15 minutes to allow for determination of
flux recovery. Membrane flux was determined using mass flow rate and the time.
Membrane flux was then normalized to the maximum value of flux through the
membrane. Flux recovery was calculated as the maximum flux after recovery divided by
the maximum flux before recovery. Multiplying this value by 100 gave the percent
recovery of the membrane. All treatments were performed in triplicate.
4.3.2. Flux Recovery through Backflushing
Filtration of a 2.5 g L-1 whey solution was performed according to the method described
in Section 3.1. Immediately after the initial filtration cycle was stopped a backflush was
performed with 10 mL of water over 10 seconds, or a flow rate of 1 mL s-1, using a
syringe pump. After completion of the backflush step, the second cycle of filtration was
performed. Membrane flux was determined and evaluated using the method described in
Section 3.1. All treatments were performed in triplicate.
4.3.3. Passive Flux Recovery Combined with Backflushing
Initial filtration of a 2.5 g L-1 whey solution followed by a resting step of 15 or 30
minutes was performed as previously described. After completion of the resting step, a

41
backflush was performed with 10 mL of water over 10 seconds, a flow rate of 1 mL s-1,
using a syringe pump. After completion of the backflush step, a second cycle of filtration
was performed. Membrane flux was determined using methods described earlier in this
work. All treatments were performed in triplicate.
4.3.4. Passive Flux Recovery over Repeated Cycles
Filtration of a 2.5 g L-1 whey solution was performed for 10 minutes according to the
methods used in Section 3.1. After 10 minutes of filtration through membranes lubricated
with Krytox 107 filtration was stopped. A resting step of 30 minutes was then performed.
After rest, filtration was again performed for 10 minutes to allow for determination of
flux recovery. This process was repeated over 12 cycles of fouling followed by
membrane rest. Flux recovery for each cycle was calculated using methods previously
reported in Section 3.1. This process was performed in triplicate and no control
membranes were used since prior results showed that membranes lubricated with Krytox
107 recovered more flux than non-lubricated membranes during a resting step.
4.4. Results
4.4.1. Passive Flux Recovery
Figure 4.1 shows the mass flow data over time during filtration of a 2.5 g L-1 whey
protein solution by a 1 µm PTFE membrane gated with Krytox 107. After 880 seconds of
filtration the membrane was fully fouled, marked by a membrane flow rate of almost 0
mL s-1. At this time, the membrane was allowed to rest for 30 minutes and then filtration
was resumed. Recovery was determined using the maximum flow rate both before and
after the resting step. Flux decline curves for this experiment are shown in Figure 4.2A.

42
The normalized recovery in LGMs created with either Krytox 103 or Krytox 107 was
greater than 1 after 15 and 30 minutes of rest, indicating that more recovery occurred in
these LGMs than in non-lubricated controls during a resting step (Figure 4.2B). In resting
intervals of both 15 and 30 minutes, membranes lubricated with Krytox 107 exhibited
more recovery than membranes lubricated with Krytox 103. Figure 4.3B shows pictures
and SEM images of LGMs and control membranes after protein fouling. Flux decline
curves for each membrane and different resting times are shown in Appendix B.
Figure 4.1. Demonstration of Evaluation of Flux Recovery Mass flow data during filtration of 2.5 g L-1 whey solution through a 1 µm PTFE membrane gated with Krytox 107. At a time of 880 seconds the membrane was allowed to rest for 30 minutes. Mass flow data is normalized to the maximum flow rate. Recovery is calculated by dividing the maximum flow rate after the resting step by the maximum flow rate during initial filtration.

43
Figure 4.2. Passive Flux Recovery in Whey-Fouled LGMs A) Normalized flux decline curves for LGMs and non-lubricated controls. B) Recovery values for LGMs after 15 minutes of fouling with 2.5 g L-1 whey solution and subsequent resting intervals of 1, 15, or 30 minutes. Recovery values for LGMs are divided by the recovery value for their respective non-lubricated control. A value of 0 means the LGM performed the same as control membranes, a value greater than 0 indicates higher recovery values in LGMs than non-lubricated controls, and a value less than 0 represents less recovery in LGMs than non-lubricated controls. C) Photographs of crystal violet-stained, protein-fouled LGMs and control membranes (top, scale bar 0.5 cm) and SEM of protein-fouled LGMs and control membranes (bottom, scale bar 5 µm).
44
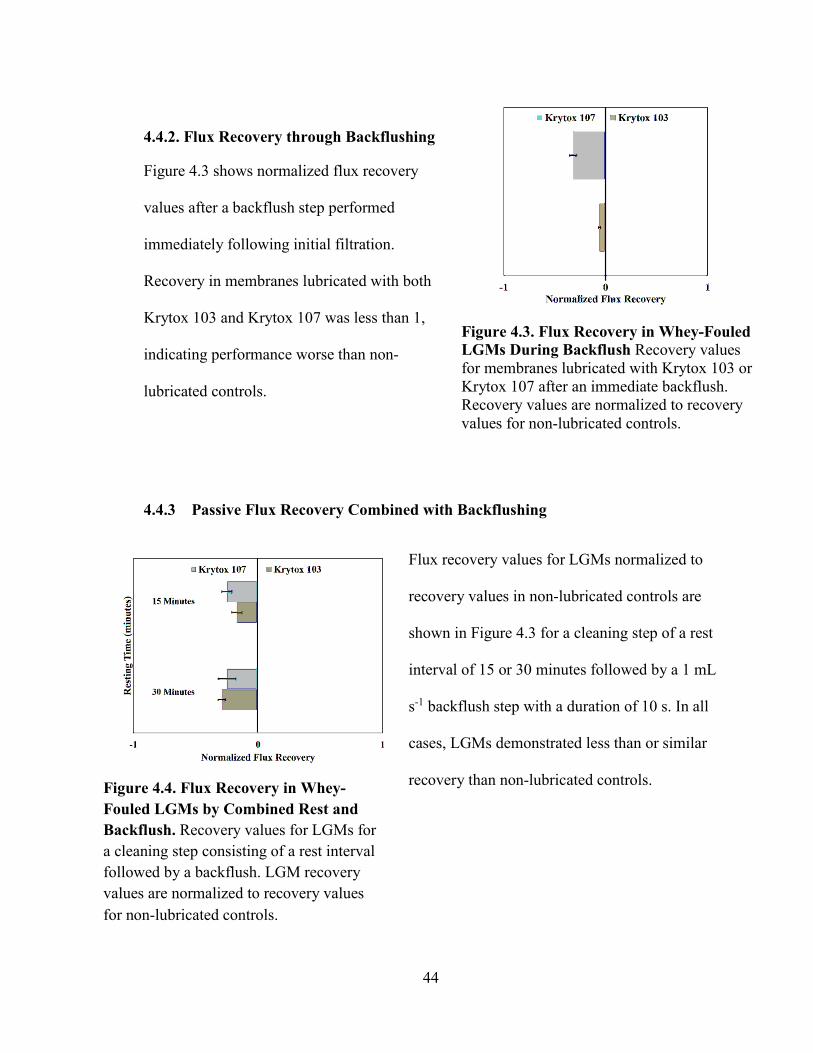
4.4.2. Flux Recovery through Backflushing
Figure 4.3 shows normalized flux recovery
values after a backflush step performed
immediately following initial filtration.
Recovery in membranes lubricated with both
Krytox 103 and Krytox 107 was less than 1,
indicating performance worse than non-
lubricated controls.
4.4.3 Passive Flux Recovery Combined with Backflushing
Flux recovery values for LGMs normalized to
recovery values in non-lubricated controls are
shown in Figure 4.3 for a cleaning step of a rest
interval of 15 or 30 minutes followed by a 1 mL
s-1 backflush step with a duration of 10 s. In all
cases, LGMs demonstrated less than or similar
recovery than non-lubricated controls.
Figure 4.3. Flux Recovery in Whey-Fouled LGMs During Backflush Recovery values for membranes lubricated with Krytox 103 or Krytox 107 after an immediate backflush. Recovery values are normalized to recovery values for non-lubricated controls.
Figure 4.4. Flux Recovery in Whey-
Fouled LGMs by Combined Rest and
Backflush. Recovery values for LGMs for
a cleaning step consisting of a rest interval
followed by a backflush. LGM recovery
values are normalized to recovery values
for non-lubricated controls.

45
4.4.4. Passive Flux Recovery Over Repeated Cycles
Percent recovery in Krytox 107 lubricated membranes over 12 cycles of filtration and
passive cleaning by a resting step are shown in Figure 4.5. Percent recovery decreased
with each cycle from 72% in the 2nd cycle to 21% in the 12th cycle.
Figure 4.5. Flux Recovery over Multiple Cycles of Whey Filtration. Percent flow rate recovery over 12 cycles of filtration and rest in LGMs created with Krytox 107 as the gating liquid.
4.5. Discussion
4.5.1. Passive Flux Recovery
Membranes lubricated with Krytox 103 recovered 16% after 15 minutes of rest and 15%
after 30 minutes of rest. The lack of additional recovery suggests that the cleaning action
that occurs during membrane rest was finished before 15 minutes in membranes
lubricated with Krytox 103. Membranes lubricated with Krytox 107 exhibited higher
recoveries than those treated with Krytox 103, recovering 32% and 60% after rest periods
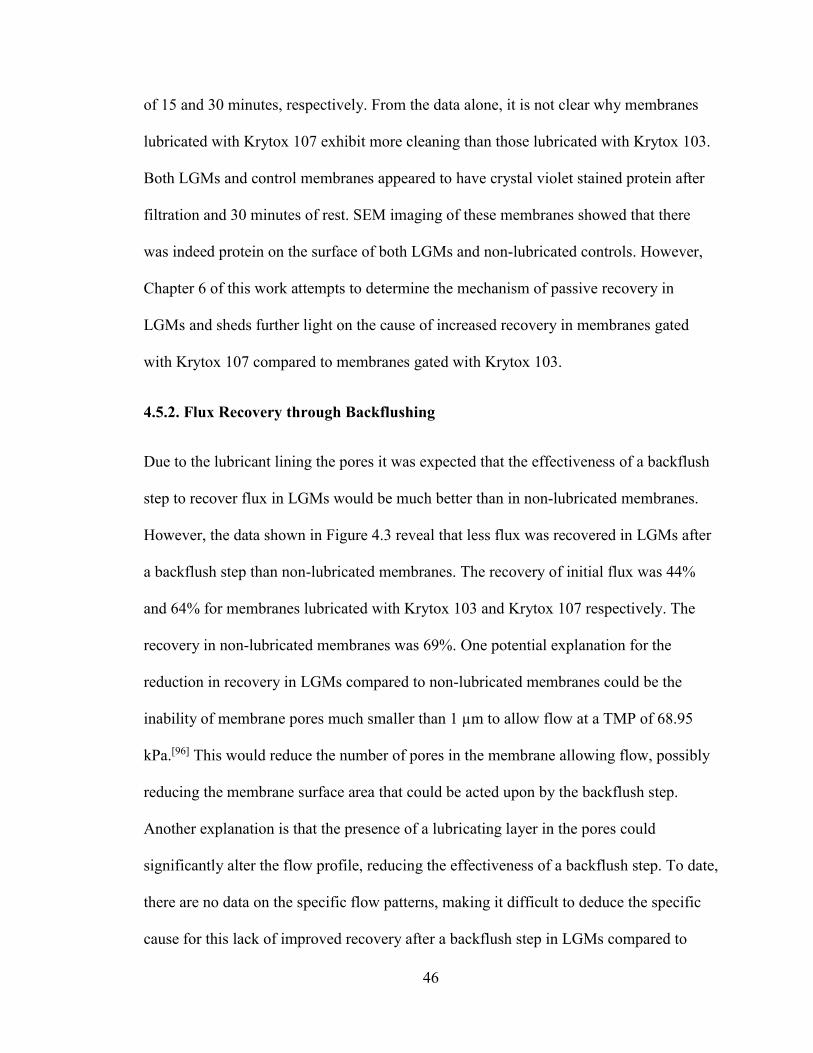
46
of 15 and 30 minutes, respectively. From the data alone, it is not clear why membranes
lubricated with Krytox 107 exhibit more cleaning than those lubricated with Krytox 103.
Both LGMs and control membranes appeared to have crystal violet stained protein after
filtration and 30 minutes of rest. SEM imaging of these membranes showed that there
was indeed protein on the surface of both LGMs and non-lubricated controls. However,
Chapter 6 of this work attempts to determine the mechanism of passive recovery in
LGMs and sheds further light on the cause of increased recovery in membranes gated
with Krytox 107 compared to membranes gated with Krytox 103.
4.5.2. Flux Recovery through Backflushing
Due to the lubricant lining the pores it was expected that the effectiveness of a backflush
step to recover flux in LGMs would be much better than in non-lubricated membranes.
However, the data shown in Figure 4.3 reveal that less flux was recovered in LGMs after
a backflush step than non-lubricated membranes. The recovery of initial flux was 44%
and 64% for membranes lubricated with Krytox 103 and Krytox 107 respectively. The
recovery in non-lubricated membranes was 69%. One potential explanation for the
reduction in recovery in LGMs compared to non-lubricated membranes could be the
inability of membrane pores much smaller than 1 µm to allow flow at a TMP of 68.95
kPa.[96] This would reduce the number of pores in the membrane allowing flow, possibly
reducing the membrane surface area that could be acted upon by the backflush step.
Another explanation is that the presence of a lubricating layer in the pores could
significantly alter the flow profile, reducing the effectiveness of a backflush step. To date,
there are no data on the specific flow patterns, making it difficult to deduce the specific
cause for this lack of improved recovery after a backflush step in LGMs compared to

47
non-lubricated membranes. Additionally, these data support the claim made by
Kovalenko et al. that liquid layers exhibit complex interactions with solid particles under
dynamic conditions that are not fully understood.[97] Creating a better understanding of
these interactions is not within the scope of this work, but future work to elucidate the
interaction of solid particles with immobilized liquid layers is essential to fully
understanding LGMs.
4.5.3. Passive Flux Recovery Combined with Backflushing
To determine if recovery in LGMs after a backflush step could be improved compared to
recovery in non-lubricated membranes, the combination of a rest interval with a
backflush step was tested for membrane recovery in both LGMs and non-lubricated
controls. Since a resting step had previously resulted in greater cleaning for LGMs than
non-lubricated controls, it was predicted that combining a resting interval with a
backflush step could increase membrane cleaning in LGMs compared to non-lubricated
membranes. However, this prediction was not supported by the data, which showed
LGMs recovering less than non-lubricated membranes after a resting interval followed by
a backflush. However, the combination of rest and backflush did result in increased flux
recovery when compared to just a rest interval, although this result is expected by the
increased cleaning energy of a backflush step. Flux recovery in membranes lubricated
with Krytox 103 after 15 minutes of rest and a backflush was 66%, compared to 72% in
non-gated control membranes. Flux recovery in membranes gated with Krytox 107 was
82% after 30 minutes of rest and a backflush, compared to 88% in non-lubricated
controls. This reduction in flux recovery indicates that the combination of a rest interval
with a backflush does not improve flux recovery in liquid-gated membranes compared to

48
non-gated membranes. However, observing a rest interval before backflushing increased
the recovery in LGMs by around 20% of initial flux for membranes lubricated with either
Krytox 103 or 107, suggesting that a rest interval facilitates membrane cleaning in a way
that increases the effect of a backflush cleaning step in LGMs. This could be caused by
the pushing of proteins to the center of the pore during the refilling of the pore, reducing
the flow required to expel proteins from the pore. However, experimental evidence to
show this is difficult to obtain due to the presence of the omniphobic liquid-gate in this
system.
4.5.4. Passive Flux Recovery Over Repeated Cycles
To evaluate the longevity of the passive recovery capabilities of LGMs created with
Krytox 107, subsequent cycles of fouling with 2.5 g L-1 whey solution followed by a rest
interval of 30 minutes. Recovery between the 1st fouling cycle and 2nd fouling cycle was
72%. After 12 fouling cycles, recovery had reduced to 21%. This reduction in recovery
could potentially be explained by loss of lubricant from the membrane, resulting in
reduced cleaning during the resting step. Another explanation for the decrease in
recovery is that the mechanism of flux recovery during a resting step is reinfusion of the
lubricant into the pore, pushing protein foulants into the middle or towards the surface of
the pore. It is possible that build-up of the cake layer results in a continual decline in flow
through the membrane, as has been reported in systems where cleaning does not occur.[32]
These possibilities will be discussed more thoroughly in Chapter 6.

49
4.6. Conclusions
The recovery of 60% of flow during a passive resting step of 30 minutes in protein-fouled
membranes gated with Krytox 107 marks a significant recovery in flux without the need
for additional energy input during cleaning. This passive recovery makes further
investigation into the application of LGMs to industry processes a promising topic. The
use of LGMs offers potential to reduce operation cleaning costs while still allowing for
recovery of flux in membranes fouled with protein. While the mechanism of flux
recovery is still unclear, it is likely that proteins are removed from the membrane through
either pore cleaning or surface cleaning.
It is also interesting to note that the presence of a lubricating layer did not increase flux
recovery compared to controls when membranes were cleaned with a backflush step. This
result was in contrast with expectations that the lubricant lining the pores during filtration
would reduce the adhesion strength of proteins, allowing for increased pore cleaning
during the backflush step. There is however, potential that the use of a backflush step at a
much lower flow rate could still result in significant recovery in LGMs. Further
investigation into recovery of flux during a backflush step in LGMs is warranted.

50
Chapter 5
FLUX RECOVERY IN BACTERIA-FOULED LIQUID-GATED MEMBRANES
5.1. Chapter Abstract
SLIPS have been previously reported to have a remarkable resistance to the adhesion of
bacteria. However, LGMs have not been evaluated for resistance to biofilm growth and
adhesion. This chapter shows that LGMs of different pore sizes resist adhesion of
Staphylococcus epidermidis biofilms under static conditions. Additionally, 1 µm PTFE
membranes gated with Krytox 103 or Krytox 107 resist the adhesion of Pseudomonas
aeruginosa, Escherichia coli, Staphylococcus aureus, and S. epidermidis biofilms. In this
chapter, it is shown that biofilms can be grown directly on to the surface of LGMs.
However, exposure to an air-water interface (AWI) results in removal of significant
amounts of these biofilms, causing a marked recovery in membrane flux relative to
fouled membranes. Steps previously used to recover flux in protein-fouled membranes
are evaluated for their ability to recover flux in bacteria-fouled membranes. Filtrations of
planktonic S. epidermidis and subsequent resting is performed, showing that passive
recovery is not achieved. In this chapter the ability of LGMs to resist fouling of bacteria
through both biofilm formation and pore blocking is evaluated.
5.2. Introduction
Bacterial fouling of membranes presents a significant issue in membrane processes,
specifically membranes exposed to bacterial growth media, such as membranes for use in
AnMBRs.[22,110–112] A reduction in bacterial fouling on membrane surfaces would greatly
improve the efficiency of AnMBRs, as well as reduce the cost of cleaning processes.[113]

51
The creation of immobilized liquid (IL) layers on porous substrates has been shown to
drastically reduce the adhesion of bacteria[89,91] and proteins[93,94] to surfaces. By
combining ILLs with membrane technology, LGMs were created.[96] While it is logical to
assume that LGMs would exhibit similar anti-biofilm characteristics as IL layers, no data
has been published supporting this assumption. In this chapter, the adhesion of bacterial
biofilms of various bacterial species on the surface of LGMs of different pore sizes is
quantified. Additionally, LGMs are used to filter planktonic bacteria, then assessed for
passive flux recovery. Filtration of DI water through membranes fouled with biofilms is
performed and the ability of a resting step to allow passive flux recovery is analyzed. In
light of data suggesting that air-water interfaces (AWIs) can strip a surface layer from IL
layers,[114] biofilm-fouled LGMs are exposed to an AWI and then flux recovery is
quantified. This chapter provides important information regarding the ability of LGMs to
resist biofilm fouling, as well as how to clean LGMs once biofilms have formed.
5.3. Materials and Methods
5.3.1. Biofilm Growth on the Surface of LGMs
Biofilms were grown on PTFE membranes according to methods described in Chapter 2.
To determine the affect of different species, biofilms of S. epidermidis, S. aureus, E. coli,
and P. aeruginosa were grown on 1 µm PTFE membranes lubricated with Krytox 103
and non-lubricated controls. After 48 hours of growth, membranes were removed from
the biofilm media and placed in 0.1% crystal violet solution for 15 minutes. After 15
minutes of soaking in crystal violet, membranes were removed from the solution and
excess crystal violet and non-adhered cells were rinsed by dipping membranes in DI

52
water until crystal violet no longer came off the membrane. Membranes were then
photographed from above. Images of the dyed membranes were cropped to the edge of
the circular membranes and then the amount of purple in the picture was quantified using
a MatLab program provided by the Aizenberg group at Harvard. To determine percent
coverage of the actual membrane and not the square photograph, percent coverage of
images was normalized to the percent coverage of a membrane entirely covered with
crystal violet. This allowed for the percent coverage of the circular membrane, rather than
the square picture to be quantified.
The effect of membrane pore size on biofilm adhesion was also investigated using 1, 5,
and 20 µm PTFE membranes. S. epidermidis biofilms were grown according to
previously described methods and membranes were analyzed for percent biofilm
coverage using the same crystal violet staining and quantification procedure as presented
earlier in this work. All treatments were performed in triplicate.
5.3.2. Flux Through Biofilm-Fouled LGMs
To investigate the flux of DI water through membranes fouled with biofilms, 2 mL of S.
epidermidis biofilm solution was placed onto a membrane already installed into the
filtration test apparatus and inoculated with 0.2 mL of planktonic S. epidermidis in the
exponential phase of growth. Biofilms were grown in the test apparatus to avoid exposure
to an AWI before quantification of membrane flux. Biofilms were grown under static
conditions for 48 hours at a temperature of 37 °C. Filtration of DI water was then
conducted at a TMP of 68.95 kPa for 90 s to quantify initial membrane flux. Following
this, a resting step of 15 minutes was performed for membranes lubricated with Krytox
103. Experiments were also performed where a backflush cleaning step was used rather

53
than passive membrane rest. After the resting or backflush step was complete, DI water
flux was again measured for 90 seconds at a TMP of 68.95 kPa. To measure the effect of
AWIs on flux recovery, the same biofilm growth and DI flux determination procedure
was followed, with the exception that the membranes were vertically dipped in DI water
two times before flux recovery was measured. Percent of clean membrane flux was
calculated as the average flow rate of the treatment divided by the average flow rate of
clean membranes. All treatments were tested in triplicate.
5.3.3. Flux Recovery in LGMs Fouled with Planktonic S. epidermidis
S. epidermidis was grown in 1 L of TSB for 48 hours at 37 °C and an agitation of 100
RPM. The optical density after 48 hours was 1.0 ± 0.1, measured at a wavelength of 540
nm. Planktonic S. epidermidis was filtered for 5 minutes at a TMP of 68.95 kPa. After
initial filtration, a resting step of 15 or 30 minutes was performed for membranes gated
with Krytox 103 and Krytox 107, respectively. According to results presented in Chapter
4 a rest interval of 15 minutes was used for LGMs created with Krytox 103, and a rest of
30 minutes was used for membranes gated with Krytox 107. After completion of the
resting step, filtration was again performed for 5 minutes to quantify flux recovery.
Recovery was calculated as the maximum flux after cleaning divided by the maximum
initial flux during the first cycle, as described in Chapter 4, Section 3.1. All treatments
were performed in triplicate.

54
5.4. Results
5.4.1. Biofilm Growth on the Surface of LGMs
Figure 5.1A. shows that 1 µm PTFE membranes lubricated with Krytox 103 reduced
biofilm adhesion compared to non-lubricated controls for all species of bacteria tested.
P. aeruginosa was the only species to cover more than 10% of the surface of lubricated
membranes. In all cases, non-lubricated controls were almost entirely covered with
biofilm. Representative samples of both controls and LGMs are shown in Figure 5.2B for
each species.
Figure 5.1. Biofilm Coverage of Different Species on LGMs A) Percent biofilm coverage for non-lubricated (NL) membranes and membranes gated with Krytox 103 (K103) after exposure to an AWI. B) Non-lubricated membranes (left) and LGMs (right) after biofilm growth by different species and exposure to an AWI. C) SEM images of S. aureus on PTFE membranes. S. aureus colored green for clarity.

55
The adhesion of biofilms to lubricated PTFE membranes of different pore sizes can be
seen in Figure 5.2A. In all cases, non-lubricated membranes had almost total coverage
while lubricated membranes did not. Lubricated membranes with a pore size of 5 µm had
the lowest coverage. Figure 5.2B shows representative samples of each pore size for both
control membranes and LGMs.
Figure 5.2. Biofilm Coverage of S. epidermidis on LGMs of Different Pore Size. A) Percent S. epidermidis biofilm coverage for non-lubricated (NL) PTFE membranes and PTFE membranes lubricated with Krytox 103 (K103) after passing through an AWI. Membrane pore sizes of 1, 5, and 20 µm were used. B) Representative images of each membrane pore size after biofilm growth and exposure to an AWI. Non-lubricated controls are on the left and LGMs are on the right.
5.4.2. Flux Through Biofilm-Fouled LGMs
Figure 5.3 shows the flux through membranes fouled with S. epidermidis biofilms both
with and without exposure to an AWI for both non-lubricated membranes and LGMs in
combination with membrane rest and a backflush. For each membrane, flux after fouling
with a biofilm was significantly lower than initial clean membrane flux. After exposure to
an AWI, the flux in LGMs is much closer to the average clean membrane flux, whereas
the flux in non-lubricated membranes remained close to 0, even after exposure to an AWI
and a backflush.

56
Figure 5.3. Flux Through LGMs Fouled with Biofilms and Cleaned Through Various Methods Percent of clean membrane flux through membranes fouled with S. epidermidis biofilms both with and without exposure to an AWI, as well as various combinations of exposure to an AWI, membrane rest, and a backflush.
5.4.3. Flux Recovery in LGMs Fouled with Planktonic S. epidermidis
Percent of flux recovery in LGMs with a pore size of both 1 µm and 5 µm during
filtration of planktonic S. epidermidis is shown in Figure 5.4. LGMs recovered a similar
percentage of initial flow as controls after 15 minutes of rest at both pore sizes.
Figure 5.4. Passive Flux Recovery in LGMs Fouled with Planktonic S. epidermidis Percent flux recovery in LGMs and non-lubricated controls fouled with planktonic S. epidermidis after a resting interval of 15 minutes for both 1 µm and 5 µm membranes.

57
5.5. Discussion
5.5.1. Biofilm Growth on the Surface of LGMs
The presence of a liquid gate reduced the coverage of biofilm drastically for all four
species tested after exposure to an AWI. The large reduction in adhered bacteria is
consistent with previous work regarding IL layers.[89,91] Furthermore, the difference in
adhesion of different species is consistent with data presented by Kovalenko et al.[97] The
difference in adhesion across different bacterial species could be caused by variations in
cell surface structures or differences in methods of initial adhesion and biofilm formation
between species.[41,43,45] It is important to note however, that all membranes were exposed
to an AWI, which creates a wrapping layer of lubricant between the water and air as
shown in Figure 1.8, leading to the removal of lubricant from the surface.[86] The
formation of this wrapping layer and subsequent removal of oil could also remove
bacteria from the surface, reducing coverage values for lubricated membranes. This is a
limitation of the methods used to analyze resistance to biofilm coverage in lubricated
materials, however, work presented later in this chapter allows for evaluation of biofilm
formation on membranes not exposed to an AWI.
The biofilm coverage of liquid-gated PTFE membranes of different pore sizes was
reduced compared to non-lubricated controls. The differences in adhesion across
membranes of different pore sizes was not expected, however, some of the physical
properties of these membranes are different. For example, the thickness of 1 µm
membranes is 152 – 250 µm, while 20 µm membranes have a thickness of 127 µm.
Additionally, the porosity of each size membrane is different, making direct comparisons
of different membranes difficult. The difference in biofilm adhesion could be caused by

58
differences in pore size, membrane thickness, or membrane porosity. Future work with
membranes of more controlled physical properties would help to clarify the role that pore
diameter plays in biofilm adhesion on LGMs. It is important to note however, that for all
pore diameters, LGMs had reduced adhesion of bacterial biofilm compared to non-
lubricated controls. This shows that exposure of biofilms on a lubricant layer to an AWI
reduces biofilm adhesion across a range of bacteria and membrane physical properties.
5.5.2. Flux Through Biofilm-Fouled LGMs
The percent of clean membrane flux in membranes fouled with S. epidermidis biofilms
without a cleaning step was less than 5% for both lubricated and non-lubricated
membranes. This suggests that biofilms are able to grow on the surface of LGMs,
resulting in a reduction of flux through the membrane. This agrees with previous data,
which shows that Krytox is not toxic. Previous work also shows that exposing biofilms
grown on lubricated surfaces to an AWI interface removes nearly all of the biofilm.[89,91]
This is due to the fact that when bacteria settle on IL layers, the strength of adhesion is
reduced enough to allow for easy cleaning during exposure to an AWI.[97] While these
surfaces do not resist bacterial adhesion to the point where biofilm formation is
prevented, the strength of adhesion is reduced enough to produce clear differences
between bare surfaces and surfaces with an IL layer.
In light of the ability of AWIs to drastically reduce biofilm coverage, membranes fouled
with S. epidermidis biofilms were exposed to an AWI and then flux was evaluated. After
exposure to an AWI, non-lubricated membranes still had less than 5% of clean membrane
flux, while membranes lubricated with Krytox 103 or Krytox 107 had 80% and 60% of
clean membrane flux, respectively. This further supports that exposure to AWIs has a

59
major role in removing bacteria from IL layers.
To more thoroughly evaluate the removal of S. epidermidis biofilms from LGMs, a
variety of cleaning steps, both with and without exposure to an AWI were evaluated. All
treatments without exposure to an AWI resulted in flows of less than 10% of clean
membrane flux. LGMs exposed to an AWI however, had percent clean membrane flux
values of over 30% for cleaning with a backflush only, as well as combining a resting
step with a backflush. The data presented in this section combines to suggest that
exposure to an AWI is an essential step in the removal of bacterial biofilms from
lubricated surfaces.
5.5.3. Flux Recovery in LGMs Fouled with Planktonic S. epidermidis
LGMs with an average pore diameter of 1 µm were tested for the ability to generate flux
recovery during a passive resting step during filtration of S. epidermidis. It was found that
passive recovery did not occur in LGMs to levels beyond non-lubricated controls. The
reason for this is unclear, however, it is possible that due to the size of S. epidermidis
relative to the pores, that fouling occurred on the pore surface. Since surface cleaning was
not observed during passive cleaning in biofilm experiments, it is possible that the
mechanism of pore cleaning occurs only within the pores. Data presented in Chapter 6
will attempt to better quantify the reinfusion of pores and the mechanisms through which
it occurs. To determine if pore size played a role in the lack of recovery, 5 µm pore
diameter membranes were used to filter planktonic S. epidermidis. It was found that
recovery still did not occur to greater levels in LGMs than non-lubricated membranes.
The data from this experiment are inconclusive, since S. epidermidis cells are still on
relatively similar in size to 5 µm, meaning that fouling may occur only at the opening of

60
the pore. In Chapter 6, mathematical models will be applied to determine the type of
fouling that develops during filtration of planktonic S. epidermidis.
5.6. Conclusions
The data presented in this chapter shows that LGMs exposed to an AWI have very little
coverage from bacterial biofilms. This reduction in coverage was observed for all four
bacterial species tested, a significant result due to the widely varied physiology of the
bacteria tested. LGMs of various pore diameters all seemed to resist bacterial adhesion,
however limitations in membrane fabrication make direct comparison of membranes with
different pore diameters difficult. While biofilms could form on LGMs under static
conditions causing a sharp decrease in membrane flow, membrane flux was recovered
through exposure to an AWI. This exposure is thought to remove adhered bacteria and
biofilm polymers through the creation of an oil wrapping layer at the AWI. As the AWI
moves across the membrane, the oil layer is disrupted, resulting in the removal of bacteria
and proteins that were previously adhered to the membrane surface. In contrast to data
obtained during protein filtration, passive flux recovery was not observed during filtration
of planktonic S. epidermidis. The cause for this lack of recovery is not clear, however,
based on data suggesting that cleaning does not occur on the membrane surface during a
rest interval, it is possible that foulants close to the size of a membrane pore are not
cleaned as effectively as much smaller foulants. Additional tests using membranes with 5
µm pore diameters were also performed, resulting in no passive recovery. Future work
should focus on quantification of lubricant loss during the passing of AWIs over
lubricated surfaces, determining if this loss has a significant impact on filtration
characteristics.
61
Chapter 6
MECHANISM OF FLUX RECOVERY IN LIQUID-GATED MEMBRANES
6.1. Chapter Abstract
It was previously demonstrated that allowing LGMs fouled with protein to rest for 15 or
30 minutes resulted in recovery of flow rate compared to controls. While this result is of
interest for fouling control in multiple membrane applications, it is essential to better
understand how recovery occurs to apply LGMs most effectively. Using least squares
regression and the four basic models for membrane fouling, it is determined that protein
fouling of LGMs seems to occur in the pores of the membrane during initial fouling, as it
does in non-lubricated membranes. However, after a resting step non-lubricated
membranes demonstrate cake filtration while membranes gated with Krytox 107 continue
to demonstrate standard fouling. Since both membranes were fouled to an almost
complete cessation of flow after 15 minutes, this result suggests that recovery happens
within the pores of LGMs. Experiments using a fouling time of 1 minute had similar
results. However, complete blocking was determined to be the fouling mechanism during
initial filtration. After a resting step, LGMs were best modelled by standard fouling while
non-lubricated controls were best represented by cake filtration and intermediate fouling.
Regressing fouling models to filtration of planktonic S. epidermidis exhibited standard
fouling as the predominant fouling mode in LGMs, a result inconsistent with the physical
assumptions of the standard fouling model. This result shows that LGMs may be
artificially weighted towards standard fouling due to the presence of a liquid-layer lining
the pore. Future work to develop a new model for fouling that accounts for the presence

62
of a liquid layer lining the pore in LGMs is necessary to fully evaluate the mechanism of
fouling in LGMs.
6.2. Introduction
In Chapter 4 of this work it was shown that flux recovery was achieved during a passive
resting step in LGMs. While this result was interesting and demonstrated the promise of
LGMs for industry applications, understanding the mechanism through which recovery is
achieved will allow for a more educated application of LGMs to industry systems. It has
been previously demonstrated that during filtration through LGMs, the gating liquid is
pushed to the walls of the pore, creating a liquid-lined channel.[96] This flow was further
described by applying core-annular flow equations to quantify flow rate through the
membrane as a function of TMP.[98] While both of these reports demonstrate how the
pore is opened and state that the pore closes during a resting step, neither determines the
method by which the pore is closed. The data in chapter 4 shows that flux recovery is
achieved in protein-fouled LGMs during a resting step. Additionally, Chapter 5 shows
that bacteria are not cleaned off the surface both after biofilm formation and during
filtration of planktonic cells. Combining these results with the data presented in literature
leads to the hypothesis that reinfusion of membrane pores leads to removal of proteins,
which are small enough to foul inside of the pore, from the pore walls. It is also
hypothesized that recovery is not seen in membranes fouled with bacteria since the
bacteria do not foul the inside of the pore and the main mechanism of cleaning happens
within the membrane pores. In this chapter, flux decline models are used to determine
what method of fouling occurs in liquid-gated membranes. These models are further used
to determine if the fouling models differ between LGMs and non-lubricated controls for

63
filtration of both whey protein and planktonic S. epidermidis.[26,36,37,40] Using these data
regressions, the mechanism through which recovery is achieved in protein-fouled
membranes is clarified.
6.3. Materials and Methods
6.3.1. Fitting of Flux Decline Equations
The four models of flux decline are cake filtration, standard blocking, intermediate
fouling, and complete blocking. Models were fit using the MatLab curve-fitting
algorithm. The Levenberg-Marquardt algorithm was used and the constant k was allowed
to vary from 0 to infinity, where k was used to represent blocking parameters present in
each equation. Data acquired during filtration in Chapter 4 and Chapter 5 were used to fit
these models. Regression was performed using average flow rate data from all three
replicates in each treatment. The time period during which the membrane flow rate
increased due to pore opening was neglected in membranes lubricated with Krytox
107.[96,98] R2 values were recorded and used to compare goodness of fit. The model with
the highest R2 value was considered to be the most accurate model. Regression was
performed for data both before and after recovery of flux during a resting period for
membranes fouled with protein. An additional data set was obtained by filtering a 2.5 g
L-1 whey solution for 1 minute, followed by 15 or 30 minutes of rest for membranes
lubricated with Krytox 103 or Krytox 107, respectively. After the rest step, filtration was
performed for another minute to allow flux recovery to be calculated. For each
calculation there is a non-lubricated control performed on the same day and with the
same solution as Krytox 103 and another non-lubricated control performed on the same

64
day with the same solution as Krytox 107. This experimental design was used to allow
for more direct comparisons of LGMs to controls and reduce temporal variance due to
bacterial growth or protein changes over time when placed in a DI water solution. The
equations used to model the fouling types are as follows:[26]
Cake Filtration:
J = ��
��∗�∗(��)���� (6.1)
Where J is membrane flow rate in ml s-1, t is time in seconds, J0 is initial membrane flow rate in ml s-1, and k is the cake filtration constant.
Standard Fouling:
J = �∗��
(�∗�∗(��)����)�
(6.2)
Where J is membrane flow rate in ml s-1, t is time in seconds, J0 is initial membrane flow rate in ml s-1, and k is the standard fouling constant.
Intermediate Blocking:
J = ��
�∗��∗��� (6.3)
Where J is membrane flow rate in ml s-1, t is time in seconds, J0 is initial membrane flow rate in ml s-1, and k is the intermediate blocking constant.

65
Complete Blocking:
J = J� ∗ e��∗� (6.4)
Where J is membrane flow rate in ml s-1, t is time in seconds, J0 is initial membrane flow rate in ml s-1, and k is the complete blocking constant.
6.4. Results
6.4.1. Fitting of Flux Decline Equations
Table 6.1 shows the R2 values for cake filtration, standard fouling, intermediate fouling,
and complete fouling during the first fouling cycle of 2.5 g L-1 whey protein solution. In
all cases, standard fouling exhibited the highest R2 value.
Table 6.1. Fit of Fouling Models to Initial Filtration R-squared values for the four models of membrane fouling during initial fouling of LGMs and non-lubricated controls with 2.5 g L-1 whey solution. Bolded values highlight the model that exhibited the highest R2 value.
Membrane Cake Standard Intermediate Complete Non-Lubricated 0.7260 0.9775 0.9430 0.9414 Krytox 103 0.7400 0.9762 0.9504 0.9279 Non-Lubricated 0.7848 0.9712 0.9592 0.9011 Krytox 107 0.6969 0.9268 0.8783 0.9034
Table 6.2 shows R-squared values for different models of blocking after 15 and 30
minutes of recovery (Krytox 103 and Krytox 107 gated membranes, respectively)
following 15 minutes of fouling with 2.5 g L-1 whey protein.

66
Table 6.2. Fit of Fouling Models to Filtration After Recovery R2 values for the four models of fouling during filtration of 2.5 g L-1 whey solution after initial fouling and subsequent membrane rest. Bolded values highlight the model with the highest R2 value.
Membrane Cake Standard Intermediate Complete Non-Lubricated 0.5180 0.0012 0.2957 -0.4922 Krytox 103 0.8141 0.6603 0.8162 0.4139 Non-Lubricated 0.7062 0.5239 0.5413 -0.1340 Krytox 107 0.7035 0.8817 0.8749 0.8206
Table 6.3 shows R2 values for the four models of fouling after 1 minute of initial fouling
with 2.5 g L-1 whey protein. In all cases, complete fouling had the highest R2 value.
Table 6.3. Fit of Fouling Models to Short Fouling Times: Initial Filtration R2 values for the four models of fouling fitted to data from 1 minute of initial fouling with a 2.5 g L-1 solution of whey protein. Bolded values highlight the models with the highest R-squared values.
Membrane Cake Standard Intermediate Complete Non-Lubricated 0.8091 0.9514 0.9130 0.9640 Krytox 103 0.8084 0.9408 0.9062 0.9499 Non-Lubricated 0.8351 0.9553 0.9235 0.9661 Krytox 107 0.7342 0.8411 0.2250 0.8670
Table 6.4 shows R2 values for each of the four fouling models after 1, 15, and 30 minutes
of rest after 1 minute of fouling with 2.5 g L-1 whey protein. Cake filtration was the
prevailing model for both non-lubricated controls, while standard and intermediate
fouling were the models with the best fit for membranes lubricated with both Krytox 103
and Krytox 107.

67
Table 6.4. Fit of Fouling Models to Short Fouling Times: After Recovery R2 values for the four models of fouling fitted to data for 1 minute of fouling with a 2.5 g L-1 whey solution after initial fouling followed by 15 and 30 minutes of rest for membranes gated with Krytox 103 and Krytox 107, respectively. Bolded values highlight the highest R2 values. Rows with two values had little difference between R2 values.
Membrane Cake Standard Intermediate Complete Non-Lubricated 0.9081 0.8312 0.8935 0.7003 Krytox 103 0.9044 0.9810 0.9807 0.9227 Non-Lubricated 0.9352 0.8935 0.9392 0.7876 Krytox 107 0.9055 0.9478 0.9423 0.9383
Table 6.5. shows R2 values for each of the 12 cycles of filtration of 2.5 g L-1 whey
solution followed by 30 minutes of rest in LGMs lubricated with Krytox 107. Standard
fouling occurred for the first two cycles, followed by intermediate fouling in cycles 3
through 9. Cycles 10, 11, and 12 were best fit by the cake filtration model.
Table 6.5. Fit of Fouling Models over Repeated Filtration Cycles R2 values for standard, complete, intermediate, and cake filtration fouling models during each of the 12 cycles of filtration of 2.5 g L-1 whey solution and subsequent rest of 30 minutes in LGMs created with Krytox 107. Bolded values highlight the highest R2 value and the respective model is considered the fouling model for that cycle.
Cycle Standard Cake Complete Intermediate
1 0.9227 0.7399 0.9004 0.8824 2 0.8952 0.7536 0.8094 0.8553 3 0.8175 0.7520 0.6762 0.8261 4 0.7498 0.7691 0.5463 0.8998 5 0.6842 0.7510 0.4492 0.7844 6 0.6529 0.7393 0.4004 0.7601 7 0.6461 0.7375 0.3904 0.7550 8 0.7043 0.7494 0.4845 0.7855 9 0.6043 0.7184 0.3325 0.7244 10 0.5628 0.7118 0.2765 0.6894 11 0.3546 0.6205 -0.0053 0.5338 12 0.4324 0.6185 0.1461 0.5672

68
Table 6.6 shows R2 values for each of the four fouling models during 5 minutes of
planktonic S. epidermidis filtration. The models for intermediate fouling had the highest
R2 value for both non-lubricated controls while standard fouling had the best fit for
LGMs created with both Krytox 103 and Krytox 107.
Table 6.6. Fit of Fouling Models During Filtration of Planktonic Bacteria R2 values for standard, complete, intermediate, and cake filtration fouling models during 5 minutes of filtration of planktonic S. epidermidis. Bolded entries highlight the highest R2 value and the respective model is considered the fouling model for that membrane.
Membrane Cake Standard Intermediate Complete Non-Lubricated 0.7767 0.8185 0.8929 0.6975 Krytox 103 0.7398 0.9411 0.9359 0.8836 Non-Lubricated 0.7561 0.8577 0.8901 0.7596 Krytox 107 0.7602 0.9473 0.9254 0.8906
6.5. Discussion
6.5.1. Fitting of Flux Decline Equations
Fitting of flux decline models to fouling data from 15 minutes of filtration of a 2.5 g L-1
whey solution showed that fouling in both LGMs and non-lubricated membranes
appeared to be standard fouling, or pore constriction. This is consistent with previous
reports that fouling during filtration of small particles is initially pore constriction,
followed by cake filtration after sufficient restriction of the pores.[37] After a resting step,
LGMs created with Krytox 107 continued to demonstrate fouling by pore restriction,
while the predominant mechanism in controls became cake filtration. Membranes
lubricated with Krytox 103 exhibited intermediate fouling after the resting step. This
suggests that partial cleaning may have occurred, reducing the amount of pore
constriction enough to allow that serves to bridge the gap between standard fouling and

69
cake filtration.[37] The return to standard fouling in membranes gated with Krytox 107
provides support for the hypothesis that flux recovery observed during the resting step is
a result of pore cleaning. However, all data obtained with LGMs is likely biased towards
pore constriction, due to the presence of the lubricant layer, which becomes thicker as
flow rate decreases.[98] This bias is clearly illustrated during the filtration of planktonic S.
epidermidis, which are too large to cause pore constriction in 1 µm membrane pores.
However, standard fouling was observed in both LGMs, suggesting that the lubricant
layer does play a role in cleaning. Over the 12 cycles of repeated fouling and filtration, a
transition from standard fouling in the first 2 cycles to intermediate fouling in cycles 3
through 9, and cake filtration in cycles 10 through 12 suggests the build-up of a cake
layer resulted in decreased flux recovery over the 12 cycles. While giving evidence that
cake layer formation plays a role in the decreased recovery of flux over repeated cycles,
this result does not exclude the possibility that lubricant layer loss also plays a role in
decreased recovery over repeated cycles. Future work is needed to clarify the
mechanisms of recovery loss. To better determine the mechanism of fouling and
recovery, a fouling period of only one minute was used. This would theoretically result in
only standard fouling of the membrane, meaning that any recovery that occurred could
likely be attributed to cleaning of the pores. During initial fouling, complete fouling was
observed in all membranes, a result that was not expected. However, after resting the
membranes, LGMs demonstrated pore restriction while controls demonstrated cake and
intermediate fouling. In membranes lubricated with Krytox 103, there were similar R-
squared values for both intermediate and standard fouling, suggesting that Krytox 103 did
not clean the pores as well as Krytox 107, consistent with previous data. Due to the bias

70
of LGMs towards pore restriction, it is difficult to make strongly supported claims.
However, this data suggests that there is some mechanism of cleaning that occurs within
the membrane pores.
6.6. Conclusions
The data presented in this chapter lends support to the idea that recovery of flux in LGMs
during a resting step is a result of cleaning within the membrane pores. However, without
methods to visualize the membrane pores during a resting period it is difficult to
definitively show this. Fitting flux decline equations to LGM filtration data was used in
an attempt to show where fouling occurs within LGMs and where fouling occurs after
cleaning. While the data suggests that LGMs are initially fouled through standard fouling,
and then again through standard or intermediate fouling after a rest step, LGMs are also
biased to the pore constriction model due to the increasing thickness of the lubricant layer
as flow rate decreases.[98] To overcome the limitation of this bias, new models for fouling
that take into account the lubricant layer need to be developed. Future work to derive and
validate new fouling models is essential to increase the general understanding of LGMs.

71
Chapter 7
CONCLUSIONS AND FUTURE DIRECTIONS
7.1. Review
This work provides basic characterization of the liquid entry pressure and basic filtration
characteristics of LGMs. It is shown that effluent protein concentration does not change
when a liquid gate is present. The presence of a liquid gate also did not influence the
filtration of 1 µm microparticles, possibly because solid microparticles were able to
displace the liquid lubricant layer lining the pores.
It was additionally shown that once LGMs were fouled with a whey protein solution,
allowing LGMs to rest for 15 or 30 minutes resulted in an increased recovery in
membrane flux compared to non-lubricated controls. This previously unreported result
shows that LGMs are capable of passive cleaning, which has broad potential for
industrial applications. It was further shown that recovery of flux was not increased in the
presence of liquid-linings during a backflush cleaning step.
The presence of a liquid-layer was not shown to resist biofilm formation on the surface of
LGMs. However, exposing LGMs to an air-water interface resulted in a flux recovery
relative to biofilm-fouled membranes not exposed to an air-water interface. This suggests
that exposure to an AWI results in removal of adhered bacteria and is consistent with
previous publications.[86,97]
To determine how membrane cleaning is achieved during a resting step, filtration data
was regressed to flux decline models and the mode of fouling was determined for both
LGMs and controls. It was found that both controls and LGMs underwent standard
fouling during initial filtration. However, after protein fouling and a resting step, LGMs

72
continued to undergo standard or intermediate fouling while controls underwent cake
layer filtration. This result lends evidence to the hypothesis that cleaning occurs within
membrane pores, however the inherent bias of LGMs to standard fouling models makes
this claim less supported.
7.2. Future Directions
Based on the entirety of this work, LGMs serve as an interesting and novel new
technology for the filtration industry. Future research directions should focus on
mathematically modeling the flow of solutions through LGMs and the interaction of
solids with the lubricant layer. As a part of this, determination of lubricant loss during
filtration would prove useful. If it is found that substantial amounts of lubricant are
removed from the membrane during filtration, methods to replenish the lubricant would
increase the longevity of LGMs.
Work to derive flux decline equations for LGMs that account for the presence of a liquid-
layer is necessary. This is a complex issue because the thickness of the lubricant layer
increases as the flux through the membrane decreases. Additional work to determine the
ability of LGMs to passively recover flux against different foulants, such as model
proteins and particles of controlled sizes, is needed to allow for determination of the
mechanism of flux recovery.
7.3. Summary
This work serves to provide basic characterization of LGMs and additionally shows the
ability for passive flux recovery to be achieved when LGMs are fouled with whey protein
and undergo a resting step. The mechanism of this passive cleaning has not been fully

73
determined, however evidence does suggest that cleaning occurs within the pores of the
membrane. It has been further shown that exposure of LGMs to an air-water interface
results in the removal of biofilms from the surface of LGMs, but does not in non-
lubricated controls. This work has presented information essential to better understanding
LGMs and has provided preliminary data to guide future applications and developments
of LGMs.

74
WORKS CITED
[1] R. Ghosh, S. S. Silva, Z. Cui, Biochem. Eng. J. 2000, 6, 19.
[2] J. A. Levesley, M. Hoare, J. Memb. Sci. 1999, 158, 29.
[3] R. Jeantet, J. L. Maubois, P. Boyaval, Enzyme Microb. Technol. 1996, 19, 614.
[4] A. Persson, A. S. Jönsson, G. Zacchi, Biotechnol. Bioeng. 2001, 72, 269.
[5] S. Nakao, F. Saitoh, T. Asakura, T. Kiyoshi, S. Kimura, J. Membr. Sci. 1987, 30, 273.
[6] Y. J. Jeon, Y. Y. Lee, Enzyme Microb. Technol. 1989, 11, 575.
[7] A. Chollangi, M. M. Hossain, Chem. Eng. Process. Process Intensif. 2007, 46, 398.
[8] A. Stack, G. Sillen, Nutr. Food Sci. 1998, 5, 280.
[9] P. Morin, R. Jiménez-Flores, Y. Pouliot, J. Dairy Sci. 2004, 87, 267.
[10] K. Burrell, R. Reed, Filtr. Sep. 1994, 399.
[11] Q. Gan, R. W. Field, M. R. Bird, R. England, J. A. Howell, M. T. Mckechnie, C. L. O’Shaughnessy, Chem. Eng. Res. Des. 1997, 75, 3.
[12] Y. Li, A. Shahbazi, C. T. Kadzere, J. Food Eng. 2006, 75, 574.
[13] F. Vaillant, P. Millan, G. O’Brien, M. Dornier, M. Decloux, M. Reynes, J. Food Eng. 1999, 42, 215.
[14] M. Yazdanshenas, S. A. R. Tabatabaee-Nezhad, M. Soltanieh, R. Roostaazad, A. B. Khoshfetrat, Desalination 2010, 258, 194.
[15] A. P. Echavarria, C. Torras, J. Pag??n, A. Ibarz, Food Eng. Rev. 2011, 3, 136.
[16] M. Afonso, Filtr. 1991, 28, 45.
[17] A. S. Jönsson, C. Jönsson, M. Teppler, P. Tomani, S. Wännström, Desalination 1996, 105, 263.
[18] K. Kimura, K. Tanaka, Y. Watanabe, Water Res. 2014, 49, 434.
[19] J. yu Tian, M. Ernst, F. Cui, M. Jekel, Water Res. 2013, 47, 1218.
[20] A. Broeckmann, J. Busch, T. Wintgens, W. Marquardt, Desalination 2006, 189, 97.
[21] K. Xiao, J. Sun, Y. Mo, Z. Fang, P. Liang, X. Huang, J. Ma, B. Ma, Desalination 2014, 343, 217.

75
[22] R. Kleerbezem, H. Macarie, Chem. Eng. 2003, 56.
[23] H. J. Lin, K. Xie, B. Mahendran, D. M. Bagley, K. T. Leung, S. N. Liss, B. Q. Liao, Water Res. 2009, 43, 3827.
[24] I. Martin-Garcia, V. Monsalvo, M. Pidou, P. Le-Clech, S. J. Judd, E. J. McAdam, B. Jefferson, J. Memb. Sci. 2011, 382, 41.
[25] A. Cerón-Vivas, J. M. Morgan-Sagastume, A. Noyola, J. Memb. Sci. 2012, 423–424, 136.
[26] A. Charfi, N. Ben Amar, J. Harmand, Water Res. 2012, 46, 2637.
[27] W. J. Gao, X. Qu, K. T. Leung, B. Q. Liao, J. Memb. Sci. 2012, 421–422, 131.
[28] D. Jang, Y. Hwang, H. Shin, W. Lee, Bioresour. Technol. 2013, 141, 50.
[29] T. Li, A. W.-K. Law, M. Cetin, a. G. Fane, J. Memb. Sci. 2013, 427, 230.
[30] H. Ozgun, M. E. Ersahin, Y. Tao, H. Spanjers, J. B. van Lier, Bioresour. Technol. 2013, 147, 285.
[31] X. Yue, Y. K. K. Koh, H. Y. Ng, Water Res. 2015, 1.
[32] M. L. Shuler, F. Kargi, Bioprocess Engineering Basic Concepts, Pearson Education Inc, Upper Saddle River, New Jersey, 2002.
[33] W. Guo, H. H. Ngo, J. Li, Bioresour. Technol. 2012, 122, 27.
[34] H. C. Flemming, G. Schaule, T. Griebe, J. Schmitt, a Tamachkiarowa, Desalination 1997, 113, 215.
[35] F. Meng, H. Zhang, F. Yang, L. Liu, Environ. Sci. Technol. 2007, 41, 4065.
[36] M. C. Vincent Vela, S. Álvarez Blanco, J. Lora García, E. Bergantiños Rodríguez, Chem. Eng. J. 2009, 149, 232.
[37] M. Hlavacek, F. Bouchet, J. Memb. Sci. 1993, 82, 285.
[38] E. Iritani, Y. Mukai, Y. Tanaka, T. Murase, J. Memb. Sci. 1995, 103, 181.
[39] G. Sabia, M. Ferraris, A. Spagni, Environ. Sci. Pollut. Res. 2016, 23, 1598.
[40] J. Mueller, R. H. Davis, J. Memb. Sci. 1996, 116, 47.
[41] G. O. Toole, H. B. Kaplan, R. Kolter, Annu. Rev. Microbiol. 2000, 54, 49.
[42] A. Persat, C. D. Nadell, M. K. Kim, F. Ingremeau, A. Siryaporn, K. Drescher, N. S. Wingreen, B. L. Bassler, Z. Gitai, H. A. Stone, Cell 2015, 161, 988.
[43] T. Vanzieleghem, P. Herman-Bausier, Y. F. Dufrene, J. Mahillon, Langmuir 2015, 31, 4713.

76
[44] A. H. Rickard, P. Gilbert, N. J. High, P. E. Kolenbrander, P. S. Handley, Trends Microbiol. 2003, 11, 94.
[45] R. Van Houdt, C. W. Michiels, 2005, 156, 626.
[46] R. S. Friedlander, N. Vogel, J. Aizenberg, Langmuir 2015, 31, 6137.
[47] G. a. O’Toole, R. Kolter, Mol. Microbiol. 1998, 30, 295.
[48] J. M. Willey, L. M. Sherwood, C. J. Woolverton, in Prescott’s Microbiol., McGraw-Hill, New York, 2011, pp. 183–185.
[49] W. E. Thomas, L. M. Nilsson, M. Forero, E. V. Sokurenko, V. Vogel, Mol. Microbiol. 2004, 53, 1545.
[50] D. De Beer, R. Srinivasan, P. S. Stewart, Appl. Environ. Microbiol. 1994, 60, 4339.
[51] P. S. Stewart, Int. J. Med. Microbiol. 2002, 292, 107.
[52] W. L. Cochran, G. A. McFeters, P. S. Stewart, J. Appl. Microbiol. 2000, 88, 22.
[53] T. E. Cloete, Int. Biodeterior. Biodegrad. 2003, 51, 277.
[54] Z. F. Cui, K. I. T. Wright, J. Memb. Sci. 1996, 117, 109.
[55] L. Vera, R. Villarroel, S. Delgado, S. Elmaleh, J. Memb. Sci. 2000, 165, 47.
[56] B. Sen Gupta, S. Hasan, M. A. Hashim, Z. F. Cui, Bioprocess Biosyst. Eng. 2005, 27, 407.
[57] A. Laorko, Z. Li, S. Tongchitpakdee, W. Youravong, Sep. Purif. Technol. 2011, 80, 445.
[58] Z. Li, X. Xu, X. Xu, F. L. Yang, S. S. Zhang, Chemosphere 2015, 140, 106.
[59] R. Ghosh, J. Memb. Sci. 2006, 274, 73.
[60] G. Belfort, J. Memb. Sci. 1989, 40, 123.
[61] S. Vigneswaran, S. Boonthanon, H. Prasanthi, Desalination 1996, 106, 31.
[62] H. Liang, W. Gong, G. Li, Desalination 2008, 221, 345.
[63] S. Y. Park, J. W. Chung, S.-Y. Kwak, J. Memb. Sci. 2015, 491, 1.
[64] A. Venault, Y. Chang, H. H. Hsu, J. F. Jhong, H. S. Yang, T. C. Wei, K. L. Tung, A. Higuchi, J. Huang, J. Memb. Sci. 2013, 439, 48.
[65] D. E. Potts, R. C. Ahlert, S. S. Wang, Desalination 1981, 36, 235.
[66] H. Ma, C. N. Bowman, R. H. Davis, J. Memb. Sci. 2000, 173, 191.

77
[67] R. Deqian, Desalination 1987, 62, 363.
[68] I. Masselin, X. Chasseray, L. Durand-Bourlier, J. M. Lain, P. Y. Syzaret, D. Lemordant, J. Memb. Sci. 2001, 181, 213.
[69] S. Muthukumaran, K. Yang, A. Seuren, S. Kentish, M. Ashokkumar, G. W. Stevens, F. Grieser, Sep. Purif. Technol. 2004, 39, 99.
[70] S. S. Madaeni, Y. Mansourpanah, Desalination 2004, 161, 13.
[71] A. Weis, M. R. Bird, M. Nyström, J. Memb. Sci. 2003, 216, 67.
[72] E. Zondervan, B. Roffel, J. Memb. Sci. 2007, 304, 40.
[73] S. S. Popović, M. N. Tekić, M. S. Djurić, J. Food Eng. 2009, 94, 307.
[74] J. C.-T. Lin, D.-J. Lee, C. Huang, Sep. Sci. Technol. 2010, 45, 858.
[75] A. Al-Amoudi, R. W. Lovitt, J. Memb. Sci. 2007, 303, 4.
[76] W. Barthlott, C. Neinhuis, H. Verlot, C. L. Schott, Planta 1997, 1.
[77] L. Bocquet, E. Lauga, Nat. Mater. 2011, 10, 334.
[78] Y. Liu, X. Chen, J. H. Xin, J. Mater. Chem. 2009, 19, 5602.
[79] K. K. Varanasi, T. Deng, J. D. Smith, M. Hsu, N. Bhate, Appl. Phys. Lett. 2010, 97, 234102.
[80] R. S. Friedlander, H. Vlamakis, P. Kim, M. Khan, R. Kolter, J. Aizenberg, Proc. Natl. Acad. Sci. U. S. A. 2013, 110, 5624.
[81] X. Deng, L. Mammen, H.-J. Butt, D. Vollmer, Science (80-. ). 2012, 335, 67.
[82] A. Tuteja, W. Choi, M. Ma, J. M. Mabry, S. A. Mazzella, G. C. Rutledge, G. H. McKinley, R. E. Cohen, Science (80-. ). 2007, 318, 1618.
[83] H. F. Bohn, W. Federle, Proc. Natl. Acad. Sci. U. S. A. 2004, 101, 14138.
[84] T.-S. Wong, S. H. Kang, S. K. Y. Tang, E. J. Smythe, B. D. Hatton, A. Grinthal, J. Aizenberg, Nature 2011, 477, 443.
[85] N. Vogel, R. a Belisle, B. Hatton, T.-S. Wong, J. Aizenberg, Nat. Commun. 2013, 4, 2167.
[86] C. Howell, T. L. Vu, C. P. Johnson, X. Hou, O. Ahanotu, J. Alvarenga, D. C. Leslie, O. Uzun, A. Waterhouse, P. Kim, M. Super, M. Aizenberg, D. E. Ingber, J. Aizenberg, Chem. Mater. 2015, 27, 1792.
[87] J. D. Smith, R. Dhiman, S. Anand, E. Reza-Garduno, R. E. Cohen, G. H. McKinley, K. K. Varanasi, Soft Matter 2013, 9, 1772.

78
[88] A. Carlson, P. Kim, G. Amberg, H. A. Stone, Europhys. Lett. 2013, 104, 34008.
[89] N. MacCallum, C. Howell, P. Kim, D. Sun, R. Friedlander, J. Ranisau, O. Ahanotu, J. J. Lin, A. Vena, B. Hatton, T.-S. Wong, J. Aizenberg, ACS Biomater. Sci. Eng. 2015, 1, 43.
[90] U. Manna, D. M. Lynn, Adv. Mater. 2015, 27, 3007.
[91] A. K. Epstein, T.-S. Wong, R. A. Belisle, E. M. Boggs, J. Aizenberg, Proc. Natl. Acad. Sci. 2012, 109, 13182.
[92] K. Manabe, K. H. Kyung, S. Shiratori, ACS Appl. Mater. Interfaces 2015, 7, 4763.
[93] S. Sunny, N. Vogel, C. Howell, T. L. Vu, J. Aizenberg, Adv. Funct. Mater. 2014, 24, 6658.
[94] S. Yuan, S. Luan, S. Yan, H. Shi, J. Yin, ACS Appl. Mater. Interfaces 2015, 7, 19466.
[95] S. B. Subramanyam, G. Azimi, K. K. Varanasi, Adv. Mater. Interfaces 2014, 1, 1300068.
[96] X. Hou, Y. Hu, A. Grinthal, M. Khan, J. Aizenberg, Nature 2015, 519, 70.
[97] Y. Kovalenko, I. Sotiri, J. Timonen, J. C. Overton, G. Holmes, J. Aizenberg, C. Howell, Y. Kovalenko, Adv. Healthc. Mater. 2016.
[98] H. Bazyar, S. Javadpour, R. G. H. Lammertink, Adv. Mater. Interfaces 2016, DOI 10.1002/admi.201600025.
[99] K. Hintzer, T. Zipplies, D. P. Carlson, W. Schmiegel, in Ullmann’s Encycl. Ind. Chem., 2000.
[100] C.-Y. Tu, Y.-C. Wang, C.-L. Li, K.-R. Lee, J. Huang, J.-Y. Lai, Eur. Polym. J. 2005, 41, 2343.
[101] Z. Y. Xi, Y. Y. Xu, L. P. Zhu, Y. Wang, B. K. Zhu, J. Memb. Sci. 2009, 327, 244.
[102] DuPont, 2015.
[103] DuPont, 2012.
[104] DuPont, 2009.
[105] H. Zhang, A. Hussam, S. G. Weber, J. Am. Chem. Soc. 2010, 132, 17867.
[106] K. U. Goss, G. Bronner, J. Phys. Chem. A 2006, 110, 9518.
[107] E. M. Tracey, R. H. Davis, J. Colloid Interface Sci. 1994, 167, 104.
[108] P. Blanpain-Avet, J. Migdal, T. Bénézech, Food Bioprod. Process. 2004, 82, 231.

79
[109] P. Blanpain-Avet, J. Migdal, T. Bénézech, Food Bioprod. Process. 2004, 82, 231.
[110] J. Kim, J. Shin, H. Kim, J.-Y. Lee, M.-H. Yoon, S. Won, B.-C. Lee, K. G. Song, Bioresour. Technol. 2014, 172, 321.
[111] S. Chang, Adv. Chem. Eng. Sci. 2014, 4, 56.
[112] A. L. Smith, L. B. Stadler, N. G. Love, S. J. Skerlos, L. Raskin, Bioresour. Technol. 2012, 122, 149.
[113] H. Ozgun, R. K. Dereli, M. E. Ersahin, C. Kinaci, H. Spanjers, J. B. van Lier, Sep. Purif. Technol. 2013, 118, 89.
[114] C. Howell, T. L. Vu, C. P. Johnson, X. Hou, O. Ahanotu, J. Alvarenga, D. C. Leslie, O. Uzun, A. Waterhouse, P. Kim, M. Super, M. Aizenberg, D. E. Ingber, J. Aizenberg, Chem. Mater. 2015, 27, 1792.

80
APPENDIX A: STANDARD CURVES FOR MICROPARTICLES AND WHEY PROTEIN
Chapter 3 reported values for the effluent concentration of 1 µm microparticles during constant
flow rate filtration. Figure A1.1. shows the standard curve for microparticles, created using the
initial stock solution and dilutions of the stock solution at a wavelength of 590 nm. This curve
confirmed that the relation between adsorbance and concentration was linear, an assumption
made for our calculations. A standard curve was also created for whey protein concentration, and
is shown in Figure A1.2. Whey protein concentration was measured at a wavelength of 540 nm.
Figure A.1. Standard Curve for Microparticle Filtration Standard curve for microparticles at a wavelength of 590 nm.
Figure A.2. Standard Curve for Whey Protein Concentration Standard curve for whey protein measured at a wavelength of 540 nm.
0
0.1
0.2
0.3
0.4
0.5
0 0.5 1 1.5
Ad
sorb
an
ce (
590
nm
)
Fraction of Stock Solution
0.0
0.1
0.2
0.3
0.4
0 0.5 1 1.5
Ad
sorb
ance
(54
0
nm
)
Fraction of Stock Solution

81
APPENDIX B: RAW 2.5 G L-1 WHEY PROTEIN FILTRATION CURVES
Chapter 4 presents data regarding the recovery of LGMs after both a passive resting interval and
a backflush step. The values for recovery were calculated from the normalized flux curves,
which are presented in this appendix. The break in data indicates the cleaning step, as
demonstrated in Figure 4.1. All data presented in this section is for membranes with a pore size
of 1 µm.
Figure B.1. Flux Decline Curves for Non-Lubricated Controls Cleaned by Passive Rest. Flux decline curves of non-lubricated 1 µm PTFE membranes with a resting step of 1 minute (top), 15 minutes (middle), and 30 minutes (bottom).

82
Figure B.2. Flux Decline Curves for LGMs Created with Krytox 103 Cleaned by Passive Rest. Flux decline curves for LGMs created with Krytox 103 with a resting step of 1 minute (top), 15 minutes (middle), and 30 minutes (bottom).

83
Figure B.3. Flux Decline Curves for LGMs Created with Krytox 107 Cleaned by Passive Rest. Flux decline curves for LGMs created with Krytox 107 with a resting step of 1 minute (top), 15 minutes (middle), and 30 minutes (bottom).

84
BIOGRAPHY OF THE AUTHOR
Jonathan Overton was born in Oklahoma City, Oklahoma in May of 1993. He was
raised in Yukon, Oklahoma, attending Yukon High School and then the Oklahoma
School of Science and Mathematics, graduating in 2011. He went on to receive his
Bachelor of Science with Departmental and College Honors in Biosystems Engineering
with an option in Bioprocessing and Biotechnology from Oklahoma State University in
2015 under the advisement of Dr. Dani Bellmer. He worked as a Research Assistant to
Dr. Hasan Atiyeh throughout his undergraduate career, performing research in the
conversion of lignocellulosic feedstocks to commodity chemicals. During this time, he
co-authored the article “Butanol production from hydrothermolysis-pretreated
switchgrass: Quantification of inhibitors and detoxification of hydrolyzate” in
Bioresource Technology. He moved to Orono, Maine in 2015 and began to work on his
Master of Science in Biological Engineering in 2015. As a graduate student at the
University of Maine, Jonathan has co-authored two articles: “Immobilized liquid layers:
A new approach to anti-adhesion surfaces for medical applications”, and invited review
to Experimental Biology and Medicine, as well as “Bacterial Interactions with
Immobilized Liquid Layers” in Advanced Healthcare Materials. After graduation,
Jonathan will be pursuing a Ph.D. in Agricultural and Biological Engineering at Purdue
University on the Frederick N. Andrews Fellowship.
Jonathan is a candidate for the Master of Science degree in Biological
Engineering from the University of Maine in May 2017.