liquidity alm or market risk ? jérôme lebuchoux. liquidity vague concept ? standard approach ...
TRANSCRIPT
Liquidity ALM or Market Risk ?
Jérôme Lebuchoux
Liquidity
Vague concept ?
Standard approach Related to market liquidity on asset (volume, trades, prices, etc…) microstructure
Major risk Macro impact Credit crunch Crisis
Market liquidity
Classical approach for liquidity Execution price depends on the volume
Execution Take into account the asymmetry (buy and sell) Optimal execution model for block trade
Allocation Rebalance the portfolio according to the liquidity
Risk Gap risk Limits
It is a vision of liquidity related to buy / sell action
Market liquidity
The regulators are imposing new constraints
New pools of liquidity have emerged New exchanges Dark pool Long term investors
This approach is not appropriate for many markets (Fixed income)
Is there something else ?
Market liquidity
Investors are not operating with the same objective nor under the same rules
Pension funds Hedge fund Insurance…
The buy and sell are only the visible actions but behind every operations there is a financing part
Cash Margin Borrow Collateral

Examples
Buy a future at an exchange Post the initial margin
Sell short a financial stock Borrow the stock
Buy a swap Post collateral

ALM liquidity
If there is no financing there is no investment
If one could not buy it may be able to borrow
If one could not sell it may be able to repo or post for collateral
Example : Corporate bonds No price on secondary market Accepted as collateral Borrow money, post the bond as collateral and invest into new asset
• Spread position
Borrowing cost, repo market are good indicators for liquidity, it could be used to get a long or a short position on liquidity on FI market.

Hedge Fund
Hedge Fund utility ?
Optimal Capital allocation Diversification Arbitrage New risk profile
Liquidity provider To the Market To the investors

Facts
Old concept but a young industry
Asset Management industry has been hit by the crisis :● Asset under management has been reduced.● Performance was poor.● Risk management has shown its limits● Authorities are putting pressure for new standards and regulation.● The confidence of the investors is low
Consequences :● Revenues are declining ● Customers are more demanding● The image of the industry is deteriorated

A step back
Main drivers of the asset management industry :● Economy
● Growth of economy● Capital needs to sustain the economy growth and restructuring
● Demography● Life expectancy● Human capital growth
● Globalization● Free trade● Communication and mobility
● Politics● Tax regime Labour / Capital● Social security vs individual savings

Hope
An evolution or a revolution ? :● Only the first point (Economy) is directly impacted by the crisis ● There are second order effects on the other points
● Returns of protectionism● Nationalisation of the economies● Political instability…
● World AL balance has evolved (geographically, private/public…) but is growing
A threat or an opportunity ? :● Adequacy between the offer and the demand has been challenged● Leaders are under pressure and Darwinism is ongoing
Our opinion: The asset management starts restructuring The window for change and opportunity is now

AUM & Actors
A steady increase of AUM and of number of HF until 2007…the crisis changes the picture

Performance
The decorrelation of the HF performance with the indexes in question

Alternative investment and liquidity crisis
The financial crisis impacts the HF industry
A performance issue Weak and correlated performance Limited number of strategies Small capacity wrt performance impact
Poor liquidity Limited financing facility Illiquidity of the underlying
Investors on hold Fall in AUM Investors raise their standards

Liquidity risk
Hedge fund are Long correlation in stable market and short the systemic correlation Long the spread of liquidity between investors - market
Standard Liquidity indicators Market impact Number of days to close the positions
Features to manage the liquidity Lock up Gates…
Unfortunately the set up of the fund have been made according to Market practice : Lock up Emergency : Gates
But not wrt the “real” liquidity risk

A toy example
Fund with a stock X in illiquid asset (price impact / NAV)
Buy an extra x of asset -> move the price up by y% -> NAV of fund + y% on the full AUM Sell x of asset -> move the price down by -y% -> NAV of fund - y% on the full AUM
A liquidity trap / gap risk
It is always easier to buy than to sell
An asymmetric risk / bubble
Tomatoes fund
Tomatoes producer
New investment
NAV
buy

A simple framework
Needs to move from a pure performance / risk model to an Asset and Liability model (which is the difference between the P&L and the NAV)
Liability : Investors, fees, etc… Asset : investment
Model of investors portfolio Each investors and prospects are ranked wrt its category, size of investment and probability to invest
or redeem.
Today AUM : 100 M$, new potential investors : 5 M$
A simple framework
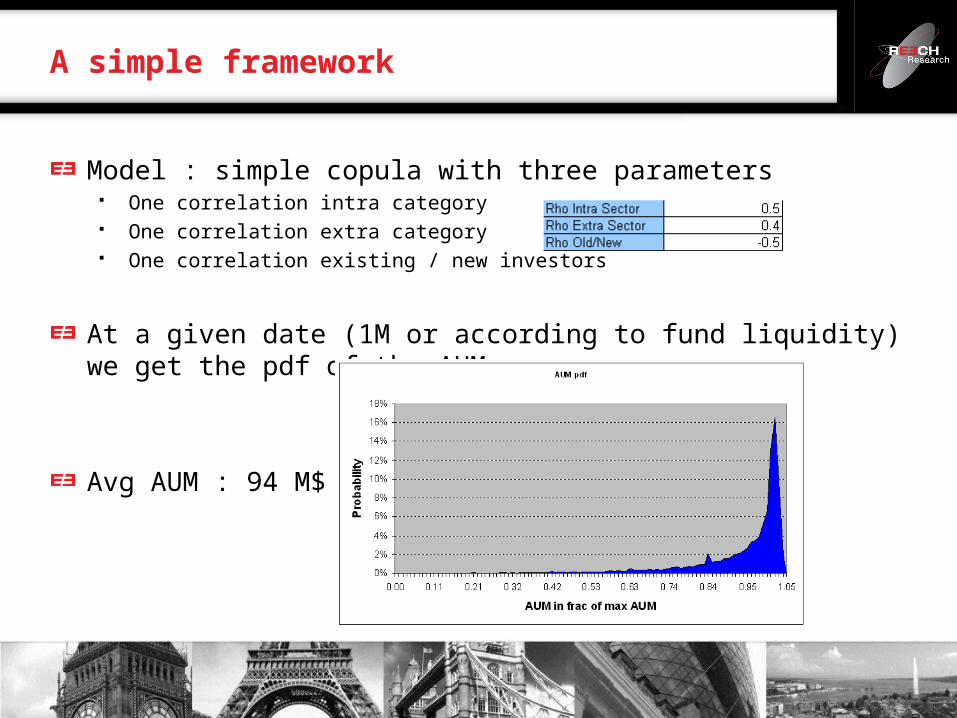
Model : simple copula with three parameters One correlation intra category One correlation extra category One correlation existing / new investors
At a given date (1M or according to fund liquidity) we get the pdf of the AUM
Avg AUM : 94 M$

Portfolio model One risky and non risky asset, no rate and dividend, simple BS model
One period model At the end of the period the AUM is impacted by the redemption and the new investment
Rebalancing without impacting the portfolio risk profile
Where is the growth of the AUM
Allocation model
σdWμdtS
dS
xX,S
dSθdX 0
ωXεX
1ωεθ ωε

Cost of rebalancing according to an average liquidity L
Optimal portfolio
Utility function
Special case
Allocation model
L1εθβλxεx,Uln
ωεX,EUArgMinθ
L1ωεθβ

The optimal allocation leads to an option on AUM
The optimal allocation accounts for the hedge of the option
The optimal allocation could be seen as the classical allocation minus the risk on the spread AUM / Asset
Intuitive approach
1-βCall2
1TλεX,Uln L
222 TE
2
*L
*
λσ
μ:θ1-εθcDeltaθθ

Target allocation in risky asset 55% Beta : 10% L : 20 %
% Change in risky asset allocation
If the proba of redemption increases, the investment in risky asset should decrease
If the investors are “correlated”, the investment in risky asset should decrease
Simple model result
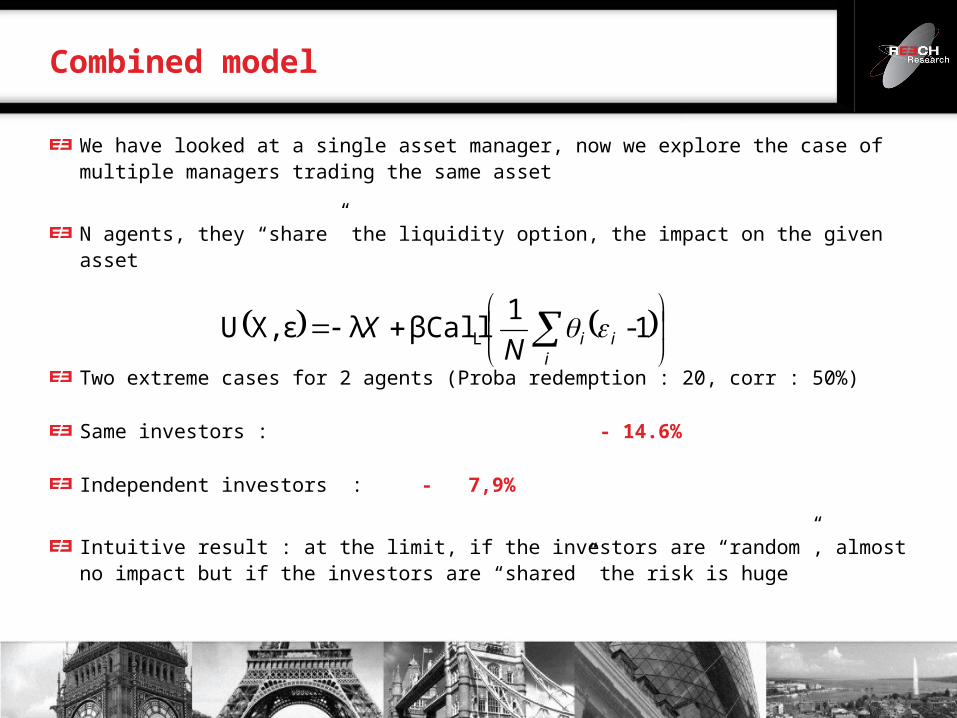
We have looked at a single asset manager, now we explore the case of multiple managers trading the same asset
N agents, they “share” the liquidity option, the impact on the given asset
Two extreme cases for 2 agents (Proba redemption : 20, corr : 50%)
Same investors : - 14.6%
Independent investors : - 7,9%
Intuitive result : at the limit, if the investors are “random”, almost no impact but if the investors are “shared” the risk is huge
Combined model
iiiN
X 1-1
βCallλεX,U L
The HF industry moved from “random” or “positive” flow of AUM to highly correlated outflows
It is crucial to quantify and manage the investors risk
Key points Better knowledge of investors Diversify the strategies Don’t be short of liquidity option
Extensions Investors redemption / fund performance correlation Multi period Define optimal liquidity of the fund (lock up, gates) Model the correlation to exogenous factor (demography, etc…)
Conclusion