liquidity value and ipo underpricing
TRANSCRIPT

0
Liquidity Value and IPO Underpricing
Wei Gaoa
Yuanzhi Lib Hongda Zhongc
January 2019
Abstract
IPO transforms a private firm into a publicly traded one and improves the liquidity of its shares. Better liquidity causes higher valuation of the firm, which we call “liquidity value”. We develop a model in which issuers and IPO investors bargain to share the liquidity value, resulting in a discounted offer price, i.e., IPO underpricing. Consistent with the model, we find that underpricing is positively related to the expected post-IPO liquidity of the issuer. The relation is stronger for firms with more information uncertainty and wider analyst coverage, and when the underwriter has more bargaining power and a smaller fraction of the firm is sold. We also explore two regulation changes as exogenous shocks to issuers’ liquidity before and after IPO, respectively. In a diff-in-diff setting, higher expected post-IPO liquidity or lower pre-IPO liquidity causes more underpricing. JEL Classifications: G32; G34 Keywords: Liquidity, IPO underpricing, Nash bargaining game ______________________________________________________________________________ a Fox School of Business, Temple University, Philadelphia, PA, 19122, USA; [email protected] b Fox School of Business, Temple University, Philadelphia, PA, 19122, USA; [email protected] c London School of Economics, London, UK; [email protected] The authors are grateful for helpful comments from seminar participants at Temple University and London School of Economics. All errors are our own.
1
Liquidity Value and IPO Underpricing
1. Introduction
It is well established that investors demand lower returns and give higher valuations to more
liquid assets (Amihud and Mendelson, 1986). Balakrishnan, Billings, Kelly, and Ljungqvist (2014)
show that managers actively shape the firm’s information environments to improve liquidity so
they achieve higher valuation. IPO, by transforming private firms into publicly traded ones, is an
extreme corporate event that improves liquidity and increases firm value. Meanwhile, private firm
investors face much less price impact when they exit their investments in a liquid public market
after IPO compared to selling shares in an illiquid private market. The market value of the firm is
thus higher after such selling activities. We refer to such increased firm market value due to
improved liquidity in these channels as “liquidity value” in this paper. Despite this fundamental
role IPO plays in firm valuation, little attention has been paid to the relationship between liquidity
value and the determination of IPO offer prices. In this study, we posit that, issuers share the benefit
of liquidity value with IPO investors by setting a discounted offer price, i.e., IPO underpricing – a
stylized fact that IPO stocks typically yield large first-day returns after going public.1
We formally develop this novel channel of IPO underpricing in a standard Nash bargaining
framework. In the model, the entrepreneur of a private firm negotiates with IPO investors to split
the liquidity value. The bargaining power of IPO investors is assumed to be greater than zero. The
model shows that IPO underpricing, which captures the payoff to IPO investors, is proportional to
liquidity value, and positively related to the underwriter’s bargaining power and negatively related
to the size of the issuance. Higher liquidity value generated by IPO should lead to more
1 Logue (1973) and Ibbotson (1975) provide some early evidence of large first-day returns defined as the offer price to close return. In our sample period of 1981-2015, the average underpricing is 21.5%.
2
underpricing during the bargaining process, controlling for bargaining power and the size of
issuance. This prediction provides the theoretical foundation for our empirical tests.
Liquidity value is caused by the difference between the issuer’s post-IPO liquidity as a public
firm and pre-IPO liquidity as a private firm. Since the pre-IPO liquidity is not directly observable,
we design the baseline test by testing the relationship between underpricing and the issuer’s
expected post-IPO liquidity. We measure the “expected” post-IPO liquidity (hereinafter referred
to as “expected liquidity”) because when the offer price is being negotiated and determined, the
post-IPO liquidity is not realized thus known to the negotiating parties yet. While the theory
predicts a relationship between underpricing and liquidity value (expected liquidity – pre-IPO
liquidity), we proxy liquidity value by the post-IPO liquidity in the baseline regressions. We adopt
this approach in the baseline regressions, because we are not aware of any consistent quantitative
liquidity measure for both private and public firms. Of course, this approximation could potentially
generate measurement error, because pre-IPO liquidity is left out of the regression. However,
measurement error only biases the estimations if the issuer’s pre-IPO liquidity is correlated with
its expected liquidity. We address this issue in two folds. First, we measure the issuer’s expected
liquidity with its public peer firms’ liquidity, which is unlikely to be correlated with the issuer’s
pre-IPO liquidity. Second, we explicitly reply on an exogenous shock to expected liquidity for
cleaner identification. The details are as follows.
Liquidity is measured by spread, turnover, and log AIM (Amihud’s Illiquidity Measure). The
main measure for expected liquidity is its peer public firms’ liquidity in the 12 months leading to
the IPO (hereinafter referred to as Peer Spread and Peer Liquidity and Peer AIM).2 Figure 1
2 In robustness checks, we also use the issuer’s own after-market liquidity in the 12 months following IPO as the proxy for its expected liquidity. All results remain the same and some are even stronger statistically. We elect not to include this analysis in the main text, because the endogeneity problem related to this measure is likely to be severe.
3
summarizes the key takeaway of the baseline regression. The univariate analysis plots the average
underpricing across subsamples of firms in five liquidity quintiles. The figure clearly shows a
monotonic pattern that is economically significant. The difference in underpricing exceeds 25%
between the lowest liquidity quintile and the highest liquidity quintile. Similar results hold in the
multi-variate regression. For instance, one standard deviation increase in peer turnover increases
underpricing by 13.3%, one standard deviation increase in peer AIM reduces underpricing by
9.6%, and one standard deviation increase in peer spread reduces underpricing by 6.5%, all in
absolute terms. These baseline results hold in various robustness checks.
We also provide cross-sectional tests of the baseline specification, conjecturing that some firms
should benefit more in valuation from improved liquidity compared to others. Part of the liquidity
value is generated by less price impact when insiders and venture capital funds exit their
investment, and given that VC-backed issuers have stronger needs to unload shares compared to
non-VC-backed issuers, we hypothesize that the relationship between underpricing and expected
liquidity is stronger for VC-backed issuers. We also rely on the theoretical model for inferences
on cross-sectional predictions. It shows that the relation between underpricing and expected
liquidity should be positively related to the bargaining power of the underwriter, and negatively
related to the fraction of shares issued. Consistent with the theory, we find the interaction term
between underwriter prestige (as a proxy IPO investors’ bargaining power) and expected liquidity
has a positive and significant coefficient, the interaction term between the fraction of new issuance
and expected liquidity has a negative and significant coefficient, and the interaction term between
the dummy variable of VC-backed issuers and expected liquidity has a positive and significant
coefficient.

4
In addition to the baseline regressions, we explore two regulation changes as exogenous shocks
to firms’ liquidity value. Such shocks can occur in two ways – to expected liquidity or to the pre-
IPO liquidity. We use the enactment of changes in Order Handling Rules (hereafter, OHR) at
Nasdaq in 1997 as an exogenous shock to expected liquidity of issuers listed on Nasdaq. Christie
and Schultz (1994) exposed the lack of odd-eighth quotes on Nasdaq, and subsequently Securities
and Exchange Commission (SEC) started the investigation on Nasdaq stock dealers about potential
colluding. Their conclusion is that dealers at Nasdaq engaged in shady activities to artificially
boost spread and illiquidity of stocks to increase their market-making profit. Hence SEC mandated
several changes of OHR for all Nasdaq securities in 1997. Most changes aim to decrease quoted
spread and promote trading. For example, one of the changes requires a limit order to be posted
on the trading system if it is more competitive than a dealer’s quotes. In addition, the minimum
quote size of market makers was reduced from 1000 shares to 100 shares. Therefore, the changes
in OHR promoted the competition between limit orders and dealer quotes on Nasdaq, and
improved the liquidity of stocks listed on Nasdaq (see Bessembinder 1999, Barclay et al. 1999,
among others). Meanwhile, other exchanges did not undergo a similar regulation change and IPO
stocks listed on those exchanges were not subject to the same exogenous liquidity shock. Using a
diff-in-diff approach, we show that Nasdaq IPOs exhibit more underpricing after 1997 compared
to non-Nasdaq IPOs, due to improved liquidity for securities listed on Nasdaq.
Second, we use the passage of the National Securities Market Improvement Act (hereafter,
NSMIA) in 1996 as an exogenous shock to the pre-IPO liquidity of issuers. By preempting state
regulations, NSMIA is designed to create security regulation uniformity at the federal level and to
improve capital access for private firms. In the era before NSMIA, if a private firm raises capital
in multiple states, it has to comply with varying state-level disclosure and registration rules in each

5
state. NSMIA lowers the regulatory barriers for private firms to raise capital from multiple states
by exempting firms from those rules (Ewens and Farre-Mensa, 2017). Furthermore, NSMIA also
expanded exemptions venture capital and private equity funds typically use to avoid registering
with SEC and subsequent disclosures. It broadened the pool for potential buyers of private shares,
and enhanced the liquidity for private shares. De Fontenay (2017) also notes that NSMIA
liberalizes the rules for selling and trading private securities.
We observe that, even though NSMIA is a federal regulation impacting all private firms in all
states, firms located in states with abundant in-state capital should be affected less than firms
located in states without it. By exploiting headquarter location differences among issuers, we can
conduct a diff-in-diff test. We find that issuers that are located in states more affected by NSMIA
exhibit lower underpricing in subsequent IPOs, compared to the control group while controlling
for issuer and deal characteristics. Overall, the evidence from the empirical analysis supports our
model prediction that the magnitude of IPO underpricing is positively related to the expected value
gain of the firm by going public.
IPO underpricing is a longstanding puzzle in finance, and there is a large literature
encompassing both theoretical and empirical work aiming to explain the phenomenon. Ljungqvist
(2004) summarizes explanations into the following categories: asymmetric information models
such as the winner’s curse or signaling for firm quality, institutional explanations such as concerns
for legal liability, underpricing as a means to retain control or reduce agency costs, and behavioral
explanations including investor sentiment and mental accounting. Our paper contributes to the
literature in several ways.
First, we propose a new rational explanation about why it exists universally, and with this
explanation we test the relation between underpricing and the liquidity benefit generated by going

6
public. A well-known explanation for IPO underpricing is asymmetric information about the
security’s value and with its fundamental risk. In order to attract sufficient interest from
uninformed investors, the issuer must compensate these investors for their information
disadvantage due to the winners’ curse problem (Rock, 1986). Similar to the information based
theories, we also view IPO underpricing as a form of compensation to the IPO investors. However,
departing from the traditional view, we propose a novel theory regarding why firms may offer such
payments: splitting the liquidity value generated from going public. Meanwhile, our theory does
not necessarily conflict with the information based theories, as liquidity value sharing can be
viewed explaining part of the underpricing that is on top of the risk compensations. In another
word, when investors have bargaining power as modeled in our paper, IPO investors earn extra
payoffs gaining from the liquidity value of IPO. Our approach is consistent with existing evidence
that underwriters and issuers do not fully incorporate all available public information during the
book-building process when determining offer prices (see Hanley, 1993, Loughran and Ritter,
2002, and Lowry and Schwert, 2004, among others.)
Second, our paper complements the strands of studies that explain IPO underpricing from a
bargaining perspective. The fundamental difference between these studies and risk-based or
information-based explanations is whether the IPO capital market is assumed to be perfectly
competitive and relatedly whether IPO investors have any bargaining power. If the IPO market is
highly competitive, competition among capital providers would drive any rent above risk
compensation to zero. In this case, payoffs to IPO investors should not depend on the liquidity
value. Liu and Ritter (2011) show that the IPO market is not completely competitive, but rather
characterized by local underwriter oligopolies, because issuers care about non-price dimensions
such as all-star analyst coverage and industry expertise. Our paper is closely related to their study

7
in this light. They focus on the relation between underpricing and bargaining power of the
underwriter as proxied by industry expertise, all-star analysts, or a top-tier status, while we focus
on the amount of the value gain shared by the issuer and IPO investors. Bradley, Cooney, Jordan,
and Singh (2004) study whether the offer price is an integer and conclude that the office price is
likely to be the result of negotiation and bargaining between issuers and IPO investors.
Lastly, existing literature offers limited and mixed evidence regarding the relation between
underpricing and the issuer’s secondary-market liquidity. Booth and Chua (1996) model how the
issuer’s need for broad ownership dispersion and a liquid secondary market together determine the
equilibrium level of underpricing with asymmetric information. Issuers achieve broad ownership
dispersion through over-subscription, which increases secondary-market liquidity but also requires
an increase in information costs borne by investors, who are compensated through higher IPO
underpricing. Their model predicts that larger underpricing causes better secondary-market
liquidity through the channel of diverse ownership. In their empirical analysis, they do not test the
relation between underpricing and secondary-market liquidity directly, but instead focus on the
relation between underpricing and over-subscription, and find supporting evidence. In contrast,
Ellul and Pagano (2006) hypothesize that the causality runs the opposite way, that is, deals with
higher liquidity risk and less liquidity post-IPO need more underpricing to attract investors to
participate. These two papers not only command different logic but also yield opposite empirical
predictions regarding whether the relation between underpricing and after-market liquidity is
positive or negative. Ellul and Pagano (2006) use IPO data from UK and find a negative
relationship between underpricing and post-IPO secondary-market liquidity (or, a positive
relationship between underpricing and the PIN variable which measures asymmetric information).
Our study helps shed light on this relation by focusing on expected liquidity of the issuer and using

8
exogenous shocks to post-IPO expected liquidity and pre-IPO liquidity for identification. Since
we use the peer public firm’s liquidity as the proxy for expected liquidity, our paper is different
from Booth and Chua (1996) but similar to Ellul and Pagano (2006) in the direction of causality.
Our empirical finding is opposite to Ellul and Pagano (2006), possibly due to the fact that they use
UK data and focus on the relation between underpricing and liquidity risk rather than liquidity
value.3
The remainder of the paper is organized as follows. Section 2 presents a simple model of
underpricing based on a Nash bargaining game and develops hypotheses. Section 3 describes the
sample and variable construction in the study. Section 4 describes empirical tests, presents main
findings and conducts robustness checks. Section 5 concludes.
2. A model of underpricing with bargaining
Consider a private firm that is valued at 𝑉𝑉, which is owned 100% by its founder. The total
number of shares is normalized to one. The pre-issuance share price is thus equal to 𝑉𝑉. The firm
plans to go public by issuing 𝑁𝑁 new shares at an offer price of 𝑃𝑃. The firm hires an underwriter for
IPO. The underwriter relies on her network of potential buy-side investors for participation and
negotiates with the issuer on behalf of investors.4 We assume that the IPO market is not perfectly
competitive, but instead is characterized by local oligopolies. The offer price is thus the negotiation
result between the founder and the underwriter who has significant bargaining zero.
3 For our own curiosity, we download the PIN measure for information asymmetry from Prof. Stephen Brown’s website: http://scholar.rhsmith.umd.edu/sbrown/pin-data?destination=node/998 and replicate Ellul and Pagano (2006) with US IPO data. We find the opposite result: the relationship between underpricing and PIN is negative, instead of positive. 4 Investment banks have the incentive to negotiate on behalf of IPO investors to guarantee that they receive a good deal, because they count on the same pool of investors for participation not just for the current IPO, but also for future deals. In another word, the interaction between investment banks and IPO investors can be characterized in a setting of repetitive games, unlike the one-time encounter of an issuer and its IPO investors.

9
Due to the improved liquidity as a public entity, after IPO the value of the pre-money firm
increases to 𝑘𝑘 ∙ 𝑉𝑉, where 𝑘𝑘 > 1, and (𝑘𝑘 − 1)𝑉𝑉 represents the liquidity value. The market value of
the issuer becomes higher from better liquidity through at least two channels. First, investors
demand lower rates of returns on more liquid assets everything else being equal. Second,
considering that early investors of most private firms plan to exit their investments, especially
when venture capital funds are involved, the post-exit firm value should be higher if such selling
activities occur while the firm is public due to smaller price impact.5
The total firm value after IPO is given by 𝑘𝑘𝑉𝑉 + 𝑁𝑁𝑃𝑃 . Denote the post-issuance secondary
market price on the first trading day by 𝑃𝑃′, and we have 𝑃𝑃′ = 𝑘𝑘𝑘𝑘+𝑁𝑁𝑁𝑁1+𝑁𝑁
. Denote the gain in wealth for
the founder via going public by 𝑊𝑊, and it is given by,
𝑊𝑊(𝑃𝑃) = 𝑃𝑃′ − 𝑉𝑉 = 𝑘𝑘𝑘𝑘+𝑁𝑁𝑁𝑁1+𝑁𝑁
− 𝑉𝑉. (1)
The offer price 𝑃𝑃 can be solved with a standard Nash bargaining game between the founder
and the underwriter over the liquidity value. Assume the bargaining power of the founder is 𝛽𝛽, and
the bargaining power of the underwriter (IPO investors) is 1 − 𝛽𝛽. The solution to the game is
characterized by the rule that the payoff to each party is equal to their bargaining power multiplied
by the total value to share, which is described as follows,
𝑊𝑊(𝑃𝑃) = 𝛽𝛽(𝑘𝑘 − 1)𝑉𝑉. (2)
Substituting Equation (1) to (2), we can solve for the offer price 𝑃𝑃,
𝑃𝑃 = �𝛽𝛽𝑘𝑘 + (1 − 𝛽𝛽) − (1−𝛽𝛽)(𝑘𝑘−1)𝑁𝑁
� 𝑉𝑉. (3)
5 We developed an alternative model expressing market value of the firm as a function of AIM (price impact, or illiquidity), similar to Kyle (1985). The alternative model gives the same empirical predictions as the current one. The alternative model is available upon requests.
10
It is trivial to show that 𝑃𝑃′ > 𝑉𝑉, and 𝑃𝑃′ > 𝑃𝑃. That is, both the founder and IPO investors benefit
from the IPO. Specifically, 𝑃𝑃′ − 𝑉𝑉 characterizes the dollar gain per share for the founder, and 𝑃𝑃′ −
𝑃𝑃 characterizes the dollar gain per share for IPO investors. Denote underpricing per share in the
percentage term by 𝑈𝑈. Consistent with the literature, 𝑈𝑈 is calculated as the difference between
𝑃𝑃′ and 𝑃𝑃, and divided by 𝑃𝑃.
𝑈𝑈 = 𝑁𝑁′−𝑁𝑁𝑁𝑁
= (𝑘𝑘𝑘𝑘+𝑁𝑁𝑁𝑁1+𝑁𝑁
− 𝑃𝑃)/𝑃𝑃 = 1−𝛽𝛽𝑁𝑁𝑘𝑘−1+(𝑁𝑁+1)𝛽𝛽−1
. (4)
Total payoffs to IPO investors are equal to 𝑈𝑈𝑁𝑁𝑃𝑃 = 𝑁𝑁(𝑃𝑃′ − 𝑃𝑃) = (1 − 𝛽𝛽)(𝑘𝑘 − 1)𝑉𝑉, which is
equal to their bargaining power 1 − 𝛽𝛽 multiplied by the total value to share (𝑘𝑘 − 1)𝑉𝑉. This also
confirms that the solution complies with the sharing rule of a Nash bargaining game.
With Equation (4), we can calculate the first derivative of underpricing 𝑈𝑈 with respect to the
liquidity value (𝑘𝑘 − 1), which is equivalent to the derivative with respect to 𝑘𝑘, the founder’s
bargaining power 𝛽𝛽, and new shares issued 𝑁𝑁. And we have,
𝜕𝜕𝜕𝜕𝜕𝜕𝑘𝑘
> 0, 𝜕𝜕𝜕𝜕𝜕𝜕𝛽𝛽
< 0, 𝜕𝜕𝜕𝜕𝜕𝜕𝑁𝑁
< 0. (5)
It shows that the magnitude of underpricing is increasing in liquidity benefit 𝑘𝑘, decreasing in
the issuer’s bargaining power 𝛽𝛽, and decreasing in new shares issued 𝑁𝑁. In our empirical analysis,
we focus on the relation between underpricing and the liquidity benefit 𝑘𝑘, controlling for the
variables related to the bargaining power and the fraction of new shares issued.
The liquidity value (𝑘𝑘 − 1)𝑉𝑉 generated by going public cannot be calculated directly, because
the counter-factual market valuation of the issuer staying as a private entity is not observable. We
circumvent this issue by observing that liquidity benefit in valuation should be closely related to
liquidity improvement from being private to public. Hence testing the relation between

11
underpricing and valuation increase can be transformed to testing the relation between
underpricing and liquidity improvement. Since the liquidity of the issuer as a public entity is not
realized at the IPO negotiation time, the offer price should be determined by the market’s
consensus expectation at the time of IPO for the issuer’s post-IPO liquidity. We call this expected
liquidity of the issuer. Formally, we test the following two hypotheses.
H1: The magnitude of IPO underpricing should be positively related to the expected post-IPO
liquidity of the issuer, everything else being equal.
H2: The magnitude of IPO underpricing should be negatively related to the pre-IPO liquidity
of the issuer when it is private, everything else being equal.
The expected liquidity post-IPO for each issuer can be measured in various ways, while the
issuer’s pre-IPO liquidity as a private firm is not observable. As a result, we design the baseline
test of the paper according to H1, and the test for H2 serves as a complement for the main analysis.
In the next two sections, we describe in details the data and empirical methodology employed to
test these two hypotheses.
3. Sample and variable construction
We start sample construction by identifying US firm-commitment initial public offerings from
Thomson Financial’s SDC Global New Issues database.6 Following the common practice in the
literature, we exclude deals with offer prices less than $5, unit offerings, ADRs, financial and
6 Some IPO studies examine both firm-commitment and best-effort issues (see Ritter, 1987; Booth and Chua, 1996) Meanwhile, many other IPO studies only examine firm-commitment issues (Carter and Manaster, 1990; Barry, Muscarella, and Vetsuypens, 1991; Loughran and Ritter, 2004, among others). We exclude best-effort offers because best-effort offers are typically very small offerings.

12
utility offerings (SIC codes 6000–6999 and 4900–4999), certificates, shares of beneficial interest,
companies incorporated outside the U.S., Americus Trust components, closed-end funds, REITs,
and limited partnerships.
Variables related to the deal characteristics including IPO offer price, IPO underwriters, and
IPO proceeds are from SDC. Stock price and liquidity data (first-day closing price, bid price, ask
price, number of shares outstanding, stock exchange, and trading volume) are from CRSP. We use
underwriting ranking data on Prof. Jay Ritter’s website. The monthly market sentiment data is
from Prof. Jeffrey Wurgler’s website (Baker and Wurgler, 2006). We download the Fama-French
10-industry classification from Prof. Kenneth R. French’s website. The final sample consists of
3,775 IPOs from 1981 to 2015 in US.
Panel A of Table 1 presents the distribution of IPO deals in listing venues. There are three
exchanges that IPOs are listed at: the New York Stock Exchange (NYSE), the American Stock
Exchange (ASE), and Nasdaq. Nasdaq IPOs account for 85.8% of the whole sample, while NYSE
deals account for 11.6%. The imbalance across exchanges is more severe during the dot com
bubble period in the 1990s. Over time, there are hot IPO periods such as the 1990s, and cold years
such as 2001, 2002, and 2003, in the aftermath of dot com bubble burst. Panel B of Table 1 shows
the distribution of IPO deals in each industry over time.7 Consistent with stylized facts, the two
industries with largest numbers of IPOs in the sample are Business Equipment (Computers,
Software, and Electronic Equipment) and Healthcare. They each account for 34.3% and 17.8% of
all deals.8
7 Only nine industries are presented because Industry nine (Utilities) are excluded as they cover all utility companies. 8 To address the concern that our results might be driven by IT firms especially during the dot com bubble period, we re-do all analysis excluding firms in the Business Equipment industry. All results remain qualitatively the same, and are presented in the Online Appendix.

13
The key variables in our analysis are underpricing and expected liquidity. Following the
literature, we construct underpricing as the percentage change from the offer price to the first-day
closing price. We use three liquidity measures: spread, turnover, and log AIM. Spread is defined
as the difference between ask price and bid price divided by the average of the two prices (mid-
point price). Turnover is the daily trading volume divided by the number of shares outstanding.
AIM is the Amihud’s (2002) illiquidity measure, which is the absolute value of daily return divided
by daily dollar volumes, scaled by 10,000,000. We construct Peer Spread, Peer Turnover, and
Peer AIM as three alternative measures for expected liquidity. Peer firms are characterized by
industry, size, and the listing stock exchange.9 Specifically, we divide the whole COMPUSTAT-
CRSP universe of stocks into five quintiles by size (measured by market capitalization) each year,
and we select publicly traded stocks that are in the same size quintile, with the same two-digit SIC
code, and listed on the same stock exchange as the issuer. For each peer firm, we first calculate an
annual liquidity measure as the simple average of its daily liquidity. We then average across all
peer firms to construct the expected liquidity for the issuer. In the baseline analysis, we test the
relationship between underpricing and expected liquidity.
Variables that are found to be important determinants of underpricing are included in the
analysis as control variables. Past literature documented a significant relation between the prestige
of the underwriter and underpricing (see Carter and Manaster, 1990; Beatty and Welch ,1996;
Cooney, Singh, Carter, and Dark, 2001; Liu and Ritter, 2011, among others). We construct Top
Underwriter as the dummy variable that is one if the lead underwriter has an updated Carter and
Manaster (1990) rank of eight or more, and zero otherwise. We use this variable to be a proxy for
9 A common practice to identify peer firms is to use just industry and size (Albuquerque, 2009, and others). Our results are robust to constructing peer firms only by industry and size. We include listing exchanges because some studies suggest that different institutional designs in different stock exchanges can affect liquidity of listed stocks (see Huang and Stoll, 1996, and Bessembinder and Kaufman, 1997).

14
bargaining power, as more prestigious investment banks should have higher bargaining power.
The model in Section 2 shows that the more bargaining power the underwriter has, the higher
underpricing should be. The model also indicates a relation between fraction of new shares issued
and underpricing. Habib and Ljungqvist (2001) propose that the dilution of shares as a result of
new issuance should matter for IPO underpricing. We define New Shares Ratio as the percentage
of IPO shares among the firm’s total number of shares outstanding. Computationally, it is
equivalent to the ratio of IPO proceeds divided by the product of IPO price multiplied by the
number of shares outstanding. Bradley, Cooney, Jordan, and Singh (2004) hypothesize that the
integer versus fractional dollar IPOs are results of negotiations between issuers and underwriters.
They find that integer IPOs are associated with more underpricing than non-integer IPOs. To
control for the integer price effect, we include the dummy variable of Integer Price. Several studies
link investor sentiment with IPO.10 To control for investor sentiment, we include Sentiment in the
regression, which is equal to the monthly market sentiment index downloaded from Prof. Jeffrey
Wurgler’s website. Lee and Wahal (2004) find that venture capital backed IPOs experience more
underpricing than non-venture backed IPOs. We construct the dummy variable VC-backed that is
equal to one if the issuer is backed by venture capital, and zero otherwise. We also control for the
issuer’s asset size and age. More details of variable construction can be found in Appendix. All
variables are winsorized at the 1st and 99th percentile level.
Table 2 presents summary statistics of variables. Panel A describes the distribution of each
variable and Panel B is the correlation matrix. The average IPO underpricing is 21.5%, with a
standard deviation of 38.8%. The average daily spread and turnover of public peer firms are 3.50%
10 Loughran, Ritter, and Rydqvist (1994) find that IPO firms are able to time their offerings for periods of high market multiples. Lee, Shleifer, and Thaler (1991) argue that individual investor sentiment is an important factor that determines when companies go public. Ljungqvist, Nanda, and Singh (2006) hypothesize that regular investors sell IPO stocks to sentiment investors.
15
and 0.80% in the 12-month period prior to the IPO. About 60.7% of IPO underwriters are large
investment banks with the Top Underwriter status. 82.1% of IPOs have integer offer prices. On
average, the issuer sells 32.2% of the ownership to raise capital in IPOs. The average sentiment is
0.32. The average asset value of issuers is $184 million, with a large variation as its standard
deviation is $578 million. The average age of issuers is 14.8 years. Around 44.7% sample issuers
are backed by venture capital.
Panel B shows that IPO underpricing has negative correlations with Peer Spread (-0.23 for
Pearson correlation, and -0.22 for Spearman correlation), positive correlations with Peer Turnover
(0.47 for Pearson correlation, and 0.31 for Spearman correlation), and negative correlations with
Peer AIM (-0.30 for Pearson correlation, and -0.32 for Spearman correlation). Additionally,
underpricing is positively correlated with Top Underwriter, Integer Price and VC-backed, and
negatively correlated with New Shares Ratio, Sentiment, and Age.
4. Empirical tests and results
4.1 The baseline
The baseline tests H1 directly by investigating whether there is a positive relation between IPO
underpricing and the issuer’s expected liquidity. We regress IPO underpricing on proxies for
expected liquidity and control variables. The regression equation is specified as follows,
𝑈𝑈𝑈𝑈𝑈𝑈𝑈𝑈𝑈𝑈𝑈𝑈𝑈𝑈𝑈𝑈𝑈𝑈𝑈𝑈𝑈𝑈𝑈𝑈𝑖𝑖𝑖𝑖𝑖𝑖 = 𝛼𝛼𝑖𝑖 + 𝛼𝛼𝑖𝑖 + 𝛼𝛼𝑖𝑖𝑖𝑖 + 𝛽𝛽1𝐸𝐸𝐸𝐸𝑈𝑈𝑈𝑈𝑈𝑈𝐸𝐸𝑈𝑈𝑈𝑈 𝐿𝐿𝑈𝑈𝐿𝐿𝐿𝐿𝑈𝑈𝑈𝑈𝑈𝑈𝐸𝐸𝐿𝐿𝑖𝑖𝑖𝑖𝑖𝑖 + 𝛾𝛾′𝑋𝑋𝑖𝑖𝑖𝑖𝑖𝑖 + 𝜀𝜀𝑖𝑖𝑖𝑖𝑖𝑖, (6)
where 𝑈𝑈, 𝑗𝑗, 𝐸𝐸 index firms, industries, and years, respectively. The parameters 𝛼𝛼𝑗𝑗,𝛼𝛼𝐸𝐸, 𝛼𝛼𝑗𝑗𝐸𝐸 estimate
the industry, year, and the interaction of industry and year fixed effects. By including 𝛼𝛼𝑗𝑗𝐸𝐸 , the

16
interacted industry and year fixed effects, we aim to control for any unobservable time-varying
industry-specific effects that are related to both underpricing and the issuer’s expected liquidity.
𝑋𝑋𝑈𝑈𝑗𝑗𝐸𝐸 is a vector of control variables that have been shown as important determinants of underpricing
in the literature, as reviewed in Section 3. H1 predicts that 𝛽𝛽1 > 0. We use public peers’ liquidity
measures Peer Spread, Peer Turnover, and Peer AIM to proxy for the expected liquidity of the
issuer.
The regression results are presented in Table 3. In Columns (1) and (2), expected liquidity is
measured by Peer Spread, in Columns (3) and (4), it is measured by Peer Turnover, and in
Columns (5) and (6), it is measured by Peer AIM. For each measure, we run the regression with
two specifications: with separate industry and year fixed effects, or with industry and year
interaction fixed effects. In all specifications, the issuer’s expected liquidity is found to be
positively related to IPO underpricing, which is reflected by significantly negative coefficients on
spread and AIM measures, and significantly positive coefficients on turnover measures.
The economic significance of expected liquidity measures is also large. We compute their
significance conservatively, by using coefficient estimates with smaller magnitudes from columns
(2), (4), and (6). One standard deviation increase in peer spread (3%) reduces underpricing by
6.5% (=3%×-2.152). Considering that the sample average underpricing is 21.5%, this is a 30%
reduction from the mean (=6.5/21.5). One standard deviation increase in peer turnover (0.5%)
increases underpricing by 13.3% (=0.5%×26.584), which is a 61.9% increase from its mean
(=13.3/21.5). One standard deviation increase in peer AIM (1.6) reduces underpricing by 9.6%
(=1.6×-0.06), which is a 44.7% reduction from the mean (=9.6/21.5).
We also find supporting evidence for other model predictions regarding the bargaining power
of IPO investors and the fraction the issuer sells during IPO. Consistent with the theory, Top
17
Underwriter, as a proxy for the bargaining power of IPO investors, is positively related to
underpricing, and its coefficient is statistically significant in all specifications. New Shares Ratio
is negatively and significantly related to underpricing. That is, the larger the fraction of the
ownership the issuer is selling during IPO, the smaller underpricing is. Results on other control
variables are also consistent with existing literature. When the offer price is an integer, there is
more underpricing due to bargaining between the issuer and IPO investors. Investor sentiment is
found to be negatively related to underpricing. In most specifications, larger and older issuers are
associated with lower underpricing, which is likely due to less asymmetric information. Venture
capital backed IPOs have higher underpricing compared to non-venture capital backed ones.
Including the interaction of year and industry fixed effects instead of the two separate fixed
effects does not change the findings, and the adjusted R-square is a bit lower. This implies that
there is not much time-varying unobserved industry fixed effects in underpricing. Still, the
robustness of the results on expected liquidity even with the inclusion of such interaction terms
shows that there is more underpricing when the issuer has higher expected liquidity compared to
other issuers going public in the same year and within the same industry.
In un-tabulated analysis, we conduct the following robustness checks to the baseline.11 (i) We
use the issuer’s own secondary-market liquidity measures in the 12-month period following IPO
as proxy for expected liquidity. (ii) We use Fama-French five-industry classifications rather than
10-industry classifications. (iii) Since 34% of IPOs are in the industry of Business Equipment, we
exclude these deals from the sample, to address the possibility that one particular industry drives
all the results. (iv) We use only size and industry to construct peer firms, rather than size, industry,
11 The results are shown in the Online Appendix.
18
and the listed stock exchange. (v) We use alternative time horizons of six months and nine months
prior to the IPO time, when we construct peer liquidity measures. The results are robust to all the
alternative specifications.
4.2 Cross-sectional analysis of the baseline
Having established the positive relationship between expected liquidity of the issuer and IPO
underpricing, in this section we explore cross-sectional variations in this relation. IPO generates
value to be shared by issuers and IPO investors through higher valuation for more liquid assets,
and higher market value after selling activities by founders and pre-IPO investors when they exit
their investments. Since venture capitalists have stronger incentives than founders and early
employees to exit 100% of their investments after going public, we conjecture that, better liquidity
(less price impact) is especially important for these issuers. Thus we should observe a stronger
relationship between expected liquidity and underpricing for VC-backed issuers compared to non-
VC-backed issuers. We test this conjecture by adding the interaction term of the dummy variable
VC-back and expected liquidity in the baseline regression.
We also rely on the theoretical model in Section 2 for guidance of more cross-sectional tests.
Equation (5) shows the first-order derivative of underpricing with respect to liquidity value 𝑘𝑘, the
founder’s bargaining power 𝛽𝛽, and shares of new issuance 𝑁𝑁. Since we are interested in how the
relationship between underpricing and liquidity value varies in the cross section, we can further
take derivatives of 𝜕𝜕𝑈𝑈/𝜕𝜕𝑘𝑘 with respect to 𝛽𝛽 and 𝑁𝑁. It is straight forward to show that,
𝜕𝜕2𝜕𝜕
𝜕𝜕𝑘𝑘𝜕𝜕𝛽𝛽< 0,𝑎𝑎𝑈𝑈𝑈𝑈 𝜕𝜕2𝜕𝜕
𝜕𝜕𝑘𝑘𝜕𝜕𝑁𝑁< 0. (7)

19
We test the model prediction as described by Equation (7) in the regression by adding the
interaction terms of Top Underwriter and New Shares Ratio with expected liquidity, respectively.
Since the underwriter’s bargaining power is 1 − 𝛽𝛽, we should expect a positive coefficient on the
interaction term of Top Underwriter and expected liquidity. In the model, the initial number of
shares outstanding is normalized to one, so empirically 𝑁𝑁 is equivalent to New Shares Ratio.
The regression results are presented in Table 4. For the sake of brevity, regression results on
control variables including the dummy variable of integer price, sentiment, asset size, age, and the
constant term are not presented in the table. Peer spread, peer turnover, and peer AIM are used as
the measure for expected liquidity respectively. We find strong results supporting our hypotheses.
While the average effect of VC-backed on underpricing is positive if interaction terms are not
included in the regression, Columns (1), (4), and (7) show a statistically and economically strong
positive (negative) relationship between underpricing and the interaction term of VC-backed and
liquidity (illiquidity). This implies that when venture capital investors are involved, better expected
liquidity post-IPO causes even more underpricing.
Columns (2), (5), (6) show that the coefficient of the interaction term between liquidity
(illiquidity) and the dummy variable Top Underwriter is significantly positive (negative). It
indicates the relationship between underpricing and liquidity is stronger when IPO investors have
stronger bargaining power. Columns (3), (6), (9) show that the coefficient of the interaction term
between liquidity (illiquidity) and New Shares Ratio is significantly negative (positive). The
relationship between underpricing and liquidity is stronger when there are less new shares issued
during IPO. These empirical findings are consistent with the model prediction as specified in
Equation (7).

20
4.3 Changes in the Order Handling Rules at Nasdaq
In the baseline, we show that underpricing is positively related to the issuer’s expected
liquidity, and we attempt to establish causality by using the issuer’s public peer firms’ liquidity
measure prior to the IPO time as the proxy for expected liquidity. With this measure, there is
unlikely a reverse causality problem. We also control for the interaction of year and industry fixed
effects, to control for any unobserved time-varying industry effects driving both public peers’
liquidity and underpricing. Still, this might not be a complete solution for the potential
measurement error issue discussed in the introduction. In this section, we conduct another test for
H1 with an exogenous shock to expected liquidity to some issuers based on an important regulation
change.
Christie and Schultz (1994) first expose the lack of odd-eighth quotes on Nasdaq and help to
reveal the scandal of Nasdaq dealers colluding to enhance the profitability of their market-making
business. Specifically, these dealers did not include competitive limit orders from customers when
these orders are better than their own quotes. By doing so, they managed to artificially maintain a
higher spread than what it should be. Consequently, liquidity was suppressed to some extent in the
market. In the aftermath of the scandal, SEC enacted several major changes in the Order Handling
Rules (OHR) on Nasdaq in 1997. First, the Limit Order Display Rule was phased in for all Nasdaq
National Market System (NMS) issues from January 20, 1997 to October 13, 1997. The rule
requires that limit orders should be displayed in the Nasdaq BBO (i.e., best bids and offers) when
they are better than quotes posted by market makers. The rule allows the general public to compete
directly with Nasdaq market makers. Second, the Quote Rule requires market makers to publicly
display their most competitive quotes. Third, the Actual Size Rule reduces the minimum quote
size of market makers from 1000 shares to 100 shares and thereby decreases dealers’ market
21
making risk, and encourages them to maintain more competitive quotes. Lastly, the Excess Spread
Rule (ESR) is amended so that dealers’ average spread during each month must be smaller than
150% of the average of the three narrowest spreads over the month. Prior to this, deals face a
similar requirement but on a continuous basis. Changing it to a monthly basis poses less restriction
on dealers’ ability to change their spreads. All these changes helped to improve the liquidity of
stocks listed on Nasdaq (See Bessembinder, 1999, Barclay et al., 1999, among others).
Using the changes of OHR at Nasdaq in 1997 as an exogenous shock to the expected liquidity
of IPOs that are listed on Nasdaq, we can test the relation between expected liquidity and
underpricing in a diff-in-diff framework. The first level of difference is the difference in the
magnitude of underpricing before and after 1997. The second level of difference is the difference
of the first-level difference among IPO deals listed on Nasdaq and non-Nasdaq exchanges. If we
find that after 1997, Nasdaq deals tend to have more underpricing than before 1997, it could be
due to a common time trend that is completely unrelated to the liquidity shock. Only if non-Nasdaq
IPOs do not experience the same level of increase in underpricing after 1997, we can rule out the
possibility of the common time trend. By using Nasdaq deals as the treatment group and non-
Nasdaq deals as the control group, we can properly establish the causality in the direction of the
issuer’s expected liquidity affecting IPO underpricing. Specifically, we estimate the following
regression equation.
𝑈𝑈𝑈𝑈𝑈𝑈𝑈𝑈𝑈𝑈𝑈𝑈𝑈𝑈𝑈𝑈𝑈𝑈𝑈𝑈𝑈𝑈𝑈𝑈𝑖𝑖𝑖𝑖𝑖𝑖 = 𝛼𝛼𝑖𝑖 + 𝛽𝛽1𝑁𝑁𝑎𝑎𝑁𝑁𝑈𝑈𝑎𝑎𝐿𝐿 × 𝑃𝑃𝑃𝑃𝑁𝑁𝐸𝐸 + 𝛽𝛽2𝑁𝑁𝑎𝑎𝑁𝑁𝑈𝑈𝑎𝑎𝐿𝐿 + 𝛽𝛽3𝑃𝑃𝑃𝑃𝑁𝑁𝐸𝐸 + 𝛾𝛾′𝑋𝑋𝑖𝑖𝑖𝑖𝑖𝑖 + 𝜀𝜀𝑖𝑖𝑖𝑖𝑖𝑖, (8)
Where 𝑈𝑈, 𝑗𝑗, 𝐸𝐸 index firms, industries, and years, respectively. Nasdaq is the dummy variable
that is equal to one if the issuer’s stock is listed on Nasdaq and zero otherwise; Post is the dummy
variable if IPO occurs after 1997 and zero otherwise. 𝑋𝑋𝑈𝑈𝑗𝑗𝐸𝐸 is the same vector of control variables as

22
in Equation (6), which includes Top Underwriter, New Shares Ratio, Integer Price, Sentiment,
Log(Assets), Log(1+Age), and VC-backed. H1 predicts that 𝛽𝛽1 > 0, that is, underpricing should
increase more (or, decrease less) after 1997 for Nasdaq-listed deals than non-Nasdaq listed deals,
due to improved liquidity of Nasdaq shares after 1997. Because this is essentially an event study,
we take the sample years to be the period of 1994-2000, which covers the six-year period before
and after 1997. Issuers that went public in 1997 are excluded from the sample. We include only
industry fixed effects but no year fixed effects in Equation (8), due to the relatively shorter time
window compared to the full sample period of 1981-2015, and the inclusion of Post, which is a
dummy variable indicating years before and after the exogenous shock.
As a preliminary investigation, we plot the average underpricing of IPO deals listed on Nasdaq
and non-Nasdaq exchanges in each year from 1994 to 2000 in Panel A of Figure 2. The figure
shows that both the time trend and levels of underpricing are extremely similar before 1997 for
Nasdaq and non-Nasdaq deals. After 1997 there is a common trend for underpricing to increase in
both groups, but the increase is significantly higher for Nasdaq IPOs. Particularly from 1997 to
1998, shortly after the enactment of OHR changes, underpricing at Nasdaq increased tremendously
from the previous year while underpricing at other exchanges actually decreased. This visual
examination suggests that there is a real impact of OHR changes on underpricing.
Since the post-1997 era coincides with the tech stock bubble in 1998 and 1999, and most tech
stocks go public on Nasdaq, we draw the same plot by excluding all tech stocks (industry
classification of Business Equipment) from the sample. And the results are shown in Panel B of
Figure 2. The pattern that Nasdaq IPOs have lower underpricing than non-Nasdaq deals before
1997, but higher underpricing than non-Nasdaq deals after 1997 is even more pronounced. This
shows that the result is not driven by the tech stock bubble.
23
We then run the regression of Equation (8) and the results are presented in the first two columns
of Table 5. We compare IPO underpricing in the periods of three years before and after 1997 (1994-
2000), and two years before and after 1997 (1995-1999) in Column (1) and (2) respectively. There
are 1,273 Nasdaq deals and 337 non-Nasdaq deals in Column (1), and 897 Nasdaq deals and 251
non-Nasdaq deals in Column (2). Consistent with the theory, the coefficient on the interaction term
of the Nasdaq dummy and the Post dummy is significantly positive across all two sample periods.
This suggests that Nasdaq IPOs exhibit more underpricing post 1997 compared to non-Nasdaq
IPOs. Combining the coefficient on the interaction term with the coefficient of the stand-alone
Nasdaq dummy variable, we find that, Nasdaq IPOs experience less underpricing prior to 1997,
but more underpricing after 1997. Taking Column (1) as an example, we can compute that average
underpricing of Nasdaq IPOs is -5.6% less than that of non-Nasdaq IPOs before 1997 (based on
the coefficient of -0.056 for the Nasdaq dummy), and is 15% higher after 1997 (=0.206-0.056).
Combining the coefficient on the interaction term with the coefficient of the stand-alone Post
dummy variable also enables us to confirm the visual finding in Figure 2: average underpricing of
Nasdaq deals increased significantly after 1997, while that of non-Nasdaq deals of the same time
window stayed almost flat. We hence conclude that the economic impact of OHR changes on the
underpricing of Nasdaq IPOs is large and significant. The results on control variables all remain
the same as in the earlier analysis.
To address the concern that firms endogenously choose where to be listed and thus Nasdaq
IPOs and non-Nasdaq IPOs are fundamentally different, we run the same regression using a
matched sample. We match each Nasdaq IPO with a non-Nasdaq deal from the same year in the
same industry (SIC two-digit code) and with similar size (market capitalization). For size
matching, each year we select all IPO deals and divide them into five quintiles by ranking their

24
market capitalization in the first year post IPO. If there are multiple matches, we select the one
with the smallest size difference. Only Nasdaq deals with a matched control deal are included in
the sample. There are 683 and 531 Nasdaq deals and an equal number of matched non-Nasdaq
deals in the periods of 1994-2000 and 1995-1999. Note that there are more non-Nasdaq deals in
the matched sample compared to the un-matched full sample. This is because there are more
Nasdaq IPOs than non-Nasdaq IPOs in the unmatched sample. In contrast, in the matched sample,
one non-Nasdaq deal can be shared by multiple Nasdaq deals as a control deal, so it can appear
multiple times.
Regression results of the matched sample are presented in Columns (3) and (4) of Table 5, with
the two sample periods. The main finding of a positive and statistically significant coefficient on
the interaction term of the Nasdaq dummy and the Post dummy remains robust in both
specifications. Of the two sample periods, the smaller estimate is 𝛽𝛽1 = 0.177 in Column (3),
which implies a relative increase of 17.7% in underpricing after 1997 for Nasdaq IPOs compared
to non-Nasdaq IPOs. Considering that the average IPO underpricing is 21.5%, this is an 82.3%
increase from its mean. Combining the coefficient on the interaction term and the coefficients on
the stand-alone Nasdaq or Post dummy variable, we reach similar conclusions as from the first
two columns of Table 5.
Lastly, to show that changes to OHR at Nasdaq indeed cause shocks to expected liquidity of
issuers at Nasdaq and issuers at other exchanges are not subject to the same shocks, we test the
relation between the law change and the expected liquidity measures directly. We use the monthly
spread, turnover, and log AIM (averages of daily data) of each individual public peer as the

25
dependent variable, rather than the average value across peer firms, for more accuracy of the test.12
To differentiate from the variables of Peer Spread, Peer Turnover, and Peer AIM defined earlier
as the average liquidity across peer firms, we denote them by Individual Peer Spread, Individual
Peer Turnover, and Individual Peer AIM. We run the following regression equation.
𝐼𝐼𝑈𝑈𝑈𝑈𝑈𝑈𝐼𝐼𝑈𝑈𝐿𝐿𝑎𝑎𝐼𝐼 𝑃𝑃𝑈𝑈𝑈𝑈𝑈𝑈 𝐿𝐿𝑈𝑈𝐿𝐿𝐿𝐿𝑈𝑈𝑈𝑈𝑈𝑈𝐸𝐸𝐿𝐿𝑖𝑖𝑖𝑖𝑖𝑖 = 𝛼𝛼𝑖𝑖 + 𝛽𝛽1𝑁𝑁𝑎𝑎𝑁𝑁𝑈𝑈𝑎𝑎𝐿𝐿 × 𝑃𝑃𝑃𝑃𝑁𝑁𝐸𝐸 + 𝛽𝛽2𝑁𝑁𝑎𝑎𝑁𝑁𝑈𝑈𝑎𝑎𝐿𝐿 + 𝛽𝛽3𝑃𝑃𝑃𝑃𝑁𝑁𝐸𝐸 + 𝛾𝛾′𝑍𝑍𝑖𝑖𝑖𝑖𝑖𝑖 +
𝜀𝜀𝑖𝑖𝑖𝑖𝑖𝑖, (9)
where liquidity is measured by spread or turnover, and 𝑈𝑈, 𝑗𝑗, 𝐸𝐸 index firms, industries, and
months, respectively. 𝑍𝑍𝑈𝑈𝑗𝑗𝐸𝐸 is a vector of control variables shown in previous studies that are related
to firm liquidity. The literature documents commonality of liquidity, so we control for market level
variables such as the market return, the lagged market return, the variance of daily market returns,
market sentiment, and the interest rate measured by the three-month T-bill rate (see Huberman and
Halka, 2001; Chordia, Roll, and Subrahmanyam, 2000, 2001, among others). All market level
variables are of monthly frequency.13 We also control for peers’ firm characteristics such as the log
of peer firm age since IPO, the log of sales, the log of market capitalization, and the number of
shareholders as a measure for ownership diversity. All firm characteristics are annual observations.
Industry fixed effects are included. We also run the regression for two periods of 1994-2000 and
1995-1999, and excluding the year of 1997.
The results are presented in Table 6. Columns (1) and (2) show that in both periods, individual
peer spread drops more for Nasdaq issuers compared to non-Nasdaq issuers and the difference is
12 In the regression of liquidity determination, some control variables have monthly frequencies, and some are firm characteristics. 13 The market return is the value-weighted NYSE/AMEX/NASDAQ/ARCA return reported by CRSP. The variance of market returns is the variance of daily market returns in a given month. Monthly market sentiment is downloaded from Prof. Jeff Wurgler’s website. The monthly three-month T-bill rate is download from the Federal Reserve Bank’s website.
26
highly significant. Based on the results in Column (1), we document that peer firms of Nasdaq
issuers experience a drop of 3.3% relative to those of non-Nasdaq issuers after 1997. This is large
economically as the average peer spread is 3.5%. Combining the coefficient on the interaction term
with the coefficient on the stand-alone Nasdaq dummy, we show that before 1997, average spread
of Nasdaq peers is higher or lower than non-Nasdaq peers depending on the selected period, but
after 1997, it is unanimously lower. Furthermore, taking the coefficient on the interaction term and
the one on the stand-alone Post dummy in Column (1), we estimate that after the changes to OHR
in 1997, average individual peer spread decreased 1.9% (= -0.033 + 0.014 = -0.019) for Nasdaq
issuers, while average individual peer spread increased 1.4% (= 0.014) for non-Nasdaq issuers, in
the period of 1994-2000. Column (2) shows similar patterns with slightly different magnitudes in
the period of 1995-1999. We conclude that changes to OHR impact Nasdaq issuers’ expected
trading spread, in an economically significant way. This is consistent with our prior, as changes to
OHR are designed to reduce quoted spread on Nasdaq.
Columns (3) and (4) report the results when liquidity is measured by turnover. The interaction
term of the Nasdaq dummy and the Post dummy are statistically significant and positive in both
periods. Based on the results in Column (3), using the coefficients on the interaction term and the
stand-alone Nasdaq dummy, we estimate that on average, average peer turnover of Nasdaq issuers
is 0.3% higher than that of non-Nasdaq issuers, but even more so after 1997, when the difference
becomes 0.4% (=0.001+0.003). Given that average peer turnover is 0.5%, the impact of changes
to OHR at Nasdaq is also economically large for turnover.
Lastly, Columns (5) and (6) show that the price impact of trades become smaller for Nasdaq
shares after 1997 compared to non-Nasdaq shares. Combining the coefficients of the interaction
term with the one on the Nasdaq dummy, we can see that the price impact at Nasdaq was higher
27
than that at NYSE and ASE before 1997, but much lower after 1997. Taking the coefficient on the
Post dummy, it also shows that the price impact on NYSE and ASE increased after 1997, but it
decreased on Nasdaq. In summary, Table 6 shows that changes to OHR at Nasdaq improves Nasdaq
issuers’ expected liquidity, measured by expected spread, expected turnover, or expected price
impact of trades.
4.4 The National Securities Market Improvement Act (NSMIA)
As shown in Section 2, H2 states that there should exist a negative relation between
underpricing and the issuer’s pre-IPO liquidity. The liquidity value gained through IPO is lower,
if investors can trade private shares with ease. However, testing H2 is less straightforward
compared to testing H1, due to the lack of liquidity measures for private firms. As a result, we
cannot construct a similar baseline for H2 to the one for H1 as specified by Equation (6). Instead,
we test H2 by exploiting a law change that affects liquidity of private shares to a different extent
and adopting a diff-in-diff approach. Even though the pre-IPO liquidity of issuers is not
observable, we can use the law change as an exogenous shock to liquidity and compare
underpricing before and after the law change across deals. The law change examined is the
National Securities Market Improvement Act (NSMIA), passed in October 1996.14
There are two major changes brought by the enactment of NSMIA to the issuance and trading
of private securities. First, historically a private firm seeking to raise capital needs to comply with
state regulations known as blue-sky laws, in addition to federal regulations such as Regulation D.
14 Ewens and Farre-Mensa (2017) provide an excellent and detailed description of the law.
28
Since these state regulations are often complex and different from each other, any private firm
raising capital from multiple states faces significant regulatory burdens. NSMIA created certain
federal provisions that exempted qualified private security issuers from having to comply with
these blue-sky laws in each state where the securities were issued. Specifically, securities sold
under Rule 506 of Regulation D, which allows private firms to raise unlimited amount of capital
when the investors are “accredited investors”, are exempted.15 This exemption is also used by most
venture capital (VC) and private equity (PE) funds raising capital.
Second, NSMIA affected VC and PE funds directly through changes to the Investment
Company Act of 1940. The Act mandates that most investment advisors must register with the
SEC, regularly disclose their investment positions, and limit their use of leverage. Historically VC
and PE funds have relied on the Act’s exemption to avoid having to comply with its registration
and disclosure requirements. NSMIA expanded these exemptions and made it easier for VC and
PE funds to satisfy the exemption criteria.16 The expansion of the exemptions allowed these funds
to raise capital from a larger number of investors, and increased capital available for private firms.
This directly improves the liquidity of private securities by broadening the pool of potential buyers.
The market for private securities has become more professionalized, with VC and PE funds and
operating businesses all vying for opportunities to invest in private companies or to acquire them
outright (see De Fontenay, 2017).
Both features of NSMIA improve the liquidity environment of private firms. Not only they
made it easier for private firms to raise capital, but also expanded the pool of potential investors
15 “Accredited investors” are institutions, individuals with annual income above $200K ($300K for couples), or individuals and couples with net worth above $1 million excluding the primary residence. 16 The law effectively removed the 100-investor cap in private investment funds, prompting the rise of large venture capital and private equity funds.

29
in private firms. Even though the law impacts all private firms in US, we conjecture that it affects
private firms located in states with less local VC and PE funds more. For example, consider a
private firm located in San Francisco versus another one in North Dakota. For the firm in San
Francisco, raising capital only within the state of California is likely to satisfy most of its capital
needs, thus the passage of NSMIA hardly makes any difference for it. While for the latter firm in
North Dakota, due to the lack of within-state private capital and investors, it needs to face heavy
compliance burdens dealing with other state blue-sky laws prior to NSMIA, and the passage of
NSMIA alleviates its problem substantially. As a result, NSMIA should have a larger impact on
the latter’s liquidity environment as a private firm compared to the one in San Francisco. We adopt
the diff-in-diff approach, and define the treatment group as issuers located in states with little
within-state private investors and the control group as issuers in states with abundant private
investors. We can then compare the change of IPO underpricing of the treatment group with that
of the control group.
We collect the number of private equity and venture capital firms in each state each year from
Thomson Reuters Eikon. Because trading of private shares is unlikely to occur within a PE or VC
firm but across firms, the number of these investment firms should be a better proxy for the
liquidity environment of private shares than the total value of assets under management (AUM).17
Since NSMIA is enacted towards the end of 1996, we treat 1996-1997 as the event time, and focus
on the period of three years before and after the law change (1993-2000).18 We then rank states in
this period by the total number of these firms in the event period of 1993-2000. The ranking is
shown in Table 7.
17 There is also no data source for total AUM of PE and VC funds in each state. 18 Also unlike changes to OHR at Nasdaq that affect the liquidity of public firm listed there immediately, it could take NSMIA longer time to impact the liquidity of private firms and the magnitude of IPO underpricing.

30
Not surprisingly, we find that the number of PE and VC firms from the eight states of CA, NY,
MA, TX, IL, CT, PA, and NJ together account for 73.14% of all such firms in the whole country.
Issuers located in these states should have more equity capital available within the state, and issuers
located in other states have relatively scarce capital within the state and need to raise capital in
other states. We take issuers in these eight states as the control sample, and issuers outside of these
states as the treatment sample. We hypothesize that IPO underpricing should decrease more (or,
increase less) for issuers in the treatment sample after the passage of NSMIA. We run the following
diff-in-diff regression.
𝑈𝑈𝑈𝑈𝑈𝑈𝑈𝑈𝑈𝑈𝑈𝑈𝑈𝑈𝑈𝑈𝑈𝑈𝑈𝑈𝑈𝑈𝑈𝑈𝑖𝑖𝑖𝑖𝑖𝑖 = 𝛼𝛼𝑖𝑖 + 𝛽𝛽1𝑇𝑇𝑈𝑈𝑈𝑈𝑎𝑎𝐸𝐸𝑈𝑈𝑈𝑈 × 𝑃𝑃𝑃𝑃𝑁𝑁𝐸𝐸 + 𝛽𝛽2𝑇𝑇𝑈𝑈𝑈𝑈𝑎𝑎𝐸𝐸𝑈𝑈𝑈𝑈 + 𝛽𝛽3𝑃𝑃𝑃𝑃𝑁𝑁𝐸𝐸 +
𝛽𝛽4𝐸𝐸𝐸𝐸𝑈𝑈𝑈𝑈𝑈𝑈𝐸𝐸𝑈𝑈𝑈𝑈 𝐿𝐿𝑈𝑈𝐿𝐿𝐿𝐿𝑈𝑈𝑈𝑈𝑈𝑈𝐸𝐸𝐿𝐿𝑖𝑖𝑖𝑖𝑖𝑖 + 𝛾𝛾′𝑋𝑋𝑖𝑖𝑖𝑖𝑖𝑖 + 𝜀𝜀𝑖𝑖𝑖𝑖𝑖𝑖, (10)
where 𝑈𝑈, 𝑗𝑗, 𝐸𝐸 index firms, industries, and years, respectively. Treated is the dummy variable that
is equal to one if the issuer is headquartered outside of the control states (CA, NY, MA, TX, IL,
CT, PA, and NJ), and zero otherwise. We also explore alternative control samples with the top four
states (CA, NY, MA, and TX), or the top two states (CA and NY). Post is the dummy variable if
IPO occurs after 1997 and zero if it occurs before 1996. We explicitly control for post-IPO
expected liquidity as the shocks here are to pre-IPO liquidity. 𝑋𝑋𝑈𝑈𝑗𝑗𝐸𝐸 is the same vector of control
variables as in Equation (6), which are Top Underwriter, New Shares Ratio, Integer Price,
Sentiment, Log(Assets), Log(1+Age), and VC-backed. For the same reasons explained in Equation
(8), we do not include year fixed effects but just industry fixed effects in Equation (10). H2 predicts
that 𝛽𝛽1 < 0. We investigate two time windows around the event: three years before and after the
law change (1993-2000, excluding 1996 and 1997), and two years before and after the law change
(1994-1999, excluding 1996 and 1997).

31
The regression results are presented in Table 8. In Panel A we control for peer spread, in Panel
B we control for peer turnover, and in Panel C we control for peer AIM. The three panels are
otherwise identical. For the control sample, Columns (1) and (2) use issuers from the top eight
states with the largest number of IPO firms (CA, NY, MA, TX, IL, CT, PA, and NJ), Columns (3)
and (4) use issuers from the top four states (CA, NY, MA, and TX), Columns (5) and (6) use
issuers from the top two states (CA and NY). Based on the three panels, we find that the coefficient
on the interaction term Treated × Post is significantly negative in 16 out of 18 specifications.19
Since the results presented in the panels are qualitatively identical, we describe the results in Panel
A in more details.
Combining the coefficient on the interaction term with the stand-alone Treated or the stand-
alone Post dummy, we reach two conclusions. First, before the enactment of NSMIA, issuers
located in states with scarce capital (the treatment group) experience larger underpricing than
issuers located in states with abundant capital (the control group). This is reflected in the positive
coefficient on Treated across all columns. Using results from these columns, we estimate that
underpricing for these issuers are about 1% to 4% higher. This itself is an interesting finding, as it
likely implies that IPO is especially important and beneficial for firms located in states without a
large pool of private equity investors, and these issuers are thus willing to leave more money on
the table. After the enactment of NSMIA, the pattern flipped, and issuers in the treatment group
experience smaller underpricing than issuers in the control group. For example, Column (3) shows
that the difference is -14% (=-0.178+0.041). Second, during the sample period, underpricing
increased for the control sample, but it increased less or even decreased for issuers in the treatment
19 The only exceptions are Columns (2) and (5) in Panel B, where the t-statistics of Treated × Post are -1.32 and -1.61, respectively.

32
group, as demonstrated by the positive and significant coefficient on the stand-alone Post dummy.
The estimates in Column (3) indicate that underpricing increased by 22.2% for issuers in the
control group during 1993-2000, but only increased by 4.4% for issuers in the treatment group
during the same period (=0.222-0.178). Column (4) shows that while underpricing for the control
group increased by 12.9%, it actually decreased for the treatment group by 0.5% (=0.129-0.134).
The coefficient estimates on control variables remain consistent with earlier analysis.
Overall the evidence suggests that after the passage of NSMIA, the liquidity benefit provided
by going public becomes smaller for issuers in the treatment group compared to issuers in the
control group. And the compensation received by IPO investors from these issuers, which is
measured by underpricing, becomes lower than that from the issuers in the control group. We
conclude that NSMIA has significantly different economic impact on issuers in the treatment
sample versus the control sample.
Lastly, instead of dividing the deals into the control sample and treatment sample explicitly,
we test whether issuers incorporated in states with lower rank (higher rank number) or lower
percentage of PE and VC firms experience less underpricing after 1997. We use Rank to denote
the rank of the states, and Percentage to denote the percentage of PE and VC firms of the states,
as presented in Table 7. For example, for state NJ, Rank=8 and Percentage=2.66. The regression
equation is as follows,
𝑈𝑈𝑈𝑈𝑈𝑈𝑈𝑈𝑈𝑈𝑈𝑈𝑈𝑈𝑈𝑈𝑈𝑈𝑈𝑈𝑈𝑈𝑈𝑈𝑖𝑖𝑖𝑖𝑖𝑖 = 𝛼𝛼𝑖𝑖 + 𝛽𝛽1𝑅𝑅𝑎𝑎𝑈𝑈𝑘𝑘 (𝑃𝑃𝑈𝑈 𝑃𝑃𝑈𝑈𝑈𝑈𝑈𝑈𝑈𝑈𝑈𝑈𝐸𝐸𝑎𝑎𝑈𝑈𝑈𝑈) × 𝑃𝑃𝑃𝑃𝑁𝑁𝐸𝐸 + 𝛽𝛽2𝑅𝑅𝑎𝑎𝑈𝑈𝑘𝑘(𝑃𝑃𝑈𝑈 𝑃𝑃𝑈𝑈𝑈𝑈𝑈𝑈𝑈𝑈𝑈𝑈𝐸𝐸𝑎𝑎𝑈𝑈𝑈𝑈) +
𝛽𝛽3𝑃𝑃𝑃𝑃𝑁𝑁𝐸𝐸 + 𝛽𝛽4𝐸𝐸𝐸𝐸𝑈𝑈𝑈𝑈𝑈𝑈𝐸𝐸𝑈𝑈𝑈𝑈 𝐿𝐿𝑈𝑈𝐿𝐿𝐿𝐿𝑈𝑈𝑈𝑈𝑈𝑈𝐸𝐸𝐿𝐿𝑖𝑖𝑖𝑖𝑖𝑖 + 𝛾𝛾′𝑋𝑋𝑖𝑖𝑖𝑖𝑖𝑖 + 𝜀𝜀𝑖𝑖𝑖𝑖𝑖𝑖, (11)
where 𝑈𝑈, 𝑗𝑗, 𝐸𝐸 index firms, industries, and years, respectively. The coefficient on the interaction
term of Rank × Post is expected to be negative, and the coefficient on the interaction term of
33
Percentage × Post is expected to be positive. The regression results are in Table 9. In the three
panels, we control or expected liquidity explicitly with Peer Spread, Peer Turnover, or Peer AIM.
The finding is consistent with our prediction. The coefficient on Rank × Post is negative and
significant in five out of six specifications, and the coefficient on Percentage × Post is positive
and significant in all six specifications. The effect is also economically large. For example, when
Rank is increased by one, underpricing post 1997 is lowered by 0.7% to 0.9% in the period of
1993-2000. For every 1% decrease in Percentage, underpricing post 1997 is lowered by 0.5% to
0.7%.
5. Conclusion
Traditionally IPO underpricing has been explained by theories based on asymmetric
information and fundamental risk, and in these theories underpricing is designed to compensate
IPO investors for the risk they bear while investing in shares of a brand-new public company. In
this paper, we argue that, when the IPO market is not perfectly competitive and IPO investors have
bargaining power, they can earn extra rent above the compensation for risk while investing in IPO
stocks, in the form of underpricing. Fundamentally IPO generates value gains for issuers through
higher market valuation due to improved liquidity. In order to realize the value gain, the issuer
negotiates with IPO investors to split the liquidity value provided by IPO, as the participation of
investors is crucial for the success of the IPO. A simple Nash bargaining game shows that the larger
the liquidity value generated by going public, the larger the compensation to IPO investors
(underpricing) is, holding constant the bargaining power. We thus conjecture that underpricing is
positively related to the expected post-IPO liquidity of the issuer, and negatively related to the
issuer’s pre-IPO liquidity as a private firm. Our study contributes to the vast IPO underpricing
34
literature by providing a rational compensation argument without resorting to asymmetric
information. The theory points to an often omitted empirical factor for underpricing, the liquidity
benefit provided by going public, as a first-order determinant for underpricing.
We first test a baseline specification investigating the relationship between underpricing and
an issuer’s expected liquidity. Consistent with the theory, we find a positive and significant
coefficient when regressing underpricing on expected liquidity. We conduct cross-sectional
analysis for the baseline, and find that the relation is stronger for issuers with VC investors
involved, and when the underwriter has more bargaining power, and the fraction of new issuance
is smaller.
We then exploit two important regulation changes as exogenous shocks to liquidity of some
public firms and some private firms. One is the changes to OHR at Nasdaq in 1997, and the other
one is the enactment of NSMIA. With both law changes, we adopt a diff-in-diff approach. With
changes to OHR at Nasdaq, the treatment sample consists of Nasdaq IPOs and the control sample
consists of non-Nasdaq IPOs. With the enactment of NSMIA, the treatment sample is made of
issuers located in states with scarce capital for private firms, and the control sample is made of
issuers located in states with ample capital for private firms. We establish causality relations from
an issuer’s expected post-IPO liquidity as a public entity and its pre-IPO liquidity as a private
entity to its IPO underpricing. Overall, the evidence supports our conjecture.

35
Reference
Albuquerque, A. 2009. Peer firms in relative performance evaluation. Journal of Accounting and Economics 48:69-89.
Amihud, Y., and H. Mendelson. 1986. Asset pricing and the bid-ask spread. Journal of Financial Economics 17:223–249.
Amihud, Y. 2002. Illiquidity and stock returns: cross-section and time-series effects. Journal of Financial Markets 5(1):31-56.
Amihud, Y., H. Mendelson, and L. H. Pedersen. 2005. Liquidity and asset prices. Foundations and Trends in Finance 1: 269-364.
Baker, M. and J. Wurgler. 2006. Investor sentiment and the cross‐section of stock returns. Journal of Finance 61(4):1645-1680. Barclay, M. J., W. G. Christie, J. H. Harris, E. Kandel, and P. H. Schultz. 1999. Effects of market reform on the trading costs and depth of NASDAQ stocks. Journal of Finance 54:1–34.
Barry, C.B., C.J. Muscarella, and M.R. Vetsuypens. 1991. Underwriter warrants, underwriter compensation, and the costs of going public. Journal of Financial Economics 29(1):113-135.
Beatty, R.P., and I. Welch. 1996. Issuer expenses and legal liability in initial public offerings. Journal of Law and Economics 39:545-602.
Bessembinder, H. 1999. Trade execution costs on NASDAQ and the NYSE: A post- reform comparison. Journal of Financial and Quantitative Analysis 34:387– 407.
Bessembinder, H., and H.M. Kaufman. 1997. A comparison of trade execution costs for NYSE and NASDAQ-listed stocks. Journal of Financial and Quantitative Analysis 32(3):287-310.
Bharath, S.T. and T. Shumway. 2008. Forecasting default with the Merton distance to default model. Review of Financial Studies 21(3):1339-1369.
Booth, J.R., and, L. Chua. 1996. Ownership dispersion, costly information, and IPO underpricing. Journal of Financial Economics 41(2):291-310.
Bradley, D. J., J. W. Cooney, B. D. Jordan, and A. K. Singh. 2004. Negotiation and the IPO offer price: A comparison of integer vs. non-integer IPOs. Journal of Financial and Quantitative Analysis 39(3): 517–540.
Carter, R.B., and S. Manaster. 1990. Initial public offerings and underwriter reputation. Journal of Finance 45:1045-1068.
Chordia, T., R. Roll and A. Subrahmanyam. 2000. Commonality in liquidity. Journal of Financial Economics 56:3–28.
Chordia, T., R. Roll and A. Subrahmanyam. 2001. Market liquidity and trading activity. Journal of Finance 56:501–530.

36
Christie, W.G. and P.H. Schultz. 1994. Why do Nasdaq market makers avoid odd‐eighth quotes? Journal of Finance 49(5):1813-1840. Cooney, J.W., A.K. Singh, R.B. Carter, and F.H. Dark. 2001. IPO initial returns and underwriter reputation: Has the inverse relationship flipped in the 1990s? University of Kentucky, Case Western Reserve University, and Iowa State University Working Paper.
De Fontenay, E. 2016. The Deregulation of Private Capital and the Decline of the Public Company. Hastings LJ 68:445.
Easley, D., S. Hvidkjaer and M. O’Hara. 2002. Is information risk a determinant of asset returns? Journal of Finance 57:2185–2221.
Ellul, A., and M. Pagano. 2006. IPO underpricing and after-market liquidity. Review of Financial Studies 19:381–421.
Ewens, M., and J. Farre-Mensa. 2017. The evolution of the private equity market and the decline in IPOs. Working Paper.
Garfinkel, J.A. 2009. Measuring investors’ opinion divergence. Journal of Accounting Research 47(5):1317-1348.
Habib, M. and A. Ljungqvist. 2001. Underpricing and entrepreneurial wealth losses: Theory and Evidence. Review of Financial Studies 14: 433-458.
Hanley, K. W. 1993. The underpricing of initial public offerings and the partial adjustment phenomenon. Journal of Financial Economics 34: 231-250.
Huang, R.D., and, H.R. Stoll. 1996. Dealer versus auction markets: A paired comparison of execution costs on NASDAQ and the NYSE. Journal of Financial Economics 41:313-357.
Huberman, G., and D. Halka. 2001. Systematic liquidity, Journal of Financial Research 24: 161–178.
Ibbotson, R. G. 1975. Price performance of common stock new issues. Journal of Financial Economics 2:235-272.
Kyle, A. 1985. Continuous auctions and insider trading. Econometrica 53:1315-3-1335.
Lee, C. M. C., A. Shleifer, and R. H. Thaler. 1991. Investor sentiment and the closed end fund puzzle. Journal of Finance 46:75–109.
Lee, P. M. and S. Wahal. 2004. Grandstanding, certification and the underpricing of venture capital backed IPOs. Journal of Financial Economics 73: 375-407.
Liu, X., and J.R. Ritter. 2011. Local underwriter oligopolies and IPO underpricing. Journal of Financial Economics 102(3):579-601.
Ljungqvist, A. 2004. IPO underpricing. Handbooks in Finance: Empirical Corporate Finance, Chapter III.4.
37
Ljungqvist, A., V. Nanda, and R. Singh. 2006. Hot markets, investor sentiment, and IPO pricing. Journal of Business 79(4):1667–1703.
Logue, D. E. 1973. On the pricing of unseasoned equity issues: 1965-1969. Journal of Financial and Quantitative Analysis 8: 91-103.
Loughran, T., J. R. Ritter, and K. Rydqvist. 1994. Initial public offerings: International Insights. Pacific-Basin Finance Journal 2:165–99.
Loughran, T. and J. R. Ritter. 2002. Why don’t issuers get upset about leaving money on the table in IPOS? Review of Financial Studies 15:413-443.
Loughran, T. and J. R. Ritter. 2004. Why has IPO underpricing changed over time? Financial management:5-37.
Lowry, M. and G.W. Schwert. 2004. Is the IPO pricing process efficient? Journal of Financial Ecomomics 71: 3-26.
Ritter, J. R. 1987. The costs of going public. Journal of Financial Economics 19:269-281.
Ritter, J. R., and I. Welch. 2002. A review of IPO activity, pricing, and allocations, Journal of Finance 57: 1795-1828.
Rock, K. 1986. Why new issues are underpriced. Journal of Financial Economics 15:187-212.

38
Appendix
Variables Definition Source
Offer Price IPO Offer Price SDC
Underpricing Percentage change from the offer price to the first-day closing price SDC & CRSP
Peer Spread
We select the issuer's peer firms as the publicly traded ones with the same industry (SIC 2-digit code), similar size, and listed on the same exchange. Daily spreads of each peer firm is calculated in the 12 months preceding the IPO time. We then take an average of the daily spreads, and average across peer firms to construct peer spread.
CRSP
Peer Turnover
We select the issuer's peer firms as the publicly traded ones with the same industry (SIC 2-digit code), similar size, and listed on the same exchange. Daily turnover of each peer firm is calculated in the 12 months preceding the IPO time. We then take an average of the daily turnover, and average across peer firms to construct peer spread.
CRSP
Peer AIM
We select the issuer's peer firms as the publicly traded ones with the same industry (SIC 2-digit code), similar size, and listed on the same exchange. Following Amihud (2002), we use daily CRSP data (CRSP variables ret, prc, and vol) to calculate the ratio of absolute stock return to dollar volume [10,000,000 × | ret | ÷ (prc × vol) ] for each day in the 12-month period before the IPO for each peer firm. We then average over the period and average across peer firms, and the final measure is the natural log of one plus the average peer AIM.
Top Underwriter A dummy variable that is equal to one if the lead underwriter has an updated Carter and Manaster's (1990) rank of eight or more, and zero otherwise.
Prof. Jay Ritter's website
Integer Price A dummy variable that is equal to one if the offer price is an integer and zero otherwise. SDC
New Shares Ratio It is the fraction of the ownership the issuer sells during the IPO. It is calculated as IPO proceeds / (IPO price × number of shares outstanding). CRSP
Sentiment It's the monthly market sentiment index based on the closed-end fund discount, the NYSE share turnover, the number of IPOs, the share of equity issuance in total equity and debt issuance, and the dividend premium, constructed in Equation (2) of Baker and Wurgler (2006).
Prof. Jeffrey Wurgler's website
Assets Firm’s pre-issue book value of assets, in millions of dollars. SDC
Age Calendar year of offering minus the calendar year of founding. Prof. Jay Ritter's website

39
VC-backed Equals one (zero otherwise) if the IPO was backed by venture capital. SDC
Peer Age Number of years that the peer firm has been public. CRSP
Sales Peer firm's annual sales, in millions. COMPUSTAT
Market Cap We first obtain daily market capitalization, which equals daily price times number of shares outstanding. We then take the average of daily values within a given month to reach monthly value. CRSP
Number of Shareholders Number of shareholders, in millions COMPUSTAT
Market Return NYSE/AMEX/NASDAQ/ARCA monthly market return. CRSP
Lagged Market Return Market return of the same month in the previous year. CRSP
Variance of Market Return Square of the standard deviation of daily market return within a given month. CRSP
Interest Rate Monthly three-month treasury bill rate. The Federal Reserve Bank's website

40
Figure 1
Average underpricing across quintile subsamples sorted by expected liquidity
The figure shows the average IPO underpricing in subsamples, when the deals are sorted by Peer Spread, Peer Turnover, and Peer AIM into five quintiles during the period of 1981-2015. Peer firms are publicly traded firms that are in the same industry (SIC 2-digit code), listed on the same exchange, and within the same size (defined by market capitalization) quintile in the COMPUSTAT-CRSP universe as the issuer. Peer Spread (Turnover) is the peer public firms’ average daily spread (turnover) in the 12-month period prior to the IPO. Peer AIM is the natural log of one plus peer public firms’ average daily AIM in the 12-month period prior to the IPO.
Panel A: Underpricing and Peer Spread
010
2030
40IP
O U
nder
pric
ing
(%)
Low Spread 2 3 4 High Spread
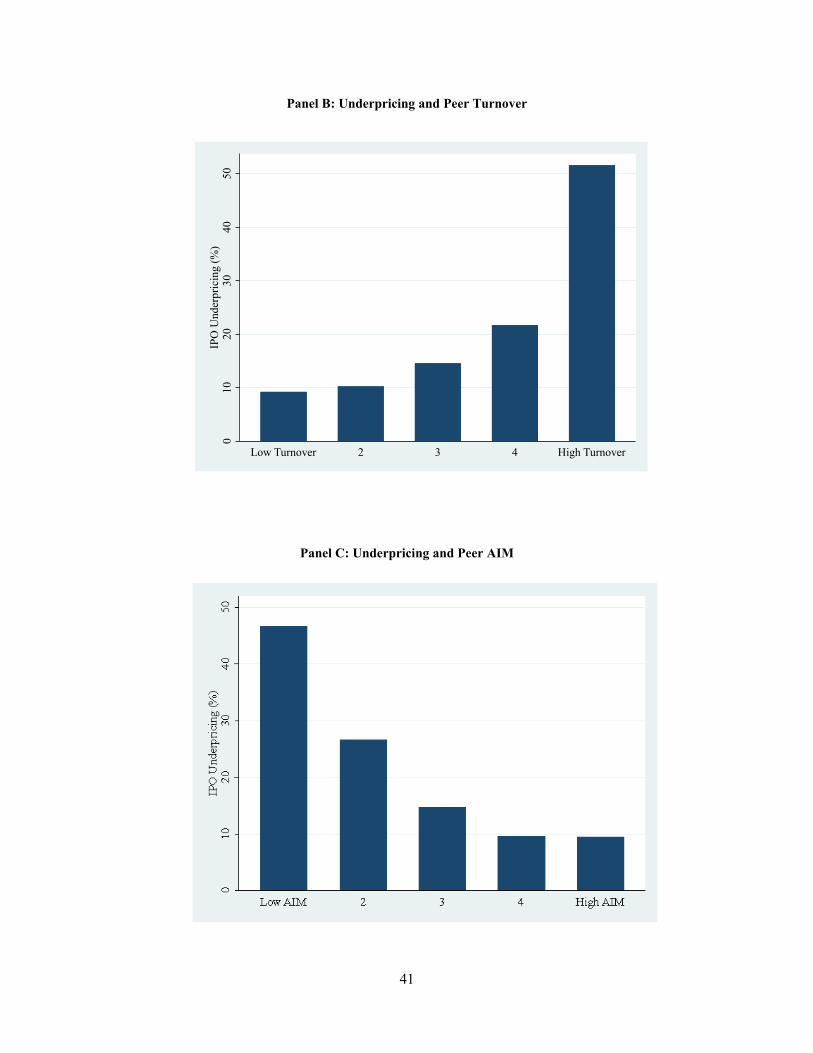
41
Panel B: Underpricing and Peer Turnover
Panel C: Underpricing and Peer AIM
01 0
2030
4050
I PO
Und
e rpr
icin
g (%
)
Low Turnover 2 3 4 High Turnover
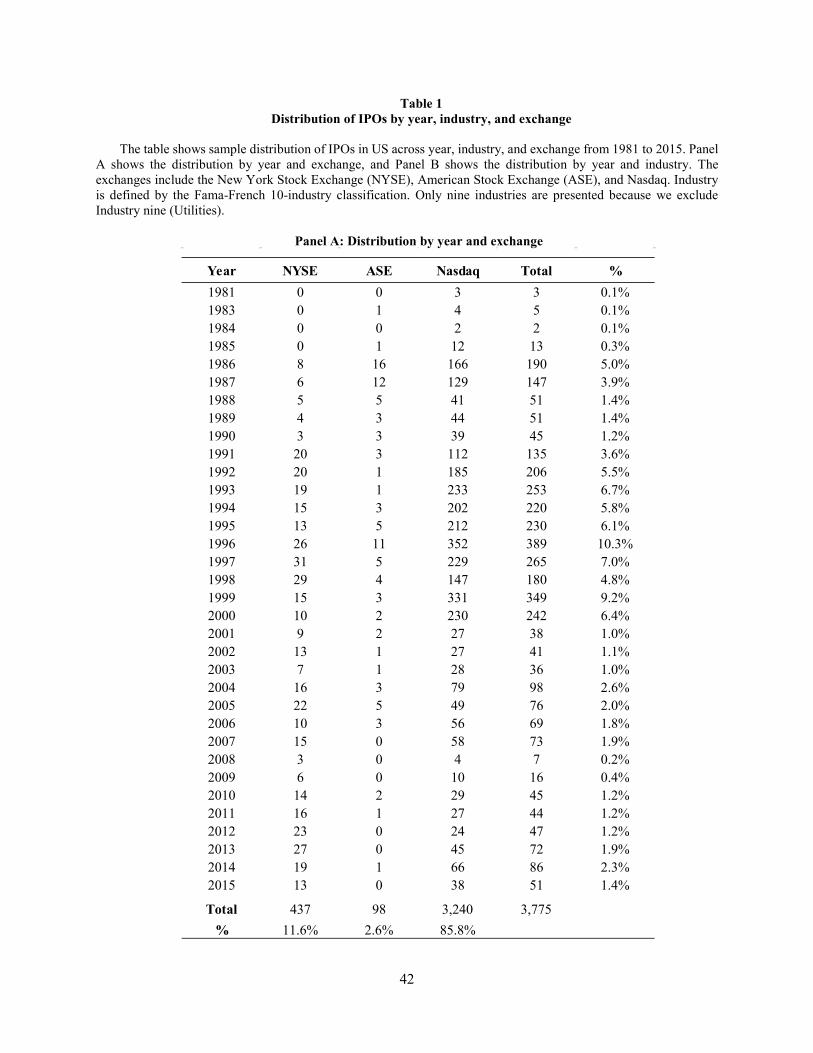
42
Table 1 Distribution of IPOs by year, industry, and exchange
The table shows sample distribution of IPOs in US across year, industry, and exchange from 1981 to 2015. Panel
A shows the distribution by year and exchange, and Panel B shows the distribution by year and industry. The exchanges include the New York Stock Exchange (NYSE), American Stock Exchange (ASE), and Nasdaq. Industry is defined by the Fama-French 10-industry classification. Only nine industries are presented because we exclude Industry nine (Utilities).
Panel A: Distribution by year and exchange
Year NYSE ASE Nasdaq Total %1981 0 0 3 3 0.1%1983 0 1 4 5 0.1%1984 0 0 2 2 0.1%1985 0 1 12 13 0.3%1986 8 16 166 190 5.0%1987 6 12 129 147 3.9%1988 5 5 41 51 1.4%1989 4 3 44 51 1.4%1990 3 3 39 45 1.2%1991 20 3 112 135 3.6%1992 20 1 185 206 5.5%1993 19 1 233 253 6.7%1994 15 3 202 220 5.8%1995 13 5 212 230 6.1%1996 26 11 352 389 10.3%1997 31 5 229 265 7.0%1998 29 4 147 180 4.8%1999 15 3 331 349 9.2%2000 10 2 230 242 6.4%2001 9 2 27 38 1.0%2002 13 1 27 41 1.1%2003 7 1 28 36 1.0%2004 16 3 79 98 2.6%2005 22 5 49 76 2.0%2006 10 3 56 69 1.8%2007 15 0 58 73 1.9%2008 3 0 4 7 0.2%2009 6 0 10 16 0.4%2010 14 2 29 45 1.2%2011 16 1 27 44 1.2%2012 23 0 24 47 1.2%2013 27 0 45 72 1.9%2014 19 1 66 86 2.3%2015 13 0 38 51 1.4%
Total 437 98 3,240 3,775% 11.6% 2.6% 85.8%

43
Panel B: Distribution by year and industry
Year Consumer Non-durables
Consumer Durables
Manu-facturing Energy Business
EquipmentTelecom-
municiatonsWholesale and Retail Healthcare Others Total %
1981 0 0 0 0 2 0 1 0 0 3 0.1%1983 0 1 1 0 0 0 1 0 2 5 0.1%1984 0 0 0 0 0 0 2 0 0 2 0.1%1985 3 0 1 0 4 0 4 1 0 13 0.3%1986 17 9 32 0 38 8 43 16 27 190 5.0%1987 13 1 26 2 32 5 26 16 26 147 3.9%1988 4 2 13 0 12 2 9 6 3 51 1.4%1989 2 0 6 2 15 1 6 8 11 51 1.4%1990 2 2 2 4 10 0 7 13 5 45 1.2%1991 9 5 10 2 38 3 24 38 6 135 3.6%1992 16 8 10 2 43 9 47 54 17 206 5.5%1993 18 12 41 9 56 14 42 27 34 253 6.7%1994 9 9 29 4 61 14 35 26 33 220 5.8%1995 9 3 20 2 98 11 22 36 29 230 6.1%1996 16 6 21 9 145 14 55 64 59 389 10.3%1997 17 4 25 4 100 5 33 40 37 265 7.0%1998 13 2 12 2 66 12 28 16 29 180 4.8%1999 8 3 5 1 212 35 23 11 51 349 9.2%2000 0 1 6 2 137 20 10 42 24 242 6.4%2001 1 0 4 1 13 0 3 11 5 38 1.0%2002 2 0 2 1 13 1 7 7 8 41 1.1%2003 0 1 2 1 12 2 4 7 7 36 1.0%2004 2 3 5 4 28 3 10 31 12 98 2.6%2005 5 2 7 5 21 4 8 18 6 76 2.0%2006 3 2 8 2 17 4 4 21 8 69 1.8%2007 1 1 7 6 22 2 4 21 9 73 1.9%2008 0 0 3 0 2 0 0 1 1 7 0.2%2009 1 0 0 0 3 0 4 4 4 16 0.4%2010 0 2 4 0 11 2 5 11 10 45 1.2%2011 0 0 2 3 17 0 7 11 4 44 1.2%2012 1 1 5 4 15 1 10 8 2 47 1.2%2013 1 1 5 2 21 0 6 27 9 72 1.9%2014 1 1 1 2 22 0 6 47 6 86 2.3%2015 2 0 1 0 8 0 5 33 2 51 1.4%
Total 176 82 316 76 1,294 172 501 672 486 3,775% 4.7% 2.2% 8.4% 2.0% 34.3% 4.6% 13.3% 17.8% 12.9%

44
Table 2 Summary statistics
The table provides summary statistics of variables. Panel A shows the distribution statistics, and Panel B presents
the correlation matrix. In Panel B, Pearson correlations are below diagonal and Spearman correlations are above diagonal. Variables construction is described in Appendix. We winsorize all variables at the 1st and 99th percentile levels.
Panel A: Distribution statistics
Panel B: Correlation matrix
N Mean Median Std. Dev. P25 P75
IPO Underpricing 3,775 21.5% 8.7% 38.8% 0.0% 25.4%
Peer Spread 3,658 3.50% 2.90% 3.00% 1.30% 4.90%
Peer Turnover 3,773 0.80% 0.70% 0.50% 0.40% 1.00%Peer AIM 3,773 1.83 1.47 1.60 0.36 2.89Top Underwriter 3,775 60.7% 1 48.8% 0 1
Integer Price 3,775 82.1% 1 38.3% 1 1
New Shares Ratio 3,775 32.2% 28.9% 17.0% 21.6% 38.0%
Sentiment 3,766 0.32 0.31 0.46 -0.06 0.63
Assets 3,775 183.65 29.70 577.74 11.00 90.10
Age 3,775 14.83 8.00 19.75 4.00 16.00
VC-backed 3,775 44.7% 0 49.7% 0 1
IPO Underpricing
Peer Spread
Peer Turnover
Peer AIM
Top Underwriter
Integer Price
New Shares Ratio
SentimentLog
(Assets)Log
(1+Age)VC-
backed
IPO Underpricing 1.00 -0.22 0.31 -0.32 0.12 0.13 -0.21 -0.09 -0.01 -0.14 0.15
Peer Spread -0.23 1.00 -0.60 0.89 -0.46 -0.18 0.41 0.40 -0.54 -0.08 -0.24
Peer Turnover 0.47 -0.53 1.00 -0.59 0.29 0.20 -0.39 -0.20 0.15 -0.12 0.34
Peer AIM -0.30 0.90 -0.55 1.00 -0.53 -0.18 0.48 0.25 -0.58 -0.06 -0.20
Top Underwriter 0.16 -0.47 0.27 -0.54 1.00 0.12 -0.28 -0.14 0.43 0.05 0.25
Integer Price 0.15 -0.15 0.20 -0.17 0.12 1.00 -0.10 -0.08 0.05 -0.04 0.12
New Shares Ratio -0.21 0.29 -0.32 0.33 -0.16 -0.08 1.00 0.06 -0.14 0.16 -0.25
Sentiment -0.09 0.28 -0.14 0.18 -0.12 -0.07 0.01 1.00 -0.16 -0.03 -0.11
Log(Assets) -0.01 -0.49 0.16 -0.55 0.44 0.05 0.01 -0.14 1.00 0.34 -0.10
Log(1+Age) -0.17 -0.08 -0.12 -0.07 0.08 -0.03 0.16 -0.04 0.40 1.00 -0.23
VC-backed 0.19 -0.25 0.32 -0.24 0.25 0.12 -0.24 -0.09 -0.12 -0.23 1.00
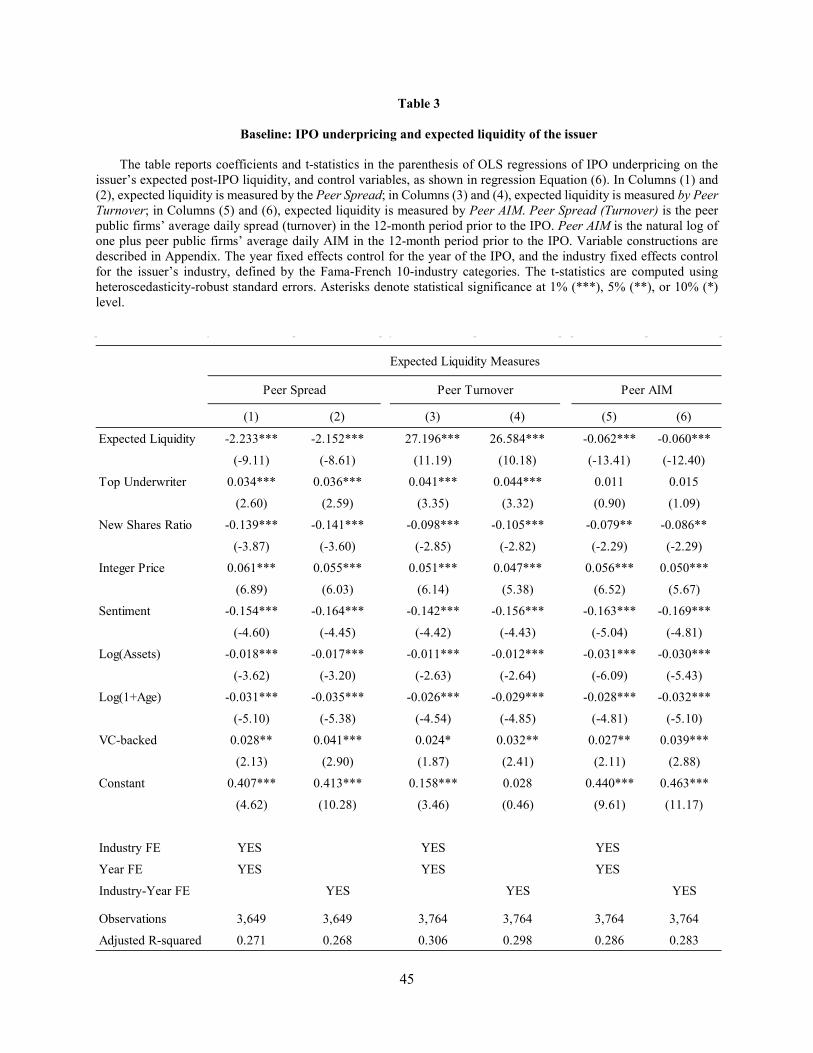
45
Table 3
Baseline: IPO underpricing and expected liquidity of the issuer
The table reports coefficients and t-statistics in the parenthesis of OLS regressions of IPO underpricing on the issuer’s expected post-IPO liquidity, and control variables, as shown in regression Equation (6). In Columns (1) and (2), expected liquidity is measured by the Peer Spread; in Columns (3) and (4), expected liquidity is measured by Peer Turnover; in Columns (5) and (6), expected liquidity is measured by Peer AIM. Peer Spread (Turnover) is the peer public firms’ average daily spread (turnover) in the 12-month period prior to the IPO. Peer AIM is the natural log of one plus peer public firms’ average daily AIM in the 12-month period prior to the IPO. Variable constructions are described in Appendix. The year fixed effects control for the year of the IPO, and the industry fixed effects control for the issuer’s industry, defined by the Fama-French 10-industry categories. The t-statistics are computed using heteroscedasticity-robust standard errors. Asterisks denote statistical significance at 1% (***), 5% (**), or 10% (*) level.
(1) (2) (3) (4) (5) (6)
Expected Liquidity -2.233*** -2.152*** 27.196*** 26.584*** -0.062*** -0.060***
(-9.11) (-8.61) (11.19) (10.18) (-13.41) (-12.40)
Top Underwriter 0.034*** 0.036*** 0.041*** 0.044*** 0.011 0.015
(2.60) (2.59) (3.35) (3.32) (0.90) (1.09)
New Shares Ratio -0.139*** -0.141*** -0.098*** -0.105*** -0.079** -0.086**
(-3.87) (-3.60) (-2.85) (-2.82) (-2.29) (-2.29)
Integer Price 0.061*** 0.055*** 0.051*** 0.047*** 0.056*** 0.050***
(6.89) (6.03) (6.14) (5.38) (6.52) (5.67)
Sentiment -0.154*** -0.164*** -0.142*** -0.156*** -0.163*** -0.169***
(-4.60) (-4.45) (-4.42) (-4.43) (-5.04) (-4.81)
Log(Assets) -0.018*** -0.017*** -0.011*** -0.012*** -0.031*** -0.030***
(-3.62) (-3.20) (-2.63) (-2.64) (-6.09) (-5.43)
Log(1+Age) -0.031*** -0.035*** -0.026*** -0.029*** -0.028*** -0.032***
(-5.10) (-5.38) (-4.54) (-4.85) (-4.81) (-5.10)
VC-backed 0.028** 0.041*** 0.024* 0.032** 0.027** 0.039***
(2.13) (2.90) (1.87) (2.41) (2.11) (2.88)
Constant 0.407*** 0.413*** 0.158*** 0.028 0.440*** 0.463***
(4.62) (10.28) (3.46) (0.46) (9.61) (11.17)
Industry FE YES YES YES
Year FE YES YES YES
Industry-Year FE YES YES YES
Observations 3,649 3,649 3,764 3,764 3,764 3,764
Adjusted R-squared 0.271 0.268 0.306 0.298 0.286 0.283
Peer AIM
Expected Liquidity Measures
Peer Spread Peer Turnover
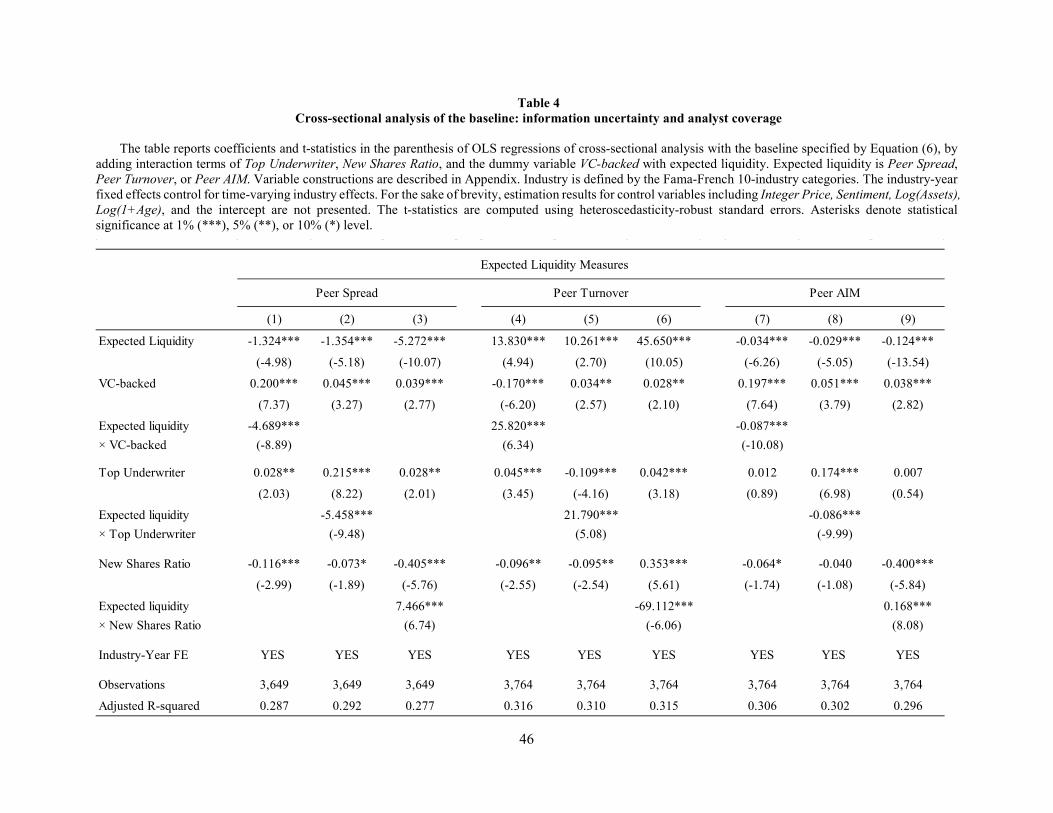
46
Table 4 Cross-sectional analysis of the baseline: information uncertainty and analyst coverage
The table reports coefficients and t-statistics in the parenthesis of OLS regressions of cross-sectional analysis with the baseline specified by Equation (6), by
adding interaction terms of Top Underwriter, New Shares Ratio, and the dummy variable VC-backed with expected liquidity. Expected liquidity is Peer Spread, Peer Turnover, or Peer AIM. Variable constructions are described in Appendix. Industry is defined by the Fama-French 10-industry categories. The industry-year fixed effects control for time-varying industry effects. For the sake of brevity, estimation results for control variables including Integer Price, Sentiment, Log(Assets), Log(1+Age), and the intercept are not presented. The t-statistics are computed using heteroscedasticity-robust standard errors. Asterisks denote statistical significance at 1% (***), 5% (**), or 10% (*) level.
(1) (2) (3) (4) (5) (6) (7) (8) (9)
Expected Liquidity -1.324*** -1.354*** -5.272*** 13.830*** 10.261*** 45.650*** -0.034*** -0.029*** -0.124***
(-4.98) (-5.18) (-10.07) (4.94) (2.70) (10.05) (-6.26) (-5.05) (-13.54)
VC-backed 0.200*** 0.045*** 0.039*** -0.170*** 0.034** 0.028** 0.197*** 0.051*** 0.038***
(7.37) (3.27) (2.77) (-6.20) (2.57) (2.10) (7.64) (3.79) (2.82)
Expected liquidity -4.689*** 25.820*** -0.087***× VC-backed (-8.89) (6.34) (-10.08)
Top Underwriter 0.028** 0.215*** 0.028** 0.045*** -0.109*** 0.042*** 0.012 0.174*** 0.007
(2.03) (8.22) (2.01) (3.45) (-4.16) (3.18) (0.89) (6.98) (0.54)
Expected liquidity -5.458*** 21.790*** -0.086***× Top Underwriter (-9.48) (5.08) (-9.99)
New Shares Ratio -0.116*** -0.073* -0.405*** -0.096** -0.095** 0.353*** -0.064* -0.040 -0.400***
(-2.99) (-1.89) (-5.76) (-2.55) (-2.54) (5.61) (-1.74) (-1.08) (-5.84)
Expected liquidity 7.466*** -69.112*** 0.168***× New Shares Ratio (6.74) (-6.06) (8.08)
Industry-Year FE YES YES YES YES YES YES YES YES YES
Observations 3,649 3,649 3,649 3,764 3,764 3,764 3,764 3,764 3,764
Adjusted R-squared 0.287 0.292 0.277 0.316 0.310 0.315 0.306 0.302 0.296
Expected Liquidity Measures
Peer Spread Peer Turnover Peer AIM
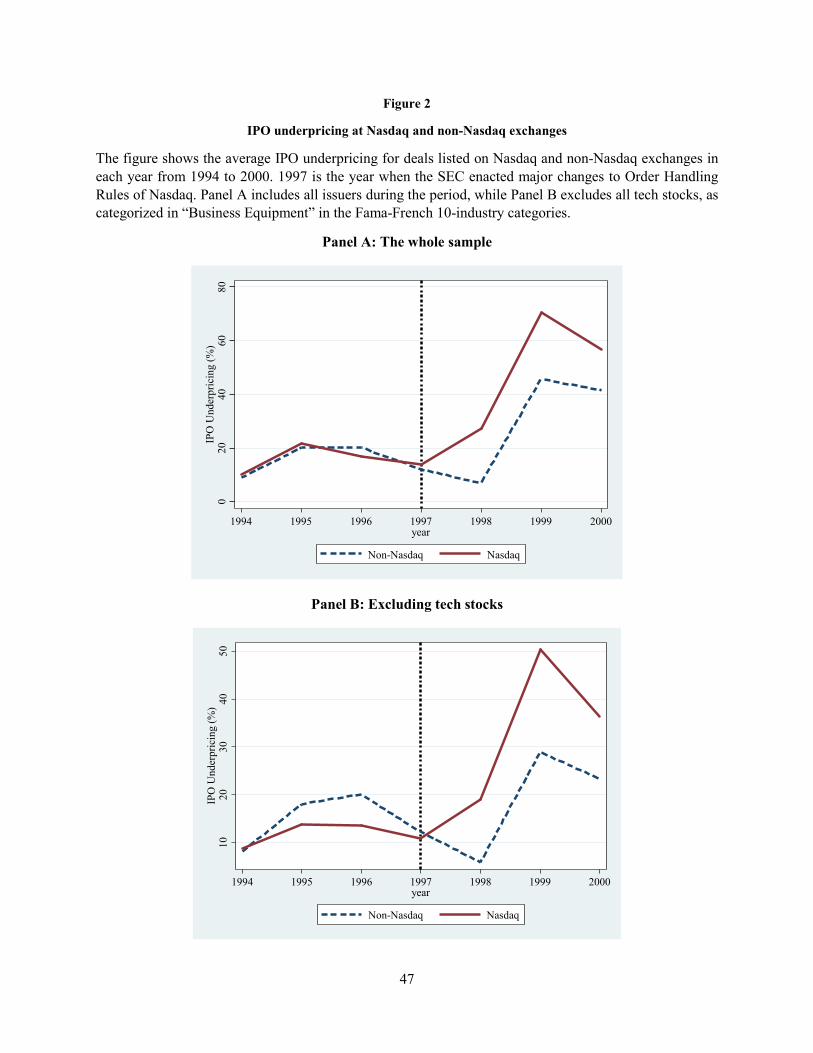
47
Figure 2
IPO underpricing at Nasdaq and non-Nasdaq exchanges
The figure shows the average IPO underpricing for deals listed on Nasdaq and non-Nasdaq exchanges in each year from 1994 to 2000. 1997 is the year when the SEC enacted major changes to Order Handling Rules of Nasdaq. Panel A includes all issuers during the period, while Panel B excludes all tech stocks, as categorized in “Business Equipment” in the Fama-French 10-industry categories.
Panel A: The whole sample
Panel B: Excluding tech stocks
020
4060
80IP
O U
nder
pric
ing
(%)
1994 1995 1996 1997 1998 1999 2000year
Non-Nasdaq Nasdaq
1020
3040
50IP
O U
nder
pric
ing
(%)
1994 1995 1996 1997 1998 1999 2000year
Non-Nasdaq Nasdaq
48
Table 5
IPO underpricing and changes to Order Handling Rules at Nasdaq in 1997
The table reports coefficients and t-statistics in the parenthesis of OLS regressions of IPO underpricing on Nasdaq versus non-Nasdaq exchanges after 1997, and control variables, as shown in regression Equation (8). The sample period spans 1994-2000 excluding the year of 1997, when changes of Order Handling Rules at Nasdaq were enacted. We run the regression in two periods: three years before and after the law passage (1994-2000), and two years before and after the law passage (1995-1999). In Columns (1) and (2), the regression is based on the full sample with all Nasdaq and non-Nasdaq IPOs. In Columns (3) and (4), the regression is based on a matched sample, where each Nasdaq IPO is matched with a non-Nasdaq IPO with the same industry (SIC two-digit code), similar size (market capitalization), and the same IPO year. Each year we select all IPO deals and divide them into five quintiles according to their market capitalization in the first year, and conduct size matching by choosing firms in the same quintile. If there are multiple matches, we select the one with the smallest size difference. Only Nasdaq deals with a matched control deal are included in the sample. One non-Nasdaq deal can be shared by multiple Nasdaq deals as a matched control, so one non-Nasdaq deal can appear several times in the data and is counted as separate observations. Nasdaq is a dummy variable if the issuer is listed at Nasdaq and zero otherwise. Post is a dummy variable that is equal to one if the issuer goes public after 1997 and zero otherwise. Variable constructions of control variables are described in Appendix. The industry fixed effects control for the issuer’s industry, defined by the Fama-French 10-industry categories. The t-statistics are computed using heteroscedasticity-robust standard errors. Asterisks denote statistical significance at 1% (***), 5% (**), or 10% (*) level.
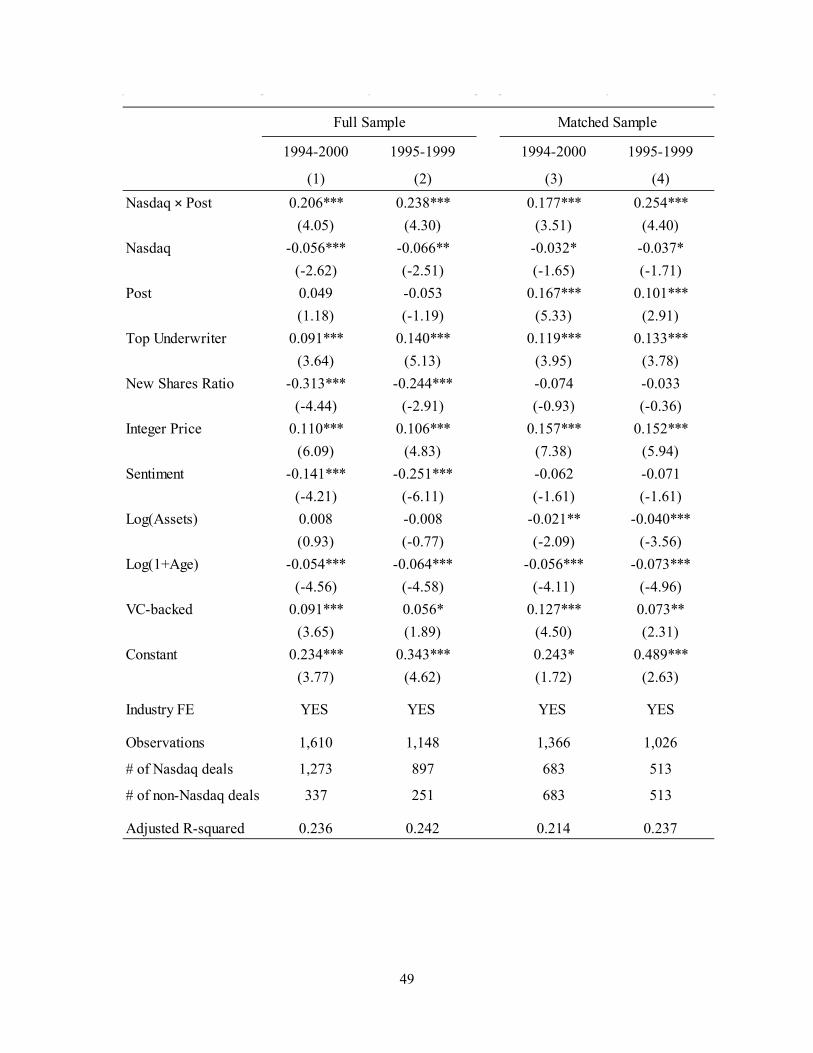
49
1994-2000 1995-1999 1994-2000 1995-1999
(1) (2) (3) (4)Nasdaq × Post 0.206*** 0.238*** 0.177*** 0.254***
(4.05) (4.30) (3.51) (4.40)Nasdaq -0.056*** -0.066** -0.032* -0.037*
(-2.62) (-2.51) (-1.65) (-1.71)Post 0.049 -0.053 0.167*** 0.101***
(1.18) (-1.19) (5.33) (2.91)Top Underwriter 0.091*** 0.140*** 0.119*** 0.133***
(3.64) (5.13) (3.95) (3.78)New Shares Ratio -0.313*** -0.244*** -0.074 -0.033
(-4.44) (-2.91) (-0.93) (-0.36)Integer Price 0.110*** 0.106*** 0.157*** 0.152***
(6.09) (4.83) (7.38) (5.94)Sentiment -0.141*** -0.251*** -0.062 -0.071
(-4.21) (-6.11) (-1.61) (-1.61)Log(Assets) 0.008 -0.008 -0.021** -0.040***
(0.93) (-0.77) (-2.09) (-3.56)Log(1+Age) -0.054*** -0.064*** -0.056*** -0.073***
(-4.56) (-4.58) (-4.11) (-4.96)VC-backed 0.091*** 0.056* 0.127*** 0.073**
(3.65) (1.89) (4.50) (2.31)Constant 0.234*** 0.343*** 0.243* 0.489***
(3.77) (4.62) (1.72) (2.63)
Industry FE YES YES YES YES
Observations 1,610 1,148 1,366 1,026
# of Nasdaq deals 1,273 897 683 513
# of non-Nasdaq deals 337 251 683 513
Adjusted R-squared 0.236 0.242 0.214 0.237
Full Sample Matched Sample

50
Table 6
Individual peer liquidity and changes to Order Handling Rules at Nasdaq in 1997
The table reports coefficients and t-statistics in the parenthesis of OLS regressions of individual peer liquidity on Nasdaq versus non-Nasdaq exchanges after 1997, and control variables, as shown in regression Equation (9). The sample period spans 1994-2000 excluding the year of 1997, when changes of Order Handling Rules at Nasdaq were enacted. We run the regression in two periods: three years before and after the law passage (1994-2000), and two years before and after he law passage (1995-1999). Nasdaq is a dummy variable if the issuer is listed at Nasdaq and zero otherwise. Post is a dummy variable that is equal to one if the issuer goes public after 1997 and zero otherwise. Individual peer spread and turnover are the monthly spread and turnover calculated as averages of daily data for each peer firm of the issuer. Peer firms are publicly traded companies with the same industry (SIC two-digit code), similar size (belonging to the same quintile when firms from the COMPUSTAT-CRSP universe are ranked by market capitalization), and listed on the same exchange as the issuer. Log (1+ Peer Age), Log (Sales), Log (Market cap), and Number of shareholders are annual characteristics of the peer firm. Market return is the value-weighted monthly market return (NYSE/AMEX/NASDAQ/ARCA) reported in CRSP. Variance of market returns is the variance of daily market returns in a given month. Sentiment is the monthly market sentiment downloaded from Prof. Jeff Wurgler’s website. Interest rate is the monthly 3-month T-bill rate downloaded from the Federal Reserve Bank’s website. Other variable constructions are described in Appendix. The industry fixed effects control for the issuer’s industry, defined by the Fama-French 10-industry categories. The t-statistics are computed using heteroskedasticity-robust standard errors. Asterisks denote statistical significance at 1% (***), 5% (**), or 10% (*) level.

51
1994-2000 1995-1999 1994-2000 1995-1999 1994-2000 1995-1999
(1) (2) (3) (4) (5) (6)Nasdaq × Post -0.033*** -0.029*** 0.001*** 0.001*** -0.237*** -0.190***
(-32.75) (-27.46) (5.92) (3.71) (-8.78) (-7.24)Nasdaq 0.003*** -0.001 0.003*** 0.004*** 0.182*** 0.130***
(2.60) (-1.10) (20.22) (19.24) (5.70) (3.93)Post 0.014*** 0.010*** 0.000 -0.000*** 0.114*** 0.077***
(15.70) (11.33) (0.43) (-3.28) (5.96) (4.10)Log(1+ Peer Age) 0.001*** 0.001*** -0.001*** -0.001*** 0.124*** 0.129***
(3.51) (4.20) (-15.29) (-16.52) (10.88) (10.56)Log(Sales) 0.000 0.001** -0.001*** -0.001*** 0.032*** 0.038***
(1.59) (2.07) (-12.24) (-10.27) (3.81) (4.06)Log(Market cap) -0.018*** -0.018*** 0.002*** 0.002*** -0.769*** -0.777***
(-55.15) (-49.91) (33.56) (28.70) (-72.74) (-67.07)
Number of shareholders 0.429*** 0.430*** -0.035*** -0.034*** 19.335*** 20.102***
(24.98) (23.16) (-7.88) (-7.13) (25.57) (25.04)Market return 0.014*** 0.018*** 0.006*** 0.004*** -0.033 0.325***
(15.52) (15.48) (23.35) (12.27) (-1.16) (9.00)
Lagged market return -0.004*** -0.002*** 0.003*** 0.004*** -0.576*** -0.307***
(-4.90) (-2.68) (9.88) (12.29) (-18.01) (-9.83)Variance of market returns 19.732*** 24.579*** 2.381*** -2.582*** 315.015*** 814.810***
(34.15) (24.86) (13.53) (-10.82) (18.00) (26.54)Sentiment 0.002*** 0.001 -0.001*** -0.002*** 0.101*** -0.009
(7.80) (1.51) (-8.97) (-15.00) (13.04) (-0.72)Interest rate -0.007 -0.103*** 0.038*** -0.047*** -2.421*** 5.706***
(-0.41) (-2.69) (10.38) (-5.91) (-4.61) (5.26)Constant 0.125*** 0.134*** -0.004*** 0.001** 4.857*** 4.447***
(53.42) (40.28) (-10.00) (1.97) (61.10) (44.52)
Industry FE YES YES YES YES YES YES
Observations 232,513 162,457 234,051 163,429 233,911 163,319Adjusted R-squared 0.508 0.503 0.217 0.203 0.621 0.619
Individual Peer Spread Individual Peer Turnover Individual Peer AIM
Dependent Variable

52
Table 7
Distribution of Private Equity Firms including VC firms across states, 1993-2000
The table reports the number and percentage of private equity firm, including VC firms, from each of the 50 states and the District of Columbia from 1993 to 2000. States (AK, ND) with zero private equity firms are not shown. This period covers three years before and after the passage of the National Securities Market Improvement Act (NSMIA), which is enacted in October 1996. The states are ranked from the largest to the smallest by the number of private equity firms incorporated in each state. Data source: Thomson Reuters Eikon.
Rank State Freq. Percent Rank State Freq. Percent
1 CA 727 25.14 26 AZ 14 0.482 NY 519 17.95 27 AL 13 0.453 MA 246 8.51 28 RI 11 0.384 TX 182 6.29 29 LA 10 0.355 IL 136 4.70 30 NH 9 0.316 CT 128 4.43 31 DE 7 0.247 PA 100 3.46 31 NV 7 0.248 NJ 77 2.66 33 KS 6 0.219 WA 60 2.07 33 SC 6 0.2110 MN 59 2.04 33 NM 6 0.2111 CO 54 1.87 33 ME 6 0.2112 GA 53 1.83 33 IA 6 0.2112 MD 53 1.83 38 OK 5 0.1714 FL 52 1.80 38 KY 5 0.1715 OH 49 1.69 40 AR 3 0.1016 NC 42 1.45 40 WY 3 0.1017 VA 40 1.38 40 MT 3 0.1018 DC 39 1.35 40 NE 3 0.1019 MI 29 1.00 40 VT 3 0.1020 TN 25 0.86 45 MS 2 0.0721 MO 23 0.80 45 WV 2 0.0722 IN 17 0.59 47 SD 1 0.0322 WI 17 0.59 47 HI 1 0.0324 OR 16 0.55 47 ID 1 0.0324 UT 16 0.55
Total 2,892 100

53
Table 8
IPO underpricing and the National Security Market Improvement Act in October 1996
The table reports coefficients and t-statistics in the parenthesis of OLS regressions of IPO underpricing on the passage of the National Security Market Improvement Act (NSMIA) in October 1996, as shown in regression Equation (10). The sample period spans 1993-2000 excluding the years of 1996 and 1997. We run the regression in two times periods: three years before and after the law passage (1993-2000) and two years before and after the law passage (1994-1999). The control sample includes issuers headquartered in states with abundant private equity capital, and the treatment sample includes issuers headquartered outside of those states. In Panel A, expected liquidity is measured by Peer Spread, in Panel B it is measured by Peer Turnover, and in Panel C it is measured by Peer AIM. The three panels have otherwise identical columns. In Columns (1) and (2), the control sample includes issuers headquartered in CA, NY, MA, TX, IL, CT, PA, and NJ. In Columns (3) and (4), the control sample includes issuers headquartered in CA, NY, MA, and TX. In Columns (5) and (6), the control sample includes issuers headquartered in CA and NY. Treated is a dummy variable that is equal to one if the issuer is in the treatment sample and zero if the issuer is in the control sample. Post is a dummy variable that is equal to one if the issuer goes public after 1997 and zero if the issuer goes public before 1996. Variable constructions of control variables are described in Appendix. The industry fixed effects control for the issuer’s industry, defined by the Fama-French 10-industry categories. The t-statistics are computed using heteroscedasticity-robust standard errors. Asterisks denote statistical significance at 1% (***), 5% (**), or 10% (*) level.

54
Panel A: Controlling for peer spread
1993-2000 1994-1999 1993-2000 1994-1999 1993-2000 1994-1999 (1) (2) (3) (4) (5) (6)Treated × Post -0.151*** -0.107* -0.178*** -0.134** -0.101** -0.124**
(-3.12) (-1.89) (-3.78) (-2.38) (-1.96) (-2.03)Treated 0.038** 0.025 0.041** 0.034 0.024 0.014
(2.05) (1.06) (2.15) (1.39) (1.07) (0.47)Post 0.191*** 0.103*** 0.222*** 0.129*** 0.201*** 0.142***
(6.66) (2.88) (6.74) (3.16) (4.91) (2.83)Peer Spread -3.459*** -3.847*** -3.491*** -3.862*** -3.523*** -3.923***
(-6.78) (-5.67) (-6.84) (-5.67) (-6.91) (-5.76)Top Underwriter 0.050* 0.113*** 0.049* 0.112*** 0.052* 0.114***
(1.69) (3.46) (1.65) (3.40) (1.78) (3.47)New Shares Ratio -0.230*** -0.197* -0.212*** -0.180* -0.219*** -0.180*
(-2.79) (-1.90) (-2.60) (-1.74) (-2.64) (-1.74)Integer Price 0.114*** 0.104*** 0.112*** 0.102*** 0.112*** 0.103***
(5.93) (4.40) (5.86) (4.39) (5.92) (4.43)Sentiment -0.117*** -0.226*** -0.119*** -0.226*** -0.117*** -0.226***
(-3.18) (-4.32) (-3.23) (-4.31) (-3.19) (-4.34)Log(Assets) -0.015 -0.030** -0.016 -0.030** -0.015 -0.030**
(-1.45) (-2.38) (-1.47) (-2.31) (-1.42) (-2.32)Log(1+Age) -0.054*** -0.064*** -0.055*** -0.066*** -0.055*** -0.064***
(-4.05) (-3.97) (-4.17) (-4.07) (-4.13) (-4.02)VC-backed 0.094*** 0.072** 0.093*** 0.071** 0.091*** 0.064*
(3.29) (2.04) (3.27) (2.03) (3.19) (1.85)Constant 0.474*** 0.527*** 0.472*** 0.519*** 0.479*** 0.527***
(6.31) (5.38) (6.34) (5.31) (6.30) (5.34)
Industry FE YES YES YES YES YES YES
Observations 1,343 889 1,343 889 1,343 889Adjusted R-squared 0.256 0.276 0.260 0.278 0.253 0.279
CA, NY, MA, TX, IL, CT, PA, NJ CA, NY, MA, TX CA, NYControl Sample
55
Panel B: Controlling for peer turnover
1993-2000 1994-1999 1993-2000 1994-1999 1993-2000 1994-1999 (1) (2) (3) (4) (5) (6)Treated × Post -0.121*** -0.071 -0.149*** -0.104* -0.078 -0.099*
(-2.64) (-1.32) (-3.32) (-1.93) (-1.61) (-1.73)Treated 0.035** 0.024 0.036** 0.026 0.024 0.017
(2.01) (1.09) (2.00) (1.13) (1.14) (0.62)Post 0.055* 0.031 0.084** 0.056 0.061 0.069
(1.80) (0.89) (2.46) (1.41) (1.47) (1.44)Peer Turnover 44.903*** 45.022*** 44.794*** 44.947*** 45.231*** 44.975***
(9.82) (7.63) (9.87) (7.66) (9.90) (7.66)Top Underwriter 0.077*** 0.125*** 0.077*** 0.122*** 0.080*** 0.125***
(2.78) (3.92) (2.72) (3.82) (2.88) (3.91)New Shares Ratio -0.090 -0.092 -0.076 -0.080 -0.082 -0.082
(-1.10) (-0.90) (-0.94) (-0.79) (-0.99) (-0.80)Integer Price 0.079*** 0.069*** 0.077*** 0.068*** 0.077*** 0.068***
(4.25) (3.07) (4.18) (3.07) (4.19) (3.09)Sentiment -0.155*** -0.154*** -0.156*** -0.152*** -0.155*** -0.153***
(-4.41) (-3.02) (-4.47) (-2.99) (-4.43) (-3.03)Log(Assets) -0.011 -0.018* -0.011 -0.017 -0.010 -0.017
(-1.17) (-1.70) (-1.17) (-1.61) (-1.12) (-1.60)Log(1+Age) -0.028** -0.035** -0.029** -0.036** -0.028** -0.035**
(-2.25) (-2.30) (-2.35) (-2.39) (-2.31) (-2.33)VC-backed 0.032 0.013 0.031 0.012 0.029 0.007
(1.11) (0.37) (1.09) (0.35) (1.02) (0.21)Constant 0.028 0.025 0.025 0.018 0.026 0.017
(0.41) (0.27) (0.37) (0.20) (0.38) (0.18)
Industry FE YES YES YES YES YES YES
Observations 1,343 889 1,343 889 1,343 889Adjusted R-squared 0.327 0.345 0.330 0.347 0.325 0.348
CA, NY, MA, TX, IL, CT, PA, NJ CA, NY, MA, TX CA, NYControl Sample
56
Panel C: Controlling for peer AIM
1993-2000 1994-1999 1993-2000 1994-1999 1993-2000 1994-1999 (1) (2) (3) (4) (5) (6)Treated × Post -0.146*** -0.100* -0.172*** -0.126** -0.102** -0.124**
(-3.06) (-1.77) (-3.68) (-2.25) (-2.02) (-2.06)Treated 0.037** 0.020 0.039** 0.028 0.027 0.015
(1.99) (0.87) (2.04) (1.16) (1.21) (0.53)Post 0.166*** 0.074** 0.196*** 0.099** 0.179*** 0.116**
(5.77) (2.05) (5.93) (2.41) (4.38) (2.32)Peer AIM -0.090*** -0.101*** -0.091*** -0.100*** -0.092*** -0.102***
(-9.32) (-8.06) (-9.35) (-8.05) (-9.50) (-8.19)Top Underwriter 0.021 0.080** 0.020 0.079** 0.023 0.081**
(0.71) (2.45) (0.69) (2.41) (0.79) (2.47)New Shares Ratio -0.164** -0.132 -0.148* -0.116 -0.152* -0.115
(-2.01) (-1.29) (-1.83) (-1.15) (-1.86) (-1.14)Integer Price 0.110*** 0.102*** 0.108*** 0.101*** 0.109*** 0.102***
(5.72) (4.31) (5.64) (4.31) (5.70) (4.35)Sentiment -0.116*** -0.219*** -0.118*** -0.219*** -0.116*** -0.219***
(-3.19) (-4.26) (-3.25) (-4.25) (-3.20) (-4.28)Log(Assets) -0.027** -0.043*** -0.027** -0.042*** -0.027** -0.042***
(-2.47) (-3.29) (-2.47) (-3.21) (-2.46) (-3.24)Log(1+Age) -0.050*** -0.060*** -0.052*** -0.062*** -0.051*** -0.061***
(-3.83) (-3.80) (-3.95) (-3.91) (-3.91) (-3.86)VC-backed 0.092*** 0.068* 0.091*** 0.068* 0.089*** 0.061*
(3.25) (1.96) (3.23) (1.96) (3.14) (1.77)Constant 0.546*** 0.613*** 0.543*** 0.605*** 0.549*** 0.609***
(7.33) (6.34) (7.35) (6.28) (7.29) (6.28)
Industry FE YES YES YES YES YES YES
Observations 1,343 889 1,343 889 1,343 889Adjusted R-squared 0.268 0.292 0.272 0.294 0.266 0.295
CA, NY, MA, TX, IL, CT, PA, NJ CA, NY, MA, TX CA, NYControl Sample
57
Table 9
IPO underpricing and the National Security Market Improvement Act in October 1996
The table reports coefficients and t-statistics in the parenthesis of OLS regressions of IPO underpricing on the
passage of the National Security Market Improvement Act (NSMIA) in October 1996, as shown in regression Equation (11). The sample period spans 1993-2000 excluding the years of 1996 and 1997. In Panel A, expected liquidity is measured by Peer Spread, in Panel B it is measured by Peer Turnover, and in Panel C it is measured by Peer AIM. The three panels have otherwise identical columns. We run the regression in two times periods: in Column (1) and (2), the sample is from three years before and after the law passage (1993-2000); and in Column (3) and (4), the sample is from two years before and after the law passage (1994-1999). We interact the rank (Rank) or the percentage (Percentage) of PE firms of each state shown in Table 7 with the dummy variable Post, which is equal to one if the issuer goes public after 1997, and zero otherwise. Variable constructions of control variables are described in Appendix. The industry fixed effects control for the issuer’s industry, defined by the Fama-French 10-industry categories. The t-statistics are computed using heteroscedasticity-robust standard errors. Asterisks denote statistical significance at 1% (***), 5% (**), or 10% (*) level.

58
Panel A: Controlling for peer spread
(1) (2) (3) (4)Rank × Post -0.009*** -0.006*
(-3.21) (-1.95)Rank 0.002*** 0.002*
(2.68) (1.67)Percentage × Post 0.007*** 0.006**
(2.76) (2.17)Percentage -0.002 -0.001
(-1.56) (-0.65)Post 0.206*** 0.066** 0.114*** -0.005
(6.53) (2.10) (2.92) (-0.12)Peer Spread -3.515*** -3.520*** -3.892*** -3.923***
(-6.88) (-6.90) (-5.74) (-5.75)Top Underwriter 0.051* 0.051* 0.114*** 0.112***
(1.73) (1.74) (3.50) (3.43)New Shares Ratio -0.223*** -0.212** -0.192* -0.177*
(-2.71) (-2.58) (-1.85) (-1.71)Integer Price 0.114*** 0.112*** 0.104*** 0.102***
(5.96) (5.89) (4.45) (4.37)Sentiment -0.119*** -0.120*** -0.227*** -0.226***
(-3.24) (-3.25) (-4.33) (-4.33)Log(Assets) -0.016 -0.015 -0.031** -0.029**
(-1.51) (-1.41) (-2.42) (-2.31)Log(1+Age) -0.053*** -0.055*** -0.063*** -0.064***
(-3.98) (-4.13) (-3.95) (-4.03)VC-backed 0.094*** 0.090*** 0.072** 0.064*
(3.28) (3.17) (2.04) (1.85)Constant 0.467*** 0.510*** 0.518*** 0.548***
(6.23) (6.81) (5.22) (5.60)
Industry FE YES YES YES YES
Observations 1,343 1,343 889 889Adjusted R-squared 0.256 0.256 0.276 0.279
1993-2000 1994-1999
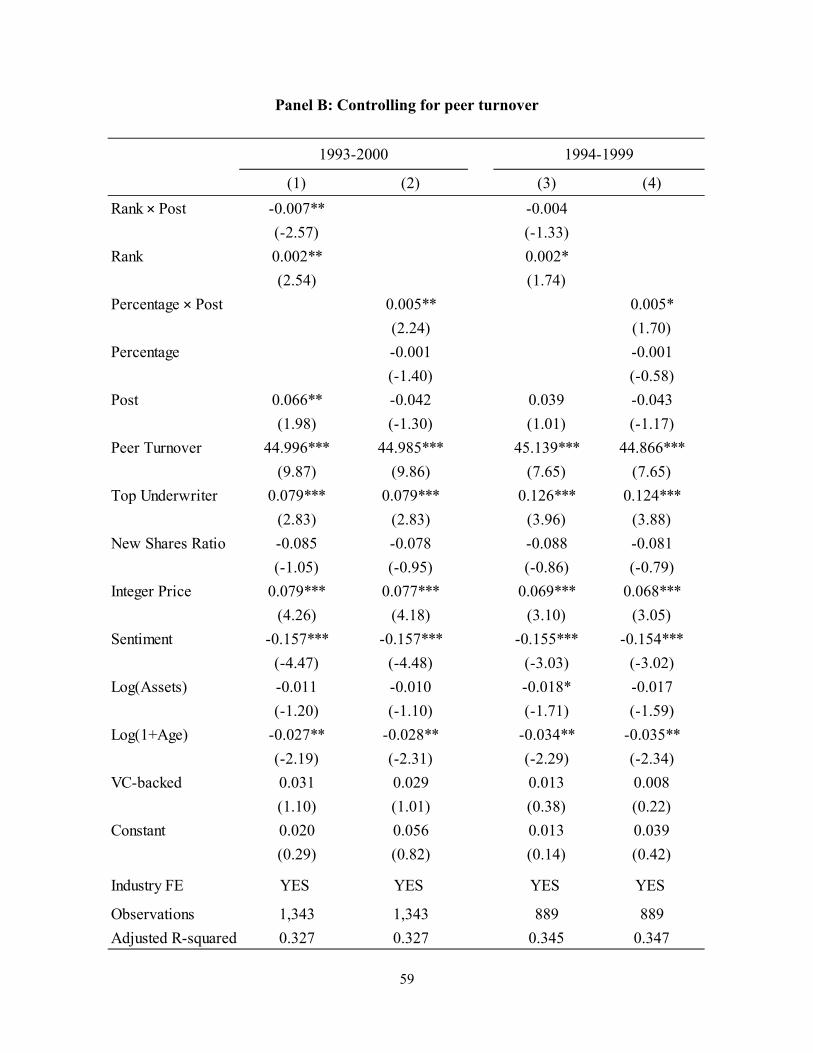
59
Panel B: Controlling for peer turnover
(1) (2) (3) (4)Rank × Post -0.007** -0.004
(-2.57) (-1.33)Rank 0.002** 0.002*
(2.54) (1.74)Percentage × Post 0.005** 0.005*
(2.24) (1.70)Percentage -0.001 -0.001
(-1.40) (-0.58)Post 0.066** -0.042 0.039 -0.043
(1.98) (-1.30) (1.01) (-1.17)Peer Turnover 44.996*** 44.985*** 45.139*** 44.866***
(9.87) (9.86) (7.65) (7.65)Top Underwriter 0.079*** 0.079*** 0.126*** 0.124***
(2.83) (2.83) (3.96) (3.88)New Shares Ratio -0.085 -0.078 -0.088 -0.081
(-1.05) (-0.95) (-0.86) (-0.79)Integer Price 0.079*** 0.077*** 0.069*** 0.068***
(4.26) (4.18) (3.10) (3.05)Sentiment -0.157*** -0.157*** -0.155*** -0.154***
(-4.47) (-4.48) (-3.03) (-3.02)Log(Assets) -0.011 -0.010 -0.018* -0.017
(-1.20) (-1.10) (-1.71) (-1.59)Log(1+Age) -0.027** -0.028** -0.034** -0.035**
(-2.19) (-2.31) (-2.29) (-2.34)VC-backed 0.031 0.029 0.013 0.008
(1.10) (1.01) (0.38) (0.22)Constant 0.020 0.056 0.013 0.039
(0.29) (0.82) (0.14) (0.42)
Industry FE YES YES YES YES
Observations 1,343 1,343 889 889Adjusted R-squared 0.327 0.327 0.345 0.347
1993-2000 1994-1999
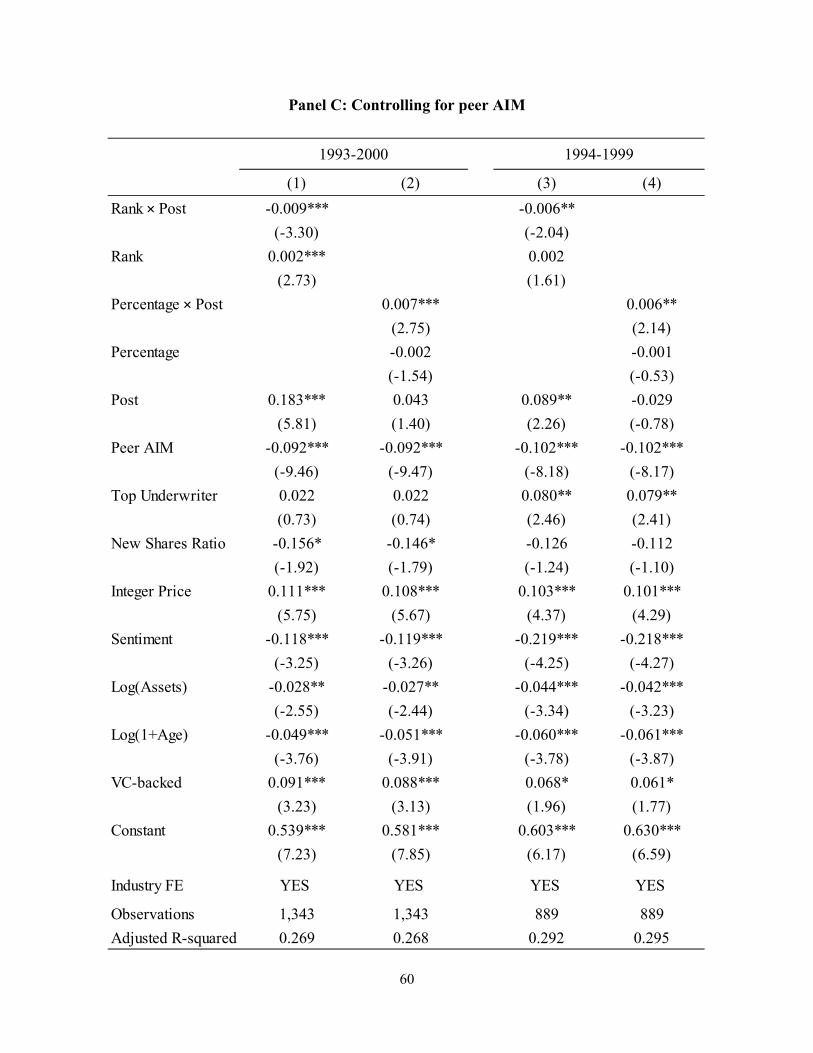
60
Panel C: Controlling for peer AIM
(1) (2) (3) (4)Rank × Post -0.009*** -0.006**
(-3.30) (-2.04)Rank 0.002*** 0.002
(2.73) (1.61)Percentage × Post 0.007*** 0.006**
(2.75) (2.14)Percentage -0.002 -0.001
(-1.54) (-0.53)Post 0.183*** 0.043 0.089** -0.029
(5.81) (1.40) (2.26) (-0.78)Peer AIM -0.092*** -0.092*** -0.102*** -0.102***
(-9.46) (-9.47) (-8.18) (-8.17)Top Underwriter 0.022 0.022 0.080** 0.079**
(0.73) (0.74) (2.46) (2.41)New Shares Ratio -0.156* -0.146* -0.126 -0.112
(-1.92) (-1.79) (-1.24) (-1.10)Integer Price 0.111*** 0.108*** 0.103*** 0.101***
(5.75) (5.67) (4.37) (4.29)Sentiment -0.118*** -0.119*** -0.219*** -0.218***
(-3.25) (-3.26) (-4.25) (-4.27)Log(Assets) -0.028** -0.027** -0.044*** -0.042***
(-2.55) (-2.44) (-3.34) (-3.23)Log(1+Age) -0.049*** -0.051*** -0.060*** -0.061***
(-3.76) (-3.91) (-3.78) (-3.87)VC-backed 0.091*** 0.088*** 0.068* 0.061*
(3.23) (3.13) (1.96) (1.77)Constant 0.539*** 0.581*** 0.603*** 0.630***
(7.23) (7.85) (6.17) (6.59)
Industry FE YES YES YES YES
Observations 1,343 1,343 889 889Adjusted R-squared 0.269 0.268 0.292 0.295
1993-2000 1994-1999