liquids the particles that make up liquids are in constant motion too. liquid particles are free to...
TRANSCRIPT

LiquidsLiquids• The particles that
make up liquids are in constant motion too.
• Liquid particles are free to slide past one another. This allows liquids, as well as gases, to “flow.”
Liquids and the Kinetic-Liquids and the Kinetic-Molecular TheoryMolecular Theory
A liquid can be described as a form of matter that has a definite volume and takes the shape of its container.
The attractive forces between particles in a liquid are more effective than those between particles in a gas.
This attraction between liquid particles is caused by the intermolecular forces:
dipole-dipole forces(hydrogen bonding)dipole-dipole forces(hydrogen bonding)London dispersion forcesLondon dispersion forces
Induced DipoleInduced Dipole

LiquidsLiquids
• But, the particles in liquids are close enough to be attracted to each other.
• These attractive forces are intermolecular forces.
• The particles are in motion, BUT their average kinetic energy isn’t high enough to allow the particles to break away from the liquid and become gas particles.
Hydrogen bonds
Surface Tension

LiquidsLiquids
However, liquid particles can escape from the surface of the liquid and become a gas.
You can heat a liquid and boil it and convert it from a liquid to a gas.
When a liquid converts to a gas, and it is not boiling, we call that process evaporation.
LiquidsLiquidsBoth evaporation and boiling are actually “coolingcooling” processes. -- Because the particles with the highest energy tend to escape into the
gas phase first, the particles which are left behind have a lower energy.– Because those particles have lower energy (the ones
who were left behind), the average temperature decreases.
• The particles are the surface of a liquid are constantly breaking away to form a gas above the surface of the liquid.

LiquidsLiquidsThose particles form a gas
above the surface of the liquid. Since that gas a “pressure” on the surface of the liquid, we call that the “vapor pressure” of the liquid.
At the same time as the gas particles are forming, some of the gas particles condense to reform a liquid.
We call the process is which a gas
becomes a liquid “condensation,” which
is essentially the opposite of evaporation.

LiquidsLiquids• Over time, the number of particles escaping the liquid to
become a gas = the number of gas particles condensing to become a liquid.
When this happens, we say we have reached a state of equilibrium, where rate of evaporation = rate of condensation
Boiling point is defined as the point at
which the vapor pressure of the liquid
equals the atmospheric pressure.
Because of this, The boiling point of a
substance can change as the
atmospheric pressure goes down.
Boiling LakeBoiling Lake in the Dominican in the Dominican Republic Republic

The Other State of MatterThe Other State of Matter

SolidsSolids
• The particles in solids are still in constant The particles in solids are still in constant motion, but they don’t have as much motion, but they don’t have as much freedom to move, as they do in liquids or freedom to move, as they do in liquids or gases.gases.
• Therefore they tend to vibrate in place as Therefore they tend to vibrate in place as opposed to sliding or moving from place to opposed to sliding or moving from place to place.place.

TRV POLKATRV POLKA
GASESGASES
LIQUIDSLIQUIDS
SOLIDSSOLIDS

Solids Solids
• As you heat a solid, the particles begin to vibrate more rapidly as the kinetic energy increases.
• The organization of the particles within the solid begins to break down. The solid eventually melts and becomes a liquid.
• The melting point is the temperature at which the forces holding the solid together are overcome by the kinetic energy of the vibrating particles.

SolidsSolids
• When a liquid turns back into a solid, we call this process freezing.
• Most solids are crystalline in nature and we call them crystals.
• Look at page 339 for a discussion of various crystal structures. I will not ask about crystal structures on the test, however, for those who are curious, take a look.

SolidsSolids• Some solids can exist in more
than one form. We call these different forms of the same
element allotropesallotropes.
• Carbon is an example:Diamond, Graphite, Buckyballs

Amorphous SolidsAmorphous Solids• Solids which do not exist in crystalline form are called“amorphous” solids, because they lack an ordered internal structure. Rubber, plastic and Rubber, plastic and asphalt asphalt are all examples of amorphous solids.• GlassGlass is another example of an amorphous solid. Glasses are sometimes called “supercooled” supercooled” liquidsliquids.

Section 4 Phase ChangesSection 4 Phase Changes

Changes of Phase Changes of Phase and Equilibriumand Equilibrium
A phasephase is any part of a system that has uniform composition and properties. (Solid,Liquid or Vapor)
A Phase change Phase change occurs when the dynamic equilibrium of a system is stressed and modified.
EquilibriumEquilibrium is a dynamic condition in which two opposing changes occur at equal rates in a closed system.

EquilibriumEquilibrium
hc610_04_v03mn.htm

Possible Changes of State

Phase DiagramsPhase DiagramsThe relationships among The relationships among
the solid, liquid and vapor the solid, liquid and vapor states is defined by the states is defined by the heat absorbed or released heat absorbed or released by the substance . All by the substance . All three Phases can be three Phases can be represented in represented in
a graph called a “phase a graph called a “phase diagram.”diagram.”

Phase DiagramsPhase DiagramsPressure vs.TemperaturePressure vs.Temperature

Phase DiagramsPhase Diagrams
• Each region represents a phase. The lines represent the conditions at which those two phases are in equilibrium.
• The graph has temperature on the independent (x) axis and pressure on the dependent (y)axis.
The Curve represents all the points all the points in which a phase change can occur.

There is a phase
diagram for every
pure substance.
When you cross a line in the graph you are going through a phase change!
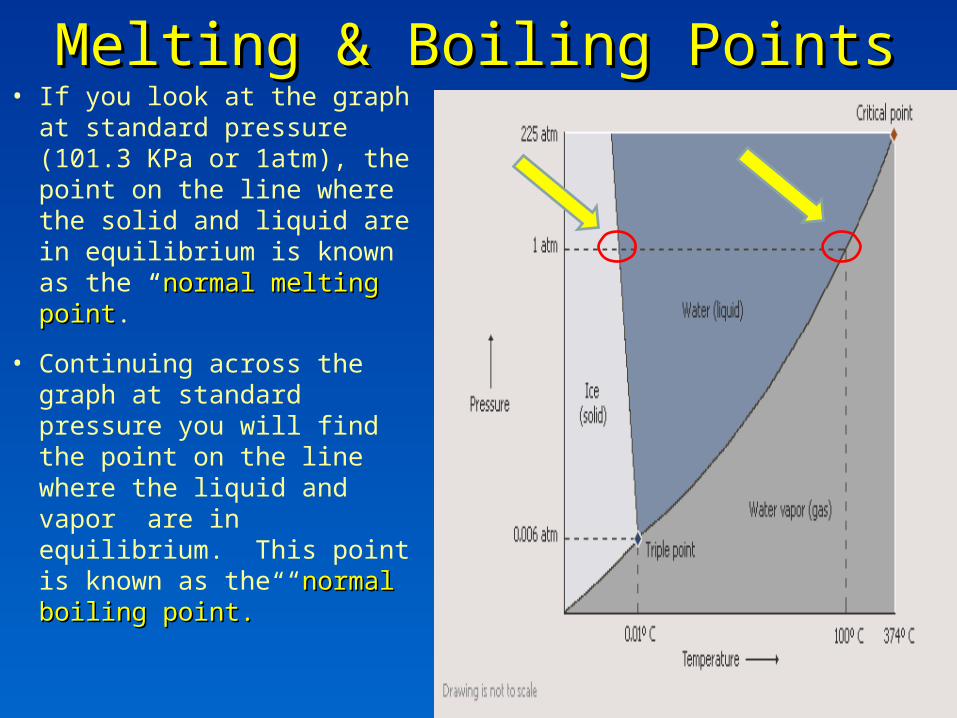
Melting & Boiling PointsMelting & Boiling Points• If you look at the graph at
standard pressure (101.3 KPa or 1atm), the point on the line where the solid and liquid are in equilibrium is known as the “normal normal melting pointmelting point.”
• Continuing across the graph at standard pressure you will find the point on the line where the liquid and vapor are in equilibrium. This point is known as the “normal boiling point.normal boiling point.”

Phase DiagramsPhase Diagrams• At the top right of the
diagram you see something known as the critical pointcritical point, which for water is 225 atm and 374K.
• Do some research and discover the definition of the critical pointcritical point. (Pg 347)
While you are at it define critical temperaturecritical temperature.

Triple PointTriple PointA unique feature of a
phase diagram and matter is the “triple triple pointpoint,” This point is the temperature and pressure at which all three phases of matter are present and in equilibrium.