lisa mcghee date: june 20, 2016 operations manager san ... · pdf file1 lisa mcghee date: june...
TRANSCRIPT
1
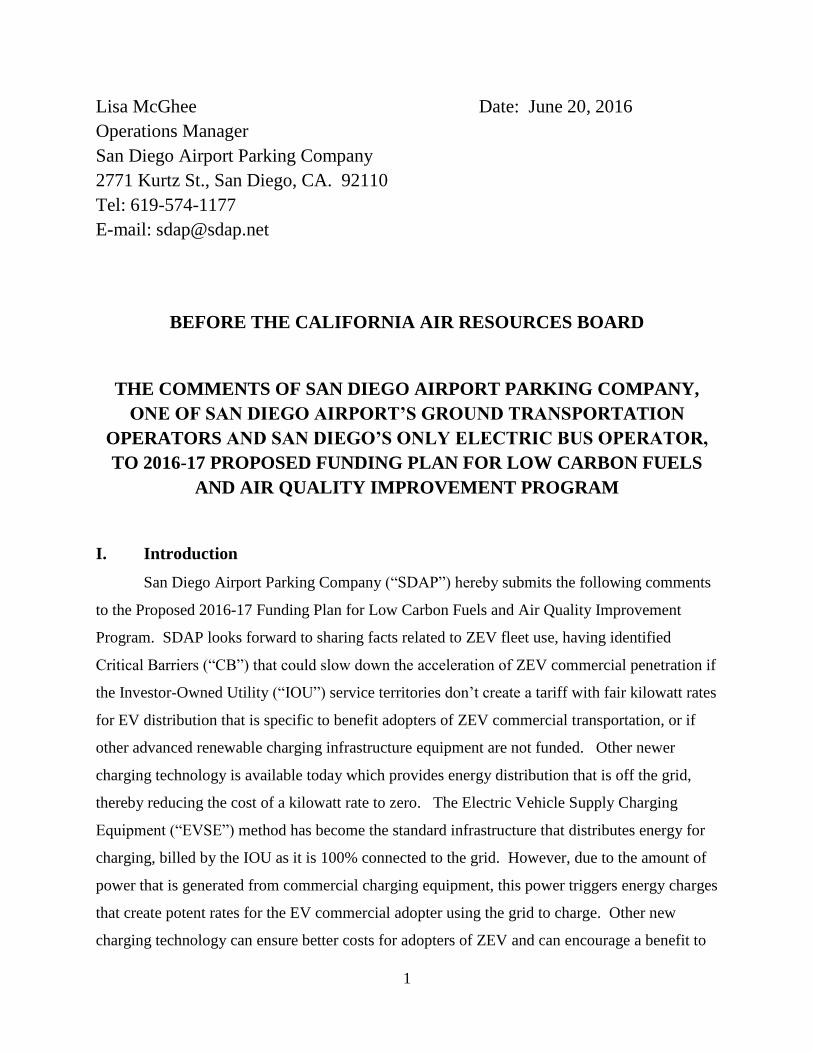
Lisa McGhee Date: June 20, 2016
Operations Manager
San Diego Airport Parking Company
2771 Kurtz St., San Diego, CA. 92110
Tel: 619-574-1177
E-mail: [email protected]
BEFORE THE CALIFORNIA AIR RESOURCES BOARD
THE COMMENTS OF SAN DIEGO AIRPORT PARKING COMPANY,
ONE OF SAN DIEGO AIRPORT’S GROUND TRANSPORTATION
OPERATORS AND SAN DIEGO’S ONLY ELECTRIC BUS OPERATOR,
TO 2016-17 PROPOSED FUNDING PLAN FOR LOW CARBON FUELS
AND AIR QUALITY IMPROVEMENT PROGRAM
I. Introduction
San Diego Airport Parking Company (“SDAP”) hereby submits the following comments
to the Proposed 2016-17 Funding Plan for Low Carbon Fuels and Air Quality Improvement
Program. SDAP looks forward to sharing facts related to ZEV fleet use, having identified
Critical Barriers (“CB”) that could slow down the acceleration of ZEV commercial penetration if
the Investor-Owned Utility (“IOU”) service territories don’t create a tariff with fair kilowatt rates
for EV distribution that is specific to benefit adopters of ZEV commercial transportation, or if
other advanced renewable charging infrastructure equipment are not funded. Other newer
charging technology is available today which provides energy distribution that is off the grid,
thereby reducing the cost of a kilowatt rate to zero. The Electric Vehicle Supply Charging
Equipment (“EVSE”) method has become the standard infrastructure that distributes energy for
charging, billed by the IOU as it is 100% connected to the grid. However, due to the amount of
power that is generated from commercial charging equipment, this power triggers energy charges
that create potent rates for the EV commercial adopter using the grid to charge. Other new
charging technology can ensure better costs for adopters of ZEV and can encourage a benefit to

2
both the adopter while helping meet the climate goals. As discussed in the recent Commission
hearings and workshops there are issues regarding ZEV Commercial Electrification
Transportation that have been raised, and with which all parties need to be familiar. The
practicality of the success of EV fleets, focusing specifically on the amount of vehicles miles
traveled (“VMT”) per day in commercial use, proves that there is carbon value in proactively
planning how EV commercial drivers can have a fair cost per mile benefit for EV rates. The EV
transportation network is already broadly established: EV vehicles in each class type are
provided various levels of EV charging equipment with different draws of power, infrastructure
that is grid tied or off the grid technology, significant amount of funding for EV vehicle
purchases, and distributed standards in connections of charging. Clearly, this is a technology
that already has provisional networking which supports adoption and promotes outreach. It is
therefore clear that ZEV commercial electrification can be successfully accelerated, helping meet
the climate goals. Moreover, when Heavy Duty over Light Duty is adopted, it is far more
impacting as it expedites a higher carbon score. For this reason, mitigating the barriers for
commercial use should be a priority. SDAP will address the following ZEV commercial barrier
topics and remedies, discussing these topics in greater detail below under Comments:
The amount of commercial Vehicle Miles Traveled (“VMT”) per shift or per day
is not effectively supported by the EV range of miles.
The Time it takes to Charge is a barrier. Differing charging methods and battery
sizes affect the time is will take to charge; therefore, examining different
infrastructure in commercial charging is needed to be able to identify the best
solution for your business.
Understanding the battery draw capacity of the Charging Equipment Technology
is unique when compared to light duty use, and depending on the installation and
equipment capacity, the solution may be different when considering short haul vs
long haul; however, the more power, the more load, the quicker the fill time,
which impacts the grid and has other effects on billing rates
What is the best source of Energy Distribution for your charging method: Should
it all be generated from EVSE, which is 100% grid tied, or from other new
technology and resources that are off the grid, or should it be mixed?

3
• In EV commercial transportation, you can’t compromise the need to charge
multiple times a day or multiple vehicles at the same time. Our normal use
creates the need to plug in during peak time or to plug in more than one bus at a
time, generating the element of peak Load Use or maximum load use. EV
charging is a complex part of the infrastructure due to the power output, and
plugging in as needed should not be a barrier.
• When specifically tied to the grid with the Utility, Demand Kilowatt Rates can’t
be avoided in commercial EVSE, the importance of which needs to be understood
as the Demand Rate is not a fair rate, creating a barrier which results in more cost
per mile than conventional fuel.
• Renewable Charging Equipment reduces the rate of a kilowatt after installing,
plus it has the highest carbon credit score, and when integrated delivers a more
sustainable grid. But there is no funding available for infrastructure that is
Renewable. Along with the identified Renewable charging equipment remedy,
there is an opportunity to give back to the grid via Vehicle to Grid technology and
battery storage, which is another benefit that supports sustainability.
• Fast Charging is another solution for commercial use that works well and, when
incorporated with smart technology, will manage the load of the grid. But there is
no funding available for infrastructure that is fast charging.
• While EV’s are widespread in light duty and residential use, there is much we still
do not know about ZEV’s in the commercial sector. Therefore, we should
implement a Fleet Pilot Program that can assist in identifying the best charging
methods to pursue, thereby determining a cost effective solution for the various
commercial uses.
4
II. Comments SDAP has operated ZEV Transportation vehicles for one year, becoming an early adopter
as of May 2015, purchasing the Zenith Motors medium duty bus with HVIP funding. SDAP
believes that the CPUC workshops were an opportunity to help share the barriers that are unique
in commercial use when compared to light duty or residential use. Concerns have been raised in
these hearings, helping illustrate the urgent need to keep the cost per mile below conventional
fuel costs, and to promote acceleration with other fleets.
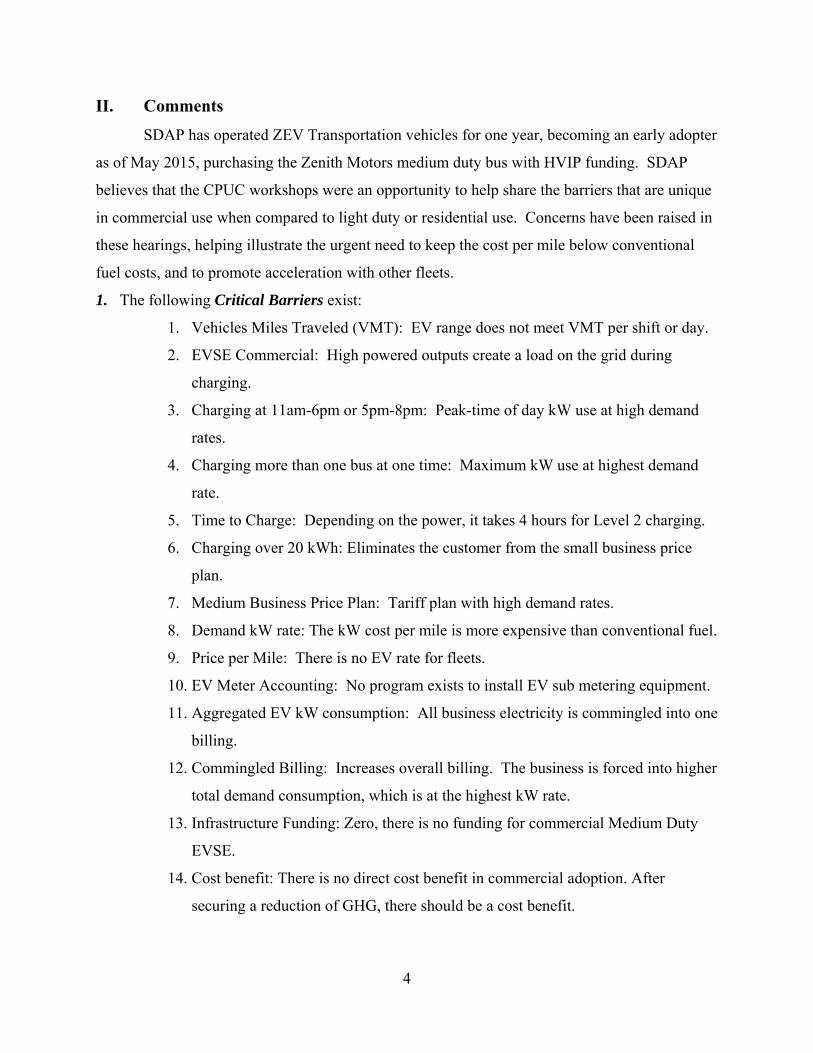
1. The following Critical Barriers exist:
1. Vehicles Miles Traveled (VMT): EV range does not meet VMT per shift or day.
2. EVSE Commercial: High powered outputs create a load on the grid during
charging.
3. Charging at 11am-6pm or 5pm-8pm: Peak-time of day kW use at high demand
rates.
4. Charging more than one bus at one time: Maximum kW use at highest demand
rate.
5. Time to Charge: Depending on the power, it takes 4 hours for Level 2 charging.
6. Charging over 20 kWh: Eliminates the customer from the small business price
plan.
7. Medium Business Price Plan: Tariff plan with high demand rates.
8. Demand kW rate: The kW cost per mile is more expensive than conventional fuel.
9. Price per Mile: There is no EV rate for fleets.
10. EV Meter Accounting: No program exists to install EV sub metering equipment.
11. Aggregated EV kW consumption: All business electricity is commingled into one
billing.
12. Commingled Billing: Increases overall billing. The business is forced into higher
total demand consumption, which is at the highest kW rate.
13. Infrastructure Funding: Zero, there is no funding for commercial Medium Duty
EVSE.
14. Cost benefit: There is no direct cost benefit in commercial adoption. After
securing a reduction of GHG, there should be a cost benefit.

5
15. Fleet EV Rates: Without special attention paid to alleviating commercial fleet
electrification barriers, conversion will not accelerate.
2. The following Remedies exist:
1. EV Flat Rate: Adoption would be encouraged by implementing a rate schedule
similar to the design SMUD has incorporated.
2. Off Grid Solar Charging: Sunshine provides free kilowatts.
3. Battery Storage Charging: Vehicle to Grid connection gives back to the grid.
4. Smart Grid Communication: Incorporates programming to manage loads.
5. Infrastructure Funding: Diversity reduces load time & shaves kW cost.
6. Fleet Pilot Program: Learn what we do not know about other methods and
technology. Include an EV rate term to be incorporated with Fast Charging, and a
requirement to reduce loads from installing Renewable Infrastructure equipment.
3. The following SDAP Bus Operation & Drive Cycle Assumptions are applied in SDAP
Comments to understand the amount of vehicles miles per shift in commercial short haul use
along with charging time:
1. SDAP Use: Airport parking customer taking shuttle bus from parking lot to
airport.
2. Open 24 hours per day, 365 days per year.
3. Fleet size: 5 Medium Duty Buses.
4. Annual Miles: 240,000 vehicle miles.
5. Monthly Miles: 20,000 vehicle miles.
6. Emissions saved per year: 286,000 lbs. of GHG saved annually in ZEV.
7. Max on-board vehicle battery charger: 62 kW of vehicle charging capacity.
8. EV Range: 100 miles.
9. Vehicle Miles per Shift: 126 Miles (14 trips).
10. Short Haul Trip Distance: 9 miles round trip.
11. EV Miles per Kilowatt: 2 miles (average).
12. Driver Shifts per day: 3 shifts per day, of 9 to 10 hours apiece.
13. Start Times for each Shift: 1) 4am@9 hrs; 2) 1pm@10 hrs; 3) 9pm@10 hrs.
14. Charge Time per Shift: 126 minutes, charging 9 mins at base between each trip.
15. EVSE Level 2 Charger: 13 kWh, yielding 26 miles per hour of charging

6
16. Time and Range of Charge: 14 charges for 9 minutes apiece produce 126 minutes
of charge for 55 miles of range.
17. Range at end of shift no. 1: 30 miles.
18. Shift no.2 starts at 1pm: Charging at 1pm equals peak-time load rates in Summer.
19. Range at start of shift no.2: 30 miles, while still needing to complete 126 VMT.
20. Charging time needed: 3.5 hours at 13 kWh, yielding 96 miles.
21. 15 mins of charging at base (14 trips) yields 3.5 hrs of charging (210 minutes).
22. 3.5 hours of charging produces 48kW, yielding 96 miles.
23. Shift no.2 will not have enough time to complete 15 mins of charging at base.
24. Shift no.2 is 30 mins short of charging time, putting it 13 miles short.
25. Therefore, Driver in shift no. 2 cannot complete all 126 miles.
4. The following are the details of the mainstream battery charging method of Electric Vehicle
Supply Equipment (EVSE) and the maximum battery charging capacity that is generated from
the on-board vehicle battery. Understanding the various methods of EVSE limitations and
charging loads is a significant barrier. It is not well understood since most charging stations
deployed today support Light Duty for home use or work place. This does not have the same
impact on loads when charging with the much more powerful commercial batteries. Medium
Duty and Heavy Duty battery charging is much bigger, much faster and much more powerful in
order to propel commercial vehicles that have a Gross Vehicle Weight (GVW) far in excess of
Light Duty. SDAP Comments address why this barrier impacts commercial use.
The battery capacity of the standard EV light duty passenger car (Ford Focus) on the road
today has 6 to 8 kWh. The medium duty bus (Zenith) has a 62 kWh battery capacity. The
heavy duty bus (Proterra) has over 100 kWh battery capacity. The standard light duty passenger
cars travel 40 miles per day, and drivers typically have plenty of time while at home, charging
the vehicle overnight so that it is fully charged at the start of the next day. The standard drive
cycle for the medium duty or heavy duty bus is 125 miles per 9-hour shift, with a bus range of
100 miles. Therefore, the bus would need to be charged throughout the shift in order to have
enough charge to complete the 125 miles.
A standard home EVSE allows you to connect the light duty passenger car to the electric
network at home to supply and charge the vehicle with the AC current. However, for quicker
charging (13kW – 300 kW), which is typical for Commercial EVSE, the equipment and
7
installation is a more advanced technology, which generally requires electric upgrading and can
be installed with a variety of methods in order to produce a higher maximum supply of power.
Commercial EV driving cycles do not always allow time to charge overnight or due to a
combination of vehicle range and VMT in commercial use. Charging throughout the shift is a
necessity, which is just the opposite of light duty EV driving cycles. Since commercial drive
cycles must charge throughout the shift, charging at 1pm during Summer Season peak-time or at
5pm Winter Season peak-time is appropriate in the commercial application. Defining all of the
ingredients tied to commercial charging is challenging, since the platform for electrification
requires equipment hardware and installation of the station, all of which is very complex. As
such, understanding the scope of EV operations and adoption is very technical. One element
that cannot be changed is the length of charge time, which is a barrier that has to be managed in
concert with the EV transportation range. More importantly, making the correct decision for the
method of charging equipment and the power that you need to supply your fleet is a critical
factor in time management: Time to charge, time traveling on the road, time back at base, time
available for charging, time of day that charging occurs. These factors all dictate whether you
can successfully stay on the road for the driving cycles and distance travelled. Additionally, the
time of day at which charging takes place can have a dramatic effect on the billing rates. The
ability to charge as needed is determined by the power output distributed from the engineering
and installation method and the power output available from the charging equipment. These
factors determine how long it takes to fully charge the vehicle. Alternatively, the average
petroleum pump delivers 5,000 kilowatts (kW) and will fill the average vehicle in less than 5
minutes, yielding a range of 200 to 300 miles.
The two tables below depict the details involved in EVSE installations. The tables
display the amount of time it takes to fully charge an EV vehicle with a range of 40 to 100 miles.
The application in each EV installation produces a different amount of power that determines the
difference in the amount of time it takes to charge; moreover, when compared to conventional
petroleum pumping, it can be reasonably understood why it is significantly slower. The
installation design of the specific power of output when combined with the type of wiring
produces different charging times.

8
Table 1: Power Output from Electrical Engineering design with EVSE Equipment
50 Mile Range = Charge
time
Power Supply Wiring
EVSE Power Output Voltage
Max. Current Breaker
6–8 hours Single phase 3.3 kW 230 Vac 16 A 3–4 hours Single phase 7.4 kW 230 Vac 32 A 2–3 hours Three phase 10 kW 400 Vac 16 A 1–2 hours Three phase 22 kW 400 Vac 32 A
20–30 minutes Three phase 43 kW 400 Vac 63 A
20–30
minutes Direct current 50 kW 400–500 V DC 100–125 A
10 minutes Direct current 120 kW 300–500 V DC 300–350 A
Table 2: EVSE Charging Power Levels Based in Part on SAE Standard J1772 Power Level Types
Charger Location
Typical Use Energy Supply Interface
Expected Power Level
Charging Time
Vehicle Technology
Level 1 (Opportunity) 120 Vac (US) 230 Vac (EU)
On-board 1-phase
Charging at home or office
Convenience outlet (NEMA 5- 15R/20R)
1.4kW (12A) 1.9kW (20A)
4-11 hours 11-36 hours
EVs 16-50kWh
Level 2 (Primary) 240 Vac (US) 400 Vac (EU)
On-board 1- or 3-phase
Charging at private, public outlets or commercial
Dedicated EVSE
4kW (17A) 8kW (32A) 19.2 kW (80A)
1-4 hours 2-6 hours 2-3 hours
EVs 16-30kWh EVs 3-50kWh
Level 3 (Fast) 208-600 Vdc
Off-Board 3-phase
Commercial, analogous to a filling station
Dedicated EVSE
50kW 100kW 0.4-1 hour 0.2-0.5 hour
EVs 20-50kWh
Ultimately, even if the supply of power is increased because you want to fill up faster, batteries
cannot accept a charge at greater than their maximum charge rate capacity. The bigger the
battery size of the on-board battery in the vehicle, the more power supply can be generated,

9
which determines your available maximum supply of power. However, in order to take
advantage of the power supply available, the design connection installation and battery size of
the EVSE equipment ultimately determines the final output. Therefore, understanding the time it
takes to charge your fleet based on the installation becomes an essential element of time
management.
The On-Board Commercial Vehicle Battery is much BIGGER than the standard light
duty passenger car; this is required in commercial vehicles in order to be able to
accommodate the gross vehicle weight (GVW) which affects the vehicle range and power to
propel the vehicle. See table 3.
Table 3: On-Board Vehicle Battery
Vehicle GVW Vehicle Make & Model On-Board Vehicle Power Output (kWh)
4,000 GVW: Ford Focus, Nissan Leaf 6 -11 kWh
10,000 GVW: Zenith Bus (SDAP Fleet) 62 kWh
40,000 GVW: Proterra Transit Bus 150 kWh up to 500 kWh
EVSE Commercial Charging Equipment is also much FASTER due to the power
supply needed to support the bigger on-board vehicle batteries. But with more power output
from commercial charging equipment comes quicker fill times and much higher equipment
cost. See table 4.
Table 4: EVSE Charging Equipment
EVSE Level Use Type EVSE Power Output (kWh) EVSE Equipment Cost
Level 1: standard home use Starts at 1.5 kWh $500
Level 2: standard home use 6 kWh $1,000
Level 2: commercial use Starts at 13 kWh – 25 kWh $3,000-$10,000
Fast Chargers: home use Starts at 35 kWh – 50 kWh $10,000-$30,000
Fast Chargers: commercial use Starts at 55 kWh – 500 kWh $50,000-300,000
10
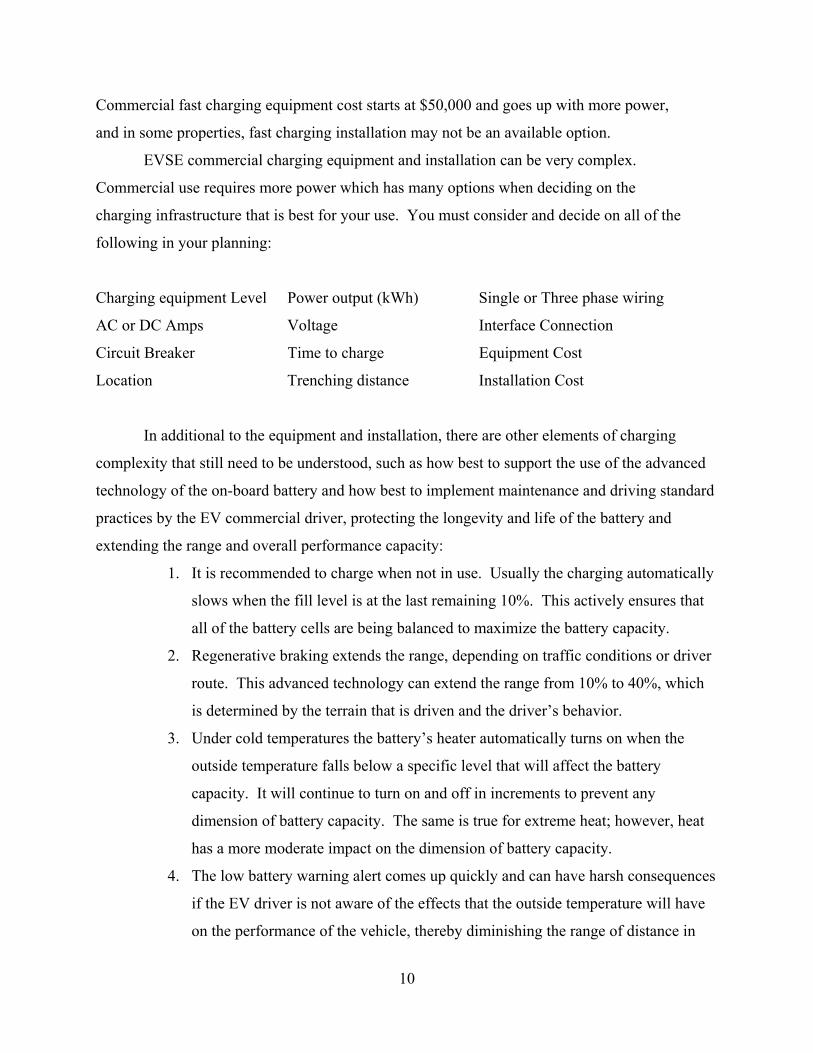
Commercial fast charging equipment cost starts at $50,000 and goes up with more power,
and in some properties, fast charging installation may not be an available option.
EVSE commercial charging equipment and installation can be very complex.
Commercial use requires more power which has many options when deciding on the
charging infrastructure that is best for your use. You must consider and decide on all of the
following in your planning:
Charging equipment Level Power output (kWh) Single or Three phase wiring
AC or DC Amps Voltage Interface Connection
Circuit Breaker Time to charge Equipment Cost
Location Trenching distance Installation Cost
In additional to the equipment and installation, there are other elements of charging
complexity that still need to be understood, such as how best to support the use of the advanced
technology of the on-board battery and how best to implement maintenance and driving standard
practices by the EV commercial driver, protecting the longevity and life of the battery and
extending the range and overall performance capacity:
1. It is recommended to charge when not in use. Usually the charging automatically
slows when the fill level is at the last remaining 10%. This actively ensures that
all of the battery cells are being balanced to maximize the battery capacity.
2. Regenerative braking extends the range, depending on traffic conditions or driver
route. This advanced technology can extend the range from 10% to 40%, which
is determined by the terrain that is driven and the driver’s behavior.
3. Under cold temperatures the battery’s heater automatically turns on when the
outside temperature falls below a specific level that will affect the battery
capacity. It will continue to turn on and off in increments to prevent any
dimension of battery capacity. The same is true for extreme heat; however, heat
has a more moderate impact on the dimension of battery capacity.
4. The low battery warning alert comes up quickly and can have harsh consequences
if the EV driver is not aware of the effects that the outside temperature will have
on the performance of the vehicle, thereby diminishing the range of distance in
11
miles that can be typically traveled. This is a pertinent issue for the EV
commercial driver to be aware of; due to the change in range of VM that creates a
new limited and shorter range.
As indicated in the foregoing tables, the electrification technology application for
commercial use is not as easy as the light duty charging platform. In order to get the best
capacity output to support the commercial vehicle’s on-board battery, the components of the
hardware and installation require a complex design and installation upgrade, including other
maintenance and performance measures that must be addressed in respect to drivers.
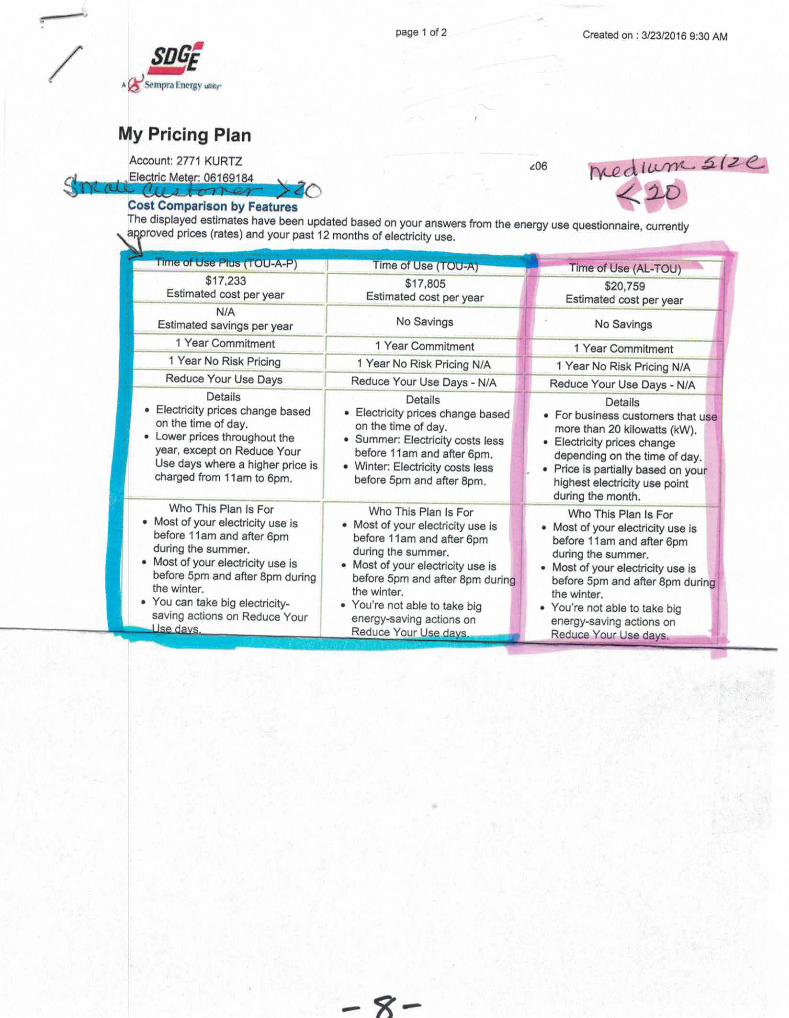
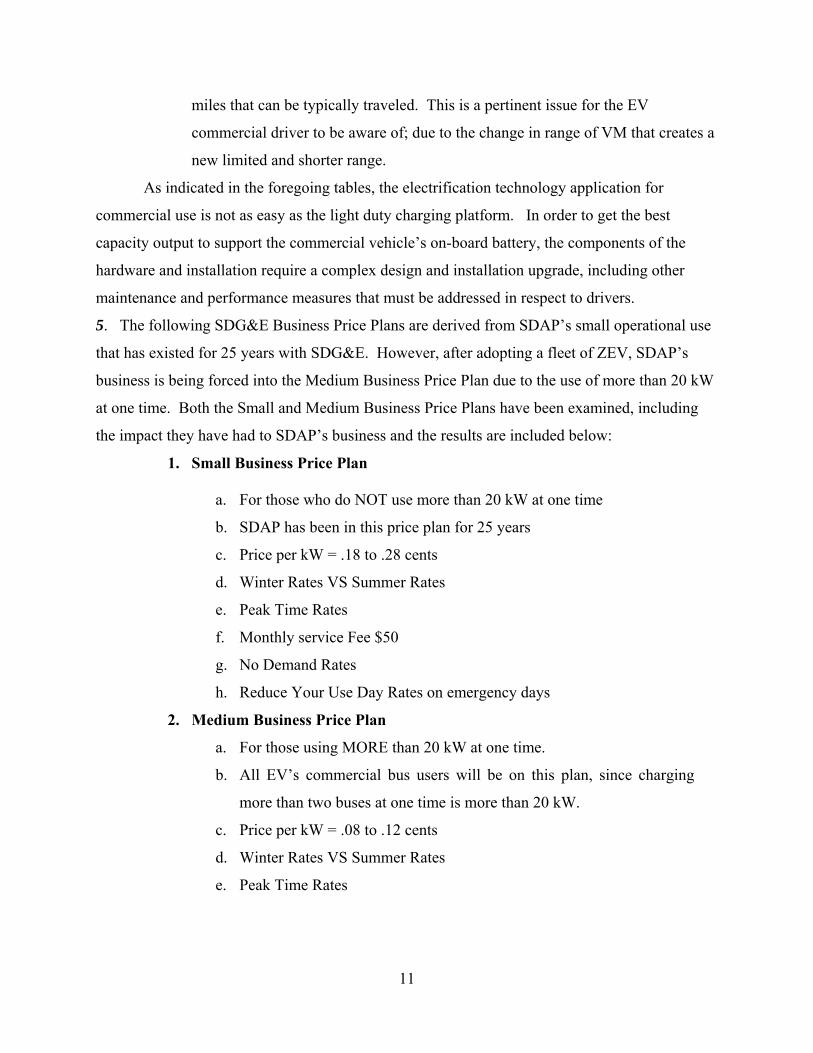
5. The following SDG&E Business Price Plans are derived from SDAP’s small operational use
that has existed for 25 years with SDG&E. However, after adopting a fleet of ZEV, SDAP’s
business is being forced into the Medium Business Price Plan due to the use of more than 20 kW
at one time. Both the Small and Medium Business Price Plans have been examined, including
the impact they have had to SDAP’s business and the results are included below:
1. Small Business Price Plan
a. For those who do NOT use more than 20 kW at one time
b. SDAP has been in this price plan for 25 years
c. Price per kW = .18 to .28 cents
d. Winter Rates VS Summer Rates
e. Peak Time Rates
f. Monthly service Fee $50
g. No Demand Rates
h. Reduce Your Use Day Rates on emergency days
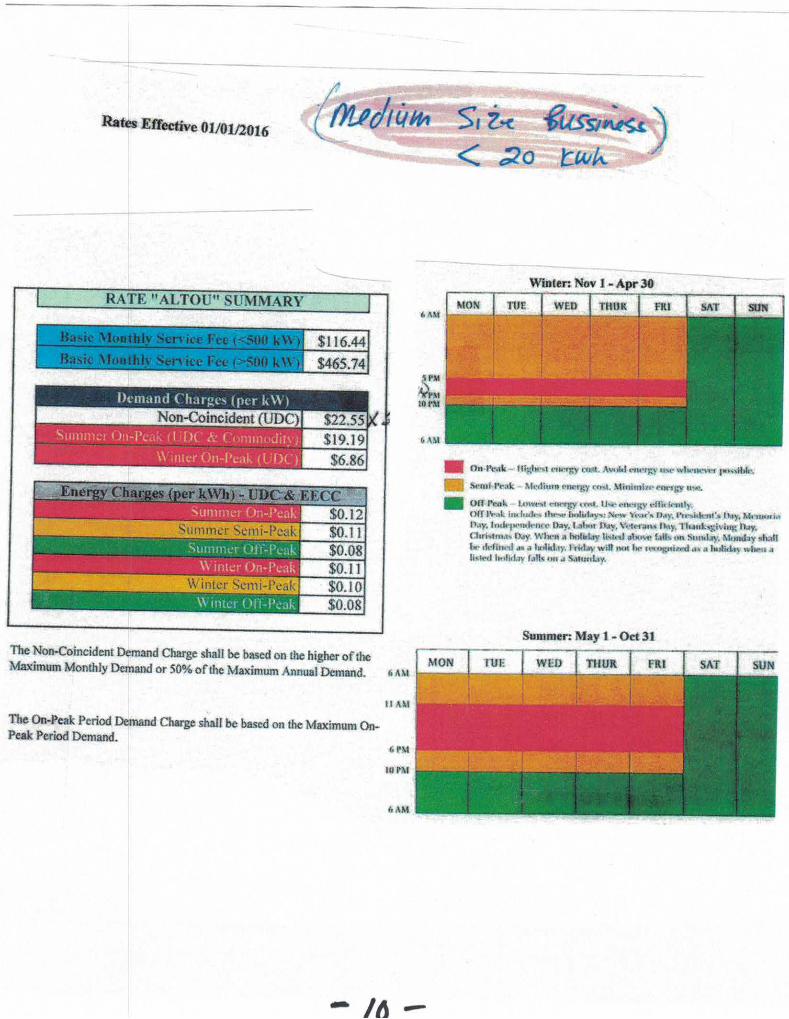
2. Medium Business Price Plan a. For those using MORE than 20 kW at one time.
b. All EV’s commercial bus users will be on this plan, since charging
more than two buses at one time is more than 20 kW.
c. Price per kW = .08 to .12 cents
d. Winter Rates VS Summer Rates
e. Peak Time Rates
12
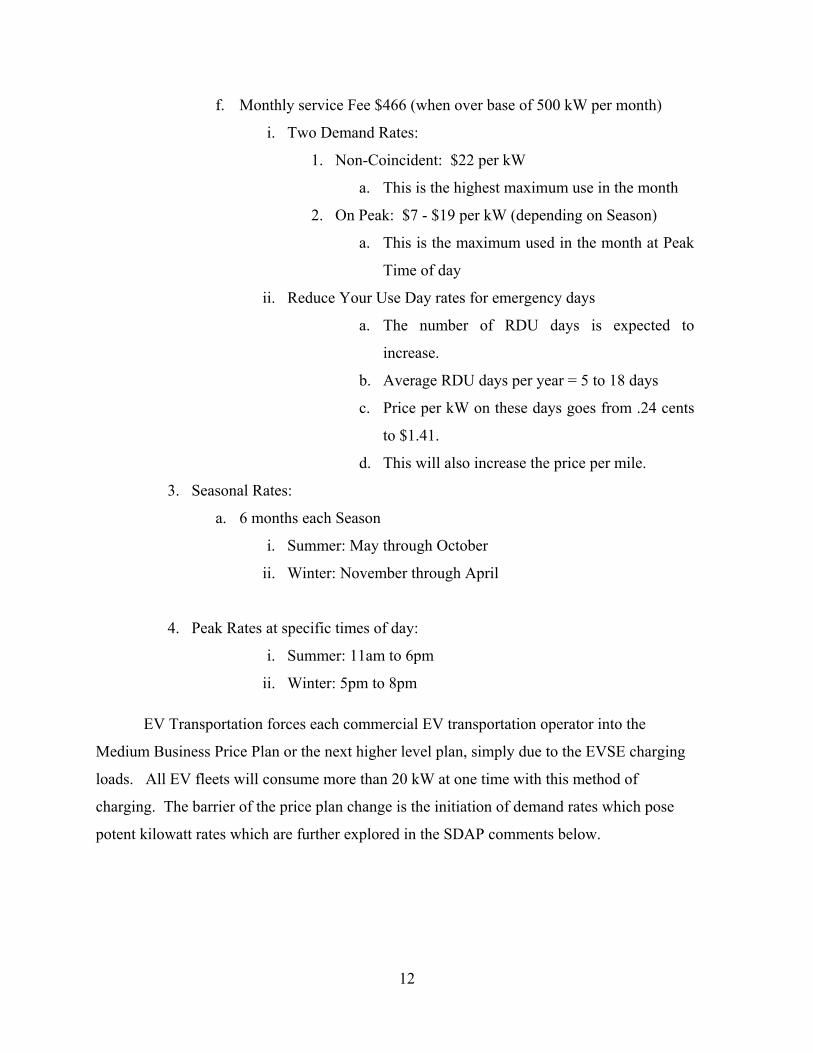
f. Monthly service Fee $466 (when over base of 500 kW per month)
i. Two Demand Rates:
1. Non-Coincident: $22 per kW
a. This is the highest maximum use in the month
2. On Peak: $7 - $19 per kW (depending on Season)
a. This is the maximum used in the month at Peak
Time of day
ii. Reduce Your Use Day rates for emergency days
a. The number of RDU days is expected to
increase.
b. Average RDU days per year = 5 to 18 days
c. Price per kW on these days goes from .24 cents
to $1.41.
d. This will also increase the price per mile.
3. Seasonal Rates:
a. 6 months each Season
i. Summer: May through October
ii. Winter: November through April
4. Peak Rates at specific times of day:
i. Summer: 11am to 6pm
ii. Winter: 5pm to 8pm
EV Transportation forces each commercial EV transportation operator into the
Medium Business Price Plan or the next higher level plan, simply due to the EVSE charging
loads. All EV fleets will consume more than 20 kW at one time with this method of
charging. The barrier of the price plan change is the initiation of demand rates which pose
potent kilowatt rates which are further explored in the SDAP comments below.
13
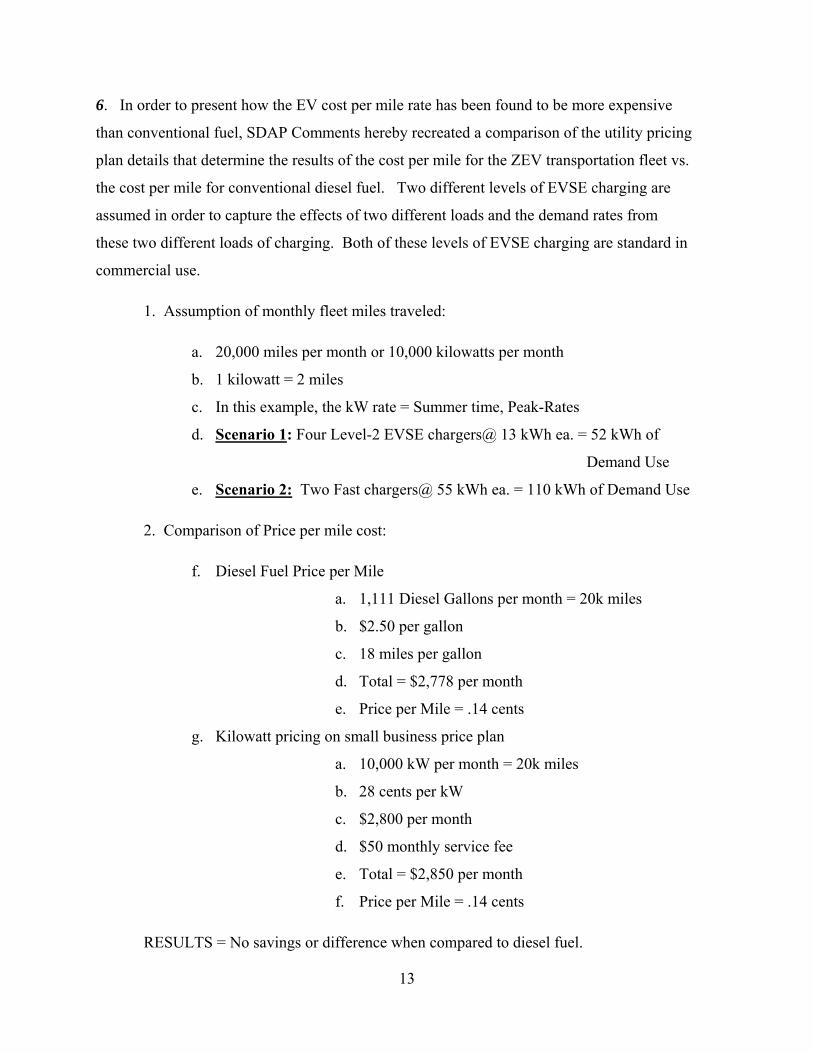
6. In order to present how the EV cost per mile rate has been found to be more expensive
than conventional fuel, SDAP Comments hereby recreated a comparison of the utility pricing
plan details that determine the results of the cost per mile for the ZEV transportation fleet vs.
the cost per mile for conventional diesel fuel. Two different levels of EVSE charging are
assumed in order to capture the effects of two different loads and the demand rates from
these two different loads of charging. Both of these levels of EVSE charging are standard in
commercial use.
1. Assumption of monthly fleet miles traveled:
a. 20,000 miles per month or 10,000 kilowatts per month
b. 1 kilowatt = 2 miles
c. In this example, the kW rate = Summer time, Peak-Rates
d. Scenario 1: Four Level-2 EVSE chargers@ 13 kWh ea. = 52 kWh of
Demand Use
e. Scenario 2: Two Fast chargers@ 55 kWh ea. = 110 kWh of Demand Use
2. Comparison of Price per mile cost:
f. Diesel Fuel Price per Mile
a. 1,111 Diesel Gallons per month = 20k miles
b. $2.50 per gallon
c. 18 miles per gallon
d. Total = $2,778 per month
e. Price per Mile = .14 cents
g. Kilowatt pricing on small business price plan
a. 10,000 kW per month = 20k miles
b. 28 cents per kW
c. $2,800 per month
d. $50 monthly service fee
e. Total = $2,850 per month
f. Price per Mile = .14 cents
RESULTS = No savings or difference when compared to diesel fuel.

14
h. kW pricing on medium business price plan (Scenario 1 – level 2 charging)
a. 10,000 kW per month = 20k miles
b. .12 cents per kW
c. $1,200 per month
d. $1,144 Non-Coincident Demand Fees *
= 52 kWh x $22 per kW
e. $988 On-Peak Demand Fees *
= 52 kWh x $19 per kW
f. $466 monthly service fee *
g. Total = $3,798 per month
h. Price per Mile = .19 cents
RESULTS = 30% increase at .04 cents more per mile or $950 more per month.
i. kW pricing on medium business price plan (Scenario 2 – fast charging)
a. 10,000 kW per month = 20k miles
b. .12 cents per kW
c. $1,200 per month
d. $2,420 Non-Coincident Demand Fees *
= 110 kWh x $22 per kW
e. $2,090 On-Peak Demand Fees *
= 110 kWh x $19 per kW
f. $466 monthly service fee *
g. Total = $6,176 per month
h. Price per Mile = .30 cents
RESULTS = 115% increase at .16 cents more per mile or $3,325 more per month.
* New fees incurred due to the charging loads on the grid which triggers demand rates
The lack of an available EV commercial rate is a Barrier as all commercial use will
go over 20 kW at one time. The demand rate occurs when consumption at one given time
goes over 20 kW. Charging during normal business hours activates peak-time charging rates,
and charging two EV buses at one time regardless of the time of day activates maximum

15
demand rate. Both demand rates will repeat each month no matter what time of day or what
day it is as the use of more than 20 kW at one time can’t be avoided on a daily basis with
commercial infrastructure and VMT. Furthermore, this analysis does not consider any other
electric energy use from standard equipment needed for running the business, since the
kilowatts from EV are now being folded into the overall bill.
This validates why demand charges cannot be avoided with the use of EV in the
commercial sector, which currently is one of the most critical barriers that commercial
electrification fleets have raised. In conjunction with the objective for ZEV acceleration, the
current price comparison clearly shows that electricity demand rates will not be at a rate that
will promote acceleration of commercial fleets. As adoption demonstrates a higher cost per
mile than conventional fuel, where is the benefit for fleets to adopt EV? The other long term
consideration is how this will affect the future of supply and demand. We need an immediate
short term solution in order to ensure that acceleration is on track, providing an opportunity
to drive down the future costs of accelerating EV’s into the electrification market. We are
concerned that the current tariff and demand rates will negatively impact outreach as the
early adopters certainly were not aware of demand rates or the effects of EVSE equipment
loads in Utility price plans. This is all evident in the facilitation of the workshops that has
been provided by the CPUC Commission and recommends the Utility to refine the rates as
per the Second Track (R.13-11-007 at 14.) to “focus on new tariffs” that would include fleets.
The current demand rate price for the EV business customer is unreasonably high and
particularly unfair after they have done their part to meet the climate goals with no cost
benefit. The cost is 30% to 115% more per mile than conventional diesel fuel and it is 30%
to 115% more per mile when compared to the small business price plan which has no
demand rates. The utility initiatives include supporting ZEV acceleration, but in order to
meet this goal, the utility must incorporate a fair rate for commercial EV, one that is clearly
lower than conventional fuels.

16
7. Advance EV Infrastructure Remedies for charging are available today.
1. We want the funding program to include Renewable Energy Infrastructure in
the budget, helping reach Climate Goals while reducing our Demand Use Fees and Peak Load
energy use that occur from being 100% tied with our Utility Companies. Let’s drive on sunshine
securing more diverse charging applications with a more modern and advanced
charging infrastructure.
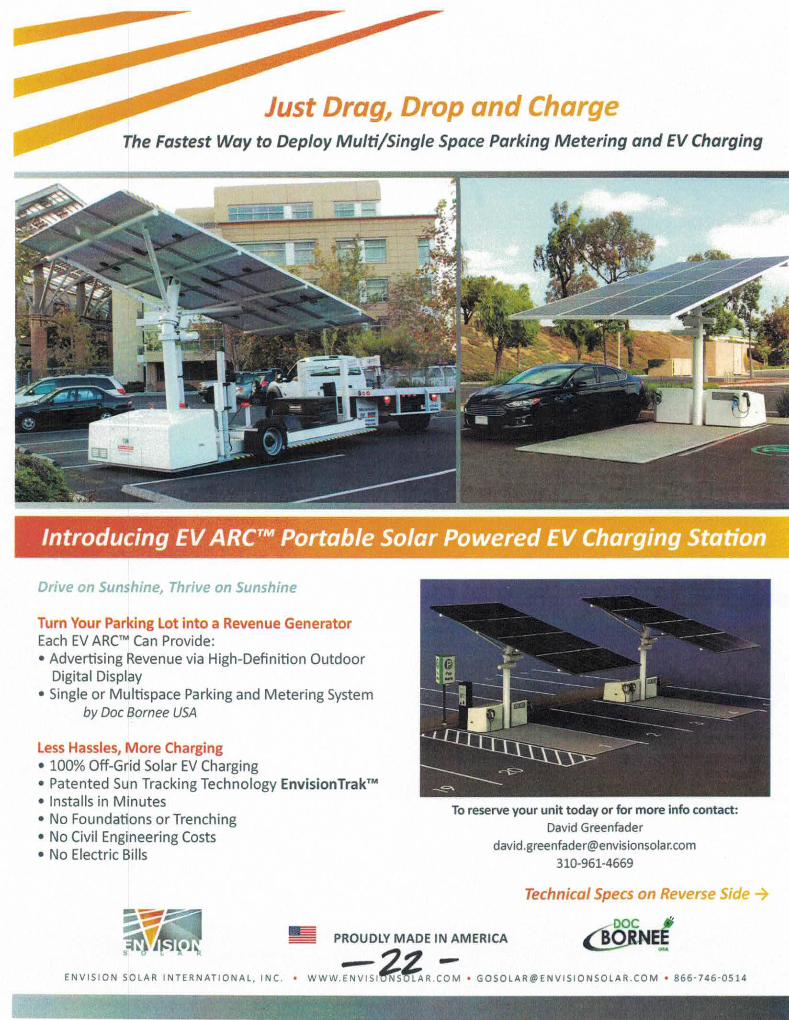
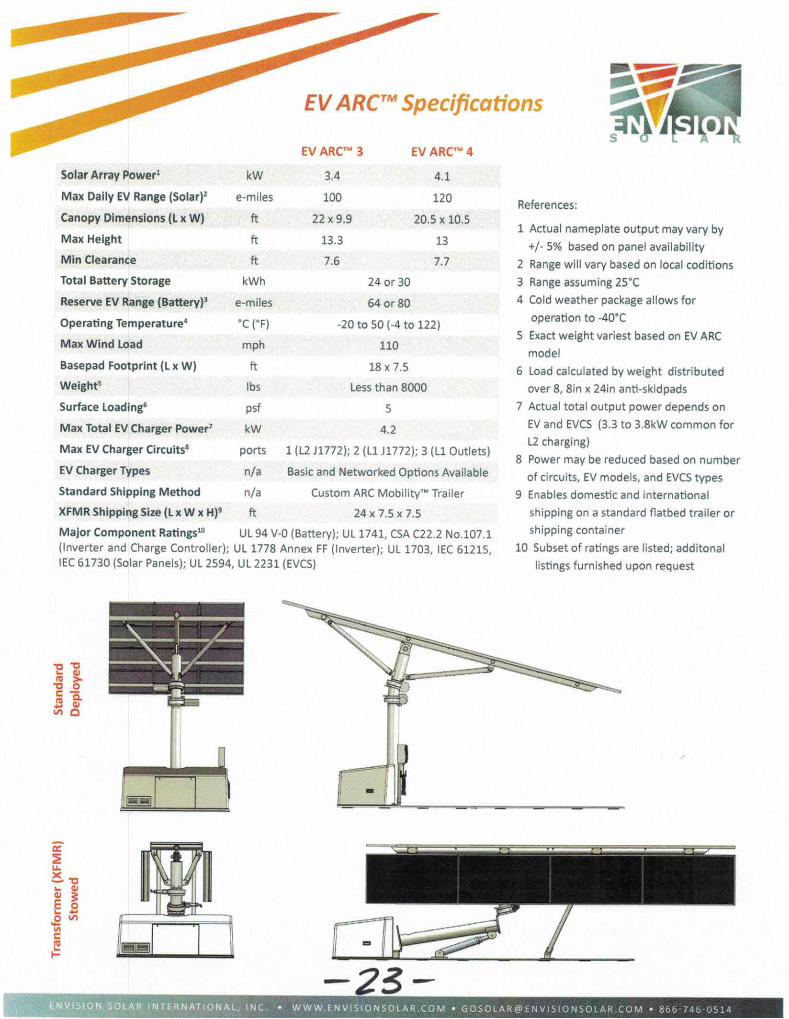
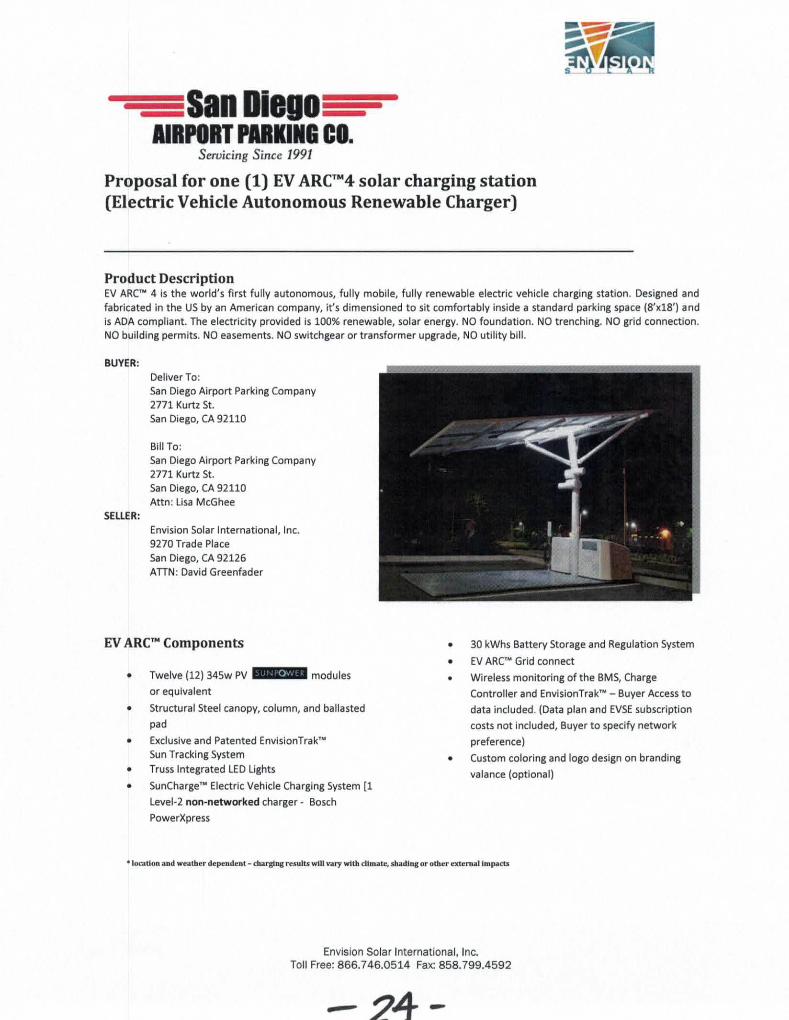
Envision Solar is a San Diego based company that supplies the world’s only transportable
EV solar powered charging station. The EV solar stations are deployed in minutes with no
environmental impact or disruption at the site location. Envision Solar has already received a
statewide mandated contract award for the State of California. Caltrans made its first series of
delivered Envision Solar powered charging stations in September 2015, a decision which
enables their employees and fleet vehicles to drive on sunshine. Envision Solar is invented
and manufactured in California; the EV ARC™ fits inside a parking space and does not
reduce available parking in any way. It generates enough clean, solar electricity to power up
to 150 miles of EV driving each day. The system's solar electrical generation is enhanced by
the patented Envision Trak™ system, which causes the array to follow the sun, generating
18% to 25% more electricity than a fixed array. The energy is stored in the EV ARC™
product's energy storage for charging day or night. The EV ARC™ requires no trenching,
foundations or installation work, allowing it to be deployed in minutes and moved to a new
location with ease. Envision Solar's EV ARC™ products are manufactured in the company's
San Diego facility, by combat veterans, minorities and workers with disabilities, all of which
has contributed to creating more jobs and employment opportunities. Sunny Southern
California has an opportunity to plan the future for others to follow -- drive on sunshine
without trenching, foundations or electrical connections and without utility bills. This means
real emissions-free driving that is perfectly in line with our goals for California.
The solar powered stations charge EV vehicles off the grid or grid tied with a battery
storage option deploying an array of products that include some of the following equipment and
benefits:
17
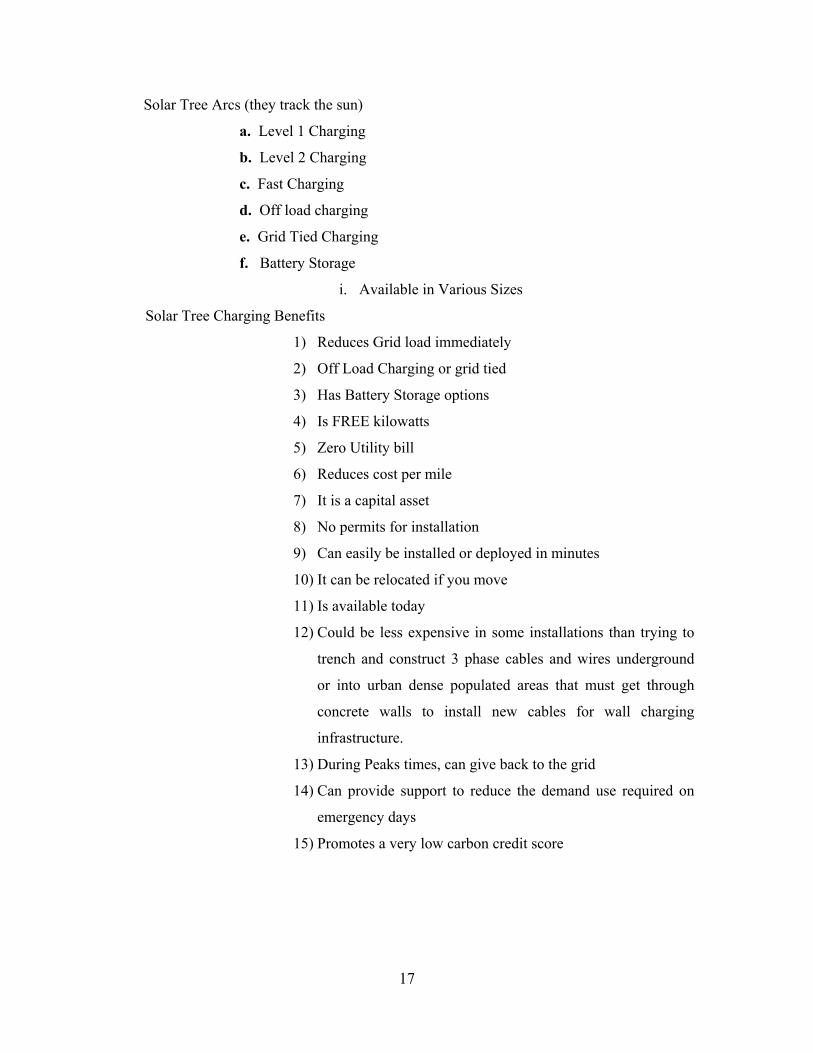
Solar Tree Arcs (they track the sun) a. Level 1 Charging b. Level 2 Charging c. Fast Charging
d. Off load charging
e. Grid Tied Charging
f. Battery Storage
i. Available in Various Sizes
Solar Tree Charging Benefits
1) Reduces Grid load immediately
2) Off Load Charging or grid tied
3) Has Battery Storage options
4) Is FREE kilowatts
5) Zero Utility bill
6) Reduces cost per mile
7) It is a capital asset
8) No permits for installation
9) Can easily be installed or deployed in minutes
10) It can be relocated if you move
11) Is available today
12) Could be less expensive in some installations than trying to
trench and construct 3 phase cables and wires underground
or into urban dense populated areas that must get through
concrete walls to install new cables for wall charging
infrastructure.
13) During Peaks times, can give back to the grid
14) Can provide support to reduce the demand use required on
emergency days
15) Promotes a very low carbon credit score

18
2. We also want the funding program to include Fast Charging Infrastructure in the
budget that will help ameliorate the time management issue related to charging. The
Demand Use Fees and Peak Load energy may be optimized with fast and short
charging interval connections. When incorporating smart grid load management
technology, we may find a solution for commercial fast charging at higher speeds
with the help of communication software that regulates the interval charging period to
15 minute increments, rather than charging for hours on the grid. Let’s become more
diverse with how we can charge using other more modern and advanced technology.
The benefits of electric energy diversity include addressing the California climate
policy, putting a priority on carbon reduction resulting in more carbon credits, and
implementing charging that benefits commercial EV adoption. Incorporating Renewable
Energy charging stations mixed with Fast Charging will best support the continuation of the
policy to drive EV electrification. Solar powered charging benefits all classes of EV vehicles
and does not create prohibitively expensive installations due to high construction cost, city
permits or property ownership approval; moreover, this will facilitate off-load charging
without contributing to issues with both load use and demand rates. Fast Charging benefits
all classes of EV vehicles and will reduce the amount of time on the grid. We believe a mix
of charging options may emerge as the optimal solution for PEV; it accommodates all EV
vehicle classes, generates grid sustainability, and supports the adoption of renewable energy
planning standards, ZEV policy goals, and results in load use that is more diverse with a
higher carbon score.
8. VGI Program – the facilitation of PEV infrastructure and development for the service territory of San Diego. The proposed VGI program only addresses light duty, workplace, and
multi-use dwellings and does not address medium duty or heavy duty, and it does not include
fast chargers or renewable charging equipment that could capture grid benefits and benefit
commercial use. The VGI Rate appears to be designed to foster use during off peak periods, a
standard to which commercial operators cannot conform due to the VMT. The VGI is a ‘day
ahead hourly time-variant rate’ based on forecasted grid use and the cost of the grid at the
anticipated time of charging. Since grid load use can’t typically be controlled in commercial
operations, this framework will not support the required activity of daily multiple charging.
19
Unknown rates or the ‘day ahead hourly time-variant rate’ are perceived as confusing and not
very user friendly; as such, we would like to see the adoption of a simple flat rate, standardized
for different levels of charging in order to support acceleration, and specifically designed for EV
commercial use. In other words, the power you draw from charging would be at a premium rate
for more power at one time; the less power you draw, the lower the rate. The concern with the
VGI rate approach is that the proposed pricing method and time of use incentive will not mitigate
the most critical barriers commercial users face, which is the demand rate and demand charge
loads. The rate structure needs more refinement and should assign a rate structure that is flat for
the specific power you choose to draw. Otherwise, the pricing as proposed is not attractive
enough to entice deployment and more importantly it could slow down deployment.
SDG&E has installed an EV Study Meter on the SDAP property to study the EV data
from the SDAP EV Fleet. This has been generating results since October 2015. SDAP seeks
participation on the SDG&E PAC Advisory Council to fill the seat of the stakeholder position as
SDAP’s experience to date and knowledge with ZEV use and equipment installation and funding
experience can help SDG&E develop an effective plan for ZEV commercial electrification while
mitigating the barriers that could slow down commercial adoption and, more importantly, assist
in acceleration. SDAP can fairly contribute to the goals to address electrification design,
sharing actual lessons learned and data. SDAP is open to contributing its results from its year of
EV operations along with the data that SDG&E can examine from the appropriate meter
installation. This provides both parties the opportunity to examine and evaluate the activities,
and will prove very productive. SDAP originally adopted the use of B-20 fuel in 2010 for the
SDAP fleet. SDAP has been planning and procuring transportation to meet the LCFS and to
comply with the climate goals for over seven years, developing a clear understanding of the
LCFS policy, including working closely with the adoption of Propane Auto Gas to meet the
criteria for off road vehicles. All of these factors make SDAP a great resource to contribute to
the needs of electrification, specifically in commercial use.
20
III. Conclusion SDAP believes that the information contained in this filing provides a sufficient basis
for acceptance.
However, SDAP requests that, to the extent deemed necessary, the CPUC Commission
waive Demand Rates for a period of three years for Fleets that can’t avoid generating Load use,
helping them be successful after participating as early ZEV adopters in the reduction of GHG,
and to be able to operate at a fair rate. This demonstrates an incentive and benefit that promotes
accelerating the use of ZEV in Commercial Electrification fleets. This could be a continuous
order similar to the Tier 3 Advice Letter 4292 E with PGE and San Joaquin Transit.
SDAP submits that the CPUC Commission require a revised Formula rate by the IOU to
reflect a more accurate depreciation rate on their next annual filings. The impact by the
adoption of ZEV drivers represents changes in the amortization periods and thereby accelerates
the current recovery cost schedules. ZEV drivers will generate more electric use and more
revenue than what was estimated in the original depreciation equipment costs schedules that
were created prior to the goals of EV transportation. SB 350 will move 1.5 million drivers that
were generating GHG to zero emissions; the 1.5 million drivers represent removal of 11 billion
light duty miles and 30 billion heavy duty fleet miles eliminating a total of 40 billion miles of
petroleum annually which is being exchanged for distribution by electrification of 20 billion
kilowatts annually.1 This will allow the new revenue generated from 20 billion kilowatts
annually to be considered in the existing infrastructure costs and to be amortized with
consideration of the 1.5 million EV drivers plus the future capacity of additional EV drivers.
SDAP Comments propose to support a pilot program for fleet operators to provide
feedback while installing and using other charging methods that include Renewable Energy
Charging Infrastructure and Fast Charging Infrastructure. This is appropriate in light of what
needs to be learned about Fleet Charging and to ensure that all solutions are included and tested.
1 As part of SB 350, the defined goal is to adopt 1.5 million ZEV’s and in doing so, these comments assumed 50% light duty and 50% heavy duty miles would produce 40 billon annual miles which transfers into 20 billion kilowatts annually. Light duty is assigned 40 miles per day. Heavy Duty is assigned 110 miles per day. 1 kilowatt = 2 miles traveled.

21
One of the barriers that must be resolved is how to optimize the grid use during peak times.
Specifically focusing on diverse charging that is net zero or fast charging that allots for the
shortest period of time on the grid will positively reflect on sustaining the grid while reducing
load use or time on the grid. The importance of finding successful charging solutions will
benefit all parties. Diversity needs to be encouraged in order to find a solution that will produce
a reduced cost in kilowatt rates and ensures the fleet operator a fair EV rate when compared to
conventional fuel.
SDAP appreciates the opportunity to submit the forgoing Comments herein.
Dated: June 6, 2016
Respectfully submitted, /s/ Lisa McGhee
Lisa McGhee Operations Manager San Diego Airport Parking Company Tel: 619-574-1177
E-mail: [email protected]
1
EXHIBITS A – F, Exhibits Attached:
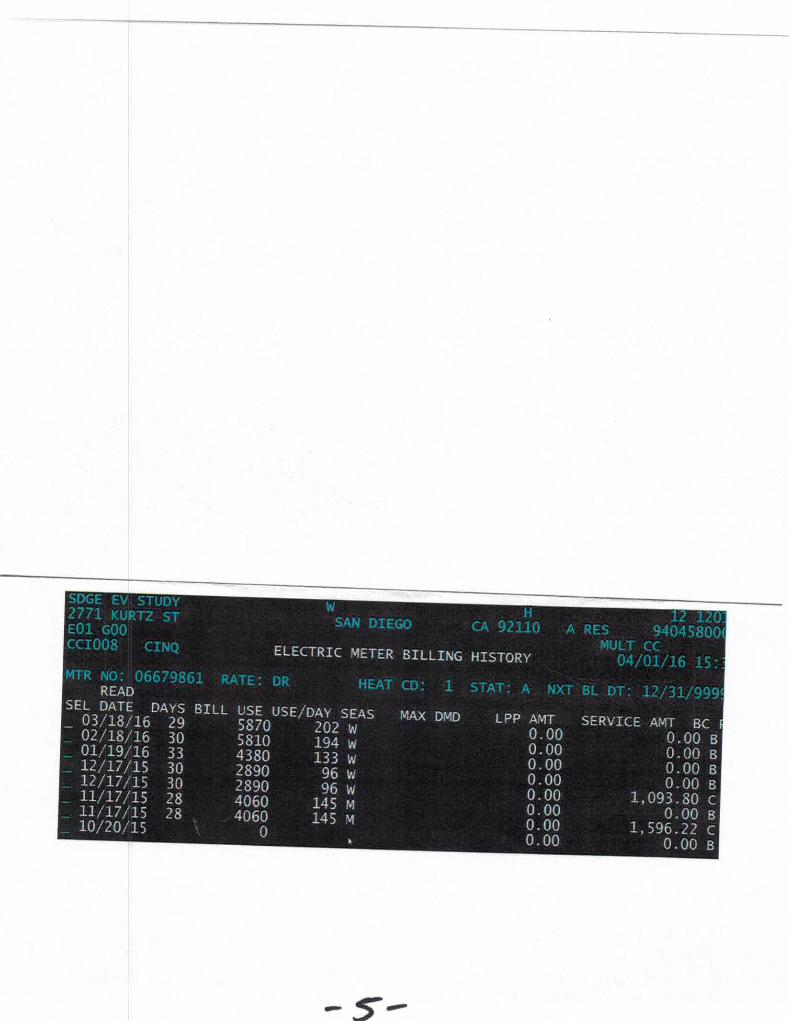
1. Exhibit A: History of SDAP Electricity use with SDG&E
1. 5 year billing history with No demand.
a. May 2015 ZEV bus #1,
1. Demand starts at 22.6 kW
b. Aug 2015 ZEV bus #2,
1. Demand is 30.9 kW
2. Electric meter consumption - EV study.
a. October 2015 thru March 2106
3. Electric meter consumption – Property + EV.
a. April 2015 thru March 2106
2. Exhibit B: SDG&E Business Customer Price Plans
1. Small Business Price Plan Rates for business customers that use
less than 20 kWh, this plan has zero demand rates.
2. Medium Business Price Plan Rates for business customers that use
over 20 kWh, this plan includes two demand rates.
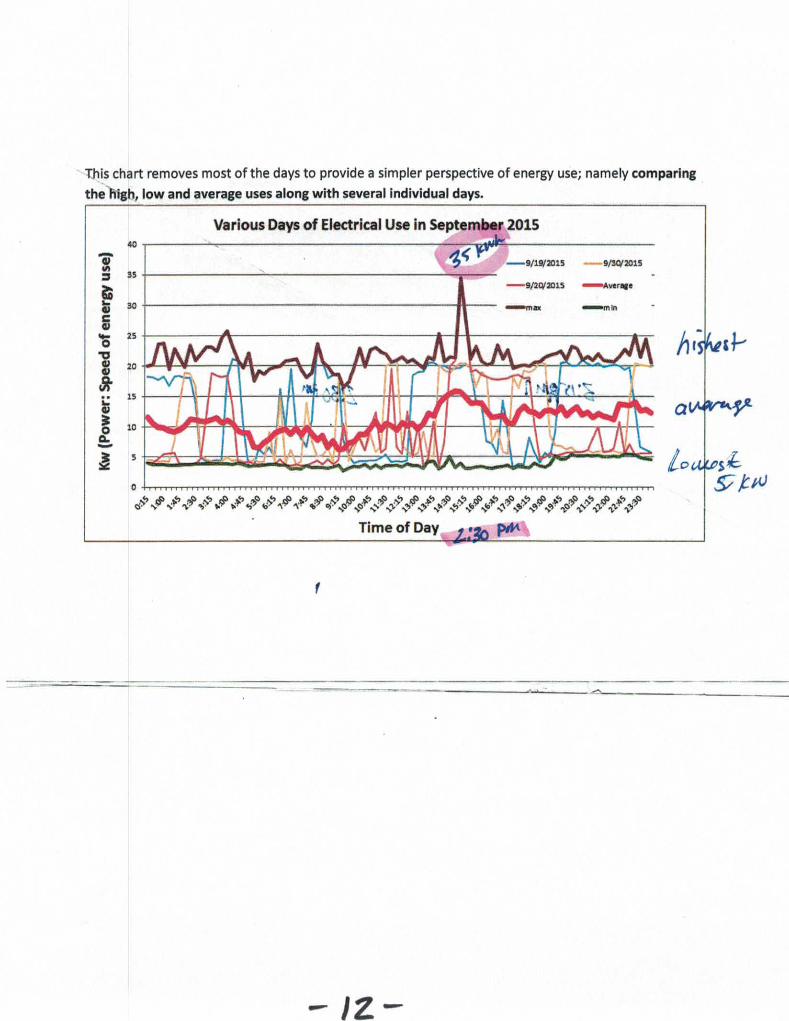
3. Exhibit C: Daily Load Use Analysis of EVSE Fleet Charging by SDG&E
a. Various days of kilowatt Use average (Sept 2015):
1. The spike depicts charging 2 buses at one time at 2:30pm
consuming the load of 35 kW at one single time from charging two
buses at one time.