Lisa Pool, AICP Becky Pepper Transportation Planner III KS ......Lisa Pool, AICP Transportation Planner III Mid-America Regional Council Becky Pepper KS Bicycle and Pedestrian Coordinator
68
Lisa Pool, AICP Transportation Planner III Mid-America Regional Council Becky Pepper KS Bicycle and Pedestrian Coordinator Kansas Dept. of Transportation
Becky PepperKS Bicycle and Pedestrian CoordinatorKansas Dept. of Transportation
1. Background on Community Design2. Typical Streetscape Design3. Obesity Trends Data4. Elements of Healthy Community Design5. Policies and Implementation Tools6. Resources
(EPA, 2003; 1969 Nationwide Personal Transportation Survey)
Image: National Center for Safe Routes to School
Presenter
Presentation Notes
Summary: The proximity of neighborhood schools to residential areas a generation or more ago encouraged high rates of walking and biking to school. Message: School have changed a lot in recent years. Distance issues are a growing problem. A generation or more ago, schools were small and located in the centers of communities. The close proximity of schools to residential neighborhoods encouraged walking and biking. Roughly 42 percent of students (from all grades) walked or biked to school in 1969. Breakdown of percentages: 49.3% of elementary; 41.6% of intermediate grades; 26.4% of senior high grades** Background: *Travel and Environmental Implications of School Siting, Environmental Protection Agency, Report No. 231-R-03-004, October 2003, available online at: http://www.smartgrowth.umd.edu/pdf/SchoolLocationReport.pdf. ** 1969 Nationwide Personal Transportation Survey (USDOT, 1972) Image(s): Welty Middle School, New Philadelphia, OH, provided by http://www.quakerfoundation.org/misc/archives/weltyold.jpg.
•40% of high schools have attendance of 1500+ students
•Schools located on 10 to 30+ acres of land
•Located in areas that make walking or biking to school difficult
Image: National Center for Safe Routes to School
Presenter
Presentation Notes
Summary: Today, schools are built to accommodate a far larger number of students, on fringe land, with the lowest possible construction costs, making it increasingly difficult for children to walk and bike to school. Message: Today, schools are built to accommodate a far larger number of students. The average school attendance is 653 students and 40% of high schools have an attendance of more than 1500 students.* Schools are increasingly being built on fringe land on the periphery of towns and cities, on parcels anywhere from 10 to 30 acres or more in size. This means that neighborhoods often aren’t connected to schools. And the quality of school construction has significantly decreased over time. The high school pictured here is so large that some students are bused to different parts of the campus during the school day. (292 acres, approx 2700 students) The reasons for this change include current land use patterns, school siting standards, and lack of coordination between planners and school officials. Background: *U.S. Department of Education, National Center for Education Statistics, Common Core of Data Survey, Table 94 – Public elementary and secondary schools, by type and size of school: 2000-01, Prepared July, 2002. Image: Dorman High School, Roebuck SC—near Spartanburg, provided by Mark Fenton.
2001: 16% walked
1969: 42% walked
(CDC, 2005)
Image: National Center for Safe Routes to School
Presenter
Presentation Notes
Summary: Today, fewer children are walking and biking and more parents are driving. Message: First let’s look at the facts. Today, fewer children are walking and biking and more parents are driving. Only a generation ago, children routinely traveled around their neighborhoods either on foot or on bike. Walking and bicycling were common ways to get to school. Today, few children (ages 5 to 18 yr. old) walk or bike. This is a major shift since when most of us were in school.*# And as traffic increases, parents become even more convinced that it is unsafe for their children to walk. They begin driving their children to school, thereby adding even more cars to the morning chaos.*** Note to Instructor: #Here’s a simple demonstration: ask all of the adults in the room who walked or bicycled regularly to school to raise their hands. Now ask how many have children in their lives (sons, daughters, grandchildren, neighbors) who walk or bike to school. There’s likely a large difference. Background: *U.S. Centers for Disease Control and Prevention. Kids Walk-to-School: Then and Now—Barrier and Solutions. Available: http://www.cdc.gov/nccdphp/dnpa/kidswalk/then_and_now.htm Accessed: January 17, 2006. ***National Safety Council. What You Can Do About Car Emissions. Available: www.nsc.org/ehc/mobile/mse_fs.htm#problem. Accessed: January 17, 2006. ***Dubay A. “See Dick and Jane Sit in Traffic,” The Press Democrat, September 7, 2003 cited in Travel and Environmental Implications of School Siting. U.S. Environmental Protection Agency EPA 231-R-03-004. October 2003 Available: http://www.epa.gov/smartgrowth/pdf/school_travel.pdf. Accessed January 20, 2006. Image(s): Natomas Elementary School, Sacramento, CA, Provided by Mark Fenton.
Pharmacies Dry Cleaners Grocery Stores Liquor Stores Bakeries Restaurants Coffee Auto Services Banking Post office Bill Pay
Land use changes obligate transportation changes. As people move out away from their places for work and play, they need giant infrastructure that can handle large numbers of people to bring them back into the places where they work and play.
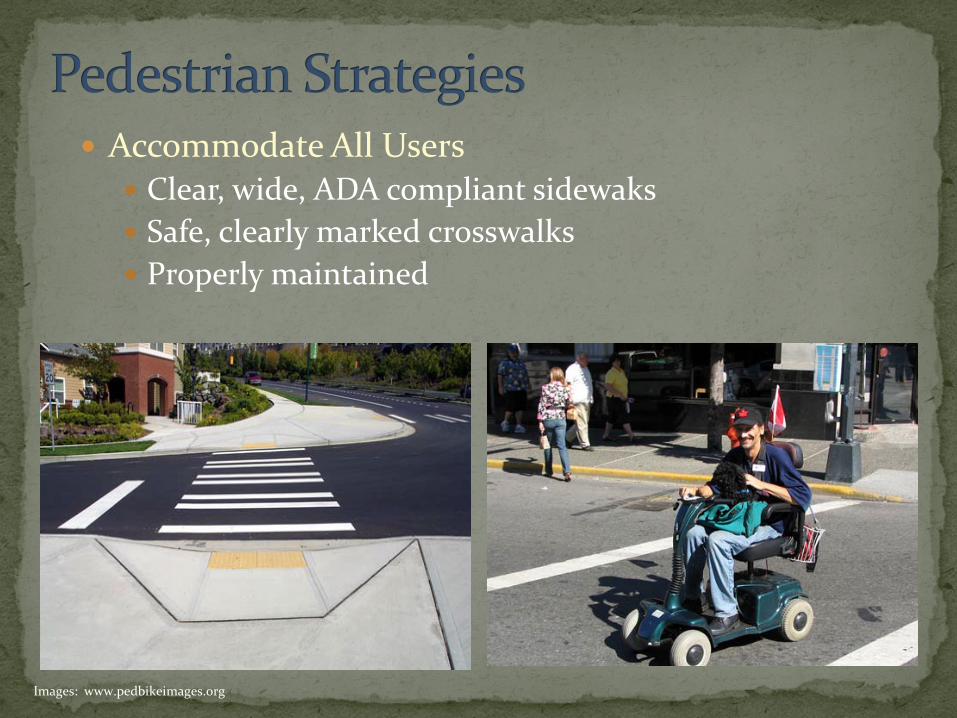
Image: www.pedbikeimages.org
Presenter
Presentation Notes
Street designed to move traffic, not designed for pedestrians, bicyclists, or transit riders. This area has no sidewalks, bike lanes, or appealing transit stops. Roads not designed for pedetrians or bicylists may still have those that use them, putting them in unsafe conditions. Can you spot the person trying to cross the street?
Here is another example where a road designed solely for cars is being used another lane. Note the bicyclist that is forced to ride the wrong way in the street and the desire lines.
Sometimes even when we do design for non-motorized transportation it is still not done so in a manner that encourages walking or bicycling. This sends a signal to the community that walking and biking are not valued forms of transportation
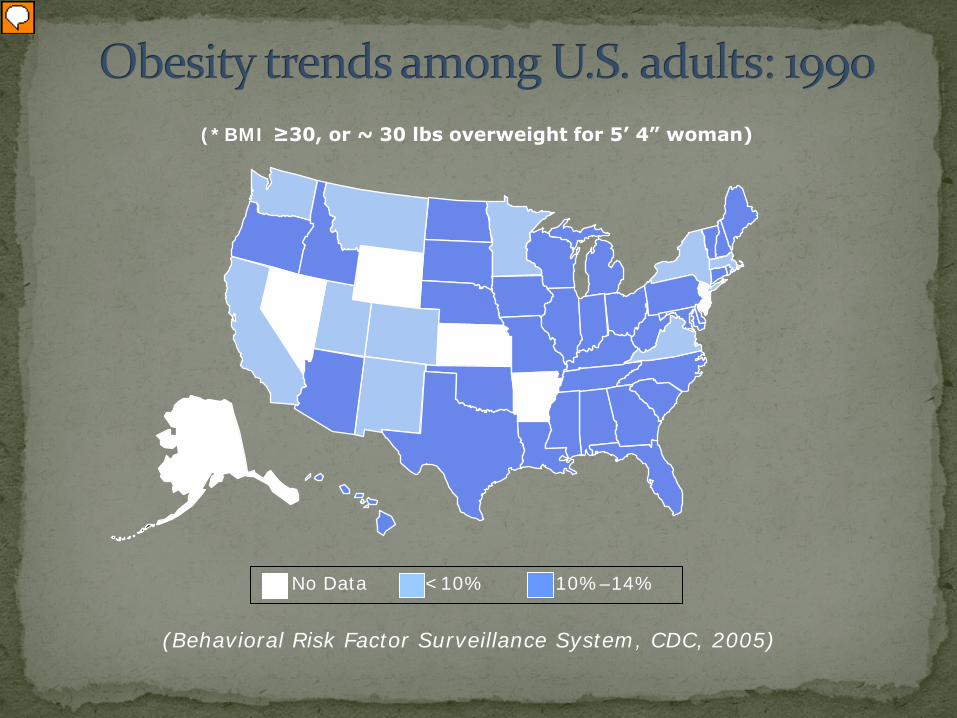
Summary/Message: Portrait of the growth of the obesity epidemic in the US in the last 28 years. Still darker… Note to Instructor: Quickly run through a slides 33 to 53 to show what has happened to adults over the last thirty years. Image(s): “Overweight and Obesity Trends.” Nutrition and Physical Activity Website, CDC, 2004, <http://www.cdc.gov/nccdphp/dnpa/obesity/trend/maps/index.htm>.
(*BMI ≥30, or ~ 30 lbs overweight for 5’ 4” woman)
Presenter
Presentation Notes
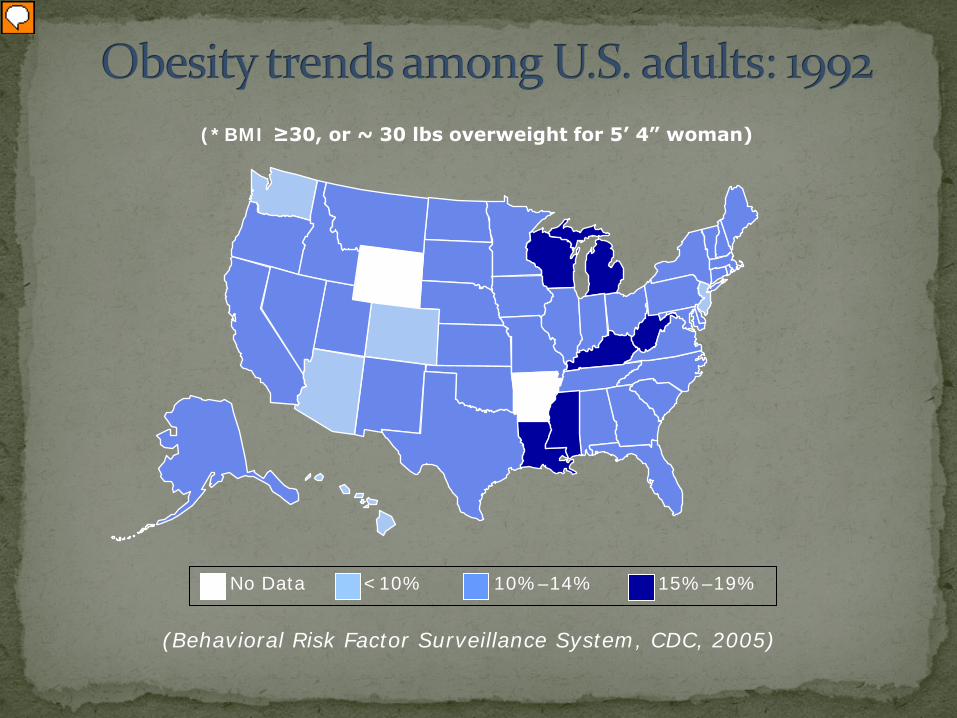
Summary/Message: Portrait of the growth of the obesity epidemic in the US in the last 28 years. Now, we have a new color…dark blue showing states with 15 to 19% of the population is obese. Note to Instructor: Quickly run through a slides 33 to 53 to show what has happened to adults over the last thirty years. Image(s): “Overweight and Obesity Trends.” Nutrition and Physical Activity Website, CDC, 2004, <http://www.cdc.gov/nccdphp/dnpa/obesity/trend/maps/index.htm>.
(*BMI ≥30, or ~ 30 lbs overweight for 5’ 4” woman)
Presenter
Presentation Notes
Summary/Message: Portrait of the growth of the obesity epidemic in the US in the last 28 years. Getting darker… Note to Instructor: Quickly run through a slides 33 to 53 to show what has happened to adults over the last thirty years. Image(s): “Overweight and Obesity Trends.” Nutrition and Physical Activity Website, CDC, 2004, <http://www.cdc.gov/nccdphp/dnpa/obesity/trend/maps/index.htm>.
(*BMI ≥30, or ~ 30 lbs overweight for 5’ 4” woman)
Presenter
Presentation Notes
Summary/Message: Portrait of the growth of the obesity epidemic in the US in the last 28 years. Note to Instructor: Quickly run through a slides 33 to 53 to show what has happened to adults over the last thirty years. Image(s): “Overweight and Obesity Trends.” Nutrition and Physical Activity Website, CDC, 2004, <http://www.cdc.gov/nccdphp/dnpa/obesity/trend/maps/index.htm>.
(*BMI ≥30, or ~ 30 lbs overweight for 5’ 4” woman)
Presenter
Presentation Notes
Summary/Message: Portrait of the growth of the obesity epidemic in the US in the last 28 years. Darker still… Note to Instructor: Quickly run through a slides 33 to 53 to show what has happened to adults over the last thirty years. Image(s): “Overweight and Obesity Trends.” Nutrition and Physical Activity Website, CDC, 2004, <http://www.cdc.gov/nccdphp/dnpa/obesity/trend/maps/index.htm>.
(*BMI ≥30, or ~ 30 lbs overweight for 5’ 4” woman)
Presenter
Presentation Notes
Summary/Message: Portrait of the growth of the obesity epidemic in the US in the last 28 years. Note to Instructor: Quickly run through a slides 33 to 53 to show what has happened to adults over the last thirty years. Image(s): “Overweight and Obesity Trends.” Nutrition and Physical Activity Website, CDC, 2004, <http://www.cdc.gov/nccdphp/dnpa/obesity/trend/maps/index.htm>.
(*BMI ≥30, or ~ 30 lbs overweight for 5’ 4” woman)
Presenter
Presentation Notes
Summary/Message: Portrait of the growth of the obesity epidemic in the US in the last 28 years. Darker… Note to Instructor: Quickly run through a slides 33 to 53 to show what has happened to adults over the last thirty years.. Image(s): “Overweight and Obesity Trends.” Nutrition and Physical Activity Website, CDC, 2004, <http://www.cdc.gov/nccdphp/dnpa/obesity/trend/maps/index.htm>.
(*BMI ≥30, or ~ 30 lbs overweight for 5’ 4” woman)
Presenter
Presentation Notes
Summary/Message: Note that some states are starting to show 20 percent or more of their adult population being overweight. A new color: Yellow, showing states where 1 in 5 18-year-olds and older is obese. Note to Instructor: Quickly run through a slides 33 to 53 to show what has happened to adults over the last thirty years. Image(s): “Overweight and Obesity Trends.” Nutrition and Physical Activity Website, CDC, 2004, <http://www.cdc.gov/nccdphp/dnpa/obesity/trend/maps/index.htm>.
(*BMI ≥30, or ~ 30 lbs overweight for 5’ 4” woman)
Presenter
Presentation Notes
Summary/Message: Here is a portrait of the growth of the obesity epidemic in the US in the last 28 years. Note to Instructor: Quickly run through a slides 33 to 53 to show what has happened to adults over the last thirty years. Image(s): “Overweight and Obesity Trends.” Nutrition and Physical Activity Website, CDC, 2004, <http://www.cdc.gov/nccdphp/dnpa/obesity/trend/maps/index.htm>.
(*BMI ≥30, or ~ 30 lbs overweight for 5’ 4” woman)
Presenter
Presentation Notes
Summary/Message: Here is a portrait of the growth of the obesity epidemic in the US in the last 28 years. Colorado is still hanging on… Note to Instructor: Quickly run through a slides 33 to 53 to show what has happened to adults over the last thirty years. Image(s): “Overweight and Obesity Trends.” Nutrition and Physical Activity Website, CDC, 2004, <http://www.cdc.gov/nccdphp/dnpa/obesity/trend/maps/index.htm>.
(*BMI ≥30, or ~ 30 lbs overweight for 5’ 4” woman)
Presenter
Presentation Notes
Summary/Message: In 2001, we see the first state where 1 out of 4 adults are around 30 pounds overweight. A new color Colorado is still hanging on… Note to Instructor: Quickly run through a slides 33 to 53 to show what has happened to adults over the last thirty years. Image(s): “Overweight and Obesity Trends.” Nutrition and Physical Activity Website, CDC, 2004, <http://www.cdc.gov/nccdphp/dnpa/obesity/trend/maps/index.htm>.
(*BMI ≥30, or ~ 30 lbs overweight for 5’ 4” woman)
Presenter
Presentation Notes
Summary/Message: By 2003, we are adding more and more red and yellow states to the map. Note to Instructor: Quickly run through a slides 33 to 53 to show what has happened to adults over the last thirty years. Image(s): “Overweight and Obesity Trends.” Nutrition and Physical Activity Website, CDC, 2004, <http://www.cdc.gov/nccdphp/dnpa/obesity/trend/maps/index.htm>.
(*BMI ≥30, or ~ 30 lbs overweight for 5’ 4” woman)
Presenter
Presentation Notes
Summary/Message: By 2005, we see a new color, dark red—representing that between 30%-34% of population are classified as obese. Note to Instructor: Quickly run through a slides 33 to 53 to show what has happened to adults over the last thirty years. Image(s): “Overweight and Obesity Trends.” Nutrition and Physical Activity Website, CDC, 2005, <http://www.cdc.gov/nccdphp/dnpa/obesity/trend/maps/index.htm>.
Pedestrian Infrastructure Bicycle Infrastructure Transit Accommodations Community Gardens City Parks
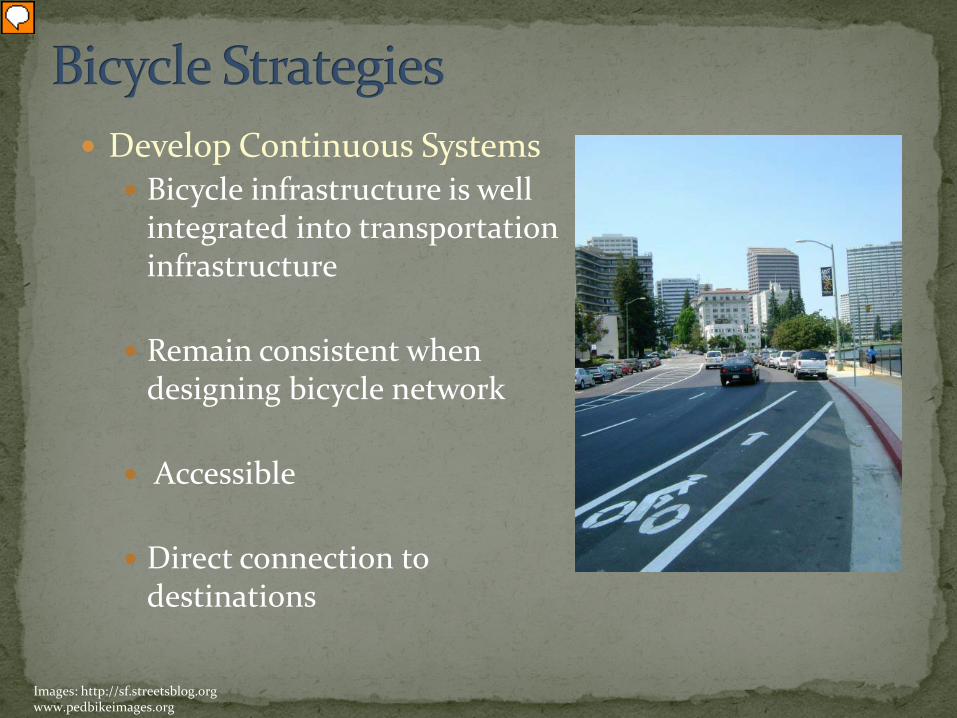
Lake Merrit, SF This is a known issue and I'm working on it diligently. We also discussed the matter at the City of Oakland's Bicycle and Pedestrian Advisory Committee meeting last Thursday. The bike lane should end at the point where there is insufficient width for the bike lane. To mark the transition, the last 100' of bike lane stripe will be a skip stripe (Detail 39A) and then two sharrows will follow the end of the bike lane to establish bicyclists' positioning in the travel lane.
Black lines show 1990 bikeway network...
…Colors show 1990 mode splits (by census tract)
0 - 2%
2 - 3%3 - 5%
5 - 8%
8 - 10%10+%
Bike Commute Mode Split
Portland, Oregon 1990
City of Portland
Dept. of Transportation
Portland, Oregon 2000
Black lines show 2000 bikeway network...
…Colors show 2000 mode splits (by census tract)
0 - 2%
2 - 3%3 - 5%
5 - 8%
8 - 10%10+%
Bike Commute Mode Split
City of Portland
Dept. of Transportation
Increase Safety Through Efficient Design Bicycle infrastructure flows well through intersections
We at the ACGA have a broad definition of what a community garden entails. It can be urban, suburban, or rural. It can grow flowers, vegetables or community. It can be one community plot, or can be many individual plots. It can be at a school, hospital, or in a neighborhood. It can also be a series of plots dedicated to "urban agriculture" where the produce is grown for a market.
Benefits Improved quality of life Promotes community development Creates community interaction Encourages self-reliance Neighborhood beautification Access to nutritious food Reduction of family food budget Conservation of resources Reduction of crime in the neighborhood Preservation of green space Reduction of urban heat island effect Creates opportunity for exercise, education, relaxation
www.communitygarden.org
Presenter
Presentation Notes
We at the ACGA have a broad definition of what a community garden entails. It can be urban, suburban, or rural. It can grow flowers, vegetables or community. It can be one community plot, or can be many individual plots. It can be at a school, hospital, or in a neighborhood. It can also be a series of plots dedicated to "urban agriculture" where the produce is grown for a market.
Types Town Centers Waterfronts Greenways Pocket Parks
We at the ACGA have a broad definition of what a community garden entails. It can be urban, suburban, or rural. It can grow flowers, vegetables or community. It can be one community plot, or can be many individual plots. It can be at a school, hospital, or in a neighborhood. It can also be a series of plots dedicated to "urban agriculture" where the produce is grown for a market.
Approaches include: Policies (comprehensive plan, complete streets) Separate health-related plan Codes and ordinancesDesign standards LEED-NDHealth impact assessmentsHealth indicators
What is it? Long-range plan that lays out community’s vision in
terms of goals and strategies. Protects public health, safety, and welfare.
Two basic approaches: Full comp. plan update Text amendments
Presenter
Presentation Notes
Full Comp. Plan Update: Evaluate entire plan for health elements and ensure health is included in each section (transportation, economy, environment, etc…). Text Amendments: Include policies for non-motorized transportation, add section on mitigating impervious surfaces, or add air-quality element.
Examples: King County, WA Promote urban centers and mixed-use projects. Increase availability and improve comfort and
attractiveness of taking transit, ridesharing, walking, and bicycling.
Mission, KS Maintain and preserve existing open space and natural
features to enhance character of built environment; promote neighborhood stability, public health and safety; and provide for outdoor recreation and visual enjoyment.
Plan for multimodal transportation citywide.
Presenter
Presentation Notes
King County: Public health objectives are integrated throughout plan, particularly in “Urban Communities” and “Transportation” chapters. Other health-related issues are addressed (air quality and water quality), but physical activity is focus. Promote public health by increasing opportunities for every resident to be more physically active. Mission: Existing open space goal Overall, the planning approach advocated in these various plans and policies is virtually indistinguishable from approaches often labeled smart growth, sustainable development, livable communities, energy-efficient design, or new urbanism. As such, it is basically good planning for providing residents with options for where they live and work, and being efficient in terms of resources.
A complete streets policy ensures that the entire right-of-way is routinely designed and operated to enable safe access for all users.
What is a Complete Streets Policy?
Image http://www.sightline.org
Specify exceptions Require high-level approval of exceptions Use best design standards Allow flexibility in balancing user needs Apply to all phases of all projects Provide direction for how to promote the use of alternative
transportation Marketing Parking management Incentives for non-drivers Costs for drivers
The Best Complete Streets Policies…
Institutionalize Restructure procedures Rewrite design manuals Retrain planners and engineers Retool measures to track outcomes
Retrofit Identify and improve incomplete streets
Complete Street Policies: 2 Steps
“The safety and convenience of all users of the transportation system, including pedestrians, bicyclists, transit users, freight, and motor vehicle drivers, shall be accommodated and balanced in all transportation and development projects and through all phases of a project so that even the most vulnerable - children, elderly, and persons with disabilities - can travel safely within the public right-of-way.”
City of Chicago Complete Streets Policy:
What is it? Thematic plan that goes beyond scope of required
comprehensive plan content and elements. Often influences decisions made in overarching
comprehensive plan and adopted as extension of comprehensive plan.
Example: Fremantle, Western Australia’s Physical Activity Strategic
Plan Provides framework and objectives to help city plan, develop,
implement, and evaluate physical activity programs and services.
Presenter
Presentation Notes
e.g. downtown plans, historic preservation plans, habitat protection plans. In response to the PASP, Physical Activity Impact Assessment Framework was developed, to be used in conjunction with development and redevelopment projects. In addition to focusing on development impacts, Fremantle also launched a series of educational programs. Within three years, it developed the following programs: a walking program that centered on a 10,000- step challenge with neighborhood businesses; a travel-smart guide that included a map of Fremantle with various physical activity opportunities (open space, public transit routes, etc.); and a bike program where the City gave bikes to people if they used them for a specific period of time. These various implementation efforts demonstrated that Fremantle was determined to take its separate health plan and embed it within various City initiatives.
What are they? Implement policies of
comprehensive plan. Regulatory.
Example: Seattle’s Land Use Code provides for pedestrian district overlays
in commercial zones. Intended to preserve and encourage pedestrian-oriented retail areas.
Liberty, MO’s Unified Development Ordinance requires that all residential development projects dedicate land or equivalent fee-in-lieu dedication for public parks and open space.
Presenter
Presentation Notes
Often traditional health-related issues are listed as a separate code in a city’s code of ordinances. Restaurants, swimming pools, dumps, etc… would be included in separate health code. KCMO adopted urban agriculture ordinance this year to promote residential neighborhood food production Zoning Ordinance and Subdivision Regulations specify whether bicycle parking is required, whether sidewalks are required, how wide the sidewalks are, whether open space is required to be set aside, whether compact mixed use zoning is allowed and where, etc… for both new development and redevelopment – very important documents. Incremental development projects can have big impact on whether our cities are designed to promote active and healthy living.
What are they? Serve as reference and resource, clarifying what is
Provides articulated vision of how different street types canbe retrofitted in accordance with city policies.
Presenter
Presentation Notes
Greensboro, North Carolina’s Design Guidelines East Market Street. Elements such as façade design, building orientation, and bicycle and pedestrian connections are outlined to create a pedestrian-friendly environment.
Could combine several of these approaches, ideally following comprehensive plan amendments with relevant ordinance revisions.
LEED-ND is rating system that integrates principles of smart growth, new urbanism, and green building into first national standard for neighborhood design.
Could contribute to the following health benefits: Reduced risk of obesity, heart disease, and hypertension by
integrating physical activities as daily part of resident’s lives. Reduced risk of asthma and other respiratory diseases,
contributions to climate change from air pollution, and injuries from motor vehicles.
Increased socially equitable and socially engaging communities. Improved mental health of the community. Reduced risk of cancer and other chronic diseases.
Presenter
Presentation Notes
LEED for Neighborhood Development (LEED-ND) proposed community design standards offer numerous public health benefits according to Centers for Disease Control and Prevention. Further research is needed to find out if residents are healthier and more active as a result of living in a LEED-ND certified neighborhood.
What is it? Tool by which policies, plans or projects may be judged as
to their potential effects on health.
Used to objectively evaluate potential health effects of project or policy before built or implemented.
Can provide recommendations to increase positive health outcomes and minimize adverse health outcomes.
Voluntary or regulatory process that focuses on health outcomes such as obesity, physical inactivity, asthma, injuries, and social equity.
Presenter
Presentation Notes
Can be integrated with environmental impact assessments.
Example San Francisco: Zoning Request for New Housing
Development Near Congested RoadwayHIA completed by San Francisco Department of
Public Health in collaboration with Planning Dept.Impact: Air modeling showed air pollution “hot
spots” closest to major roadway. Outcome: New buildings required to include
particulate air filtration.
Presenter
Presentation Notes
Accessibility: Focus less on automobile users and more on bicyclists, pedestrians, and transit riders. Air Quality: From a planning perspective, automobile emissions are key area of concern. Environment and Housing Quality: Exposure to pollutants can be unpredictable, but in some cases can be affected by land-use decisions and building codes. Food: Access to nutritious food is emerging as important planning issue involving topics from supermarket and restaurant locations to providing space for community gardens Mental Health: Vegetated environments have positive effects on physiological measures, such as heart rate, skin conductance, muscle tension, and blood pressure. Physical Activity: Build environments to create opportunities for physical activity from parks and open space to sidewalks and land use.. • Safety: Design for safety of all ages and transportation modes. • Social Capital: One’s social network or sense of attachment to one’s community. Mixed use, walkable urban areas increase social capital. • Water Quality: Protecting surface and groundwater,
Percent adults obese Childhood and adult asthma prevalence Childhood and adult asthma hospitalization Motor vehicle injuries Diabetes prevalence Air Quality Water Quality
Presenter
Presentation Notes
set of indicators measuring the health of residents. provides a broad array of comprehensive, population-based data to community-based organizations, community health centers, public agencies, policymakers and the general public.
Transportation plan links future transportation decisions to health-related goals.
Health impact assessment (HIA) is incorporated into plan.
Created position of active living director as distinct role with its own responsibilities within city government (Active Living Division).
City goal of ensuring convenient access to affordable fresh fruits and vegetables through community gardens.
Presenter
Presentation Notes
Atlanta metro area 18,986 population All fourth-graders get bicycle safety training. Heavy investments to ensure easy pedestrian access and transit connections for residents who rely on subway and buses. Plan rates intersections and streets for pedestrians and bicycles.
Centers for Disease Control and Prevention -www.cdc.gov/healthyplaces
U.S. Green Building Council -www.usgbc.org/ShowFile.aspx?DocumentID=1736
LEED for Neighborhood Development home page -www.usgbc.org/leed/nd
Active Living By Design - www.activelivingbydesign.org
National Complete Streets Coalition - www.completestreets.org
Walkability Checklist - www.walking info.org
Bikeability Checklist - www.bicyclinginginfo.org
Presenter
Presentation Notes
LEED-ND Understanding the Relationship Between Public Health and the Built Environment -