list of wti indicators - world banksiteresources.worldbank.org/intranettrade/resources/239054... ·...
TRANSCRIPT
World Trade Indicators 2009/10 Page 1
List of WTI Indicators
WTI PILLARS BY CATEGORIES
PILLAR 1 - TRADE POLICY 1-Trade Restrictiveness Indices (TRIs)
2-MFN Applied Tariff (AV + AVE)
3-MFN Applied Tariff (AV-only)
4-Applied Tariff including preferences
5-Tariff escalation
6-MFN-0 Tariff Lines / Import Value
7-Tariff Peaks
8-Tariff Bounds / Overhang
9-Non-Ad Valorem Tariffs
10-Non-Tariff Measures
11-Customs Duties
12-Contingency Protection - Trade Remedy
13-Export Restrictions
14-Services Policy
PILLAR 2 - EXTERNAL ENVIRONMENT 1-Market Access - Trade Restrictiveness Indices (MA-TRIs)
2-Rest-of-the-World Applied Tariffs (including. prefs.)
3-Contingency Protection - Trade Remedy Faced
4-MFN-0 Export Value
5-Preferential Trade
6-Exchange Rates
7-Commodity Prices

World Trade Indicators 2009/10 Page 2
PILLAR 3 - INSTITUTIONAL ENVIRONMENT 1-Ease of Doing Business
2-Worldwide Governance Indicators (WGI)
PILLAR 4 - TRADE FACILITATION 1-Logistic Performance Index and its indicators
2-Trading Across Borders - Doing Business
3-Transportation
4-Information and Communication Technologies
5-Trade Finance
6-Other Variables
PILLAR 5 - TRADE OUTCOME 1-Real growth in trade
2-Nominal growth in trade
3-Trade Composition (share of goods and services)
4-Trade Composition (share of goods, share of services)
5-Trade integration (% GDP)
6-Trade Balances
7-Shares of World Trade
8-Growth in Shares of World Trade
9-Product and Market Diversification
10-Tourism, FDI, and Remittances
11-Other Variables
World Trade Indicators 2009/10 Page 3
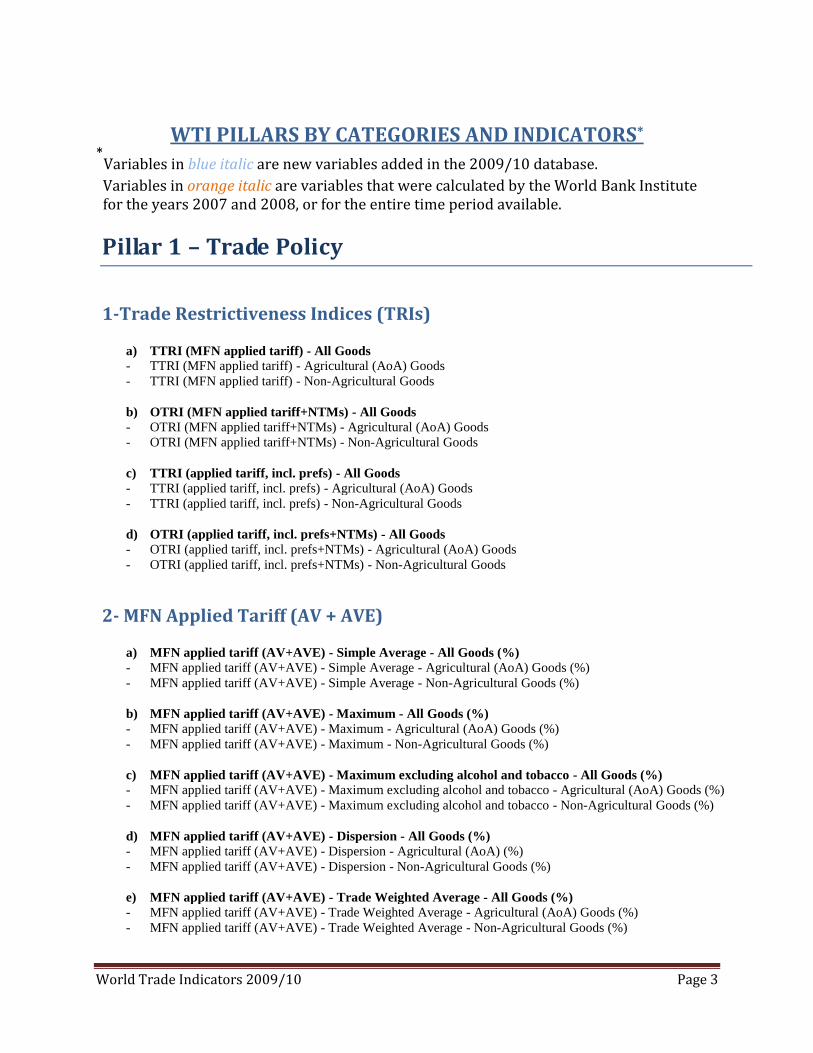
WTI PILLARS BY CATEGORIES AND INDICATORS*
*Variables in blue italic are new variables added in the 2009/10 database.
Variables in orange italic are variables that were calculated by the World Bank Institute for the years 2007 and 2008, or for the entire time period available.
Pillar 1 – Trade Policy
1-Trade Restrictiveness Indices (TRIs)
a) TTRI (MFN applied tariff) - All Goods
- TTRI (MFN applied tariff) - Agricultural (AoA) Goods
- TTRI (MFN applied tariff) - Non-Agricultural Goods
b) OTRI (MFN applied tariff+NTMs) - All Goods
- OTRI (MFN applied tariff+NTMs) - Agricultural (AoA) Goods
- OTRI (MFN applied tariff+NTMs) - Non-Agricultural Goods
c) TTRI (applied tariff, incl. prefs) - All Goods
- TTRI (applied tariff, incl. prefs) - Agricultural (AoA) Goods
- TTRI (applied tariff, incl. prefs) - Non-Agricultural Goods
d) OTRI (applied tariff, incl. prefs+NTMs) - All Goods
- OTRI (applied tariff, incl. prefs+NTMs) - Agricultural (AoA) Goods
- OTRI (applied tariff, incl. prefs+NTMs) - Non-Agricultural Goods
2- MFN Applied Tariff (AV + AVE)
a) MFN applied tariff (AV+AVE) - Simple Average - All Goods (%)
- MFN applied tariff (AV+AVE) - Simple Average - Agricultural (AoA) Goods (%)
- MFN applied tariff (AV+AVE) - Simple Average - Non-Agricultural Goods (%)
b) MFN applied tariff (AV+AVE) - Maximum - All Goods (%)
- MFN applied tariff (AV+AVE) - Maximum - Agricultural (AoA) Goods (%)
- MFN applied tariff (AV+AVE) - Maximum - Non-Agricultural Goods (%)
c) MFN applied tariff (AV+AVE) - Maximum excluding alcohol and tobacco - All Goods (%)
- MFN applied tariff (AV+AVE) - Maximum excluding alcohol and tobacco - Agricultural (AoA) Goods (%)
- MFN applied tariff (AV+AVE) - Maximum excluding alcohol and tobacco - Non-Agricultural Goods (%)
d) MFN applied tariff (AV+AVE) - Dispersion - All Goods (%)
- MFN applied tariff (AV+AVE) - Dispersion - Agricultural (AoA) (%)
- MFN applied tariff (AV+AVE) - Dispersion - Non-Agricultural Goods (%)
e) MFN applied tariff (AV+AVE) - Trade Weighted Average - All Goods (%)
- MFN applied tariff (AV+AVE) - Trade Weighted Average - Agricultural (AoA) Goods (%)
- MFN applied tariff (AV+AVE) - Trade Weighted Average - Non-Agricultural Goods (%)
World Trade Indicators 2009/10 Page 4
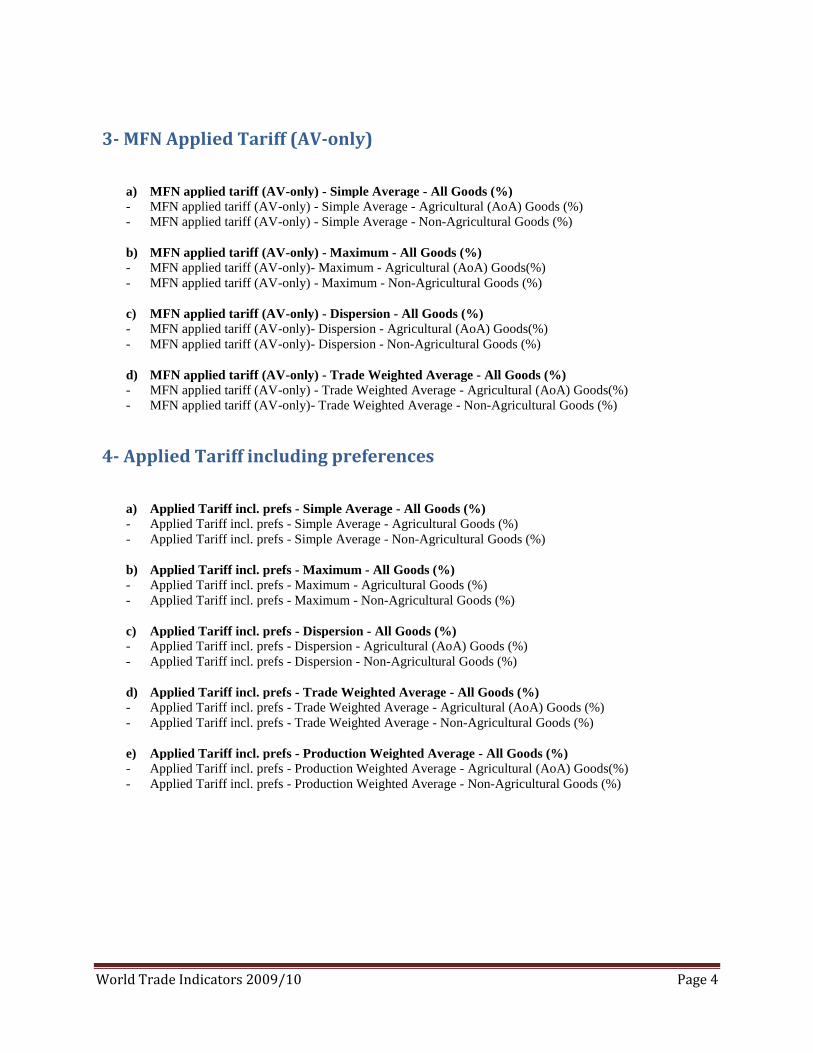
3- MFN Applied Tariff (AV-only)
a) MFN applied tariff (AV-only) - Simple Average - All Goods (%)
- MFN applied tariff (AV-only) - Simple Average - Agricultural (AoA) Goods (%)
- MFN applied tariff (AV-only) - Simple Average - Non-Agricultural Goods (%)
b) MFN applied tariff (AV-only) - Maximum - All Goods (%)
- MFN applied tariff (AV-only)- Maximum - Agricultural (AoA) Goods(%)
- MFN applied tariff (AV-only) - Maximum - Non-Agricultural Goods (%)
c) MFN applied tariff (AV-only) - Dispersion - All Goods (%)
- MFN applied tariff (AV-only)- Dispersion - Agricultural (AoA) Goods(%)
- MFN applied tariff (AV-only)- Dispersion - Non-Agricultural Goods (%)
d) MFN applied tariff (AV-only) - Trade Weighted Average - All Goods (%)
- MFN applied tariff (AV-only) - Trade Weighted Average - Agricultural (AoA) Goods(%)
- MFN applied tariff (AV-only)- Trade Weighted Average - Non-Agricultural Goods (%)
4- Applied Tariff including preferences
a) Applied Tariff incl. prefs - Simple Average - All Goods (%)
- Applied Tariff incl. prefs - Simple Average - Agricultural Goods (%)
- Applied Tariff incl. prefs - Simple Average - Non-Agricultural Goods (%)
b) Applied Tariff incl. prefs - Maximum - All Goods (%)
- Applied Tariff incl. prefs - Maximum - Agricultural Goods (%)
- Applied Tariff incl. prefs - Maximum - Non-Agricultural Goods (%)
c) Applied Tariff incl. prefs - Dispersion - All Goods (%)
- Applied Tariff incl. prefs - Dispersion - Agricultural (AoA) Goods (%)
- Applied Tariff incl. prefs - Dispersion - Non-Agricultural Goods (%)
d) Applied Tariff incl. prefs - Trade Weighted Average - All Goods (%)
- Applied Tariff incl. prefs - Trade Weighted Average - Agricultural (AoA) Goods (%)
- Applied Tariff incl. prefs - Trade Weighted Average - Non-Agricultural Goods (%)
e) Applied Tariff incl. prefs - Production Weighted Average - All Goods (%)
- Applied Tariff incl. prefs - Production Weighted Average - Agricultural (AoA) Goods(%)
- Applied Tariff incl. prefs - Production Weighted Average - Non-Agricultural Goods (%)

World Trade Indicators 2009/10 Page 5
5- Tariff escalation
a) MFN Applied tariff escalation (diff, finished-raw) - All Goods (%)
- MFN Applied tariff escalation (diff, finished-raw) - Agricultural (AoA) Goods(%)
- MFN Applied tariff escalation (diff, finished-raw) - Non-Agricultural Goods (%)
b) MFN Applied tariff escalation (%change, finished-raw) - All Goods (%)
- MFN Applied tariff escalation (%change, finished-raw) - Agricultural (AoA) Goods(%)
- MFN Applied tariff escalation (%change, finished-raw) - Non-Agricultural Goods (%)
6- MFN-0 Tariff Lines / Import Value
a) Share of Tariff Lines with MFN-0 - All Goods (%)
- Share of Tariff Lines with MFN-0 - Agricultural (AoA) (%)
- Share of Tariff Lines with MFN-0 - Non-Agricultural Goods (%)
b) MFN-0 Import Value (% Total Imports) - All Goods
- MFN-0 Import Value (% Total Imports) - Agricultural (AoA) Goods
- MFN-0 Import Value (% Total Imports) - Non-Agricultural Goods
7- Tariff Peaks
a) Share of Tariff Lines with Domestic Peaks - All Goods (%)
- Share of Tariff Lines with Domestic Peaks - Agricultural (AoA) Goods (%)
- Share of Tariff Lines with Domestic Peaks - Non-Agricultural Goods (%)
b) Share of Tariff Lines with International Peaks - All Goods (%)
- Share of Tariff Lines with International Peaks - Agricultural (AoA) Goods (%)
- Share of Tariff Lines with International Peaks - Non-Agricultural Goods (%)
8- Tariff Bounds / Overhang
a) Share of Tariff Lines Bound - All Goods (%)
- Share of Tariff Lines Bound - Agricultural (AoA) Goods (%)
- Share of Tariff Lines Bound - Non-Agricultural Goods (%)
b) Total Overhang - All Goods (%)
- Total Overhang - Agricultural (AoA) Goods (%)
- Total Overhang - Non-Agricultural Goods (%)
World Trade Indicators 2009/10 Page 6
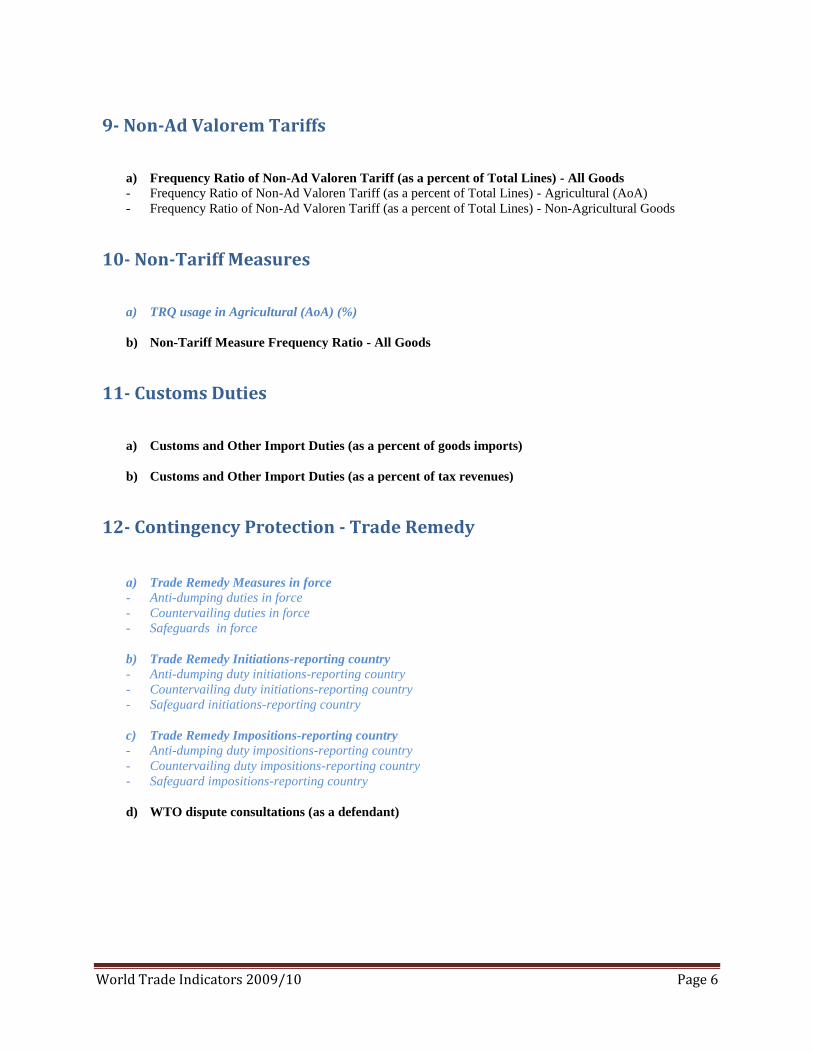
9- Non-Ad Valorem Tariffs
a) Frequency Ratio of Non-Ad Valoren Tariff (as a percent of Total Lines) - All Goods
- Frequency Ratio of Non-Ad Valoren Tariff (as a percent of Total Lines) - Agricultural (AoA)
- Frequency Ratio of Non-Ad Valoren Tariff (as a percent of Total Lines) - Non-Agricultural Goods
10- Non-Tariff Measures
a) TRQ usage in Agricultural (AoA) (%)
b) Non-Tariff Measure Frequency Ratio - All Goods
11- Customs Duties
a) Customs and Other Import Duties (as a percent of goods imports)
b) Customs and Other Import Duties (as a percent of tax revenues)
12- Contingency Protection - Trade Remedy
a) Trade Remedy Measures in force
- Anti-dumping duties in force
- Countervailing duties in force
- Safeguards in force
b) Trade Remedy Initiations-reporting country
- Anti-dumping duty initiations-reporting country
- Countervailing duty initiations-reporting country
- Safeguard initiations-reporting country
c) Trade Remedy Impositions-reporting country
- Anti-dumping duty impositions-reporting country
- Countervailing duty impositions-reporting country
- Safeguard impositions-reporting country
d) WTO dispute consultations (as a defendant)

World Trade Indicators 2009/10 Page 7
13- Export Restrictions
a) Export taxes (as a percent of goods exports)
b) Export taxes (as a percent of tax revenues)
c) Export license usage
d) Export tax usage
e) Presence of export surrender requirements
f) Presence of export repatriation requirements
14- Services Policy
a) GATS commitments restrictiveness index - all service sectors
- GATS commitments restrictiveness index - market access
- GATS commitments restrictiveness index - national treatment
- GATS commitments restrictiveness index - business services
- GATS commitments restrictiveness index - communication services
- GATS commitments restrictiveness index - construction/engineering services
- GATS commitments restrictiveness index - distribution services
- GATS commitments restrictiveness index - educational services
- GATS commitments restrictiveness index - environmental services
- GATS commitments restrictiveness index - financial services
- GATS commitments restrictiveness index - health/social services
- GATS commitments restrictiveness index - tourism/travel services
- GATS commitments restrictiveness index - recreational/cultural services
- GATS commitments restrictiveness index - transport services
- GATS commitments restrictiveness index - other services
b) USITC Banking GATS commitment Index
c) ITU foreign participation/ownership in telecom sector (%)
d) ITU competition index in telecom sector

World Trade Indicators 2009/10 Page 8
Pillar 2 – External Environment
1- Market Access - Trade Restrictiveness Indices (MA-TRIs)
a) MA-TTRI (applied tariff incl. prefs.) - All Goods
- MA-TTRI (applied tariff incl. prefs.) - Agricultural (AoA) Goods
- MA-TTRI (applied tariff incl. prefs.) - Non-Agricultural Goods
b) MA-OTRI (applied tariff incl. prefs.+NTMs) - All Goods
- MA-OTRI (applied tariff incl. prefs.+NTMs) - Agricultural (AoA) Goods
- MA-OTRI (applied tariff incl. prefs.+NTMs) - Non-Agricultural Goods
2- Rest-of-the-World Applied Tariffs (including. prefs)
a) ROW Applied Tariff (incl. prefs) - Simple Average - All Goods (%)
- ROW Applied Tariff (incl. prefs) - Simple Average - Agricultural (AoA) Goods (%)
- ROW Applied Tariff (incl. prefs) - Simple Average - Non-Agricultural Goods (%)
b) ROW Applied Tariff (incl. prefs) - Maximum - All Goods (%)
- ROW Applied Tariff (incl. prefs) - Maximum - Agricultural (AoA) Goods (%)
- ROW Applied Tariff (incl. prefs) - Maximum - Non-Agricultural Goods (%)
c) ROW Applied Tariff (incl. prefs) - Dispersion - All Goods (%)
- ROW Applied Tariff (incl. prefs) - Dispersion - Agricultural (AoA) Goods (%)
- ROW Applied Tariff (incl. prefs) - Dispersion - Non-Agricultural Goods (%)
d) ROW Applied Tariff (incl. prefs) - Trade Weighted Average - All Goods (%)
- ROW Applied Tariff (incl. prefs) - Trade Weighted Average - Agricultural (AoA) Goods (%)
- ROW Applied Tariff (incl. prefs) - Trade Weighted Average - Non-Agricultural Goods (%)

World Trade Indicators 2009/10 Page 9
3- Contingency Protection - Trade Remedy Faced
a) Trade remedy initiations faced-exporting country
- Anti-dumping duty initiations faced-exporting country
- Countervailing duty initiations faced-exporting country
b) Trade Remedy Impositions faced-exporting country
- Anti-dumping duty impositions faced-exporting country
- Countervailing duty impositions faced-exporting country
c) WTO dispute consultations (as a complainant)
4- MFN-0 Export Value
a) MFN-0 export value (% total exports) - All Goods
- MFN-0 Export Value (% total exports) - Agricultural (AoA) Goods
- MFN-0 Export Value (% total exports) - Non-Agricultural Goods
5- Preferential Trade
a) No. of FTAs / CUs - Goods and Services
- No. of FTAs / CUs - Goods
- No. of FTAs / CUs – Services
b) Preferential exports (EU+US) take-up rate (%)
- Preferential exports (EU-only) take-up rate (%)
- Preferential exports (US-only) take-up rate (%)
c) Preferences (EU+US) utilization rate (%, actual/potential value)
- Preferences (EU-only) utilization rate (%, actual/potential value)
- Preferences (US-only) utilization rate (%, actual/potential value)
d) Preferences (EU+US) actual value (% of beneficiary country exports to US and EU)
- Preferences (EU-only) actual value (% of beneficiary country exports to EU)
- Preferences (US-only) actual value (% of beneficiary country exports to US)
e) Share of trade with FTA/CU partners - Exports (%)
f) Share of trade with FTA/CU partners - Imports (%)

World Trade Indicators 2009/10 Page 10
6- Exchange Rates
a) Real Effective Exchange Rate (REER) trade weighted - (%change, +=appreciation)
b) Nominal Effective Exchange Rate (%change, + = appreciation)
c) Growth in US Dollar Exchange Rate (%change, + = appreciation)
7- Commodity Prices
a) Growth in energy commodity price index (%)
- Crude oil, avg, spot price (US$/bbl)
b) Growth in non-energy commodity price index (%)
- Growth in agriculture price index (%)
-Growth in beverages price index (%)
- Growth in food price index (%)
-Growth in fats and oils price index (%)
-Growth in grains price index (%)
-Growth in other food price index (%)
- Growth in raw materials price index (%)
-Growth in timber price index (%)
-Growth in other raw materials price index (%)
- Growth in fertilizers price index (%)
- Growth in metals and minerals price index (%)
- Gold price (US$/toz)

World Trade Indicators 2009/10 Page 11
Pillar 3 – Institutional environment
1- Ease of Doing Business
a) Ease of Doing Business - Rank
- Doing Business - Starting a Business - Rank
- Doing Business - Closing a Business - Rank
- Doing Business - Enforcing Contracts - Rank
2- Worldwide Governance Indicators (WGI)
a) Government Effectiveness - WGI
b) Regulatory Quality - WGI
c) Rule of Law - WGI
d) Control of Corruption - WGI
e) Political Stability / Absence of Terrorism – WGI

World Trade Indicators 2009/10 Page 12
Pillar 4 – Trade Facilitation
1-Logistic Performance Index and its indicators
a) LPI - Overall
- LPI - Efficiency of customs and other border procedures
- LPI - Quality of transport and IT infrastructures
- LPI - International transport costs
- LPI - Logistics competence
- LPI - Trackability of shipments
- LPI - Domestic transportation costs
- LPI - Timeliness of shipments
2- Trading Across Borders - Doing Business
a) DB - Trading across borders rank
- DB - No. of documents for export
- DB - Days for export
- DB - Cost to export (US$ per container)
- DB - No. of documents for import
- DB - Days for import
- DB - Cost to import (US$ per container)
3- Transportation
a) UNCTAD - Liner shipping connectivity index
b) Baltic Exchange Dry Index
c) Port Container Traffic (TEU twenty foot equivalent units)
d) Air freight (million tons km)
e) Total Freight Costs to US (% of import value)
f) Air Freight Costs to US (% of import for consumption value)
g) Air freight costs from US - DHL, 1 lbs
World Trade Indicators 2009/10 Page 13
4- Information and Communication Technologies
a) Mobile and fixed-line telephone subscribers (per 100 people)
b) Average cost of 3-minute call to US (US$)
c) Population covered by mobile cellular network (%)
d) Personal computers (per 100 people)
e) Internet users (per 100 people)
f) Internet subscribers (per 100 people)
5- Trade Finance
a) Export credit - insured exposures (US$ million)
- Export credit insured exposures - short term (US$ million)
b) Export credit - insured exposures (% Goods Exports)
- Export credit insured exposures - short term (% Goods Exports)
6- Other Variables
a) Pump price for diesel fuel (US$ per liter)
b) Electricity cost for industry (US$ per kilowatt hour)
c) Secondary gross school enrollment (%)
d) Tertiary gross school enrollment (%)

World Trade Indicators 2009/10 Page 14
Pillar 5 – Trade Outcome
1- Real growth in trade
a) Real growth in total trade (g+s,%)
- Real growth in goods trade (%)
- Real growth in services trade (%)
b) Real growth in total exports (g+s, %)
- Real growth in goods exports (%)
- Real growth in services exports (%)
c) Real growth in total imports (g+s, %)
- Real growth in goods imports (%)
- Real growth in services imports (%)
2-Nominal growth in trade
a) Nominal growth in total trade (g+s, %)
- Nominal growth in goods trade (%)
- Nominal growth in services trade (%)
b) Nominal growth in total exports (g+s, %)
- Nominal growth in goods exports (BOP, %)
-Nominal growth in agricultural exports (NA, %)
-Nominal growth in food exports (NA, %)
- Nominal growth in non-agricultural exports (NA goods export minus agri, %)
- Nominal growth in manufactured exports (NA, %)
- Nominal growth in fuels exports (NA, %)
-Nominal growth in ores and metals exports (NA, %)
- Nominal growth in services exports (%)
-Nominal growth in transport exports (%)
-Nominal growth in travel exports (%)
-Nominal growth in other commercial services exports (%)
-Nominal growth in financial exports (%)
- Nominal growth in computer and information exports (%)
- Nominal growth in "other business services" exports (%)
-Nominal growth in government services exports (%)
World Trade Indicators 2009/10 Page 15
c) Nominal growth in total imports (g+s, %)
- Nominal growth in goods imports (BOP, %)
-Nominal growth in agricultural imports (NA, %)
-Nominal growth in food imports (NA, %)
-Nominal growth in non-agricultural imports (NA goods imports minus agri, %)
-Nominal growth in manufactured imports (NA, %)
-Nominal growth in fuels imports (NA, %)
- Nominal growth in ores and metals imports (NA, %)
- Nominal growth in services imports (%)
-Nominal growth in transport imports (%)
-Nominal growth in travel imports (%)
-Nominal growth in other commercial services imports (%)
-Nominal growth in financial imports (%)
-Nominal growth in computer and information imports (%)
-Nominal growth in "other business services" imports (%)
-Nominal growth in government services imports (%)
3-Trade Composition (share of goods and services)
a) Goods trade share of total trade (g+s, %)
b) Services trade share of total trade (g+s, %)
c) Goods exports share of total exports (g+s, %)
- Agricultural exports share of total exports (g+s, %)
-Food exports share of total exports (g+s, %)
- Non-agricultural exports share of total exports (g+s, %)
-Manufactures exports share of total exports (g+s, %)
-Fuels exports share of total exports (g+s, %)
-Ores and metals exports share of total exports (g+s, %)
d) Services exports share of total exports (g+s, %)
- Transport exports share of total exports (g+s, %)
- Travel exports share of total exports (g+s, %)
- Other commercial services exports share of total exports (g+s, %)
- Financial exports share of total exports (g+s,%)
- Computer and information exports share of total exports (g+s, %)
-"Other business services" exports share of total exports (g+s, %)
- Government services n.i.e. exports share of total exports (g+s, %)
World Trade Indicators 2009/10 Page 16
e) Goods imports share of total imports (g+s, %)
- Agricultural imports share of total imports (g+s, %)
-Food imports share of total imports (g+s, %)
- Non-agricultural imports share of total imports (g+s, %)
-Manufactured imports share of total imports (g+s, %)
-Fuels imports share of total imports (g+s, %)
-Ores and metals imports share of total imports (g+s, %)
f) Services imports share of total imports (g+s, %)
- Transport imports share of total imports (g+s, %)
- Travel imports share of total imports (g+s, %)
- Other commercial services imports share of total imports (g+s, %)
-Financial imports share of total imports (g+s, %)
-Computer and information imports share of total imports (g+s, %)
-"Other business services" imports share of total imports (g+s, %)
- Government services n.i.e imports share of total imports (g+s, %)
4-Trade Composition (share of goods, share of services)
a) Agricultural exports share of goods exports (%)
- Food exports share of goods exports (%)
b) Non-agricultural exports share of goods exports (%)
- Manufactured exports share of goods exports (%)
- Fuels exports share of goods exports (%)
- Ores and metals exports share of goods exports (%)
c) Transport exports share of services exports (%)
d) Travel exports share of services exports (%)
e) Other commercial services exports share of services exports (%)
- Financial exports share of services exports (%)
- Computer and information exports share of services exports (%)
- "Other business services" exports share of services exports (%)
f) Government services n.i.e exports share of services exports (%)
g) Agricultural imports share of goods imports (%)
- Food imports share of goods imports (%)
h) Non-agricultural imports share of goods imports (%)
- Manufactured imports share of goods imports (%)
- Fuels imports share of goods imports (%)
- Ores and metals imports share of goods imports (%)
World Trade Indicators 2009/10 Page 17
i) Transport imports share of services imports (%)
j) Travel imports share of services imports (%)
k) Other commercial services imports share of services imports (%)
- Financial imports share of services imports (%)
- Computer and information imports share of services imports (%)
- "Other business services" imports share of services imports (%)
l) Government services n.i.e. imports share of services imports (%)
5-Trade integration (% GDP)
a) Trade integration (% of GDP)
- Goods trade integration (% of GDP)
- Services trade integration (% of GDP)
b) Export integration (g+s, % of GDP)
- Goods exports (% of GDP)
-Agricultural exports (% of GDP)
-Food exports (% of GDP)
-Non-agricultural exports (% of GDP)
-Manufactured exports (% of GDP)
-Fuel exports (% of GDP)
-Ores and metals exports (% of GDP)
- Services exports (% of GDP)
-Transport exports (% of GDP)
-Travel exports (% of GDP)
- Other commercial services exports (% of GDP)
-Financial exports (% of GDP)
-Computer and information exports (% of GDP)
-"Other business services" exports (as percent of GDP)
- Government services n.i.e exports (% of GDP)
c) Import integration (g+s, % of GDP)
- Goods imports (% of GDP)
-Agricultural imports (% of GDP)
-Food imports (% of GDP)
-Non-agricultural imports (% of GDP)
-Manufactured imports (% of GDP)
-Fuels imports (% of GDP)
-Ores and metals imports (% of GDP)
World Trade Indicators 2009/10 Page 18
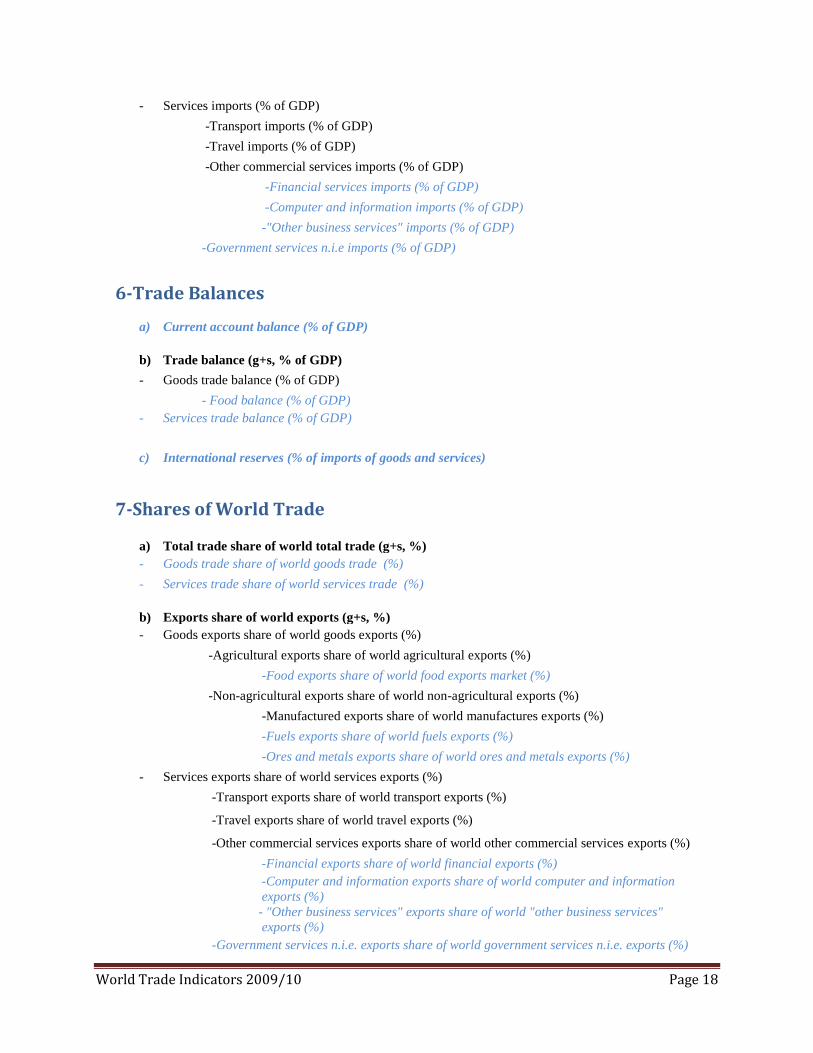
- Services imports (% of GDP)
-Transport imports (% of GDP)
-Travel imports (% of GDP)
-Other commercial services imports (% of GDP)
-Financial services imports (% of GDP)
-Computer and information imports (% of GDP)
-"Other business services" imports (% of GDP)
-Government services n.i.e imports (% of GDP)
6-Trade Balances
a) Current account balance (% of GDP)
b) Trade balance (g+s, % of GDP)
- Goods trade balance (% of GDP)
- Food balance (% of GDP)
- Services trade balance (% of GDP)
c) International reserves (% of imports of goods and services)
7-Shares of World Trade
a) Total trade share of world total trade (g+s, %)
- Goods trade share of world goods trade (%)
- Services trade share of world services trade (%)
b) Exports share of world exports (g+s, %)
- Goods exports share of world goods exports (%)
-Agricultural exports share of world agricultural exports (%)
-Food exports share of world food exports market (%)
-Non-agricultural exports share of world non-agricultural exports (%)
-Manufactured exports share of world manufactures exports (%)
-Fuels exports share of world fuels exports (%)
-Ores and metals exports share of world ores and metals exports (%)
- Services exports share of world services exports (%)
-Transport exports share of world transport exports (%)
-Travel exports share of world travel exports (%)
-Other commercial services exports share of world other commercial services exports (%)
-Financial exports share of world financial exports (%)
-Computer and information exports share of world computer and information
exports (%)
- "Other business services" exports share of world "other business services"
exports (%)
-Government services n.i.e. exports share of world government services n.i.e. exports (%)

World Trade Indicators 2009/10 Page 19
c) Imports share of world imports (g+s, %)
- Goods imports share of world goods imports (%)
-Agricultural imports share of world agriculture imports (%)
-Food imports share of world food imports market (%)
-Non-agricultural imports share of world non-agricultural imports (%)
-Manufactured imports share of world Manufactures imports (%)
-Fuels imports share of world fuels imports (%)
-Ores and metals imports share of world ores and metals imports (%)
- Services imports share of world services imports (%)
-Transport imports share of world transport imports (%)
-Travel imports share of world travel imports (%)
-Other commercial services imports share of world other commercial services
imports (%)
-Financial imports share of world financial imports (%)
-Computer and information imports share of world computer
and information imports (%)
-"Other business services" imports share of world "other business
services" imports (%)
-Government services n.i.e. imports share of world government services imports (%)
8-Growth in Shares of World Trade
a) Growth in trade share of world total trade (g+s, %)
- Growth in goods trade share of world goods trade (%)
- Growth in services trade share of world services trade (%)
b) Growth in exports share of world exports (g+s, %)
- Growth in goods exports share of world goods exports (%)
-Growth in agricultural exports share of world agricultural exports (%)
-Growth in food exports share of world food exports (%)
-Growth in non-agricultural exports share of world non-agricultural exports (%)
-Growth in manufactures exports share of world manufactures
exports (%)
-Growth in fuels exports share of world fuels exports (%)
-Growth in ores and metals exports share of world ores and metals
exports (%)
- Growth in services exports share of world services exports (%)
-Growth in transport exports share of world transport exports (%)
-Growth in travel exports share of world travel exports (%)
-Growth in other commercial services exports share of world other commercial
services exports (%)
-Growth in financial exports share of world financial exports (%)
-Growth in computer and information exports share of world computer
and information exports (%)
- Growth in "other business services" exports share of world "other business
services exports" (%)
World Trade Indicators 2009/10 Page 20
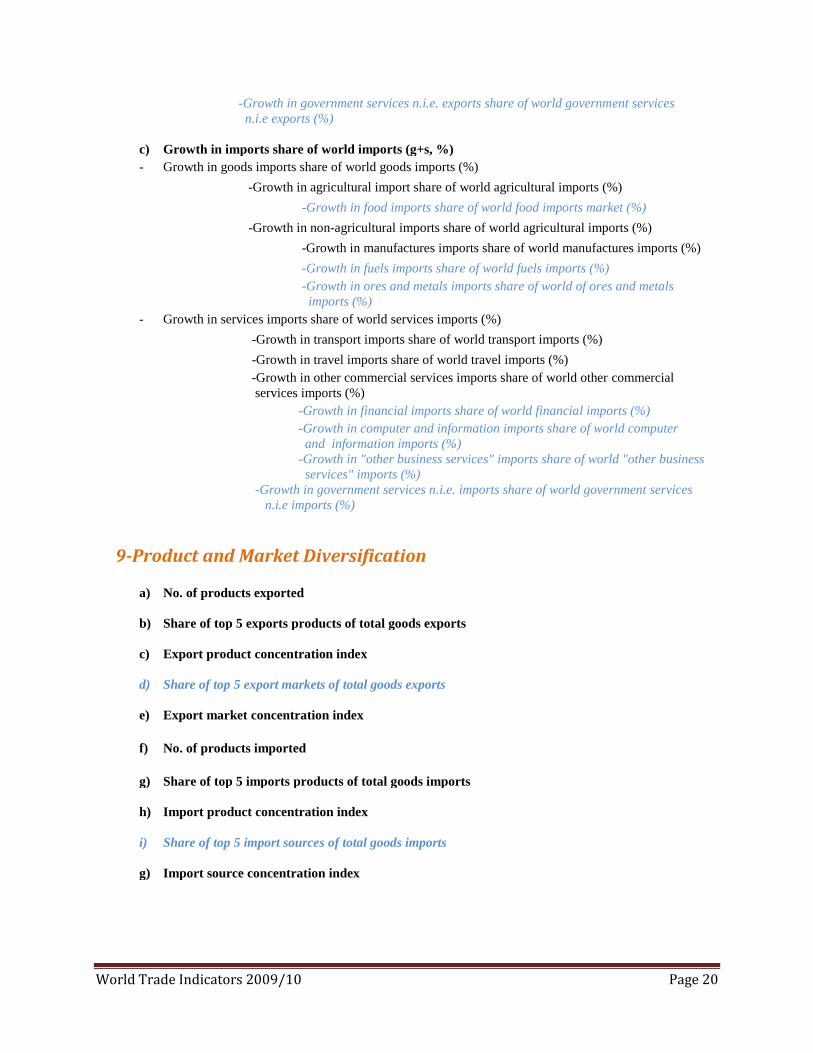
-Growth in government services n.i.e. exports share of world government services
n.i.e exports (%)
c) Growth in imports share of world imports (g+s, %)
- Growth in goods imports share of world goods imports (%)
-Growth in agricultural import share of world agricultural imports (%)
-Growth in food imports share of world food imports market (%)
-Growth in non-agricultural imports share of world agricultural imports (%)
-Growth in manufactures imports share of world manufactures imports (%)
-Growth in fuels imports share of world fuels imports (%)
-Growth in ores and metals imports share of world of ores and metals
imports (%)
- Growth in services imports share of world services imports (%)
-Growth in transport imports share of world transport imports (%)
-Growth in travel imports share of world travel imports (%)
-Growth in other commercial services imports share of world other commercial
services imports (%)
-Growth in financial imports share of world financial imports (%)
-Growth in computer and information imports share of world computer
and information imports (%)
-Growth in "other business services" imports share of world "other business
services" imports (%)
-Growth in government services n.i.e. imports share of world government services
n.i.e imports (%)
9-Product and Market Diversification
a) No. of products exported
b) Share of top 5 exports products of total goods exports
c) Export product concentration index
d) Share of top 5 export markets of total goods exports
e) Export market concentration index
f) No. of products imported
g) Share of top 5 imports products of total goods imports
h) Import product concentration index
i) Share of top 5 import sources of total goods imports
g) Import source concentration index

World Trade Indicators 2009/10 Page 21
10-Tourism, FDI, and Remittances
a) Growth in tourist arrivals (%)
b) Growth in tourist departures (%)
c) FDI inflows (% of GDP)
d) FDI outflows (% of GDP)
e) FDI inflows (% of exports of goods and services)
f) FDI inflows (% of world FDI inflows)
- FDI inflows (% of total FDI inflows to low and middle income countries)
- FDI inflows (% of total FDI inflows to low and middle income country excluding China and India)
g) Total remittances inflows (% of GDP)
h) Total remittances outflows (% of GDP)
i) Total remittances inflows (% of exports of goods and services)
j) Total remittances inflows (% of world total remittances inflows)
k) Total remittances inflows (% of FDI inflows)
l) Worker remittances inflows (% of GDP)
m) Worker remittances outflows (% of GDP)
n) Worker remittances inflows (% of goods exports)
o) Worker remittances inflows (% of world worker remittances inflows)
11-Other Variables
a) Population
b) Real GDP growth (%)
c) Real GDP per capita growth (%)
d) Nominal trade (g+s) per capita

World Trade Indicators 2009/10 Page 22
Quarterly Variables
Total Trade (g+s), Total Exports (g+s), Total Imports (g+s)
- Real Growth Trade (g+s) BOP, year on year
- Real Growth Exports (g+s) BOP, year on year
- Real Growth Imports (g+s) BOP, year on year
- Real Growth Trade (g+s) BOP, quarter on quarter
- Real Growth Exports (g+s) BOP, quarter on quarter
- Real Growth Imports (g+s) BOP, quarter on quarter
- Nominal Growth Trade (g+s) BOP, year on year
- Nominal Growth Exports (g+s) BOP, year on year
- Nominal Growth Imports (g+s) BOP, year on year
- Nominal Growth Trade (g+s) BOP, quarter on quarter
- Nominal Growth Exports (g+s) BOP, quarter on quarter
- Nominal Growth Imports (g+s) BOP, quarter on quarter
Goods Trade, Goods Exports, Goods Imports – Balance of Payments (BoP)
- Real Growth Goods Trade BOP, year on year
- Real Growth Goods Exports BOP, year on year
- Real Growth Goods Imports BOP, year on year
- Real Growth Goods Trade BOP, quarter on quarter
- Real Growth Goods Exports BOP, quarter on quarter
- Real Growth Goods Imports BOP, quarter on quarter
- Nominal Growth Goods Trade BOP, year on year
- Nominal Growth Goods Exports BOP, year on year
- Nominal Growth Goods Imports BOP, year on year
- Nominal Growth Goods Trade BOP, quarter on quarter
- Nominal Growth Goods Exports BOP, quarter on quarter
- Nominal Growth Goods Imports BOP, quarter on quarter
World Trade Indicators 2009/10 Page 23
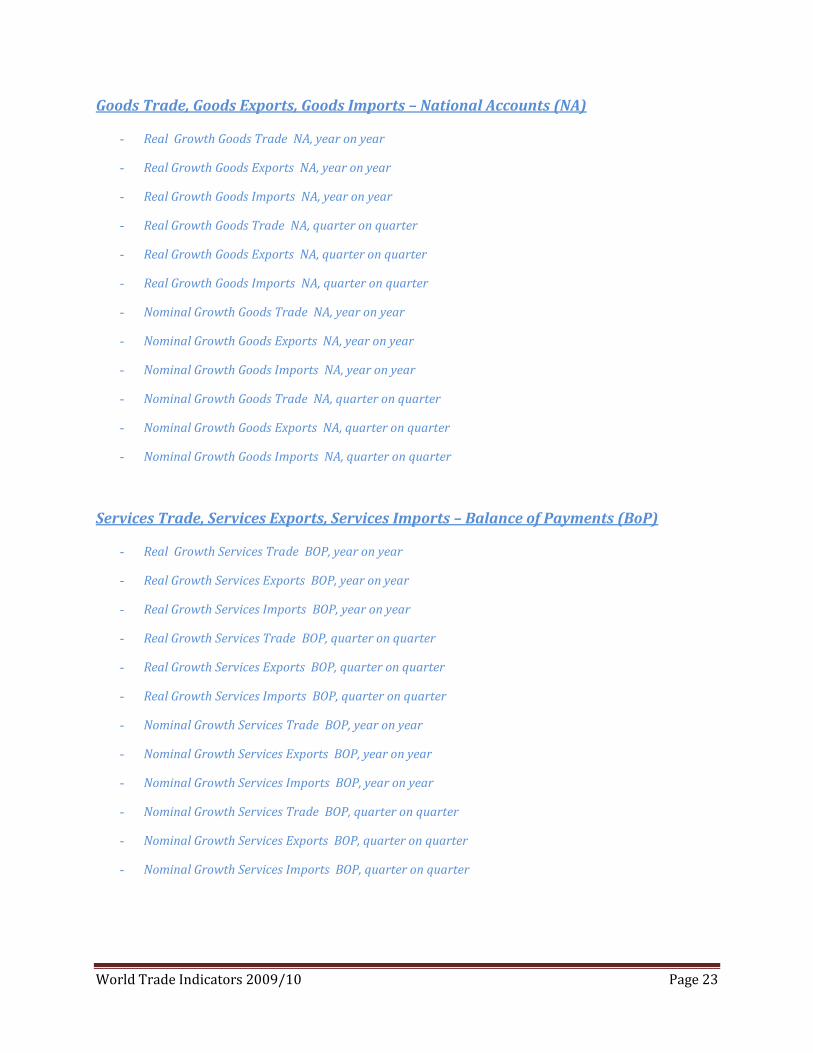
Goods Trade, Goods Exports, Goods Imports – National Accounts (NA)
- Real Growth Goods Trade NA, year on year
- Real Growth Goods Exports NA, year on year
- Real Growth Goods Imports NA, year on year
- Real Growth Goods Trade NA, quarter on quarter
- Real Growth Goods Exports NA, quarter on quarter
- Real Growth Goods Imports NA, quarter on quarter
- Nominal Growth Goods Trade NA, year on year
- Nominal Growth Goods Exports NA, year on year
- Nominal Growth Goods Imports NA, year on year
- Nominal Growth Goods Trade NA, quarter on quarter
- Nominal Growth Goods Exports NA, quarter on quarter
- Nominal Growth Goods Imports NA, quarter on quarter
Services Trade, Services Exports, Services Imports – Balance of Payments (BoP)
- Real Growth Services Trade BOP, year on year
- Real Growth Services Exports BOP, year on year
- Real Growth Services Imports BOP, year on year
- Real Growth Services Trade BOP, quarter on quarter
- Real Growth Services Exports BOP, quarter on quarter
- Real Growth Services Imports BOP, quarter on quarter
- Nominal Growth Services Trade BOP, year on year
- Nominal Growth Services Exports BOP, year on year
- Nominal Growth Services Imports BOP, year on year
- Nominal Growth Services Trade BOP, quarter on quarter
- Nominal Growth Services Exports BOP, quarter on quarter
- Nominal Growth Services Imports BOP, quarter on quarter