“listening in”to find and explore new combinations of...
TRANSCRIPT

72 / Journal of Marketing, April 2004Journal of MarketingVol. 68 (April 2004), 72–87
Glen L. Urban & John R. Hauser
“Listening In” to Find and Explore NewCombinations of Customer Needs
By “listening in” to ongoing dialogues between customers and Web-based virtual advisers (e.g., Kelley Blue Book’sAuto Choice Advisor), the authors identify new product opportunities based on new combinations of customerneeds. The data are available at little incremental cost and provide the scale necessary for complex products (e.g.,148 trucks and 129 customer needs in the authors’ application). The authors describe and evaluate the method-ologies with formal analysis, Monte Carlo simulation (calibrated on real data), and a “proof-of-concept” applicationin the pickup-truck category (more than 1000 Web-based respondents). The application identified opportunities fornew truck platforms worth approximately $2.4 billion–$3.2 billion and $1 billion–$2 billion, respectively.
Glen L. Urban is David Austin Professor of Marketing (e-mail: [email protected]), and John R. Hauser is Kirin Professor of Marketing (e-mail:[email protected]), Sloan School of Management, Massachusetts Instituteof Technology. This research was supported by the Sloan School of Man-agement, the eBusiness Center, the Center for Innovation in ProductDevelopment at MIT, and the General Motors Corporation. The authorsgratefully acknowledge the contributions of their industrial collaborators,research assistants, and faculty colleagues: Vince Barabba, Iakov Bart,Ahmed Benabadji, Rupa Bhagwat, Brian Bower, Brian Chan, Hann-ChingChao, Mitul Chatterjee, Shyn-Ren Chen, Thomas Cheng, Stanley Cheung,Frank Days, Ken Dabrowski, Benson Fu, Salman Khan, ChristopherMann, Rami Musa, Joseph Kim, Ken Lynch, Bill Qualls, James Ryan, BilalShirazi, Jonathon Shoemaker, Fareena Sultan, Andy Tian, XinghengWang, and Irene Wilson. This article has benefited from presentations atthe Marketing Science conferences in Wiesbaden, Germany, and Edmon-ton, Canada; the Marketing Science conference “New Methods for NewProducts”; the MIT Marketing Workshop; the New England Marketing Con-ference; and the Stanford Marketing Workshop. Related information isavailable at http://mitsloan.mit.edu/vc and http://ebusiness.mit.edu. Theauthors provided external funds for the use of color in the figures.
Identifying new platform opportunities is one of the mostimportant roles of market intelligence. Monitoring [Web-based advisers] provides a rich source of observed in-market customer behavior that complements our currentinquiry tools that, by their nature, are forced to ask cus-tomers either to state their intentions before they are actu-ally in the market or to remember after the purchase whatthey did (and why) when shopping for a vehicle. No formof inquiry is perfect, however; whatever its limitations, thecurrency [of Web-based advisers] presents a valuablesource of market understanding that is already streamingby and is of great value when used appropriately.
—Vince Barabba, General Manager of Corporate Strategy and Knowledge Development, General Motors
The advent of the Internet has given customers moreinformation about products in diverse industries suchas travel, health, automobiles, computers, home enter-
tainment, and financial services. For example, the percent-age of people using the Internet for information and adviceis high in travel (70%), health (56%), and automobiles(62%). The monitoring of Internet searches, undertaken bypotential customers in their own vested interests, has thepotential to reveal new opportunities for new products and
product platforms. In this article, we explore a set ofmethodologies to use this information to identify new prod-uct opportunities. Although our application is drawn fromthe automotive industry, the basic concepts are applicable tocomplex products in both consumer and business-to-business markets, such as high-end copiers, home entertain-ment centers, and financial services (Ulrich and Eppinger1995).
Automobiles and trucks are indeed complex products.The investment for a new automotive platform can requireas much as $1 billion–$2 billion and 1200 person-years ofinvestment. Such investments are justified by the scale of themarket. For example, with approximately 150 brands oftruck on the market, the average truck needs less than 1% ofthe marketplace to be profitable; each share point is worth$800 million in annual revenue.
Most automotive platforms are redesigns to provideknown combinations of customer benefits (i.e., needs).However, long-term survival requires that new opportunitiesbe identified. For example, in the late 1980s, through a com-bination of qualitative focus groups and quantitative percep-tual mapping studies, a new opportunity was identified forluxury vehicles that could haul moderate loads. Today, theluxury sport-utility-vehicle segment is one of the most prof-itable automotive segments. Another new product examplecame from leading-edge users. In the 1960s, teenagers andyoung adults were customizing inexpensive vintage Fordswith V8 engines. Ford recognized the opportunity for inex-pensive, sporty cars with large engines. The first productioncar in this “pony” segment, the 19641⁄2 Mustang, sold420,000 units in the first year ($10 billion in today’s prices;ClassicPonyCars.com 2002). The 1983 Chrysler minivansare another example. Growing families needed a vehicle thatcould carry a 4¢ ¥ 8¢ sheet of plywood, fit easily in theirgarages, drive like a passenger car, have a side door forsmall children, and incorporate a sedanlike liftgate for shop-ping. Chrysler sold 210,000 units in the first year and dom-inated the new segment for years to come (Allpar.com2003). These are but some of the many automotive examplesin which profitable new platforms filled previously unrecog-nized (by the auto industry) combinations of consumerneeds. The firms that first identified the new combinations

of customer needs were able to exploit the opportunitiesprofitably for many years.
Identification of new combinations of customer needsfor complex products is no small challenge. For example,trucks fulfill between 100 and 150 distinct customer needs,and even more if sound and other subsystems are included.Because of the sheer magnitude of combinatorial combina-tions (e.g., 1052 in our application), existing products fulfilla tiny fraction of the potential combinations. Complex prod-ucts require large samples. For example, even if we hadhypotheses about a new combination of customer needs, wemight still need detailed information on almost 500 or morerespondents to be comfortable that a needs-combinationsegment is worth further investigation. Because multipleneeds define a segment, it is not unusual for sample sizes inthe automotive industry to approach 10,000 for targetedresearch and 100,000 for general searches. General Motors(GM) alone spends tens of millions of dollars each yearsearching for new needs combinations and studying needscombinations when they have been identified. Some studiesare in the cost range of $500,000 to $1 million. Automotivefirms desire methodologies that are more cost effective andthat can be run continuously to identify new needs-combination opportunities as soon as they occur.
In this article, we propose methodologies that provide apractical means to find combinations of customer needs thatrepresent profitable new opportunities. The methodologiesexploit new data (i.e., clickstreams from virtual advisers)that are available at little incremental cost but provide thescale (both number of products and number of needs) that isnecessary to find opportunities in complex-product cate-gories. For example, there is a virtual adviser sponsored byGM, J.D. Power, Kelley Blue Book, and Car Talk and partlybased on the methodologies in this article that has approxi-mately 500,000 annual visitors.
We obtained the new data by “listening in” to ongoingdialogues created when customers use the Internet to searchfor information and advice about automotive purchases. Thedata are incentive compatible: Customers are seeking adviceand have an incentive to reveal their needs. The virtualadvisers generating the data are updated often to includenew products and new customer benefits (needs), providingevolving data with which to identify new combinations ofneeds as soon as customers express them. We focus on thetruck market to illustrate the methods. The methodologiesextend readily to other complex-product categories, such astravel, medical, and office equipment.
We listen in by combining multiple stages: a Bayesianvirtual adviser to obtain the data, an opportunity trigger toidentify when existing trucks do not fulfill desired combina-tions of needs, a virtual engineer to explore and clarify theidentified opportunity, a design palette to explore how cus-tomers would design their own trucks, and a clustering pro-cedure to estimate the (rough) size of the segment of cus-tomers who desire the new combinations of needs. In thisarticle, we illustrate each stage, examine internal validitywith Monte Carlo analyses, and provide an example basedon a sample of more than 1000 respondents. This “proof-of-concept” research was performed parallel to existing meth-ods, yet it identified a key segment at a much lower cost. It
New Combinations of Customer Needs / 73
also implied the existence of a segment, still being explored,that existing methods may have missed. We begin by dis-cussing how listening in complements existing methods.
Existing Methods to IdentifyProfitable Combinations of
Customer NeedsBecause so much is at stake, strategic marketing and mar-keting research groups invest heavily in identifying newopportunities. They speak to leading-edge users, maintainand monitor user groups, sponsor special racing events,monitor chat rooms and user groups, and use various quali-tative and ethnographic methods (Barabba 2004; Barabbaand Zaltman 1991; Griffin and Hauser 1993; Gutman 1992).For example, automotive firms invest heavily in quantitativemethods such as conjoint analyses; activities, interests, andopinions (AIO) studies; and large-scale “clinics” in whichcustomers view and react to prototypes and concepts (Greenand Srinivasan 1990; Plummer 1974; Urban, Weinberg, andHauser 1996). Table 1 summarizes characteristics of exist-ing methods and listening in. The cost and sample-size dataare typical for the automotive industry; they are based onour experience and discussions with auto executives andconsultants.1
The methods in Table 1 are complementary. For exam-ple, qualitative and ethnography interviews are powerfulmethods to probe in-depth once the research is focused, butthey are an expensive means to search for combinations ofneeds that might be desired by less than 1% of the market.Conjoint analyses provide accurate estimates of the impor-tance of customer needs, but they are most effective whenthey are targeted to approximately 10 to 20 needs. Evenadaptive methods cannot handle all the needs that describe atruck. Furthermore, AIO studies are designed to examine theentire market for new combinations of needs, but they areexpensive, performed infrequently, and tend not to collectdata on gaps in customer needs. In contrast, AIO studiesprovide critical input to virtual advisers. Truck clinics pro-vide the most realistic stimuli to customers. They aredesigned carefully to forecast sales before launch, but theirprimary use is confirmatory rather than exploratory.
Listening in fills a gap in existing methods by making itfeasible to use inexpensive and readily available data tosearch large numbers of customer needs to find combina-tions of customer needs that are desired but not currentlyfulfilled by existing trucks. More important, unlike AIOstudies, listening in can immediately and automatically tar-get both quantitative and qualitative questions to explorefurther the new combinations of customer needs. Becauselistening in runs continuously and is updated periodicallywith new vehicles and benefits (needs), it provides an earlywarning of new needs-combination segments as soon asthey appear in the market.
Tailored interviewing (TI) has characteristics that aresimilar to the Bayesian virtual adviser. Both TI and the vir-
1Table 1 also includes tailored interviewing, an approach thatshows promise for automotive applications, especially for the seg-mentation gearbox used in the virtual adviser.

74/ Journal of M
arketing,April 2004
TABLE 1Complementary Methods for Understanding Customer-Needs Combinations: Truck Example
Number of Features Number of Number of IncludesIncremental or Stated Needs Vehicles Feature In-Depth
Data Source Cost per Study per Study per Study Combinations Probes
Qualitative and ethnographic 5–10 groups of 5–10 $40,000–$50,000 50–100 5–10 Open-ended Yesinterviewsa customers per segment
Tailored Interviewsb
Segmentation 800 personal interviews $80,000 73 scales 7 segments — —Interest or intent 512 (calibration) and 235 $10,000–$15,000 12–15 items Single scale — —
mail questionnaires (Phase 2)
AIO studiesa 100,000 mailed $500,000 114 150 — —questionnaires
Conjoint analysesa 300 online or in-person $50,000–$100,000 10–20 5–10 1060 —interviews
Truck clinicsa 300 central-facility $500,000 40–50 10–20 — Yespersonal interviews
Listening inc
Bayesian adviser Track online $10,000–$20,000 36 148 — —Opportunity trigger Track online Included — — 1015 —Virtual engineer Invite online Included 79 — 1031 YesDesign palette Invite online Included 14 — 1060 —Clustering Track online Included — — — —
aData are as cited in article and/or typical for the automotive industry. We rounded some estimates for confidentiality.bData are from the work of Kamakura and Wedel (1995) and Singh, Howell, and Rhoads (1990). Automotive cost estimates are based on sample sizes in Journal of Marketing Research articles.Cost per respondent is typical for the industry, as is estimated by auto industry executives and consultants.
cExperience is based on the pilot study. The numbers of vehicles, needs, and combinations may increase in subsequent applications.

tual adviser classify respondents (e.g., into seven segments,as in the work of Kamakura and Wedel [1995]; into threemost preferred trucks [of 148] in our application). There areother technical differences that we discuss in the next sec-tion. A key conceptual difference is that to be practical in thetruck market, the virtual adviser must be updated almostcontinuously as new trucks enter the market or as new fea-tures are added to the question banks. Although both meth-ods assign respondents with posterior probabilities, the vir-tual adviser relies on Bayesian methods to updateprobabilities and uses data from multiple sources, whereasTI relies on a calibration survey and uses maximum-likelihood methods (Kamakura and Wedel 1995, Equations3–7). Each method works well in its target application.
Listening in is not a panacea, nor can it operate withoutcomplementary methods. For example, although the virtualengineer contains qualitative probes, subsequent qualitativeand ethnographic research provides greater depth on a seg-ment when it has been identified. Similarly, when new needscombinations have been uncovered, conjoint analysessearch the combinations in greater detail and quantify theimportance of the alternative needs. Although listening inprovides first-order forecasts, truck clinics provide the accu-racy necessary before $1 billion–$2 billion is committed toa project. We illustrate in a stylized way how listening incomplements existing methods for two practical situationsin truck markets. In practice, applications are more iterativeand include other methods (Urban and Hauser 1993).
Identify opportunities for a new truck platform:Listening in fi qualitative interviews fi conjoint analy-sis fi truck clinics fi launch.
Monitor marketplace changes for vehicle “refresh” oppor-tunities:
Listening in fi conjoint analysis fi truck clinics filaunch.
Tapping Data from Virtual Advisers(Web-Based Searches)
Virtual-adviser data are extensive, available at little incre-mental cost, and underused as a means to identify unfulfilledcombinations of customer needs. Web sites such as KelleyBlue Book (http://www.kbb.com), Microsoft Autos (http://autos.msn.com), Edmund’s (http://www.edmunds.com),Autobytel (http://www.autobytel.com), Autoweb (http://www.autoweb.com), NADA (http://www.nadaguides.com),and Vehix (http://www.vehix.com) have changed the waythat customers search for information on cars and trucks. Ofall new-vehicle buyers, 62% search online before buying avehicle (J.D. Power and Associates 2001). This search ratehas increased from 54% in 2000 and from 40% in 1999. Themost important and most accessed Internet content is infor-mation about vehicle options and features. Notably,although customers prefer independent sites for pricing andgeneral evaluation, they prefer manufacturers’ sites, by morethan a two-to-one margin, for feature and option information(J.D. Power and Associates 2001, p. E16).
Virtual advisers come in many varieties, including com-parators, which array choice alternatives by features
New Combinations of Customer Needs / 75
(Epinions.com); feature-specifiers, which ask consumers forpreferred levels of features and search the database for prod-ucts that meet the feature specifications (Kelly Blue Book’sonline recommendation tool); configurators with detailedspecifications and costs for the chosen set of detailed prod-uct features (http://configurator.carprices.com/autoadvisors);collaborative filters, which recommend products based oncorrelations of previous purchases by similar customers(Amazon.com); and utility maximizers, which use methodssimilar to conjoint analysis to weight features (Activebuy-ersguide.com). Other advisers use real people who con-sumers can access by e-mail (Mayohealth.org) or in live chatrooms (Nordstom.com).
The listening-in methodology relies on data from aBayesian virtual adviser, which is a method that is well-matched to the opportunity trigger mechanism. However,the virtual engineer, the design palette, and the clustering arenot limited to working with a Bayesian virtual adviser.These methodologies can work with any virtual adviser thatprovides recommendations at any point in the questioningsequence and that links customers’ responses to benefits thatthe customers derive from vehicles.
A Bayesian Virtual AdviserThe Bayesian virtual adviser was developed as a prototypefor a major automotive manufacturer; a commercial systembased, in part, on this adviser is now in place on the Web.This virtual adviser combines two methods to recommend aset of four vehicles to customers: a segmentation gearboxand a Bayesian adviser. The segmentation gearbox dividespeople into segments on the basis of grouping and assign-ment rules.2 The grouping is based on a cluster analysis of a114-item AIO questionnaire sent to 100,000 respondents (76personal viewpoints and 38 preferred vehicle characteristics,including styling and design). The automotive manufac-turer’s AIO study identified 48 segments, of which 25 wererelevant to pickup trucks. Customers were assigned to seg-ments on the basis of answers about their desires for featuresand options such as comfort, passenger capacity, and pres-tige as well as about their anticipated use of the truck. In thevirtual adviser, one of the four recommended vehicles wasthe vehicle bought most often by the segment to which thecustomer was assigned. However, because the segmentationgearbox is designed to allocate people to segments ratherthan identify new opportunities, it is not the focus of thisarticle. Instead, we focus on the Bayesian adviser that rec-ommends three of the four vehicles.
Bayesian Adviser
The basic concepts behind the Bayesian adviser are (1) toselect sets of questions, known as question banks, such thatthe answers provide the most information about which vehi-cle to recommend and (2) to update the probabilities thatdescribe the likelihoods that each vehicle will be most pre-
2The industry term “gearbox” is an analogy. Just as the gearboxin a car matches engine speed to wheel speed, the segmentationquestions match the manufacturer’s vehicles to the customer.

76 / Journal of Marketing, April 2004
3The global set of question banks from which the algorithmselects is drawn from cluster analyses of the ongoing AIO surveys,supplemented with managerial judgment. The set of questionbanks evolves on the basis of ongoing market intelligence. Thesemethods are state of the art but standard marketing research prac-tice. They are not the focus of this article.
4In most equations, we suppress the individual customer sub-script, i, for simplicity.
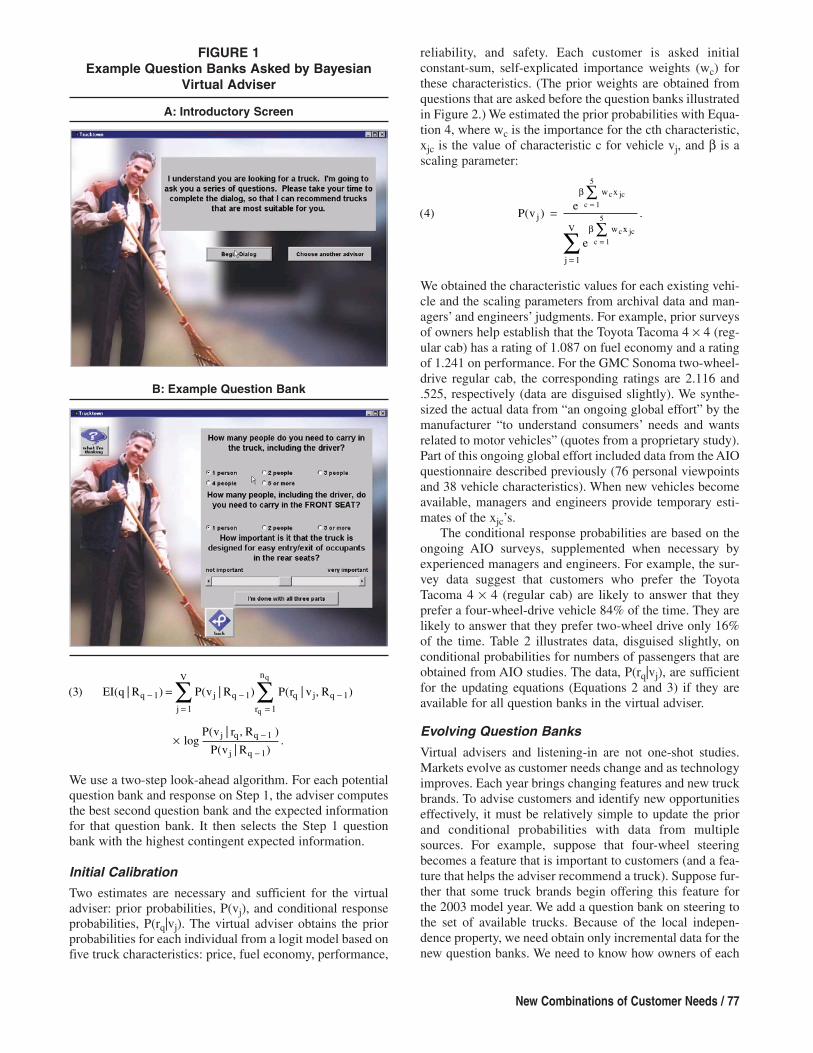
ferred by the customer after each question bank.3 Figure 1,Panel A, illustrates the opening screen of the virtual adviser(a neighbor who is a contractor and who has bought manytrucks over the years), and Figure 1, Panel B, illustrates oneof the question banks asked of customers. We describe theBayesian updating mechanism and then describe how it canbe used to select the maximum-information question bank.We subsequently indicate how we obtained both the condi-tional and the prior probabilities.
We begin with the notation. We let Q be a set of questionbanks indexed from q = 1 to N. For each question bank, q,rq indexes the potential responses to that question bank,where rq is a nominal variable with values from 1 to nq. Ifthere is more than one question in a question bank, nq rep-resents the number of possible combinations of answers. Ifone of the questions includes a continuous sliding scale, it isdiscretized to a finite number of categories.
For each customer, the order of the question banks ischosen adaptively. For a given customer, Rq – 1 is the set ofquestion banks up to but not including question bank q. Thevariable vj indicates vehicles from 1 to V. At any point in theadviser’s questioning sequence, we are interested in the like-lihood that the customer will prefer vehicle j after havingbeen asked question bank q. We indicate this likelihood byP(vj|Rq – 1, rq).
Suppose that from previous surveys, we have availablethe conditional probabilities of how customers, who prefereach vehicle, will answer the question banks. We then canuse Bayes’ theorem to update recommendations.4
where P(vj|Rq – 1) is the virtual adviser’s recommendationprobability to the customer for vehicle vj before asking theqth question bank.
However, even with data from full-scale surveys, such asan AIO questionnaire with 100,000 responses, use of Equa-tion 1 is not feasible because the number of potential com-binations of responses grows exponentially with the numberof question banks. For example, in our study, the dimen-sionality of RN, the number of unique paths through theadviser’s questions, is 1.4 ¥ 1015. Fortunately, we can makeEquation 1 feasible based on the property of local indepen-dence. This property appears reasonable for our data and hasproved robust in simulations and applications in the TI liter-ature (e.g., Kamakura and Wedel 1995, Equation 11; Singh,Howell, and Rhoades 1990, Equation 8). Local indepen-dence recognizes that there are nonzero correlations acrossvehicles in the answers to the question banks; customers
( ) ( | , )( | , ) ( | )
( | , ) ( | )
,1 11 1
1 1
1
P v R rP r v R P v R
P r v R P v R
j q qq j q j q
q j q j q
j
V-- -
- -=
=
Â
5For applications in marketing of reward functions based oninformation theory, see Hauser (1978) and Herniter (1973). Forapplications in psychology, see Prelec (2001).
who prefer a full-sized truck may also prefer a diesel engine.Indeed, it is this combination of preferences on which theadviser bases its recommendations. However, if we limitourselves to customers who prefer a Ford F350 Supercab,for those customers, responses to the “size” question bankare approximately statistically independent of the responsesto the “engine type” question bank. This enables us to writeP(rq, Rq – 1| vj) @ P(rq|vj) P(rq – 1|vj) … P(r1|vj), which impliesthat P(rq|vj) @ P(rq|vj, Rq – 1) by the laws of conditional prob-ability. Using this property, we rewrite Equation 1, in whichwe recursively obtain P(vj|Rq – 1), as follows:
Figure 2 gives a simplified example for one customer ofthe evolution of the recommendation probability. The cur-rent recommendation is on the left-hand side, and the prob-ability that the customer will purchase that recommendedvehicle is on the right-hand side. Also listed on the left-handside are the question bank and parts of the answer. Forexample, after the second question bank on engine size, thecustomer answers “four cylinders.” If the customer were tostop answering question banks and request a recommenda-tion, the adviser would recommend the Mazda B2300 andforecast a .0735 probability that the customer would pur-chase the Mazda B2300. In Figure 2, the probability of pur-chase increases for the most preferred truck after each ques-tion bank is answered. Note that the recommended vehiclechanges after the fifth question bank and again after theeighth question bank.
Question Bank Selection
To select the next question bank, the virtual adviser attemptsto gain as much information as possible from the customer.For example, if after reviewing the responses, the adviserdecides that a question bank on towing capacity is likely tomake one truck more highly probable and all other trucksless probable, that question bank might be a good candidateto ask next. To do this, we turn to formal theory in whichinformation is defined as the logarithm of the relative odds(e.g., Gallagher 1968). That is, the information, I(vj|rq,Rq – 1), provided by the response to question bank q equalslog [P(vj|Rq – 1, rq)/P(vj|Rq – 1)]. This definition has severalnice theoretical properties, including that (1) under an equalproportional loss rule, information always increases whenthe probability of the maximum-choice truck increases; (2)the expected information is maximized for the true proba-bilities; and (3) the information measure rewards systemsthat provide more finely grained estimates (Kullback 1954;Savage 1971).5
To compute the expected information, we take theexpectation over all possible responses to question bank qand over all possible vehicles. The information that weexpect from question bank q is given in Equation 3:
( ) ( | , )( | ) ( | )
( | ) ( | )
.2 11
1
1
P v R rP r v P v R
P r v P v R
j q qq j j q
q j j q
j
V--
-=
@
Â
New Combinations of Customer Needs / 77
FIGURE 1Example Question Banks Asked by Bayesian
Virtual Adviser
A: Introductory Screen
B: Example Question Bank
We use a two-step look-ahead algorithm. For each potentialquestion bank and response on Step 1, the adviser computesthe best second question bank and the expected informationfor that question bank. It then selects the Step 1 questionbank with the highest contingent expected information.
Initial Calibration
Two estimates are necessary and sufficient for the virtualadviser: prior probabilities, P(vj), and conditional responseprobabilities, P(rq|vj). The virtual adviser obtains the priorprobabilities for each individual from a logit model based onfive truck characteristics: price, fuel economy, performance,
( ) ( | ) ( | ) ( | , )
log( | , )
( | ).
3 1 1
1
1
1
1
1
EI q R P v R P r v R
P v r R
P v R
q j q
j
V
q j q
r
n
j q q
j q
q
q
- -=
-=
-
-
=
¥
 Â
reliability, and safety. Each customer is asked initialconstant-sum, self-explicated importance weights (wc) forthese characteristics. (The prior weights are obtained fromquestions that are asked before the question banks illustratedin Figure 2.) We estimated the prior probabilities with Equa-tion 4, where wc is the importance for the cth characteristic,xjc is the value of characteristic c for vehicle vj, and b is ascaling parameter:
We obtained the characteristic values for each existing vehi-cle and the scaling parameters from archival data and man-agers’ and engineers’ judgments. For example, prior surveysof owners help establish that the Toyota Tacoma 4 ¥ 4 (reg-ular cab) has a rating of 1.087 on fuel economy and a ratingof 1.241 on performance. For the GMC Sonoma two-wheel-drive regular cab, the corresponding ratings are 2.116 and.525, respectively (data are disguised slightly). We synthe-sized the actual data from “an ongoing global effort” by themanufacturer “to understand consumers’ needs and wantsrelated to motor vehicles” (quotes from a proprietary study).Part of this ongoing global effort included data from the AIOquestionnaire described previously (76 personal viewpointsand 38 vehicle characteristics). When new vehicles becomeavailable, managers and engineers provide temporary esti-mates of the xjc’s.
The conditional response probabilities are based on theongoing AIO surveys, supplemented when necessary byexperienced managers and engineers. For example, the sur-vey data suggest that customers who prefer the ToyotaTacoma 4 ¥ 4 (regular cab) are likely to answer that theyprefer a four-wheel-drive vehicle 84% of the time. They arelikely to answer that they prefer two-wheel drive only 16%of the time. Table 2 illustrates data, disguised slightly, onconditional probabilities for numbers of passengers that areobtained from AIO studies. The data, P(rq|vj), are sufficientfor the updating equations (Equations 2 and 3) if they areavailable for all question banks in the virtual adviser.
Evolving Question Banks
Virtual advisers and listening-in are not one-shot studies.Markets evolve as customer needs change and as technologyimproves. Each year brings changing features and new truckbrands. To advise customers and identify new opportunitieseffectively, it must be relatively simple to update the priorand conditional probabilities with data from multiplesources. For example, suppose that four-wheel steeringbecomes a feature that is important to customers (and a fea-ture that helps the adviser recommend a truck). Suppose fur-ther that some truck brands begin offering this feature forthe 2003 model year. We add a question bank on steering tothe set of available trucks. Because of the local indepen-dence property, we need obtain only incremental data for thenew question banks. We need to know how owners of each
( ) ( ) .41
5
1
5
1
P ve
e
j
w x
w x
j
V
c jcc
c jcc
==
=
Â
Â
=Â
b
b

78 / Journal of Marketing, April 2004
TABLE 2Conditional Probabilities Obtained from AIO Surveys and Supplemented with Judgment
Conditional Probability P(rq|vj) (%)
Number of Chevy Avalanche Chevy Silverado GMC Sonoma Dodge RamPassengers 2WD 2500 2WD 4WD Crew Cab (148 Vehicles) Club 4WD
1 5% 25% 15% … 10%2 15% 25% 5% … 15%3 25% 25% 15% … 25%4 25% 15% 25% … 25%5–6 30% 10% 25% … 25%
Notes: Data are disguised. 2WD = two-wheel drive; 4WD = four-wheel drive.
truck brand will rate their vehicles on the new questionbank. For new truck brands, we need to know how ownersof the new brands will rate their vehicles on the characteris-tic values (xjc) and how they will answer each questionbank, P(rq|vj). We obtained the data from the periodic AIOsurveys and from other sources, such as one-time surveysand judgment. In essence, the virtual adviser (and listeningin) free rides on surveys undertaken by the manufacturer forother purposes. This adaptability is a key feature that is nec-essary for practical application and represents a conceptualdifference between the Bayesian virtual adviser and TI. Theformer uses Bayesian methods to incorporate new data frommultiple sources, whereas the latter relies on maximum-likelihood estimates obtained in a calibration survey. Eachmethod is matched to its application domain. However, fur-ther research might combine these relative strengths into animproved methodology.
Opportunity Trigger MechanismThe next stages of listening in identify when opportunitiesexist and identify the combinations of customer needs thatare not satisfied by existing vehicles.
Trigger Mechanism to Identify WhenOpportunities Exist
For many customers, an existing vehicle will fulfill theirneeds, and the updated recommendation probabilities willevolve smoothly as in Figure 2. Existing vehicles satisfy theneeds combinations these customers desire. However, forsome customers, their answers to question banks revealinconsistencies. For example, suppose that (1) the customerhas already answered constant-sum importance questionbanks, which indicate that reliability and low price areimportant (price 30 points, performance 10 points, fueleconomy 20 points, reliability 30 points, and safety 10points), and (2) the customer’s subsequent answers suggestan interest in a small truck with a four-cylinder engine, two-wheel drive, and automatic transmission. Through the firstfour question banks, the Mazda B2300 fits these preferencesbest (see Figure 3, first four bars from top). Given theseanswers, the virtual adviser decides that further informationon towing and hauling will clarify recommendations. Theadviser expects that the customer will want to haul or towrelatively light loads, such as small garden equipment or aJet Ski. Knowing the exact towing and hauling needs will
FIGURE 2Evolution of Updated Recommendation Probabilities After Question Banks
Mazda B2300, prior (points) .0533Mazda B2300, engine size (four cylinder) .0735
Mazda B2300, transmission (automotive, 2WD) .0861Mazda B2300, size (compact) .1105
Mazda B2300, towing/hauling (no) .1123Toyota Tacoma, construction plowing (no) .1200
Toyota Tacoma, brand (all) .1243Toyota Tacoma, bed length (short) .1328
GMC Sierra 1500, tallest person (6¢–6.5¢) .1376GMC Sierra 1500, passengers (two) .1440
GMC Sierra 1500, maneuverability (important) .1440GMC Sierra 1500, big, quiet (not important) .1458
GMC Sierra 1500, styling (sporty) .1467GMC Sierra 1500, price ($20K–$22K) .1467
.00 .04 .08 .12 .16
Maximum Probability
Rec
om
men
dat
ion
/Qu
esti
on
B
anks
/Res
po
nse
s
Notes: Abbreviated consumer responses to question bank are in parentheses. 2WD = two-wheel drive.

New Combinations of Customer Needs / 79
FIGURE 3Example Use of the Opportunity Trigger
Mazda B2300, prior (points) .0533Mazda B2300, engine size (four cylinder) .0735
Mazda B2300, transmission (automotive, 2WD) .0861Mazda B2300, size (compact) .1105
Ford Ranger, towing/hauling (no) .1056Ford Ranger, construction plowing (no) .1200
Ford Ranger, brand (all) .1243Ford Ranger, bed length (short) .1328
Ford Ranger, tallest person (<6¢) .1356Ford Ranger, passengers (two) .1401
Ford Ranger, maneuverability (important) .1428Ford Ranger, big, quiet (neutral) .1459
Ford Ranger, styling (conventional) .1478Ford Ranger price ($20K–$22K) .1498
.00 .04 .08 .12 .16
Maximum Probability
Rec
om
men
dat
ion
/Qu
esti
on
B
anks
/Res
po
nse
s
Notes: Abbreviated consumer responses to question bank are in parentheses. 2WD = two-wheel drive.
help the adviser decide among several otherwise comparablelight-duty trucks.
However, suppose that the customer says that he or sheplans to use the truck to haul heavy materials and to tow alarge motorboat (weighing 6500 pounds). No existing light-duty truck can tow such heavy loads effectively and safely.In contrast, no truck that can tow such heavy loads can fillthe customer’s requirements as expressed in previous ques-tion banks. If enough customers desire these combinationsof features, this may be an opportunity worth investigating:a light-duty truck that can occasionally haul heavy materialsor tow heavy loads. Note that the goal is to define the oppor-tunity by needs (light duty, haul heavy materials) rather thanfeatures (V8 engine). In this way, new vehicles can satisfythe newly identified combinations of customer needs withfeatures that may or may not be available in existingvehicles.
The intuition in this example is that the question bank ontowing and hauling revealed something about the customer’sunderlying needs. This new information suggests that thecustomer is not satisfied with the needs combinations pro-vided by existing trucks; the virtual adviser will need torevise its best-truck recommendation probability downward.This drop in the maximum recommendation probabilitybecomes a trigger for further investigation. We illustrate thistrigger mechanism with an arrow in the dialogue in Figure3. The fifth question bank, which included questions abouttowing and hauling, causes the most preferred vehicle tochange from the Mazda to a Ford Ranger (a slightly larger,more powerful compact truck). Utility drops because thismore powerful compact truck is an insufficient compromiseto meet both the towing and hauling requirements and therequirements expressed in the first four question banks (ithas a six-cylinder engine and is more expensive). A full-sized truck, such as the Chevrolet Silverado 1500, can fulfillthe towing and hauling requirements, but the adviser doesnot recommend the Silverado because it has poor ratings onthe other desired features. After further question banks, the
recommendation probabilities in Figure 3 again increasebecause the Ford Ranger fulfills the additional requirements.
The intuitive idea in Figure 3 has appeal, but before weincorporate the trigger mechanism, we must investigate itfurther. For example, the posterior probability might dropbecause there is error in the customer’s response. If the trig-ger mechanism is too sensitive, it might identify many falseneed-conflicts, and the true need-conflicts might be lost inthe noise. In contrast, if it is not sensitive enough, the trig-ger mechanism might miss opportunities. We show subse-quently, through simulation, how to select a sensitivity levelfor the trigger mechanism such that segments of customersdesiring known combinations of needs are recovered withsufficient precision. In the simulations, we begin with realdata for the conditional probabilities and create known seg-ments. We then add error and examine how various sensitiv-ity levels balance false positives and false negatives. Thesimulations demonstrate that calibration is feasible and thatthe performance of the listening-in mechanism is reasonablyrobust in the face of response errors. It is also reasonablyrobust with respect to the sensitivity levels chosen for thetrigger mechanism. Having thus established a reasonabledegree of internal validity, we are more confident in apply-ing the methodology to real data.
The other issue is theoretical. The intuition assumes thata drop in posterior probability identifies a conflict in thedesired customer needs that are fulfilled by existing vehi-cles. If a question bank affected only the vehicle that wasrecommended before the qth question bank and if that samevehicle were recommended after the qth question bank, thenmost random utility models would suggest that a probabilitydrop was an indicator of an underlying utility drop. Forexample, both the logit and the probit models have thisproperty. However, each question bank can affect the proba-bilities of all 148 vehicles and change the identity of the rec-ommended vehicle on the basis of the qth question bank. Wedemonstrate formally in the Appendix that the intuition stillholds. If the qth question bank does not change the identity

80 / Journal of Marketing, April 2004
6Such correlations across vehicles are consistent with local inde-pendence, which assumes response independence conditioned on agiven vehicle. Local independence enables customers to be hetero-geneous across vehicles in their answers to the question banks.
of the recommended vehicle, a drop in posterior probabilityis a necessary and sufficient condition indicating that therecommended vehicle has characteristics in conflict with thecustomer’s preferences. The more complex issue is when theqth question bank changes the identity of the recommendedvehicle. We show formally that if the recommended vehiclechanges and the posterior probability drops, it must be thecase that a truck with mixed characteristics would havehigher utility than the truck recommended either before orafter the qth question bank. We also show that the mixed-characteristic truck that is better for the customer is not anexisting truck.
Analyses to Identify Which Combinations ofCustomer Needs Are Not Satisfied
When a probability drop identifies a potential conflict, weseek further information to identify which customer needsare in conflict. We consider a null hypothesis that the exist-ing trucks satisfy (almost all) customer-needs combinations.This hypothesis implies that if two truck characteristics arepositively correlated among existing trucks, we expect themto be positively correlated among customers’ preferences, asrevealed by their answers to the questions banks. For exam-ple, on the basis of existing trucks, we expect that there is apositive correlation across vehicles of the probabilities thata customer will (1) use the truck for towing heavy loads and(2) prefer a rugged body style for that vehicle. In addition,we expect that there is a negative correlation of the proba-bilities that a customer will (1) use the truck for towingheavy loads and (2) prefer a compact body style. Because noexisting truck satisfies these needs simultaneously, recom-mendation probabilities will drop when the customerrequests a compact truck that can tow heavy loads (see theAppendix).
This means that we can identify the needs combinationsthat caused the drop by examining negative correlationsamong expected answers to the question banks for the ques-tions answered by customers who experienced a probabilitydrop. The probability drop challenges the null hypothesisand its implications. That is, customers who experience aprobability drop want some combinations of customer needsthat are negatively correlated in the existing market. To findthe desired combinations from the set of all negatively cor-related combinations, we limit our search to the need com-binations evaluated by customers with probability drops.
Formally, rrqrpis the correlation across vehicles of the
conditional probabilities of a customer answering rq to ques-tion bank q and answering rp to question bank p,6 and R isthe matrix of these correlations (here R is a capital r). When-ever a probability drop implies a potential opportunity, thelistening-in algorithm examines all correlations correspond-ing to that customer’s answers to the first q question banks(Rq – 1 � rq) and flags the ones that are highly negative (lessthan –.30 in our application). Such negative correlations
indicate why the (triggered) customer’s desired benefits(needs) are not fulfilled by existing trucks (subject to statis-tical confidence). The level of the flagging mechanism is setwith simulation.
The opportunity trigger identifies the customers whohave combinations of needs that are not satisfied, and it flagsspecific entries in the R matrix to identify combinations ofneeds that represent new opportunities. The combinations ofneeds are a working hypothesis for a new opportunity. How-ever, before the automotive firm can act on the workinghypothesis, it needs further information about the potentialopportunity, because the number of questions the virtualadviser uses is, by necessity, a compromise between effi-cient recommendation (fewer questions) and probes for newneeds combinations (more questions). To understand andexplore the opportunity more completely, listening in com-plements the virtual adviser and the trigger mechanism.
A Virtual Engineer Clarifies theOpportunity
The virtual engineer (VE) concentrates its questions toobtain relevant, more-detailed information about combina-tions of customer needs. The VE asks relatively few ques-tions of each targeted customer (six screens in our applica-tion), but across many customers, its questions span theneeds space. In our application, the VE explores an addi-tional 79 features beyond the 36 features explored in the vir-tual adviser. As is the virtual adviser, the VE is designed tobe flexible; its questions are updated continuously withoutthe need to recommission large-scale AIO surveys.
The concept of a VE is simple; its implementation diffi-cult. To be useful, the VE must ask the customer questionsthat inform the engineering design decisions that are neces-sary to design a truck to meet the customers’ newly identified(potential) combination of needs. To be credible to the cus-tomer, the VE must ask questions in a nontechnical mannerthat pertains to how the customer uses the truck. Naturally,the VE evolves through application, but we describe here theprocess by which the initial VE questions are created.
An engineering design team from a major automotivemanufacturer considered the basic engineering problemimposed by potential conflicting needs. The team then gen-erated the questions that it would need answered to clarifythe opportunity and to decide among basic solutions to con-flicts. The engineering team members formulated the ques-tions that they would ask the customer if they were partici-pating in the dialogue between the adviser and customer. Forexample, if a customer wants a compact truck that can towa large boat, the engineering team would ask about the typeof boat (e.g., modest sailboat, large motorboat, multiple JetSkis) and the weight of the boat that the customer plans totow. The engineering team would also ask the customer whyhe or she wants a compact truck (e.g., low price, tight park-ing, high maneuverability, fuel economy). All engineeringquestions are then rephrased into “customer language.”
In addition to the questions identified by the engineeringteam, the VE includes open-ended dialogues that enable thecustomer to elaborate further the reasons underlying the pre-viously unidentified combinations of needs. Figure 4 illus-

New Combinations of Customer Needs / 81
FIGURE 4Virtual Engineer
A: Introductory Screen B: Example Dialogue
C: Specific Questions to Elaborate D: Open-Ended Question
trates a sample dialogue in which the VE introduces himself,asks about a conflict, gathers quantitative data, and asks foropen-ended comments. In this example, the conflict isbetween a full-sized truck and a six-cylinder engine.
A Design Palette Solicits CustomerSolutions to Potential Conflicts
We supplement the VE with a design palette (DP) that cov-ers 14 features. The DP’s perspective is the customer’s ownsolutions (von Hippel 1986). The DP is similar to innovationtoolkits, configurators, and choice boards that enable cus-tomers to mix and match features (Dahan and Hauser 2002;Hauser and Toubia 2003; Liechty, Ramaswamy, and Cohen2001; von Hippel 2001).
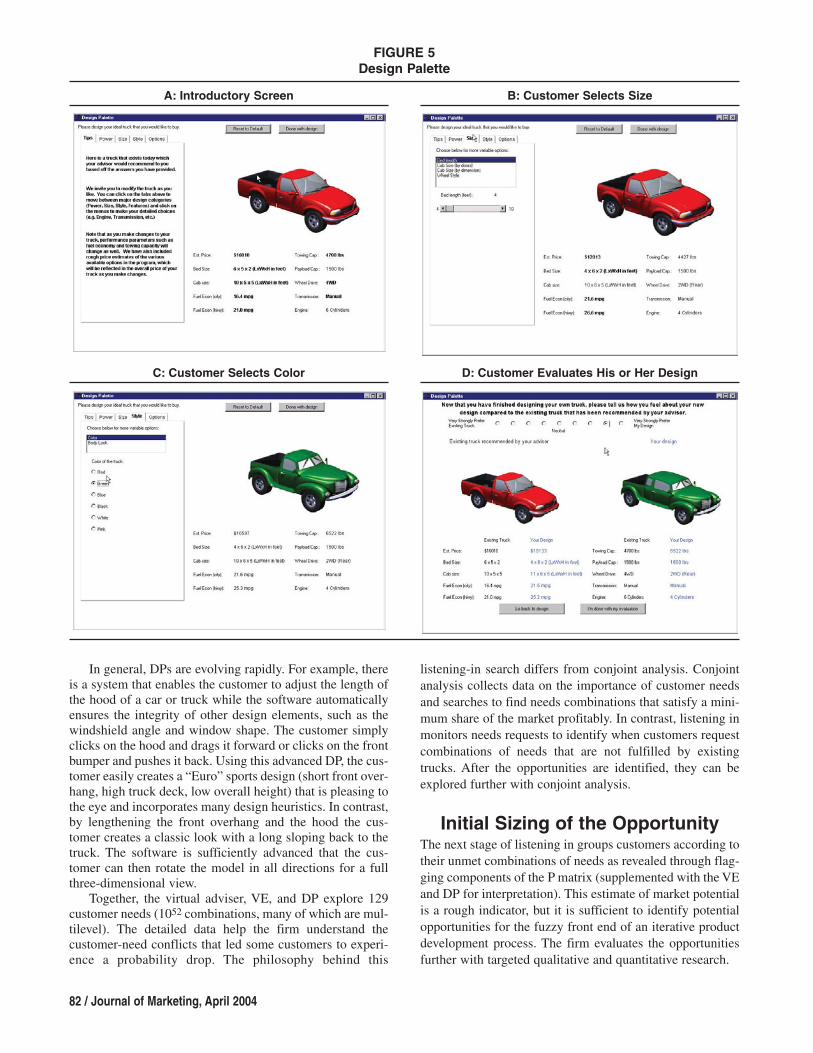
The DP is illustrated in Figure 5. The customer (1)receives instructions, (2) changes the size of the truck, and(3) changes the color. For brevity, we do not show the manyintermediate steps, some of which include new state-of-the-art truck features, such as four-wheel steering and extrawide
7Becuase of self-preference learning, memory accessibility, andcontext effects, the preference for the self-designed truck may beinflated (Simmons, Bickart, and Lynch 1993; Tourangeau, Rips,and Rasinski 2000). This does not diminish the value of the DP asa means to clarify opportunities.
frames. However, changes are not free for the customer.There are sophisticated engineering and cost models under-lying the DP. For example, if the customer changes the sizeof the truck, the price, fuel economy, and towing/payloadcapacity change accordingly. After completing the redesign,the customer is given the opportunity to indicate whetherand by how much he or she prefers the new design. (Thecustomer may not prefer the new design because of accu-mulated sticker shock or because of a holistic judgment ofthe final truck.) In the empirical application that we describesubsequently, 73% of the respondents who completed theexercise indicated that they would purchase their custom-designed truck were it available.7
82 / Journal of Marketing, April 2004
FIGURE 5Design Palette
A: Introductory Screen B: Customer Selects Size
C: Customer Selects Color D: Customer Evaluates His or Her Design
In general, DPs are evolving rapidly. For example, thereis a system that enables the customer to adjust the length ofthe hood of a car or truck while the software automaticallyensures the integrity of other design elements, such as thewindshield angle and window shape. The customer simplyclicks on the hood and drags it forward or clicks on the frontbumper and pushes it back. Using this advanced DP, the cus-tomer easily creates a “Euro” sports design (short front over-hang, high truck deck, low overall height) that is pleasing tothe eye and incorporates many design heuristics. In contrast,by lengthening the front overhang and the hood the cus-tomer creates a classic look with a long sloping back to thetruck. The software is sufficiently advanced that the cus-tomer can then rotate the model in all directions for a fullthree-dimensional view.
Together, the virtual adviser, VE, and DP explore 129customer needs (1052 combinations, many of which are mul-tilevel). The detailed data help the firm understand thecustomer-need conflicts that led some customers to experi-ence a probability drop. The philosophy behind this
listening-in search differs from conjoint analysis. Conjointanalysis collects data on the importance of customer needsand searches to find needs combinations that satisfy a mini-mum share of the market profitably. In contrast, listening inmonitors needs requests to identify when customers requestcombinations of needs that are not fulfilled by existingtrucks. After the opportunities are identified, they can beexplored further with conjoint analysis.
Initial Sizing of the OpportunityThe next stage of listening in groups customers according totheir unmet combinations of needs as revealed through flag-ging components of the R matrix (supplemented with the VEand DP for interpretation). This estimate of market potentialis a rough indicator, but it is sufficient to identify potentialopportunities for the fuzzy front end of an iterative productdevelopment process. The firm evaluates the opportunitiesfurther with targeted qualitative and quantitative research.

New Combinations of Customer Needs / 83
8There is self-selection because customers choose to initiate dia-logues with virtual advisers. Nonetheless, a large fraction of self-selected customers might be an important opportunity. We expectless self-selection as more truck customers use the Web to searchfor information.
Suppose that Ai represents customer i’s answers to thequestion banks. For each Ai, we identify a subset, Ri, of theR matrix that represents strongly negative correlations. Byclustering triggered respondents on Ri, we identify groups ofcustomers with similar combinations of desired needs thatare not fulfilled (on average) by existing trucks. Subject tothe caveat of self-selected customers, the size of the clusteras a fraction of the initial sample is a rough indicator of thesize of the segment that desires the identified combinationsof needs.8 To simulate a new truck design, we define a con-cept truck by the needs it fulfills as reflected by customers’answers to the question banks, P(rq|vj). These data are suffi-cient to calculate revised posterior probabilities for alltrucks, including the new-truck concept (Equation 2). Aver-aging of the revised posterior probabilities over respondentsprovides a rough estimate of the potential market share forthe new concept truck.
Monte Carlo Simulations:Sensitivity to Error and the Trigger
MechanismIf successful, listening in will affect billion-dollar decisionson new truck platforms. Before we can be confident in itsapplication, we must address the following issues: First, wewant to know whether listening in can recover opportunitiesfrom noisy data. This issue is best addressed with simulationbecause we can specify known segments of customers whohave unmet needs combinations. Second, applicationsrequire that the opportunity trigger be calibrated. Here, too,simulation is best to determine the best trigger sensitivity.Relevance and external validity are better addressed with aproof-of-concept application in which we listen in to realcustomers in a pilot study to determine whether unmet com-binations of needs can be identified. We hope that the pilotstudy at least can identify combinations of needs that werediscovered in parallel by other studies (at much greaterexpense). Recall that truck manufacturers routinely spendtens of millions of dollars annually on market research.
Simulation Methodology
We use the conditional probabilities, P(rq|vj), and R-matrixcorrelations based on the 100,000-respondent AIO studyand supplemental managerial judgment. On the basis of theproof-of-concept study we describe subsequently, we selectthree segments of customers whose needs are satisfied byexisting trucks (e.g., full-sized trucks that can tow and haullarge loads). The three segments provide a baseline fromwhich to test whether the methodology identifies falseopportunities. Next, we generate six segments with combi-nations of needs that are not satisfied by existing trucks. Wedefine their responses to the question banks to be consistentwith their desired benefits (needs). We attempt to test
whether listening in can recover these segments from noisydata. Because of the multiple stages of listening in, this is farfrom ensured. In total, we generate nine customer segmentsof 500 respondents each, for a total of 4500 simulatedrespondents.
We next add errors to the customers’ responses. For therq’s, which are nominal variables, we randomly select E% ofthe questions to be answered incorrectly. The incorrectanswers are distributed among the remaining categoriesaccording to a uniform distribution. For the wc’s, which areinterval-scaled variables (mean = 20), we simulate responseerror by adding a zero-mean, normally distributed responseerror such that the standard deviation of the error equals aspecified number of points (e). For simplicity, we truncatenegative self-explicated importances that, fortunately, occurwith low probability. We then apply the listening-in equa-tions to each of the 4500 simulated respondents. For clus-tering the R matrix, we use a k-means nontree clusteringalgorithm based on the Euclidean norm defined on thematrix of negative correlations from triggered respondents(respondents by potential conflict pairs; details are availableon request).
Internal Validity: Testing Recovery of UnmetNeeds Combinations from Noisy Data
As an initial test of internal validity, we add moderate noisewhere e = 5 points and E = 10%. We use a relatively sensi-tive opportunity trigger; we record conflict correlationswhenever P(v1|rq, Rq – 1) – P(v1|Rq – 1) £ .00005. We subse-quently examine sensitivity to this parameter.
Table 3 suggests that listening in can recover knownneeds combinations from moderately noisy data. The entriesindicate the number of respondents from a true segment(rows) that were assigned to a cluster (columns). We exam-ine Table 3 at the macro and micro levels.
The managerial focus is at the macro level. First, wenotice the diagonal nature of the data in Table 3; even withnoise in the data, listening in identified all five segments.Second, we examine the unmet combinations of needs thatdefined each segment. For example, the first known segmentwas defined by four need conflicts: compact truck/tow largeloads, compact truck/haul large loads, four-cylinder engine/tow large loads, and a four-cylinder engine/haul large loads.In Cluster 1, the percentages of respondents who had theseneeds were 95.9%, 82.4%, 77.3%, and 73.3%, respectively.We identified no other need conflict for more than 9.4% ofthe Cluster 1 respondents. We obtained similar results forthe other five known clusters. We identified no false-positiveneeds combinations at the macro level (Clusters 8 and 9 areredundant with Cluster 6).
At the micro level, we classified 82.7% of the respon-dents correctly. Most of the misclassifications were respon-dents who were classified falsely into the null segmentbecause of errors in their responses. The simulation identi-fied 21,096 conflict pairs compared with only 16,500 trueconflict pairs: 14% were false negatives, and 36% were falsepositives. Thus, response errors affect the classification ofspecific respondents. Fortunately, the macro-level identifi-cation of unmet needs combinations appears robust withrespect to the micro errors. We now test whether this insight

84 / Journal of Marketing, April 2004
TABLE 3Results of the Simulated Cluster Analysis
Number of Respondents Classified to Each Cluster
Needs Combinations 1 2 3 4 5 6 7 8 9 Total
Compact truck, large loads 418 0 0 1 0 0 81 0 0 500Sporty full-sized, short bed 1 422 0 0 0 0 77 0 0 500Compact truck, diesel 0 0 401 0 0 0 99 0 0 500Full-sized, extrashort bed 1 0 0 346 0 0 153 0 0 500Compact truck, ten cylinders 3 27 0 0 336 0 134 0 0 500Full-sized, maneuverable 0 2 0 0 0 346 92 43 17 500Null segment 43 0 2 1 0 0 1454 0 0 1500
Notes: Each known segment desired multiple needs combinations. Here, we list examples for each segment. The largest number in each rowis in boldface.
TABLE 4Calibrating the Opportunity Trigger
Percentage of Percentage of Percentage of FalseTrigger Respondents Opportunities Needs-Combinations OpportunitiesLevel Classified Correctly Identified Correctly Segments Identified Identified
t = .00000 82.73 100 100 0t = .00005 82.73 100 100 0t = .00010 82.69 100 100 0t = .00100 82.69 100 100 0t = .01000 56.69 63.6 63.4 0t = .10000 33.33 0 0 0
generalizes to other levels of errors (e and E) and other sen-sitivities of the opportunity trigger.
Setting the Sensitivity of the Opportunity Triggerand Its Relative Robustness
Table 4 repeats the simulations for various trigger sensitivi-ties (t) that vary from extremely sensitive (t = .00000) toextremely insensitive (t = .10000). At both the macro andmicro levels, listening in is relatively robust with respect tothe trigger level for t £ .001. For larger sensitivities, perfor-mance degrades. For extremely high t, all opportunities aremissed. On the basis of Table 4 and simulations with otherlevels of error, we recommend a sensitive trigger. The exactlevel is less critical as long as the level is less than .001.
Sensitivity to the Level of Response Errors
We now explore the sensitivity of listening in to responseerrors in the constant-sum question banks (e) and the nomi-nal question banks (E). We examine performance at both themacro level (percentage of needs combinations identified)and the micro level (percentage of respondents classifiedcorrectly). Table 5 suggests that performance is relativelyinsensitive to errors in the priors (wc’s), even for errors thatare 50% of the mean response (ten points). For a Bayesiansystem, we did not find this surprising; the impact of the pri-ors diminishes as more question banks are answered. How-ever, performance is sensitive to errors in the nominal ques-tion banks, with clear degradation at a 20% error. Such anerror rate would correspond to one of five respondents say-ing that they want a compact truck when they actually wanta large truck. Table 5 indicates that care must be taken in
9There appears to be a slight anomaly in Table 5. For E = 20%,classification and identification appear to increase slightly witherrors in the self-explicated importance. This happens because thecombination of errors pushes more respondents to the no-conflictclusters. As a result, a few more no-conflict respondents are classi-fied correctly, making it easier to achieve a majority in the remain-ing clusters. Neither difference is significant at the .05 level with atwo-tailed t-test.
Web design to engage customers with clear questions so thaterror rates (E) remain at 10% or lower.9
Summary
Together, Tables 3, 4, and 5 suggest that a reasonable levelof internal validity exists despite errors in both the priorpreferences and the responses to the question banks. As longas the trigger level is relatively sensitive (£.001) and thenominal error is moderate (£10%), listening in can identifyknown segments of customers who desire combinations ofneeds that existing trucks do not meet. Recovery is not per-fect when there are response errors, but this level of recov-ery should be sufficient for the fuzzy front end of productdevelopment, especially when final managerial decisionsare refined with subsequent qualitative and quantitative data.
Proof-of-Concept Application andTest
Before bringing online listening in to a situation in whichmore than 350,000 customers are tracked annually, webelieved it was important to test the methodology in a pilot

New Combinations of Customer Needs / 85
Response Errors e = 0 e = 5 e = 10(Updating) Points Points Points
Macro Level: Percentage of Unmet Needs CombinationsIdentified Correctly
E = 0% 100% 100% 100%E = 10% 100% 100% 100%E = 20% 93.9% 75.8% 81.8%
Micro Level: Percentage of Respondents ClassifiedCorrectly
E = 0% 100% 99.9% 99.9%E = 10% 82.9% 82.7% 81.8%E = 20% 61.6% 55.0% 56.8%
Errors in the Self-Explicated Importance (Priors)
TABLE 5Sensitivity to Response Errors
TABLE 6Elaboration of Customer Needs for a Full-Sized Maneuverable Pickup Truck
Why I Need a Maneuverable Pickup Truck Why I Need a Full-Sized Pickup Truck
Frequent city driving 66% Large passenger capacity 73%Tight parking 58% Large payloads 50%I make many U-turns 26% Full-sized style 39%Too many traffic jams 28%
10We based this initial test on a stratified random sample of thepanel. For this test, all customers were given the opportunity to usethe DP.
test with real customers. In August 2001, an automotivemanufacturer sponsored a study in which 1092 pickup-truckcustomers were recruited from the Harris Interactive Paneland given a $20 incentive to participate in the test.10 Onaverage, each customer spent 45 minutes with the virtualadviser, DP, and VE (when triggered). Most customersfound the experience worthwhile. Customers trusted the vir-tual adviser by an eight-to-one margin over dealers andwould be more likely to purchase a vehicle recommended bythe virtual adviser by a four-to-one margin over a vehiclerecommended by a dealer. For the DP, 78% of participantsfound using it an enjoyable experience, and 82% believed itwas a serious exercise. When the VE was triggered, 88% ofparticipants found the questions easy to answer, and 77%believed that the VE related well to their needs. Notably,56% of the participants reported that they would pay for theadvice provided by the virtual adviser if it were included inthe price of the pickup truck that they purchased as a resultof using the adviser.
With a sensitive trigger, the most common pairwise con-flicts were a maneuverable full-sized truck (38%), a com-pact truck that could tow and haul heavy materials (14%),and a full-sized truck with a six-cylinder engine (7%). Twosegments of customers were identified that expressed unmetcombinations of needs. Segment 1 requested large trucks butindicated a desire for maneuverability. Segment 1 consistedof two groups: customers who wanted a top-of-the-line
11We obtain rough forecasts by adding a full-sized maneuver-able pickup truck to the choice sets of the needs-segment cus-tomers. We obtain P(rq|vj) for the new vehicle by assuming a pro-file similar to an existing vehicle except for the critical responseson the size and maneuverability questions, which we changed to beconsistent with the vehicle being both full-sized and maneuverable.The iterative use of Equation 1 provides the estimates.
truck and customers who wanted a standard full-sizedpickup truck. Segment 2 requested a compact truck thatcould tow and haul heavy loads. Table 6 provides moredetail on Segment 1. From the VE, we learned that respon-dents use full-sized trucks for city driving. Large trucksfulfill critical needs for large passenger capacity and largepayloads. However, the respondents also desired maneuver-ability: combinations of benefits (needs) that are not avail-able with existing trucks.
The DP explored Segment 1’s desires further. The fea-tures that they changed most often were truck height (6¢ to7¢), truck width (6¢ to 7¢), and steering (two-wheel to four-wheel steering). This suggests that these customers desire aneven larger truck but that they would be interested in four-wheel steering to gain maneuverability. Using the methodsdescribed previously for market sizing, we estimated thepotential market share of a full-sized truck with four-wheelsteering. On the basis of cost models, we calculated that theextra features would increase the manufacturer’s suggestedretail price by $3,000. For this concept truck, the listening-in equations estimate a market-share increase for the manu-facturer of 3%–4% (we coded the exact value for confiden-tiality).11 Such a $2.4 billion–$3.2 billion annual opportunityis worth further investigation. In addition, a compact truckwith heavy-duty hauling and towing is estimated to be a $1billion–$2 billion opportunity (values are coded). Techni-cally, the benefit (needs) combinations are feasible with theuse of a small truck platform that has a strong frame, trans-mission, and engine.
After we completed our study, we learned that an auto-motive manufacturer was in the process of introducing four-wheel steering to improve the maneuverability of its top-of-the-line pickup truck, which was previously unknown to us.This combination of needs had been identified with tradi-tional methods (Table 1) but at a significantly greater cost.This truck is now selling well. We plan to monitor the salesof this truck to determine whether its sales are in the roughrange predicted by the market-sizing equations. We foundno indication that traditional methods identified the need fora basic truck with four-wheel steering. We plan to monitorwhether traditional methods confirm such a combination ofneeds.
86 / Journal of Marketing, April 2004
Summary, Discussion, and FurtherResearch
In this article, we explore a methodology to listen in on cus-tomer dialogues with virtual advisers to identify combina-tions of customer needs that are not fulfilled by existingtrucks. Monte Carlo analyses suggest that listening in isinternally valid and relatively robust with respect toresponse errors and trigger sensitivity. A proof-of-conceptdemonstration suggests that unmet needs combinations forreal respondents can be identified.
As with all methodologies, listening in will benefit fromcontinuous improvement. Each stage can be improved; bet-ter methods to identify priors, more efficient look-aheadalgorithms, improved calibration of the trigger mechanism,and better indicators of conflicting needs all can benefitfrom further research. The dialogues, the user interfaces,and the presentation of stimuli are all areas of potentialimprovement. For example, work is now underway to putmore stretch into the DP and to give the virtual adviser andthe VE personalities based on “talking heads.” The variousstages of listening in are designed to be modular. Furtherresearch might explore other advisers, triggering mecha-nisms, means to identify and size segments (e.g., latentstructure analysis), and applications (e.g., telecommunica-tions, consumer electronics, travel services, financialservices).
AppendixFormal Derivation of Trigger
MechanismThe listening-in methodology uses a trigger mechanism toinvoke the VE and DP. We argue intuitively in the text thatsuch a drop in the recommendation probability (Equation 1)is an indication that existing trucks do not fulfill desiredcombinations of customer needs. Here, we demonstrate witha formal analytical model that such a drop identifies oppor-tunities. The issue is not trivial because a question bank, q,potentially affects the updated utilities of each and everyproduct in the market, not just the recommended product.The formal analysis identifies the net effects.
Although our application uses complex question banksfor 148 trucks, we can illustrate the basic principles withN = 3 and a dichotomous question bank. (Our propositionsgeneralize to analogs for larger N and for polychotomousquestion banks, but the notation is cumbersome.) Followingthe text, j indexes the vehicles. Without loss of generality, v1is the recommended product after question bank q – 1. Inaddition, represents customer benefits (needs) that are notaffected by question bank q, and represents customer ben-efits (needs) that are affected by question bank q. In this for-mulation, we treat price as a characteristic, and it can be ineither or (for motivation, see Hauser and Urban 1996).Following Blackorby, Primont, and Russell (1975), wemodel preferences using a utility tree such that u( , ) =ux( ) + uy( ) + e, where e is a Gumbel-distributed errorterm that represents the uncertainty in utility due to questionbanks that have not yet been asked (or may never need to beasked). For simplicity, we assume that trucks with =
rygood
ry j
ry j
rx j
ry j
rx j
ry j
rx j
ry j
rx j
experience an increase in utility, and trucks with = experience a decrease in utility. (The dichotomous questionbank reveals which customer benefits are desired.) We let v2be a surrogate for products with desirable characteristics andv3 be a surrogate for products with undesirable characteris-tics (as revealed by question bank q). Following McFadden(1974), we write the recommendation probabilities in morefundamental utility-theory terms (where V is the total num-ber of vehicles):
After question bank q, two situations can occur: The rec-ommended truck remains v1 or it becomes v2. It cannotbecome v3, because even if = , v1 would still be pre-ferred over v3. The following propositions address the twosituations. Together, they indicate that whenever the recom-mendation probability drops, an opportunity exists for a newhigher-utility truck with mixed characteristics.
P1: If the recommended truck after question bank q is the sametruck as that recommended after question bank q – 1, thenv1 has undesirable characteristics ( = ) if and only ifP(v1|rq, Rq – 1) decreases. If the probability decreases, anew truck with mixed characteristics has higher utility thandoes the recommended truck. That new truck is not cur-rently available in the marketplace.
P2: If the recommended truck after question bank q is differentfrom the truck recommended after question bank q – 1 andif the recommendation probability decreases, then v1 hasundesirable characteristics ( = ). A new truck withmixed characteristics has higher utility than both the rec-ommended truck after q – 1 question banks and the recom-mended truck after q question banks. That new truck is notcurrently available in the marketplace.
Proofs
Straightforward algebra establishes that P(v1|rq, Rq – 1) –P(v1|Rq – 1) is proportional to
if = and that– £ 0 if =
. Algebra also establishes that the proportionality(denominator) is positive. This establishes the first statementin P1 and implies that = if the probability drops.Because u1( ) + uy( ) > u1( ) + uy( ), a new prod-uct with and has higher utility. If the recommendedtruck changes after question bank q, then P(v1|rq, Rq – 1) <P(v2|rq, Rq – 1), and because the recommendation probabilitydecreases, we have P(v2|rq, Rq – 1) < P(v1|Rq – 1). Thus,P(v1|rq, Rq – 1) < P(v1|Rq – 1), and by P1, we have = .This establishes the first result in P2. Because v1 was rec-ommended before question bank q, we have
; by supposition, we have – > 0.Thus, a product with the features and will have higherutility than either v1 or v2. This establishes the second resultin P2. In both propositions, we know that the new truck does
ry2
rx1
u yy bad( )r
u yy good( )r
u xx ( )r
2
u xx ( )r
1 >
rybad
ry1
rygood
rx1
rybad
rx1
rygood
rx1
rybad
ry1
rybad
ry1eu x u x u yx x y good( ) ( ) ( )
r r r1 2+ +eu x u x u yx x y bad( ) ( ) ( )
r r r1 2+ +
rygood
ry1eu x u x u yx x y bad( ) ( ) ( )
r r r1 3 0+ + ≥
eu x u x u yx x y good( ) ( ) ( )r r r
1 3+ + -
rybad
ry1
rybad
ry1
rybad
ry1
( ) ( | , )( ) ( )
( ) ( )
( ) ( )
( ) ( ) ( ) ( ) ( )
A P v r Re
e
e
e e e
j q q
u x u y
u x u y
m
V
u x u y
u x u y u x u y u x u
x j y j
x m y m
x j y j
x y x y good x y
1 1
1
1 1 2 3
-+
+
=
+
+ + +
=
=+ +
Â
r r
r r
r r
r r r r r(( ) .rybad
rybad
ry j
New Combinations of Customer Needs / 87
not currently exist, because if it were available, it wouldhave higher utility and thus would have been recommended.
Generalizations
If there are n2 trucks similar to v2 and n3 trucks similar to v3,the analogs to P1 and P2 are readily proved. The numbers n2and n3 enter the equations for P(v1|rq, Rq – 1) – P(v1|Rq – 1),but the basic proofs remain intact. If there are many truckswith or but different , the expressions for
rx j
rybad
rygood
P(v1|rq, Rq – 1) – P(v1|Rq – 1) include more terms, but eachcan be proved to have the correct sign (i.e., increases if and decreases if ). With these changes, the remainingportions of the proofs follow as we have showed.
We use Equation 1 to make the proofs transparent. Bothpropositions can be generalized to other probability modelswith the appropriate characteristics. We leave the details ofthese generalizations to readers.
rybad
rygood
REFERENCESAllpar.com (2003), “A Brief History of the Minivan,” (accessed
December 1, 2004), [available at http://www.allpar.com/model/m/history.html].
Balasubramanian, Siva K. and Wagner A. Kamakura (1989), “Mea-suring Consumer Attitudes Toward the Marketplace with Tai-lored Interviews,” Journal of Marketing Research, 26 (August),311–26.
Barabba, Vincent P. (2004), Surviving Transformation: Lessonsfrom GM’s Surprising Turnaround. New York: Oxford Univer-sity Press.
——— and Gerald Zaltman (1991), Hearing the Voice of the Mar-ket: Competitive Advantage Through Creative Use of Informa-tion. Boston: Harvard Business School Press.
Blackorby, C., D. Primont, and R.R. Russell (1975), “Budgeting,Decentralization, and Aggregation,” Annals of Economic SocialMeasurement, 4 (1), 23–24.
ClassicPonyCars.com (2002), “History of the Ford Mustang,”(accessed December 31, 2002), [available at http://www.clas-sicponycars.com/history.html].
Dahan, Ely and John R. Hauser (2002), “The Virtual Customer,”Journal of Product Innovation Management, 19 (September),332–53.
Gallagher, Robert (1968), Information Theory and Reliable Com-munication. New York: John Wiley & Sons.
Green, Paul E. and V. Srinivasan (1990), “Conjoint Analysis inMarketing: New Developments with Implications for Researchand Practice,” Journal of Marketing, 54 (October), 3–19.
Griffin, Abbie J. and John R. Hauser (1993), “The Voice of theCustomer,” Marketing Science, 12 (Winter), 1–27.
Gutman, Jonathan (1982), “A Means–End Chain Model Based onCustomer Categorization Processes,” Journal of Marketing, 46(Spring), 60–72.
Hauser, John R. (1978), “Testing the Accuracy, Usefulness, andSignificance of Probabilistic Models: An Information TheoreticApproach,” Operations Research, 26 (May–June), 406–421.
——— and Olivier Toubia (2003), “Properties of Preference Ques-tions: Utility Balance, Choice Balance, Configurators, and M-Efficiency,” working paper, Massachusetts Institute of Technol-ogy Center for Innovation in Product Development.
——— and Glen L. Urban (1986), “Value Priority Hypotheses forConsumer Budget Plans,” Journal of Consumer Research, 12(March), 446–62.
Herniter, Jerry (1973), “An Entropy Model of Brand PurchaseBehavior,” Journal of Marketing Research, 10 (November),361–75.
J.D. Power and Associates (2001), New Autoshopper.com Study.Agoura Hills, CA: J.D. Power and Associates.
Kamakura, Wagner A. and Michel Wedel (1995), “Life-Style Seg-mentation with Tailored Interviewing,” Journal of MarketingResearch, 32 (August), 308–317.
Kullback, S. (1954), Information Theory and Statistics. New York:John Wiley & Sons.
Liechty, John, Venkatram Ramaswamy, and Steven Cohen (2001),“Choice Menus for Mass Customization: An ExperimentalApproach for Analyzing Customer Demand with an Applica-tion to a Web-Based Information Service,” Journal of Market-ing Research, 38 (May), 183–96.
McFadden, Daniel (1974), “Conditional Logit Analysis of Qualita-tive Choice Behavior,” in Frontiers in Econometrics, P. Zarem-bka, ed. New York: Academic Press, 105–142.
Plummer, Joseph T. (1974), “The Concept and Application of LifeStyle Segmentation,” Journal of Marketing, 38 (January),33–37.
Prelec, Drazen (2001), “A Two-Person Scoring Rule for SubjectiveReports,” working paper, Sloan School of Management, Mass-achusetts Institute of Technology.
Savage, L.J. (1971), “Elicitation of Personal Probabilities andExpectations,” Journal of the American Statistical Association,66, 783–801.
Simmons, Carolyn J., Barbara A. Bickart, and John G. Lynch Jr.(1993), “Capturing and Creating Public Opinion in SurveyResearch,” Journal of Consumer Research, 30 (September),316–29.
Singh, Jagdip, Roy D. Howell, and Gary K. Rhoads (1990), “Adap-tive Designs for Likert-Type Data: An Approach for Imple-menting Marketing Surveys,” Journal of Marketing Research,27 (August) 304–321.
Tourangeau, Roger, Lance J. Rips, and Kenneth A. Rasinski(2000), The Psychology of Survey Response. New York: Cam-bridge University Press.
Ulrich, Karl T. and Steven D. Eppinger (1995), Product Design andDevelopment. New York: McGraw-Hill.
Urban, Glen L. and John R. Hauser (1993), Design and Marketingof New Products, 2d ed. Englewood Cliffs, NJ: Prentice Hall.
———, Bruce Weinberg, and John R. Hauser (1996), “PremarketForecasting of Really-New Products,” Journal of Marketing,60, (January), 47–60.
von Hippel, Eric (1986), “Lead Users: A Source of Novel ProductConcepts,” Management Science, 32 (7), 791–805.
——— (2001), “Perspective: User Toolkits for Innovation,” Jour-nal of Product Innovation Management, 18 (4), 247–57.
Zaltman, Gerald (1997), “Rethinking Market Research: PuttingPeople Back In,” Journal of Marketing Research, 23 (Novem-ber), 424–37.
