lite-on technology corporation and subsidiaries
TRANSCRIPT

Lite-On Technology Corporation and Subsidiaries Consolidated Financial Statements for the Years Ended December 31, 2018 and 2017 and Independent Auditors’ Report

- 1 -
DECLARATION OF CONSOLIDATION OF FINANCIAL STATEMENTS OF AFFILIATES
The companies required to be included in the consolidated financial statements of affiliates in accordance
with the “Criteria Governing Preparation of Affiliation Reports, Consolidated Business Reports and
Consolidated Financial Statements of Affiliated Enterprises” for the year ended December 31, 2018 are
all the same as the companies required to be included in the consolidated financial statements of parent
and subsidiary companies as provided in International Financial Reporting Standards No. 10
“Consolidated Financial Statements”. Relevant information that should be disclosed in the consolidated
financial statements of affiliates has all been disclosed in the consolidated financial statements of parent
and subsidiary companies. Hence, we do not prepare a separate set of consolidated financial statements of
affiliates.
Very truly yours,
LITE-ON TECHNOLOGY CORPORATION
By
RAYMOND SOONG
Chairman
February 26, 2019


- 3 -
For the year ended December 31, 2018, the key audit matters for the Group’s consolidated financial
statements were as follows:
Allowance for Impairment Loss for Trade Receivables
The recoverable amount from the allowance for impairment loss is determined by management’s
evaluation of the credit risk of overdue receivables, and it is affected by management’s assumption
of a client’s credit quality. In our audit, we focused on clients with significant trade receivables and
overdue balances, and we evaluated the reasonableness of management’s estimation of the
allowance for impairment loss.
Refer to Note 4 to the consolidated financial statements for a summary of significant accounting
policies. Refer to Note 13 to the consolidated financial statements for the carrying amount of trade
receivables and impairment loss for trade receivables. Our key audit procedures in respect of the
above area included the following:
We assessed both the trade receivables aging report classified by client’s credit rating and the
reasonableness of the percent of impairment loss allowance; this assessment included the
implementation of computer audit sampling procedures to test the correctness of trade receivable
aging reports. We confirmed the recoverability of outstanding trade receivables by testing the after
period-end collection of receivables.
Allowance for Inventory Valuation Loss
The value of inventory is affected by the volatility of market demand and ever-changing
technology which could make inventory outdated and obsolete. The allocation of inventory cost
elements and estimations of the net realizable value of inventory require management’s subjective
judgment. In our audit, we focused on whether the value of inventory was evaluated according to
IAS 2, which is based on the lower of cost or net realizable value method. We also assessed the
reasonableness of management’s estimation of the allowance for inventory valuation loss.
Refer to Note 4 to the consolidated financial statements for a summary of significant accounting
policies. Refer to Note 14 to the consolidated financial statements for the carrying amount of
inventory. Our key audit procedures in respect of the above area included the following:
1. We assessed both inventory aging reports classified by business segments and the
reasonableness of the percent of allowance for inventory valuation loss; this assessment
included the implementation of computer audit sampling procedures to test the correctness of
inventory aging reports.
2. We obtained information of the year-end allowance for inventory valuation loss and inventory
aging reports, and we compared the current and prior years’ allowances and analyzed any
differences. We drew samples from the year-end inventory and compared the most recent price
of goods sold to the carrying amount to ensure that the inventory had been valued by the lower
of cost or net realizable value method.

- 4 -
Impairment Loss for Property, Plant and Equipment and Intangible Assets (Including Goodwill)
Management should assess, on the financial statement date, any indication of impairment to
property, plant and equipment and intangible assets. If there is any indication of impairment,
management should estimate the recoverable amount of these assets. If it is impossible to do so,
management should estimate the recoverable amount of the cash generating units to which these
assets belong. Due to the complexity of this impairment estimation, in our audit, we focused on
whether the estimation was made in accordance with IAS 36 to ensure that all assets’ carrying
amounts did not exceed their respective recoverable amounts.
Refer to Note 4 to the consolidated financial statements for a summary of the significant
accounting policies on property, plant and equipment and intangible assets impairment. Refer to
Notes 18 and 20 to the consolidated financial statements for disclosures of property, plant and
equipment and intangible assets. Our key audit procedures performed in respect of the above area
included the following:
1. Through internal control testing, we understood the methods of asset impairment valuation
made by management and the associated control policy’s design and implementation.
2. We obtained the asset impairment valuation table of each cash generating unit from
management. We consulted our firm experts on the reasonableness of management’s
impairment assessments and assumptions, including its cash generating unit classifications,
cash flow predictions, discount rates, etc.
Other Matter
We have also audited the parent company only financial statements of Lite-On Technology
Corporation as of and for the years ended December 31, 2018 and 2017 on which we have issued
an unmodified opinion.
Responsibilities of Management and Those Charged with Governance for the Consolidated
Financial Statements
Management is responsible for the preparation and fair presentation of the consolidated financial
statements in accordance with the Regulations Governing the Preparation of Financial Reports by
Securities Issuers and IFRS, IAS, IFRIC and SIC endorsed and issued into effect by the Financial
Supervisory Commission of the Republic of China, and for such internal control as management
determines is necessary to enable the preparation of consolidated financial statements that are free
from material misstatement, whether due to fraud or error.
In preparing the consolidated financial statements, management is responsible for assessing the
Group’s ability to continue as a going concern, disclosing, as applicable, matters related to going
concern and using the going concern basis of accounting unless management either intends to
liquidate the Group or to cease operations, or has no realistic alternative but to do so.
Those charged with governance, including the audit committee, are responsible for overseeing the
Group’s financial reporting process.

- 5 -
Auditors’ Responsibilities for the Audit of the Financial Statements
Our objectives are to obtain reasonable assurance about whether the consolidated financial
statements as a whole are free from material misstatement, whether due to fraud or error, and to
issue an auditors’ report that includes our opinion. Reasonable assurance is a high level of
assurance, but is not a guarantee that an audit conducted in accordance with the auditing standards
generally accepted in the Republic of China will always detect a material misstatement when it
exists. Misstatements can arise from fraud or error and are considered material if, individually or in
the aggregate, they could reasonably be expected to influence the economic decisions of users
taken on the basis of these consolidated financial statements.
As part of an audit in accordance with auditing standards generally accepted in the Republic of
China, we exercise professional judgment and maintain professional skepticism throughout the
audit. We also:
1. Identify and assess the risks of material misstatement of the consolidated financial statements,
whether due to fraud or error, design and perform audit procedures responsive to those risks,
and obtain audit evidence that is sufficient and appropriate to provide a basis for our opinion.
The risk of not detecting a material misstatement resulting from fraud is higher than for one
resulting from error, as fraud may involve collusion, forgery, intentional omissions,
misrepresentations, or the override of internal control.
2. Obtain an understanding of internal control relevant to the audit in order to design audit
procedures that are appropriate in the circumstances, but not for the purpose of expressing an
opinion on the effectiveness of the Group’s internal control.
3. Evaluate the appropriateness of accounting policies used and the reasonableness of accounting
estimates and related disclosures made by management.
4. Conclude on the appropriateness of management’s use of the going concern basis of
accounting and, based on the audit evidence obtained, whether a material uncertainty exists
related to events or conditions that may cast significant doubt on the Group’s ability to
continue as a going concern. If we conclude that a material uncertainty exists, we are required
to draw attention in our auditors’ report to the related disclosures in the consolidated financial
statements or, if such disclosures are inadequate, to modify our opinion. Our conclusions are
based on the audit evidence obtained up to the date of our auditors’ report. However, future
events or conditions may cause the Group to cease to continue as a going concern.
5. Evaluate the overall presentation, structure and content of the financial statements, including
the disclosures, and whether the consolidated financial statements represent the underlying
transactions and events in a manner that achieves fair presentation.
6. Obtain sufficient and appropriate audit evidence regarding the financial information of entities
or business activities within the Group to express an opinion on the consolidated financial
statements. We are responsible for the direction, supervision, and performance of the group
audit. We remain solely responsible for our audit opinion.
We communicate with those charged with governance regarding, among other matters, the planned
scope and timing of the audit and significant audit findings, including any significant deficiencies
in internal control that we identify during our audit.
We also provide those charged with governance with a statement that we have complied with
relevant ethical requirements regarding independence, and communicate with them all relationships
and other matters that may reasonably be thought to bear on our independence, and where
applicable, related safeguards.


- 7 -
LITE-ON TECHNOLOGY CORPORATION AND SUBSIDIARIES
CONSOLIDATED BALANCE SHEETS
DECEMBER 31, 2018 AND 2017
(In Thousands of New Taiwan Dollars)
2018 2017
ASSETS Amount % Amount %
CURRENT ASSETS
Cash and cash equivalents (Note 6) $ 63,285,301 32 $ 57,783,860 30 Financial assets at fair value through profit or loss (''FVTPL'') (Note 7) 132,139 - 101,677 -
Financial assets at amortized cost (Note 9) 223,738 - - - Contracts assets 3,024,589 2 - -
Debt instruments with no active market (Note 12) - - 911,783 1
Notes receivable, net (Note 13) 697,671 - 282,316 - Trade receivables, net (Note 13) 45,484,821 23 52,037,732 27
Trade receivables from related parties (Note 33) 90,095 - 79,288 -
Other receivables 10,910,806 6 1,364,028 1 Other receivables from related parties (Note 33) 4,417 - 2,806 -
Inventories, net (Note 14) 31,493,066 16 28,312,572 15
Non-current assets held for sale (Note 16) - - 815,143 - Other current assets (Note 21) 2,638,275 1 3,372,102 2
Total current assets 157,984,918 80 145,063,307 76
NON-CURRENT ASSETS
Financial assets at FVTPL (Note 7) 111,220 - - - Financial assets at fair value through other comprehensive income ("FVTOCI") (Note 8) 388,675 - - -
Available-for-sale financial assets (Note 11) - - 513,129 -
Financial assets at amortized cost (Note 9) 395,301 - - - Debt instruments with no active market (Note 12) - - 573,085 -
Investments accounted for using the equity method (Note 17) 4,972,609 3 3,681,951 2
Property, plant and equipment, net (Note 18) 20,484,992 10 22,490,411 12 Investment properties, net (Note 19) 1,178,393 1 1,426,134 1
Intangible assets, net (Note 20) 5,914,084 3 9,828,658 5
Deferred tax assets (Note 28) 4,333,202 2 3,614,920 2 Refundable deposits 499,984 - 641,387 -
Prepaid investments - - 1,354,950 1
Other non-current assets (Note 21) 872,691 1 807,825 1
Total non-current assets 39,151,151 20 44,932,450 24
TOTAL $ 197,136,069 100 $ 189,995,757 100
LIABILITIES AND EQUITY
CURRENT LIABILITIES
Short-term borrowings (Note 22) $ 30,087,282 15 $ 30,155,790 16
Financial liabilities at FVTPL (Note 7) 51,877 - 147,052 -
Notes payable 18,235 - 38,797 -
Trade payables 52,309,412 27 56,152,649 30
Trade payables to related parties (Note 33) 781,623 - 803,894 -
Other payables 29,388,957 15 21,123,576 11
Other payables to related parties (Note 33) 16,684 - 19,927 -
Current tax liabilities 4,986,079 3 3,221,310 2
Provisions (Note 24) 1,011,238 - 866,119 -
Advance receipts 1,959,041 1 2,049,789 1
Current portion of long-term borrowings (Note 22) 184 - 16,204 -
Finance lease payables (Note 23) 1,469 - 1,600 -
Total current liabilities 120,612,081 61 114,596,707 60
NON-CURRENT LIABILITIES
Long-term borrowings, net of current portion (Note 22) - - 178 -
Deferred tax liabilities (Note 28) 1,605,349 1 1,324,792 1
Finance lease payables, net of current portion (Note 23) 351 - 1,764 -
Net defined benefit liabilities (Note 25) 160,997 - 224,025 -
Guarantee deposits 78,890 - 80,862 -
Total non-current liabilities 1,845,587 1 1,631,621 1
Total liabilities 122,457,668 62 116,228,328 61
EQUITY ATTRIBUTABLE TO OWNERS OF THE PARENT COMPANY
Share capital
Ordinary shares 23,508,670 12 23,508,670 12
Capital surplus
Additional paid-in capital from share issuance in excess of par value 3,471,812 2 9,372,488 5
Bond conversions 7,462,138 4 7,462,138 4
Treasury share transactions 477,697 - 400,329 -
Difference between consideration and carrying amounts adjusted arising from changes in percentage of ownership of subsidiaries 47,209 - 49,019 -
Changes in capital surplus from investments in associates accounted for using the equity method 271,367 - 276,782 -
Mergers 10,015,194 5 10,015,194 6
Total capital surplus 21,745,417 11 27,575,950 15
Retained earnings
Legal reserve 12,049,900 6 11,786,967 6
Special reserve 2,705,954 2 1,338,878 1
Unappropriated earnings 15,789,147 8 10,093,753 5
Total retained earnings 30,545,001 16 23,219,598 12
Other equity
Exchange differences on translating foreign operations (2,779,863 ) (2 ) (2,528,893 ) (1 )
Unrealized loss of financial assets at FVTOCI (449,461 ) - - -
Unrealized loss on available-for-sale financial assets - - (18,497 ) -
Gain on financial instruments in cash flow hedging securities 2,714 - 3,372 -
Total other equity (3,226,610 ) (2 ) (2,544,018 ) (1 )
Treasury shares (1,248,722 ) (1 ) (1,248,722 ) (1 )
Total equity attributable to owners of the Parent Company 71,323,756 36 70,511,478 37
NON-CONTROLLING INTERESTS 3,354,645 2 3,255,951 2
Total equity 74,678,401 38 73,767,429 39
TOTAL $ 197,136,069 100 $ 189,995,757 100
The accompanying notes are an integral part of the consolidated financial statements.

- 8 -
LITE-ON TECHNOLOGY CORPORATION AND SUBSIDIARIES
CONSOLIDATED STATEMENTS OF COMPREHENSIVE INCOME
FOR THE YEARS ENDED DECEMBER 31, 2018 AND 2017
(In Thousands of New Taiwan Dollars, Except Earnings Per Share)
2018 2017
Amount % Amount %
OPERATING REVENUE
Sales (Notes 27 and 33) $ 211,390,341 102 $ 220,857,071 103
Less: Sales allowance 3,102,425 1 5,075,609 2
Sales returns 1,178,828 1 1,217,140 1
Total operating revenue 207,109,088 100 214,564,322 100
COST OF GOODS SOLD (Notes 14, 30 and 33) 180,006,839 87 186,854,505 87
GROSS PROFIT 27,102,249 13 27,709,817 13
OPERATING EXPENSES (Notes 30 and 33)
Selling and marketing expenses 7,084,795 3 6,774,460 3
General and administrative expenses 6,116,248 3 6,175,520 3
Research and development expenses 6,348,444 3 6,415,873 3
Expected credit loss (Note 32) 66,949 - - -
Total operating expenses 19,616,436 9 19,365,853 9
OPERATING INCOME 7,485,813 4 8,343,964 4
NON-OPERATING INCOME AND EXPENSES
Share of profit of associates 178,863 - 170,309 -
Interest income 1,710,052 1 1,365,837 -
Dividend income 39,400 - 39,811 -
Other income (Note 33) 5,265,003 2 1,401,724 1
Net gain on disposal of investments (Note 17) 86,603 - 179,115 -
Net gain (loss) on foreign currency exchange (497,693) - 226,478 -
Net gain on financial assets at FVTPL 1,338,423 1 341,680 -
Finance costs (875,318) (1) (603,844) -
Other expenses (380,339) - (937,955) (1)
Net loss on disposal of property, plant and equipment (20,018) - (96,747) -
Net loss on disposal of intangible asset (6) - - -
Impairment loss (Notes 11, 17, 18 and 20) (3,546,662) (2) (7,058,778) (3)
Total non-operating income and expenses 3,298,308 1 (4,972,370) (3)
PROFIT BEFORE INCOME TAX 10,784,121 5 3,371,594 1
INCOME TAX EXPENSE (Note 28) (2,817,037) (1) (740,463) -
NET PROFIT FOR THE YEAR 7,967,084 4 2,631,131 1
(Continued)

- 9 -
LITE-ON TECHNOLOGY CORPORATION AND SUBSIDIARIES
CONSOLIDATED STATEMENTS OF COMPREHENSIVE INCOME
FOR THE YEARS ENDED DECEMBER 31, 2018 AND 2017
(In Thousands of New Taiwan Dollars, Except Earnings Per Share)
2018 2017
Amount % Amount %
OTHER COMPREHENSIVE INCOME (LOSS)
(Notes 25, 26 and 28)
Items not reclassified subsequently to profit or loss:
Remeasurement of defined benefit plans $ 3,041 - $ (43,909) -
Unrealized gain (loss) on investments in equity
instruments designated as at FVTOCI (107,838) - - -
Share of other comprehensive loss of associates
accounted for using the equity method (1,770) - (9,920) -
Income tax benefit relating to items not
reclassified subsequently to profit or loss 4,441 - 9,552 -
(102,126) - (44,277) -
Items that may be reclassified subsequently to profit
or loss
Exchange differences on translating foreign
operations (369,243) - (1,591,874) -
Unrealized gain on available-for-sale financial
assets - - 100,061 -
Share of other comprehensive loss of associates
accounted for using the equity method (48,265) - (64,169) -
Income tax benefit relating to items that may be
reclassified subsequently to profit or loss 171,056 - 287,498 -
(246,452) - (1,268,484) -
Other comprehensive loss for the year, net of
income tax (348,578) - (1,312,761) -
TOTAL COMPREHENSIVE INCOME FOR THE
YEAR $ 7,618,506 4 $ 1,318,370 1
NET PROFIT ATTRIBUTABLE TO:
Owners of the Parent Company $ 7,956,838 4 $ 2,629,334 1
Non-controlling interests 10,246 - 1,797 -
$ 7,967,084 4 $ 2,631,131 1
TOTAL COMPREHENSIVE INCOME
ATTRIBUTABLE TO:
Owners of the Parent Company $ 7,602,588 4 $ 1,366,244 1
Non-controlling interests 15,918 - (47,874) -
$ 7,618,506 4 $ 1,318,370 1
(Continued)

- 10 -
LITE-ON TECHNOLOGY CORPORATION AND SUBSIDIARIES
CONSOLIDATED STATEMENTS OF COMPREHENSIVE INCOME
FOR THE YEARS ENDED DECEMBER 31, 2018 AND 2017
(In Thousands of New Taiwan Dollars, Except Earnings Per Share)
2018 2017
Amount % Amount %
EARNINGS PER SHARE (NEW TAIWAN
DOLLARS; Note 29)
From continuing operations
Basic $3.42 $1.13
Diluted $3.38 $1.13
The accompanying notes are an integral part of the consolidated financial statements. (Concluded)

- 11 -
LITE-ON TECHNOLOGY CORPORATION AND SUBSIDIARIES
CONSOLIDATED STATEMENTS OF CHANGES IN EQUITY
FOR THE YEARS ENDED DECEMBER 31, 2018 AND 2017
(In Thousands of New Taiwan Dollars, Unless Stated Otherwise)
Equity Attributable to Owners of the Parent Company
Capital Surplus (Note 26)
Additional
Difference
Between
Consideration
and Carrying
Amounts
Adjusted
Changes in
Capital Surplus
from Other Equity (Note 26)
Paid-in Capital Arising from Investments in Exchange Unrealized Gain Unrealized from Share Changes in Associates Differences on (Loss) on Gain (Loss) on
Issue of Share Capital (Note 26) Issuance in Percentage of Accounted for Retained Earnings (Notes 26 and 28) Translating Financial Assets Available-for- Non-controlling
Shares Excess of Par Bond Treasury Share Ownership in Using Equity Special Unappropriated Foreign Designated as sale Financial Cash Flow Treasury Shares Interests
(In Thousands) Amount Value Conversions Transactions Subsidiaries Method Mergers Total Legal Reserve Reserve Earnings Total Operations FVIOCI Assets Hedges Total (Note 26) (Notes 26) Total Equity
BALANCE AT JANUARY 1, 2017 2,350,867 $ 23,508,670 $ 9,372,488 $ 7,462,138 $ 328,800 $ 45,612 $ 273,487 $ 10,015,194 $ 27,497,719 $ 10,845,332 $ 398,602 $ 16,252,206 $ 27,496,140 $ (1,195,684 ) $ - $ (126,588 ) $ - $ (1,322,272 ) $ (1,248,722 ) $ 3,348,901 $ 79,280,436
Appropriation of the 2016 earnings
Cash dividends - 29.2% - - - - - - - - - - - (6,864,532 ) (6,864,532 ) - - - - - - - (6,864,532 )
Special reserve - - - - - - - - - - 940,276 (940,276 ) - - - - - - - - -
Legal reserve - - - - - - - - - 941,635 - (941,635 ) - - - - - - - - -
Changes in non-controlling interests - - - - - - - - - - - - - - - - - - - (45,076 ) (45,076 )
Changes in percentage of ownership interest in subsidiaries - - - - - 3,407 - - 3,407 - - - - - - - - - - - 3,407
Changes in capital surplus from investments in associates accounted
for by using the equity method - - - - - - 3,295 - 3,295 - - - - - - - - - - - 3,295
Changes in capital surplus from cash dividends of the Parent
Company paid to subsidiaries - - - - 71,529 - - - 71,529 - - - - - - - - - - - 71,529
Net profit for the year ended December 31, 2017 - - - - - - - - - - - 2,629,334 2,629,334 - - - - - - 1,797 2,631,131
Other comprehensive income (loss) for the year ended December 31,
2017, net of income tax - - - - - - - - - - - (41,344 ) (41,344 ) (1,333,209 ) - 108,091 3,372 (1,221,746 ) - (49,671 ) (1,312,761 )
Total comprehensive income (loss) for the year ended December 31,
2017 - - - - - - - - - - - 2,587,990 2,587,990 (1,333,209 ) - 108,091 3,372 (1,221,746 ) - (47,874 ) 1,318,370
BALANCE AT DECEMBER 31, 2017 2,350,867 23,508,670 9,372,488 7,462,138 400,329 49,019 276,782 10,015,194 27,575,950 11,786,967 1,338,878 10,093,753 23,219,598 (2,528,893 ) - (18,497 ) 3,372 (2,544,018 ) (1,248,722 ) 3,255,951 73,767,429
Effect of retrospective application (Note 3) - - - - - - - - - - - 279,769 279,769 - (298,266 ) 18,497 - (279,769 ) - - -
BALANCE AT JANUARY 1, 2018 AS RESTATED 2,350,867 23,508,670 9,372,488 7,462,138 400,329 49,019 276,782 10,015,194 27,575,950 11,786,967 1,338,878 10,373,522 23,499,367 (2,528,893 ) (298,266 ) - 3,372 (2,823,787 ) (1,248,722 ) 3,255,951 73,767,429
Appropriation of the 2017 earnings
Legal reserve - - - - - - - - - 262,933 - (262,933 ) - - - - - - - - -
Special reserve - - - - - - - - - - 1,367,076 (1,367,076 ) - - - - - - - - -
Cash dividends - 4.1% - - - - - - - - - - - (963,855 ) (963,855 ) - - - - - - - (963,855 )
Distribution of cash dividends from capital surplus - - (5,900,676 ) - - - - - (5,900,676 ) - - - - - - - - - - - (5,900,676 )
Changes in non-controlling interests - - - - - - - - - - - - - - - - - - - 82,776 82,776
Changes in percentage of ownership interest in subsidiaries - - - - - (1,810 ) - - (1,810 ) - - - - - - - - - - - (1,810 )
Changes in capital surplus from investments in associates accounted for by using the equity method - - - - - - (5,415 ) - (5,415 ) - - - - - - - - - - - (5,415 )
Changes in capital surplus from cash dividends of the Parent
Company paid to subsidiaries - - - - 77,368 - - - 77,368 - - - - - - - - - - - 77,368
Disposal of investments in equity instruments designated as at
FVTOCI - - - - - - - - - - - 43,182 43,182 - (43,182 ) - - (43,182 ) - - -
Disposal of investments accounted for using the equity method - - - - - - - - - - - - - 4,078 - - - 4,078 - - 4,078
Net profit for the year ended December 31, 2018 - - - - - - - - - - - 7,956,838 7,956,838 - - - - - - 10,246 7,967,084
Other comprehensive income (loss) for the year ended December 31,
2018, net of income tax - - - - - - - - - - - 9,469 9,469 (255,048 ) (108,013 ) - (658 ) (363,719 ) - 5,672 (348,578 )
Total comprehensive income (loss) for the year ended December 31,
2018 - - - - - - - - - - - 7,966,307 7,966,307 (255,048 ) (108,013 ) - (658 ) (363,719 ) - 15,918 7,618,506
BALANCE AT DECEMBER 31, 2018 2,350,867 $ 23,508,670 $ 3,471,812 $ 7,462,138 $ 477,697 $ 47,209 $ 271,367 $ 10,015,194 $ 21,745,417 $ 12,049,900 $ 2,705,954 $ 15,789,147 $ 30,545,001 $ (2,779,863 ) $ (449,461 ) $ - $ 2,714 $ (3,226,610 ) $ (1,248,722 ) $ 3,354,645 $ 74,678,401
The accompanying notes are an integral part of the consolidated financial statements.

- 12 -
LITE-ON TECHNOLOGY CORPORATION AND SUBSIDIARIES
CONSOLIDATED STATEMENTS OF CASH FLOWS
FOR THE YEARS ENDED DECEMBER 31, 2018 AND 2017
(In Thousands of New Taiwan Dollars)
2018 2017
CASH FLOWS FROM OPERATING ACTIVITIES
Income before income tax $ 10,784,121 $ 3,371,594
Adjustments for:
Depreciation expenses 4,698,252 5,675,601
Amortization expenses 306,500 421,386
Expected credit loss 66,949 -
Impairment loss reversed on trade receivables - (14,132)
Net gain on fair value change of financial assets designated as at
FVTPL (1,338,423) (341,680)
Finance costs 875,318 603,844
Interest income (1,710,052) (1,365,837)
Dividend income (39,400) (39,811)
Share of profit of associates accounted for using the equity method (178,863) (170,309)
Net loss on disposal of property, plant and equipment 20,018 96,747
Net loss on disposal of intangible asset 6 -
Net gain on disposal of non-current assets held for sale (162,819) -
Net gain on disposal of available-for-sale financial assets - (49,598)
Net gain on disposal of investments accounted for using the equity
method (86,603) (129,517)
Impairment loss recognized on financial assets - 26,554
Impairment loss recognized on non-financial assets 3,749,500 8,054,479
Unrealized loss (gain) on foreign currency exchange 262,569 (140,908)
Recognition of provisions 429,650 149,804
Changes in operating assets and liabilities
Financial instruments held for trading - 427,387
Financial assets mandatorily classified as at FVTPL 1,230,565 -
Contract assets (3,033,890) -
Notes receivable (419,737) 87,012
Trade receivables 8,831,029 7,499,616
Trade receivables from related parties (10,807) (19,110)
Other receivables (9,800,729) (284,175)
Other receivables from related parties (1,611) 3,033
Inventories (3,606,918) (3,340,153)
Other current assets 696,139 (874,201)
Notes payable (20,571) 20,414
Trade payables (4,655,634) (4,995,977)
Trade payables to related parties (22,271) (200,185)
Other payables 7,710,429 (1,506,621)
Other payables to related parties (3,243) 10,499
Provisions (285,733) (311,752)
Advance receipts (93,901) 184,462
Net defined benefit liabilities (63,174) 89,129
Cash generated from operations 14,126,666 12,937,595
Interest received 1,662,673 1,370,650
Dividends received 39,400 39,811
(Continued)

- 13 -
LITE-ON TECHNOLOGY CORPORATION AND SUBSIDIARIES
CONSOLIDATED STATEMENTS OF CASH FLOWS
FOR THE YEARS ENDED DECEMBER 31, 2018 AND 2017
(In Thousands of New Taiwan Dollars)
2018 2017
Interest paid $ (852,547) $ (598,421)
Income tax paid (1,492,648) (2,596,455)
Net cash generated from operating activities 13,483,544 11,153,180
CASH FLOWS FROM INVESTING ACTIVITIES
Acquisition of financial assets at FVTOCI (58,970) -
Proceeds from disposal of financial assets at FVTOCI 176,660 -
Proceeds from disposal of financial assets at amortized costs 868,455 -
Acquisition of available-for-sale financial assets - (15,110)
Proceeds from sale of available-for-sale financial assets - 298,632
Proceeds from sale of debt investments with no active market - 17,548
Proceeds from disposal of investments accounted for using the equity
method 2,849 246,708
Increase in prepaid investments - (1,354,950)
Cash provided by disposal of subsidiaries 5,590 -
Proceeds from disposal of non-current assets held for sale 658,211 -
Acquisition of property, plant and equipment (5,646,424) (4,204,726)
Proceeds from disposal of property, plant and equipment 3,444,871 84,065
Decrease (increase) in refundable deposits 140,857 (140,276)
Acquisition of intangible assets (166,322) (228,654)
Proceeds from disposal of intangible assets 418,442 17,688
Increase in other non-current assets (80,403) (67,148)
Dividend received from associates 101,714 95,057
Net cash used in investing activities (134,470) (5,251,166)
CASH FLOWS FROM FINANCING ACTIVITIES
Proceeds from short-term borrowings - 16,066,496
Repayments of short-term borrowings (476,153) -
Repayments of long-term borrowings (16,645) (19,528,450)
Refunds of guarantee deposits received (1,345) (6,273)
Decrease in finance lease payables (1,617) (1,567)
Cash dividends (6,787,163) (6,793,003)
Changes in non-controlling interests (30,537) (47,305)
Net cash used in financing activities (7,313,460) (10,310,102)
EFFECTS OF EXCHANGE RATE CHANGES ON THE BALANCE
OF CASH AND CASH EQUIVALENTS HELD IN FOREIGN
CURRENCIES (534,173) (3,016,543)
(Continued)

- 14 -
LITE-ON TECHNOLOGY CORPORATION AND SUBSIDIARIES
CONSOLIDATED STATEMENTS OF CASH FLOWS
FOR THE YEARS ENDED DECEMBER 31, 2018 AND 2017
(In Thousands of New Taiwan Dollars)
2018 2017
NET INCREASE (DECREASE) IN CASH AND CASH
EQUIVALENTS $ 5,501,441 $ (7,424,631)
CASH AND CASH EQUIVALENTS AT THE BEGINNING OF THE
YEAR 57,783,860 65,208,491
CASH AND CASH EQUIVALENTS AT THE END OF THE YEAR $ 63,285,301 $ 57,783,860
The accompanying notes are an integral part of the consolidated financial statements. (Concluded)

- 15 -
LITE-ON TECHNOLOGY CORPORATION AND SUBSIDIARIES
NOTES TO CONSOLIDATED FINANCIAL STATEMENTS
FOR THE YEARS ENDED DECEMBER 31, 2018 AND 2017
(In Thousands of New Taiwan Dollars, Unless Stated Otherwise)
1. GENERAL INFORMATION
Lite-On Technology Corporation (the “Parent Company”) was established in March 1989. The Parent
Company’s shares are listed on the Taiwan Stock Exchange. The Parent Company manufactures and
markets (1) computer software, hardware, peripherals and components, (2) monitors, multifunction and
all-in-one printers, cameras and Internet systems and image-processing equipment; (3) information storage
and processing equipment, electronic components and office equipment; (4) electronic coils, transformers,
power suppliers and electronic hardware parts; (5) light-emitting diode (LED) products; (6) electronic car
products; and (7) optical lens modules and optoelectronic components.
The Parent Company merged with Lite-On Electronics, Inc., Silitek Corp. and GVC Corp., with the Parent
Company as the surviving entity. The merger took effect on November 4, 2002, and the Parent Company
thus assumed all rights and obligations of the three merged companies on that date.
The Parent Company merged with its subsidiary, Lite-On Enclosure Inc., with the Parent Company as the
surviving entity. The merger took effect on April 1, 2004, and the Parent Company thus assumed all rights
and obligations of its former subsidiary on that date.
The Parent Company separately merged with Li Shin International Enterprise Corp., Lite-On Clean Energy
Technology Corp., Lite-On Automotive Corp., Leotek Electronics Corp., Lite-On IT Corporation and
LarView Technologies Corp., with the Parent Company as the surviving entity. The mergers separately and
respectively took effect on March 22, 2014, April 15, 2014, June 1, 2014, June 29, 2014, June 30, 2014 and
September 1, 2014, with the Parent Company as the surviving entity of all the mergers, and the Parent
Company thus assumed all rights and obligations of the six merged companies on those respective dates.
The consolidated financial statements of the Parent Company and its subsidiaries, hereto forth collectively
referred to as the Group, are presented in the Parent Company’s functional currency, the New Taiwan
dollar.
2. APPROVAL OF FINANCIAL STATEMENTS
The consolidated financial statements were approved by the Parent Company’s board of directors on
February 26, 2019.

- 16 -
3. APPLICATION OF NEW, AMENDED AND REVISED STANDARDS AND INTERPRETATIONS
a. Initial application of the amendments to the Regulations Governing the Preparation of Financial Reports
by Securities Issuers and the International Financial Reporting Standards (IFRS), International
Accounting Standards (IAS), Interpretations of IFRS (IFRIC), and Interpretations of IAS (SIC)
(collectively, the “IFRSs”) endorsed and issued into effect by the FSC
Except for the following, whenever applied, the initial application of the amendments to the
Regulations Governing the Preparation of Financial Reports by Securities Issuers and the IFRSs
endorsed and issued into effect by the FSC would not have any material impact on the Group’s
accounting policies:
1) IFRS 9 “Financial Instruments” and related amendments
IFRS 9 supersedes IAS 39 “Financial Instruments: Recognition and Measurement”, with
consequential amendments to IFRS 7 “Financial Instruments: Disclosures” and other standards.
IFRS 9 sets out the requirements for classification, measurement, and impairment of financial assets
and hedge accounting. Refer to Note 4 for information relating to the relevant accounting policies.
The requirements for classification, measurement, and impairment of financial assets have been
applied retrospectively from January 1, 2018. IFRS 9 is not applicable to items that have already
been derecognized on December 31, 2017.
Classification, measurement, and impairment of financial assets
On the basis of the facts and circumstances that exist as of January 1, 2018, the Group has
performed an assessment of the classification of recognized financial assets and has elected not to
restate prior reporting periods.
The following table shows the original measurement categories and carrying amount under IAS 39
and the new measurement categories and carrying amount under IFRS 9 for each class of the
Company’s financial assets and financial liabilities as of January 1, 2018.
Measurement Category Carrying Amount
Financial Asset IAS 39 IFRS 9 IAS 39 IFRS 9 Note
Cash and cash equivalents Loans and receivables Amortized cost $ 57,783,860 $ 57,783,860 a)
Derivatives instruments Held-for-trading Mandatorily classified as at FVTPL
101,677 101,677 -
Equity securities Available-for‑sale Mandatorily classified as at
FVTPL
20,271 20,271 b)
Available-for‑sale Equity instruments classified
as at FVTOCI
424,389 424,389 b)
Mutual funds Available-for‑sale Mandatorily classified as at
FVTPL
68,469 68,469 c)
Debt instruments Debt investment instruments
with no active market
Amortized cost 1,484,868 1,484,868 d)
Notes receivable, trade
receivables, trade
receivables from related parties, other
receivables and other
receivables from related parties
Loans and receivables Amortized cost 53,766,170 53,766,170 a)

- 17 -
Financial Asset
IAS 39 Carrying
Amount as of
January 1, 2018 Reclassifications
IFRS 9 Carrying
Amount as of
January 1, 2018
Retained
Earnings Effect
on January 1,
2018
Other Equity
Effect on
January 1, 2018 Note
FVTPL $ 101,677 $ - $ 101,677 $ - $ -
Add: Reclassification from
available-for-sale (IAS 39)
-
88,740
88,740
(25 )
25
b) and c)
101,677 88,740 190,417 (25 ) 25
FVTOCI
Add: Reclassification from
available-for-sale (IAS 39)
-
424,389
424,389
205,414
(205,414 )
b)
Investments accounted for using
the equity method
3,681,951
-
3,681,951
74,380
(74,380 )
d)
Amortized cost
Add: Reclassification from loans
and receivables (IAS 39)
-
113,034,898
113,034,898
-
-
a) and e)
$ 3,783,628 $ 113,548,027 $ 117,331,655 $ 279,769 $ (279,769 )
a) Cash and cash equivalents, notes receivable, trade receivables, trade receivables from related
parties, other receivables and other receivables from related parties that were previously
classified as loans and receivables under IAS 39 were classified as measured at amortized cost
with an assessment of expected credit losses under IFRS 9.
b) The Group elected to classify all of its investments in equity securities previously classified as
available-for-sale under IAS 39 as at FVTPL or FVTOCI under IFRS 9. As a result, there were
adjustments to decrease the beginning balance of retained earnings by $25 thousand and
increase that of other equity by $25 thousand.
The Group recognized under IAS 39 impairment loss on certain investments in equity securities
previously classified as available-for-sale, and the loss was accumulated in retained earnings.
Since those investments were designated as at FVTOCI under IFRS 9 and no impairment
assessment is required, an adjustment was made that resulted in a decrease of $205,414
thousand in other equity and an increase of $205,414 thousand in retained earnings on January
1, 2018.
c) Mutual funds previously classified as available-for-sale under IAS 39 were classified
mandatorily as at FVTPL under IFRS 9, because the contractual cash flows are not solely
payments of principal and interest on the principal outstanding and they are not equity
instruments.
d) With the retrospective adoption of IFRS 9 by investments in subsidiaries and associates
accounted for using the equity method, the Company chose not to restate comparative periods
for such investments. On January 1, 2018, the subsidiaries accounted for previously recognized
equity securities under IAS 39 as available-for-sale financial assets upon its adoption of IFRS 9.
The corresponding adjustments of the investments to at FVTOCI, according to the shareholding
ratio, resulted in the decrease in other equity by $12,970 thousand and the increase in retained
earnings by $12,970 thousand. The associates accounted for previously recognized equity
securities under IAS 39 as available-for-sale financial assets upon its adoption of IFRS 9. The
corresponding adjustments of the investments to at FVTPL, according to the shareholding ratio,
resulted in the decrease in other equity by $61,410 thousand and the increase in retained
earnings by $61,410 thousand.

- 18 -
e) Debt investments previously classified as debt instruments with no active market and measured
at amortized cost under IAS 39 were reclassified as measured at amortized cost with an
assessment of expected credit losses under IFRS 9, because on January 1, 2018, the contractual
cash flows were solely payments of principal and interest on the principal outstanding and these
investments were held within a business model whose objective is to collect contractual cash
flows.
2) IFRS 15 “Revenue from Contracts with Customers” and related amendments
IFRS 15 establishes principles for recognizing revenue that apply to all contracts with customers
and supersedes IAS 18 “Revenue”, IAS 11 “Construction Contracts” and related interpretations.
Refer to Note 4 for information relating to the relevant accounting policies.
The revenue recognition process under IFRS 15 is as follows:
a) Identify the contract(s);
b) Identify the separate performance obligations in the contract;
c) Determine the transaction price;
d) Allocate the transaction price to the separate performance obligations; and
e) Recognize revenue when the group entity satisfies a performance obligation.
The Group applies IFRS 15 retrospectively to on-going contracts with the cumulative effect
recognized at the date of initial application. The Group does not restate the comparative information
for the prior period.
The expected cumulative effect of retrospective applications on assets, liabilities and equity, as of
January 1, 2018, is as follows:
Financial Asset
January 1, 2018
Carrying Amount
(IAS 18) Reclassification
January 1, 2018
Carrying Amount
(IFRS 15)
January 1, 2018
Retained
Earnings Effect
January 1, 2018
Other Equity
Effect Remark
Trade receivable from related
parties
$ 79,288 $ - $ 79,288 $ - $ -
Trade receivable from
non-related parties
52,037,732 (2,647,305 ) 49,390,427 - -
Contract assets - current - 2,647,305 2,647,305 - - *
$ 52,117,020 $ - $ 52,117,020 $ - $ -
Remark:
* Before the adoption of IFRS 15, the Group recognized revenue once the transfer of risks and
rewards of products was complete; upon adoption, any rights to consideration in exchange for
goods or services are recognized as contract assets.
3) IFRIC 22 “Foreign Currency Transactions and Advance Consideration”
IAS 21 stipulated that a foreign currency transaction shall be recorded on initial recognition in the
functional currency by applying to the foreign currency amount the spot exchange rate between the
functional currency and the foreign currency at the date of the transaction. IFRIC 22 further
explains that the date of the transaction is the date on which an entity recognizes a non-monetary
asset or non-monetary liability from payment or receipt of advance consideration. If there are
multiple payments or receipts in advance, the entity shall determine the date of the transaction for
each payment or receipt of advance consideration.

- 19 -
The Group will apply IFRIC 22 prospectively on and after January 1, 2018.
b. Amendments to the Regulations Governing the Preparation of Financial Reports by Securities Issuers
and IFRSs endorsed by the FSC for application starting from 2019
New, Amended And Revised Standards And Interpretations
(the “New IFRSs”)
Effective Date
Announced by IASB (Note 1)
Annual Improvements to IFRSs 2015-2017 Cycle January 1, 2019
Amendments to IFRS 9 “Prepayment Features with Negative
Compensation”
January 1, 2019 (Note 2)
IFRS 16 “Leases” January 1, 2019
Amendments to IAS 19 “Plan amendments, Curtailments, and
Settlements”
January 1, 2019 (Note 3)
Amendments to IAS 28 “Long-term Interests in Associates and Joint
Ventures”
January 1, 2019
IFRIC 23 “Uncertainty over Income Tax Treatments” January 1, 2019
Note 1: Unless stated otherwise, the above New IFRSs are effective for annual periods beginning on
or after their respective effective dates.
Note 2: The FSC permits the election for early adoption of the amendments starting from January 1,
2018.
Note 3: The Group shall apply these amendments to plan amendments, curtailments or settlements
occurring on or after January 1, 2019.
1) IFRS 16 “Leases”
IFRS 16 sets out the accounting standards for leases that will supersede IAS 17, IFRIC 4 and related
interpretations. Upon initial application of IFRS 16, the Group will elect to apply IFRS 16 only to
contracts entered into (or changed) on or after January 1, 2019 in order to determine whether those
contracts are, or contain, a lease. Contracts identified as containing a lease under IAS 17 and IFRIC
4 will not be reassessed and will be accounted for in accordance with the transitional provisions
under IFRS 16.
The Group as lessee
Upon initial application of IFRS 16, the Group will recognize right-of-use assets, or investment
properties if the right-of-use assets meet the definition of investment properties and lease liabilities
for all leases on the balance sheets, except for short-term leases and leases for which the underlying
asset is of low value. The lease payments associated with those leases will be recognized as an
expense on a straight-line basis.
On the statements of comprehensive income, the Group will present the depreciation expense
charged on right-of-use assets separately from the interest expense accrued on lease liabilities;
interest is computed using the effective interest method. On the statements of cash flows, cash
payments for the principal portion of lease liabilities will be classified within financing activities;
cash payments for the interest portion will be classified within operating activities. Before the
adoption of IFRS 16, payments under operating lease contracts including property interest qualified
as investment properties are recognized as expenses on a straight-line basis. Prepaid lease payments
for land use rights of land located in China and Vietnam are recognized as prepayments for leases.
Cash flows for operating leases are classified within operating activities on the statements of cash
flows. Contracts classified as finance lease are recognized as lease asset and finance lease payable
on the balance sheets.

- 20 -
Lease liabilities were recognized on January 1, 2019 for leases previously classified as operating
leases under IAS 17. Lease liabilities were measured at the present value of the remaining lease
payments, discounted using the lessee’s incremental borrowing rate on January 1, 2019.
Right-of-use assets are measured at an amount equal to the lease liabilities at the commencement
date. The Group applies IAS 36 to all right-of-use assets.
The Group expects to apply the following practical expedients:
a) The Group will apply a single discount rate to a portfolio of leases with reasonably similar
characteristics to measure lease liabilities.
b) The Group will account for those leases for which the lease term ends on or before December
31, 2019 as short-term leases.
The Group as lessor
The Group will not make any adjustments for leases in which it is a lessor and will account for
those leases with the application of IFRS 16 starting from January 1, 2019.
Anticipated impact on assets, liabilities and equity
Carrying
Amount as of
December 31,
2018
Adjustments
Arising from
Initial
Application
Adjusted
Carrying
Amount as of
January 1, 2019
Right-of-use assets - non-current $ - $ 1,905,514 $ 1,905,514
Prepaid lease payments - non-current
(Note 21) 713,824 (713,824) -
Total effect on assets $ 713,824 $ 1,191,690 $ 1,905,514
Finance lease payables- current $ - $ 376,009 $ 376,009
Finance lease payables- non-current - 830,587 830,587
Total effect on liabilities $ - $ 1,206,596 $ 1,206,596
Retained earnings $ 30,545,001 $ (5,144) $ 30,539,857
Non-controlling interest 3,354,645 (9,762) 3,344,883
Total effect on equities $ 33,899,646 $ (14,906) $ 33,884,740
2) Amendments to IAS 19 “Plan Amendment, Curtailment or Settlement”
The amendments stipulate that, if a plan amendment, curtailment or settlement occurs, the current
service cost and the net interest for the remainder of the annual reporting period are determined
using the actuarial assumptions used for the remeasurement of the net defined benefit liabilities
(assets). In addition, the amendments clarify the effect of a plan amendment, curtailment or
settlement on the requirements regarding the asset ceiling. The amendment shall be applied
prospectively.
Except for the above impact, as of the date the consolidated financial statements were authorized for
issue, the Group is continuously assessing the possible impact that the application of other standards
and interpretations will have on the Group’s financial position and financial performance and will
disclose the relevant impact when the assessment is completed.

- 21 -
c. New IFRSs in issue but not yet endorsed and issued into effect by the FSC
New IFRSs
Effective Date
Announced by IASB (Note 1)
Amendments to IFRS 3 “Definition of a Business” January 1, 2020 (Note 2)
Amendments to IFRS 10 and IAS 28 “Sale or Contribution of Assets
between An Investor and Its Associate or Joint Venture”
To be determined by IASB
IFRS 17 “Insurance Contracts” January 1, 2021
Amendments to IAS 1 and IAS 8 “Definition of Material” January 1, 2020 (Note 3)
Note 1: Unless stated otherwise, the above New IFRSs are effective for annual periods beginning on
or after their respective effective dates.
Note 2: The Group shall apply these amendments to business combinations for which the acquisition
date is on or after the beginning of the first annual reporting period beginning on or after
January 1, 2020 and to asset acquisitions that occur on or after the beginning of that period.
Note 3: The Group shall apply these amendments prospectively for annual reporting periods
beginning on or after January 1, 2020.
1) Amendments to IFRS 10 and IAS 28 “Sale or Contribution of Assets between an Investor and its
Associate or Joint Venture”
The amendments stipulate that, when the Group sells or contributes assets that constitute a business
(as defined in IFRS 3) to an associate or joint venture, the gain or loss resulting from the transaction
is recognized in full. Also, when the Group loses control of a subsidiary that contains a business but
retains significant influence or joint control, the gain or loss resulting from the transaction is
recognized in full.
Conversely, if the Group sells or contributes assets that do not constitute a business to an associate
or joint venture or the Group loses control of a subsidiary that does not contain a business but
retains significant influence or joint control over an associate or a joint venture, the gain or loss
resulting from the transaction is recognized only to the extent of the Group’s interest as an unrelated
investor in the associate or joint venture, i.e. the Group’s share of the gain or loss is eliminated.
Also, if the assets or the ex-subsidiary were not considered a “business”, as defined under IFRS 3,
the gain or loss resulting from the transaction is recognized only to the extent of the Group’s interest
as an unrelated investor in the associate or joint venture, i.e. the Group’s share of the gain or loss is
eliminated.
2) Amendments to IFRS 3 “Definition of a Business”
The amendments clarify that, to be considered a business, an acquired set of activities and assets
must include, at a minimum, an input and a substantive process applied to the input that together
significantly contribute to the ability to create outputs. The amendments narrow the definitions of
outputs by focusing on goods and services provided to customers, and the reference to an ability to
reduce costs is removed. Moreover, the amendments remove the assessment of whether market
participants are capable of replacing any missing inputs or processes and continuing to produce
outputs. In addition, the amendments introduce an optional concentration test that permits a
simplified assessment of whether an acquired set of activities and assets are business.

- 22 -
Except for the above impact, as of the date the financial statements were authorized for issue, the Group
is continuously assessing the possible impact that the application of other standards and interpretations
will have on the Group’s financial position and financial performance and will disclose the relevant
impact when the assessment is completed.
4. SUMMARY OF SIGNIFICANT ACCOUNTING POLICIES
a. Statement of compliance
The financial statements have been prepared in accordance with the Regulations Governing the
Preparation of Financial Reports by Securities Issuers.
b. Basis of preparation
The financial statements have been prepared on the historical cost basis except for financial instruments
which are measured at fair values and net defined benefit liabilities which are measured at the present
value of the defined benefit obligation less the fair value of plan assets.
The fair value measurements are grouped into Levels 1 to 3 based on the degree to which the fair value
measurement inputs are observable and the significance of the inputs to the fair value measurement in
its entirety, which are described as follows:
1) Level 1 inputs are quoted prices (unadjusted) in active markets for identical assets or liabilities;
2) Level 2 inputs are inputs other than quoted prices included within Level 1 that are observable for
the asset or liability, either directly (i.e. as prices) or indirectly (i.e. derived from prices); and
3) Level 3 inputs are unobservable inputs for the asset or liability.
c. Classification of current and non-current assets and liabilities
Current assets include:
1) Assets held primarily for the purpose of trading;
2) Assets expected to be realized within 12 months after the reporting period; and
3) Cash and cash equivalents unless the asset is restricted from being exchanged or used to settle a
liability for at least 12 months after the reporting period.
Current liabilities include:
1) Liabilities held primarily for the purpose of trading;
2) Liabilities due to be settled within 12 months after the reporting period, even if an agreement to
refinance, or to reschedule payments, on a long-term basis is completed after the reporting period
and before the financial statements are authorized for issue; and
3) Liabilities for which the Group does not have an unconditional right to defer settlement for at least
12 months after the reporting period. Terms of a liability that could, at the option of the
counterparty, result in its settlement by the issue of equity instruments do not affect its
classification.
Assets and liabilities that are not classified as current are classified as non-current.

- 23 -
d. Basis of consolidation
The consolidated financial statements incorporate the financial statements of the Parent Company and
the entities controlled by the Parent Company. Income and expenses of subsidiaries acquired or
disposed of during the period are included in the consolidated statements of profit or loss and other
comprehensive income from the effective dates of acquisitions up to the effective dates of disposals, as
appropriate. When necessary, adjustments are made to the financial statements of subsidiaries to bring
their accounting policies into line with those used by the Parent Company. All intra-group transactions,
balances, income and expenses are eliminated in full upon consolidation. Total comprehensive income
of subsidiaries is attributed to the owners of the Parent Company and to the non-controlling interests
even if this results in the non-controlling interests having a deficit balance.
Changes in the Group’s ownership interests in subsidiaries that do not result in the Group losing control
over the subsidiaries are accounted for as equity transactions. The carrying amounts of the Group’s
interests and the non-controlling interests are adjusted to reflect the changes in their relative interests in
the subsidiaries. Any difference between the amount by which the non-controlling interests are adjusted
and the fair value of the consideration paid or received is recognized directly in equity and attributed to
the owners of the Parent Company.
When the Group loses control of a subsidiary, a gain or loss is recognized in profit or loss and is
calculated as the difference between (i) the aggregate of the fair value of the consideration received and
any investment retained in the former subsidiary at its fair value at the date when control is lost and (ii)
the assets (including any goodwill) and liabilities and any non-controlling interests of the former
subsidiary at their carrying amounts at the date when control is lost. The Group accounts for all
amounts recognized in other comprehensive income in relation to that subsidiary on the same basis as
would be required had the Group directly disposed of the related assets or liabilities.
Before 2018, the fair value of any investment retained in a former subsidiary at the date when control is
lost is regarded as the fair value on initial recognition of available-for-sale financial assets/financial
assets at FVTPL or, when applicable, the cost on initial recognition of an investment in an associate or a
joint venture. Starting from 2018, the fair value of any investment retained in the former subsidiary at
the date when control is lost is regarded as the fair value on initial recognition of financial assets at
FVTOCI/financial assets at FVTPL or, when applicable, the cost on initial recognition of an investment
in an associate or a joint venture.
See Note 15 and Table 8 for detailed information on subsidiaries, including the percentages of
ownership and main businesses.
e. Business combinations
Acquisitions of businesses are accounted for using the acquisition method. Acquisition-related costs are
generally recognized in profit or loss as incurred.
Goodwill is measured as the excess of the sum of the consideration transferred, the amount of any
non-controlling interests in the acquiree, and the fair value of the acquirer’s previously held equity
interest in the acquiree over the net of the acquisition-date amounts of the identifiable assets acquired
and the liabilities assumed.
When a business combination is achieved in stages, the Group’s previously held equity interest in an
acquiree is remeasured to fair value at the acquisition date, and the resulting gain or loss is recognized
in profit or loss or other comprehensive income. Amounts arising from interests in the acquiree prior to
the acquisition date that have previously been recognized in other comprehensive income are
recognized on the same basis as would be required if those interests were directly disposed of by the
Group.

- 24 -
Business combinations involving entities under common control are not accounted for by the
acquisition method but are accounted for at the carrying amounts of the entities. Prior period
comparative information in the consolidated financial statements is restated as if a business combination
involving entities under common control had already occurred in that period.
f. Foreign currencies
In preparing the Group’s financial statements, transactions in currencies other than the Group’s
functional currency (foreign currencies) are recognized at the rates of exchange prevailing at the dates
of the transactions.
At the end of each reporting period, monetary items denominated in foreign currencies are retranslated
at the rates prevailing at that date. Exchange differences on monetary items arising from settlement or
translation are recognized in profit or loss in the period.
Non-monetary items measured at fair value that are denominated in foreign currencies are retranslated
at the rates prevailing at the date when the fair value was determined. Exchange differences arising on
the retranslation of non-monetary items are included in profit or loss for the period except for exchange
differences arising from the retranslation of non-monetary items in respect of which gains and losses are
recognized directly in other comprehensive income, in which case, the exchange differences are also
recognized directly in other comprehensive income. Non-monetary items that are measured at historical
cost in a foreign currency are not retranslated.
For the purposes of presenting financial statements, the assets and liabilities of the Group’s foreign
operations (including of the subsidiaries and associates, in other countries or currencies used different
with the Group) are translated into New Taiwan dollars using exchange rates prevailing at the end of
each reporting period. Income and expense items are translated at the average exchange rates for the
period. Exchange differences arising are recognized in other comprehensive income.
On the disposal of a foreign operation (i.e. a disposal of the Group’s entire interest in a foreign
operation, or a disposal involving loss of control over a subsidiary that includes a foreign operation, or a
partial disposal of an interest in an associate that includes a foreign operation of which the retained
interest becomes a financial asset), all of the exchange differences accumulated in equity in respect of
that operation are reclassified to profit or loss.
In relation to a partial disposal of a foreign subsidiary that does not result in the Group losing control
over the subsidiary, the proportionate share of accumulated exchange differences is included in the
calculation of equity transactions but is not recognized in profit or loss. For all other partial disposals,
the proportionate share of the accumulated exchange differences recognized in other comprehensive
income is reclassified to profit or loss.
Goodwill and fair value adjustments on identifiable assets and liabilities acquired arising on the
acquisition of a foreign operation are treated as assets and liabilities of the foreign operation and
translated at the rate of exchange prevailing at the end of each reporting period. Exchange differences
arising are recognized in other comprehensive income.
g. Inventories
Inventories consist of raw materials, work in process, finished goods, merchandise, and inventory in
transit. Inventories are stated at the lower of cost or net realizable value. Inventory write-downs are
made by item, except where it may be appropriate to group similar or related items. Net realizable value
is the estimated selling price of inventories less all estimated costs of completion and costs necessary to
make the sale. Inventories are recorded at weighted-average cost.

- 25 -
h. Investments accounted for using the equity method
An associate is an entity over which the Group has significant influence and which is not a subsidiary.
Significant influence is the power to participate in the financial and operating policy decisions of the
investee but is not control or joint control of those policies. The Group uses the equity method to
account for its investments in associates and joint ventures.
Under the equity method, the investment is initially recognized at cost and the carrying amount is
increased or decreased to recognize the Group’s share of the profit or loss and other comprehensive
income of the subsidiary after the date of acquisition. Besides, the Group also recognizes the Group’s
share of the change in other equity of the subsidiary.
Any excess of the cost of acquisition over the Group’s share of the net fair value of the identifiable
assets and liabilities of an associate at the date of acquisition is recognized as goodwill, which is
included within the carrying amount of the investment and is not amortized. Any excess of the Group’s
share of the net fair value of the identifiable assets and liabilities over the cost of acquisition, after
reassessment, is recognized immediately in profit or loss.
When the Company subscribes for additional new shares of an associate at a percentage different from
its existing ownership percentage, the resulting carrying amount of the investment differs from the
amount of the Group’s proportionate interest in the associate. The Group records such a difference as an
adjustment to investments with the corresponding amount charged or credited to capital surplus -
changes in capital surplus from investments in associates and joint ventures accounted for using the
equity method. If the Group’s ownership interest is reduced due to its additional subscription of the new
shares of the associate, the proportionate amount of the gains or losses previously recognized in other
comprehensive income in relation to that associate is reclassified to profit or loss on the same basis as
would be required had the investee directly disposed of the related assets or liabilities. When the
adjustment should be debited to capital surplus, but the capital surplus recognized from investments
accounted for using the equity method is insufficient, the shortage is debited to retained earnings.
The Group assesses its investment for any impairment by comparing the carrying amount with the
estimated recoverable amount, as assessed based on the entire financial statements of the invested
company. Impairment loss is recognized when the carrying amount exceeds the recoverable amount. If
the recoverable amount of the investment subsequently increases, the Group recognizes reversal of the
impairment loss; the adjusted post-reversal carrying amount should not exceed the carrying amount that
would have been recognized (net of amortization or depreciation) had no impairment loss been
recognized in prior years
The Group discontinues the use of the equity method from the date on which its investment ceases to be
an associate. Any retained investment is measured at fair value at that date, and the fair value is
regarded as the investment’s fair value on initial recognition as a financial asset. The difference
between the previous carrying amount of the associate attributable to the retained interest and its fair
value is included in the determination of the gain or loss on disposal of the associate. The Group
accounts for all amounts previously recognized in other comprehensive income in relation to that
associate on the same basis as would be required had that associate directly disposed of the related
assets or liabilities. If an investment in an associate becomes an investment in a joint venture or an
investment in a joint venture becomes an investment in an associate, the Group continues to apply the
equity method and does not remeasure the retained interest.
When the Group’s share of losses of an associate and a joint venture equals or exceeds its interest in
that associate, the Group discontinues recognizing its share of further losses. Additional losses and
liabilities are recognized only to the extent that the Group has incurred legal obligations, or constructive
obligations, or made payments on behalf of that associate and joint venture.

- 26 -
When a group entity transacts with its associate, profits and losses resulting from the transactions with
the associate are recognized in the Group’s consolidated financial statements only to the extent of
interests in the associate that are not related to the Group.
i. Property, plant and equipment
Property, plant and equipment are stated at cost less recognized accumulated depreciation and
accumulated impairment loss.
Properties in the course of construction for production, supply or administrative purposes are carried at
cost less any recognized impairment loss. Cost includes professional fees and borrowing costs eligible
for capitalization. Such properties are depreciated and classified to the appropriate categories of
property, plant and equipment when completed and ready for their intended use.
Depreciation on property, plant and equipment (including assets held under finance leases) is
recognized using the straight-line method. Each significant part is depreciated separately. If the lease
term is shorter than the asset’s useful life, then such an asset is depreciated over the lease term. The
estimated useful lives, residual values and depreciation method are reviewed at the end of each
reporting period, with the effect of any changes in the estimates accounted for on a prospective basis.
j. Investment properties
Investment properties are properties held to earn rental and/or for capital appreciation. Investment
properties are initially measured at cost, including transaction costs. Subsequent to initial recognition,
investment properties are measured at cost less accumulated depreciation and accumulated impairment
loss. Depreciation is recognized using the straight-line method. On derecognition of an investment
property, the difference between the net disposal proceeds and the carrying amount of the asset is
included in profit or loss.
k. Goodwill
Goodwill arising from the acquisition of a business is carried at cost as established at the date of
acquisition of the business less accumulated impairment loss.
For the purposes of impairment testing, goodwill is allocated to each of the Company’s cash-generating
units or groups of cash-generating units (referred to as cash-generating units) that is expected to benefit
from the synergies of the combination.
A cash-generating unit to which goodwill has been allocated is tested for impairment annually, or more
frequently when there is an indication that the unit may be impaired, by comparing its carrying amount,
including the attributed goodwill, with its recoverable amount. However, if the goodwill allocated to a
cash-generating unit was acquired during the current annual period, that unit shall be tested for
impairment before the end of the current annual period. If the recoverable amount of the
cash-generating unit is less than its carrying amount, the impairment loss is allocated first to reduce the
carrying amount of any goodwill allocated to the unit and then pro rata to the other assets of the unit
based on the carrying amount of each asset in the unit. Any impairment loss is recognized directly in
profit or loss. The impairment loss recognized for goodwill is not reversed in subsequent periods.
If goodwill has been allocated to a cash-generating unit and the entity disposes of an operation within
that unit, the goodwill associated with the operation disposed of is included in the carrying amount of
the operation when determining the gain or loss on disposal.

- 27 -
l. Intangible assets
1) Intangible assets acquired separately
Intangible assets with finite useful lives that are acquired separately are initially measured at cost
and subsequently measured at cost less accumulated amortization and accumulated impairment loss.
Amortization is recognized on a straight-line basis. The estimated useful life, residual value, and
amortization method are reviewed at the end of each reporting period, with the effect of any
changes in estimate accounted for on a prospective basis. Intangible assets with indefinite useful
lives that are acquired separately are measured at cost less accumulated impairment loss.
2) Intangible assets acquired in a business combination
Intangible assets acquired in a business combination and recognized separately from goodwill are
initially recognized at their fair value at the acquisition date. Subsequent to initial recognition, they
are measured on the same basis as intangible assets that are acquired separately.
3) Derecognition of intangible assets
On derecognition of an intangible asset, the difference between the net disposal proceeds and the
carrying amount of the asset are recognized in profit or loss.
m. Impairment of tangible and intangible assets other than goodwill
At the end of each reporting period, the Group reviews the carrying amounts of its tangible and
intangible assets, excluding goodwill, to determine whether there is any indication that those assets
have suffered any impairment loss. If any such indication exists, the recoverable amount of such assets
is estimated in order to determine the extent of the impairment loss. When it is not possible to estimate
the recoverable amount of an individual asset, the Group estimates the recoverable amount of the
cash-generating unit to which the asset belongs. Corporate assets are allocated to the individual
cash-generating units on a reasonable and consistent basis of allocation.
Intangible assets with indefinite useful lives and intangible assets not yet available for use are tested for
impairment at least annually, and whenever there is any indication that the asset may be impaired.
The recoverable amount is the higher of fair value less costs to sell and value-in-use. If the recoverable
amount of an asset or cash-generating unit is estimated to be less than its carrying amount, the carrying
amount of the asset or cash-generating unit is reduced to its recoverable amount. An impairment loss is
recognized in profit or loss.
When an impairment loss is subsequently reversed, the carrying amount of the asset or cash-generating
unit is increased to the revised estimate of its recoverable amount, but only to the extent of the carrying
amount that would have been determined had no impairment loss been recognized for the asset or
cash-generating unit in prior years. Reversals of an impairment loss are recognized in profit or loss.
n. Non-current assets held for sale
Non-current assets (or disposal groups) are classified as held for sale if their carrying amounts will be
recovered principally through a sale transaction rather than through continuing use. This condition is
regarded as met only when the sale is highly probable and the non-current asset (or disposal group) is
available for immediate sale in its present condition. To meet the criteria for the sale being highly
probable, the appropriate level of management must be committed to the sale, which should be expected
to qualify for recognition as a completed sale within 1 year from the date of classification.

- 28 -
Non-current assets (and disposal groups) classified as held for sale are measured at the lower of their
previous carrying amount and fair value less costs to sell. Recognition of depreciation of those assets
would cease.
o. Financial instruments
Financial assets and financial liabilities are recognized when a group entity becomes a party to the
contractual provisions of the instruments.
Financial assets and financial liabilities are initially measured at fair value. Transaction costs that are
directly attributable to the acquisition or issue of financial assets and financial liabilities (other than
financial assets and financial liabilities at FVTPL) are added to or deducted from the fair value of the
financial assets or financial liabilities, as appropriate, on initial recognition. Transaction costs directly
attributable to the acquisition of financial assets or financial liabilities at FVTPL are recognized
immediately in profit or loss.
1) Financial assets
All regular way purchases or sales of financial assets are recognized and derecognized on a trade
date basis.
a) Measurement category
2018
Financial assets, held by the Company, are classified into the following categories: Financial
assets at FVTPL, financial assets at amortized cost and equity instruments at FVTOCI.
i. Financial assets at FVTPL
Financial assets are classified as at FVTPL when such a financial asset is mandatorily
classified or designated as at FVTPL. Financial assets mandatorily classified as at FVTPL
include investments in equity instruments which are not designated as at FVTOCI and debt
instruments that do not meet the amortized cost criteria or the FVTOCI criteria.
Financial assets at FVTPL are stated at fair value, with any gains or losses arising on
remeasurement recognized in profit or loss. Refer to Note 32 for the determination of fair
value of the financial assets.
ii. Financial assets at amortized cost
Financial assets that meet the following conditions are subsequently measured at amortized
cost:
i) The financial asset is held within a business model whose objective is to hold financial
assets in order to collect contractual cash flows; and
ii) The contractual terms of the financial asset give rise on specified dates to cash flows
that are solely payments of principal and interest on the principal amount outstanding
Subsequent to initial recognition, financial assets at amortized cost - consisting of cash and
cash equivalents, trade receivables at amortized cost, trade receivables (including from
related parties), contract assets and other receivables (including from related parties) - are
measured at amortized cost, which equals the gross carrying amount determined using the
effective interest method less any impairment loss. Exchange differences are recognized in
profit or loss.

- 29 -
Cash equivalents include time deposits that are highly liquid, readily convertible to a known
amount of cash and are subject to an insignificant risk of changes in value.
iii. Investments in equity instruments at FVTOCI
On initial recognition, the Company may make an irrevocable election to designate
investments in equity instruments as at FVTOCI. Designation as at FVTOCI is not
permitted if the equity investment is held for trading or if it is contingent consideration
recognized by an acquirer in a business combination.
Investments in equity instruments at FVTOCI are subsequently measured at fair value with
gains and losses arising from changes in fair value recognized in other comprehensive
income and accumulated in other equity. The cumulative gain or loss will not be reclassified
to profit or loss on disposal of the equity investments; instead, it will be transferred to
retained earnings.
Dividends on these investments in equity instruments are recognized in profit or loss when
the Company’s right to receive the dividends is established, unless the dividends clearly
represent a recovery of part of the cost of the investment.
2017
Financial assets are classified into the following categories: financial assets at FVTPL,
available-for-sale financial assets, and loans and receivables.
i. Financial assets at FVTPL
Financial assets at FVTPL are derivatives that do not meet the criteria for hedge accounting
and are measured at fair value with any gains or losses arising from remeasurement
recognized in profit or loss. Refer to Note 32 for the determination of fair value of the
financial assets.
ii. Available-for-sale financial assets
Available-for-sale financial assets are non-derivatives that are either designated as
available-for-sale or are not classified as loans and receivables, held-to-maturity investments
or financial assets at FVTPL.
Available-for-sale financial assets are measured at fair value. Changes in the carrying
amount of available-for-sale monetary financial assets relating to changes in foreign
currency exchange rates, interest income calculated using the effective interest method and
dividends on available-for-sale equity investments are recognized in profit or loss. Other
changes in the carrying amount of available-for-sale financial assets are recognized in other
comprehensive income and will be reclassified to profit or loss when the investment is
disposed of or is determined to be impaired.
Dividends on available-for-sale equity instruments are recognized in profit or loss when the
Group’s right to receive the dividends is established.

- 30 -
iii. Loans and receivables
Except for financial assets at FVTPL, loans and receivables (primarily including cash and
cash equivalent, note receivables, debt instruments with no active market, trade receivables,
and other receivables) are measured at amortized cost using the effective interest method,
less any impairment, except for short-term receivables when the effect of discounting is
immaterial.
Cash equivalents include time deposits that are highly liquid, readily convertible to a known
amount of cash and are subject to an insignificant risk of changes in value.
b) Impairment of financial assets
2018
The Group recognizes a loss allowance for expected credit losses (ECL) on financial assets at
amortized cost (including cash and cash equivalents, trade receivables at amortized cost, trade
receivables (including from related parties)), contract assets, other receivables (including from
related parties) and investments in debt instruments that are measured at FVTOCI.
For trade receivables and contract assets, the Group measures the loss allowance for that
financial instrument at an amount equal to 12-month ECLs. For all other financial instruments,
the Group recognizes lifetime ECLs when there has been a significant increase in credit risk
since initial recognition. If, on the other hand, the credit risk on a financial instrument has not
increased significantly since initial recognition, the Group measures the loss allowance for that
financial instrument at an amount equal to 12-month ECLs.
Expected credit losses reflect the weighted average of credit losses with the respective risks of
default occurring as the weights. Lifetime ECLs represent the expected credit losses that will
result from all possible default events over the expected life of a financial instrument. In
contrast, 12-month ECLs represent the portion of lifetime ECLs that is expected to result from
default events on a financial instrument that are possible within 12 months after the reporting
date.
The Group recognizes an impairment loss in profit or loss for all financial instruments with a
corresponding adjustment to their carrying amount through a loss allowance account.
2017
Financial assets are assessed for indicators of impairment at the end of each reporting period.
Financial assets are considered to be impaired when there is objective evidence that, as a result
of one or more events that occurred after the initial recognition of the financial asset, the
estimated future cash flows of the investment have been affected.
For financial assets carried at amortized cost, such as trade receivables, assets that are assessed
not to be impaired individually are, in addition, assessed for impairment on a collective basis.
The Company assesses the collectability of receivables by performing the account aging
analysis and examining current trends in the credit quality of its customers.
For financial assets carried at amortized cost, the amount of the impairment loss recognized is
the difference between the asset’s carrying amount and the present value of estimated future
cash flows, discounted at the financial asset’s original effective interest rate.

- 31 -
For financial assets measured at amortized cost, if, in a subsequent period, the amount of the
impairment loss decreases and the decrease can be related objectively to an event occurring after
the impairment was recognized, the previously recognized impairment loss is reversed through
profit or loss to the extent that the carrying amount of the investment at the date the impairment
is reversed does not exceed what the amortized cost would have been had the impairment not
been recognized.
For available-for-sale equity investments, a significant or prolonged decline in the fair value of
the security below its cost is considered to be objective evidence of impairment.
When an available-for-sale financial asset is considered to be impaired, cumulative gains or
losses previously recognized in other comprehensive income are reclassified to profit or loss in
the period. In respect of available-for-sale equity securities, impairment loss previously
recognized in profit or loss are not reversed through profit or loss. Any increase in fair value
subsequent to an impairment loss is recognized in other comprehensive income.
The carrying amount of the financial asset is reduced by the impairment loss directly for all
financial assets with the exception of trade receivables, where the carrying amount is reduced
through the use of an allowance account. When a trade receivable is considered uncollectible, it
is written off against the allowance account. Subsequent recoveries of amounts previously
written off are credited against the allowance account. Changes in the carrying amount of the
allowance account are recognized in profit or loss except for uncollectible trade receivables that
are written off against the allowance account.
c) Derecognition of financial assets
The Group derecognizes a financial asset only when the contractual rights to the cash flows
from the asset expire, or when it transfers the financial asset and substantially all the risks and
rewards of ownership of the asset to another party.
On derecognition of a financial asset in its entirety, the difference between the asset’s carrying
amount and the sum of the consideration received and receivable and the cumulative gain or
loss that had been recognized in other comprehensive income is recognized in profit or loss.
2) Financial liabilities and equity instruments
Debt and equity instruments issued by a company entity are classified as either financial liabilities
or as equity in accordance with the substance of the contractual arrangements and the definitions of
a financial liability and an equity instrument.
Equity instruments issued by the Company are recognized at the proceeds received, net of direct
issue costs.
Repurchase of the Company’s own equity instruments is recognized in and deducted directly from
equity. No gain or loss is recognized in profit or loss on the purchase, sale, issue or cancellation of
the Company’s own equity instruments.
Except financial liabilities at FVTPL, financial liabilities are measured at amortized cost using the
effective interest method. Financial liabilities at FVTPL are stated at fair value, with any gain or
loss arising on remeasurement recognized in profit or loss.
3) Derivative financial instruments
The Group enters into a variety of derivative financial instruments to manage its exposure to foreign
exchange rate risks, including currency swaps.

- 32 -
Derivatives are initially recognized at fair value at the date on which the derivative contracts are
entered into and are subsequently remeasured to their fair value at the end of each reporting period.
The resulting gain or loss is recognized in profit or loss immediately unless the derivative is
designated and effective as a hedging instrument; in which event, the timing of the recognition in
profit or loss depends on the nature of the hedging relationship. When the fair value of a derivative
financial instrument is positive, the derivative is recognized as a financial asset; when the fair value
of a derivative financial instrument is negative, the derivative is recognized as a financial liability.
p. Provisions
Provisions are measured at the best estimate of the discounted cash flows of the consideration required
to settle the present obligation at the end of the reporting period, taking into account the risks and
uncertainties surrounding the obligation. When a provision is measured using the cash flows estimated
to settle the present obligation, its carrying amount is the present value of those cash flows.
Provisions for the expected cost of warranty obligations are recognized at the date of sale of the relevant
products, at the best estimate of the expenditure required to settle the Group’s obligation by the
management of the Group.
q. Revenue recognition
2018
The Group identifies contracts with the customers, allocates the transaction price to the performance
obligations, and recognizes revenue when performance obligations are satisfied.
1) Sale of goods
The sale of goods is recognized as revenue when the goods are delivered to the customer’s specific
location because it is the time when the customer has full discretion over the manner of distribution
and price to sell the goods, has the primary responsibility for sales to future customers, and bears
the risks of obsolescence. Trade receivables or contract assets are recognized concurrently.
The Group does not recognize revenue on materials delivered to subcontractors because this
delivery does not involve a transfer of control.
2) Rental revenue
The operation of leasing business was in accordance with IAS 17 Leases. The possible situations
related to lease (such as the terms and conditions of leasing, the probabilities of future lease
receivables and the burden of future costs) would be treated as operating lease.
3) Electricity generation revenue
Revenue is recognized when the power is transmitted to the substation of a power company.
Electricity generation revenue is based on the fair value of subsidiary’s settled value with the power
company. However, when receivables are expected to be realized within one year, the value at the
settlement date would not be discounted to the present to determine the fair value, since the
difference between fair value and settled value is negligible and the transactions are frequent.
4) Dividend and interest income
Dividend income from investments is recognized when the shareholder’s right to receive payment
has been established provided that it is probable that the economic benefits will flow to the Group
and the amount of income can be measured reliably.

- 33 -
Interest income from a financial asset is recognized when it is probable that the economic benefits
will flow to the Group and the amount of income can be measured reliably. Interest income is
accrued on a time basis, by reference to the principal outstanding and at the effective interest rate
applicable.
2017
Revenue is measured at the fair value of the consideration received or receivable. Revenue is reduced
for estimated customer returns, rebates and other similar allowances. Allowance for sales returns and
liability for returns are recognized at the time of sale based on the seller’s reliable estimate of future
returns and based on past experience and other relevant factors.
1) Sale of goods
Revenue from the sale of goods is recognized when all the following conditions are satisfied:
a) The Group has transferred to the buyer the significant risks and rewards of ownership of the
goods;
b) The Group retains neither continuing managerial involvement to the degree usually associated
with ownership nor effective control over the goods sold;
c) The amount of revenue can be measured reliably;
d) It is probable that the economic benefits associated with the transaction will flow to the Group;
and
e) The costs incurred or to be incurred in respect of the transaction can be measured reliably.
The Group does not recognize sales revenue on materials delivered to subcontractors because this
delivery does not involve a transfer of risks and rewards of materials ownership.
2) Rental revenue
The operation of leasing business was in accordance with IAS 17 Leases, that is, the possible
situation related to leasing (ex. the condition of leasing, and the burden of future cost) would treat as
operating lease.
3) Electricity generation revenue
Revenue is recognized when the power is transmitted to the substation of a power company.
Electricity generation revenue is based on the fair value of subsidiary’s settled value with the power
company. However, when receivables are expected to be realized within one year, the value at the
settlement date would not be discounted to the present to determine the fair value, since the
difference between fair value and settled value is negligible and the transactions are frequent.
4) Dividend and interest income
Dividend income from investments is recognized when the shareholder’s right to receive payment
has been established provided that it is probable that the economic benefits will flow to the Group
and the amount of income can be measured reliably.
Interest income from a financial asset is recognized when it is probable that the economic benefits
will flow to the Group and the amount of income can be measured reliably. Interest income is
accrued on a time basis, by reference to the principal outstanding and at the effective interest rate
applicable.

- 34 -
r. Leasing
Leases are classified as finance leases whenever the terms of the lease transfer substantially all the risks
and rewards of ownership to the lessee. All other leases are classified as operating leases.
1) The Group as lessor
Rental income from operating leases is recognized on a straight-line basis over the term of the
relevant lease.
2) The Group as lessee
Operating lease payments are recognized as an expense on a straight-line basis over the lease term.
s. Employee benefits
1) Short-term employee benefits
Liabilities recognized in respect of short-term employee benefits are measured at the undiscounted
amount of the benefits expected to be paid in exchange for the related service.
2) Retirement benefits
Payments to defined contribution retirement benefit plans are recognized as an expense when
employees have rendered service entitling them to the contributions.
Defined benefit costs (including service cost, net interest and remeasurement) under the defined
benefit retirement benefit plans are determined using the projected unit credit method. Service cost
(including current service cost) and net interest on the net defined benefit liabilities (assets) are
recognized as employee benefits expense in the period they occur. Remeasurement, comprising
actuarial gains and losses and the return on plan assets (excluding interest), is recognized in other
comprehensive income in the period in which it occurs. Remeasurement recognized in other
comprehensive income is reflected immediately in retained earnings and will not be reclassified to
profit or loss.
Net defined benefit liabilities (assets) represent the actual deficit (surplus) in the Group’s defined
benefit plans. Any surplus resulting from this calculation is limited to the present value of any
refunds from the plans or reductions in future contributions to the plans.
3) Termination benefits
A liability for a termination benefit is recognized at the earlier of when the Group can no longer
withdraw the offer of the termination benefit and when the Group recognizes any related
restructuring costs.
t. Taxation
Income tax expense represents the sum of the tax currently payable and deferred tax.
1) Current tax
According to the Income Tax Law, an additional tax at 10% of unappropriated earnings is provided
for as income tax in the year the shareholders approve to retain the earnings.

- 35 -
Adjustments of prior years’ tax liabilities are added to or deducted from the current year’s tax
provision.
2) Deferred tax
Deferred tax is recognized on temporary differences between the carrying amounts of assets and
liabilities and the corresponding tax bases used in the computation of taxable profit. Deferred tax
liabilities are generally recognized for all taxable temporary differences. Deferred tax assets are
generally recognized for all deductible temporary differences, research and development
expenditures, and personnel training expenditures to the extent that it is probable that taxable profits
will be available against which those deductible temporary differences can be utilized.
Deferred tax liabilities are recognized for taxable temporary differences associated with investments
in subsidiaries and associates, except where the Group is able to control the reversal of the
temporary difference and it is probable that the temporary difference will not reverse in the
foreseeable future. Deferred tax assets arising from deductible temporary differences associated
with such investments are only recognized to the extent that it is probable that there will be
sufficient taxable profits against which to utilize the benefits of the temporary differences and they
are expected to reverse in the foreseeable future.
The carrying amount of deferred tax assets is reviewed at the end of each reporting period and
reduced to the extent that it is no longer probable that sufficient taxable profits will be available to
allow all or part of the asset to be recovered. A previously unrecognized deferred tax asset is also
reviewed at the end of each reporting period and recognized to the to the extent that it has become
probable that future taxable profit will allow the deferred tax asset to be recovered.
Deferred tax liabilities and assets are measured at the tax rates that are expected to apply in the
period in which the liabilities are settled or the assets are realized, based on tax rates (and tax laws)
that have been enacted or substantively enacted by the end of the reporting period. The
measurement of deferred tax liabilities and assets reflects the tax consequences that would follow
from the manner in which the Group expects, at the end of the reporting period, to recover or settle
the carrying amount of its assets and liabilities.
3) Current and deferred tax for the year
Current and deferred tax are recognized in profit or loss, except when they relate to items that are
recognized in other comprehensive income or directly in equity, in which case, the current and
deferred tax are also recognized in other comprehensive income or directly in equity respectively.
5. CRITICAL ACCOUNTING JUDGMENTS AND KEY SOURCES OF ESTIMATION
UNCERTAINTY
In the application of the Group's accounting policies (Note 4), management is required to make judgments,
estimates and assumptions about the carrying amounts of assets and liabilities that are not readily apparent
from other sources. The estimates and associated assumptions are based on historical experience and other
factors that are considered relevant. Actual results may differ from these estimates.
The estimates and underlying assumptions are reviewed on an ongoing basis. Revisions to accounting
estimates are recognized in the period in which the estimate is revised if the revision affects only that period
or in the period of the revision and future periods if the revision affects both current and future periods.

- 36 -
a. Business model assessment for financial assets - 2018
The Group determines the business model at a level that reflects how groups of financial assets are
managed together to achieve a particular business objective. This assessment includes judgment about
all relevant evidence including how the performance of the assets is evaluated, the risks that affect the
performance of the assets and how these are managed, and how the managers of the assets are
compensated. The Group monitors financial assets measured at amortized cost or at FVTOCI, and when
assets are derecognized prior to their maturity, the Group understands the reasons for their disposal and
whether the reasons are consistent with the objective of the business for which the assets were held.
Monitoring is part of the Group’s continuous assessment of whether the business model for which the
remaining financial assets are held continues to be appropriate and, if it is not appropriate, whether
there has been a change in the business model such that a prospective change to the classification of
those assets is proper.
b. Estimated impairment of financial assets - 2018
The provision for impairment of trade receivables and investments in debt instruments are based on
assumptions about risk of default and expected loss rates. The Group uses judgment in making these
assumptions and in selecting the inputs to the impairment calculation, based on the Group’s historical
experience, existing market conditions as well as forward looking estimates as of the end of each
reporting period. Refer to Note 13 for details of the key assumptions and inputs used.
c. Estimated impairment of trade receivables - 2017
When there is objective evidence of impairment loss for trade receivables, the Group takes into
consideration the estimation of future cash flows of such receivables. The amount of the impairment
loss is measured as the difference between the asset’s carrying amount and the present value of
estimated future cash flows (excluding future credit losses that have not been incurred) discounted at
the financial asset’s original effective interest rate. Where the actual future cash flows are less than
expected, a material impairment loss may arise.
d. Impairment of goodwill
Determining whether goodwill is impaired requires an estimation of the value-in-use of the
cash-generating units to which goodwill has been allocated. The value-in-use calculation requires
management to estimate the future cash flows expected to arise from the cash-generating unit and a
suitable discount rate in order to calculate the present value. Where the actual future cash flows are less
than expected, a material impairment loss may arise.
e. Impairment of property, plant and equipment
The impairment of equipment in relation to the production of handsets was based on the recoverable
amount of those assets, which is the higher of fair value less costs to sell or value-in-use of those assets.
Any changes in the market price or future cash flows will affect the recoverable amount of those assets
and may lead to the recognition or reversal of additional impairment losses.
f. Write-down of inventories
The net realizable value of inventories is the estimated selling price in the ordinary course of business
less the estimated costs of completion and the estimated costs necessary to make the sale. The
estimation of net realizable value is based on current market conditions and historical experience with
product sales of a similar nature. Changes in market conditions may have a material impact on the
estimation of the net realizable value.

- 37 -
6. CASH AND CASH EQUIVALENTS
December 31
2018 2017
Cash on hand $ 3,240 $ 4,001
Checking accounts 975,772 1,215,740
Demand deposits 39,717,272 35,683,512
Time deposits 22,589,017 20,880,607
$ 63,285,301 $ 57,783,860
7. FINANCIAL INSTRUMENTS AT FVTPL
December 31
2018 2017 Financial assets at FVTPL - current
Financial assets held for trading
Derivative financial assets (not under hedge accounting)
Forward exchange contracts $ - $ 101,677
Financial assets mandatorily classified as at FVTPL
Derivative financial assets (not under hedge accounting)
Forward exchange contracts $ 93,643 $ -
Currency swaps 38,496 -
$ 132,139 $ 101,677
Financial assets at FVTPL - non-current
Financial assets mandatorily classified as at FVTPL
Non-derivative financial assets
Mutual funds $ 99,727 $ -
Domestic quoted shares 11,493 -
$ 111,220 $ -
Financial liabilities at FVTPL - current
Financial liabilities held for trading
Derivative financial liabilities (not under hedge accounting)
Forward exchange contracts $ - $ 96,393
Currency swaps - 50,659
$ - $ 147,052
Financial liabilities at FVTPL - current
Financial liabilities mandatorily classified as at FVTPL
Non-derivative financial assets
Forward exchange contracts $ 45,584 $ -
Currency swaps 6,293 -
$ 51,877 $ -

- 38 -
At the end of the reporting period, outstanding forward exchange contracts and currency swap contracts not
under hedge accounting were as follows:
Currency Maturity Date
Notional Amount
(In Thousands)
December 31, 2018
The Parent Company
Currency swaps USD/NTD 2019.01.09-
2019.05.06
USD120,000/NTD3,652,320
Lite-On Overseas Trading Co., Ltd.
Forward exchange contracts CNY/USD 2019.01.15-
2019.03.11
CNY885,336/USD128,000
Currency swaps CNY/USD 2019.01.29 CNY167,338/USD24,000
LITE-ON SINGAPORE PTE. LTD.
Forward exchange contracts USD/NTD 2019.01.14-
2019.06.10
USD600,000/NTD18,199,954
Forward exchange contracts USD/CNY 2019.01.24 USD15,000/CNY104,925
Forward exchange contracts CNY/USD 2019.03.06 CNY139,020/USD20,000
Forward exchange contracts USD/MXN 2019.01.04 USD1,600/MXN32,384
Forward exchange contracts USD/EUR 2019.01.04 USD14,790/EUR13,000
Forward exchange contracts USD/JPY 2019.01.04 USD883/JPY100,000
Forward exchange contracts USD/CAD 2019.01.03 USD984/CAD1,300
Forward exchange contracts USD/BRL 2019.01.07 USD2,500/BRL9,587
Forward exchange contracts USD/INR 2019.01.14 USD6,000/INR433,664
Currency swaps CNY/USD 2019.01.09-
2019.03.13
USD367,701/USD53,000
Philip & Lite-On Digital Solutions
Corporation
Forward exchange contracts USD/EUR 2019.01.04 USD3,980/EUR3,500
Currency swaps USD/NTD 2019.01.14 USD20,000/NTD614,900
Silitech Technology Corporation
Forward exchange contracts USD/MYR 2019.01.07-
2019.03.06
USD1,980,000/MYR8,267,010
Forward exchange contracts EUR/MYR 2019.01.28-
2019.03.27
EUR310,000/MYR1,488,464
Forward exchange contracts USD/CNY 2019.01.14-
2019.02.15
USD3,000,000/CNY20,757,600
December 31, 2017
The Parent Company
Currency swaps USD/NTD 2018.01.10-
2018.11.06
USD130,000/NTD3,856,015
Lite-On Overseas Trading Co., Ltd.
Forward exchange contracts CNY/USD 2018.01.08-
2018.01.31
CNY575,824/USD87,000
(Continued)

- 39 -
Currency Maturity Date
Notional Amount
(In Thousands)
LITE-ON SINGAPORE PTE. LTD.
Forward exchange contracts USD/EUR 2018.01.04 USD19,040/EUR16,000
Forward exchange contracts USD/BRL 2018.01.18 USD2,000/BRL6,690
Forward exchange contracts USD/NTD 2018.01.31-
2018.04.03
USD445,000/NTD13,233,313
Forward exchange contracts CNY/USD 2018.01.17-
2018.01.29
CNY480,017/USD72,500
Forward exchange contracts USD/CAD 2018.01.03 USD1,573/CAD2,000
Forward exchange contracts USD/JPY 2018.01.04 USD889/JPY100,000
Lite-On Electronics (Thailand) Co., Ltd.
Forward exchange contracts THB/USD 2018.01.16-
2018.02.15
THB91,160/USD2,800
Philip & Lite-On Digital Solutions
Corporation
Forward exchange contracts USD/EUR 2018.01.04 USD5,950/EUR5,000
Currency swaps USD/NTD 2018.01.16 USD27,000/NTD808,650
LITE-ON MOBILE PTE. LTD.
Forward exchange contracts USD/CNY 2018.01.29 USD70,000/CNY459,620
Silitech Technology Corporation
Forward exchange contracts USD/MYR 2018.01.08-
2018.03.08
USD1,050/MYR4,379
Forward exchange contracts EUR/MYR 2018.02.26-
2018.03.26
EUR150/MYR735
(Concluded)
The Group entered into derivative contracts in 2018 and 2017 to manage exposures due to fluctuations of
foreign exchange rates. The derivative contracts entered into by the Group did not meet the criteria for
hedge accounting. Thus, the derivative contracts are classified as financial assets or financial liabilities at
FVTPL. The financial risk management objectives of the Group were to minimize risks due to changes in
fair value or cash flows.
8. FINANCIAL ASSETS AT FVTOCI
Investments in Equity Instruments at FVTOCI
December 31,
2018
Non-current
Domestic investments
Listed shares $ 199,825
Emerging market shares 99,844
Unlisted shares 40,998
340,667
Foreign investments
Unlisted shares 43,952
Listed shares 4,056
48,008
$ 388,675
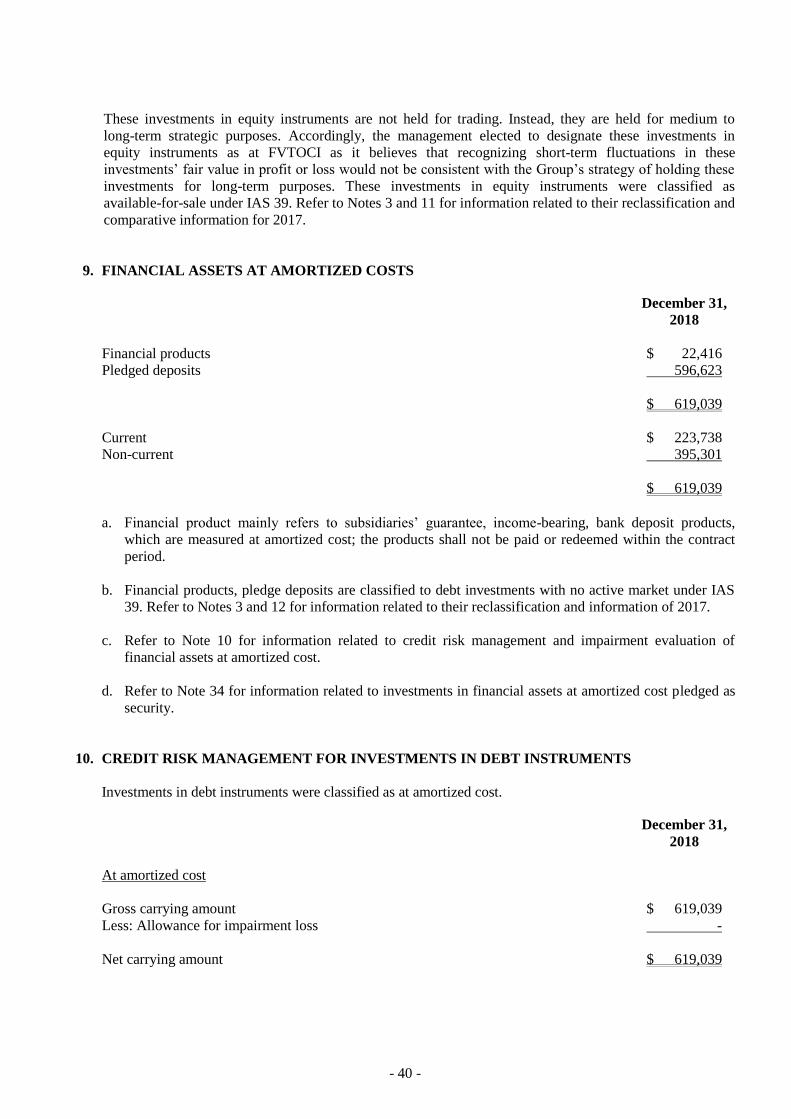
- 40 -
These investments in equity instruments are not held for trading. Instead, they are held for medium to
long-term strategic purposes. Accordingly, the management elected to designate these investments in
equity instruments as at FVTOCI as it believes that recognizing short-term fluctuations in these
investments’ fair value in profit or loss would not be consistent with the Group’s strategy of holding these
investments for long-term purposes. These investments in equity instruments were classified as
available-for-sale under IAS 39. Refer to Notes 3 and 11 for information related to their reclassification and
comparative information for 2017.
9. FINANCIAL ASSETS AT AMORTIZED COSTS
December 31,
2018
Financial products $ 22,416
Pledged deposits 596,623
$ 619,039
Current $ 223,738
Non-current 395,301
$ 619,039
a. Financial product mainly refers to subsidiaries’ guarantee, income-bearing, bank deposit products,
which are measured at amortized cost; the products shall not be paid or redeemed within the contract
period.
b. Financial products, pledge deposits are classified to debt investments with no active market under IAS
39. Refer to Notes 3 and 12 for information related to their reclassification and information of 2017.
c. Refer to Note 10 for information related to credit risk management and impairment evaluation of
financial assets at amortized cost.
d. Refer to Note 34 for information related to investments in financial assets at amortized cost pledged as
security.
10. CREDIT RISK MANAGEMENT FOR INVESTMENTS IN DEBT INSTRUMENTS
Investments in debt instruments were classified as at amortized cost.
December 31,
2018
At amortized cost
Gross carrying amount $ 619,039
Less: Allowance for impairment loss -
Net carrying amount $ 619,039

- 41 -
In order to minimize credit risk, the Group has designated its credit management committee to evaluate the
exposure of default risk. The credit rating information may be obtained from independent rating agencies,
where available, and if not available, the credit management committee uses other publicly available
financial information to evaluate the debtors.
11. AVAILABLE-FOR-SALE FINANCIAL ASSETS
December 31,
2017
Non-current
Domestic investments
Listed shares $ 243,321
Emerging market shares 107,399
Unlisted shares 15,785
366,505
Foreign investments
Unlisted shares 72,575
Mutual funds 68,469
Listed shares 5,580
146,624
$ 513,129
Refer to Note 32 for information relating to the fair values determined for available-for-sale financial
assets.
There was objective evidence that the fair values of some financial assets were below their carrying costs
and will permanently decline. As a result, the Group recognized impairment loss of $10,987 thousand in the
consolidated statements of comprehensive income for the years ended December 31, 2017.
12. DEBT INVESTMENTS WITH NO ACTIVE MARKET
December 31,
2017
Financial products $ 766,844
Pledged deposits and restricted bank deposits 718,024
$ 1,484,868
Current $ 911,783
Non-current 573,085
$ 1,484,868
Financial product mainly refers to subsidiary’s guarantee income-bearing bank deposit products, which are
measured at amortized cost; the products shall not be paid or redeemed within the contract period.
Refer to Note 34 for information on asset pledged as collateral or for security.

- 42 -
13. NOTES AND TRADE RECEIVABLES, NET
December 31
2018 2017
Notes receivable
Notes receivable - operating $ 697,671 $ 282,316
Trade receivables
At amortized cost
Gross carrying amount $ 45,703,661 $ 52,561,262
Allowance for impairment loss (218,840) (199,568)
Unrealized interest revenue - (323,962)
$ 45,484,821 $ 52,037,732
a. Notes receivable
The aging of notes receivable was as follows:
December 31 2018 2017
Not past due $ 697,671 $ 282,316
The above aging schedule was based on the number of days past the due date.
b. Trade receivables
For the year ended December 31, 2018
The average credit period on the sales of goods was approximately 90 days, and no interest was charged
on trade receivables. In order to minimize credit risk, the management of the Group has delegated a
team responsible for determining credit limits, credit approvals and other monitoring procedures to
ensure that follow-up action is taken to recover overdue receivables. In addition, the Group reviews the
recoverable amount of each individual trade debt at the end of the reporting period to ensure that
adequate allowance is made for possible irrecoverable amounts. In this regard, the management believes
the Group’s credit risk was significantly reduced.
The Group applies the simplified approach to estimate expected credit losses prescribed by IFRS 9,
which permits the use of a lifetime expected losses allowance for all trade receivables. The expected
credit losses on trade receivables are estimated using an allowance matrix, which takes into
consideration the historical credit loss experience with the respective debtor, the current financial
position of the debtor, and the current and future economic conditions of the industry as well as the
overall economy. Upon consideration, there was no material difference across various client classes.
Thus, the Group estimated the expected credit losses using the number of days that a trade receivable
was past due.
The Group writes off a trade receivable when there is information indicating that the debtor is
experiencing severe financial difficulty and there is no realistic prospect of recovery, e.g. when the
debtor has been placed under liquidation or when the trade receivables are more than 2 years past due,
whichever occurs earlier. For trade receivables that have been written off, the Group continues to
engage in enforcement activity to attempt to recover the receivables which are due. Where recoveries
are made, these are recognized in profit or loss.

- 43 -
The following table details the loss allowance of trade receivables based on the Group’s allowance
matrix.
Not Past Due
Less Than and
Including 60
Days 61 to 210 Days 211 to 240 Days
More Than 240
Days Total
Expected credit loss rate 0% 0.1%-5% 40%-70% 50%-100% 100%
Gross carrying amount $ 44,450,374 $ 986,808 $ 114,360 $ 2,468 $ 149,651 $ 45,703,661
Loss allowance (9,560) (57,933) (1,696) (149,651) (218,840)
Amortized cost $ 44,450,374 $ 977,248 $ 56,427 $ 772 $ - $ 45,841,821
The movements of the loss allowance of trade receivables were as follows:
For the Year
Ended
December 31,
2018
Balance at January 1 (IAS 18) $ 199,568
IFRS 15 contract assets reclassification adjustment (149)
Balance at January 1 (IFRS 15) 199,419
Expected credit loss 55,148
Reversal of previously recognized write-off 927
Actual write-off (17,508)
Disposal of subsidiaries (18,383)
Effects of changes in foreign exchange rates (763)
Balance at December 31 $ 218,840
For the year ended December 31, 2017
The Group applied the same credit policy in 2018 and 2017. The Group recognized an allowance for
impairment loss of 100% against all receivables over 240 days past due because historical experience is
that receivables that are past due beyond 240 days are not recoverable. Allowance for impairment loss
was recognized against trade receivables between 1 and 240 days based on the estimated irrecoverable
amounts determined by reference to past default experience with the counterparties and an analysis of
their respective current financial positions.
The aging of receivables were as follows:
December 31,
2017
Not past due $ 51,255,744
Past due
1-60 days 1,006,738
61-210 days 144,809
211-240 days 1,661
Over 240 days 152,310
1,305,518
$ 52,561,262
The above aging schedule was based on the number of days past the due date.

- 44 -
Trade receivables from sales on installments by the Group were as follows:
December 31,
2017
Trade receivables $ 2,171,192
Unrealized interests revenue (323,962)
$ 1,847,230
Movements in the allowance for impairment loss recognized on notes receivable and trade receivables
were as follows:
For the Year
Ended
December 31,
2017
Balance at January 1 $ 219,021
Allowance reversed for impairment loss (14,132)
Amounts written off during the period as uncollectible (308)
Foreign exchange translation (5,013)
Balance at December 31 $ 199,568
14. INVENTORIES, NET
December 31
2018 2017
Finished goods $ 19,718,524 $ 17,234,506
Raw materials 8,462,033 7,622,326
Work in progress 2,650,114 2,908,250
Inventory in transit 200,049 241,992
Merchandise 462,346 305,498
$ 31,493,066 $ 28,312,572
The costs of inventories recognized as cost of goods sold for the years ended December 31, 2018 and 2017
were $18,006,839 thousand and $186,854,505 thousand, respectively.
The cost of inventories recognized as cost of goods sold for the year ended December 31, 2018 included an
increase in cost of goods sold amounting to $202,838 thousand, due to inventory write-downs to their net
realizable value. The cost of inventories recognized as cost of goods sold for the year ended December 31,
2017 included an increase in cost of goods sold amounting to $1,022,255 thousand, due to an increase in
net realizable value.
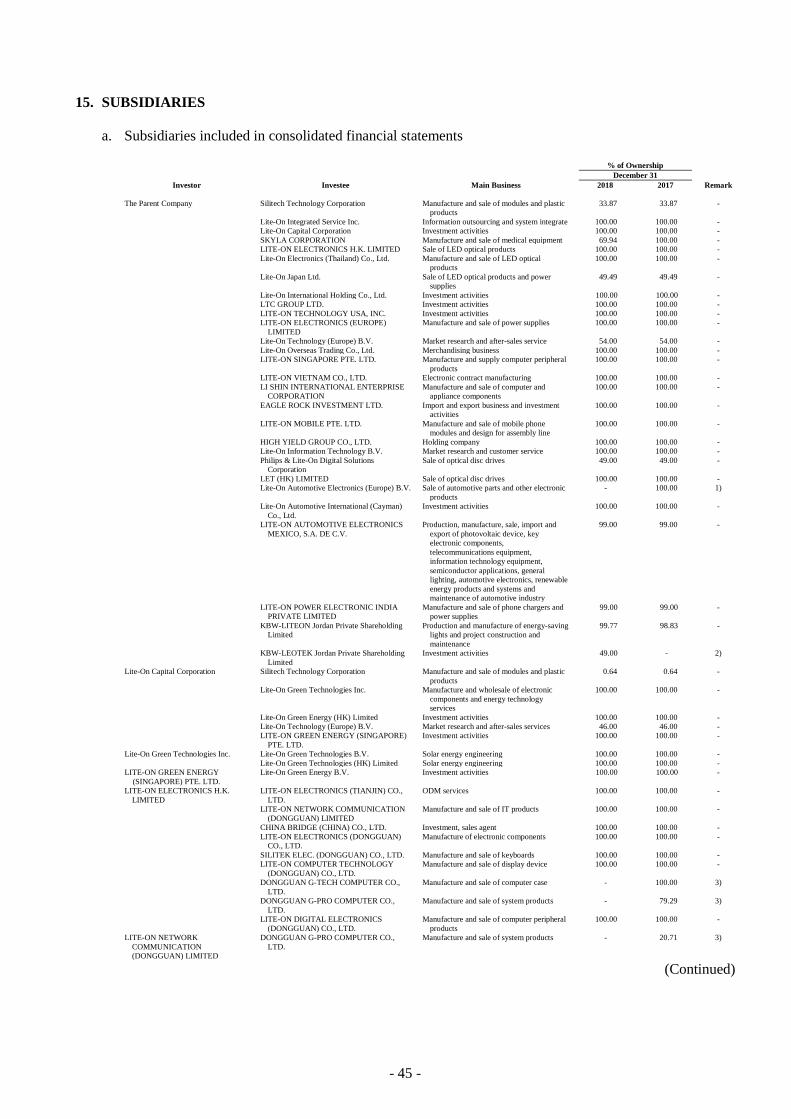
- 45 -
15. SUBSIDIARIES
a. Subsidiaries included in consolidated financial statements
% of Ownership
December 31
Investor Investee Main Business 2018 2017 Remark
The Parent Company Silitech Technology Corporation Manufacture and sale of modules and plastic
products 33.87 33.87 -
Lite-On Integrated Service Inc. Information outsourcing and system integrate 100.00 100.00 -
Lite-On Capital Corporation Investment activities 100.00 100.00 -
SKYLA CORPORATION Manufacture and sale of medical equipment 69.94 100.00 -
LITE-ON ELECTRONICS H.K. LIMITED Sale of LED optical products 100.00 100.00 -
Lite-On Electronics (Thailand) Co., Ltd. Manufacture and sale of LED optical
products 100.00 100.00 -
Lite-On Japan Ltd. Sale of LED optical products and power
supplies 49.49 49.49 -
Lite-On International Holding Co., Ltd. Investment activities 100.00 100.00 -
LTC GROUP LTD. Investment activities 100.00 100.00 -
LITE-ON TECHNOLOGY USA, INC. Investment activities 100.00 100.00 -
LITE-ON ELECTRONICS (EUROPE)
LIMITED
Manufacture and sale of power supplies 100.00 100.00 -
Lite-On Technology (Europe) B.V. Market research and after-sales service 54.00 54.00 -
Lite-On Overseas Trading Co., Ltd. Merchandising business 100.00 100.00 -
LITE-ON SINGAPORE PTE. LTD. Manufacture and supply computer peripheral
products
100.00 100.00 -
LITE-ON VIETNAM CO., LTD. Electronic contract manufacturing 100.00 100.00 -
LI SHIN INTERNATIONAL ENTERPRISE
CORPORATION Manufacture and sale of computer and
appliance components 100.00 100.00 -
EAGLE ROCK INVESTMENT LTD. Import and export business and investment
activities 100.00 100.00 -
LITE-ON MOBILE PTE. LTD. Manufacture and sale of mobile phone
modules and design for assembly line 100.00 100.00 -
HIGH YIELD GROUP CO., LTD. Holding company 100.00 100.00 -
Lite-On Information Technology B.V. Market research and customer service 100.00 100.00 -
Philips & Lite-On Digital Solutions
Corporation Sale of optical disc drives 49.00 49.00 -
LET (HK) LIMITED Sale of optical disc drives 100.00 100.00 -
Lite-On Automotive Electronics (Europe) B.V. Sale of automotive parts and other electronic
products
- 100.00 1)
Lite-On Automotive International (Cayman)
Co., Ltd.
Investment activities 100.00 100.00 -
LITE-ON AUTOMOTIVE ELECTRONICS
MEXICO, S.A. DE C.V.
Production, manufacture, sale, import and
export of photovoltaic device, key
electronic components,
telecommunications equipment,
information technology equipment,
semiconductor applications, general
lighting, automotive electronics, renewable
energy products and systems and
maintenance of automotive industry
99.00 99.00 -
LITE-ON POWER ELECTRONIC INDIA
PRIVATE LIMITED Manufacture and sale of phone chargers and
power supplies 99.00 99.00 -
KBW-LITEON Jordan Private Shareholding
Limited Production and manufacture of energy-saving
lights and project construction and
maintenance
99.77 98.83 -
KBW-LEOTEK Jordan Private Shareholding
Limited
Investment activities 49.00 - 2)
Lite-On Capital Corporation Silitech Technology Corporation Manufacture and sale of modules and plastic
products
0.64 0.64 -
Lite-On Green Technologies Inc. Manufacture and wholesale of electronic
components and energy technology
services
100.00 100.00 -
Lite-On Green Energy (HK) Limited Investment activities 100.00 100.00 -
Lite-On Technology (Europe) B.V. Market research and after-sales services 46.00 46.00 -
LITE-ON GREEN ENERGY (SINGAPORE)
PTE. LTD.
Investment activities 100.00 100.00 -
Lite-On Green Technologies Inc. Lite-On Green Technologies B.V. Solar energy engineering 100.00 100.00 -
Lite-On Green Technologies (HK) Limited Solar energy engineering 100.00 100.00 -
LITE-ON GREEN ENERGY Lite-On Green Energy B.V. Investment activities 100.00 100.00 -
(SINGAPORE) PTE. LTD.
LITE-ON ELECTRONICS H.K.
LIMITED
LITE-ON ELECTRONICS (TIANJIN) CO.,
LTD.
ODM services 100.00 100.00 -
LITE-ON NETWORK COMMUNICATION
(DONGGUAN) LIMITED
Manufacture and sale of IT products 100.00 100.00 -
CHINA BRIDGE (CHINA) CO., LTD. Investment, sales agent 100.00 100.00 -
LITE-ON ELECTRONICS (DONGGUAN)
CO., LTD. Manufacture of electronic components 100.00 100.00 -
SILITEK ELEC. (DONGGUAN) CO., LTD. Manufacture and sale of keyboards 100.00 100.00 -
LITE-ON COMPUTER TECHNOLOGY
(DONGGUAN) CO., LTD.
Manufacture and sale of display device 100.00 100.00 -
DONGGUAN G-TECH COMPUTER CO.,
LTD.
Manufacture and sale of computer case - 100.00 3)
DONGGUAN G-PRO COMPUTER CO.,
LTD.
Manufacture and sale of system products - 79.29 3)
LITE-ON DIGITAL ELECTRONICS
(DONGGUAN) CO., LTD.
Manufacture and sale of computer peripheral
products
100.00 100.00 -
LITE-ON NETWORK
COMMUNICATION
(DONGGUAN) LIMITED
DONGGUAN G-PRO COMPUTER CO.,
LTD.
Manufacture and sale of system products - 20.71 3)
(Continued)

- 46 -
% of Ownership
December 31
Investor Investee Main Business 2018 2017 Remark
CHINA BRIDGE (CHINA) CO.,
LTD.
LITE-ON OPTO TECHNOLOGY
(CHANGZHOU) CO., LTD. Development, manufacture of new-type
electronic components and provide
technology consulting services,
maintenance equipment and after-sales
services
12.59 12.59 -
WUXI CHINA BRIDGE EXPRESS
TRADING CO., LTD.
Express and sale of power supplies, printers,
display devices and scanners
100.00 100.00 -
LITE-ON ELECTRONICS
COMPANY LIMITED
LITEON COMMUNICATION
(GUANGZHOU) COMPANY LIMITED
Manufacture and sale of mobile terminal
equipment
100.00 100.00 -
LITE-ON ELECTRONICS (GUANGZHOU)
LIMITED
Manufacture and sale of printers and scanners 100.00 100.00 -
LITE-ON (GUANGZHOU) INFORTECH
CO., LTD. Information outsourcing 100.00 100.00 -
LITEON ELECTRONICS AND WIRELESS
(GUANGZHOU) LIMITED Manufacture and sale of mobile terminal
equipment 100.00 100.00 -
LITE-ON (GUANGZHOU) PRECISION
TOOLING LTD. Manufacture and sale of modules 67.03 67.03 -
LITE-ON TECHNOLOGY (GUANGZHOU)
LIMITED Manufacture and sale of computer cases 100.00 100.00 -
LITE-ON TECHNOLOGY (JIANGSU) CO.,
LTD. Development, manufacture, sale and
installation of power supplies and
transformers and provision of technology
consulting services, maintenance
equipment and precision instruments
100.00 100.00 -
LITE-ON TECHNOLOGY (GZ)
INVESTMENT COMPANY LIMITED
Investment activities 100.00 100.00 -
LITE-ON POWER TECHNOLOGY
(DONGGUAN) CO., LTD.
Development, manufacture and sale of
electronic components, power supplies and
provision technology consulting services
100.00 100.00 -
LITE-ON TECHNOLOGY (GZ)
INVESTMENT COMPANY
LITE-ON (GUANGZHOU) PRECISION
TOOLING LTD. Manufacture and sale of modules 32.97 32.97 -
LIMITED ZHUHAI LITE-ON MOBILE
TECHNOLOGY COMPANY LTD. Mobile phone mold, assembly line design,
manufacture and sale activities. - 100.00 4)
LITE-ON TECHNOLOGY
(JIANGSU) CO., LTD.
LITE-ON TECHNOLOGY (CHANGZHOU)
CO., LTD. Development, manufacture, sale and
installation of power supplies and
transformers and provision technology
consulting services, maintenance
equipment and after-sales services
100.00 100.00 -
LITE-ON OPTO TECHNOLOGY
(CHANGZHOU) CO., LTD.
Development, manufacture and sale of
new-type electronic components and LED
and provision technology consulting
services, maintenance equipment and
after-sales services
87.41 87.41 -
LITE-ON MEDICAL DEVICE
(CHANGZHOU) LTD. Manufacture and sale of medical equipment 100.00 100.00 -
CHANGZHOU LEOTEK NEW ENERGY
TRADE LIMITED Wholesale, import and export and installation
of street lights, signal lights, scenery lights
and new-type electronic components
100.00 100.00 -
LITE-ON COMPUTER (CHANGZHOU)
CO., LTD.
Design, development, manufacture and sale
of computer laptop keyboard modules and
components and provision of technology
consulting services and after-sales services
100.00 100.00 -
Lite-On Automotive Electronics (CZ) Co. Manufacture, sale and processing of
electronic products
100.00 - 5)
LITE-ON GREEN TECHNOLOGIES
(NANJING) CORPORATION
Solar energy engineering 100.00 100.00 6)
YET FOUNDATE LIMITED DONGGUAN LITE-ON COMPUTER CO.,
LTD.
Manufacture and sale of computer hosts and
components
100.00 100.00 -
FORDGOOD ELECTRONIC
LIMITED
LITEON LI SHIN TECHNOLOGY
(GANZHOU) LTD
Manufacture and sale of electronic
components
100.00 100.00 -
LITE-ON ELECTRONICS
(GUANGZHOU) LIMITED
YANTAI LITE-ON MOBILE ELECTRONIC
COMPONENTS CO., LTD.
Development, design, manufacture, sale of
phone case and components and provide
technical support, business management
information consult, goods and technology
import and export.
100.00 100.00 7)
LITE-ON TECHNOLOGY USA,
INC.
LITE-ON, INC. Sales data processing business of
optoelectronic products and power supplies 100.00 100.00 -
LITE-ON TRADING USA, INC. Sale of optical products 100.00 100.00 -
LEOTEK ELECTRONICS USA LLC. Sale of LED products 100.00 100.00 -
POWER INNOVATIONS
INTERNATIONAL, INC. Development, design and manufacture of
power control and energy management 95.25 95.25 -
Lite-On Sales & Distribution Inc. Sale of optical disc drives 100.00 100.00 -
LITE-ON TECHNOLOGY SERVICE, INC. After-sales service of optical products 100.00 100.00 -
Lite-On International Holding Co.,
Ltd.
LITE-ON CHINA HOLDING CO., LTD. Manufacture and sale of computer cases 100.00 100.00 -
LITE-ON SINGAPORE PTE. LTD. Lite-On Technology (Yingtan) Ltd. Manufacture and sale of electronic
components 100.00 100.00 -
LITE-ON TECHNOLOGY (XIANNING)
CO., LTD. Manufacture and sale of electronic
components 100.00 100.00 -
LITE-ON TECHNOLOGY (SHANGHAI)
CO., LTD. Manufacture and sale of energy saving
equipment 100.00 100.00 -
LITE-ON AUTOMOTIVE ELECTRONICS
MEXICO, S.A. DE C.V. Production, manufacture, sale, import and
export of photovoltaic device, key
electronic components,
telecommunications equipment,
information technology equipment,
semiconductor applications, general
lighting, automotive electronics, renewable
energy products and systems and
maintenance of automotive industry
1.00 1.00 -
LITE-ON POWER ELECTRONIC INDIA
PRIVATE LIMITED
Manufacture and sale of phone chargers and
power supplies
1.00 1.00 -
LITE-ON TECHNOLOGY
(SHANGHAI) CO., LTD.
LITE-ON INTELLIGENT TECHNOLOGY
(YENCHENG) CORP.
Wholesale, import and export and installation
of street lights, signal lights, scenery lights
and new-type electronic components
100.00 100.00 -
(Continued)

- 47 -
% of Ownership
December 31
Investor Investee Main Business 2018 2017 Remark
LTC GROUP LTD. TITANIC CAPITAL SERVICES LTD. Investment activities 100.00 100.00 -
LTC INTERNATIONAL LTD. Manufacture and sale of system products 100.00 100.00 -
Lite-On Technology (Europe) B.V. Lite-On (Finland) Oy Manufacture and sale of mobile phone
modules and design for assembly line 100.00 100.00 -
Lite-On (Finland) Oy Lite-On Mobile Oyj Manufacture and sale of mobile phone
modules and design for assembly line 100.00 100.00 -
LITE-ON CHINA HOLDING CO.,
LTD.
LITE-ON ELECTRONICS COMPANY
LIMITED Investment activities 100.00 100.00 -
YET FOUNDATE LIMITED Manufacture of plastic and computer
peripheral products 100.00 100.00 -
I-SOLUTIONS LIMITED Original equipment manufacturer of
electronic products 100.00 100.00 -
FORDGOOD ELECTRONIC LIMITED Import and export and real estate business 100.00 100.00 -
G&W TECHNOLOGY (BVI) LIMITED Real estate management 50.00 50.00 -
G&W TECHNOLOGY (BVI)
LIMITED
G&W TECHNOLOGY LIMITED Leasing business 100.00 100.00 -
EAGLE ROCK INVESTMENT LTD. HUIZHOU LI SHIN ELECTRONIC CO.,
LTD.
Manufacture of computer peripheral products 100.00 100.00 -
HUIZHOU FU TAI ELECTRONIC CO.,
LTD.
Manufacture of computer peripheral products 100.00 100.00 -
HIGH YIELD GROUP CO., LTD. LITE-ON IT INTERNATIONAL (HK)
LIMITED
Sale of optical disc drives 100.00 100.00 -
LITE-ON IT INTERNATIONAL
(HK) LIMITED
LITEON OPTO TECHNOLOGY
(GUANGZHOU) LTD.
Manufacture and sale of optical disc drives 100.00 100.00 -
LiteON Auto Electric Technology
(Guangzhou) Ltd.
Manufacture and sale of optical disc drives 100.00 100.00 -
LITEON-IT OPTO TECH (BH) CO., LTD. Manufacture and sale of optical disc drives 100.00 100.00 -
Lite-On Information Technology B.V. Lite-On Information Technology GmbH Sale of optical disc drives 100.00 100.00 -
Philips & Lite-On Digital Solutions
Corporation
PLDS Germany GmbH Development and sale of modules of
automotive recorders
100.00 100.00 -
Philips & Lite-On Digital Solutions USA, Inc. Sale of optical disc drives 100.00 100.00 -
Philips & Lite-On Digital Solutions Korea Ltd. Sale of optical disc drives 100.00 100.00 -
PLDS Netherlands B.V. Sale and design of optical disc drives 100.00 100.00 -
Philips & Lite-On Digital Solutions
(Shanghai) Co., Ltd. Sale of optical disc drives 100.00 100.00 -
Silitech Technology Corporation Silitech (BVI) Holding Ltd. Investment activities 100.00 100.00 -
Lite-On Japan Ltd. Sale of LED optical products and power
supplies
7.87 7.87 -
Silitech (BVI) Holding Ltd. Silitech (Bermuda) Holding Ltd. Investment activities 100.00 100.00 -
Silitech (Bermuda) Holding Ltd. Silitech Technology Corporation Limited Manufacture of plastic and computer
peripheral products 100.00 100.00 -
Silitech Technology Corp. Sdn. Bhd. Manufacture of computer peripheral products 100.00 100.00 -
Silitech (Hong Kong) Holding Ltd. Investment activities 100.00 100.00 -
Silitech International (India) Private Limited Development, manufacture and sale of
automotive parts - 100.00 8)
Silitech (Hong Kong) Holding Ltd. Silitech Electronic (SuZhou) Co., Ltd. Manufacture and sale of automotive parts 100.00 100.00 -
Silitech Technology Corporation
Limited
Xurong Electronic (Shenzhen) Ltd. Manufacture of automotive parts, touch
panels and plastic and rubber assembly
100.00 100.00 -
XURONG Tooling Manufacturing (Suzhou)
Co., Ltd.
Development, manufacture and sale of
precision modules and new-type electronic
components (chip components, testing
elements, hybrid integrated circuits)
- 60.00 9)
Lite-On Automotive International
(Cayman) Co., Ltd
LITE-ON AUTOMOTIVE HOLDINGS
(HONG KONG) CO., LIMITED
Investment activities 100.00 100.00 -
LITE-ON AUTOMOTIVE
HOLDINGS (HONG KONG)
LITE-ON AUTOMOTIVE (WUXI) CO., LTD Manufacture, sale and processing of
electronic products
100.00 100.00 -
CO., LIMITED
Lite-On (Guangzhou) Automotive Electronics
Limited Manufacture, sale and processing of
electronic products 100.00 100.00 -
Lite-On Japan Ltd. L&K Industries Philippines, Inc. Import and export business of electronic
components 100.00 100.00 -
Lite-On Japan (H.K.) Limited Import and export business of electronic
components 100.00 100.00 -
Lite-On Japan (Korea) Co., Ltd. Import and export business of electronic
components 100.00 100.00 -
LITE-ON JAPAN (Thailand) CO., LTD. Import and export business of electronic
components 100.00 100.00 -
Lite-On Japan (H.K.) Limited NL (SHANGHAI) CO., LTD. Import and export business of electronic
components 100.00 100.00 -
Lite-On Mobile Oyj Lite-On Mobile Sweden AB Manufacture and sale of mobile phone
modules and design for assembly line 100.00 100.00 -
LITE-ON MOBILE INDÚ STRIA E
COMÉRCIO DE PLÁ STICOS LTDA. Manufacture and sale of mobile phone
modules and design for assembly line 2.97 2.97 -
LITE-ON MOBILE INDIA PRIVATE
LIMITED Manufacture and sale of mobile phone
modules and design for assembly line 11.59 11.59 -
LITE-ON MOBILE PTE. LTD. GUANGZHOU LITE-ON MOBILE
ELECTRONIC COMPONENTS CO., LTD. Manufacture and sale of mobile phone
modules and design for assembly line - 100.00 4)
GUANGZHOU LITE-ON MOBILE
ENGINEERING PLASTICS CO., LTD. Manufacture and sale of mobile phone
modules and design for assembly line 100.00 100.00 -
BEIJING LITE-ON MOBILE ELECTRONIC
AND TELECOMMUNICATION
COMPONENTS CO., LTD.
Manufacture and sale of mobile phone
modules and design for assembly line 100.00 100.00 -
Shenzhen Lite-On Mobile Precision Molds
Co., Ltd.
Manufacture and sale of mobile phone
modules and design for assembly line
- 100.00 4)
LITE-ON MOBILE INDÚ STRIA E
COMÉRCIO DE PLÁ STICOS LTDA.
Manufacture and sale of mobile phone
modules and design for assembly line
97.03 97.03 -
LITE-ON MOBILE INDIA PRIVATE
LIMITED
Manufacture and sale of mobile phone
modules and design for assembly line
88.41 88.41 -
LITE-ON YOUNG FAST PTE. LTD. Investment activities 100.00 100.00 -
LITE-ON YOUNG FAST PTE. LTD. LITE-ON YOUNG FAST (HUIZHOU) CO.,
LTD. Modules of touch panels - 100.00 10)
KBW-LEOTEK Jordan Private
Shareholding Limited
LEOTEK, PSC (formerly: KBW-LEOTEK
FACTORY Jordan Private Shareholding
Limited)
Production and manufacture of energy-saving
lights 60.00 - 2)
(Concluded)

- 48 -
Remark:
1) Sold in July 2018.
2) Became a subsidiary in May 2018.
3) Dissolved upon reorganization with LITE-ON NETWORK COMMUNICATION (DONGGUAN)
LIMITED in December 2018.
4) Sold in October 2018.
5) Established in January 2018.
6) The investee was initially held by Lite-On Green Technologies (HK) Limited. Upon reorganization
in November 2018, the ownership interests were transferred to LITE-ON TECHNOLOGY
(JIANGSU) CO., LTD.
7) The investee was initially held by Guangzhou Lite-On Mobile Electronic Components Co., Ltd.
Upon reorganization in July 2018, the ownership interests were transferred to Lite-On Electronics
(Guangzhou) Limited.
8) Liquidated in October 2018.
9) Liquidated in May 2018.
10) Liquidated in November 2018.
b. Subsidiaries excluded from consolidated financial statements: None.
c. Details of subsidiaries that have material non-controlling interests
Proportion of Ownership and
Voting Rights Held by
Non-controlling Interests
December 31
Name of Subsidiary 2018 2017
Silitech Technology Corp. 65.49% 65.49%
See Table 8 and Table 9 for the information on main operating activities, place of incorporation and
principal place of business.
Profit (Loss) Allocated to
Non-controlling Interests Accumulated Non-controlling
For the Year Ended Interests
December 31 December 31
Name of Subsidiary 2018 2017 2018 2017
Silitech Technology Corp. $ (22,145) $ (53,798) $ 2,464,676 $ 2,491,005
Others 32,391 55,595 889,969 764,946
$ 10,246 $ 1,797 $ 3,354,645 $ 3,255,951
The summarized financial information below represents amounts before intragroup eliminations.

- 49 -
Silitech Technology Corp. and Silitech Technology Corp.’s subsidiaries:
December 31
2018 2017
Current assets $ 3,972,433 $ 4,049,950
Non-current assets 771,549 815,100
Current liabilities (881,038) (945,650)
Non-current liabilities (99,356) (116,205)
Equity $ 3,763,588 $ 3,803,195
Equity attributable to:
Parent Company $ 1,298,912 $ 1,312,190
Non-controlling interests of Silitech Technology Corp. 2,464,676 2,489,872
Non-controlling interests of Silitech Technology Corp.’s
subsidiaries - 1,133
$ 3,763,588 $ 3,803,195
For the Year Ended December 31
2018 2017
Revenue $ 2,251,044 $ 2,285,054
Net loss for the year $ (33,816) $ (82,105)
Other comprehensive loss for the year (4,603) (56,610)
Total comprehensive loss for the year $ (38,419) $ (138,715)
Net loss attributable to:
Parent Company $ (11,671) $ (28,307)
Non-controlling interests of Silitech Technology Corp. (22,145) (53,711)
Non-controlling interests of Silitech Technology Corp.’s
subsidiaries - (87)
$ (33,816) $ (82,105)
Total comprehensive loss attributable to:
Parent Company $ (13,278) $ (47,836)
Non-controlling interests of Silitech Technology Corp. (25,196) (90,769)
Non-controlling interests of Silitech Technology Corp.’s
subsidiaries 55 (110)
$ (38,419) $ (138,715)
Net cash flow from:
Operating activities $ (299,005) $ (154,568)
Investing activities 1,248,814 (51,424)
Financing activities (1,238) (1,440,002)
Foreign exchange translation (406) (46,278)
Net cash inflow (outflow) $ 948,165 $ (1,692,272)

- 50 -
16. NON-CURRENT ASSETS HELD FOR SALE
December 31
2018 2017
Investment properties held for sale $ - $ 399,594
Property, plant and equipment held for sale - 385,601
Land use right held for sale - 29,948
$ - $ 815,143
Silitech Technology Corporation, a subsidiary, signed a contract with Suzhou Xu Die industrial Co., Ltd. to
sell the majority of right-to-use of land, property, plant and equipment and investment properties in Suzhou
for CNY 235,000 thousand on July 19, 2018. The transaction was completed as of December 2018. Silitech
Technology Corporation has recognized gain on disposal of $153,905 thousand.
No impairment loss was recognized when the Group classified property, plant and equipment and
investment properties into non-current assets held for sale since the fair values of the assets were higher
than their carrying values.
17. INVESTMENTS ACCOUNTED FOR USING THE EQUITY METHOD
Investments in Associates
December 31
2018 2017
Associates that are not individually material $ 4,972,609 $ 3,681,951
Aggregate Information of Associates That Are Not Individually Material
For the Year Ended December 31
2018 2017
The Group’s share of:
Profit for the year $ 178,863 $ 170,309
Other comprehensive loss (50,035) (74,089)
Total comprehensive income (loss) for the year $ 128,828 $ 96,220
In January 2018, the Group partially disposed of its interest in Logah Technology Corp.; thus, it ceased to
have significant influence. The Group retained the remaining interest as financial assets at FVTOCI whose
fair value at the date of disposal. This transaction resulted in the recognition of a gain in profit or loss,
calculated as follows:
Amount
Proceeds of disposal $ 4,560
Add: Fair value of retained investment 187,834
Less: Carrying amount of investment on the date of loss of significant influence (93,003)
Carrying amount of disposed of investment (2,238)
Share of other comprehensive income of the associate (4,078)
Gain recognized (under non-operating income and expenses - disposal of net
investments) $ 93,075

- 51 -
In July 2017, the Group recognized an impairment loss of $15,567 thousand to investments accounted for
using the equity method, due to the bankruptcy of the associates. The loss was recorded under the
impairment loss on the consolidated statements of comprehensive income.
18. PROPERTY, PLANT AND EQUIPMENT, NET
Freehold Land Buildings
Machinery
Equipment
Tooling
Equipment
Transportation
Equipment
Office
Equipment
Equipment Held
under Finance
Leases
Other
Equipment Total
Cost
January 1, 2018 $ 2,326,301 $ 18,044,924 $ 39,084,953 $ 2,302,461 $ 60,819 $ 2,148,655 $ 827,968 $ 6,260,200 $ 71,056,291
Additions 619 160,355 3,148,660 137,864 2,161 159,536 21,760 2,497,307 6,128,262
Disposals - (18,461 ) (15,355,823 ) (69,529 ) (6,495 ) (195,534 ) (233,230 ) (966,245 ) (16,845,317 )
Reclassification - 231,250 839,888 (235,715 ) (6 ) 24,717 (607,894 ) (492,180 ) (239,940 )
Effect of foreign currency
exchange differences 1,056 (262,960 ) (297,758 ) (26,275 ) (404 ) (11,131 ) (8,614 ) (54,877 ) (660,963 )
December 31, 2018 $ 2,327,976 $ 18,155,108 $ 27,419,920 $ 2,108,806 $ 56,075 $ 2,126,243 $ - $ 7,244,205 $ 59,438,333
Accumulated depreciation
January 1, 2018 $ - $ 8,835,336 $ 28,402,680 $ 2,138,079 $ 55,513 $ 1,788,779 $ 607,728 $ 4,205,896 $ 46,034,011
Additions - 664,151 3,316,541 136,406 2,865 190,923 30,951 328,550 4,670,387
Disposals - (9,277 ) (10,238,666 ) (71,316 ) (6,145 ) (168,084 ) (232,102 ) (756,855 ) (11,482,445 )
Reclassification - (55,435 ) (26,170 ) (248,757 ) (4 ) (4 ) (398,538 ) 153,256 (575,652 )
Effect of foreign currency
exchange differences - (127,144 ) (237,991 ) (24,797 ) (302 ) (11,390 ) (8,039 ) (33,979 ) (443,642 )
December 31, 2018 $ - $ 9,307,631 $ 21,216,394 $ 1,929,615 $ 51,927 $ 1,800,224 $ - $ 3,896,868 $ 38,202,659
Accumulated impairment
January 1, 2018 $ - $ 278,488 $ 2,122,836 $ 19,657 $ - $ 2,711 $ 38,067 $ 70,110 $ 2,531,869
Additions - 51,963 86,219 - 155 2,476 18,380 2,145 161,338
Disposals - - (1,897,807 ) - - (167 ) - (9 ) (1,897,983 ) Reclassification - - - - - - (55,426 ) 55,426 -
Effect of foreign currency
exchange differences - (12,857 ) (20,817 ) (211 ) (2 ) (50 ) (1,021 ) (9,584 ) (44,542 )
December 31, 2018 $ - $ 317,594 $ 290,431 $ 19,446 $ 153 $ 4,970 $ - $ 118,088 $ 750,682
December 31, 2018, net $ 2,327,976 $ 8,529,883 $ 5,913,095 $ 159,745 $ 3,995 $ 321,049 $ - $ 3,229,249 $ 20,484,992
Cost
January 1, 2017 $ 2,324,761 $ 18,915,082 $ 39,797,206 $ 2,707,256 $ 63,509 $ 2,163,576 $ 786,526 $ 7,513,576 $ 74,271,492
Additions - 163,256 2,780,511 91,490 2,495 238,765 44,669 1,284,127 4,605,313
Disposals (691 ) (204,668 ) (3,293,484 ) (489,298 ) (3,771 ) (206,009 ) (2,290 ) (174,260 ) (4,374,471 )
Reclassification 4,110 (588,732 ) 246,276 12,685 (190 ) (18,398 ) - (2,268,914 ) (2,613,163 )
Effect of foreign currency
exchange differences (1,879 ) (240,014 ) (445,556 ) (19,672 ) (1,224 ) (29,279 ) (927 ) (94,329 ) (832,880 )
December 31, 2017 $ 2,326,301 $ 18,044,924 $ 39,084,953 $ 2,302,461 $ 60,819 $ 2,148,655 $ 827,978 $ 6,260,200 $ 71,056,291
Accumulated depreciation
January 1, 2017 $ - $ 8,718,781 $ 27,497,682 $ 2,514,537 $ 54,910 $ 1,830,294 $ 580,760 $ 4,046,477 $ 45,243,441
Additions - 710,822 4,153,408 150,329 5,230 198,489 26,264 409,081 5,653,623
Disposals - (157,058 ) (2,798,733 ) (495,655 ) (3,331 ) (201,434 ) (2,290 ) (165,368 ) (3,823,869 )
Reclassification - (336,205 ) (181,936 ) (12,645 ) (288 ) (14,534 ) - (50,362 ) (595,970 )
Effect of foreign currency
exchange differences - (101,004 ) (267,741 ) (18,487 ) (1,008 ) (24,036 ) 2,994 (33,932 ) (443,214 )
December 31, 2017 $ - $ 8,835,336 $ 28,402,680 $ 2,138,079 $ 55,513 $ 1,788,779 $ 607,728 $ 4,205,896 $ 46,034,011
Accumulated impairment
January 1, 2017 $ - $ 254,172 $ 734,237 $ 13,624 $ 453 $ 7,055 $ 38,787 $ 153,509 $ 1,201,837
Additions - 30,904 1,828,468 974 - 315 - 1,357 1,862,018
Disposals - (2,766 ) (339,233 ) (38 ) (215 ) (1,357 ) - (26,181 ) (369,790 )
Effect of foreign currency
exchange differences - (3,822 ) (100,636 ) 5,097 (238 ) (3,302 ) (720 ) (58,575 ) (162,196 )
December 31, 2017 $ - $ 278,488 $ 2,122,836 $ 19,657 $ - $ 2,711 $ 38,067 $ 70,110 $ 2,531,869
December 31, 2017, net $ 2,326,301 $ 8,931,100 $ 8,559,437 $ 144,725 $ 5,306 $ 357,165 $ 182,183 $ 1,984,194 $ 22,490,411
Due to the decline in sales of some of the Group’s products in the markets, the expected future cash flows
generated by some equipments used in the production decreased. Therefore, the recoverable amount was
lower than the carrying amount. Consequently, the Group recognized impairment loss of $161,338
thousand and $1,862,018 thousand for the years ended December 31, 2018 and 2017, respectively. The
impairment losses were recognized in the statement of comprehensive income. The Group determined the
recoverable amount of the related equipment on the basis of their fair value less costs of disposal. The fair
value of the recoverable amount was categorized as a Level 1 measurement.

- 52 -
The above items of property, plant and equipment were depreciated on a straight-line basis at the following
rates per annum:
Buildings 3-60 years
Machinery equipment 2-10 years
Tooling equipment 2-20 years
Transportation equipment 3-10 years
Office equipment 2-20 years
Equipment held under finance leases 2-10 years
Other equipment 2-20 years
19. INVESTMENT PROPERTIES, NET
Completed
Investment
Properties
Cost
Balance at January 1, 2018 $ 1,460,944
Additions 7,051
Transferred to property, plant and equipment (204,424)
Net exchange differences (23,636)
Balance at December 31, 2018 $ 1,239,935
Accumulated depreciation
Balance at January 1, 2018 $ 34,810
Depreciation expense 27,865
Net exchange differences (1,133)
Balance at December 31, 2018 $ 61,542
Balance at December 31, 2018, net $ 1,178,393
Cost
Balance at January 1, 2017 $ 669,502
Transferred from property, plant and equipment 1,460,944
Transferred to non-current assets held for sale (657,093)
Net exchange differences (12,409)
Balance at December 31, 2017 $ 1,460,944
Accumulated depreciation
Balance at January 1, 2017 $ 239,712
Depreciation expense 21,978
Transferred from property, plant and equipment 34,810
Transferred to non-current assets held for sale (257,499)
Net exchange differences (4,191)
Balance at December 31, 2017 $ 34,810
Balance at December 31, 2017, net $ 1,426,134

- 53 -
The investment properties held by the Group are depreciated using the straight-line method over their
estimated useful lives of 20 to 50 years.
The Group’s management was unable to reliably measure the fair value of its investment property located
in Shanghai because the market for comparable properties is inactive and alternative reliable measurements
of fair value were not available; therefore, the Group determined that the fair value of the investment
property cannot be reliably measurable.
The Group has freehold interests in all of its investment properties.
20. INTANGIBLE ASSETS, NET
Goodwill Patents
Patents Use
Rights
Client
Relationships Software
Other
Intangible
Assets Total
Cost
January 1, 2018 $ 15,413,191 $ 51,244 $ 2,695,878 $ 163,819 $ 1,057,879 $ 1,677,191 $ 21,059,202
Additions - 111 - - 160,061 6,150 166,322
Disposals (368,462 ) - - - (74,643 ) (172,549 ) (615,654 )
Reclassification - - - - 21,648 - 21,648
Effect of foreign currency
exchange differences 8,343 9 - - 542 (984 ) 7,910
December 31, 2018 $ 15,053,072 $ 51,364 $ 2,695,878 $ 163,819 $ 1,165,487 $ 1,509,808 $ 20,639,428
Accumulated amortization
January 1, 2018 $ 77,234 $ 48,792 $ 2,583,550 $ 163,819 $ 761,406 $ 1,635,740 $ 5,270,541
Additions - 1,432 112,328 - 185,034 7,706 306,500
Disposals - - - - (58,348 ) (138,817 ) (197,165 )
Reclassification - - - - - - -
Effect of foreign currency
exchange differences - - - - 962 (781 ) 181
December 31, 2018 $ 77,234 $ 50,224 $ 2,695,878 $ 163,819 $ 889,054 $ 1,503,848 $ 5,380,057
Accumulated impairment
January 1, 2018 $ 5,959,943 $ - $ - $ - $ 60 $ - $ 5,960,003
Additions 3,385,324 - - - - - 3,385,324
Deductions - - - - (40 ) - (40)
December 31, 2018 $ 9,345,267 $ - $ - $ - $ 20 $ - $ 9,345,287
December 31, 2018, net $ 5,630,571 $ 1,140 $ - $ $ 276,413 $ 5,960 $ 5,914,084
Cost
January 1, 2017 $ 15,416,303 $ 38,570 $ 2,695,878 $ 163,819 $ 833,595 $ 1,888,423 $ 21,036,588
Additions - 1,150 - - 225,403 2,101 228,654
Disposals - - - - (7,248 ) (212,607 ) (219,855 )
Reclassification - 11,535 - - 8,077 (265 ) 19,347
Effect of foreign currency
exchange differences (3,112 ) (11 ) - - (1,948 ) (461 ) (5,532 )
December 31, 2017 $ 15,413,191 $ 51,244 $ 2,695,878 $ 163,819 $ 1,057,879 $ 1,677,191 $ 21,059,202
Accumulated amortization
January 1, 2017 $ 77,234 $ 34,161 $ 2,358,895 $ 163,819 $ 587,078 $ 1,816,431 $ 5,037,618
Additions - 3,096 224,655 - 179,486 14,149 421,386
Disposals - - - - (7,248 ) (194,919 ) (202,167 )
Reclassification - 11,535 - - 3,773 (262 ) 15,046
Effect of foreign currency
exchange differences - - - - (1,683 ) 341 (1,342 )
December 31, 2017 $ 77,234 $ 48,792 $ 2,583,550 $ 163,819 $ 761,406 $ 1,635,740 $ 5,270,541
Accumulated impairment
January 1, 2017 $ 789,743 $ - $ - $ - $ (507 ) $ - $ 789,236
Additions 5,170,200 - - - 6 - 5,170,206
Reclassification - - - - 561 - 561
December 31, 2017 $ 5,959,943 $ - $ - $ - $ 60 $ - $ 5,960,003
December 31, 2017, net $ 9,376,014 $ 2,452 $ 112,328 $ - $ 296,413 $ 41,451 $ 9,828,658

- 54 -
a. The above items of other intangible assets were amortized on a straight-line basis at the following rates
per annum:
Patents 6 years
Patents use rights 12 years
Client relationships 4 years
Software 1-14 years
Other intangible assets 1-10 years
b. The amounts of cash-generating unit used in amortizing the Group’s goodwill are listed as follows:
December 31
2018 2017
Parent Company $ 5,248,746 $ 5,617,208
POWER INNOVATIONS INTERNATIONAL, INC. 342,940 332,261
LITE-ON MOBILE PTE. LTD. - 3,387,661
Others 38,884 38,884
$ 5,630,570 $ 9,376,014
1) The Group has sold the major operations and assets of its portable mobile phones image business
group during the six months ended June 30, 2018. As a result, the Group shall exclude the goodwill
of that business group of $368,462 thousand as a reduction of operating concession and premium
earnings. (Refer to Note 36.)
2) The Group tested the goodwill of a cash-generating unit, LITE-ON MOBILE PTE. LTD, for
impairment. Upon evaluation, the recoverable amount of the cash-generating unit was less than its
carrying amount. Thus, for the nine months ended September 30, 2018 and 2017, the Group
recognized impairment losses of $3,385,324 and $5,170,200 thousand in the consolidated statement
of comprehensive income, respectively.
3) Goodwill is allocated to the Group’s recoverable amount of cash-generating units. The recoverable
amount of all cash-generating units has been determined based on value-in-use calculations. These
calculations use pre-tax cash flow projections based on financial budgets approved by the
management covering the future four to five-year period. The discount rate used in the value-in-use
calculation was 9.90% to 11.36%. Pre-tax cash flow projections after the four to five-year period
are expected to have zero growth thereon.
4) Management determined gross margin based on past performance and future profits. The growth
rate used is consistent with the forecasts included in industry reports. The discount rates used are
pre-tax and reflect specific risks relating to the relevant cash-generating units.

- 55 -
21. OTHER ASSETS
December 31
2018 2017
Prepayments $ 1,800,430 $ 2,402,109
Prepayments for leases 839,816 752,148
Offset against tax payable 624,290 731,553
Prepayments for equipment 17,631 36,708
Others 228,799 257,409
$ 3,510,966 $ 4,179,927
Current $ 2,638,275 $ 3,372,102
Non-current 872,691 807,825
$ 3,510,966 $ 4,179,927
Prepayments for leases with carrying amounts of $526,949 thousand and $556,646 thousand as of
December 31, 2018 and 2017, respectively, referred to land use rights located in mainland China. The
carrying amount of $186,875 thousand and $73,901 thousand as of December 31, 2018 and 2017 referred to
land use rights located in Vietnam, correspondingly.
22. BORROWINGS
a. Short-term borrowings
December 31
2018 2017
Unsecured borrowings
Line of credit borrowings $ 30,087,282 $ 30,155,790
Market interest rates for short-term borrowings were as follows:
December 31
2018 2017
Short-term borrowings 2.48%-8.3% 1.69%-2.38%
b. Long-term borrowings
December 31
2018 2017
Unsecured borrowings
Lite-On Japan Ltd. $ - $ 15,161
Current portion - (15,161)
- -
(Continued)

- 56 -
December 31
2018 2017
Secured borrowings
POWER INNOVATIONS INTERNATIONAL, INC. $ 184 $ 1,221
Current portion (184) (1,043)
- 178
$ - $ 178
(Concluded)
1) As of December 31, 2017, Lite-On Japan Ltd., a subsidiary of the Parent Company, had 2 long-term
bank loans, with contract terms from June 2013 to October 2018, with interest rates of 1.1% and
principals repayable in trimestral installments.
2) As of December 31, 2018 and 2017, POWER INNOVATIONS INTERNATIONAL, INC., a
subsidiary of the Parent Company, had a long-term secured borrowing as a collateral loan for
machinery and equipment, with contract terms from March 28, 2013 to February 28, 2019, and an
interest rate of 4.4%.
23. FINANCE LEASE PAYABLES
December 31
2018 2017
Minimum lease payments
Not later than one year $ 1,473 $ 1,722
Later than one year and not later than five years 354 1,804
1,827 3,526
Future finance charges (7) (162)
$ 1,820 $ 3,364
Present value of minimum lease payments
Not later than one year $ 1,469 $ 1,600
Later than one year and not later than five years 351 1,764
$ 1,820 $ 3,364
Current $ 1,469 $ 1,600
Non-current 351 1,764
$ 1,820 $ 3,364
POWER INNOVATIONS INTERNATIONAL, INC. $ 1,820 $ 3,364
Current portion of long-term capital lease liabilities (1,469) (1,600)
$ 351 $ 1,764

- 57 -
POWER INNOVATIONS INTERNATIONAL, INC. leased machinery and equipment under finance leases
valid from March 28, 2013 to March 31, 2020. The terms of these leases were between five and seven
years, with 3.49% to 4.75% interest rate. The machinery and equipment can be bought at bargain purchase
prices at the end of the lease terms.
24. PROVISIONS
December 31
2018 2017
Current
Warranties $ 1,011,238 $ 866,119
Balance at January 1 $ 866,119 $ 1,032,113
Recognition of provisions 429,650 149,804
Usage (285,733) (311,752)
Effect of foreign currency exchange differences 1,202 (4,046)
Balance at December 31 $ 1,011,238 $ 866,119
Based on the local legislation for the sale of goods, provision for warranty claims is the present value of
management’s best estimate of the future outflow of economic benefits that will be required under the
Parent Company’s obligations for warranties. The estimate has been made on the basis of historical
warranty trends and may vary as a result of the entry of new materials, altered manufacturing processes or
other events affecting product quality.
25. RETIREMENT BENEFIT PLANS
a. Defined contribution plans
The Parent Company and subsidiaries - Philips & Lite-On Digital Solutions Corp., Silitech Technology
Corp., Lite-On Integrated Services Inc. and SKYLA CORPORATION of the Group adopted a pension
plan under the Labor Pension Act (the “LPA”), which is a state-managed defined contribution plan.
Under the LPA, an entity makes monthly contributions to employees’ individual pension accounts at
6% of monthly salaries and wages starting from July 1, 2015. Some consolidated entities, which are
mainly in investments, have either very few or even no staff. These companies have no pension plans
and thus do not contribute to pension funds and do not recognize pension costs. Except for these
companies, the remaining companies all contribute to pension funds and recognize pension costs based
on local government regulations.
b. Defined benefit plans
The Parent Company and subsidiaries - Philips & Lite-On Digital Solutions Corp., Silitech Technology
Corp. and SKYLA CORPORATION of the Group adopted the defined benefit plan under the Labor
Standards Law, under which pension benefits are calculated on the basis of the length of service and
average monthly salaries of the six months before retirement. The Parent Company and its subsidiaries -
Philips & Lite-On Digital Solutions Corp. and Silitech Technology Corp. of the Group contribute
amounts equal to 2% to 6% of total monthly salaries and wages to a pension fund administered by the
pension fund monitoring committee. Pension contributions are deposited in the Bank of Taiwan in the
committee’s name. Before the end of each year, the Parent Company and its subsidiaries assess the
balance in the pension fund. If the amount of the balance in the pension fund is inadequate to pay
retirement benefits for employees who conform to retirement requirements in the next year, the Parent
Company and its subsidiaries are required to fund the difference in one appropriation that should be
made before the end of March of the next year. The pension fund is managed by the Bureau of Labor

- 58 -
Funds, Ministry of Labor (“the Bureau”); the Parent Company and its subsidiaries have no right to
influence the investment policy and strategy.
The amounts included in the balance sheets in respect of the Group’s defined benefit plans were as
follows:
December 31
2018 2017
Present value of defined benefit obligation $ 1,230,896 $ 1,271,333
Fair value of plan assets (1,069,899) (1,047,308)
Net defined benefit liabilities $ 160,997 $ 224,025
Movements in net defined benefit liabilities were as follows:
Present Value
of the Defined
Benefit
Obligation
Fair Value of
the Plan Assets
Net Defined
Benefit
Liabilities
Balance at January 1, 2017 $ 1,267,158 $ (1,078,054) $ 189,104
Current service cost 8,237 - 8,237
Net interest expense (income) 16,248 (13,356) 2,892
Recognized in profit or loss 24,485 (13,356) 11,129
Remeasurement
Return on plan assets - 2,972 2,972
Actuarial loss - changes in demographic
assumptions 3,906 - 3,906
Actuarial loss - changes in financial
assumptions 29,757 - 29,757
Actuarial loss - experience adjustments 7,274 - 7,274
Recognized in other comprehensive loss 40,937 2,972 43,909
Contributions from the employer - (20,512) (20,512)
Benefits paid (61,642) 61,642 -
Exchange differences on foreign plans 395 - 395
Balance at December 31, 2017 $ 1,271,333 $ (1,047,308) $ 224,025
Balance at January 1, 2018 $ 1,271,333 $ (1,047,308) $ 224,025
Current service cost 7,371 - 7,371
Net interest expense (income) 13,382 (10,389) 2,993
Recognized in profit or loss 20,753 (10,389) 10,364
Remeasurement
Return on plan assets - (32,269) (32,269)
Actuarial loss - changes in demographic
assumptions 2,655 - 2,655
Actuarial loss - changes in financial
assumptions 5,999 - 5,999
Actuarial loss - experience adjustments 20,574 - 20,574
Recognized in other comprehensive (gain)
loss 29,228 (32,269) (3,041)
(Continued)

- 59 -
Present Value
of the Defined
Benefit
Obligation
Fair Value of
the Plan Assets
Net Defined
Benefit
Liabilities
Contributions from the employer $ - $ (38,211) $ (38,211)
Benefits paid (58,278) 58,278 -
Disposal of business (32,240) - (32,240)
Exchange differences on foreign plans 100 - 100
Balance at December 31, 2018 $ 1,230,896 $ (1,069,899) $ 160,997
(Concluded)
Through the defined benefit plans under the Labor Standards Law, the Group is exposed to the
following risks:
1) Investment risk: The plan assets are invested in domestic and foreign equity and debt securities,
bank deposits, etc. The investment is conducted at the discretion of the Bureau or under the
mandated management. However, in accordance with relevant regulations, the return generated by
plan assets should not be below the interest rate for a 2-year time deposit with local banks.
2) Interest risk: A decrease in the government bond interest rate will increase the present value of the
defined benefit obligation; however, this will be partially offset by an increase in the return on the
plan’s debt investments.
3) Salary risk: The present value of the defined benefit obligation is calculated by reference to the
future salaries of plan participants. As such, an increase in the salary of the plan participants will
increase the present value of the defined benefit obligation.
The actuarial valuations of the present value of the defined benefit obligation were carried out by
qualified actuaries. The significant assumptions used for the purposes of the actuarial valuations were as
follows:
December 31
2018 2017
Discount rate(s) 0.95%-4.375% 1.00%-4.375%
Expected rate(s) of salary increase 3.00%-4.75% 3.00%-4.75%
Expected return on plan assets 0.95%-4.375% 1.00%-4.375%
If possible reasonable change in each of the significant actuarial assumptions will occur and all other
assumptions will remain constant, the present value of the defined benefit obligation would increase
(decrease) as follows:
December 31
2018 2017
Discount rate(s)
0.25% increase $ (27,081) $ (29,864)
0.25% decrease $ 28,007 $ 30,927
Expected rate(s) of salary increase
0.25% increase $ 26,800 $ 29,657
0.25% decrease $ (26,067) $ (28,809)

- 60 -
The sensitivity analysis presented above may not be representative of the actual change in the present
value of the defined benefit obligation as it is unlikely that the change in assumptions would occur in
isolation of one another as some of the assumptions may be correlated.
December 31
2018 2017
The expected contributions to the plan for the next year $ 19,624 $ 20,347
The average duration of the defined benefit obligation 8.83-14.78 years 10.10-15.75 years
26. EQUITY
a. Share capital
1) Ordinary shares
December 31
2018 2017
Number of shares authorized (in thousands) 3,500,000 3,500,000
Amount of shares authorized $ 35,000,000 $ 35,000,000
Number of shares issued and fully paid (in thousands) 2,350,867 2,350,867
Amount of shares issued $ 23,508,670 $ 23,508,670
Fully paid ordinary shares, which have a par value of $10, carry one right to vote and carry a right
to dividends per share.
Of the Parent Company’s authorized shares, 100,000 thousand shares had been reserved for the
issuance of employee share options.
2) Issued global depositary receipts
On September 25, 1996, the Parent Company issued 4,900 thousand units of global depositary
receipts (GDRs) on the London Stock Exchange. These GDRs represented 49,000 thousand
ordinary shares of the Parent Company.
On April 3, 1995, GVC Corp. issued 5,000 thousand units of GDRs on the London Stock Exchange.
These GDRs represented 25,000 thousand ordinary shares of GVC Corp., which later issued more
shares. As of November 4, 2002, the outstanding GDRs were 7,627 thousand units, or 38,136
thousand ordinary shares of GVC Corp. For merger purposes, these GDRs were exchanged for the
Parent Company’s 1,478 thousand marketable equity securities, which represented the Parent
Company’s 14,781 thousand ordinary shares.
As of December 31, 2018 and 2017, the outstanding GDRs were both 5,221 thousand units,
representing 52,209 thousand ordinary shares of the Parent Company. The rights and obligation of
security holders are the same as those of ordinary shareholders, except for voting rights. As of
December 31, 2018 and 2017, the unredeemed GDRs amounted to 815 thousand units and 894
thousand units.

- 61 -
b. Capital surplus
The premium from shares issued in excess of par (including share premium from issuance of ordinary
shares, conversion of bonds, and mergers) may be used to offset a deficit. When the Group has no
deficit, the capital surplus may be distributed as cash dividends or transferred to capital. The transfer to
capital is restricted to a certain percentage of the Group’s capital surplus and limited to one-per-year.
The capital surplus arising from - changes of shares in equities of subsidiaries, changes in equities of
associates accounted for using the equity method and treasury share transactions resulting from
dividends that are derived from subsidiaries holding the Company’s shares - may only be used to offset
deficits.
c. Retained earnings and dividend policy
Under the dividend policy as set forth in the amended Articles, if there is net profit after tax upon the
final settlement of account of each fiscal year, the Group shall first to offset any previous accumulated
losses (including unappropriated earnings adjustment if any) and set aside a legal reserve at 10% of the
net profits, unless the accumulated legal reserve is equal to the total capital of the Group; then set aside
special reserve in accordance with relevant laws or regulations or as requested by the authorities in
charge. The remaining net profit, plus the beginning unappropriated earnings (including adjustment of
unappropriated earnings if any), shall be distributed into dividends to shareholders according to the
distribution plan proposed by the Board of Directors and submitted to the shareholders’ meeting for
approval. For the policies on distribution of employees’ compensation and remuneration of directors
before and after amendment, refer to Note 30 (b) on employee benefits expense.
The Parent Company’s dividend policy is designed to meet present and future development projects and
takes into consideration the investment environment, funding requirements, international or domestic
competitive conditions while simultaneously meeting shareholders’ interests. When there is no
cumulative loss, the Parent Company shall set aside share dividends at no less than 70% of the net
profit. The way to distribute dividends could be either through cash or shares, and cash dividends shall
not be less than 90% of the total dividends.
After the Parent Company considers financial, business, and operational factors, if there are no retained
earnings to be appropriated or if the earnings to be appropriated are significantly lower than the prior
year’s actual appropriation of the earnings, then part of or all of the Parent Company’s paid-in capital
can be appropriated according to the law or the competent authority.
Appropriation of earnings to legal reserve shall be made until the legal reserve equals the Parent
Company’s paid-in capital. Legal reserve may be used to offset deficit. If the Parent Company has no
deficit and the legal reserve has exceeded 25% of the Parent Company’s paid-in capital, the excess may
be transferred to capital or distributed in cash.
Under Rule No. 1010012865, Rule No. 1010047490 and Rule No. 1030006415 issued by the FSC and
the directive titled “Questions and Answers for Special Reserves Appropriated Following Adoption of
IFRSs”, the Parent Company should appropriate or reverse a special reserve. Any special reserve
appropriated may be reversed to the extent that the net debit balance reverses and thereafter distributed.
Except for non-ROC resident shareholders, all shareholders receiving the dividends are allowed a tax
credit equal to their proportionate share of the income tax paid by the Parent Company.
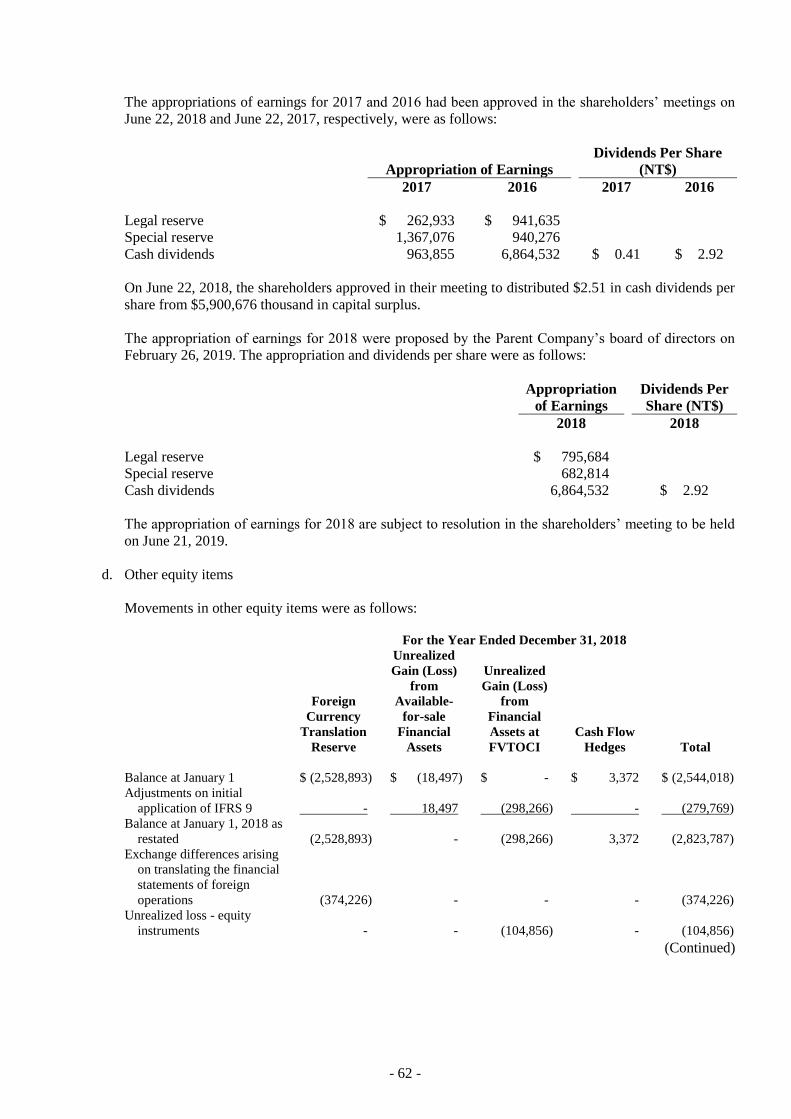
- 62 -
The appropriations of earnings for 2017 and 2016 had been approved in the shareholders’ meetings on
June 22, 2018 and June 22, 2017, respectively, were as follows:
Appropriation of Earnings
Dividends Per Share
(NT$)
2017 2016 2017 2016
Legal reserve $ 262,933 $ 941,635
Special reserve 1,367,076 940,276
Cash dividends 963,855 6,864,532 $ 0.41 $ 2.92
On June 22, 2018, the shareholders approved in their meeting to distributed $2.51 in cash dividends per
share from $5,900,676 thousand in capital surplus.
The appropriation of earnings for 2018 were proposed by the Parent Company’s board of directors on
February 26, 2019. The appropriation and dividends per share were as follows:
Appropriation
of Earnings
Dividends Per
Share (NT$)
2018 2018
Legal reserve $ 795,684
Special reserve 682,814
Cash dividends 6,864,532 $ 2.92
The appropriation of earnings for 2018 are subject to resolution in the shareholders’ meeting to be held
on June 21, 2019.
d. Other equity items
Movements in other equity items were as follows:
For the Year Ended December 31, 2018
Foreign
Currency
Translation
Reserve
Unrealized
Gain (Loss)
from
Available-
for-sale
Financial
Assets
Unrealized
Gain (Loss)
from
Financial
Assets at
FVTOCI
Cash Flow
Hedges Total
Balance at January 1 $ (2,528,893) $ (18,497) $ - $ 3,372 $ (2,544,018)
Adjustments on initial
application of IFRS 9 - 18,497 (298,266) - (279,769)
Balance at January 1, 2018 as
restated (2,528,893) - (298,266) 3,372 (2,823,787)
Exchange differences arising
on translating the financial
statements of foreign
operations (374,226) - - - (374,226)
Unrealized loss - equity
instruments - - (104,856) - (104,856)
(Continued)

- 63 -
For the Year Ended December 31, 2018
Foreign
Currency
Translation
Reserve
Unrealized
Gain (Loss)
from
Available-
for-sale
Financial
Assets
Unrealized
Gain (Loss)
from
Financial
Assets as at
FVTOCI
Cash Flow
Hedges Total
Share of other
comprehensive income
(loss) of associates $ (47,607) $ - $ (3,157) $ (658) $ (51,422)
Cumulative unrealized gain
of equity instruments at
FVTOCI transferred to
retained earnings due to
disposals - - (43,182) - (43,182)
Disposal of investment
accounted for using the
equity method 4,078 - - - 4,078
Income tax benefit 166,785 - - - 166,785
Balance at December 31 $ (2,779,863) $ - $ (449,461) $ 2,714 $ (3,226,610)
(Concluded)
For the Year Ended December 31, 2017
Foreign
Currency
Translation
Reserve
Unrealized
Gain (Loss)
from
Available-for-
sale Financial
Assets
Cash Flow
Hedges Total
Balance at January 1 $ (1,195,684) $ (126,588) $ - $ (1,322,272)
Exchange differences arising on
translating the financial
statements of foreign
operations (1,533,318) - - (1,533,318)
Gain arising on changes in the
fair value of
available-for-sale financial
assets - 149,089 - 149,089
Reclassification to income from
disposal of available-for-sale
financial assets - (49,598) - (49,598)
Share of other comprehensive
income (loss) of associates (76,141) 8,600 3,372 (64,169)
Gain reclassified to profit or
loss based on decreased
proportions on disposal of
associates (4,185) - - (4,185)
Income tax benefit 280,435 - - 280,435
Balance at December 31 $ (2,528,893) $ (18,497) $ 3,372 $ (2,544,018)
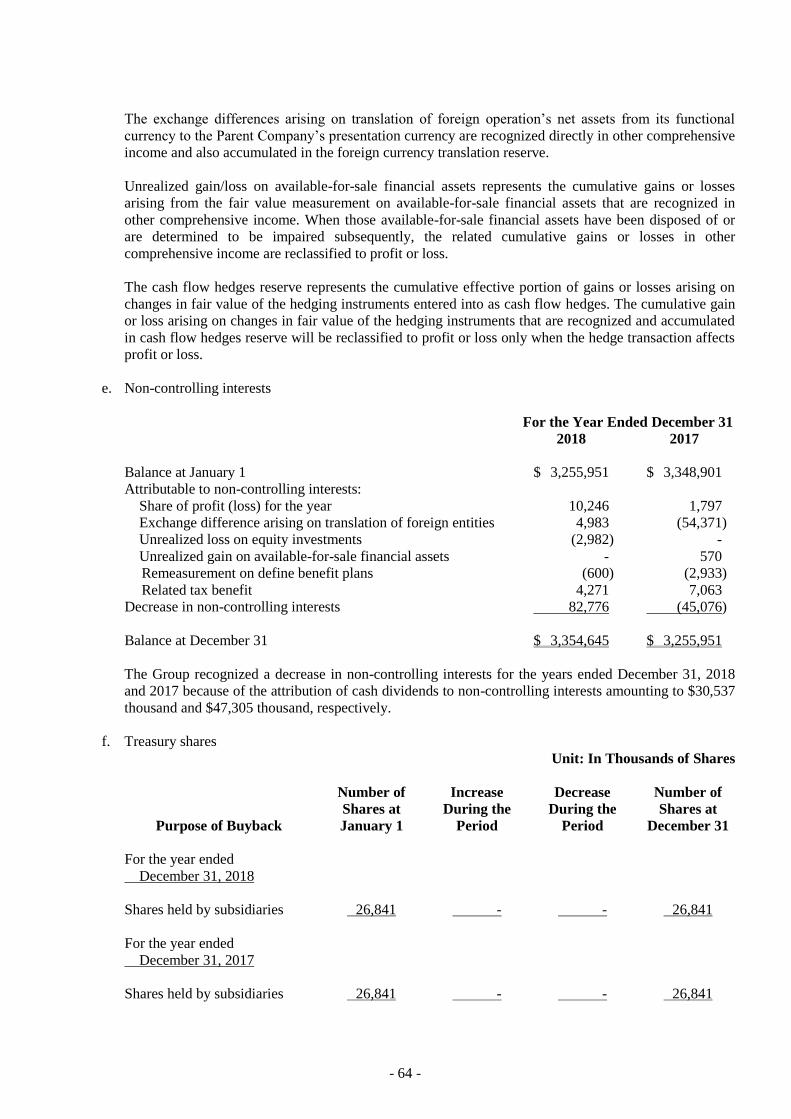
- 64 -
The exchange differences arising on translation of foreign operation’s net assets from its functional
currency to the Parent Company’s presentation currency are recognized directly in other comprehensive
income and also accumulated in the foreign currency translation reserve.
Unrealized gain/loss on available-for-sale financial assets represents the cumulative gains or losses
arising from the fair value measurement on available-for-sale financial assets that are recognized in
other comprehensive income. When those available-for-sale financial assets have been disposed of or
are determined to be impaired subsequently, the related cumulative gains or losses in other
comprehensive income are reclassified to profit or loss.
The cash flow hedges reserve represents the cumulative effective portion of gains or losses arising on
changes in fair value of the hedging instruments entered into as cash flow hedges. The cumulative gain
or loss arising on changes in fair value of the hedging instruments that are recognized and accumulated
in cash flow hedges reserve will be reclassified to profit or loss only when the hedge transaction affects
profit or loss.
e. Non-controlling interests
For the Year Ended December 31
2018 2017
Balance at January 1 $ 3,255,951 $ 3,348,901
Attributable to non-controlling interests:
Share of profit (loss) for the year 10,246 1,797
Exchange difference arising on translation of foreign entities 4,983 (54,371)
Unrealized loss on equity investments (2,982) -
Unrealized gain on available-for-sale financial assets - 570
Remeasurement on define benefit plans (600) (2,933)
Related tax benefit 4,271 7,063
Decrease in non-controlling interests 82,776 (45,076)
Balance at December 31 $ 3,354,645 $ 3,255,951
The Group recognized a decrease in non-controlling interests for the years ended December 31, 2018
and 2017 because of the attribution of cash dividends to non-controlling interests amounting to $30,537
thousand and $47,305 thousand, respectively.
f. Treasury shares
Unit: In Thousands of Shares
Purpose of Buyback
Number of
Shares at
January 1
Increase
During the
Period
Decrease
During the
Period
Number of
Shares at
December 31
For the year ended
December 31, 2018
Shares held by subsidiaries 26,841 - - 26,841
For the year ended
December 31, 2017
Shares held by subsidiaries 26,841 - - 26,841

- 65 -
The Parent Company’s shares held by its subsidiaries at the end of the reporting periods were as
follows:
Name of Subsidiary
Number of
Shares Held
(In Thousands)
Carrying
Amount Market Price
December 31, 2018
Lite-On Capital Corporation 15,116 $ 718,857 $ 613,704
LTC INTERNATIONAL LTD. 7,004 297,469 284,068
YET FOUNDATE LIMITED 2,271 126,881 91,989
LITE-ON ELECTRONICS COMPANY
LIMITED 2,450 105,515 99,253
$ 1,248,722 $ 1,089,014
December 31, 2017
Lite-On Capital Corporation 15,116 $ 718,857 $ 613,704
LTC INTERNATIONAL LTD. 7,004 297,469 284,157
YET FOUNDATE LIMITED 2,271 126,881 92,053
LITE-ON ELECTRONICS COMPANY
LIMITED 2,450 105,515 99,322
$ 1,248,722 $ 1,089,236
Under the Securities and Exchange Act, the Parent Company shall neither pledge treasury shares nor
exercise shareholders’ rights on these shares, such as rights to dividends and to vote. The subsidiaries
holding treasury shares, however, retain shareholders’ rights, except the rights to participate in any
share issuance for cash and to vote.
27. REVENUE
For the Year Ended December 31
2018 2017
Customer contract revenue
Revenue from the sale of goods $ 207,019,842 $ 214,444,557
Rental income from property 89,246 112,377
Solar power income - 7,388
$ 207,109,088 $ 214,564,322
Refer to Note 39 for segment revenue information.

- 66 -
28. INCOME TAX
a. Income tax recognized in profit or loss
Major components of tax expense recognized in profit or loss are as follows:
For the Year Ended December 31
2018 2017
Current income tax expense
In respect of the current year $ 3,164,455 $ 2,516,196
Adjustments for prior year (82,794) 127,289
3,081,661 2,643,485
Deferred income tax expense (benefit)
The origination and reversal of temporary differences (405,159) (1,903,022)
Effect of change in tax rate 140,535 -
(264,624) (1,903,022)
Income tax expense recognized in profit or loss $ 2,817,037 $ 740,463
In order to lower operating costs, during the third quarter of the year ended December 31, 2017, the
Group adjusted its policy approved by each overseas subsidiary’s board of directors whereby a part of
each of such subsidiary’s earnings shall be reinvested instead of remitted back. Therefore, any recorded
deferred tax liability for the year is reversed.
A reconciliation of income before income tax and income tax expense recognized in profit or loss is as
follows:
For the Year Ended December 31
2018 2017
Income before Income tax $ 10,784,121 $ 3,371,594
Income tax expense calculated at the statutory rate $ 2,814,656 $ 733,996
Deductible (nondeductible) items in determining taxable income 349,799 1,720,839
Additional income tax on unappropriated earnings - 61,361
The origination and reversal of temporary differences (264,624) (1,903,022)
Adjustments for prior year (82,794) 127,289
Income tax expense recognized in profit or loss $ 2,817,037 $ 740,463
In 2017, the applicable corporate income tax rate used by the group entities in the ROC is 17%.
However, the Income Tax Act in the ROC was amended in February 2018, and the corporate income
tax rate was adjusted from 17% to 20%, effective in 2018. In addition, the rate of the corporate surtax
applicable to the 2018 unappropriated earnings will be reduced from 10% to 5%. The applicable tax rate
used by subsidiaries in China is 25%. Tax rates used by other group entities operating in other
jurisdictions are based on the tax laws in those jurisdictions.
As the status of the 2018 appropriations of earnings to be resolved in the shareholder’s meeting is
uncertain, the potential income tax consequences of the 2017 unappropriated earnings, which are
subject to a 5% tax rate, cannot be reliably determinable.

- 67 -
b. Income tax benefit recognized in other comprehensive income
For the Year Ended December 31
2018 2017
Deferred income tax
Income tax recognized in other comprehensive income
Translation of foreign operations $ 171,143 $ 287,775
Remeasurement on defined benefit plans 4,441 9,552
Share of other comprehensive loss of associates (87) (277)
$ 175,497 $ 297,050
c. Deferred income tax
The movements of deferred tax assets were as follows:
Opening
Balance
Recognized in
Profit (Loss)
Recognized in
Other
Comprehensive
Income (Loss)
Exchange
Differences
Closing
Balance
For the year ended December 31, 2018
Temporary differences Investment accounted for using the equity
method $ 1,672,291 $ 201,710 $ 171,056 $ (1 ) $ 2,045,056
Impairment loss on assets 678,986 425,683 - (5 ) 1,104,664 Operating loss carryforward 432,628 11,095 - (8,841 ) 434,882
Accrued warranty expense 121,735 48,591 - 5 170,331
Unrealized loss on inventories 151,455 9,761 - (159 ) 161,057 Unrealized loss and expense 59,520 89,459 - (844 ) 148,135
Net defined benefit liability 83,200 2,054 4,441 664 90,359
Unrealized sales profit 12,682 (12,440 ) - - 242 Others 402,423 (229,275 ) - 5,328 178,476
$ 3,614,920 $ 546,638 $ 175,497 $ (3,853 ) $ 4,333,202
For the year ended December 31, 2017
Temporary differences
Investment accounted for using the equity
method $ 1,256,276 $ 128,517 $ 287,498 $ - $ 1,672,291 Impairment loss on assets 351,520 327,728 - (262 ) 678,986
Operating loss carryforward 145,933 290,315 - (3,620 ) 432,628 Unrealized loss on inventories 183,136 (29,432 ) - (2,249 ) 151,455
Accrued warranty expense 268,718 (146,968 ) - (15 ) 121,735
Net defined benefit liability 72,727 943 9,552 (22 ) 83,200
Unrealized loss and expense 528,440 (467,647 ) - (1,273 ) 59,520
Unrealized sales profit 43,882 (31,194 ) - (6 ) 12,682
Others 191,034 223,688 - (12,299 ) 402,423
$ 3,041,666 $ 295,950 $ 297,050 $ (19,746 ) $ 3,614,920

- 68 -
The movements of deferred tax liabilities were as follows:
Opening
Balance
Recognized in
Profit (Loss)
Recognized in
Other
Comprehensive
Income (Loss)
Exchange
Differences
Closing
Balance
For the year ended December 31, 2018
Temporary differences
Investment accounted for using the equity method $ 572,741 $ 183,430 $ - $ - $ 756,171
Unrealized amortization of goodwill 353,808 62,437 - - 416,245
Land value increment tax 239,693 40,627 - - 280,320 Unrealized exchange gains, net 141,703 (43,877 ) - 3 97,829
Others 16,847 39,397 - (1,460 ) 54,784
$ 1,324,792 $ 282,014 $ - $ (1,457 ) $ 1,605,349
For the year ended December 31, 2017
Temporary differences
Investment accounted for using the equity method $ 2,220,464 $ (1,647,723 ) $ - $ - $ 572,741
Unrealized amortization of goodwill 353,808 - - - 353,808 Land value increment tax 239,693 - - - 239,693
Unrealized exchange gains, net 84,796 56,826 - 81 141,703
Others 33,360 (16,175 ) - (338 ) 16,847
$ 2,932,121 $ (1,607,072 ) $ - $ (257 ) $ 1,324,792
d. Income tax assessments
The tax returns of the Parent Company for all years through 2015 have been assessed by the tax
authorities.
29. EARNINGS PER SHARE
Unit: NT$ Per Share
For the Year Ended December 31
2018 2017
Basic earnings per share $ 3.42 $ 1.13
Diluted earnings per share $ 3.38 $ 1.13
The earnings and weighted average number of ordinary shares outstanding in the computation of earnings
per share were as follows:
Net Profit for the Year
For the Year Ended December 31
2018 2017
Earnings used in the computation of basic earnings per share $ 7,956,838 $ 2,629,334
Effect of potentially dilutive ordinary shares:
Employees’ compensation - -
Earnings used in the computation of diluted earnings per share $ 7,956,838 $ 2,629,334

- 69 -
Weighted Average Number of Ordinary Shares Outstanding
Unit: In Thousand Shares
For the Year Ended December 31
2018 2017
Weighted average number of ordinary shares outstanding in
computation of basic earnings per share 2,324,026 2,324,026
Effect of potentially dilutive ordinary shares:
Employees’ compensation 27,731 9,164
Weighted average number of ordinary shares outstanding in
computation of dilutive earnings per share 2,351,757 2,333,190
If the Parent Company settles the bonuses or remuneration paid to employees in cash or shares, the Parent
Company presumed that the entire amount of the bonus or remuneration would be settled in shares and the
resulting potential shares were included in the weighted average number of shares outstanding used in the
computation of diluted earnings per share, if the effect is dilutive. The dilutive effect of the potential shares
is included in the computation of diluted earnings per share until the number of shares to be distributed to
employees is resolved in the following year.
30. ADDITIONAL INFORMATION ON EXPENSES
For the Year Ended December 31
2018 2017
a. Depreciation and amortization
Property, plant and equipment $ 4,670,387 $ 5,653,623
Investment properties 27,865 21,978
Intangible assets 306,500 421,386
$ 5,004,752 $ 6,096,987
An analysis of depreciation by function
Recognized in operating costs $ 3,954,159 $ 4,844,222
Recognized in operating expenses 744,093 831,379
$ 4,698,252 $ 5,675,601
An analysis of amortization by function
Recognized in operating costs $ 17,587 $ 26,753
Recognized in operating expenses 288,913 394,633
$ 306,500 $ 421,386
(Continued)

- 70 -
For the Year Ended December 31
2018 2017
b. Employee benefit expenses
Post-employment benefits
Defined contribution plans $ 687,796 $ 758,431
Defined benefit plans (Note 25) 10,364 11,129
698,160 769,560
Termination benefits 316,157 198,629
Other employee benefits 24,098,829 25,146,841
$ 25,113,146 $ 26,115,030
Employee benefits expense summarized by function
Recognized in operating costs $ 15,037,326 $ 16,061,202
Recognized in operating expenses 10,075,820 10,053,828
$ 25,113,146 $ 26,115,030
(Concluded)
The Parent Company distributed employees’ compensation and remuneration of directors at the rates no
less than 1% and no higher than 1.5%, respectively, of net profit before income tax, employees’
compensation, and remuneration of directors. The appropriations of employee compensation and
remuneration of directors for 2018 and 2017, which have been approved by the Parent Company’s
board of directors on February 26, 2019 and February 27, 2018, respectively, were as follows:
For the Year Ended December 31
2018 2017
Cash
Dividends
Share
Dividends
Cash
Dividends
Share
Dividends
Employees’ compensation $ 1,125,893 $ - $ 372,051 $ -
Remuneration of directors 67,633 - 27,284 -
If there is a change in the proposed amounts after the annual consolidated financial statements are
authorized for issue, the differences are recorded as a change in accounting estimate and will be
adjusted in the next year.
There was no difference between the actual amounts of employee’s compensation and the remuneration
of directors paid and the amounts recognized in the consolidated financial statements for the years
ended December 31, 2017.
Information on 2019 and 2018 employees’ compensation and remuneration of directors resolved by the
Parent Company’s board of directors is available on the Market Observation Post System website of the
Taiwan Stock Exchange.
31. CAPITAL MANAGEMENT
The Group manages its capital to ensure that entities in the Group will be able to continue as going
concerns while maximizing the return to shareholders through the optimization of the debt and equity
balance.

- 71 -
The Group’s capital management system aims to ensure that the necessary financial resources and operating
plan are enough to meet the next 12 months’ requirements for working capital, capital expenditures,
research and development expenses, debt repayment, dividend expenses and other need.
32. FINANCIAL INSTRUMENTS
a. Fair value of financial instruments not measured at fair value
For certain financial instruments - including contract assets, notes receivable, trade receivables
including related parties, other receivables including related parties, financial assets at amortized costs,
short-term borrowings, notes payable, trade payables including related parties, other payables including
related parties and finance lease payables - the Group’s management considers the carrying amounts of
these financial instruments recognized in the financial statements as approximating their fair values. For
long-term loans (including their current portion) with floating rates, the carrying amounts of long-term
loans are used as basis to estimate their fair value.
b. Fair value of financial instruments that are measured at fair value on a recurring basis
1) Fair value hierarchy
December 31, 2018
Level 1 Level 2 Level 3 Total
Financial assets at FVTPL
Derivative instruments $ - $ 132,139 $ - $ 132,139
Mutual funds - 99,727 - 99,727
Securities listed in ROC - equity
securities 11,493 - - 11,493
$ 11,493 $ 231,866 $ - $ 243,359
Equity Investments
Securities listed in ROC - equity
securities $ 199,825 $ - $ - $ 199,825
Emerging market shares - 99,844 - 99,844
Unlisted securities - other countries -
equity securities - - 43,952 43,952
Unlisted securities - ROC - equity
securities - - 40,998 40,998
Securities listed in other countries -
equity securities 4,056 - - 4,056
$ 203,881 $ 99,844 $ 84,950 $ 388,675
Financial liabilities at FVTPL
Derivative instruments $ - $ 51,877 $ - $ 51,877

- 72 -
December 31, 2017
Level 1 Level 2 Level 3 Total
Financial assets at FVTPL
Derivative instruments $ - $ 101,677 $ - $ 101,677
Financial liabilities at FVTPL
Derivative instruments $ - $ 147,052 $ - $ 147,052
Available-for-sale financial assets
Securities listed in ROC - equity
securities $ 243,321 $ - $ - $ 243,321
Securities listed in other countries -
equity securities 5,580 - - 5,580
Unlisted securities - ROC - equity
securities - - 15,785 15,785
Unlisted securities - other countries -
equity securities - - 72,575 72,575
Mutual funds - 68,469 - 68,469
Emerging market shares - 107,399 - 107,399
$ 248,901 $ 175,868 $ 88,360 $ 513,129
There were no transfers between Levels 1 and 2 in the current and prior periods.
2) Reconciliation of Level 3 fair value measurements of financial assets
Investments on
Equity
Instruments
Unlisted Quotes
For the year ended December 31, 2018
Balance at January 1, 2018 $ 88,360
Total gains or losses
In other comprehensive income 36,252
Additions 59,480
Disposals (99,142)
Balance at December 31, 2018 $ 84,950
For the year ended December 31, 2017
Balance at January 1, 2017 $ 105,155
Total gains or losses
In profit or loss (Note 11) (10,987)
In other comprehensive income (5,316)
Disposals (492)
Balance at December 31, 2017 $ 88,360

- 73 -
3) Valuation techniques and inputs applied for the purpose of measuring Level 2 fair value
measurement
Financial Instruments Valuation Techniques and Inputs
Financial assets at FVTPL -
forward exchange contracts
Estimation of future cash flows using observable forward
exchange rates at the end of year and contract forward rates,
discounted at a rate that reflects the credit risk of various
counterparties.
Financial assets at FVTPL -
currency swaps
Estimation of fair value of a currency swap contract is based on
its principal and interest rate on mutual agreement and the
suitable discount rate that reflects the credit risk of various
counterparties at the end of the reporting period.
Mutual funds Using the observable similar market average price or the price of
the same kind of tools provided by the mutual fund
management company.
Emerging market shares Using the recent emerging market share price of similar
emerging market shares of investee companies and
considering the adjustment of all the information on the
performance and operation of the emerging company
available from trading date to measuring date.
4) Valuation techniques and inputs applied for the purpose of measuring Level 3 fair value
measurement
The fair values of unlisted equity securities - ROC and other countries were determined using the
income approach. In this approach, the discounted cash flow method was used to capture the present
value of the expected economic benefits from these investments. According to the discounted cash
flow analysis and observable financial market average prices or by using similar kinds of estimation
tools, the discount rate and the parameters used can be referenced from Reuters news agency,
Bloomberg agency or other financial institutions for instruments with essentially the same
conditions and characteristics as the interest rate swaps offering financial products whose features
include the same remaining contract terms, fixed interest rates, payment of principal, payment of
currency, etc. All the information can be obtained by the Group.
c. Categories of financial instruments
December 31
2018 2017
Financial assets
FVTPL
Financial assets held for trading $ - $ 101,677
Financial assets mandatorily classified as at FVTPL 243,359 -
Loans and receivables (1) - 113,034,898
Available-for-sale financial assets (2) - 513,129
Financial assets at amortized costs (3) 124,116,739 -
Equity investments at FVTOCI 388,675 -
(Continued)

- 74 -
December 31
2018 2017
Financial liabilities
FVTPL
Financial liabilities held for trading $ - $ 147,052
Financial liabilities mandatorily classified as at FVTPL 51,877 -
Amortized cost
Short-term borrowings 30,087,282 30,155,790
Long-term loans (including current portion of long-term debts) 184 16,382
Payables (4) 82,514,911 78,138,843
(Concluded)
1) The balances included loans and receivables measured at amortized cost, which comprise cash and
cash equivalents, debt instruments with no active market, notes receivable, trade receivables, trade
receivables from related parties, other receivables and other receivables from related parties.
2) The balances of the financial assets included available for sale financial assets, evaluated at cost.
3) The balances included financial assets measured at amortized cost, which comprise cash and cash
equivalents, debt instruments measured at amortized cost, contract assets, notes receivable, trade
receivables, trade receivables from related parties, other receivables and other receivables from
related parties.
4) The balances included financial liabilities measured at amortized cost, which comprise notes
payable, trade payables, trade payables to related parties, other payables and other payables to
related parties.
d. Financial risk management objectives and policies
The Group’s major financial instruments include equity investments, trade receivables, trade payables,
and borrowings. The Group’s Corporate Treasury function provides services to the business,
coordinates access to domestic and international financial markets, monitors and manages the financial
risks relating to the operations of the Group through internal risk reports which analyze exposures by
degree and magnitude of risks. These risks include market risk (including foreign currency risk, interest
rate risk and other price risk), credit risk and liquidity risk.
The Group sought to minimize the effects of these risks by using derivative financial instruments to
hedge risk exposures. The use of financial derivatives was governed by the Group’s policies approved
by the board of directors, which provided written principles on foreign exchange risk, interest rate risk,
credit risk, the use of financial derivatives and non-derivative financial instruments, and the investment
of excess liquidity. Compliance with policies and exposure limits was reviewed by the internal auditors
on a continuous basis. The Group did not enter into or trade financial instruments, including derivative
financial instruments, for speculative purposes.
1) Market risk
The Group’s activities exposed it primarily to the financial risks of changes in foreign currency
exchange rates (see (a) below) and interest rates (see (b) below). The Group entered into a variety of
derivative financial instruments to manage its exposure to foreign currency risk, including forward
exchange contracts and currency swap contracts to hedge the exchange rate risk arising on the
exports.

- 75 -
There were no changes to the Group’s exposure to market risks or the manner in which these risks
were managed and measured.
a) Foreign currency risk
The Group’s had foreign currency sales and purchases, which exposed the Group to foreign
currency risk. Exchange rate exposures were managed within approved policy parameters
utilizing forward exchange contracts and currency swaps. It is the Group’s policy to negotiate
the terms of the hedge derivatives to match the terms of the hedged item to maximize hedge
effectiveness.
The carrying amounts of the Group’s foreign currency denominated monetary assets and
monetary liabilities and of the derivatives exposed to foreign currency risk at the end of the
reporting period are set out in Note 37.
Sensitivity analysis
The Group was mainly affected by the U.S. dollar.
The following table details the Group’s sensitivity to a 5% increase and decrease in New
Taiwan dollars (the functional currency) against the U.S. dollar. The sensitivity analysis
included only outstanding foreign currency denominated monetary items. A positive number
below indicates an increase in pre-tax profit and other equity associated with New Taiwan
dollars strengthening 5% against the U.S. dollar. For a 5% weakening of New Taiwan dollars
against the U.S. dollar, there would be an equal and opposite impact on pre-tax profit and other
equity and the balances below would be negative.
USD Impact
For the Year Ended December 31
2018 2017
Profit or loss $ (912,321) $ (645,616)
b) Interest rate risk
The Group was exposed to interest rate risk because entities in the Group borrowed funds at
both fixed and floating interest rates. The risk is managed by the Group by maintaining an
appropriate mix of fixed and floating rate borrowings.
The carrying amount of the Group’s financial assets and financial liabilities with exposure to
interest rates at the end of the reporting period were as follows:
December 31
2018 2017
Fair value interest rate risk
Financial assets (i) $ 22,904,046 $ 20,865,475
Financial liabilities (ii) 27,973,401 28,199,681
Cash flow interest rate risk
Financial assets (iii) 40,021,282 37,183,512
Financial liabilities (iv) 2,115,885 1,975,855
i. The balances included time deposits, financial assets at amortized cost with fixed interest
rates (2018) and debt investments with no active market (2017).

- 76 -
ii. The balances included financial liabilities exposed to fair value risk from interest rate
fluctuations.
iii. The balances included demand deposits, financial assets at amortized cost with floating
interest rates (2018).
iv. The balances included financial liabilities exposed to cash flow risk from interest rate
fluctuations.
Sensitivity analysis
The sensitivity analyses below were determined based on the Group’s exposure to interest rates
for both derivatives and non-derivative instruments at the end of the reporting period. For
floating rate liabilities, the analysis was prepared assuming the amount of the liability
outstanding at the end of the reporting period was outstanding for the whole reporting period.
If interest rates had been 25 basis points higher and all other variables were held constant, the
Group’s pre-tax profit for the years ended December 31, 2018 and 2017 would increase by
$94,763 thousand and $88,019 thousand.
c) Other price risk
The Group was exposed to equity price risk through its investments in listed equity securities.
Equity investments are held for strategic rather than trading purposes. The Group does not
actively trade these investments.
Sensitivity analysis
The sensitivity analyses below were determined based on the exposure to equity price risks at
the end of the reporting period.
If the fair value of financial assets as at FVTPL and FVTOCI increased by 10%, profit or loss
before income tax and other comprehensive income would increase by $1,149 thousand and
$20,388 thousand for the years ended December 31, 2018, respectively. If the fair value of
available-for-sale financial assets increased by 10%, other comprehensive income (before tax)
would increase by $24,890 thousand in the year of 2017.
2) Credit risk
Credit risk refers to the risk that counterparty will default on its contractual obligations resulting in
financial loss to the Group. The Group is exposed to credit risk from trade receivables, deposits, and
other financial instruments. Credit risk on business-related exposures is managed separately from
that on financial-related exposures.
a) Business related credit risk
To maintain the quality of receivables, the Group has established operating procedures to
manage credit risk.
For individual customers, risk factors considered include the customer’s financial position,
credit rating agency rating, the Group’s internal credit rating, and transaction history as well as
current economic conditions that may affect the customer’s ability to pay. The Group also has
the right to use some credit protection enhancement tools, such as requiring advance payments,
to reduce the credit risks involving certain customers.

- 77 -
b) Financial related credit risk
Bank deposits and other financial instruments are credit risk sources required by the Group’s
Department of Finance Department to be measured and monitored. However, since the Group’s
counter-parties are all reputable financial institutions and government agencies, there is no
significant financial credit risk.
c) The movement of allowance for expected credit loss, by the simplified method, is as follows:
Notes
Receivable
Trade
Receivables
Contract
Assets Total
January 1, 2018
(IAS 18)
$ - $ 199,568 $ - $ 199,568
Effects of IFRS 15
adoption
- (149) 149 -
January 1, 2018
(IFRS 18)
- 199,419 149 199,568
Expected credit loss - 55,148 11,801 66,949
Reversal of previously
recognized loss
- 927 - 927
Recognized Loss - (17,508) - (17,508)
Disposal of subsidiaries - (18,383) - (18,383)
Effects of changes in
foreign exchange
rates
- (763) 119 (644)
December 31, 2018 $ - $ 218,840 $ 12,069 $ 230,909
3) Liquidity risk
The objective of liquidity risk management, the department is required to maintain operating cash
and cash equivalents, in order to ensure that the Group has sufficient financial flexibility.
The table below summarizes the maturity profile of the Group’s non-derivative financial liabilities
based on contractual undiscounted payments.
December 31, 2018
Weighted
Average
Effective
Interest Rate
(%)
On Demand or
Less than 1
Year 1-3 Years
Over 3 Years to
5 Years 5+ Years
Non-derivative financial liabilities
Non-interest bearing $ 82,514,911 $ 78,128 $ - $ 762
Finance lease liabilities 3.49-4.75 1,469 351 - - Variable interest rate liabilities 2.48-8.3 2,115,885 - - -
Fixed interest rate liabilities 3.04-4.40 27,971,581 - - -
$ 112,603,846 $ 78,479 $ - $ 762

- 78 -
December 31, 2017
Weighted
Average
Effective
Interest Rate
(%)
On Demand or
Less than 1
Year 1-3 Years
Over 3 Years to
5 Years 5+ Years
Non-derivative financial liabilities
Non-interest bearing $ 78,138,843 $ 80,050 $ - $ 812
Finance lease liabilities 3.49-4.75 1,600 1,764 - - Variable interest rate liabilities 1.98-2.29 1,975,855 - - -
Fixed interest rate liabilities 1.10-4.40 28,196,139 178 - -
$ 108,312,437 $ 81,992 $ - $ 812
The table below summarizes the maturity profile of the Group’s derivative financial instruments
based on contractual undiscounted payments.
December 31, 2018
On Demand or
Less than 1
Year 1-3 Years
Over 3 Years
to 5 Years 5+ Years
Forward exchange contracts
Inflows $ 24,394,324 $ - $ - $ -
Outflows (24,159,086) - - -
235,238 - - -
Currency swaps
Inflows 6,712,114 - - -
Outflows (6,628,425) - - -
83,689 - - -
$ 318,927 $ - $ - $ -
December 31, 2017
On Demand or
Less than 1
Year 1-3 Years
Over 3 Years
to 5 Years 5+ Years
Forward exchange contracts
Inflows $ 21,109,376 $ - $ - $ -
Outflows (21,014,309) - - -
95,067 - - -
Currency swaps
Inflows 4,718,370 - - -
Outflows (4,664,665) - -
53,705 - - -
$ 148,772 $ - $ - $ -

- 79 -
33. TRANSACTIONS WITH RELATED PARTIES
Balances and transactions between the Parent Company and its subsidiaries, which were related parties of
the Parent Company, had been eliminated on consolidation and are not disclosed in this note. Besides as
disclosed elsewhere in the other notes, details of transactions between the Group and other related parties
are disclosed below.
a. Related parties and relationships
Related Parties Relationships with the Group
Lite-On Semiconductor Corp. Associate
Lite-Space Technology Company Limited Associate
Yamada-Lom Fabricacao De Artefatos De Material Plastico
Ltda. (“Yamada-Lom Ltda.”) Associate
DragonJet Corporation Associate
Silport Travel Corp. Related party in substance
Chi Mei Mold Co. Related party in substance
Silport Technology Corp. Related party in substance
Diodes Incorporated Related party in substance
Auden Techno Corp. Related party in substance
Lite-On Cultural Foundation Related party in substance
Dongguan Huaqiang Information Technology Co., Ltd. Related party in substance
Look Tec Co., Ltd. Related party in substance (became an
unrelated party since January 2018)
KBW-LEOTEK FACTORY Jordan Private Shareholding
Limited
Related party in substance (became a
subsidiary since May 2018)
b. Sales of goods
For the Year Ended December 31
2018 2017
Related parties categories
Associates
Lite-On Semiconductor Corp. $ 373,492 $ 284,931
Others 6,207 -
379,699 284,931
Related party in substance
Others 512 591
$ 380,211 $ 285,522
For the years ended December 31, 2018 and 2017, the Group’s selling prices for Lite-On
Semiconductor Corp. for the Group were at cost plus an agreed-upon profit. Except for the sales
arrangement with Lite-On Semiconductor Corp., the sales terms between the Group and its related
parties have no material difference as the sales terms with non-related parties.
Operating lease contracts with related parties are based on market prices and made under mutual and
standard agreements; the market prices and contract terms between the Group and its related parties
have no material difference as the sales terms with non-related parties.

- 80 -
c. Purchases of goods
For the Year Ended December 31
2018 2017
Related parties categories
Associates
Lite-Space Technology Company Limited $ 2,672,861 $ 4,006,557
Lite-On Semiconductor Corp. 1,336,179 1,237,763
4,009,040 5,244,320
Related party in substance
Diodes Incorporated 610,845 612,652
Others 55,063 97,286
665,908 709,938
$ 4,674,948 $ 5,954,258
The costs of the Group’s purchases from Lite-On Semiconductor Corp. for the years ended December
31, 2018 and 2017 were based on cost plus agreed-upon profit. Except for these purchases, the purchase
terms between the Group and its related parties have no material difference in comparison with those
with non-related parties.
d. Receivables from related parties
December 31
2018 2017
Related parties categories
Trade receivables
Associates
Lite-On Semiconductor Corp. $ 84,828 $ 73,945
Others 5,226 5,343
90,054 79,288
Related party in substance
Others 41 -
$ 90,095 $ 79,288
Other receivables
Associates
Lite-On Semiconductor Corp. $ 2,490 $ 1,014
Yamada-Lom Ltda. 1,726 1,082
Others 18 254
4,234 2,350
Related party in substance
KBW-LEOTEK FACTORY Jordan Private Shareholding
Limited - 420
Others 183 36
183 456
$ 4,417 $ 2,806
The outstanding trade receivables from related parties are unsecured. No allowance for doubtful
accounts was recognized for trade receivables from related parties for the years ended December 31,
2018 and 2017.

- 81 -
e. Payables to related parties
December 31
2018 2017
Related parties categories
Trade payables
Associates
Lite-On Semiconductor Corp. $ 384,374 $ 388,159
Lite-Space Technology Company Limited 179,309 153,398
563,683 541,557
Related party in substance
Diodes Incorporated 213,798 227,239
Others 4,142 35,098
217,940 262,337
$ 781,623 $ 803,894
Other payables
Associates
Others $ 515 $ 24
Related party in substance
Silport Travel Corp. 8,043 10,489
Chi Mei Mold Co. 7,893 9,333
Others 233 81
16,169 19,903
$ 16,684 $ 19,927
The outstanding trade payables from related parties are unsecured.
f. Operating expenses
For the Year Ended December 31
2018 2017
Related parties categories
Associates
Lite-On Semiconductor Corp. $ 24,020 $ 20,907
Related party in substance
Silport Travel Corp. 83,732 83,549
Chi Mei Mold Co. 3,865 14,506
Look Tec Co., Ltd. - 16,797
Others 380 250
89,977 115,102
$ 111,997 $ 136,009

- 82 -
g. Other revenue
For the Year Ended December 31
2018 2017
Related parties categories
Associates
Yamada-Lom Ltda. $ 9,269 $ 3,068
Lite-On Semiconductor Corp. 6,778 4,478
Others - 1,219
16,047 8,765
Related party in substance
Auden Techno Corp. 5,172 8,168
Others 1,519 1,468
6,691 9,636
$ 22,738 $ 18,401
h. Compensation of key management personnel
For the Year Ended December 31
2018 2017
Short-term employee benefits $ 603,414 $ 582,380
Post-employment benefits 19,294 25,898
Termination benefits - 1,944
$ 622,708 $ 610,222
The remuneration of directors and key executives was determined by the remuneration committee
having regard to the performance of individuals and market trends.
34. ASSETS PLEDGED AS COLLATERAL OR FOR SECURITY
December 31
2018 2017
Pledged time deposits (classified as financial assets at amortized
costs) $ 596,623 $ -
Pledged time deposits and restricted bank deposits (classified as debt
instruments with no active markets) - 718,024
$ 596,623 $ 718,024
Above assets included the guarantee deposits that had been pledged for (a) a government projects (b) the
customs agency for shipment clearance in advance of duty payments (c) the tax refund guarantee.

- 83 -
35. SIGNIFICANT CONTINGENT LIABILITIES AND UNRECOGNIZED COMMITMENTS
a. From the second quarter of the year ended June 30, 2010 to the second quarter of the year ended June
30, 2014, petitioner Carlos Fogelman filed a motion for authorization to institute class action antitrust
proceedings with the Superior Court of Quebec in the district of Montreal; the Fanshawe College of
Applied Arts and Technology filed a statement of claim in the Ontario court; Neil Godfrey filed a
statement of claim with the Superior Court of British Columbia; Donald Woligroski filed a statement of
claim in the Manitoba court; and Cindy Retallick filed a statement of claim in the Saskatchewan court.
All plaintiffs filed an antitrust group lawsuit against the Parent Company and its subsidiaries - Philips &
Lite-On Digital Solutions Corporation, Philips & Lite-On Digital Solutions USA, Inc. and other
companies with related businesses. The Company assigned lawyers as its representative in these
lawsuits. Although the outcome of the proceedings have not been determined, the Parent Company
accrued a reasonable amount in case of losses on these lawsuits and will continue to recognize the
losses quarterly on the basis of a reasonable estimation of the lawsuits until their settlements.
b. The Company and its subsidiary LITE-ON SINGAPORE PTE. LTD. sued Darfon Electronics Co., Ltd.
and Darfon Electronics Co., Ltd. (USA) in the San Francisco federal court for infringement of keyboard
patents in June 2018. In the same court, Dafang Electronics Co., Ltd. countersued the Parent Company
and its subsidiaries LITE-ON, INC., LITE-ON SINGAPORE PTE. LTD. and LITE-ON
ELECTRONICS (DONGGUAN) CO., LTD. for infringement of keyboard patents. The lawsuits are in
the early stages, and the current assessment has no significant impact on the Company’s operations and
finances.
c. Darfon electronics Co., Ltd. sued the Company and its subsidiary LITE-ON COMPUTER
(CHANGZHOU) CO., LTD. in the intermediate people’s court at Suzhou, Jiangsu, People’s Republic
of China for infringement of keyboard patents in December 2018. In the same court, the Company and
its subsidiary LITE-ON ELECTRONICS (GUANGZHOU) LIMITED sued Darfon electronics Co. Ltd.
and its subsidiaries for infringement of keyboard related patents. The lawsuits are in the early stages,
and the current assessment has no significant impact on the Company’s operations and finances.
36. OTHER SIGNIFICANT MATTERS
The transaction regarding transferring the Portable Image Device SBG’s main business (Camera Module
Business) and assets and the recognition of the impairment loss of goodwill and operating losses for Mobile
Mechanics Business Group were both approved by board of directors of the Parent Company in August
2018. As of the date that the consolidated financial statements were issued, the business transfer is
completed and the main part of the operating assets and liabilities was transferred. The impairment loss of
goodwill (see Note 20) and operating losses for Mobile Mechanics Business Group were also recognized.
The net profit of the above transactions is NT$1,041,786 thousand, which is recognized as non-operating
income and expenses.

- 84 -
37. SIGNIFICANT ASSETS AND LIABILITIES DENOMINATED IN FOREIGN CURRENCIES
The following information was aggregated by the foreign currencies other than functional currencies of the
group entities and the exchange rates between foreign currencies and respective functional currencies were
disclosed. The significant assets and liabilities denominated in foreign currencies were as follows:
December 31, 2018
Foreign
Currencies Exchange Rate
Carrying
Amount
Financial assets
Monetary items
USD $ 1,441,072 30.6650 (USD:NTD) $ 44,190,469
USD 1,286,223 6.8393 (USD:CNY) 39,442,026
USD 64,281 7.8321 (USD:HKD) 1,971,176
USD 17,277 32.3200 (USD:THB) 529,806
USD 2,539 0.8730 (USD:EUR) 77,863
EUR 13,091 1.1455 (EUR:USD) 459,837
$ 86,671,177
Non-monetary items
Investments accounted for using the
equity method
USD 3,255 30.6650 (USD:NTD) $ 99,826
Financial liabilities
Monetary items
USD 2,036,096 30.6650 (USD:NTD) $ 62,436,894
USD 1,013,611 6.8393 (USD:CNY) 31,082,386
USD 29,902 7.8321 (USD:HKD) 916,943
USD 26,325 32.3200 (USD:THB) 807,246
USD 6,066 0.8730 (USD:EUR) 186,021
$ 95,429,490
December 31, 2017
Foreign
Currencies Exchange Rate
Carrying
Amount
Financial assets
Monetary items
USD $ 1,501,366 29.7100 (USD:NTD) $ 44,605,573
USD 1,352,449 6.4968 (USD:CNY) 40,181,252
USD 63,065 7.8156 (USD:HKD) 1,873,647
USD 31,368 32.5600 (USD:THB) 931,936
USD 4,637 0.8368 (USD:EUR) 137,765
EUR 13,876 1.1950 (EUR:USD) 492,681
$ 88,222,854
(Continued)

- 85 -
Foreign
Currencies Exchange Rate
Carrying
Amount
Non-monetary items
Investments accounted for using the
equity method
USD $ 2,666 29.7100 (USD:NTD) $ 79,217
Financial liabilities
Monetary items
USD 1,935,977 29.7100 (USD:NTD) $ 57,517,887
USD 1,136,372 6.4968 (USD:CNY) 33,761,613
USD 32,937 7.8156 (USD:HKD) 978,552
USD 32,186 32.5600 (USD:THB) 956,238
USD 11,290 0.8368 (USD:EUR) 335,418
$ 93,549,708
(Concluded)
For the years ended December 31, 2018 and 2017 net foreign exchange gains was $497,693 thousand and
$226,478 thousand. It is impractical to disclose net foreign exchange gains or losses by each significant
foreign currency due to the variety of the foreign currency transactions of the group entities.
38. SEPARATELY DISCLOSED ITEMS
a. Information on significant transactions and information on investees:
1) Financing provided: See Table 1 below.
2) Endorsement/guarantee provided: See Table 2 below.
3) Marketable securities held (excluding investment in subsidiaries, associates and jointly controlled
entities): See Table 3 below.
4) Marketable securities acquired and disposed of at costs or prices of at least NT$300 million or 20%
of the paid-in capital: See Table 4 below.
5) Acquisition of individual real estate properties at costs of at least NT$300 million or 20% of the
paid-in capital: None.
6) Disposal of individual real estate properties at prices of at least NT$300 million or 20% of the
paid-in capital: See Table 5 below.
7) Total purchases from or sales to related parties of at amounting to at least NT$100 million or 20%
of the paid-in capital: See Table 6 below.
8) Receivables from related parties amounting to at least NT$100 million or 20% of the paid-in
capital: See Table 7 below.
9) Trading in derivative instruments: See Notes 7 and 32 to the financial statements.
10) Information on investees: See Table 8 below.

- 86 -
b. Information on investments in mainland China:
1) Information on any investee company in mainland China, showing the name, principal business
activities, paid-in capital, method of investment, inward and outward remittance of funds,
ownership percentage, net income of investees, investment income or loss, carrying amount of the
investment at the end of the period, repatriations of investment income, and limit on the amount of
investment in the mainland China area: See Table 9 below.
2) Any of the following significant transactions with investee companies in mainland China, either
directly or indirectly through a third party, and their prices, payment terms, and unrealized gains or
losses: See Table 10 below.
c. Intercompany relationships and significant intercompany transactions: See Table 10 below.
39. SEGMENT INFORMATION
a. General information
The Group identified the reportable segments based on the managerial reporting information, and the
segments by the types of products which included Optoelectronics, Information Technologies, Storage,
and Mobile Mechanics and Others. The types of products are described as follows:
1) Optoelectronics: LED Components and Lighting Products, Camera Modules and Automotive
Electronics.
2) Information technologies: Products used in Server, Networking Devices, NB, Tablets, DT and
Multifunction Peripheral.
3) Storage: Optical Disk Drives and Solid State Drives.
4) The Group also had Mobile Mechanics and Others operating segments that did not exceed the
quantitative threshold. These segments mainly engage in manufacturing and selling of Mechanical
Products for Mobile Devices, handset casing and others.
b. Measurement of segment information
The Group uses the income before income tax from operations as the measurement for segment profit
and the basis of performance assessment. There was no material differences between the accounting
policies of the operating segment and the accounting policies described in Note 4.
c. Segment information
The segment information provided to the chief operating decision-maker for the reportable segments is
as follows:
Optoelectronics IT Storage
Mobile
Mechanics and
Others Elimination Total
For the year ended
December 31, 2018
Sales from external customers $ 43,487,662 $ 119,360,992 $ 33,227,622 $ 11,032,812 $ - $ 207,109,088
Sales among segments 1,399,789 1,415,303 19,889 769,172 (3,604,153 ) -
Operating profit (loss) 1,906,571 5,994,320 2,239,910 (1,453,472 ) - 8,687,329
For the year ended
December 31, 2017
Sales from external customers 50,905,435 116,707,327 32,957,425 13,994,135 - 214,564,322
Sales among segments 1,412,294 1,235,280 11,038 601,698 (3,260,310 ) -
Operating profit (loss) 1,141,393 6,718,831 3,179,584 (1,916,651 ) - 9,123,157

- 87 -
d. Geographic information
Revenue from External
Customers Non-current Assets
For the Year Ended December 31 December 31
2018 2017 2018 2017
Asia $ 134,192,811 $ 147,643,570 $ 27,843,443 $ 33,794,339
America 49,365,614 44,718,555 605,244 745,530
Europe 23,221,849 21,826,301 1,473 13,159
Others 328,814 375,896 - -
$ 207,109,088 $ 214,564,322 $ 28,450,160 $ 34,553,028
The geographic information is presented by billing regions. Noncurrent assets include property, plant
and equipment, investment properties, intangible assets and others.
e. Information about major customers
The customer representing at least 10% of the Group’s net sales:
For the Year Ended December 31
2018 2017
Customer Name Sales Amount Percentage Sales Amount Percentage
A $ - - $ 21,641,308 10.09
f. Reconciliation information for segment profit (loss)
1) The revenue from external parties reported to the chief operating decision-maker is used the same
accounting policies in consistent with in the statement of comprehensive income.
2) A reconciliation of reportable segments profit (loss) and income before income tax is provided as
follows:
For the Year Ended December 31
2018 2017
Reportable segments’ profit $ 8,687,329 $ 9,123,157
Unclassified loss (1,201,516) (779,193)
Non-operating income and expenses 3,298,308 (4,972,370)
Profit before income tax $ 10,784,121 $ 3,371,594
3) Segment profit represented the profit before tax earned by each segment without unclassified
headquarter administration costs, the share of profit of associates, interest income, dividend income,
other income, net gain on disposal of investments, net gain or loss on foreign currency exchange,
net valuation gain on financial assets at FVTPL, finance costs, other expenses, net loss on disposal
of property, plant and equipment, impairment loss, and income tax expense. This was the measure
reported to the chief operating decision maker for the purpose of resource allocation and assessment
of segment performance.

- 88 -
TABLE 1
LITE-ON TECHNOLOGY CORPORATION AND SUBSIDIARIES
FINANCING PROVIDED
FOR THE YEAR ENDED DECEMBER 31, 2018
(Amounts in Thousands of New Taiwan Dollars)
No. Financing Company Counterparty Financial
Statement
Account
Related Party Maximum
Balance for the
Period
Ending Balance Amount
Actually Drawn Interest Rate
Nature for
Financing
(Note 1)
Transaction
Amount Reasons for
Financing Allowance for
Bad Debt
Collateral Financing
Limits for Each
Borrowing
Company
(Note 2)
Financing
Company’s
Total Financing
Amount Limits
(Note 2)
Note Item Value
1 LITE-ON SINGAPORE PTE.
LTD.
LITE-ON MOBILE PTE. LTD. Receivables from
related parties
Yes $ 2,472,400 $ 1,226,600 $ 1,266,600 0.86%-3.64413% b $ - Operating capital $ - None $ - $ 11,872,909 $ 11,872,909
2 LTC Group Ltd. Lite-On Automotive Electronics
Mexico, S.A. DE C.V.
Receivables from
related parties
Yes 92,715 91,995 91,995 2.130% b - Operating capital - None - 471,720 471,720
3 LITE-ON ELECTRONICS
H.K. LIMITED
LET (HK) LIMITED Receivables from
related parties
Yes 236,440 - - 1.160% b - Operating capital - None - 7,744,094 7,744,094
Lite-On Green Technologies (HK) Limited
Receivables from related parties
Yes 389 - - 1.200% b - Operating capital - None - 7,744,094 7,744,094
Lite-On Green Energy (HK)
Limited
Receivables from
related parties
Yes 779 - - 1.200% b - Operating capital - None - 7,744,094 7,744,094
4 LITE-ON TECHNOLOGY
(SHANGHAI) CO., LTD.
LITE-ON INTELLIGENT
TECHNOLOGY (YENCHENG) CORP.
Receivables from
related parties
Yes 46,807 - - 3.045% b - Operating capital - None - 2,714,509 2,714,509
5 LITE-ON AUTOMOTIVE
(WUXI) CO., LTD.
LITE-ON GREEN
TECHNOLOGIES (NANJING) CORPORATION
Receivables from
related parties
Yes 26,623 13,451 13,451 3.045% b - Operating capital - None - 594,309 594,309
6 LITEON OPTO TECHNOLOGY
(GUANGZHOU) LTD.
YANTAI LITE-ON MOBILE ELECTRONIC
COMPONENTS CO., LTD.
Receivables from related parties
Yes 46,807 - - 3.325% b - Operating capital - None - 1,976,351 1,976,351
7 LITE-ON TECHNOLOGY
(CHANGZHOU) CO., LTD.
CHANGZHOU LEOTEK NEW
ENERGY TRADE LIMITED
Receivables from
related parties
Yes 140,421 134,508 134,508 3.325% b - Operating capital - None - 3,935,856 3,935,856
8 LITE-ON NETWORK COMMUNICATION
(DONGGUAN) LIMITED.
LITE-ON ELECTRONICS (GUANGZHOU) LIMITED
Receivables from related parties
Yes 252,940 - - 3.045% b - Operating capital - None - 3,771,895 3,771,895
9 LITE-ON OPTO
TECHNOLOGY
(CHANGZHOU) LIMITED
LITE-ON INTELLIGENT
TECHNOLOGY
(YENCHENG) CORP.
Receivables from
related parties
Yes 45,989 44,836 44,836 3.045% b - Operating capital - None - 2,858,633 2,858,633
Note 1: Reasons for financing are as follows:
a. Business relationship.
b. The need for short-term financing.
Note 2: Financing limit for each borrower and aggregate financing limits are calculated based on the Parent Company’s policy.
Note 3: The net worth is based on the latest audited financial statements.
Note 4: All intercompany financing loans have been eliminated from consolidation.
(Concluded)

- 89 -
TABLE 2
LITE-ON TECHNOLOGY CORPORATION AND SUBSIDIARIES
ENDORSEMENT/GUARANTEE PROVIDED FOR THE YEAR ENDED DECEMBER 31, 2018
(Amounts in Thousands of New Taiwan Dollars)
No. Endorsement/
Guarantee Provider
Guaranteed Party
Limits on
Endorsement/
Guarantee Amount
Provided to Each
Guaranteed Party
(Note 2)
Maximum
Balance
for the Period
Ending Balance Amount Actually
Drawn
Amount of
Endorsement/
Guarantee
Collateralized
by Properties
Ratio of
Accumulated
Endorsement/
Guarantee to Net
Equity Per Latest
Financial
Statements
(%)
Maximum
Endorsement/
Guarantee Amount
Allowable
(Note 2)
Guarantee
Provided by
Parent
Company
Guarantee
Provided by
A Subsidiary
Guarantee
Provided to
Subsidiaries
in Mainland
China
Note Name
Nature of
Relationship
(Note 1)
0 Lite-On Technology Lite-On Technology (Europe) B.V. b $ 7,132,376 $ 68,728 $ 66,741 $ 66,741 $ - 0.09 $ 28,529,502 Yes No No
Corporation (the “Parent
Company”)
1 Lite-On Capital Corporation Lite-On Green Energy B.V. c 2,137,951 339,998 330,169 330,169 - 0.46 2,137,951 No No No
Lite-On Green Technologies B.V. c 2,137,951 848,537 - - - - 2,137,951 No No No
Note 1: Relationship between endorser/guarantor and endorsee/guarantee are as follows:
a. Business relationship.
b. A subsidiary in which the Parent Company holds directly over 50% of equity interest.
c. An investee in which the Parent Company and its subsidiaries hold over 50% of equity interest.
Note 2: a. No. 0: The aggregate amount of guarantees/endorsements by Lite-On Technology Corporation should not exceed 40% of its net worth, and the amount of guarantees/endorsements for any single entity should not exceed 10% of its net worth.
b. No. 1: The endorsement/guarantee limit for each entity and the total endorsement/guarantee limit are calculated on the basis of Lite-On Capital Corporation’s endorsement/guarantee procedures.
c. The net worth is based on the latest audited financial statements.

- 90 -
TABLE 3
LITE-ON TECHNOLOGY CORPORATION AND SUBSIDIARIES
MARKETABLE SECURITIES HELD
DECEMBER 31, 2018
(Amounts in Thousands of New Taiwan Dollars or Thousands of Foreign Currencies)
Held Company Name Marketable Securities Type and Name Relationship with the Held
Company Financial Statement Account
December 31, 2018
Note Shares/Units
(In Thousands)
Carrying Value
(Foreign
Currencies in
Thousands)
Percentage
of
Ownership
(%)
Fair Value
(Foreign
Currencies in
Thousands)
Lite-On Technology Corporation Ordinary shares
EPISTAR Corporation - Financial assets at FVTPL 449 $ 11,493 0.04 $ 11,493
Wistron Corporation - Financial assets at FVTOCI 5,437 103,848 0.19 103,848
Logah Technology Corp. - Financial assets at FVTOCI 7,905 65,376 12.54 65,376
Com2B Corp. - Financial assets at FVTOCI 5,000 9,009 11.11 9,009
Avamax Corp. - Financial assets at FVTPL 559 - 6.99 - Note
Aetas Technology, Inc. Member of the board of directors Financial assets at FVTPL 4,026 - 8.07 - Note
AuriaSolar Co., Ltd. - Financial assets at FVTPL 41,400 - 19.71 - Note
Z-Com, Inc. - Financial assets at FVTOCI 63 683 0.09 683
Fong Han Electronics Co., Ltd. - Financial assets at FVTPL 1,167 - 6.67 - Note
Xepex Electronics Co., Ltd. - Financial assets at FVTPL - - - - Note
North America Micro-Electronic & Software,
Incorporated
- Financial assets at FVTOCI 5 - 2.67 - Note
Action Media Technologies, Inc. - Financial assets at FVTPL 38 - - - Note
Oplink Communications, Inc. - Financial assets at FVTOCI 1 867 0.01 867
Taiwan Changxing Technology Co., Ltd. - Financial assets at FVTOCI 462 4,620 15.40 4,620
InSynerger Technology Co., Ltd. - Financial assets at FVTOCI 1,710 29,070 19.29 29,070
Preference shares
Arkologic Holdings Limited - Financial assets at FVTPL 11,111 - 7.66 - Note
PI-CORAL - Financial assets at FVTPL 1,139 - 10.65 - Note
Fund
Arm IoT Fund, L.P. - Financial assets at FVTPL - 44,840 - 44,840
Convertible bond
Xepex Electronics Co., Ltd. - Financial assets at FVTPL 150 - - - Note
Lite-On Capital Corporation Ordinary shares
Lite-On Technology Corporation The Parent Company Financial assets at FVTOCI 15,116 613,704 0.64 613,704
Lead Data, Inc. - Financial assets at FVTOCI 865 3,873 0.59 3,873
Compound Solar Technology Co., Ltd. - Financial assets at FVTPL 2,000 - 2.86 - Note
Z-Com, Inc. - Financial assets at FVTOCI 2,412 26,045 3.33 26,045
Auden Techno Corp. Member of the board of directors Financial assets at FVTOCI 8,124 99,844 19.90 99,844
Lite-On Green Energy (HK) Limited Ordinary shares
Changzhou Binhu Thin Film Solar Greenhouse
Co., Ltd.
- Financial assets at FVTOCI - US$ 140 19.90 US$ 140
(Continued)

- 91 -
Held Company Name Marketable Securities Type and Name Relationship with the Held
Company Financial Statement Account
December 31, 2018
Note Shares/Units
(In Thousands)
Carrying Value
(Foreign
Currencies in
Thousands)
Percentage
of
Ownership
(%)
Fair Value
(Foreign
Currencies in
Thousands)
LITE-ON ELECTRONICS Share certificates
COMPANY LIMITED Lite-On Technology Corporation GDR The Parent Company Financial assets at FVTOCI 245 $ 99,253 0.10 $ 99,253
YET FOUNDATE LIMITED Share certificates
Lite-On Technology Corporation GDR The Parent Company Financial assets at FVTOCI 227 91,989 0.10 91,989
Ordinary shares
Northern Lights Semiconductor - Financial assets at FVTPL 3,000 - 5.91 - Note
LET (HK) LIMITED Fund
Innovation Works Development Fund, L.P. - Financial assets at FVTPL - HK$ 6,841 - HK$ 6,841
LITE-ON TECHNOLOGY Preference shares
USA, INC. CNEX LABS Inc. - Financial assets at FVTOCI 245 US$ 1,000 0.45 US$ 1,000
LTC GROUP LTD. Ordinary shares
VIZIO, Inc. - Financial assets at FVTPL 437 $ - 2.90 $ - Note
LTC INTERNATIONAL LTD. Ordinary shares
Lite-On Technology Corporation The Parent Company Financial assets at FVTOCI 3,793 154,000 0.16 154,000
Share certificates
Lite-On Technology Corporation GDR The Parent Company Financial assets at FVTOCI 321 130,068 0.14 130,068
LITE-ON CHINA HOLDING CO. Ordinary shares
LTD. COMMIT Incorporated - Financial assets at FVTPL 4,962 - 1.87 - Note
Silitech Technology Corporation Ordinary shares
Chi Mei Mold Co., Ltd. Member of the board of directors Financial assets at FVTOCI 1,300 7,308 10.00 7,308
RTR-TECH Technology Co., Ltd. - Financial assets at FVTOCI 6,820 - 9.46 - Note
Silitech (Bermuda) Holding Ltd. Fund
Innovation Works Development Fund, L.P. - Financial assets at FVTPL - US$ 916 - US$ 916
Lite-On Japan Ltd. Ordinary shares
Tamura Corporation - Financial assets at FVTOCI 19,250 JPY 10,280 0.03 JPY 10,280
The Dai-ichi Life Insurance Company, Limited - Financial assets at FVTOCI 7 JPY 1,203 - JPY 1,203
Note: The carrying values of the financial instruments were all assessed for impairment.
(Concluded)

- 92 -
TABLE 4
LITE-ON TECHNOLOGY CORPORATION AND SUBSIDIARIES
MARKETABLE SECURITIES ACQUIRED AND DISPOSED OF AT COSTS OR PRICES OF AT LEAST NT$300 MILLION OR 20% OF THE PAID-IN CAPITAL
FOR THE YEAR ENDED DECEMBER 31, 2018
(Amounts in Thousands of New Taiwan Dollars or in Thousands of Foreign Currencies)
Company Name Marketable Securities Type and
Name Financial Statement Account Counterparty
Nature of
Relationship
Beginning Balance Acquisition Disposal Ending Balance
Shares/Units
(In Thousands) Amount
Shares/Units
(In Thousands) Amount
Shares/Units
(In Thousands) Amount
Carrying
Amount
Gain (Loss) on
Disposal
Shares/Units
(In Thousands) Amount
Lite-On Technology Corporation
The shares of KBW-LITEON Jordan Private Shareholding Limited
Investments accounted for using the equity method (Note 8)
KBW-LITEON Jordan Private Shareholding
Limited
100%-owned subsidiary
4,297 $ 325,571 17,500 $ 885,324 (Note 1)
- $ - $ - $ - 21,797 $ 1,210,895
The shares of Lite-On International Holding Co., Ltd.
Investments accounted for using the equity method (Note 8)
Lite-On International Holding Co., Ltd.
100%-owned subsidiary
338,825 17,379,624 21,800 725,264 (Note 2)
- - 104,680 (Note 2)
- 357,625 18,000,208
Lite-On International
Holding Co., Ltd
The shares of LITE-ON CHINA
HOLDING CO., LTD.
Investments accounted for using the
equity method (Note 8)
LITE-ON CHINA
HOLDING CO., LTD.
100%-owned
subsidiary
339,442 US$ 611,528 21,800 US$ 28,817
(Note 3)
- - US$ 20,284
(Note 3)
- 421,242 US$ 620,061
LITE-ON CHINA
HOLDING CO. LTD.
The shares of LITE-ON
ELECTRONICS COMPANY LIMITED
Investments accounted for using the
equity method (Note 8)
LITE-ON ELECTRONICS
COMPANY LIMITED
100%-owned
subsidiary
2,966,233 US$ 586,824 117,234 US$ 28,578
(Note 4)
- - US$ 18,731
(Note 4)
- 3,083,467 US$ 596,671
LITE-ON ELECTRONICS COMPANY LIMITED
The shares of LITE-ON TECHNOLOGY (JIANGSU) CO.,
LTD.
Investments accounted for using the equity method (Note 8)
LITE-ON TECHNOLOGY (JIANGSU) CO., LTD.
100%-owned subsidiary
-
HK$ 1,975,279 - HK$ 245,498 (Note 5)
- - HK$ 108,620 (Note 5)
- - HK$ 2,112,157
LITE-ON TECHNOLOGY
(JIANGSU) CO., LTD.
The shares of Lite-On Automotive
Electronics (CZ) Co.
Investments accounted for using the
equity method (Note 8)
Lite-On Automotive
Electronics (CZ) Co.
100%-owned
subsidiary
- - - CNY 223,746
(Note 6)
- - CNY 614
(Note 6)
- - CNY 223,132
LITE-ON TECHNOLOGY
(GZ) INVESTMENT COMPANY LIMITED
The shares of Zhuhai Lite-On Mobile
Technology Company Ltd.
Investments accounted for using the
equity method (Note 8)
Top-Touch Electronics
Co., Ltd.
100%-owned
subsidiary
- CNY (185,361 ) - - - (Note 7) CNY 185,361
(Note 7)
(Note 7) - -
LITE-ON MOBILE PTE. LTD.
The shares of Guangzhou Lite-On Mobile Electronic Components Co.,
Ltd.
Investments accounted for using the equity method (Note 8)
Top-Touch Electronics Co., Ltd.
100%-owned subsidiary
- US$ 119,925 - - - (Note 7) US$ 119,925 (Note 7)
(Note 7) - -
The shares of Shenzhen Lite-On Mobile Precision Molds Co., Ltd.
Investments accounted for using the equity method (Note 8)
Top-Touch Electronics Co., Ltd.
100%-owned subsidiary
- US$ 7,023 - - - (Note 7) US$ 7,023 (Note 7)
(Note 7) - -
Silitech Electronic
( SuZhou ) Co., Ltd.
Fixed Income Instruments Financial assets at amortized cost -
current
- - - 766,844
(CNY 167,700 )
- 2,235,066
(CNY 498,540 )
- 3,009,589
(CNY 667,953 )
2,979,494
(CNY 661,240 )
30,095
(CNY 6,713 )
- 22,416
(CNY 5,000 )
Note 1: The acquisition amount includes prepaid investments of $269,820 thousand, cash injections of $485,574 thousand, gain accounted for using the equity method of $119,341 thousand and effects on changes in equity of $10,589 thousand.
Note 2: The acquisition amount includes cash injections of $650,346 thousand, effects on changes in equity of $74,918 thousand; the disposal amount includes loss accounted for using the equity method.
Note 3: The acquisition amount includes cash injections of US$21,800 thousand, gain accounted for using the equity method of US$7,017 thousand; the disposal amount includes effects on changes in equity.
Note 4: The acquisition amount includes cash injections of US$15,000 thousand, gain accounted for using the equity method of US$13,578 thousand; the disposal amount includes effects on changes in equity.
Note 5: The acquisition amount includes cash injections of HK$116,820 thousand, gain accounted for using the equity method of HK$128,678 thousand; the disposal amount includes effects on changes in equity.
Note 6: The acquisition amount includes cash injections; the disposal amount includes loss accounted for using the equity method.
Note 7: The monetary amount for the disposal of equity shares transaction is CNY530 million. The expected loss on disposal is amounted to $518 million according to the share purchase agreement and matters to be adjusted.
Note 8: The investment accounted for using the equity method and prepaid investments were eliminated during the consolidation process.

- 93 -
TABLE 5
LITE-ON TECHNOLOGY CORPORATION AND SUBSIDIARIES
DISPOSAL OF INDIVIDUAL REAL ESTATE AT PRICES OF AT LEAST NT$ MILLION OR 20% OF THE PAID-IN CAPITAL
FOR THE YEAR ENDED DECEMBER 31, 2018
(Amounts in Thousands of New Taiwan Dollars)
Company Name Property Event Date
Original
Acquisition
Date
Carrying
Amount
Transaction
Amount Collection
Gain (Loss) on
Disposal Counterparty Relationship
Purpose of
Disposal Pricing Reference Other Terms
Silitech Electronic
(SuZhou ) Co., Ltd.
Right-to-use on land,
property, plant and
equipment and
investment
properties at
Suzhou
July 19, 2018 July 2007 CNY 178,262 CNY 235,000 The Group has received
90% of the
considerations as of
December 31, 2018.
The Group expects to
receive the remaining
considerations of
CNY23,500 thousand
CNY 33,812 Suzhou Xu Die
Industrial Co., Ltd.
Non-related
party
Liquidation of
assets
Appraised value of
CNY218,023 thousand,
referred to the real estate
appraisal report provided
by Suzhou Suxin
Zhongan Real Estate
Appraisal And Consulting
Co., Ltd.
None
on March 4, 2019.
Appraised value of
CNY217,934 thousand,
referred to the real estate
appraisal report provided
by Wuxi Zhong-zheng
Assets Appraisal Co.

- 94 -
TABLE 6
LITE-ON TECHNOLOGY CORPORATION AND SUBSIDIARIES
TOTAL PURCHASES FROM OR SALES TO RELATED PARTIES OF AT AMOUNTING TO AT LEAST NT$100 MILLION OR 20% OF THE PAID-IN CAPITAL
FOR THE YEAR ENDED DECEMBER 31, 2018
(Amounts in Thousands of New Taiwan Dollars or in Thousands of Foreign Currencies)
Company Name Related Party Nature of
Relationship
Transaction Details Abnormal Transaction Notes/Accounts
(Payable) or Receivable Note
Purchase/
Sale Amount
% to
Total Payment Terms Unit Price Payment Terms Ending Balance
% to
Total
Lite-On Technology Corporation Philips & Lite-On Digital Solutions Corporation Subsidiary Sale $ (14,742,645) (10.57) About 90 days Cost-plus pricing No significant difference $ 3,797,699 9.79
LITE-ON TECHNOLOGY (CHANGZHOU) CO., LTD. Fourth-tier subsidiary Sale (1,206,074) (0.88) About 90 days Cost-plus pricing No significant difference 460,697 1.19
WUXI CHINA BRIDGE EXPRESS TRADING CO., LTD. Third-tier subsidiary Sale (466,169) (0.34) About 90 days Cost-plus pricing No significant difference 73,845 0.19
LITE-ON SINGAPORE PTE. LTD. Subsidiary Sale (3,846,273) (2.80) About 90 days Cost-plus pricing No significant difference 906,503 2.34
Lite-On Japan Ltd. Subsidiary Sale (685,488) (0.50) About 90 days Cost-plus pricing No significant difference 159,394 0.41
LITE-ON TRADING USA, INC. Sub-subsidiary Sale (5,197,154) (3.79) About 90 days Cost-plus pricing No significant difference 2,046,981 5.28
Lite-On Sales & Distribution Inc. Sub-subsidiary Sale (496,999) (0.36) About 90 days Cost-plus pricing No significant difference 223,843 0.58
LITE-ON CHINA HOLDING CO. LTD. Sub-subsidiary Sale (186,948) (0.14) About 90 days Cost-plus pricing No significant difference 186,249 0.48
LITE-ON TECHNOLOGY (CHANGZHOU) CO., LTD. Fourth-tier subsidiary Purchase 1,852,264 1.48 About 90 days Cost-plus pricing No significant difference (668,427) (1.59)
LITE-ON SINGAPORE PTE. LTD. Subsidiary Purchase 22,425,492 17.97 About 90 days Cost-plus pricing No significant difference (8,041,771) (19.16)
LITE-ON, INC. Sub-subsidiary Purchase 110,121 0.09 About 90 days Cost-plus pricing No significant difference - -
Lite-On Overseas Trading Co., Ltd. Subsidiary Purchase 80,575,490 64.56 About 90 days Cost-plus pricing No significant difference (26,481,119) (63.10)
LITE-ON AUTOMOTIVE (WUXI) CO., LTD. Third-tier subsidiary Purchase 119,748 0.10 About 90 days Cost-plus pricing No significant difference (38,104) (0.09)
Diodes Incorporated Related party in
substance
Purchase 131,947 0.11 About 90 days Cost-plus pricing No significant difference (60,478) (0.14)
Philips & Lite-On Digital Solutions Corporation Philips & Lite-On Digital Solutions USA, Inc. Subsidiary Sale (7,545,018) (48.89) About 90 days Cost-plus pricing No significant difference 709,895 26.83
PLDS Germany GmbH Subsidiary Sale (660,967) (4.28) About 90 days Cost-plus pricing No significant difference 159,865 6.04
LITE-ON ELECTRONICS (TIANJIN) CO., LTD. Lite-On Overseas Trading Co., Ltd. Affiliate Sale (1,733,838) (100.00) About 90 days Cost-plus pricing No significant difference 263,976 100.00
LITE-ON NETWORK COMMUNICATION WUXI CHINA BRIDGE EXPRESS TRADING CO., LTD. Affiliate Sale (465,505) (1.96) About 90 days Cost-plus pricing No significant difference 174,774 13.93
(DONGGUAN) LIMITED Lite-On Overseas Trading Co., Ltd. Affiliate Sale (23,114,843) (97.36) About 90 days Cost-plus pricing No significant difference 1,031,369 82.21
LITE-ON OPTO TECHNOLOGY (CHANGZHOU) CO.,
LTD.
LITE-ON SINGAPORE PTE. LTD. Affiliate Sale (4,730,256) (100.00) About 90 days Cost-plus pricing No significant difference 1,145,681 100.00
LITEON LI SHIN TECHNOLOGY (GANZHOU) LTD. Lite-On Overseas Trading Co., Ltd. Affiliate Sale (747,181) (100.00) About 90 days Cost-plus pricing No significant difference 153,875 100.00
LITE-ON COMPUTER (CHANGZHOU) CO., LTD. LITE-ON SINGAPORE PTE. LTD. Affiliate Sale (562,182) (50.77) About 90 days Cost-plus pricing No significant difference 117,925 53.05
Lite-On Overseas Trading Co., Ltd. Affiliate Sale (545,214) (49.23) About 90 days Cost-plus pricing No significant difference 104,384 46.95
LITE-ON TECHNOLOGY (CHANGZHOU) CO., LTD. LITE-ON SINGAPORE PTE. LTD. Affiliate Sale (14,216,872) (59.73) About 90 days Cost-plus pricing No significant difference 3,016,583
54.31
Lite-On Overseas Trading Co., Ltd. Affiliate Sale (7,730,448) (32.48) About 90 days Cost-plus pricing No significant difference 1,867,396 33.62
LITE-ON TECHNOLOGY (XIANNING) CO., LTD. Lite-On Overseas Trading Co., Ltd. Affiliate Sale (721,870) (100.00) About 90 days Cost-plus pricing No significant difference 89,204 100.00
LITE-ON TECHNOLOGY (SHANGHAI) CO., LTD. LITE-ON TECHNOLOGY (CHANGZHOU) CO., LTD. Affiliate Sale (103,619) (1.47) About 90 days Cost-plus pricing No significant difference 34,958 1.36
Philips & Lite-On Digital Solutions (Shanghai) Co., Ltd. Affiliate Sale (353,611) (5.00) About 90 days Cost-plus pricing No significant difference 18,933 0.74
WUXI CHINA BRIDGE EXPRESS TRADING CO., LITE-ON OPTO TECHNOLOGY (CHANGZHOU) CO., LTD. Affiliate Sale (177,168) (3.98) About 90 days Cost-plus pricing No significant difference 29,153 2.36
LTD. LITE-ON TECHNOLOGY (CHANGZHOU) CO., LTD. Affiliate Sale (158,928) (3.57) About 90 days Cost-plus pricing No significant difference 27,504 2.22
LITE-ON ELECTRONICS (DONGGUAN) CO., LTD. WUXI CHINA BRIDGE EXPRESS TRADING CO., LTD. Affiliate Sale (581,982) (3.83) About 90 days Cost-plus pricing No significant difference 110,126 5.78
LITE-ON POWER ELECTRONIC INDIA PRIVATE
LIMITED
Affiliate Sale (228,253) (1.50) About 90 days Cost-plus pricing No significant difference 229,285 12.02
Lite-On Overseas Trading Co., Ltd. Affiliate Sale (14,372,652) (94.66) About 90 days Cost-plus pricing No significant difference 1,566,255 82.13
(Continued)

- 95 -
Company Name Related Party Nature of
Relationship
Transaction Details Abnormal Transaction Notes/Accounts
(Payable) or Receivable Note
Purchase/
Sale Amount
% to
Total Payment Terms Unit Price Payment Terms Ending Balance
% to
Total
SILITEK ELEC. (DONGGUAN) CO., LTD. Lite-On Overseas Trading Co., Ltd. Affiliate Sale $ (10,574,723) (95.07) About 90 days Cost-plus pricing No significant difference $ 3,195,579 93.82
LITE-ON POWER TECHNOLOGY (DONGGUAN)
CO., LTD.
LITE-ON ELECTRONICS COMPANY LIMITED Parent Sale (1,610,498) (100.00) About 90 days Cost-plus pricing No significant difference 399,920 100.00
LITE-ON ELECTRONICS H.K. LIMITED Lite-On Overseas Trading Co., Ltd. Affiliate Sale (308,930) (9.66) About 90 days Cost-plus pricing No significant difference 85,361 13.13
LITE-ON ELECTRONICS COMPANY LIMITED LITE-ON SINGAPORE PTE. LTD. Affiliate Sale (1,610,490) (100.00) About 90 days Cost-plus pricing No significant difference - -
HUIZHOU LI SHIN ELECTRONIC CO., LTD. Lite-On Overseas Trading Co., Ltd. Affiliate Sale (1,573,392) (79.52) About 90 days Cost-plus pricing No significant difference 199,367 71.73
LITE-ON ELECTRONICS (GUANGZHOU) LIMITED LITE-ON TECHNOLOGY (SHANGHAI) CO., LTD. Affiliate Sale (804,063) (2.00) About 90 days Cost-plus pricing No significant difference 315,421 4.75
Lite-On Overseas Trading Co., Ltd. Affiliate Sale (28,094,828) (70.01) About 90 days Cost-plus pricing No significant difference 6,194,405 93.29
LITEON OPTO TECHNOLOGY (GUANGZHOU) LTD. Lite-On Overseas Trading Co., Ltd. Affiliate Sale (1,644,749) (98.84) About 90 days Cost-plus pricing No significant difference 274,964 98.15
LiteON Auto Electric Technology (Guangzhou) Ltd. LITE-ON TECHNOLOGY (SHANGHAI) CO., LTD. Affiliate Sale (451,217) (99.57) About 90 days Cost-plus pricing No significant difference 79,809 100.00
LITEON-IT OPTO TECH (BH) CO., LTD. Lite-On Overseas Trading Co., Ltd. Affiliate Sale (10,939,256) (100.00) About 90 days Cost-plus pricing No significant difference 510,297 100.00
Lite-On Electronics (Thailand) Co., Ltd. LITE-ON SINGAPORE PTE. LTD. Affiliate Sale (3,511,429) (96.59) About 90 days Cost-plus pricing No significant difference 521,618 91.75
Lite-On Japan Ltd. Affiliate Sale (124,085) (3.41) About 90 days Cost-plus pricing No significant difference 46,920 8.25
LITE-ON SINGAPORE PTE. LTD. LITE-ON TECHNOLOGY (CHANGZHOU) CO., LTD. Affiliate Sale (125,330) (0.18) About 90 days Cost-plus pricing No significant difference 44,509 0.21
LITE-ON TECHNOLOGY (SHANGHAI) CO., LTD. Subsidiary Sale (2,762,142) (3.93) About 90 days Cost-plus pricing No significant difference 824,857 3.88
WUXI CHINA BRIDGE EXPRESS TRADING CO., LTD. Affiliate Sale (2,306,459) (3.28) About 90 days Cost-plus pricing No significant difference 841,406 3.95
LITE-ON ELECTRONICS H.K. LIMITED Affiliate Sale (3,174,900) (4.52) About 90 days Cost-plus pricing No significant difference 798,420 3.75
Lite-On Japan Ltd. Affiliate Sale (1,405,371) (2.00) About 90 days Cost-plus pricing No significant difference 337,770 1.59
LITE-ON, INC. Affiliate Sale (804,903) (1.14) About 90 days Cost-plus pricing No significant difference 147,469 0.69
LITE-ON TRADING USA, INC. Affiliate Sale (7,240,186) (10.30) About 90 days Cost-plus pricing No significant difference 3,204,473 15.06
LEOTEK ELECTRONICS USA LLC Affiliate Sale (1,077,087) (1.53) About 90 days Cost-plus pricing No significant difference 474,945 2.23
Lite-On Sales & Distribution, Inc. Affiliate Sale (171,950) (0.24) About 90 days Cost-plus pricing No significant difference 53,569 0.25
Lite-On Overseas Trading Co., Ltd. Affiliate Sale (179,435) (0.26) About 90 days Cost-plus pricing No significant difference 58,733 0.28
Lite-On (Guangzhou) Automotive Electronics Limited Affiliate Sale (108,879) (0.15) About 90 days Cost-plus pricing No significant difference 6,162 0.03
LITE-ON MOBILE INDÚ STRIA E COMÉRCIO DE
PLÁ STICOS LTDA.
Affiliate Sale (305,361) (0.43) About 90 days Cost-plus pricing No significant difference 103,023 0.48
LITE-ON AUTOMOTIVE ELECTRONICS MEXICO,
S.A. DE C.V.
LITE-ON SINGAPORE PTE. LTD. Affiliate Sale (380,016) (100.00) About 90 days Cost-plus pricing No significant difference 26,203 100.00
Lite-On Overseas Trading Co., Ltd. LITE-ON NETWORK COMMUNICATION (DONGGUAN)
LIMITED
Affiliate Sale (18,659,588) (9.48) About 90 days Cost-plus pricing No significant difference 2,765,250 5.60
LITEON LI SHIN TECHNOLOGY (GANZHOU) LTD. Affiliate Sale (297,837) (0.15) About 90 days Cost-plus pricing No significant difference 66,398 0.13
LITE-ON TECHNOLOGY (CHANGZHOU) CO., LTD. Affiliate Sale (13,339,843) (6.78) About 90 days Cost-plus pricing No significant difference 4,925,032 9.97
LITE-ON TECHNOLOGY (XIANNING) CO., LTD. Affiliate Sale (275,700) (0.14) About 90 days Cost-plus pricing No significant difference 13,689 0.03
LITE-ON ELECTRONICS (DONGGUAN) CO., LTD. Affiliate Sale (12,403,569) (6.30) About 90 days Cost-plus pricing No significant difference 952,751 1.93
SILITEK ELEC. (DONGGUAN) CO., LTD. Affiliate Sale (7,963,382) (4.05) About 90 days Cost-plus pricing No significant difference 1,172,956 2.37
I-SOLUTIONS LIMITED Affiliate Sale (128,868) (0.07) About 90 days Cost-plus pricing No significant difference 15,387 0.03
HUIZHOU LI SHIN ELECTRONIC CO., LTD. Affiliate Sale (765,428) (0.39) About 90 days Cost-plus pricing No significant difference 83,531 0.17
LITE-ON ELECTRONICS (GUANGZHOU) LIMITED Affiliate Sale (31,384,316) (15.94) About 90 days Cost-plus pricing No significant difference 5,555,797 11.24
LITEON OPTO TECHNOLOGY (GUANGZHOU) LTD. Affiliate Sale (1,086,080) (0.55) About 90 days Cost-plus pricing No significant difference 420,917 0.85
LiteON Auto Electric Technology (Guangzhou) Ltd. Affiliate Sale (174,703) (0.09) About 90 days Cost-plus pricing No significant difference 89,933 0.18
LITEON-IT OPTO TECH (BH) CO., LTD. Affiliate Sale (10,247,644) (5.21) About 90 days Cost-plus pricing No significant difference 2,414,764 4.89
LITE-ON SINGAPORE PTE. LTD. Affiliate Sale (19,466,827) (9.89) About 90 days Cost-plus pricing No significant difference 4,435,178 8.97
(Continued)

- 96 -
Company Name Related Party Nature of
Relationship
Transaction Details Abnormal Transaction Notes/Accounts
(Payable) or Receivable Note
Purchase/
Sale Amount
% to
Total Payment Terms Unit Price Payment Terms Ending Balance
% to
Total
Lite-On Overseas Trading Co., Ltd. Lite-On Semiconductor Corp. Associate Purchase $ 658,281 0.33 About 90 days Cost-plus pricing No significant difference $ (256,881) (0.57)
Diodes Incorporated Related party in
substance
Purchase 284,488 0.14 About 90 days Cost-plus pricing No significant difference (104,860) (0.23)
Lite-Space Technology Company Limited Associate Purchase 2,694,901 1.37 About 90 days Cost-plus pricing No significant difference (176,666) (0.39)
LITE-ON AUTOMOTIVE (WUXI) CO., LTD. LITE-ON TECHNOLOGY (SHANGHAI) CO., LTD. Affiliate Sale (174,307) (44.07) About 90 days Cost-plus pricing No significant difference 138,148 67.90
Lite-On (Guangzhou) Automotive Electronics Limited LITE-ON TECHNOLOGY (SHANGHAI) CO., LTD. Affiliate Sale (2,458,695) (44.94) About 90 days Cost-plus pricing No significant difference 1,076,131 66.30
LITE-ON SINGAPORE PTE. LTD. Affiliate Sale (2,394,096) (43.76) About 90 days Cost-plus pricing No significant difference 211,176 13.01
Shenzhen Lite-On Mobile Precision Molds Co., Ltd. GUANGZHOU LITE-ON MOBILE ELECTRONIC
COMPONENTS CO., LTD.
Affiliate Sale (211,560) (96.13) About 90 days Cost-plus pricing No significant difference - - (Note 2)
GUANGZHOU LITE-ON MOBILE ELECTRONIC
COMPONENTS CO., LTD.
Lite-On Mobile Oyj Affiliate Sale (146,220) (11.42) About 90 days Cost-plus pricing No significant difference - - (Note 2)
LITE-ON MOBILE PTE. LTD. Parent Sale (489,215) (38.22) About 90 days Cost-plus pricing No significant difference - - (Note 2)
ZHUHAI LITE-ON MOBILE TECHNOLOGY
COMPANY LTD.
LITE-ON MOBILE PTE. LTD. Affiliate Sale (134,240) (25.83) About 90 days Cost-plus pricing No significant difference - - (Note 2)
LITE-ON MOBILE PTE. LTD. GUANGZHOU LITE-ON MOBILE ELECTRONIC
COMPONENTS CO., LTD.
Subsidiary Sale (116,636) (15.35) About 90 days Cost-plus pricing No significant difference - -
Lite-On Japan Ltd. Lite-On Semiconductor Corp. Associate Sale JPY(1,326,471) (9.66) About 90 days Cost-plus pricing No significant difference JPY 303,321 12.56
Lite-On Semiconductor Corp. Associate Purchase JPY 2,183,924 17.98 About 90 days Cost-plus pricing No significant difference JPY (341,898) (11.19)
Silitech Technology Corp. Ltd. Silitech Technology Corporation Parent Sale US$ (23,253)
JPY (11,150)
(98.00) About 90 days No significant
difference
60-120 days US$ 8,303
JPY 3,730
100.00
ERU (78) ERU 39
Xurong Electronic (Shenzhen) Ltd. Silitech Technology Corp. Ltd. Parent Sale US$ (23,716)
JPY (11,150)
(66.00) About 90 days No significant
difference
60-90 days US$ 8,303
JPY 3,730
80.00
ERU (78) ERU 39
Note 1: All intercompany sales and purchases have been eliminated from consolidation.
Note 2: Sold in October 2018.
(Concluded)

- 97 -
TABLE 7
LITE-ON TECHNOLOGY CORPORATION AND SUBSIDIARIES
RECEIVABLES FROM RELATED PARTIES AMOUNTING TO AT LEAST NT$100 MILLION OR 20% OF THE PAID-IN CAPITAL
DECEMBER 31, 2018
(Amounts in Thousands of New Taiwan Dollars or in Thousands of Foreign Currencies)
Company Name Related Party Nature of
Relationship
Ending Balance
of Notes
Receivable-inter
Ending Balance
of Trade
Receivables-inter
Ending Balance
of Other
Receivables-inter
Turnover
Rate
Overdue Amounts
Received in
Subsequent
Period
Allowance for
Bad Debts Amount Action Taken
Lite-On Technology Corporation Philips & Lite-On Digital Solutions Corporation Subsidiary $ - $ 3,797,699 $ 2,997 3.23 $ - - $ 2,161,668 $ -
LITE-ON TECHNOLOGY (CHANGZHOU) CO., LTD. Fourth-tier
subsidiary
- 460,697 144 2.97 - - - -
LITE-ON SINGAPORE PTE. LTD. Subsidiary - 906,503 86,352 5.53 - - 58,064 -
Lite-On Japan Ltd. Subsidiary - 159,394 26,273 4.53 - - 24,360 -
LITE-ON TRADING USA, INC. Sub-subsidiary - 2,046,981 10,384 2.58 - - 456,286 -
Lite-On Sales & Distribution Inc. Sub-subsidiary - 223,843 101 1.74 - - 32,189 -
Lite-On Overseas Trading Co., Ltd. Subsidiary - 3,233,971 86,112 - - - 1,826,629 -
LITE-ON CHINA HOLDING CO. LTD. Sub-subsidiary - 186,249 - 0.97 - - - -
Philips & Lite-On Digital Solutions Corporation Philips & Lite-On Digital Solutions USA, Inc. Subsidiary - 709,895 3,496 6.84 - - 217,348 -
PLDS Germany GmbH Subsidiary - 159,865 - 3.45 - - 29,203 -
LITE-ON ELECTRONICS (TIANJIN) CO., LTD. Lite-On Overseas Trading Co., Ltd. Affiliate - 263,976 - 5.84 - - 137,621 -
LITE-ON NETWORK COMMUNICATION (DONGGUAN)
LIMITED
WUXI CHINA BRIDGE EXPRESS TRADING CO.,
LTD.
Affiliate - 174,774 - 3.35 - - 53,799 -
LITE-ON ELECTRONICS (GUANGZHOU) CO., LTD. Affiliate - 29,577 79,384 3.30 - - 5 -
Lite-On Overseas Trading Co., Ltd. Affiliate - 1,031,369 - 25.45 - - 916,272 -
LITE-ON OPTO TECHNOLOGY (CHANGZHOU) CO., LITE-ON SINGAPORE PTE. LTD. Affiliate - 1,145,681 7,224 4.38 - - 545,159 -
LITEON LI SHIN TECHNOLOGY (GANZHOU) LTD. Lite-On Overseas Trading Co., Ltd. Affiliate - 153,875 - 9.71 - - 57,854 -
LITE-ON COMPUTER (CHANGZHOU) CO., LTD. LITE-ON SINGAPORE PTE. LTD. Affiliate - 117,925 - 4.73 - - - -
Lite-On Overseas Trading Co., Ltd. Affiliate - 104,384 - 6.53 - - 62,384 -
LITE-ON TECHNOLOGY (CHANGZHOU) CO., LTD. CHANGZHOU LEOTEK NEW ENERGY TRADE
LIMITED
Affiliate - - 139,515 - - - 83 -
LITE-ON SINGAPORE PTE. LTD. Affiliate - 3,016,583 - 4.51 - - 729,521 -
Lite-On Overseas Trading Co., Ltd. Affiliate - 1,867,396 - 4.11 - - 1,041,518 -
LITE-ON TECHNOLOGY (SHANGHAI) LTD. LITE-ON AUTOMOTIVE (WUXI) CO., LTD. Affiliate - - 154,241 - - - - -
LITE-ON ELECTRONICS (DONGGUAN) CO., LTD. WUXI CHINA BRIDGE EXPRESS TRADING CO.,
LTD.
Affiliate - 110,126 - 4.52 - - 32,721 -
LITE-ON POWER ELECTRONIC INDIA PRIVATE
LIMTED
Affiliate - 229,285 - 1.98 18,135 - - -
Lite-On Overseas Trading Co., Ltd. Affiliate - 1,566,255 - 8.69 - - 1,566,255 -
SILITEK ELEC. (DONGGUAN) CO., LTD. Lite-On Overseas Trading Co., Ltd. Affiliate - 3,195,579 7,887 3.71 - - 1,030,264 -
LITE-ON POWER TECHNOLOGY (DONGGUAN) CO., LTD. LITE-ON ELECTRONICS COMPANY LIMITED Affiliate - 399,920 - 6.71 - - 399,920 -
LITE-ON ELECTRONICS H.K. LIMITED LITE-ON SINGAPORE PTE. LTD. Affiliate - - 401,259 - - - 401,259 -
HUIZHOU LI SHIN ELECTRONIC CO., LTD. Lite-On Overseas Trading Co., Ltd. Affiliate - 199,367 - 15.78 - - 147,714 -
(Continued)

- 98 -
Company Name Related Party Nature of
Relationship
Ending Balance
of Notes
Receivable-inter
Ending Balance
of Trade
Receivables-inter
Ending Balance
of Other
Receivables-inter
Turnover
Rate
Overdue Amounts
Received in
Subsequent
Period
Allowance for
Bad Debts Amount Action Taken
LITE-ON ELECTRONICS (GUANGZHOU) LIMITED LITE-ON TECHNOLOGY (SHANGHAI) CO., LTD. Affiliate $ - $ 315,421 $ 3,408 3.44 $ - - $ 96,912 $ -
Lite-On Overseas Trading Co., Ltd. Affiliate - 6,194,405 - 4.53 - - 2,506,985 -
LITEON OPTO TECHNOLOGY (GUANGZHOU) LTD. Lite-On Overseas Trading Co., Ltd. Affiliate - 274,964 - 6.49 - - 129,176 -
LITEON-IT OPTO TECH (BH) CO., LTD. Lite-On Overseas Trading Co., Ltd. Affiliate - 510,297 - 9.21 - - 466,239 -
Lite-On Electronics (Thailand) Co., Ltd. LITE-ON SINGAPORE PTE. LTD. Affiliate - 521,618 8,192 4.88 - - 257,193 -
LITE-ON SINGAPORE PTE. LTD. LITE-ON TECHNOLOGY (SHANGHAI) CO., LTD. Subsidiary - 824,857 - 3.03 - - 297,202 -
WUXI CHINA BRIDGE EXPRESS TRADING CO.,
LTD.
Affiliate - 841,406 - 2.72 - - 221,861 -
LITE-ON ELECTRONICS H.K. LIMITED Affiliate - 798,420 69 3.75 - - 55,820 -
Lite-On Japan Ltd. Affiliate - 337,770 6,992 3.38 - - 33,290 -
LITE-ON, INC. Affiliate - 147,469 578 4.79 - - 15,193 -
LITE-ON TRADING USA, INC. Affiliate - 3,204,473 - 2.85 - - 617,680 -
LEOTEK ELECTRONICS USA LLC Affiliate - 474,945 - 2.82 - - 218,835 -
LITE-ON MOBILE INDÚ STRIA E COMÉRCIO DE
PLÁ STICOS LTDA.
Affiliate - 103,023 1,909 3.85 3,538 - 31,077 -
LITE-ON MOBILE PTE. LTD. Affiliate - - 1,228,959 - - - - -
G&W TECHNOLOGY (BVI) LIMITED G&W TECHNOLOGY LIMITED Subsidiary - - 139,315 - - - - -
Lite-On Overseas Trading Co., Ltd. LITE-ON NETWORK COMMUNICATION
(DONGGUAN) LIMITED
Affiliate - 2,765,250 - 6.87 - - 1,453,353 -
LITE-ON TECHNOLOGY (CHANGZHOU) CO., LTD. Affiliate - 4,925,032 - 2.76 - - 14,073 -
LITE-ON ELECTRONICS (DONGGUAN) CO., LTD. Affiliate - 952,751 - 8.56 - - 916,759 -
SILITEK ELEC. (DONGGUAN) CO., LTD. Affiliate - 1,172,956 981 7.72 - - 801,850 -
LITE-ON ELECTRONICS (GUANGZHOU) LIMITED Affiliate - 5,555,797 - 5.51 - - 1,861,166 -
LITEON OPTO TECHNOLOGY (GUANGZHOU) LTD. Affiliate - 420,917 3,974 2.76 - - 94,693 -
LiteON Auto Electric Technology (Guangzhou) Ltd. Affiliate - 89,933 35,906 2.26 - - 30,112 -
LITEON-IT OPTO TECH (BH) CO., LTD. Affiliate - 2,414,764 247 3.16 - - 662 -
LITE-ON SINGAPORE PTE. LTD. Affiliate - 4,435,178 23,041 3.16 - - 350,425 -
LITE-ON AUTOMOTIVE (WUXI) CO., LTD. LITE-ON TECHNOLOGY (SHANGHAI) CO., LTD. Affiliate - 138,148 125 1.09 - - 39,778 -
Lite-On (Guangzhou) Automotive Electronics Limited LITE-ON TECHNOLOGY (SHANGHAI) CO., LTD. Affiliate - 1,076,131 35,339 2.57 - - 307,439 -
LITE-ON SINGAPORE PTE. LTD. Affiliate - 211,176 26 10.92 - - 206,775 -
Silitech Technology Corp. Ltd. Silitech Technology Corporation Parent - US$ 8,303
JPY 3,730
- 2.72 - - US$ 2,200
JPY 404
-
ERU 39
Xurong Electronic (Shenzhen) Ltd. Silitech Technology Corp. Ltd. Parent - US$ 8,303
JPY 3,730
- 2.78 - - US$ 2,200
JPY 403
-
ERU 39
(Concluded)

- 99 -
TABLE 8
LITE-ON TECHNOLOGY CORPORATION AND SUBSIDIARIES
NAMES, LOCATIONS, AND RELATED INFORMATION OF INVESTEES OVER WHICH THE PARENT COMPANY EXERCISES SIGNIFICANT INFLUENCE
FOR THE YEAR ENDED DECEMBER 31, 2018 (Amounts in Thousands of New Taiwan Dollars or Thousands of Foreign Currencies)
Investor Company Investee Company Location Main Businesses and Products
Original Investment Amount Balance as of December 31, 2018
Net Income
(Losses) of the
Investee
Share of
Profits/Losses of
Investee
Note December 31,
2018
December 31,
2017
Shares
(In Thousands)
Percentage
of
Ownership
(%)
Carrying Value
Lite-On Technology Corporation Silitech Technology Corporation New Taipei City,
Taiwan
Manufacture and sale of modules and plastic products $ 324,685 $ 324,685 60,757 33.87 $ 1,274,728 $ (33,816) $ (11,453) Subsidiary
Lite-On Integrated Service Inc. Taipei City, Taiwan Information outsourcing and system integrate 25,886 25,886 3,400 100.00 48,323 6,079 6,079 Subsidiary
DragonJet Corporation New Taipei City,
Taiwan
Manufacture and sale of computer peripherals, printers,
digital cameras, modules and plastic products
1,069,080 1,069,080 26,727 29.62 921,780 (158,196)
(47,093)
Associate
(Note 1)
Lite-On Capital Corporation Taipei City, Taiwan Investment activities 4,096,367 4,096,367 209,545 100.00 1,453,527 63,571 19,433 Subsidiary
LITE-ON ELECTRONICS H.K. LIMITED Hong Kong Sale of LED optical products 7,339,481 7,339,481 17,865 100.00 16,089,012 HK$ 517,220 2,113,651 Subsidiary
Lite-On Electronics (Thailand) Co., Ltd. Thailand Manufacture and sale of LED optical products 529,106 529,106 5,030 100.00 1,776,480 THB 156,975 146,897 Subsidiary
Lite-On Japan Ltd. Japan Sale of LED optical products and power supplies 248,305 248,305 6,162 49.49 342,959 JPY (17,352) (2,450) Subsidiary
Lite-On International Holding Co., Ltd. British Virgin Islands Investment activities US$ 357,625 US$ 335,825 357,625 100.00 18,000,208 US$ 7,012 (104,680) Subsidiary
LTC GROUP LTD. British Virgin Islands Investment activities $ 1,098,752 $ 1,098,752 32,916 100.00 187,653 US$ 631 (992) Subsidiary
LITE-ON TECHNOLOGY USA, INC. USA Investment activities US$ 55,172 US$ 55,172 470 100.00 2,507,215 US$ 3,802 97,919 Subsidiary
LITE-ON ELECTRONICS (EUROPE)
LIMITED
United Kingdom Manufacture and sale of power supplies $ 44,559 $ 44,559 300 100.00 59,784 GBP 144 5,800 Subsidiary
Lite-On Technology (Europe) B.V. Netherlands Market research and after-sales service 2,543,184 2,543,184 331 54.00 425,694 EUR 87 1,656 Subsidiary
Lite-On Overseas Trading Co., Ltd. British Virgin Islands Merchandising business 168,947 168,947 5,143 100.00 235,695 US$ (1,536)
(46,680)
Subsidiary
LITE-ON SINGAPORE PTE. LTD. Singapore Manufacture and supply computer peripheral products US$ 63,788 US$ 63,788 51,777 100.00 12,106,016 US$ 303,121 8,853,757 Subsidiary
Lite-On Semiconductor Corp. New Taipei City,
Taiwan
Manufacture of image sensor and rectifier $ 773,618 $ 773,618 57,204 18.32 1466,975 $ 871,904 158,698 Associate
(Note 1)
LITE-ON VIETNAM CO., LTD. Vietnam Electronic contract manufacturing US$ 12,000 US$ 12,000 - 100.00 353,641 US$ 382 11,527 Subsidiary
LI SHIN INTERNATIONAL ENTERPRISE
CORPORATION
British Virgin Islands Manufacture and sale of computer and appliance
components
$ 56,929 $ 56,929 1,748 100.00 4,095 US$ 2,186 66,463 Subsidiary
EAGLE ROCK INVESTMENT LTD. British Virgin Islands Import and export business and investment activities 341 341 10 100.00 1,253,972 US$ 4,660 142,277 Subsidiary
Canfield Ltd. Apia, Samoa Import and export business and investment activities 7,142 7,142 200 33.33 3,884 US$ (83) (858) Associate
LITE-ON MOBILE PTE. LTD. Singapore Manufacture and sale of mobile phone modules and
design for assembly line
EUR 457,014 EUR 457,014 427,531 100.00 3,785,919 US$ (48,732)
(1,642,575)
Subsidiary
LET (HK) LIMITED Hong Kong Sale of optical disc drives $ 251,322 $ 251,322 62,060 100.00 40,046 HK$ 2,102 8,219 Subsidiary
HIGH YIELD GROUP CO., LTD. British Virgin Islands Holding company 2,271,806 2,271,806 68,138 100.00 5,896,949 US$ 5,368 432,110 Subsidiary
Lite-On Information Technology B.V. Netherlands Market research and customer service 1,163,591 1,163,591 11,018 100.00 16,243 EUR (14) (480) Subsidiary
Philips & Lite-On Digital Solutions
Corporation
Taiwan Sale of optical disc drives 267,113 267,113 17,150 49.00 300,513 $ 62,572 30,660 Subsidiary
Lite-Space Technology Company Limited Hong Kong Sale of computer components 165,498 149,968 5,600 46.67 95,942 US$ 545 6,755 Associate
LITE-ON AUTOMOTIVE ELECTRONICS
MEXICO, S.A. DE C.V.
Mexico Production, manufacture, sale, import and export of
photovoltaic device, key electronic components,
telecommunications equipment, information
technology equipment, semiconductor applications,
general lighting, automotive electronics, renewable
energy products and systems and maintenance of
automotive industry
US$ 4,950 US$ 4,950 146 99.00 53,776 MXN (22,896) (36,185) Subsidiary
Lite-On Automotive Electronics (Europe)
B.V.
Netherlands Sale of automotive parts and other electronic products EUR - EUR 90 - - - EUR 4 160 Subsidiary
(Note 4)
(Continued)

- 100 -
Investor Company Investee Company Location Main Businesses and Products
Original Investment Amount Balance as of December 31, 2018
Net Income
(Losses) of the
Investee
Share of
Profits/Losses of
Investee
Note December 31,
2018
December 31,
2017
Shares
(In Thousands)
Percentage
of
Ownership
(%)
Carrying Value
Lite-On Technology Corporation Lite-On Automotive International (Cayman)
Co., Ltd.
Cayman Investment activities US$ 100,626 US$ 100,626 11,967 100.00 $ 2,386,776 US$ 6,351 $ 180,993 Subsidiary
KBW-LEOTEK Jordan Private Shareholding
Ltd.
Jordan Investment activities US$ 69 US$ 69 49 49.00 (119) JOD (51) (4,545) Subsidiary
KBW-LITEON Jordan Private Shareholding
Limited
Jordan Production and manufacture of energy-saving lights and
project construction and maintenance
US$ 30,786 US$ 6,069 21,797 99.77 1,210,895 JOD 2,848 119,341 Subsidiary
LITE-ON POWER ELECTRONIC INDIA
PRIVATE LIMITED
India Manufacture and sale of phone chargers and power
supplies
INR 403,920 INR 403,920 40,392 99.00 96,022 INR (147,011) (64,563) Subsidiary
SKYLA CORPORATION Taiwan Manufacture and sale of medical equipment $ 200,000 $ 500 20,000 64.94 199,533 $ (973) (5,236) Subsidiary
Lite-On Capital Corporation Silitech Technology Corporation New Taipei City,
Taiwan
Manufacture and sale of modules and plastic products 115,572 115,572 1,153 0.64 105,645 (33,816) - Subsidiary
Lite-On Green Technologies Inc. Taipei City, Taiwan Manufacture and wholesale of electronic components and
energy technology services
1,040,000 1,040,000 84,000 100.00 242,278 (4,867) - Subsidiary
Lite-On Green Energy (HK) Limited Hong Kong Investment activities US$ 3,100 US$ 3,000 3,100 100.00 6,425 US$ (2) - Subsidiary
Lite-On Technology (Europe) B.V. Netherlands Market research and after-sales service $ 2,126,479 $ 2,126,479 282 46.00 360,777 EUR 87 - Subsidiary
Lite-On Semiconductor Corp. New Taipei City,
Taiwan
Manufacture of image sensor and rectifier - - 6,486 2.08 194,868 $ 871,904 - Associate
(Note 1)
LITE-ON GREEN ENERGY (SINGAPORE)
PTE. LTD.
Singapore Investment activities 227,434 227,434 3,458 100.00 105,953 EUR 21 - Subsidiary
Five Dimension Co., Ltd. Japan Development, manufacture and sale of cell phone and
camera lens modules
JPY 172,180 JPY 172,180 9 39.10 - -
- Associate
(Note 2)
Lite-On Green Technologies Inc. Lite-On Green Technologies B.V. Netherlands Solar energy engineering EUR 16,020 EUR 16,020 30 100.00 207,266 EUR (11) - Subsidiary
Lite-On Green Technologies (HK) Limited Hong Kong Solar energy engineering US$ 860 US$ 760 4,000 100.00 2,408 US$ (63) - Subsidiary
LITE-ON GREEN ENERGY
(SINGAPORE) PTE. LTD.
Lite-On Green Energy B.V. Netherlands Investment activities EUR 2,500 EUR 2,500 9,140 100.00 EUR 629 EUR (8) - Subsidiary
Lite-On Green Technologies B.V. Kompaktsolar GmbH Berlin, Germany Solar energy engineering EUR 401 EUR 401 51 51.00 EUR - EUR - - Associate
CHINA BRIDGE (CHINA) CO.,
LTD.
WUXI CHINA BRIDGE EXPRESS
TRADING CO., LTD.
Wuxi, China Express and sale of power supplies, printers, display
devices and scanners
CNY 36,244 CNY 36,244 - 100.00 CNY 103,087 CNY (8,810) - Subsidiary
LITE-ON OPTO TECHNOLOGY
(CHANGZHOU) CO., LTD.
Changzhou, China Development, manufacture of new-type electronic
components and provide technology consulting
services, maintenance equipment and after-sales
services
CNY 85,015 CNY 85,015 - 12.59 CNY 80,271 CNY 44,812 - Subsidiary
LITE-ON ELECTRONICS
(GUANGZHOU) LIMITED
YANTAI LITE-ON MOBILE ELECTRONIC
COMPONENTS CO., LTD.
Yantai, China Development, design, manufacture, sale of phone case
and components and provide technical support,
business management information consult, goods and
technology import and export.
CNY 37,504 CNY - - 100.00 CNY 35,043 CNY (11,847) - Subsidiary
LITE-ON TECHNOLOGY
(JIANGSU) CO., LTD.
LITE-ON TECHNOLOGY (CHANGZHOU)
CO., LTD.
Changzhou, China Development, manufacture, sale and installation of
power supplies and transformers and provision
technology consulting services, maintenance
equipment and after-sales services
CNY 527,134 CNY 527,134 - 100.00 CNY 877,834 CNY 58,290 - Subsidiary
LITE-ON OPTO TECHNOLOGY
(CHANGZHOU) CO., LTD.
Changzhou, China Development, manufacture and sale of new-type
electronic components and LED and provision
technology consulting services, maintenance
equipment and after-sales services
CNY 503,977 CNY 503,977 - 87.41 CNY 557,305 CNY 44,812 - Subsidiary
LITE-ON MEDICAL DEVICE
(CHANGZHOU) LTD.
Changzhou, China Manufacture and sale of medical equipment CNY 30,640 CNY 30,640 - 100.00 CNY 23,603 CNY - - Subsidiary
LITE-ON COMPUTER (CHANGZHOU)
CO., LTD.
Changzhou, China Design, development, manufacture and sale of computer
laptop keyboards and components and provision
technology consulting services and after-sales services
CNY 55,924 CNY 55,924 - 100.00 CNY 54,033 CNY 1,530 - Subsidiary
Lite-On Automotive Electronics (CZ) Co. Changzhou, China Manufacture, sale and processing of electronic products CNY 223,746 CNY - - 100.00 CNY 223,132 CNY (614) - Subsidiary
Lite-On Automotive International
(Cayman) Co., Ltd.
LITE-ON AUTOMOTIVE HOLDINGS
(HONG KONG) CO., LIMITED
Hong Kong Investment activities HK$ 42,009 HK$ 41,384 101,250 100.00 US$ 77,330 HK$ 49,959 - Subsidiary
(Continued)

- 101 -
Investor Company Investee Company Location Main Businesses and Products
Original Investment Amount Balance as of December 31, 2018
Net Income
(Losses) of the
Investee
Share of
Profits/Losses of
Investee
Note December 31,
2018
December 31,
2017
Shares
(In Thousands)
Percentage
of
Ownership
(%)
Carrying Value
HIGH YIELD GROUP CO.,
LTD.
LITE-ON IT INTERNATIONAL (HK)
LIMITED
Hong Kong Sale of optical disc drives US$ 102,400 US$ 102,400 102,400 100.00 US$ 203,062 US$ 5,374 $ - Subsidiary
Lite-On Information Technology
B.V.
Lite-On Information Technology GmbH Germany Sale of optical disc drives EUR 25 EUR 25 - 100.00 EUR 42 EUR 2 - Subsidiary
Philips & Lite-On Digital Philips & Lite-On Digital Solutions USA, Inc. USA Sale of optical disc drives $ 33 $ 33 1 100.00 $ 233,600 US$ (53) - Subsidiary
Solutions Corporation PLDS Netherlands B.V. Netherlands Sale and design of optical disc drives 381,221 381,221 15 100.00 48,391
EUR 11 - Subsidiary
PLDS Germany GmbH Germany Development and sale of modules of automotive
recorders
1,326,996 1,326,996 - 100.00 970,012
EUR 601 - Subsidiary
Philips & Lite-On Digital Solutions Korea
Ltd.
South Korea Sale of optical disc drives 15,376 15,376 18 100.00 34,555
KBW 37,572 - Subsidiary
KBW-LEOTEK Jordan Private
Shareholding Limited
LEOTEK, PSC (formerly: KBW-LEOTEK
FACTORY Jordan Private Shareholding
Limited)
Jordan Production and manufacture of energy-saving lights JOD 30 JOD 30 30 60.00 JOD 4 JOD (60)
-
LITE-ON TECHNOLOGY USA,
INC.
LITE-ON, INC. USA Sales data processing business of optoelectronic products
and power supplies
US$ 3,000 US$ 3,000 3,000 100.00 US$ 5,785 US$ 608 - Subsidiary
LITE-ON TRADING USA, INC. California, USA Sale of optical products US$ 31,500 US$ 31,500 315 100.00 US$ 36,766 US$ 2,464 - Subsidiary
LEOTEK ELECTRONICS USA LLC USA Sale of LED products US$ 5,792 US$ 5,792 - 100.00 US$ 12,604 US$ 1,493 - Subsidiary
POWER INNOVATIONS
INTERNATIONAL, INC.
USA Development, design and manufacture of power control
and energy management
US$ 15,756 US$ 15,756 12,916 95.25 US$ 16,676 US$ (850) - Subsidiary
Lite-On Sales & Distribution, Inc. USA Sale of optical disc drives US$ 4,765 US$ 4,765 1 100.00 US$ 3,311 US$ 284 - Subsidiary
LITE-ON TECHNOLOGY SERVICE, INC. USA After-sales service of optical products US$ 1,500 US$ 1,500 1 100.00 US$ 1,790 US$ 74 - Subsidiary
Lite-On International Holding
Co., Ltd.
LITE-ON CHINA HOLDING CO. LTD. British Virgin Islands Manufacture and sale of computer cases US$ 421,242 US$ 399,442 421,242 100.00 US$ 620,061 US$ 7,017 - Subsidiary
LITE-ON SINGAPORE PTE. LiteStar JV Holding (BVI) Co., Ltd. British Virgin Islands Investment activities US$ 27,000 US$ 27,000 2 17.59 US$ 24,823 $ 53,568 - Associate
LTD. LITE-ON AUTOMOTIVE ELECTRONICS
MEXICO, S.A. DE C.V.
Mexico Production, manufacture, sale, import and export of
photovoltaic device, key electronic components,
telecommunications equipment, information
technology equipment, semiconductor applications,
general lighting, automotive electronics, renewable
energy products and systems and maintenance of
automotive industry
US$ 50 US$ 50 1 1.00 US$ 18 MXN (22,896) - Subsidiary
LITE-ON POWER ELECTRONIC INDIA
PRIVATE LIMITED
India Manufacture and sale of phone chargers and power
supplies
INR 4,080 INR 4,080 408 1.00 US$ 32 INR (147,011) - Subsidiary
LITE-ON TECHNOLOGY
(SHANGHAI) CO., LTD.
LITE-ON INTELLIGENT TECHNOLOGY
(YENCHENG) CORP.
Yancheng, China Wholesale, import and export and installation of street
lights, signal lights, scenery lights and new-type
electronic components
CNY 19,427 CNY 19,427 - 100.00 CNY 30,077 CNY (846)
- Subsidiary
LTC GROUP LTD. TITANIC CAPITAL SERVICES LTD. British Virgin Islands Investment activities $ 529,106 $ 529,106 8,655 100.00 US$ 575 US$ (67) - Subsidiary
LTC INTERNATIONAL LTD. British Virgin Islands Manufacture and sale of system products 485,514 485,514 15,120 100.00 US$ 11,922 US$ 638 - Subsidiary
Lite-On Technology (Europe)
B.V.
Lite-On (Finland) Oy Finland Manufacture and sale of mobile phone modules and
design for assembly line
EUR 76,674 EUR 76,674 3 100.00 EUR 19,010 EUR 52 - Subsidiary
Lite-On (Finland) Oy Lite-On Mobile Oyj Finland Manufacture and sale of mobile phone modules and
design for assembly line
EUR 196,618 EUR 196,618 52,937 100.00 EUR 18,720 EUR 52 - Subsidiary
LITE-ON CHINA HOLDING
CO., LTD.
LITE-ON ELECTRONICS COMPANY
LIMITED
Hong Kong Investment activities US$ 375,760 US$ 360,760 3,083,467 100.00 US$ 596,671 HK$ 106,256 - Subsidiary
YET FOUNDATE LIMITED Hong Kong Manufacture of plastic and computer peripheral products CNY 73,220 CNY 73,220 68,430 100.00 US$ 17,793 CNY 5,316 - Subsidiary
I-SOLUTIONS LIMITED British Virgin Islands Original equipment manufacturer of electronic products US$ 1,500 US$ 1,500 1,500 100.00 US$ 1,500 US$ - - Subsidiary
FORDGOOD ELECTRONIC LIMITED Hong Kong Import and export and real estate business US$ 12,666 US$ 13,336 100,150 100.00 US$ 15,868 HK$ 17,147 Subsidiary
G&W TECHNOLOGY (BVI) LIMITED British Virgin Islands Real estate management US$ 3,900 US$ 3,900 3,900 50.00 US$ 4,315 US$ 525 - Subsidiary
(Continued)

- 102 -
Investor Company Investee Company Location Main Businesses and Products
Original Investment Amount Balance as of December 31, 2018
Net Income
(Losses) of the
Investee
Share of
Profits/Losses of
Investee
Note December 31,
2018
December 31,
2017
Shares
(In Thousands)
Percentage
of
Ownership
(%)
Carrying Value
G&W TECHNOLOGY (BVI)
LIMITED
G&W TECHNOLOGY LIMITED Hong Kong Leasing business US$ 65 US$ 65 500 100.00 US$ 1,162 US$ 565 $ - Subsidiary
Silitech Technology Corporation Lite-On Japan Ltd. Japan Sale of LED optical products and power supplies JPY 197,040 JPY 197,040 980 7.87 $ 71,176 JPY (17,352) - Subsidiary
Silitech (BVI) Holding Ltd. British Virgin Islands Investment activities US$ 95,182 US$ 95,182 95,182 100.00 3,360,288 US$ 848 - Subsidiary
Silitech (BVI) Holding Ltd. Silitech (Bermuda) Holding Ltd. Bermuda Investment activities US$ 95,132 US$ 95,132 95,132 100.00 US$ 109,524 US$ 850 - Subsidiary
Silitech (Bermuda) Holding Ltd. Silitech (Hong Kong) Holding Ltd. Hong Kong Investment activities US$ 77,200 US$ 77,200 77,200 100.00 US$ 57,752 CNY 23,275 - Subsidiary
Silitech Technology Corporation Sdn. Bhd. Malaysia Manufacture of computer peripheral products US$ 5,632 US$ 5,632 21,400 100.00 US$ 14,444 CNY 11,944 - Subsidiary
Silitech Technology Corporation Ltd. Hong Kong Manufacture of plastic and computer peripheral products US$ 8,000 US$ 8,000 62,400 100.00 US$ 22,096 CNY (43,812) - Subsidiary
Silitech International (India) Private Ltd. India Development, manufacture and sale of automotive parts US$ 3,002 US$ 3,002 4,173 100.00 US$ - INR - - Subsidiary
(Note 5)
Lite-On Japan Ltd. L&K Industries Philippines, Inc. Philippines Import and export business of electronic components JPY 261,944 JPY 261,944 1,000 100.00 JPY 261,944 JPY (242,858) - Subsidiary
(Note 3)
Lite-On Japan (H.K.) Limited Hong Kong Import and export business of electronic components JPY 70,000 JPY 70,000 50 100.00 JPY 70,000 JPY 61,685 - Subsidiary
(Note 3)
Lite-On Japan (Korea) Co., Ltd. South Korea Import and export business of electronic components JPY 22,593 JPY 22,593 20 100.00 JPY 22,593 JPY - - Subsidiary
(Note 3)
LITE-ON JAPAN (Thailand) CO., LTD Thailand Import and export business of electronic components JPY 65,939 JPY 65,939 200 100.00 JPY 65,939 JPY 55,022 - Subsidiary
(Note 3)
Lite-On Japan (H.K.) Limited NL (SHANGHAI) CO., LTD. China Import and export business of electronic components JPY 35,655 JPY 35,655 30 100.00 JPY 35,655 JPY 27,139 - Subsidiary
(Note 3)
Lite-On Mobile Oyj Lite-On Mobile Sweden AB Sweden Manufacture and sale of mobile phone modules and
design for assembly line
EUR 20,551 EUR 20,551 20 100.00 EUR 350 SEK (1) - Subsidiary
LITE-ON MOBILE INDÚ STRIA E
COMÉRCIO DE PLÁ STICOS LTDA.
Brazil Manufacture and sale of mobile phone modules and
design for assembly line
EUR 2,509 EUR 2,509 6,507 2.97 EUR 387 BRL 10,504 - Subsidiary
LITE-ON MOBILE INDIA PRIVATE
LIMITED
India Manufacture and sale of mobile phone modules and
design for assembly line
EUR 4,436 EUR 4,436 33,536 11.59 EUR 2,286 INR 58,833 - Subsidiary
LITE-ON MOBILE PTE. LTD. LITE-ON MOBILE INDÚ STRIA E
COMÉRCIO DE PLÁ STICOS LTDA.
Brazil Manufacture and sale of mobile phone modules and
design for assembly line
US$ 108,302 US$ 108,302 212,824 97.03 US$ 14,505 BRL 10,504 - Subsidiary
LITE-ON YOUNG FAST PTE. LTD. Singapore Investment activities US$ 7,864 US$ 7,864 10 100.00 US$ 3,983 US$ 835 - Subsidiary
Yamada-Lom Fabricacao De Artefatos De
Material Plastico Ltda.
Brazil Manufacture and sale of mobile phone modules and
design for assembly line
US$ 540 US$ 540 - 25.00 US$ 255 BRL 2,524 - Associate
LITE-ON MOBILE INDIA PRIVATE
LIMITED
India Manufacture and sale of mobile phone modules and
design for assembly line
US$ 47,239 US$ 47,239 255,730 88.41 US$ 19,973 INR 58,833 - Subsidiary
Note 1: Information on net income (loss) of investee has not been approved by its board of directors, so it is shown as an estimated amount. For final amount of net income (loss), refer to financial statements published on the market observation post system.
Note 2: The investee is filing for bankruptcy and impairment loss has already been recognized.
Note 3: The sub-subsidiary of the parent company; the investment income/losses and adjustment for changes in equities using the equity method are recognized by the parent company.
Note 4: Sold in July 2018.
Note 5: Dissolved upon liquidation in October 2018.
Note 6: Refer to Table 9 for information on investments in mainland China.
(Concluded)

- 103 -
TABLE 9
LITE-ON TECHNOLOGY CORPORATION AND SUBSIDIARIES
INFORMATION ON INVESTMENT IN MAINLAND CHINA
FOR THE YEAR ENDED DECEMBER 31, 2018
(Amounts in Thousands of New Taiwan Dollars or Thousands of Foreign Currencies)
Investor Company Investee Company Main Businesses and Products Total Amount of
Paid-in Capital
(Note 2)
Method of
Investment
Accumulated
Outflow of
Investment from
Taiwan as of
January 1, 2018
Investment of Flows Accumulated
Outflow of
Investment from
Taiwan as of
December 31, 2018
Net Income
(Losses) of the
Investee Company
(Note 2)
Percentage
of
Ownership
Share of
Profits/Losses
(Note 2)
Carrying
Amount as of
December 31, 2018
(Note 2)
Accumulated
Inward
Remittance of
Earnings as of
December 31, 2018
Note Outflow Inflow
Lite-On Technology
Corporation
LITE-ON COMPUTER TECHNOLOGY
(DONGGUAN) CO., LTD.
Manufacture and sale of display device $ 502,906
(US$ 16,400 )
Note 1 $ 873,002
(US$ 28,469 )
$ - $ - $ 873,002
(US$ 28,469 )
$ (11,561 )
(CNY -2,535 )
100.00 $ (11,561 )
(CNY -2,535 )
$ 389,243
(HK$ 99,416 )
$ -
DONGGUAN G-PRO COMPUTER CO.,
LTD.
Manufacture and sale of system products -
Note 1 534,338
(US$ 17,425 )
- - -
-
- -
-
- Note 3
LITE-ON ELECTRONICS (TIANJIN) CO., LTD.
ODM services 2,039,223 (US$ 66,500 )
Note 1 2,039,161 (US$ 66,498 )
- - 2,039,161 (US$ 66,498 )
230,411 (CNY 50,522 )
100.00 230,411 (CNY 50,522 )
3,143,927 (HK$ 802,985 )
-
LITE-ON ELECTRONICS
(DONGGUAN) CO., LTD.
Manufacture of electronic components 1,085,541
(US$ 35,400 )
Note 1 1,085,541
(US$ 35,400 )
- - 1,085,541
(US$ 35,400 )
464,383
(CNY 101,825 )
100.00 464,383
(CNY 101,825 )
2,723,835
(HK$ 695,690 )
-
SILITEK ELEC. (DONGGUAN) CO.,
LTD.
Manufacture and sale of keyboards 147,192
(US$ 4,800 )
Note 1 147,192
(US$ 4,800 )
- - 147,192
(US$ 4,800 )
792,591
(CNY 173,791 )
100.00 792,591
(CNY 173,791 )
3,159,353
(HK$ 806,925 )
-
LITE-ON ELECTRONICS (GUANGZHOU) LIMITED
Manufacture and sale of printers and scanners
1,122,339 (US$ 36,600 )
Note 1 1,122,339 (US$ 36,600 )
- - 1,122,339 (US$ 36,600 )
(729,673 ) (CNY -159,995 )
100.00 (729,673 ) (CNY -159,995 )
8,676,649 (HK$ 2,216,088 )
-
Note 4
CHINA BRIDGE (CHINA) CO., LTD. Investment, sales agent 919,950
(US$ 30,000 )
Note 1 912,130
(US$ 29,745 )
- - 912,130
(US$ 29,745 )
13,796
(CNY 3,025 )
100.00 13,796
(CNY 3,025 )
1,286,677
(HK$ 328,628 )
-
LITE-ON NETWORK
COMMUNICATION (DONGGUAN)
LIMITED
Manufacture and sale of IT products 1,362,017
(US$ 44,416 )
Note 1 434,523
(US$ 14,170 )
- - 1,321,508
(US$ 430,95)
455,841
(CNY 99,952 )
100.00 455,841
(CNY 99,952 )
3,771,890
(HK$ 963,372 )
- Note 3
LITEON COMMUNICATION
(GUANGZHOU) COMPANY
LIMITED
Manufacture and sale of mobile terminal
equipment
753,132
(US$ 24,560 )
Note 1 753,132
(US$ 24,560 )
- - 753,132
(US$ 24,560 )
- 100.00 - - -
Note 4
DONGGUAN G-TECH COMPUTER
CO., LTD.
Manufacture and sale of computer case -
Note 1 352,648
(US$ 11,500 )
- - -
-
100.00 -
-
- Note 3
LITE-ON TECHNOLOGY
(GUANGZHOU) LIMITED
Manufacture and sale of computer case 1,018,078
(US$ 33,200 )
Note 1 1,018,078
(US$ 33,200 )
- - 1,018,078
(US$ 33,200 )
- 100.00 - - - Note 4
COMMIT Incorporated Manufacture and sale of application software and multimedia product
design
983,917 (US$ 32,086 )
Note 1 18,399 (US$ 600 )
- - 18,399 (US$ 600 )
- 1.87 - - -
LITEON ELECTRONICS AND WIRELESS (GUANGZHOU)
LIMITED
Manufacture and sale of mobile terminal equipment
484,814 (US$ 15,810 )
Note 1 484,814 (US$ 15,810 )
- - 484,814 (US$ 15,810 )
- 100.00 - - - Note 4
LITE-ON (GUANGZHOU) INFORTECH CO., LTD.
Information outsourcing 38,945 (US$ 1,270 )
Note 1 71,879 (US$ 2,344 )
- - 71,879 (US$ 2,344 )
12,770 (CNY 2,800 )
100.00 12,770 (CNY 2,800 )
185,072 (HK$ 47,269 )
-
LITE-ON (GUANGZHOU) PRECISION
TOOLING LTD.
Manufacture and sale of modules 558,103
(US$ 18,200 )
Note 1 374,113
(US$ 12,200 )
- - 374,113
(US$ 12,200 )
- 100.00 - -
- Note 4
LITE-ON DIGITAL ELECTRONICS
(DONGGUAN) CO., LTD.
Manufacture and sale of computer
peripheral products
91,995
(US$ 3,000 )
Note 1 91,995
(US$ 3,000 )
- - 91,995
(US$ 3,000 )
4,497
(CNY 986 )
100.00 4,497
(CNY 986 )
88,498
(HK$ 22,603 )
-
LITEON LI SHIN TECHNOLOGY (GANZHOU) LTD.
Manufacture and sale of electronic components
367,980 (US$ 12,000 )
Note 1 408,948 (US$ 13,336 )
- - 408,948 (US$ 13,336 )
68,076 (CNY 14,927 )
100.00 68,076 (CNY 14,927 )
460,447 (HK$ 117,602 )
-
LITE-ON TECHNOLOGY (XIANNING)
CO., LTD.
Manufacture and sale of electronic
components
199,323
(US$ 6,500 )
Note 1 199,323
(US$ 6,500 )
- - 199,323
(US$ 6,500 )
55,192
(CNY 12,102 )
100.00 55,192
(CNY 12,102 )
305,515
(US$ 9,963 )
-
LITE-ON TECHNOLOGY (JIANGSU)
CO., LTD.
Development, manufacture, sale and
installation of power supplies and
transformers and provision of technology consulting services,
maintenance equipment and precision
instruments
5,090,390
(US$ 166,000 )
Note 1 4,630,415
(US$ 151,000 )
459,975
(US$ 15,000 )
- 5,090,390
(US$ 166,000 )
497,411
(CNY 109,067 )
100.00 497,411
(CNY 109,067 )
8,269,728
(HK$ 2,112,157 )
-
LITE-ON TECHNOLOGY (GZ)
INVESTMENT COMPANY LIMITED
Investment activities 2,453,200
(US$ 80,000 )
Note 1 2,453,200
(US$ 80,000 )
- - 2,453,200
(US$ 80,000 )
811,034
(CNY 177,835 )
100.00 811,034
(CNY 177,835 )
514,995
(HK$ 131,534 )
-
Lite-On Technology (Yingtan) Ltd. Manufacture and sale of electronic components
337,315 (US$ 11,000 )
Note 1 337,315 (US$ 11,000 )
- - 337,315 (US$ 11,000 )
22,151 (CNY 4,857 )
100.00 22,151 (CNY 4,857 )
301,437 (US$ 9,830 )
-
LITE-ON POWER TECHNOLOGY
(DONGGUAN) CO., LTD.
Development, manufacture and sale of
electronic components, power supplies and provision technology consulting
services
489,781
(US$ 15,972 )
Note 1 489,781
(US$ 15,972 )
- - 489,781
(US$ 15,972 )
182,629
(CNY 40,045 )
100.00 182,629
(CNY 40,045 )
887,963
(HK$ 226,793 )
-
(Continued)

- 104 -
Investor Company Investee Company Main Businesses and Products
Total Amount of
Paid-in Capital
(Note 2)
Method of
Investment
Accumulated
Outflow of
Investment from
Taiwan as of
January 1, 2018
Investment of Flows Accumulated
Outflow of
Investment from
Taiwan as of
December 31, 2018
Net Income
(Losses) of the
Investee Company
(Note 2)
Percentage
of
Ownership
Share of
Profits/Losses
(Note 2)
Carrying
Amount as of
December 31, 2018
(Note 2)
Accumulated
Inward
Remittance of
Earnings as of
December 31, 2018
Note Outflow Inflow
Lite-On Technology
Corporation
CHANGZHOU LEOTEK NEW ENERGY
TRADE LIMITED
Wholesale, import and export and
installation of street lights, signal
lights, scenery lights and new-type electronic components
$ 30,665
(US$ 1,000 )
Note 1 $ 30,665
(US$ 1,000 )
$ - $ - $ 30,665
(US$ 1,000 )
$ (17,444 )
(CNY -3,825 )
100.00 $ (17,444 )
(CNY -3,825 )
$ 2,748
(CNY 613 )
$ -
LITEON OPTO TECHNOLOGY
(GUANGZHOU) LTD.
Manufacture and sale of optical disc
drives
1,318,595
(US$ 43,000 )
Note 1 1,318,595
(US$ 43,000 )
- - 1,318,595
(US$ 43,000 )
(136,768 )
(CNY -29,989 )
100.00 (136,768 )
(CNY -29,989 )
1,976,359
(US$ 64,450 )
-
LiteON Auto Electric Technology
(Guangzhou) Ltd.
Manufacture and sale of optical disc
drives
61,330
(US$ 2,000 )
Note 1 61,330
(US$ 2,000 )
- - 61,330
(US$ 2,000 )
(15,757 )
(CNY -3,455 )
100.00 (15,757 )
(CNY -3,455 )
132,687
(US$ 4,327 )
-
LITEON-IT OPTO TECH (BH) CO., LTD.
Manufacture and sale of optical disc drives
1,686,575 (US$ 55,000 )
Note 1 1,686,575 (US$ 55,000 )
- - 1,686,575 (US$ 55,000 )
316,223 (CNY 69,338 )
100.00 316,223 (CNY 69,338 )
4,113,158 (US$ 134,132 )
-
Lite-On (Guangzhou) Automotive
Electronics Limited
Manufacture, sale and processing of
electronic products
190,123
(US$ 6,200 )
Note 1 180,004
(US$ 5,870 )
- - 180,004
(US$ 5,870 )
234,237
(CNY 51,361 )
100.00 234,237
(CNY 51,361 )
1,774,735
(HK$ 453,282 )
-
LITE-ON AUTOMOTIVE (WUXI) CO.,
LTD
Manufacture, sale and processing of
electronic products
153,325
(US$ 5,000 )
Note 1 153,325
(US$ 5,000 )
- - 153,325
(US$ 5,000 )
(44,639 )
(CNY -9,788 )
100.00 (44,639 )
(CNY -9,788 )
594,307
(HK$ 151,791 )
-
HUIZHOU LI SHIN ELECTRONIC CO., LTD.
Manufacture of computer peripheral products
377,425 (US$ 12,308 )
Note 1 195,551 (US$ 6,377 )
- - 195,551 (US$ 6,377 )
141,178 (CNY 30,956 )
100.00 141,178 (CNY 30,956 )
1,171,219 (US$ 38,194 )
-
HUIZHOU FU TAI ELECTRONIC CO.,
LTD.
Manufacture of computer peripheral
products
29,714
(US$ 969 )
Note 1 1,993
(US$ 65 )
- - 1,993
(US$ 65 )
1,532
(CNY 336 )
100.00 1,532
(CNY 336 )
62,649
(CNY 2,043 )
-
LITE-ON TECHNOLOGY (SHANGHAI)
CO., LTD.
Manufacture and sale of energy saving
equipment
2,177,215
(US$ 71,000 )
Note 1 2,177,215
(US$ 71,000 )
- - 2,177,215
(US$ 71,000 )
102,326
(CNY 22,437 )
100.00 102,326
(CNY 22,437 )
2,714,496
(CNY 88,521 )
-
SUZHOU LITE-ON STORAGE CO., LTD.
Research, development, manufacture, sale of SSD and smart storage device
(including high-speed with more than
100TB storage capacity) provide after-sales service and technical
support; import and export, as a
principal or an agent, assorted products and technologies.
3,066,500 (US$ 100,000 )
Note 2 1,379,925 (US$ 45,000 )
- - 1,379,925 (US$ 45,000 )
65,050 (CNY 14,651 )
45.00 29,273 (CNY 6,593 )
1,366,254
-
BEIJING LITE-ON MOBILE
ELECTRONIC AND TELECOMMUNICATION
COMPONENTS CO., LTD.
Manufacture and sale of mobile phone
modules and design for assembly line
490,640
(US$ 16,000 )
Note 1 1,605,742
(US$ 52,364 )
- - 1,605,742
(US$ 52,364 )
(65,892 )
(CNY -14,448 )
100.00 (65,892 )
(CNY -14,448 )
544,334
(US$ 17,751 )
-
GUANGZHOU LITE-ON MOBILE ENGINEERING PLASTICS CO., LTD.
Manufacture and sale of mobile phone modules and design for assembly line
600,114 (US$ 19,570 )
Note 1 2,779,077 (US$ 90,627 )
- - 2,779,077 (US$ 90,627 )
50,960 (CNY 11,174 )
100.00 50,960 (CNY 11,174 )
1,834,012 (US$ 59,808 )
-
GUANGZHOU LITE-ON MOBILE
ELECTRONIC COMPONENTS CO., LTD.
Manufacture and sale of mobile phone
modules and design for assembly line
- Note 1 3,537,269
(US$ 115,352 )
- - 3,537,269
(US$ 115,352 )
(232,372 )
(CNY -50,952 )
- (232,372 )
(CNY -50,952 )
- - Note 5
Shenzhen Lite-On Mobile Precision Molds
Co., Ltd.
Manufacture and sale of mobile phone
modules and design for assembly line
- Note 1 400,209
(US$ 13,051 )
- - 400,209
(US$ 13,051 )
(172,226 )
(CNY -37,764 )
- (172,226 )
(CNY -37,764 )
- - Note 5
ZHUHAI LITE-ON MOBILE
TECHNOLOGY COMPANY LTD.
Manufacture and sale of mobile phone
modules and design for assembly line
- Note 1 476,197
(US$ 15,529 )
- - 476,197
(US$ 15,529 )
(239,691 )
(CNY -52,557 )
- (239,691 )
(CNY -52,557 )
- - Note 5
LITE-ON YOUNG FAST (HUIZHOU) CO., LTD.
Modules of touch panels - Note 1 199,323 (US$ 6,500 )
- - 199,323 (US$ 6,500 )
16,085 (CNY 3,527 )
- 16,085 (CNY 3,527 )
- - Note 6
LITE-ON GREEN TECHNOLOGIES (NANJING) CORPORATION
Solar energy engineering 22,999 (US$ 750 )
Note 1 22,999 (US$ 750 )
- - 22,999 (US$ 750 )
(2,043 ) (CNY -448 )
100.00 (2,043 ) (CNY -448 )
(10,115 ) (CNY -2,256 )
-
Changzhou Binhu Thin Film Solar
Greenhouse Co., Ltd.
Manufacture and sale of solar energy
engineering
448,360
(CNY 100,000 )
Note 1 91,903
(US$ 2,997 )
- - 91,903
(US$ 2,997 )
- 19.90 - 4,293
(US$ 140 )
-
Epricrystal (Changzhou) Co., Ltd. Manufacture, design and sale of
light-emitting diode products
4,814,405
(US$ 157,000 )
Note 1 827,955
(US$ 27,000 )
- - 827,955
(US$ 27,000 )
57,188
(CNY 12,539 )
19.74 11,287
(CNY 2,475 )
916,753
(CNY 204,468 )
-
DONGGUAN LITE-ON COMPUTER CO., LTD.
Manufacture and sale of computer hosts and components
61,330 (US$ 2,000 )
Note 1 61,330 (US$ 2,000 )
- - 61,330 (US$ 2,000 )
3,612 (CNY 792 )
100.00 3,612 (CNY 792 )
100,832 (CNY 22,489 )
-
Dongguan Huaqiang Information
Technology Co., Ltd.
Manufacture and sale of laser head and
digital player machine core
89,672
(CNY 20,000 )
Note 1 38,086
(US$ 1,242 )
53,418
(US$ 1,742 )
18,080
(CNY 3,964 )
46.67 8,437
(CNY 1,850 )
1,793
(CNY 400 )
-
Philips & Lite-On Digital
Solutions Corporation
Philips & Lite-On Digital Solutions
(Shanghai) Co., Ltd.
Sale of optical disc drives 30,665
(US$ 1,000 )
Note 1 30,665
(US$ 1,000 )
- - 30,665
(US$ 1,000 )
17,034
(CNY 3,735 )
100.00 17,034
(CNY 3,735 )
505,046 -
Silitech Technology
Corporation
Xurong Electronic (Shenzhen) Ltd. Manufacture of automotive parts, touch
panels and plastic & rubber assembly
85,862
(US$ 2,800 )
Note 1 203,354 - - 203,354 (202,669 )
(CNY -44,525 )
100.00 (202,669 )
(CNY -44,525 )
619,030
(CNY 138,077 )
-
Silitech Electronic (SuZhou) Co., Ltd. Manufacture and sale of automotive parts 827,955
(US$ 27,000 )
Note 1 2,391,870
(US$ 78,000 )
- - 2,391,870
(US$ 78,000 )
102,329
(CNY 22,481 )
100.00 102,329
(CNY 22,481 )
433,743
(CNY 96,748 )
- Note 7
(Continued)

- 105 -
Investor Company Accumulated Investment in Mainland China as of
December 31, 2018
Investment Amounts Authorized by
Investment Commission, MOEA Upper Limit on Investment
Lite-On Technology Corporation $ 36,532,840
(US$ 1,191,353 )
$ 39,281,865
(US$ 1,281,000 )
Note 8
Philips & Lite-On Digital Solutions Corporation 30,665
(US$ 1,000 )
30,665
(US$ 1,000 )
$ 367,976
(Note 9)
Silitech Technology Corporation 2,687,219
(US$ 81,000 )
(NT$ 203,354 )
2,837,631
(US$ 85,905 )
(NT$ 203,354 )
7,538,445
(Note 10)
Note 1: The way of investment in Mainland China is as follows:
a. Indirect investment in mainland China through holding companies.
b. Direct investment in mainland China through the Company.
Note 2: Amount was recognized based on the audited financial statements.
Note 3: LITE-ON NETWORK COMMUNICATION (DONGGUAN) LIMITED merged with DONGGUAN G-PRO COMPUTER CO., LTD. and DONGGUAN G-TECH COMPUTER CO., LTD; LITE-ON NETWORK COMMUNICATION (DONGGUAN) LIMITED was the surviving entity. The merger has been registered with the Ministry of Economic Affairs on February 13, 2019 (Registered No. 10800011600).
Note 4: LITE-ON ELECTRONICS (GUANGZHOU) LIMITED merged with LITE-ON TECHNOLOGY (GUANGZHOU) LIMITED, LITE-ON (GUANGZHOU) PRECISION TOOLING LTD., LITEON COMMUNICATION (GUANGZHOU) COMPANY LIMITED, and LITEON ELECTRONICS AND WIRELESS
(GUANGZHOU) LIMITED; LITE-ON ELECTRONICS (GUANGZHOU) LIMITED was the surviving entity. Because the merger was still under way, the change in the amount of investment in mainland China has not yet registered with the Ministry of Economic Affairs.
Note 5: Sold in October 2018 and has been registered with the Ministry of Economic Affairs (No. 10700355970).
Note 6: Dissolved upon liquidation in November 2018.
Note 7: The total paid-in-capital of Silitech Electronic (SuZhou) Co., Ltd. was US$78,000 thousand. On September 13, 2018, its board of directors passed a resolution for the return of capital in the form of cash of US$51,000 thousand to Silitech (Hong Kong) Holding Ltd. As of December 31, 2018, Silitech (Hong Kong) Holding Ltd.
has received US$40,000 thousand.
Note 8: Under Order No. 10720403170 issued by the Ministry of Economic Affairs, R.O.C. on February 5, 2018, the Company acquired a certification - approved by the Industrial Development Bureau and valid from January 31, 2018 to January 30, 2021 - of its status as operation headquarters in the ROC. Thus, the Company has no
limitation on the investment amount in mainland China.
Note 9: Calculated based on 60% of Philips & Lite-On Digital Solutions Corporation’s net worth.
Note 10: Calculated based on 60% of Silitech Technology Corporation’s net worth or NT$80 million, whichever is higher, plus accumulated inward remittance of share capital or earnings from subsidiaries.
(Concluded)

- 106 -
TABLE 10
LITE-ON TECHNOLOGY CORPORATION AND SUBSIDIARIES
INTERCOMPANY RELATIONSHIPS AND SIGNIFICANT INTERCOMPANY TRANSACTIONS
FOR THE YEAR ENDED DECEMBER 31, 2018
(Amounts in Thousands of New Taiwan Dollars)
No.
(Note 1) Company Name Counterparty
Nature of
Relationship
(Note 2)
Intercompany Transaction
Financial Statements Item Amount Terms
% of
Consolidated
Net Revenue or
Total Assets
(Note 3)
0 Lite-On Technology Corporation Philips & Lite-On Digital Solutions Corporation a. Sales $ 14,742,645 Cost-plus pricing 7
Philips & Lite-On Digital Solutions Corporation a. Accounts receivable 3,797,699 Cost-plus pricing 2
LITE-ON SINGAPORE PTE. LTD. a. Sales 3,846,273 Cost-plus pricing 2
LITE-ON SINGAPORE PTE. LTD. a. Purchases 22,425,492 Cost-plus pricing 11
LITE-ON SINGAPORE PTE. LTD. a. Accounts payable 8,041,771 Cost-plus pricing 4
LITE-ON TRADING USA, INC. a. Sales 5,197,154 Cost-plus pricing 3
LITE-ON TRADING USA, INC. a. Accounts receivable 2,046,981 Cost-plus pricing 1
Lite-On Overseas Trading Co., Ltd. a. Accounts receivable 3,233,971 Cost-plus pricing 2
Lite-On Overseas Trading Co., Ltd. a. Purchases 80,575,490 Cost-plus pricing 39
Lite-On Overseas Trading Co., Ltd. a. Accounts payable 26,481,119 Cost-plus pricing 13
1 Philips & Lite-On Digital Solutions Corporation Philips & Lite-On Digital Solutions USA, Inc. a. Sales 7,545,018 Cost-plus pricing 4
2 LITE-ON NETWORK COMMUNICATION (DONGGUAN) Lite-On Overseas Trading Co., Ltd. c. Sales 23,114,843 Cost-plus pricing 11
LIMITED Lite-On Overseas Trading Co., Ltd. c. Accounts receivable 1,031,369 Cost-plus pricing 1
3 LITE-ON OPTO TECHNOLOGY (CHANGZHOU) CO., LITE-ON SINGAPORE PTE. LTD. c. Sales 4,730,256 Cost-plus pricing 2
LTD. LITE-ON SINGAPORE PTE. LTD. c. Accounts receivable 1145,681 Cost-plus pricing 1
4 LITE-ON TECHNOLOGY (CHANGZHOU) CO., LTD. LITE-ON SINGAPORE PTE. LTD. c. Sales 14,216,872 Cost-plus pricing 7
LITE-ON SINGAPORE PTE. LTD. c. Accounts receivable 3,016,583 Cost-plus pricing 2
Lite-On Overseas Trading Co., Ltd. c. Sales 7,730448 Cost-plus pricing 4
Lite-On Overseas Trading Co., Ltd. c. Accounts receivable 1,867396 Cost-plus pricing 1
5 LITE-ON ELECTRONICS (DONGGUAN) CO., LTD. Lite-On Overseas Trading Co., Ltd. c. Sales 14,372,652 Cost-plus pricing 7
Lite-On Overseas Trading Co., Ltd. c. Accounts receivable 1,566,255 Cost-plus pricing 1
6 SILITEK ELEC. (DONGGUAN) CO., LTD. Lite-On Overseas Trading Co., Ltd. c. Sales 10,574,723 Cost-plus pricing 5
Lite-On Overseas Trading Co., Ltd. c. Accounts receivable 3,195,579 Cost-plus pricing 2
7 LITE-ON ELECTRONICS (GUANGZHOU) CO., LTD. Lite-On Overseas Trading Co., Ltd. c. Sales 28,094,828 Cost-plus pricing 14
Lite-On Overseas Trading Co., Ltd. c. Accounts receivable 6,194,405 Cost-plus pricing 3
(Continued)

- 107 -
No.
(Note 1) Company Name Counterparty
Nature of
Relationship
(Note 2)
Intercompany Transaction
Financial Statements Item Amount Terms
% of
Consolidated
Net Revenue or
Total Assets
(Note 3)
8 LITEON-IT OPTO TECH (BH) CO., LTD. Lite-On Overseas Trading Co., Ltd. c. Sales $ 10,939,256 Cost-plus pricing 5
9 Lite-On Electronics (Thailand) Co., Ltd. LITE-ON SINGAPORE PTE. LTD. c. Sales 3,511,429 Cost-plus pricing 2
10 LITE-ON SINGAPORE PTE. LTD. LITE-ON TECHNOLOGY (SHANGHAI) CO., LTD. c. Sales 2,762,142 Cost-plus pricing 1
WUXI CHINA BRIDGE EXPRESS TRADING CO.,
LTD.
c. Sales 2,306,459 Cost-plus pricing 1
LITE-ON ELECTRONICS H.K. LIMITED c. Sales 3,174,900 Cost-plus pricing 2
LITE-ON TRADING USA, INC. c. Sales 7,240,186 Cost-plus pricing 4
LITE-ON TRADING USA, INC. c. Accounts receivable 3,204,473 Cost-plus pricing 2
LEOTEK ELECTRONICS USA LLC c. Sales 1,077,087 Cost-plus pricing 1
11 Lite-On Overseas Trading Co., Ltd. LITE-ON NETWORK COMMUNICATION
(DONGGUAN) LIMITED
c. Sales 18,659,588 Cost-plus pricing 9
LITE-ON NETWORK COMMUNICATION
(DONGGUAN) LIMITED
c. Accounts receivable 2,765,250 Cost-plus pricing 1
LITE-ON TECHNOLOGY (CHANGZHOU) CO., LTD. c. Sales 13,339,843 Cost-plus pricing 6
LITE-ON TECHNOLOGY (CHANGZHOU) CO., LTD. c. Accounts receivable 4,925,032 Cost-plus pricing 3
LITE-ON ELECTRONICS (DONGGUAN) CO., LTD. c. Sales 12,403,569 Cost-plus pricing 6
SILITEK ELEC. (DONGGUAN) CO., LTD. c. Sales 7,963,382 Cost-plus pricing 4
SILITEK ELEC. (DONGGUAN) CO., LTD. c. Sales 1,172,956 Cost-plus pricing 1
LITE-ON ELECTRONICS (GUANGZHOU) CO., LTD. c. Sales 31,384,316 Cost-plus pricing 15
LITE-ON ELECTRONICS (GUANGZHOU) CO., LTD. c. Accounts receivable 5,555,797 Cost-plus pricing 3
LITE-ON OPTO TECHNOLOGY (GUANGZHOU)
CO., LTD.
c. Sales 1,086,080 Cost-plus pricing 1
LITE-ON IT OPTO TECH (BH) CO., LTD. c. Sales 10,247,644 Cost-plus pricing 5
LITE-ON IT OPTO TECH (BH) CO., LTD. c. Accounts receivable 2,414,764 Cost-plus pricing 1
LITE-ON SINGAPORE PTE. LTD. c. Sales 19,466,827 Cost-plus pricing 9
LITE-ON SINGAPORE PTE. LTD. c. Accounts receivable 4,435,178 Cost-plus pricing 2
12 Lite-On (Guangzhou) Automotive Electronics Co., Limited LITE-ON TECHNOLOGY (SHANGHAI) LTD. c. Sales 2,458,695 Cost-plus pricing 1
LITE-ON TECHNOLOGY (SHANGHAI) LTD. c. Accounts receivable 1,076,131 Cost-plus pricing 1
LITE-ON SINGAPORE PTE. LTD. c. Sales 2,394,096 Cost-plus pricing 1
Note 1: The Parent Company and its subsidiaries are coded as follows:
a. The Parent Company is coded “0”.
b. The subsidiaries are coded consecutively beginning from “1” in the order presented in the table above.
Note 2: Nature of relationship is as follows:
a. From the Parent Company to its subsidiary.
b. From a subsidiary to its Parent Company.
c. Between subsidiaries.
(Continued)

- 108 -
Note 3: The percentage calculation is based on the consolidated total operating revenues or total assets. For balance sheet items, each item's period-end balance is shown as a percentage to consolidated total assets as December 31, 2018. For profit
or loss items, cumulative amounts are shown as a percentage to consolidated total operating revenues for the year ended December 31, 2018.
Note 4: The intercompany transactions have been eliminated from consolidation.
Note 5: The above table only discloses each of the related-party transactions which amount to at least 1% of total revenue or total assets, while the reverse flow of transactions are not additionally disclosed.
(Concluded)