literacy boost indonesia endline report - resource centre · pdf fileliteracy boost indonesia...
TRANSCRIPT

1
!
Literacy Boost Indonesia Endline Report
July 2013
Christina Brown
With special thanks to Save the Children staff and our team of enumerators: Karla Klau, Benny Giri, Didiek Yuana, Carolyn Alesbury and Dr. Amy Jo Dowd (SC) and Adelbertha A. Seran, Bertho Junedi Benyamin, Frida Kole Roman, Hiasintus Sekundus, Ignasia P. Aton, Indra Setiawan, Magdalena D. S. Fernandes, Melpi Minal Ria Marpaung, Mickhael Nahak, Norfince T. Nge, Paskalis Arnoldus Teti,
Rafael Gomes, Selvia Yohana T. A. Tety, Victoria E. M. Fatin, Wilibrodus Wandy Gasa, Yofita Nahak, Yovita Asa Ikun (Enumerators)

2
!"#$%&'()*+&#,(--./0# During the 2012-2013 school year, Save the Children (SC) began implementing the first year of the Literacy Boost (LB) program. The program, designed to improve reading skills for early grade students, focuses on working with teachers, parents, and community members, as well as providing reading materials, to boost students' reading growth. LB trains teachers in effective literacy teaching methodologies and works with communities to maintain weekly activities for students to participate in, reinforcing literacy inside and outside the classroom. Using an emergent literacy and early grade reading assessment, a subset of the students' reading growth is tracked from baseline to endline to chart their progress through the year. These data also enable SC program staff to adapt the intervention’s teacher training and community activities to the students' particular needs. In July 2012, baseline data were collected in 20 Literacy Boost schools and 15 comparison schools. At each of the 35 schools where data were collected, 20 children in the second grade were randomly sampled at baseline. Endline data were collected in the same schools in May 2013. In total, 672 students (394 Literacy Boost, 278 comparison) were assessed at baseline, and 581 (333 Literacy Boost, 248 comparison) of these same students, 87% of the original sample, were located at endline and assessed. While control schools were chosen to be good matches for LB schools, there were some differences between the two groups and these variables were controlled for throughout the analysis. Students’ literacy skills and home, health and academic background were collected and will be used in this report to understand both the effect of the LB program and overall trends in literacy among students. Program Impact Students in LB schools made significant additional gains over peers in comparison schools in reading comprehension and oral comprehension. LB students also made larger gains in reading fluency though the impact was statistically significant at a lower threshold. However, there was not a statistically significant effect of the program on letter identification, concepts about print material, individual word reading or reading accuracy. These areas, many of which are stepping-stones to reading, need to be a larger focus for next year’s implementation of the program. Program documents from implementation and classroom observations of reading lessons were also used to understand better how LB was implemented in different schools. Because much of the initiative for change is in the hands of teachers and community members, the quality of programming and teaching depends on these individuals. As a result the intensity and effectiveness of implementation of LB varied across schools. Using program data, we see that schools that were more involved in LB (more community activities, higher attendance at them, more teachers trained in LB techniques) made larger gains in reading fluency over the year than LB schools that did not implement LB components as effectively. Similarly students who attended schools that used more LB teaching strategies also performed better in reading fluency and reading comprehension. This result holds when controlling for background baseline differences between schools that were more involved in LB and those that were not. However, it appears that the lowest quintile of students did not benefit as much from LB. While LB students did make additional gains beyond their peers in oral comprehension, they did not make any more progress than students in comparison schools in letter identification and individual word reading, stepping-stones to fluent reading.

3
Students who do not speak Indonesian as their primary language benefitted significantly from LB. In comparison schools, the gap between Indonesian and non-Indonesian speakers (students who speak another language at home, such as Tetun or Kemak) is quite large, whereas it is much smaller in LB schools. For example, at the end of the year in LB schools 16% of Indonesian speakers and 20% of non-Indonesian could not read a simple text. In comparison schools 15% of Indonesian speakers and 28% non-Indonesian speakers could not. This suggests LB teacher training, which includes strategies for how to build off a student’s home language in teaching literacy, is effective. Literacy & Gender At the end of the year, girls in LB schools scored significantly higher than boys in five out of eight assessment areas. This is rooted in a number of differences, negatively affecting boys’ literacy. First, boys have slightly worse health statistics and significantly fewer attended preschool. Boys were twice as likely to be absent on the day of the endline assessment. Boys are also twice as likely to work outside of the home, though there was not a significant difference in performance for those that did work. However, girls do not perform better in all circumstances. The larger the size of the family the worse girls perform, but this relationship does not exist for boys. This suggests larger families are limited in resources and unable to support all children’s education, prioritizing boys. Literacy & Health Over a third of students tested were stunted and nearly a half were underweight for their age. Students who were stunted, underweight or did not eat a full breakfast performed worse on average in a range of literacy areas, controlling for socio-economic status (SES). Additionally, if families do not treat their water (by boiling or some other means) they also perform much worse controlling for SES. For example, 21% of students from poor families that treat their water cannot read, but twice that—44% of students from poor families that do not treat their water cannot read. The link between health characteristics and cognitive development is clear and these areas provide additional avenues for organizations to support literacy growth and to intervene earlier in children's lives with nutrition and stimulation interventions. Literacy & Home Environment Students’ exposure to text and family members who are supportive of the student’s academic development are crucial drivers of literacy. Students who have access to more types of reading materials score much higher on all elements of literacy. The more people in a students’ family that encourage and help the student study and tell them stories, the better the student performs, and so even parents that are illiterate can support their student’s literacy in significant ways. However, the benefits of a supportive home literacy environment affect groups of students differently. For example, the number of reading materials a student has access to at home is unrelated to literacy for high SES students, but strongly correlated for those in low and medium SES families. In fact, students from low and medium SES households with four or five types of reading materials at home perform just as well as those from high SES backgrounds with the same number of books. Additionally, the effect of seeing other family members read positively effects girls’ literacy but has no effect on boys’ literacy.

4
Table of Contents
I. Executive Summary ..................................................................................................................................................... 2
II. Introduction ................................................................................................................................................................. 5 A. Literacy Boost Program ....................................................................................................................................................... 6 B. Methods ................................................................................................................................................................................... 7
III. Context ....................................................................................................................................................................... 9 A. Student Background ............................................................................................................................................................. 9 B. Socio-Economic Status ....................................................................................................................................................... 11 C. Health & Nutrition ............................................................................................................................................................. 12 D. Home Literacy Environment ............................................................................................................................................ 13 E. Absence at Endline .............................................................................................................................................................. 14
IV. Program Impact ...................................................................................................................................................... 16 A. Program Impact by Reading Skill ..................................................................................................................................... 16
i. Reading Fluency ................................................................................................................................................... 17 ii. Reading Comprehension .................................................................................................................................. 17 iii. Oral Comprehension ....................................................................................................................................... 18 iv. Concepts about Print ....................................................................................................................................... 19 v. Letter Identification ........................................................................................................................................... 19 vi. Individual Word Reading ................................................................................................................................. 19 vii. Reading Accuracy ............................................................................................................................................. 19 viii. Readers .............................................................................................................................................................. 19 ix. Reading with Comprehension ........................................................................................................................ 19 x. Effect Size ............................................................................................................................................................. 20 xi. Interpreting the Results ................................................................................................................................... 21
B. Program Impact by Involvement in Literacy Boost ...................................................................................................... 23 i. School Involvement in Literacy Boost Activities .......................................................................................... 23 ii. Student Involvement in Literacy Boost Activities ....................................................................................... 26
C. Limitations in Establishing Causality ................................................................................................................................ 29
V. Understanding the Program Impact .................................................................................................................... 30 A. Program’s Theory of Change ........................................................................................................................................... 30 B. Gaps in the Theory of Change ......................................................................................................................................... 32 C. Differences Among Schools .............................................................................................................................................. 33
VI. Literacy & Student Background .......................................................................................................................... 35 A. Results by Performance at Baseline ................................................................................................................................ 35 B. Results by Gender ............................................................................................................................................................... 37 C. Results by Health & Nutrition ......................................................................................................................................... 39 D. Results by Home Literacy Environment ........................................................................................................................ 41 E. Results by Home Language ................................................................................................................................................ 44 F. Results by Socio-Economic Status .................................................................................................................................... 46
VII. Recommendations ................................................................................................................................................ 47 A. Program Recommendations ............................................................................................................................................. 47 B. Data Collection Recommendations ................................................................................................................................ 51
Bibliography ................................................................................................................................................................... 52
Appendix 1: Regression Outputs ............................................................................................................................. 53
Appendix 2: Individual School Results ..................................................................................................................... 62

5
!!"#!1)/23(')*21# The following report presents the results of an impact evaluation of an early grade literacy program implemented by Save the Children Indonesia in the Belu District of Nusa Tenggara Timur Province. The evaluation is based on baseline (July/August 2012) and endline (May 2013) data from students in twenty program schools, as well as fifteen comparable control schools. The analysis uses a difference in difference strategy to compare the gains students in the Literacy Boost program made in one academic year to those at schools that did not receive the program. The report is organized as follows: Section II outlines the main features of the program itself, including the timeline of components implemented. This section also discusses the methodology for the sample selection and describes the instruments used to measure literacy skills, as well as the other background data collected at the student, school, community and program level. Section III takes a closer look at the students in the program and comparison schools to better understand whether the two groups are a good comparison; gain insight on the realities these students face; and how this may affect their ability to become fluent readers. We will look at students’ academic and socio-economic background, health, nutrition, and home literacy environment. This section also discusses attrition between the baseline and endline and what the implications are for being able to compare the program and control schools. Section IV looks at whether the program had an impact in each literacy area. While the difference in difference approach provides credence to being able to attribute causation to the program, we will also discuss some of the challenges in establishing causality and the statistical techniques used to overcome some of these challenges. Within the aggregate program impact, we then dig in to look at how the impact varied based on the school and student’s level of involvement in LB. In Section V, we take a step back and look at the program impact in light of what actually took place during the year of the program. This will give a sense of the efficiency of the program. We will look at the program’s theory of change and what actually took place at each level: inputs, activities, outputs, outcomes and impact. We also examine how these components varied at each school, producing different impacts at each school. Section VI examines a wider variety of factors that impact student’s literacy abilities. We examine student’s results by their baseline scores, gender, health, home environment and primary language. We also discuss the varying impact LB had for these sub-populations. Section VII discusses recommendations for the next cycle of the Literacy Boost program, as well as areas for further data collection and analysis. The Appendix includes the regression tables predicting attrition, and aggregated and disaggregated literacy gains.

6
4"#5*)&/.'0#6227)#8/29/.-# During the 2012-2013 school year, Save the Children Indonesia implemented a pilot of the Literacy Boost program—an intervention focused on working with teachers and communities to improve children’s reading skills—in Belu District, Nusa Tenggara Timur. The program was implemented in 20 schools and 39 surrounding communities with a focus on early grade students. The LB program entails a number of components to ensure students receive literacy support inside and outside of the classroom. These include:
1. a 9-module teacher training on literacy strategies, conducted in three phases 2. provision of Book Banks for schools and communities for students to borrow from 3. establishing a Reading Buddy system in which older children read with younger children 4. conducting regular community reading awareness sessions with parents 5. overseeing weekly Reading Camps run by trained Reading Camp Leaders
Implementation Challenges Several challenges prevented the LB project from being implemented fully:
• Limited staffing at the SC office in Belu throughout the project, especially during the planning and initial implementation
• Limited staff expertise in the specific teaching methodologies recommended in the LB toolkit • Short time period and limited expertise in being able to adapt the LB model, developed in the
US and applied in other countries, to this specific context • There were also significant challenges in acquiring appropriate reading materials, especially
stories for the students and so these had to be created from scratch • Due to an initial late start, the program also ran into scheduling conflicts with the schools in
working around holidays, testing schedules and other government conflicts. • Significant challenges in getting parents to attend meetings; staff later learned that few parents
were receiving the message that these meetings were happening
The program was implemented with delayed teacher training, fewer parents meetings and only two monitoring visits. Findings should be interpreted in light of the fact that many of the activities only ran for several months before the endline assessment and a third of the teacher training took place just a month or two before the assessment. As this was a pilot of the program, these are areas that will be improved for the following year. Implementation Successes Despite a late start there was definitely interest from the students, teachers, principals, communities and government officials in the components of the LB program. Reading camps and read-a-thons were highly attended and anticipated by students each week. Students also took advantage of book banks, enjoying the opportunity to be able to take books home to read. Read-a-thons and Reading Festival events stemmed from community enthusiasm for LB. Though enthusiasm varied among schools, many teachers and principals praised the training they had attended and especially appreciated the continued support they received from master trainers and school supervisors. Teachers mentioned that they appreciated how applicable much of the training was to their classroom and learned the importance of using strong teaching methods. A teacher at a participating school stated, “Previously the method we used wasn’t good for students, but after [LB

7
training] I realized the process should be more participatory and tried to support students individually. Currently students do not have a problem learning to read.” Figure 1: Implementation timeline and outputs Date Activity Output Jul-Aug ‘12
Baseline 2nd grade students tested on literacy concepts
- 672 students tested from the 20 intervention schools and 15 control schools
Sept ‘12 Stakeholder Orientation Workshop with government education staff to introduce project, garner support and elicit feedback
- 3 day workshop - 7 members from the district education office, sub-district and planning ministry attended
Sept-Oct ‘12
Conducted community socialization meetings Various stakeholders including community leaders, youth leaders, people who actively engage in children’s activities, as well as principals and representatives of early grade teachers from target communities participated in these meetings
- Meeting held in 20 communities surrounding the target schools - 233 community members attended
Oct ‘12 Teacher training Teachers trained on letter knowledge and phonemic awareness
- 2 day training - 86 teachers and 4 principals attended
Nov ‘12 Monitoring Master trainers conduct monitoring and mentoring of teachers
- 63 teachers observed
Oct, Jan & Apr
Reading Camp Facilitators training Facilitators trained in leading reading camps and supporting phonemic awareness, letter knowledge and vocabulary
- 64 volunteers trained to facilitate reading camps
Oct-Jun Reading Camps Students listened to a story, played reading games, took part in focused instruction on reading skills and made a reading materials to take home
- Weekly camps held in each of the 39 communities - 819 students participated in reading camps
Nov & Feb
Community facilitators trained Facilitators trained to lead community and parent workshops
- 35 community facilitators trained
Nov-Mar
Parent Reading Awareness Sessions Sessions provided information on how to support their student in reading
- 7 sessions held in communities - 212 parents attended
Jan ‘13 Teacher training Teachers trained on using formative assessments, language issues and reading fluency
- 2 day training - 116 teachers and 16 principals attended
Jan ‘13 Reading Buddies Monitor orientation Teachers from each school received orientation on coordinating and monitoring reading buddies within the school
- 1 teacher from each school
Jan-Jun ‘13
Reading Buddies Early grade students meet with older students to practice reading
- 131 pairs of students were established
Feb & Apr ‘13
Monitoring Master trainers conduct monitoring and mentoring of teachers
- 78 teachers observed
Mar-Jun ‘13
Community events Two week Read-a-thons and Reading festivals held in communities
- 14 schools participated in reading festival & read-a-thons
Apr-May ‘13
Teacher training Teachers trained on reading comprehension and vocabulary
- 2 day training
6"#:&);237# Sample Selection At baseline, 20 2nd grade students from each of the 20 Literacy Boost schools and 15 comparison schools were randomly chosen to take a literacy assessment. Those same students were retested at the end of the year. 14% of students tested at baseline were unable to be retested at endline due to absence or changing schools. This analysis looks at the program results for students who were tested both at baseline and endline.
8
In order to understand the effect of a program, it is crucial to have a comparison group that does not receive the program to understand what happens in schools without the intervention. During the course of a school year, students in regular schools will make some literacy gains. Therefore, we need to compare the gain students in our 20 program schools make to that of a student’s in a typical classroom. Comparison schools were selected based on similarities in socioeconomic background, geography and school type. At the endline, on average the LB and comparison schools are highly similar in background characteristics, ensuring these groups are a good comparison. Instruments The same instruments were used at baseline (July/August 2012) and endline (May 2013). At endline an additional questionnaire for Literacy Boost students asking about their participation in Literacy Boost activities, including reading buddies, reading camps and using the school’s book bank was also added. Figure 2 shows a list of the background information collected and literacy concepts tested.
Figure 2: Assessment Data Collected at Baseline & Endline Students Background General Gender, age, language, work, chores, village Academic School, teacher, pre-school enrollment, grade repetition, time spent studying Socioeconomic Type of home, household size, home amenities Health Height, weight, meals eaten, general health, history of illness, access to clean water,
use of bed net Home Literacy Environment Access to print Quantity and type of print materials at home Reading at home Household members seen reading, helping student study, telling stories and reading to
student Literacy Skills Concepts about print Number of concepts about book awareness demonstrated out of 11 Letter identification Number of upper case and lower case letters/sounds identified out of 52 Individual words Number of most common single words from grade-level text book read out of 20 Fluency Number of words in a connected text read correctly in a minute Accuracy Percentage of words in a connected text read correctly Comprehension Number of comprehension questions answered correctly from passage out of 5
In addition, data was collected for each school on the infrastructure, geography and language of students. At a third of the schools two early grade teachers and the principal were also interviewed to learn more about their use of LB strategies in the classroom and the overall implementation of LB at the school. Furthermore, detailed documentation from SC Belu on program implementation and monitoring data was also compiled to better understand the level of involvement of each school and community. As there were obstacles throughout the implementation as well as differences in the support and enthusiasm schools had for the program, it is helpful to look at what actually took place in each school to better understand the effect of the program and areas for future improvement. This data includes attendance records from teacher trainings, community events, teacher observation monitoring results, program documentation and SC staff’s input based on their interaction with the schools.

9
!!!"#<21)&%)## In order to best serve the students, we need to understand their background, health and home environment. It is also important to compare students in LB schools versus control schools to ensure the two groups are a good match. Looking at how some of these factors change over time from the beginning of the year to the end of the year is also useful to understand how students’ lives changed over the school year. Were students present at endline in each group similar enough to compare? As we will show in the following pages, students in LB and comparison schools are very similar in a wide range of background characteristics. The few differences were LB students are less likely to have repeated 2nd grade, had fewer chores, earned more money if they worked outside the home and were more likely to have diarrhea at the baseline. At the endline, there was a significant difference in the number of students who worked outside the home as well as LB students having a more supportive home literacy environment. However, this final difference may be due to the program itself (see pg. 37). The following charts use clustered t-tests to determine if there is a significant difference between LB and comparison schools for each characteristic.
4"#,)(3&1)#6.'=9/2(13## Figure 3: Background Characteristics by group at baseline & endline Baseline Endline
Variable Literacy Boost
Average
Comparison Average
Sig. diff.
Literacy Boost
Average
Comparison Average
Sig. diff.
Sample size 334 250 334 250 Age 7.42 7.43 - 8.07 7.98 - % Female 53.1 46.8 - 52.9 48.4 - % attended preschool 66.1 58.5 - 68.8 60.7 - % who repeated 1st grade 24.9 23.8 - 26.7 28.6 - % who repeated 2nd grade 6.0 14.1 ** 12.6 15.7 - Minutes of study per day 53.2 54.9 - 64.9 63.1 - Home Language % Indonesian 65.6 56.8 - 60.0 57.6 - % Tetun 14.1 25 - 27.2 25.2 - % Kemak 7.2 2.4 - 9.0 3.6 - School Characteristics Km to city center 11.3 21.8 * School day length (hours) 3.0 3.1 - School Enrollment 396 281 - % of schools with electricity 90 89 - % of school with running water 57 53 - ** p<0.01, * p<0.05
Figure 3 displays the mean values for background variables by sample group at the beginning and end of the year. At the end of the year, students were on average 8 years old and about two-thirds had attended preschool. Over a fourth repeated 1st grade and about one in seven repeated 2nd grade. At the beginning of the year, significantly more comparison students reported repeating 2nd grade than LB students. Students report studying about an hour each day outside of school, an increase from the beginning of the year. The majority of students speak Indonesian, the national language, as the primary

10
language in their homes. However, a fourth speak Tetun and about one in twenty speak Kemak, two local languages, as their primary language at home. Both languages are native to the island of Timor. The languages are more common in Timor-Leste, and many of the students who speak these languages at home are refugees from the conflict between Indonesia and Timor-Leste. Comparison schools were significantly more rural on average than LB schools. The farthest LB school was 26km from Atambua, the main town in Belu district. However, comparison schools were as far as 45km away from the town. However, distance does not necessarily imply remoteness. There were smaller towns located in some of these areas and some schools, though not geographically far from Atambua, were very remote without paved roads and very difficult to access during the rainy season when rivers swell. As there was a significant difference between the two groups in distance, we control for this variable throughout the analysis of program effect. Along other school characteristics both groups are similar. Early grade students attend school for an average of three hours. The vast majority of schools have electricity but only just over half had running water. School enrollment ranged from 90 students to over 800. LB schools are larger on average but the difference is not statistically significant.
#
#
#
#
#
#
#
#
#
#
#
#
#
#
#
#

11
6"#,2'*2>$'212-*'#,).)(7# Figure 4: Socio-economic characteristics by group at baseline & endline Baseline Endline
Variable Literacy Boost
Average
Comparison Average
Sig. diff.
Literacy Boost
Average
Comparison Average
Sig. diff.
Household size 5.06 4.93 - 5.65 5.51 - % with a thatch roof 7.36 11.3 - 7.9 11.8 - % with electricity 79.9 77.4 - 87.4 83.4 - % with a refrigerator 25.8 21.0 - 30.6 28.6 - % with toilet 91.0 85.1 - 91.0 90.3 - % with motorcycle 53.2 49.6 - 58.3 50.4 - Number of amenities (of 4) 2.48 2.33 - 2.68 2.52 - # of chores 2.2 3.1 *** 3.5 3.5 - % work outside the home 4.5 7.3 - 11.7 20.6 * If yes, how many min/day? 36.3 45.3 - 105.4 72.7 * If yes, money earned (1,000Rp) 11.9 3.3 * 12.2 20.4 * *** p<0.001, ** p<0.01, * p<0.05
Belu District, along with most of NTT province, is one of the poorer areas of Indonesia. The province had an average GDP/capita of just $527 compared to the average for Indonesia—$3,223 in 20111. As the district is on the border of Indonesia and Timor-Leste many people in the area are refugees from the conflict. LB and comparison schools comprised of a mix of rural and semi-urban schools. At the end of the school year, households had on average 5.5 people and about 10% of families had a thatch roof, as compared to an iron roof. Over the course of the year, the percent of families that had electricity went from 79% to 85%. This change mirrors the significant amount of construction and infrastructure work taking place in the area. One significant difference between the groups is comparison students reported performing more chores than LB students at the beginning of the year. At the endline, a smaller percentage of LB students worked than their peers, but for those that did work, they worked longer hours and for less pay than those in comparison schools. Figure 5: Percent of students in each SES category by group A student’s socio-economic status (SES) was determined based on the type of roof and toilet and the number of possessions and appliances in their home. From this information, students were categorized as low SES, medium SES or high SES. LB schools have fewer low SES students and slightly more medium and high SES students, though the difference is not statistically significant.
!!!!!!!!!!!!!!!!!!!!!!!!!!!!!!!!!!!!!!!!!!!!!!!!!!!!!!!!1 Badan Pusat Statistik - Statistics Indonesia, 2012
41.2
47.2
28.2
24.8
30.6
28
0% 10% 20% 30% 40% 50% 60% 70% 80% 90% 100%
Literacy Boost
Comparison Low SES
Medium SES
High SES

12
<"#?&.@);#A#B()/*)*21# Figure 6: Health & nutrition by group at baseline & endline Baseline Endline
Variable Literacy
Boost Avg. Comparison
Average Sig. diff.
Literacy Boost Avg.
Comparison Average
Sig. diff.
Height (m) 1.17 1.17 - 1.20 1.20 - Weight (kg) 18.7 18.6 - 19.9 20.3 - BMI 13.8 13.6 - 13.8 14.0 - % stunted 33.6 29.2 - 37.0 34.4 - % underweight 45.0 40.7 - 49.8 48.1 - % ate breakfast 86.8 87.9 - 89.2 92.7 - % ate full meal for breakfast 56.7 63.7 - 78.5 82.1 - % ate lunch 95.8 95.2 - 98.8 97.6 - % ate full meal for lunch 77.3 84.7 - 96.0 97.5 - % report feeling healthy 93.3 94.3 - 94.6 95.1 - % who report diarrhea 26.3 20.4 - 9.1 8.6 - % with diarrhea for > 3 days 12.4 5.8 * 2.7 3.7 - % who report treating water 83.4 78.2 - 87.8 86.0 - % who have had malaria 43.7 37.8 - 41.4 40.8 - % who report always sleeping under mosquito net 83.5 86.7 - 86.8 87.9 -
* p<0.05
A student’s health and nutrition is immensely important in their cognitive development. Students in the region demonstrated several health conditions, which prevent them from reaching their full academic potential. First, over a third of students are stunted and nearly half are underweight, due to insufficient nutrition. Figures 7 & 8 show students’ height for age and weight for age. The green curve is global average scores for healthy children. The blue and pink curves show where boys and girls from our survey fall, showing they are significantly shorter and skinnier than the global average. The height of the curve is the proportion of students at the given height or weight. About a fifth of the students did not eat breakfast on the day of the endline. Incidence of reported diarrhea decreased over the course of the year to fewer than 1 in 10 students. Most students sleep under mosquito nets and drink treated water, and the prevalence of both behaviors is increasing. Figure 7: Height for age Figure 8: Weight for age

13
C"#?2-*)&/.'0#$1+*/21-&1)# Figure 9: Student’s home literacy environment by group at baseline & endline Baseline Endline
Variable Literacy Boost
Average
Comparison Average
Sig. diff.
Literacy Boost
Average
Comparison Average
Sig. diff.
# of types of reading materials 2.9 2.7 - 3.29 3.03 - % of children who saw someone reading at home 82.3 81.5 - 89.2 77.4 **
% of family members seen reading 36.7 36.3 - 36.3 30.6 *
% of children who were read to by a family member 77.2 69.0 - 84.1 76.2 *
% of family members who read to child 25.2 22.5 - 23.2 21.3 -
% of children who were helped to study 95.5 94.4 - 97.9 94.0 *
% of family members who helped/encouraged study 38.5 36.7 - 36.3 34.0 -
** p<0.01, * p<0.05
Family support for a child’s education has been a key factor in studies of other LB programs. At the baseline, LB students had more supportive home literacy environments along each metric but the difference was not statistically significant for any of them. However, by the end of the year, the difference was statistically significant in four areas. One component of LB is holding parent meetings to provide suggestions on how to support their student’s academic performance. On pg. 37 we will discuss changes in home literacy environment over the year. On average at the end of the year, students had just over three types of reading materials at home, mainly textbooks, religious texts and storybooks. 86% of students saw someone in their family read. Students have seen about a third of their family members read. 83% of students had someone in their family read to them. On average a fifth of family members read to the students. Almost everyone has someone in their family that encourages or helps them study, and a little over a third of family members helped or encouraged the student to study. Overall the groups are well enough matched that we can compare their progress in literacy over the year. As there are several variables with a statistically significant difference, we will control for those differences in our later analysis of the program effect.
14
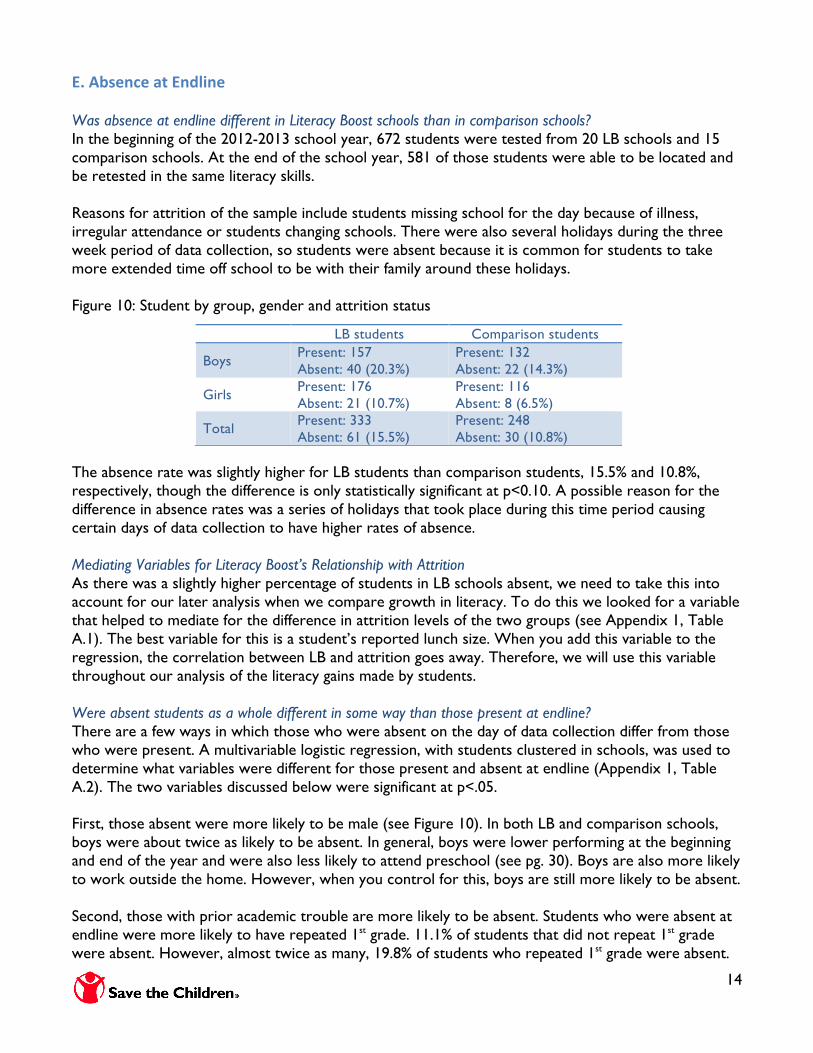
$"#4D7&1'&#.)#$13@*1&# Was absence at endline different in Literacy Boost schools than in comparison schools? In the beginning of the 2012-2013 school year, 672 students were tested from 20 LB schools and 15 comparison schools. At the end of the school year, 581 of those students were able to be located and be retested in the same literacy skills. Reasons for attrition of the sample include students missing school for the day because of illness, irregular attendance or students changing schools. There were also several holidays during the three week period of data collection, so students were absent because it is common for students to take more extended time off school to be with their family around these holidays. Figure 10: Student by group, gender and attrition status The absence rate was slightly higher for LB students than comparison students, 15.5% and 10.8%, respectively, though the difference is only statistically significant at p<0.10. A possible reason for the difference in absence rates was a series of holidays that took place during this time period causing certain days of data collection to have higher rates of absence. Mediating Variables for Literacy Boost’s Relationship with Attrition As there was a slightly higher percentage of students in LB schools absent, we need to take this into account for our later analysis when we compare growth in literacy. To do this we looked for a variable that helped to mediate for the difference in attrition levels of the two groups (see Appendix 1, Table A.1). The best variable for this is a student’s reported lunch size. When you add this variable to the regression, the correlation between LB and attrition goes away. Therefore, we will use this variable throughout our analysis of the literacy gains made by students. Were absent students as a whole different in some way than those present at endline? There are a few ways in which those who were absent on the day of data collection differ from those who were present. A multivariable logistic regression, with students clustered in schools, was used to determine what variables were different for those present and absent at endline (Appendix 1, Table A.2). The two variables discussed below were significant at p<.05. First, those absent were more likely to be male (see Figure 10). In both LB and comparison schools, boys were about twice as likely to be absent. In general, boys were lower performing at the beginning and end of the year and were also less likely to attend preschool (see pg. 30). Boys are also more likely to work outside the home. However, when you control for this, boys are still more likely to be absent. Second, those with prior academic trouble are more likely to be absent. Students who were absent at endline were more likely to have repeated 1st grade. 11.1% of students that did not repeat 1st grade were absent. However, almost twice as many, 19.8% of students who repeated 1st grade were absent.
LB students Comparison students
Boys Present: 157 Absent: 40 (20.3%)
Present: 132 Absent: 22 (14.3%)
Girls Present: 176 Absent: 21 (10.7%)
Present: 116 Absent: 8 (6.5%)
Total Present: 333 Absent: 61 (15.5%)
Present: 248 Absent: 30 (10.8%)

15
Were students in Literacy Boost schools who were absent at endline different from those who were present at endline? When we focus in on just LB students, there are similar differences between those absent and present as when we look at the whole sample. First, those who repeated 2nd grade were more likely to be absent. Within LB students, 20.3% of students who repeated 2nd grade were absent, whereas only 12.7% of students who did not repeat were absent (Appendix 1, Table A.3). Also students who are stunted, which is low height for their age, due to insufficient nutrients were actually less likely to be absent. Of students who were not considered stunted at baseline, 14.8% were absent at the end of the year, but 10.7% of those who are stunted were absent. Just as with the entire sample, boys were more likely to be absent than girls. Figure 11: Percent of students absent at endline by group
####
9
17.6 20.3
12.7
0
5
10
15
20
25
Girls Boys Repeated 2nd grade Did Not Repeat

16
!E"#8/29/.-#!-F.')#
4"#8/29/.-#!-F.')#D0#G&.3*19#,=*@@# This section looks at the gains made by students in LB and comparison schools in six different areas of literacy: letter identification, print awareness, individual word reading, reading accuracy and fluency when reading a passage and comprehension. As LB and comparison students did not start out with the same average literacy skills, we will be focusing on comparing the gains students made in each group as opposed to the total score. Additionally, to determine if LB students made a larger gain, we will be controlling for other background differences and the students’ initial baseline score.2 When students start out with a higher score there is less possible gain to be demonstrated on a particular test because there are only so many questions they can get right. By controlling for their baseline score we reduce this problem by comparing students that started in the same place. Figure 12: Baseline, Endline and Gains in Literacy Skills by Group
Reading Skill Group Avg.
Baseline score
Avg. Endline score
Avg. Gain3
Sig. diff. between
gain scores Benchmark Benchmark
met?
Letter identification (%)
LB 76 90 14 - 94% No Comparison 73 89 16
Concepts about Print (%)
LB 76 86 11 - 91% No Comparison 74 82 8
Individual words read (%)
LB 60 87 27 - 100% No
Comparison 9.7 16.8 7.1 Fluency (words per minute)
LB 17.0 38.5 21.6 ~ 24 Yes Comparison 11.1 29.1 18.1
Accuracy (%) LB 42 77 35
- 81% No Comparison 33 73 40
Reading Comprehension (%), readers at baseline
LB 62 90 28 * 80% Yes
Comparison 50 72 32
Reading Comprehension (%), new readers
LB - 68 68 * - -
Comparison - 62 62 Oral Comprehension (%)
LB 38 64 26 * 60% Yes Comparison 34 50 16
Student is a reader (%) LB 58 83 25
- - - Comparison 50 80 30
* p<0.05, ~ p<0.10
#
!!!!!!!!!!!!!!!!!!!!!!!!!!!!!!!!!!!!!!!!!!!!!!!!!!!!!!!!2 For each literacy skill, we controlled for the baseline score, lunch size (for attrition), 2nd grade repetition, number of chores, diarrhea for three days ore more, amount earned working and distance to city center and used clustered standard errors. If variables were not at all related to the outcome p>0.3 they were dropped from the model to prevent crowding out the effect of other important variables. See Table A.4 in Appendix 1 for the regression models. 3 Any difference between baseline plus gain scores versus endline is due to rounding.
17
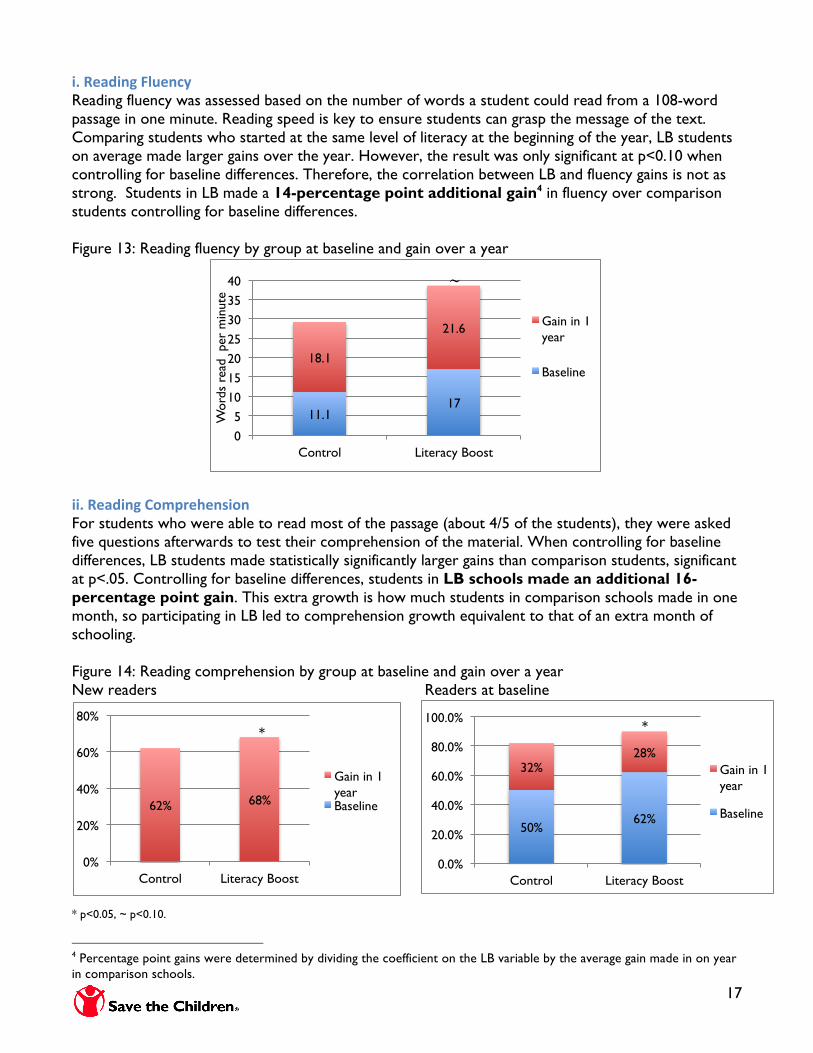
*"#G&.3*19#H@(&1'0#Reading fluency was assessed based on the number of words a student could read from a 108-word passage in one minute. Reading speed is key to ensure students can grasp the message of the text. Comparing students who started at the same level of literacy at the beginning of the year, LB students on average made larger gains over the year. However, the result was only significant at p<0.10 when controlling for baseline differences. Therefore, the correlation between LB and fluency gains is not as strong. Students in LB made a 14-percentage point additional gain4 in fluency over comparison students controlling for baseline differences. Figure 13: Reading fluency by group at baseline and gain over a year
#**"#G&.3*19#<2-F/&;&17*21#For students who were able to read most of the passage (about 4/5 of the students), they were asked five questions afterwards to test their comprehension of the material. When controlling for baseline differences, LB students made statistically significantly larger gains than comparison students, significant at p<.05. Controlling for baseline differences, students in LB schools made an additional 16-percentage point gain. This extra growth is how much students in comparison schools made in one month, so participating in LB led to comprehension growth equivalent to that of an extra month of schooling. Figure 14: Reading comprehension by group at baseline and gain over a year New readers Readers at baseline
* p<0.05, ~ p<0.10.!!!!!!!!!!!!!!!!!!!!!!!!!!!!!!!!!!!!!!!!!!!!!!!!!!!!!!!!!4 Percentage point gains were determined by dividing the coefficient on the LB variable by the average gain made in on year in comparison schools.
62% 68%
0%
20%
40%
60%
80%
Control Literacy Boost
Gain in 1 year Baseline
50% 62%
32% 28%
0.0%
20.0%
40.0%
60.0%
80.0%
100.0%
Control Literacy Boost
Gain in 1 year
Baseline
11.1 17
18.1
21.6
0 5
10 15 20 25 30 35 40
Control Literacy Boost
Wor
ds r
ead
per
min
ute
Gain in 1 year
Baseline
"!
#!#!

18
Figure 14 (left) shows the gains in reading comprehension of students who became readers over the course of the year. As these students could not read the passage at the beginning of the year, they do not have a baseline comprehension score. LB students made statistically significantly larger gains than comparison students controlling for baseline differences. There is one crucial aspect to point out about figure 14 (right). On average readers at baseline from comparison schools actually gained slightly more. However, this shows why just looking at averages can be misleading when the two groups are not perfectly matched. The reason for this is that more students in comparison schools had lower baseline scores, and on a 5-question assessment, there is more room to grow if you start with a lower score. This is why it is crucial to compare students who had the same baseline score. Figure 15 shows this comparison. For students who started with a baseline score of 0-3, LB students gained more over the year, demonstrating the effect of the program. Figure 15: Gain scores by group by each student’s baseline score.
Score at baseline
Gain for comparison students
Gain for LB students *
I# !"#$ JKL#M# !"#$ NOL#P# %"#$ QNL#K# "&#$ KIL#Q# '(#$ '(#$
***"#R/.@#<2-F/&;&17*21#For students who were unable to read the passage at endline (about a fifth of the students), assessors read them the passage and then asked five questions to test their comprehension of the material. The following data shows the baseline and gain scores for students who were nonreaders at both baseline and endline. Students in LB schools made significantly larger gains than those in comparison schools. When controlling for baseline differences, LB students made an additional 87% growth over comparison students in oral comprehension questions. This means that students in LB schools gained close to a full year of extra growth in oral comprehension. This part of the assessment was only administered if students themselves could not read the passage. Figure 16: Oral comprehension by group at baseline and gain over a year
34% 38%
16%
26%
0.0%
10.0%
20.0%
30.0%
40.0%
50.0%
60.0%
70.0%
Control Literacy Boost
Gain in 1 year
Baseline
#!
* p<0.05
!

19
For the following five literacy assessment areas there was not a significant effect of the program when controlling for baseline differences. The gains made by students in LB schools and comparison schools, with the given controls, are too similar to be able to say if there was a difference made by LB.
*+"#<21'&F)7#.D2()#8/*1)#The concepts about print section of the assessment evaluates students’ understanding of the parts of a book and which direction to read. These skills are fundamental for students to move from individual word reading to reading books. Results started high with students at baseline knowing about 3/4 of the questions. LB students gained 10.9% and comparison students gained 8.2% over the year. However, this difference is not statistically significant. As there was not much room for improvement, it is not surprising we do not see a statistically significant difference between the two groups.
+"#5&))&/#!3&1)*S*'.)*21#At the beginning of the year, students could identify about 3/4 of the 52 upper and lower case letters in the Roman alphabet, with LB students starting 3% higher than comparison students. LB students gained an additional 7 letters over the year, and comparison students gained 8 letters. This is one area for LB to focus on in the future as low performing students need extra support in this area to ensure they can achieve this stepping stone to reading.
+*"#!13*+*3(.@#T2/3#G&.3*19#At baseline, LB students performed significantly better than comparison students in individual words read from a list of 20 words. LB students could read 60% of the words at the beginning of the year, and in comparison schools students could only read 49%. However, comparison students made larger average gains (36%) than LB students (27%). Despite comparison schools making larger gains on average, when controlling for baseline differences, there is not a statistically significant difference in gains between the two groups.
+**"#G&.3*19#4''(/.'0#Students were asked to read a short passage and from that the total number of words read out of 108 was used to determine reading accuracy. LB students also began the year much higher than comparison students with 41.9% and 33% correct, respectively. Again comparison students made larger average gains though when controlling for baseline differences there was no difference between the groups.
+***"#G&.3&/7#Another important measure to look at is the gain in students who became “readers”, able to read at least a portion of the passage. At the baseline, 58% of LB students and 50% of comparison schools could read at least a portion of the passage. Over the year an additional 25% of LB and 30% of comparison students became readers.
*%"#G&.3*19#U*);#<2-F/&;&17*21#The ultimate goal of reading is to fully understand and absorb the text. Each basic step—letter awareness, concepts about print, etc.—build on each other to ultimately culminate in reading with comprehension. By using students’ scores from the skills listed previously we can gauge where the students falls along the scale from nonreader to reading with comprehension. Figure 17 shows the percentage of students that were emergent readers, beginning readers and readers with comprehension in each group at the beginning and end of the year. Emergent readers are those that could not read the passage or did so very slowly and were only able to answer at most one of the five comprehension questions. Beginners are those that could read faster and answered 2-3 of the comprehension questions correctly. Readers with comprehension could read the passage with more fluency and answered 4 or 5 out of the comprehension questions correctly.
20
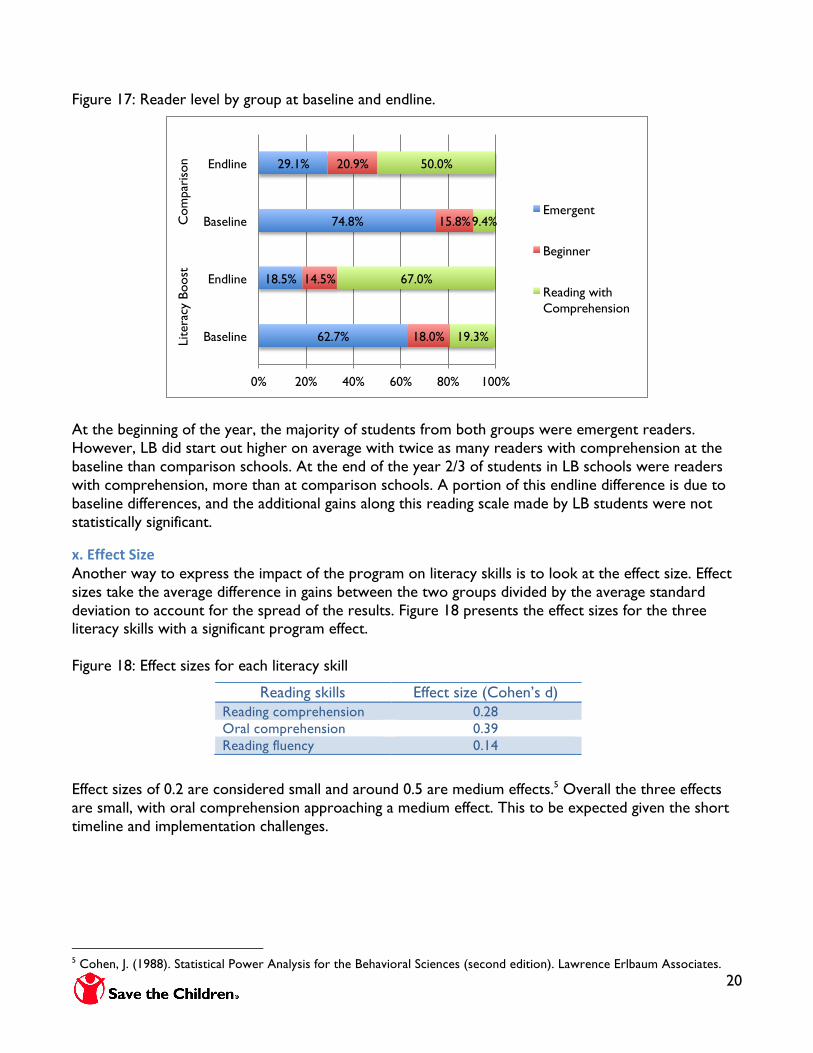
Figure 17: Reader level by group at baseline and endline.
At the beginning of the year, the majority of students from both groups were emergent readers. However, LB did start out higher on average with twice as many readers with comprehension at the baseline than comparison schools. At the end of the year 2/3 of students in LB schools were readers with comprehension, more than at comparison schools. A portion of this endline difference is due to baseline differences, and the additional gains along this reading scale made by LB students were not statistically significant.
%"#$SS&')#,*V&#Another way to express the impact of the program on literacy skills is to look at the effect size. Effect sizes take the average difference in gains between the two groups divided by the average standard deviation to account for the spread of the results. Figure 18 presents the effect sizes for the three literacy skills with a significant program effect. Figure 18: Effect sizes for each literacy skill Effect sizes of 0.2 are considered small and around 0.5 are medium effects.5 Overall the three effects are small, with oral comprehension approaching a medium effect. This to be expected given the short timeline and implementation challenges.
!!!!!!!!!!!!!!!!!!!!!!!!!!!!!!!!!!!!!!!!!!!!!!!!!!!!!!!!5 Cohen, J. (1988). Statistical Power Analysis for the Behavioral Sciences (second edition). Lawrence Erlbaum Associates.
Reading skills Effect size (Cohen’s d) Reading comprehension 0.28 Oral comprehension 0.39 Reading fluency 0.14
62.7%
18.5%
74.8%
29.1%
18.0%
14.5%
15.8%
20.9%
19.3%
67.0%
9.4%
50.0%
0% 20% 40% 60% 80% 100%
Baseline
Endline
Baseline
Endline Li
tera
cy B
oost
C
ompa
riso
n
Emergent
Beginner
Reading with Comprehension

21
%*"#!1)&/F/&)*19#);&#G&7(@)7#By randomly selecting the 2nd grade students we tested, we can generalize the effects we see to all early grade students in the school. Since we see an impact for these randomly selected students, we can assume that there was an overall impact on average for the 4,000 early grade students in LB schools. In order to become a student that reads with comprehension there are a series of stepping-stones necessary. First, students need to know letters and sounds. Then students learn to read individual words, then passages, and finally read the passage fluently enough to grasp the meaning. Students move from “lower” level skills up to “higher” level skills like fluency and comprehension. One interesting trend is LB schools made significant additional gains in higher-level skills: reading fluency and comprehension. It appears LB and comparison schools made similar gains in lower level skills like individual word reading and letter identification, but LB students were able to make further progress in more advanced reading skills. This suggests this program may be a good model to work on more advanced skills. It is positive to see LB students were able to make such large gains in these more difficult skills, but it is crucial the program also tries to make progress in all of the areas. However, there should also be more of a focus on lower skills. Without these foundational skills low performing students will not be able to achieve full literacy. Looking closer at initially low-performing students (pg. 28), it appears they did not perform any better in LB schools than comparison schools in foundational reading skills. That discussion further shows that these lower students were not able to be reached by LB strategies which is likely one reason we do not see a gain in lower level skills. There are several other possible reasons for not seeing an impact in several of the assessment areas:
1. No actual program impact: It is possible that LB simply did not make an impact on these skills. If so, there needs to be a greater focus next year in these areas. In many LB interventions in other countries, in the first year of implementation there was not a significant impact in all of the literacy areas. Especially considering the challenges in implementation in Belu, it is quite possible that the program simply was not able to impact these areas.
2. Cap on scores: Another limitation within the analysis is that the scores for each component of the assessment are capped. For example, on the most used words section, students can only score up to 20, and many students reached this cap. As this report is focusing on gains made over the year, if a student starts out scoring very well at baseline, there is not much improvement possible for them to show on this test. A student who starts out getting 18 out of the 20 words correct at baseline, can only “gain” 2 words on this exam, even though in reality the student has probably made significant progress in reading.
3. Lack of spread in data: By the end of the year, many students achieved a perfect or near perfect score on several of the easier components of the test. This produced highly skewed data, making it more challenging to find a program effect. Figure 19 shows students’ scores on the individual word reading section of the assessment. The vast majority of students received a perfect score on this component and the distribution looks similar for letter identification, total words read and concepts about print.

22
Figure 19: Histogram of individual words read at endline
4. The last mile problem: The current analysis implies a linear relationship between given variables and literacy scores. In many education interventions, it has been noted that it is more challenging to impact the lowest students than those in the middle. It is much harder to move a class from 90% readers to 100% readers than 50% readers to 60% readers. This is because that last ten percent is harder to reach for a variety of reasons, which caused them to be in the bottom of the class. A portion of the issue is LB students started out with higher scores in all five literacy areas where there appeared to be no impact. For example, in LB schools students could read, on average, 60% of the words from a list of most common words, but comparison students could only read 48.5% of words. Comparison students made 35.5% growth over the year, ending with an average of 84% of the words correct. For LB students to make that same level of growth they would have ended up with average of 95.5%, so nearly every student would have needed to read all the words on the list which is a more difficult accomplishment.
Num
ber o
f stu
dent
s
0 5 10 15 20Individual words read at endline (of 20)

23
6"#8/29/.-#!-F.')#D0#!1+2@+&-&1)#*1#5*)&/.'0#6227)# In this section, we will also look closer at the results to understand how the impact varied for schools and students more involved in LB. Overall, we find that schools that were more involved in LB activities, teachers that used more LB teaching strategies and students who attended more LB activities made additional literacy gains in certain assessment areas.
*"#,';22@#!1+2@+&-&1)#*1#5*)&/.'0#6227)#4')*+*)*&7#The LB model provides ongoing support, resources and training for principals, teachers and community members but leaves much of the actual initiative for change to these individuals. It is up to schools to send their teachers to training. It is up to the teachers who do attend the training to make changes in their teaching strategies based on what they have learned. It is up to schools to actually allow students to borrow the books provided and encourage students’ participation in activities like reading buddies and reading camps. While LB provides ongoing support and some monitoring, for the program to work it requires teachers, principals and communities to follow through with the program and take initiative to reach out for additional support when their school faces obstacles in implementation. The level of involvement and commitment to LB program components varied considerably by school. Some principals led the charge and required all early grade teachers receive training and worked throughout the year to ensure the teachers used the strategies recommended. Other principals and teachers were unaware of the main teaching strategies LB advocates or knew of them but did not use them in their classrooms. Many schools also faced challenges in implementation of activities. For example, in one school the teacher in charge of monitoring the reading buddies left the school mid-way through the year and no one took over that responsibility for her. In many schools, there was limited space for a book bank and the books were instead stored in a less than child-friendly corner of the principal’s office. In order to gauge the school’s level of involvement in LB programming we use monitoring and program data from throughout the year. We will look at two indicators to gauge involvement:
• School involvement: This is a composite measure which incorporates 13 different factors, such as whether the principal attended LB training, the number of master trainers at the school, teachers’ use the LB literacy teaching methods, students use of book banks, reading buddies and attendance at reading camps in the area. These scores are based on program documents and SC staff’s observations of the schools.
• Teacher observations: This score is based on monitoring data of early grade teachers’ use of 40 different recommended teaching strategies during a 45-minute teaching observation of a reading lesson in March. These include having a classroom with visible print, and using phonemic awareness, letter knowledge, fluency and comprehension strategies. This is not the percent of strategies the student’s own teacher necessarily uses every day, as we do not have that information. However, using the average techniques used by early grade teachers in the school on one day will give us a general sense if the school tends to use LB techniques during reading instruction.
What types of schools were more involved in LB? Schools that were more involved in LB activities during the year did not on average have higher baseline scores in literacy (Appendix 1, Table A.5). Similarly, when we look at the teacher observation score, there is no relationship between a student’s initial literacy level at baseline and the average teacher observation score for that school. Therefore, schools with initially higher performing students

24
at baseline were not more likely to be more involved in LB activities, have more teachers trained or have more community events. Teachers at schools where students started out scoring well were not more or less likely to use LB techniques in their classes. This is important because it shows that no matter where students start out, teachers were able to apply the techniques demonstrated in LB trainings. Schools that are more rural were actually slightly more involved and had teachers use more of the techniques than those that were closer to the city center. This is also a positive result because it shows that schools geographically closer to the SC office were not favored in terms of support or resources. This also stems from the approach LB uses by finding volunteers from the community. SC works to train the teachers and community members to sustain the program on their own, and then most of the implementation takes place organically within the community as they have ownership over the work. This allows schools and communities to take advantage of LB methods without SC staff to continuously be physically present at the school. Is involvement in LB components related to literacy gains? As we saw from the previous section, schools that used more LB strategies were fairly similar to those that did not. However, in the few areas where they were different we controlled for these differences to hope to capture the effect of LB. This allows us to compare these schools and possibly attribute differences in gains over the year to the differing intensity of LB implementation in the school. In general, students at schools that were more involved in LB activities and those with teachers that used more LB strategies made moderately larger gains in reading fluency and comprehension during the school year than those that did not. (Appendix 1, Table A.6). Figure 20: Reading fluency gains by schools’ involvement in LB & use of LB teaching strategies !
Controlling for any baseline differences between schools that used more LB components and those that did not, students attending schools that were more involved made larger fluency gains (significant at p<.05). Students in schools one “level” more involved (from “least involved” to “moderately involved”, etc.) gained 2.7 additional words per minute controlling for baseline differences. Keeping in mind that comparison schools only made 18 words per minute gain in an entire year, this additional gain from becoming more involved in LB is substantial. This extra gain
17
22.7 23.1
18.2 21.8
24.9
0
5
10
15
20
25
30
Least involved Moderately involved
Highly involved 0-24% 25-28% 29% or more
School involvement in LB Avg. % of LB teaching strategies used

25
is 16% of the growth a student in a regular school made in a whole year. By making LB schools more involved in LB activities there are significant gains to be made. Similarly students who attended schools where more teachers were observed using LB strategies made larger gains in fluency and reading comprehension (significant at p<.05). On average teachers who used 10% more LB strategies had students on average gain an additional 2.5 words per minute, controlling for baseline differences. While these relationships are only correlations, there appears evidence that those who have teachers that use more LB techniques do better over the course of the year. We do not know if they learned those techniques from the SC training or were already using them in their classrooms. By controlling for baseline differences between schools that were more involved in LB, it helps eliminate some of this problem, suggesting this gain is due to changes made this year. Increasing Involvement of LB schools & Communities By controlling for baseline differences in schools that were more involved in LB we can eliminate some of the other reasons we might see additional growth in these schools. It appears there is a link between a school’s level of involvement in LB activities and students’ growth in literacy. Therefore it is crucial that SC not only start up LB programs but ensure that the staff at the school is on board and motivated enough to be committed to the program throughout the school year. Some LB schools did not make any additional gains while others made huge gains, so the intensity of the LB application is crucial. This requires SC to both build the determination within schools and communities to invest time in the beginning and check up with schools frequently to support them in their work throughout the year. Further recommendations for this are discussed in section VII.

26
**"#,)(3&1)#!1+2@+&-&1)#*1#5*)&/.'0#6227)#4')*+*)*&7# Literacy Boost Activities Through training, provision of materials and appointment of supervisors, LB established three main activities students could participate in to improve their literacy skills outside the classroom.
1. Book banks: These collections of books, usually located in the main office of the school and in communities, were available for students to borrow for the day, take home or read at school. SC provided the books, shelving and a system for allowing students to check books out.
2. Reading buddies: SC appointed a teacher at each school to be in charge of creating reading buddy pairs (an early grade student and 4th or 5th grade student) and then monitoring that the students were meeting with their buddies and had access to books to read together. Some teachers also allowed students to come to their house to borrow a book to read with their buddy.
3. Reading camps: SC trained local volunteers to hold weekly reading camps in the community. At these events students could listen to a story, play reading games, take part in focused instruction on a certain reading skill and make a book to take home.
Participation in LB Activities Many students actively used these three activities each week and much of the positive feedback from schools was around students’ interest in these programs. However, attendance was not universal. After the 2nd grade students were tested in their literacy skills during the endline, they were also asked about their participation in LB activities. Students reported the following: Book Banks
57% reported using the book bank last week
On average, students attend the bank 1.2 times a week
Of students who attend book banks, 73% could remember the title of a book they read from the bank
Reading Buddies
2/3 reported having a reading buddy
Of those students, 98% could remember the name of their reading buddy
88% of students with reading buddies met with their buddy last week
Reading Camps
54% reported attending a reading camp last week
About 2/3 created reading materials to take home at camp
Based on SC’s documentation of program activities, students appear to have overstated their attendance in some activities, so actual attendance is lower. For example, only 3% of students assigned a reading buddy that was monitored weekly by a teacher representative at the school, but students may have thought a “reading buddy” was a classmate they sit next to or a sibling they read with at home. What these results do not tell us is the quality of the interaction that the student had. For example, a student could “meet” with their reading buddy but not actually do any reading and just play instead. A student could check a book out of the book bank but not read it or try to read it but get frustrated

27
when no one is available to help. More data needs to be collected about the quality of the students’ experiences. Additionally, more supports need to be in place to make sure the student gets the most out of each experience. For example, when a student returns a book the teacher is supposed to ask them questions about it to gauge comprehension, which not all schools do. More sources of monitoring like this should be incorporated into these activities. Who attends LB Activities? While many students participate in LB activities, it appears that students with higher initial literacy levels and more supportive home literacy environments are slightly more likely to attend (Appendix 1, Table A.7). Boys and girls attended activities at fairly even rates. Home support for reading was consistently related to attendance in LB activities. Having reading materials at home and family members that read to the student and encouraged studying were related to participation in reading banks, reading buddies and reading camps. Figure 21: Participation in LB activities by reading materials at home at baseline
In general students who had higher literacy levels at the baseline tended to attend LB activities at a slightly higher rate. Students who were readers at baseline attended book banks a bit more often. Those who could read more words at baseline and could identify more letters (figure 22) were also slightly more likely to attend certain LB activities. Attendance in preschool and not repeating a grade were also correlated with slightly higher attendance in some of the activities. For example, those that repeated 1st grade attended about 16% fewer activities than those that did not repeat. Students who were in the lowest 20% of those tested at the beginning of the year were less likely to report attending LB activities. This is not a strong relationship and there were many students who did not start out strong readers that still attended many events. However, SC should strive to ensure all students feel comfortable attending these events no matter their initial literacy level.
2.5
3.6
4.2
0
0.5
1
1.5
2
2.5
3
3.5
4
4.5
0 or 1 2 or 3 4 or 5
Avg
. LB
activ
ities
att
ende
d re
cent
ly
Types of reading materials at home at baseline

28
Figure 22: Participation in LB activities by letters identified at baseline
Other student characteristics like health, SES, number of chores, time spent working and studying were generally unrelated to participation in activities. This suggests that students other time commitments did not prevent them from participating in LB activities. Students coming from poorer families or those in worse health were not less likely to attend LB events. Does participation in LB activities affect literacy gains? There is some correlation between students’ gains in literacy skills over the year and their reported participation in LB activities (reading camps, reading buddies and book banks). On average those who attended more activities made larger gains in letter identification when comparing students that started at the same level at the beginning of the year and controlling for differences between students who were more likely to attend activities, significant at p<.01 (Figure 23 and Appendix 1, Table A.8). Figure 23: Gain in letters identified at endline by student reported participation in LB activities
However, it is important to note that this only establishes a correlation between literacy skills and the tendency to self-report higher levels of involvement in the activities, rather than confirmed attendance. Without data on actual student attendance (as opposed to reported) it is hard to predict the true impact of these activities.
3.1 3.4
3.8 4
0
0.5
1
1.5
2
2.5
3
3.5
4
4.5
30 or less 31-44 45-48 49-52
Avg
. LB
activ
ities
att
ende
d re
cent
ly
Letters (of 52) student knew at baseline
5.8
7.8 8
0
2
4
6
8
10
0 1-4 5 or more
Gai
n in
lett
ers
iden
tifie
d
Number of LB activities student reported attending recently

29
<"#5*-*).)*217#*1#$7).D@*7;*19#<.(7.@*)0# In order to conclude the LB program definitely caused the difference in gains between students in the LB and comparison schools, we have to establish that any difference between the groups in the beginning are factors that would not affect the students’ reading skills. However, there are differences between students in the LB schools and comparison schools. These include:
- Higher initial literacy scores in all assessment areas in LB schools - Higher attrition rate in LB schools - Differences in background characteristics
To eliminate some of these differences, we have controlled for all of these variables. This allows to us separate out the effects of some of those initial differences. However, there are additional differences that we are unable to control for. For example, Ministry of Education officials recommended these 20 schools to receive the LB program. While we tried to pick comparison schools that would be similar, the fact that these schools were selected could mean that they were perhaps better connected to government officials or more motivated or successful schools that the government was more aware of. Additionally, we know the schools are closer to the main town of Atambua in the district and are larger (figure 3). While we can control for distance and size, factors like political clout and advocacy strength we cannot control. These immeasurable variables could have been a factor in a school becoming part of the LB program and would also likely impact a student’s overall school performance. There are likely other changes happening over the course of the year, such as uneven economic growth, and it is possible they would affect more LB schools or vice versa. We cannot control for these differences. Schools were asked about other NGO activity in the area, and it appears there was not an impact of other NGO’s on early grade literacy in program or control schools. These issues are in addition to the other limitations discussed on pg. 20-21 due to the distribution of the data.
#
#
#
#
#!!!

30
E"#W13&/7).13*19#);/29/.-#!-F.')# In section IV, we looked at the impact of the program. However, this impact is only useful if we understand what actually happened during the implementation of the program. Understanding the results relies on the understanding of what took place during the year of the program. This gives a sense of the cost-effectiveness of the program. In this section we will discuss what happened and how this varied by school.
4"#8/29/.-X7#Y;&2/0#2S#<;.19&#A theory of change is a chain of logic that connects an organization’s actions to the intended outcomes they are working toward. The unstated theory of change for this program is: If teachers are trained and monitored on better teaching techniques and communities are supported to create opportunities for students to read outside school, then students’ literacy skills will improve. Within this theory of change, there is a chain of inputs, leading to activities, outputs, outcomes and impacts. To understand the impact in literacy skills at the end of the year, we need to have a full understanding of each piece of this plan. Inputs, activities and outputs are aspects of the program that SC has a direct impact on. Inputs include the staff, budget and other resources dedicated to the project. Activities consist of what SC “did” during the year: trainings, monitoring, meetings with stakeholders, community events, etc. Outputs are what directly resulted from the activities that took place. For example, an output of a training could be that 75 early grade teachers attended two days of training on phonemic awareness and vocabulary. Outcomes and impacts are the changes that take place in the target population as a result of SC’s inputs, activities and outputs. Outcomes are initial changes that happen when students, teachers, parents, principals and community leaders decide to make changes based on SC’s work. For example, a teacher could ask reading comprehension questions at the end of reading a passage based on teacher training she received from SC. Finally, impacts are the ultimate effects of the program that are measured by SC, in essence the goals the program is working towards. In this case, the impact we are focusing on are gains in literacy skills. While literacy in itself is a right for all children6, there is also a large body of research on the broader positive effects literacy has on a person’s life. Based on international education research, benefits of literacy include:7
• Higher incomes • Better health & lower fertility rates • More decision-making autonomy, self-esteem, empowerment, and more involvement in
community/political affairs These effects are even larger for women, and women’s literacy also has very positive effects on the health, education and well-being of the women’s future children. However, while SC will not measure and track these broader changes, there is strong research evidence to suggest these changes will take place as well.
!!!!!!!!!!!!!!!!!!!!!!!!!!!!!!!!!!!!!!!!!!!!!!!!!!!!!!!!$!UNESCO, Education for All Global Monitoring Report, Why Literacy Matters (2006).!7 Ibid

31
Figure 24: Program Logic Model
Inputs
• Cost: Approximately $30 per student • Staff: 4.6 staff members for the second half of the project (between one to three staff members for the first half of the project)
• 59 book banks (one for each school and community) which included over 100 books • Classroom supplies: display boards, bookshelves, letter cards, white boards • Tarpaulins and supplies for reading camps
Activities
• Master trainer training, teacher training, parent meeting facilitator training, reading camp leader training, reading buddy facilitator training
• Meetings with local leaders and government officials • Monitoring, support and supplies for weekly reading camps, access to book banks and ongoing reading buddies program
• Held reading festival and read-a-thon
Outputs
• 11 master trainers attend 6 days of training • 88 teachers/principals attend full 6 days of training • 67 teachers/principals attend part of training • 64 volunteers attend reading camp facilitator training • 39 community faciliators trained to lead parent meetings • 7 government officials attend 3 day stakeholder orientation
Outcomes
• Teachers used 29% of LB teaching stratgies during 45 minute observation • Community faciliators hold all 7 parent meetings in half of the communities with attendnace ranging from 6 to 24 parents (a fourth of communities have a couple meetings and a fourth have no parent meetings)
• Volunteers hold reading camps most weeks in all but one school with attendance ranging from 13 to 39 students
Impact
• For early grade students in 20 schools (approximately 4,000 students) the following gains were made beyond what students gained in an average year of schooling:
• 16-percentage point additional gain in reading comprehension • 87-percentage point additional gain in oral comprehension • 14-percentage point additional gain in fluency

32
6"#Z.F7#*1#);&#Y;&2/0#2S#<;.19&#Between each step in the model is a series of assumptions that one level will lead to the next. For example, we assume that certain outputs (attending training) will lead to certain outcomes (teachers use different teaching methods in their classrooms). There are couple key weakness areas in this chain. First, the jump from outputs to outcomes was tenuous, especially for teacher training. While it appears teachers do use some of the LB strategies as evidence from observation of their classrooms in October and March, we do not know how much they actually learned and the resulting behavior changes from our training. They may have been using the strategies for years before, as some are quite generic, such as choral reading, echo reading and students reading silently. When teachers were interviewed at the end of the year about the trainings and their use of the strategies most could only name a couple strategies from the training and many could not name any that LB focused on. While it is possible they could use the strategy in their classrooms without being able to remember they learned it during LB training, there is definitely more work that needs to be done in ensuring teachers learn from the trainings and make changes to their teaching practice. This will likely require continual monitoring and additional support from staff in the school and SC. There are challenges in determining what aspects of the outcomes drive the impacts we see. As LB is a multifaceted program, it is hard to disaggregate the effects of teacher training and community activities. While we know as a package these components lead to the impacts we see, it is unclear which components are successful and which are not in driving literacy gains.

33
<"#C*SS&/&1'&7#4-219#,';22@7#While figure 24 shows the total inputs, activities, outputs, outcomes and impacts, these results varied at each of the 20 schools. SC worked to provide similar services for each school and community, but the results varied significantly. This stems from the fact that schools decided how many teachers to send to training, as well as whether the principal would attend. Even from the beginning of the program, each school had differing levels of engagement with the program. Inputs & Activities: At the inputs level all schools received the same basic materials and staff attention. Similarly, the same activities were offered for all schools. Though depending on the school’s location, attending teacher trainings was significantly more difficult for some schools than others, especially during the rainy season. Additionally some of the expectations for community involvement in LB may be more challenging in certain conditions. Requiring high school students to volunteer their time or teachers to facilitate reading buddies on the weekend could be an unrealistic expectation for those who work in the afternoon or have other time-consuming commitments. Therefore while the number and scope of activities were offered equally, true access to them was not equal. Outputs: There was significant variation at this level, mirroring the later divergence in outcomes and impacts. There was variation in the number of teachers trained, how many trainings they attended and the number of community leaders trained to facilitate LB activities. Figure 25 shows the number of teachers that attended all three parts of the training. Over 100% indicates that administrators also attended training. Figure 25: Percent of early grade teachers trained fully at each LB school
Outcomes: The gap further widens as some teachers and community members that were trained did not apply the given teaching strategies in their classrooms or maintain LB activities throughout the year. At the outcome stage, we look at how individuals make changes to their behaviors based on SC’s work. At this level you can see further see the difference between schools that were fully engaged in LB and those that were not. Support from principals was often crucial in ensuring the changes were maintained over the course of the year. Figure 26 shows the number of LB strategies out of 40 used by LB teachers during a classroom observation.
0.5
11.
5Pe
rcen
t of e
arly
gra
de te
ache
rs tr
aine
d
1 3 4 5 6 7 8 9 10 11 12 13 14 16 18 19 25 26 27 29School ID

34
Figure 26: Avg % of LB strategies used during classroom observation at each LB school
Impacts: Finally, LB schools saw very different results at the end of the year. Some schools did not perform any better than comparison schools. For example, the average fluency gain in comparison schools was 18 words read per minute, and figure 27 shows that there were five LB schools that made smaller gains over the year. In order to correct for these differences, there need to be changes made from the first step in the theory of change. As program leaders see certain schools require extra support and encouragement, they need to adjust their inputs and activities to ensure all schools are fully involved and able to make significant gains. Figure 27: Avg. fluency gain at each LB school
010
2030
40Av
g. g
ain
in w
ords
read
per
min
ute
1 3 4 5 6 7 8 9 10 11 12 13 14 16 18 19 25 26 27 29School ID
05
1015
20Av
g. L
B te
achin
g str
ateg
ies u
sed
by te
ache
rs d
uring
obs
erva
tion
1 3 4 5 6 7 8 9 10 11 12 13 14 16 18 19 25 26 27 29School ID
Avg. gain made in comparison schools

35
E!"#5*)&/.'0#A#,)(3&1)#6.'=9/2(13#
4"#G&7(@)7#D0#8&/S2/-.1'&#.)#6.7&@*1&#We define “low performing student” as someone who cannot read any words from a list of most common words and could identify less than 2/3 of the letters. At the beginning of the school year 19% of the total students were low performing. Of these students many were still low performing at the end of the year:
- 30% still could not read a single words from a list of most common words - 40% still could identify less than 2/3 of the letters
This suggests there is a portion of students that made very little progress over the course of the year. This result is very similar for both LB and comparison schools. It appears that LB is unable to make a significant difference in reaching the very lowest students. The only literacy areas students in LB schools performed better than their comparison peers was oral comprehension and reading comprehension (though the sample for reading comprehension was very small). While it is positive to see oral comprehension skills were significantly improved, as this is a key life skill, it is unfortunate we do not see a program effect in any of the measures that are stepping stones to literacy, such as letter identification and individual word reading. Figure 28: Percent of students who could read a given number of words at endline
Figure 28 shows how many words students could read from a list of 20 by the end of the year. The column on the left shows the results for students who were low performing at the beginning of the year. 31% of these initially low performing students could not read any words at the end of the year. 18% could read between 1-7 words. 13% could read between 8-13 words, and 38% could read between 14-20 words. However, for those that were not low performing to begin with nearly all of the students could read between 14-20 words. These results are similar for students in LB and comparison schools. Schools with many low performing students were just as likely to be more involved in LB and have teachers use LB strategies, so it is not as though students were not exposed to LB. However, they were less likely to attend LB activities like reading camps and book banks. It appears that the current model of LB was not successful enough in
reaching those lowest students; so more work needs to be done to find teaching strategies and extra activities. In order for all students to benefit, there needs to be a range of activities for students at different levels.
31%
1%
18%
3%
13%
3%
38%
93%
0%
10%
20%
30%
40%
50%
60%
70%
80%
90%
100%
Low performing student at baseline
Not low perfoming student at baseline
Perc
ent
of s
tude
nts
that
can
rea
d th
e gi
ven
num
ber
of w
ords
14-20 words
8-13 words
1-7 words
0 words
Words read at endline

36
There are some low performing students in almost all schools. However. in about a third of the schools, between 30-60% of students were low performing at baseline. These schools should be a priority if SC wants to focus on improving the literacy skills of the lowest performing students. Figure 29: Percent of students that are low performing at baseline at each school
School ID
It is also crucial to look closer at the range of progress made by students who were low performing at the beginning of the year. Figure 30 shows box plots for the endline scores of four literacy skills for students who were low performing at the beginning of the year. A box plot shows each quartile of the data with the 2nd and 3rd quartile the heavy shaded box with the median line in the middle. Figure 30: Box plots of endline scores for initially low performing students
For example, the fluency box plot does not include the line or first box showing that half of the students received a score of zero. The third quartile of students scored between around 1 and 10 words per minute, the highest quartile scored between 10 and 20 words per minute. Each individual dot is an outlier (an individual student) ranging from 20 up to about 70 words per minute. Looking at the box plot for letters, we see that there is quite a range in students’ letter knowledge, with half still knowing less than 40 of 52 letters at the end of the year.
0.2
.4.6
% of
stude
nts ar
e low
perfo
rmers
at ba
selin
e
1 2 3 4 5 6 7 8 9 10 11 12 13 14 15 16 17 18 19 20 21 22 23 24 25 26 27 28 29 30 31 32 33 34 36
020
4060
8010
0Sc
ore
at e
ndlin
e
Letters (of 52) Individual words read (of 20)Words read per minute Total words read in passage (of 108)

37
6"#G&7(@)7#D0#Z&13&/! Overall girls scored higher than boys in all literacy skills, with five skills showing statistically significant differences in LB schools. This gender gap stems from differences in a variety of behaviors and characteristics associated with school success, such as attendance, preschool enrollment and health. Figure 31: Baseline, endline & gain scores by gender for LB schools
Reading Skill Sex N Baseline score
Sig. diff. between genders (baseline)
Endline score
Sig. diff. between genders (endline)
Gain in 1 year
Sig. diff. between genders (gains)
Concepts about print (of 20)
Boys 157 8.3 -
9.3 **
0.9 -
Girls 175 8.5 9.8 1.3 Letter identification
Boys 157 38.4 -
45.7 *
7.5 -
Girls 175 40.7 47.7 7.1 Individual word reading (of 20)
Boys 157 11 -
16.4 *
5.5 -
Girls 175 12.7 18.0 5.3 Words read per minute
Boys 157 13.5 **
33.5 **
20.0 -
Girls 175 20.2 43.1 22.9 Total words read (of 108)
Boys 157 39.5 *
78.8 *
38.8 -
Girls 175 50.5 87.6 37.1 Reading Comprehension
Boys 123 2.8 -
4 -
1.5 -
Girls 152 3.2 4.2 1.4 Student is a reader
Boys 157 40% -
78.3 -
26.6% -
Girls 175 50.6% 86.3 23.4% ** p<0.01, * p<0.05 In five out of the eight indicators of literacy (shown below), girls significantly outperform boys at the end of the year in LB schools. At the beginning of the year girls also scored higher in reading fluency, accuracy and comprehension, and in general girls made slightly higher gains during the year. Figure 32: Literacy skills in which girls significantly outperform boys at endline at LB schools
There are several reasons that could explain this difference: 1. Boys have slightly lower health statistics. Their weight and height for age is lower than for girls
and, as we discuss on pg. 39, health matters significantly for performance in school.
9.3 9.8
45.7 47.7
16.4 18
33.5 43.1
78.8 87.6
0
20
40
60
80
100
Boys Girls Boys Girls Boys Girls Boys Girls Boys Girls
Concepts about print (of 20)
Letter identification (of 52)
Individual word reading (of 20)
Words read per minute (of 108)
Total words read (of 108)
##!
##!
#!
#!
#!

38
2. Twice as many boys work outside the home as girls do at the end of the year. Students who work tend to perform slightly worse, but girls who work perform much worse than girls who do not work (figure 33). However, comparing boys and girls that work, girls perform better, and the same is true for boys and girls that do not work.
3. Girls attended preschool at higher rates. 73% of girls and 59% of boys attended preschool. 4. Girls reported having more types of reading materials at home with about 3.3 types as
compared to 3 for boys. They also have slightly more members of the family help and encourage them study.
5. Boys were nearly twice as likely to be absent at the baseline. Figure 33: Reading fluency at endine for boys and girls by work Another interesting effect that is different for boys and girls is the role of household size. The larger the household size, the worse girls perform on average. However for boys, household size is unrelated to their literacy level (Appendix 1, Table A.9). Figure 34 plots each students’ household size and reading fluency. The blue line shows that there is no statistically significant relationship for household size and fluency for boys, and the red line demonstrates for girls there is a negative relationship. Research has shown similar trends that larger families in developing countries, constrained by limited resources, invest more in boys’ education than girls.8 Figure 34: Reading fluency at endline by household size for boys versus girls
!!!!!!!!!!!!!!!!!!!!!!!!!!!!!!!!!!!!!!!!!!!!!!!!!!!!!!!!8 Salem, R. (2007). “Is Gender Bias in Education Mediated by Sibling Configuration”. Office of Population Research: Princeton University.
38.8 32.4 30.8 29.5
0 5
10 15 20 25 30 35 40 45
Don't work Work outside home
Don't work Work outside home
Girls Boys
Wor
ds r
ead
per
min
ute
020
4060
8010
0W
ords
read
per
min
ute
0 5 10 15Household size
Boys Girls

39
#<"#G&7(@)7#D0#?&.@);#A#B()/*)*21#Student’s general health, determined by their height, weight, reported meals and illnesses, is an important factor affecting literacy. Students who are stunted or underweight due to insufficient caloric and vitamin intake perform significantly lower than students that are healthier in reading fluency and comprehension (figure 35 and Appendix 1, Table A.10). Students who had a full meal at breakfast tended to have higher scores in a range of literacy areas. While this could be that those who do not eat breakfast and are stunted/underweight come from poorer families, when you compare students with the same SES the relationship still holds that those with worse nutrition perform lower. 35% of students tested were stunted and 48% were underweight making this a significant problem in Belu. This suggests that another area for SC to incorporate into their program is a nutritional component, perhaps through including health information in parent meetings. Figure 35: Average reading fluency by health status
In general, students’ height for age and weight for age were related to their endline score. Students who had a full meal for lunch and slept under mosquito nets also had higher average scores at the end of the year on several assessment areas of literacy. These differences still remain when controlling for socio-economic status (Appendix 1, Table A.11). These results are similar to other studies that have been done showing the importance of nutrition in student’s performance in school and overall cognitive development.9
!!!!!!!!!!!!!!!!!!!!!!!!!!!!!!!!!!!!!!!!!!!!!!!!!!!!!!!!9 Martorell, R. 1996. "Undernutrition During Pregnancy and Early Childhood and its Consequences for Behavioral Development." Paper prepared for World Bank's conference on Early Child Development: Investing in the Future, April 8 & 9, 1996.
29.6 27.8 28.7
27.2
0
5
10
15
20
25
30
35
Not stunted or underweight
Stunted Underweight Stunted & underweight
Wor
ds r
ead
per
min
ute
at e
ndlin
e

40
Figure 36: Average scores in three literacy areas by student’s breakfast
Whether a student’s family treats their water (to make it safe for drinking) was also an important factor in literacy performance even for students from the same SES (Appendix 1, Table A.11 and Figure 37). 21% of students from poor families that treat their water cannot read, but that number jumps to 44% of students that cannot read if they are from a poor family and do not treat their water. This further shows the importance of health in a student’s academic performance. Figure 37: Nonreaders at endline by SES and Water Treating
#
#
#
#
28.4 31.2
40.6 44.1 45.3 47.3
16.1 16.2 17.5
0
20
40
60
No breakfast Snack Full meal No breakfast Snack Full meal No breakfast Snack Full meal
Reading fluency (of 108) Letter indentification (of 52) Individual word reading (of 20)
20.5%
44.1%
20.7% 21.1%
8.1% 10.5%
0.0%
10.0%
20.0%
30.0%
40.0%
50.0%
Treats water Doesn't treat Treats water Doesn't treat Treats water Doesn't treat
Low SES Medium SES High SES
Perc
ent
of s
tude
nts
that
can
not
read

41
C"#G&7(@)7#D0#?2-*)&/.'0#$1+*/21-&1)#Family support for reading and access to reading materials are crucial factors affecting student’s reading growth. For all eight indicators of literacy both the number of reading materials at home and the percent of family that helps/encourages the student to study were highly related to the student’s score. The percent of family members that tell the student stories is also related to several literacy areas. This relationship holds when controlling for SES. This does not mean that just providing books to students to have at home is enough, but it suggests that students who come from families that have more reading materials at home tend to perform well. Figure 38: Nonreaders at endline by types of reading materials at home
However, whether family members were seen reading or read to the student directly was not related to the student’s literacy scores. These results are important because it shows that parents themselves do not need to be literate to support their student in reading. They can help their student by providing reading materials at home, telling stories and encouraging the student to study or checking to make sure the student completed their homework. This support should come from as many family members as possible. Figure 39: Reading fluency at endline by the student’s home literacy environment
26.2
31
40.2
32 31.8
36.6
41.2
0
5
10
15
20
25
30
35
40
45
0-1 2-3 4-5 0-20% 21-40% 41-60% 61-100%
Types of reading materials at home Percent of household that helps student study
Wor
ds r
ead
per
min
ute
at e
ndlin
e
34%
23%
10%
0%
5%
10%
15%
20%
25%
30%
35%
40%
0-1 2-3 4-5
% o
f stu
dent
s th
at c
anno
t re
ad
Types of reading materials at home

42
Figure 40: Reading fluency by types of reading materials at home for different SES
While reading materials are correlated with literacy skills, this relationship is not the same for all students. In fact, for students from a high SES family, there is not a correlation between reading materials and literacy skills. For those in low SES and medium SES families, more reading materials at home is related to higher reading fluency (Appendix 1, Table A. 13). Figure 40 shows there is a positive trend between fluency and reading materials for low and medium SES (the blue and red line) but no relationship for high SES students (green line). This appears to be an effective way to mediate for differences in SES. Students in low and medium SES homes performed just as well as those from high SES homes if they had four or five reading materials at home. Home literacy environment also had a different impact on those in LB versus comparison schools. In LB schools, students who had more family members read to them had higher average fluency scores. However, we do not see any impact of family members reading on fluency scores in comparison schools. It is possible that some of this difference comes from parent meetings in LB communities where parents are given strategies to support their student’s literacy. However, from the data available we do not know for sure if this difference is attributable to the program. Finally, it appears that home literacy environment also has a different impact on girls versus boys. If girls saw more family members read they were more likely to have higher reading fluency scores, but for boys there was not a relationship (Figure 41 and Appendix 1, Table A.13).
020
4060
8010
0W
ords
read
per
min
ute
0 1 2 3 4 5Types of reading materials at home
Low SES Medium SES High SES

43
Figure 41: Reading fluency by percent of family members student sees read and gender
Change in Home Literacy Environment over the year An aspect of LB is to meet with parents to encourage them to be more involved in their child’s literacy development, so we hope to see that there is a larger gain in home literacy improvements in LB schools than comparison schools. Figure 9 showed that students reported some differences between their home literacy environments at the beginning of the year and end. Over the year students in both LB and comparison schools gained access to slightly more types of reading materials and a larger percentage of students had someone that read to them at home. When comparing changes in home literacy environments for LB versus comparison students, the only significantly different change is in the percentage of students who have someone that reads to them and the percentage of the family that reads to them. Over the year, LB students had an increase in both of these indicators, whereas in comparison schools both of these indicators decreased. However, we do not know if this change is for sure attributable to parent meetings from LB as attendance was low.
36.4 41.6
47.3 47.9
32.7 27 27.9 29
0
10
20
30
40
50
60
0-20% 21-40% 41-60% 61-100% 0-20% 21-40% 41-60% 61-100%
Girls Boys
Wor
ds r
ead
per
min
ute
% of family that student sees read

44
$"#G&7(@)7#D0#?2-.19(.9&#Student’s home language has a significant effect on their literacy abilities. Students who do not speak Indonesian at home as their primary language score lower on average on all eight indicators of literacy and are almost twice as likely to be non-readers as those who speak Indonesian at home on average. Students whose primary language is not Indonesian perform much better in LB schools than comparison schools. The difference between Indonesian speakers and non-Indonesian speaking scores is larger in each component of literacy in comparison schools than LB schools. As figure 42 shows, at the end of the year in LB schools 16% of Indonesian speakers and 20% of non-Indonesian could not read a simple text. However, in comparison schools 15% of Indonesian speakers and 28% non-Indonesian speakers could not. A component of the teacher training includes training on how to work with students who speak another language at home and to recognize the strengths that students bring instead of focusing on their language as a negative. This approach appears to work well as non-Indonesian speakers perform much better in LB schools. Figure 42: Percent of students that cannot read at endline
!! Another important factor is the percentage of students at the school who speak Indonesian. Students who attend schools where a smaller portion of the students speak Indonesian perform significantly worse. In fact, the percent of students who speak Indonesian at the school is more closely related to literacy scores than the student’s own home language. This shows that it is not just the individual’s language that matters but the entire language environment. However, this effect is smaller in LB schools, which have a more proactive approach to working with students that speak another language at home. Therefore LB improved approach to working with language differences not only benefits those students it also benefits Indonesian speakers in schools with a larger percentage of students that speak an ethnic minority. This improved strategy of working with language benefited all students. Students who do not speak Indonesian at home were just as likely to attend LB activities. However, these students attend schools that on average were slightly less involved in LB and their teachers used fewer LB strategies on average. Since LB strategies are particularly effective for these students, SC should push for more involvement in these schools. Another challenge non-Indonesian speakers face is it appears that the current preschool system does not have as much of a positive impact on their future literacy. For students who speak Indonesian as
16 19.5
14.6
28.3
0
5
10
15
20
25
30
Indonesian Non-Indonesian speaker
Indonesian Non-Indonesian speaker
Literacy Boost Comparison
Perc
ent
of s
tude
nts
that
can
not
read

45
their primary language, the gains from attending preschool are substantial. However, for those who do not speak Indonesian as their primary home language, the gain from attending preschool is much smaller (Figure 43Appendix 1, Table A.14). However, this does not mean that preschool in general is not helpful for non-Indonesian speakers. It means preschools operating in this area are not serving these students well enough. It is possible that preschool teachers need more training on how to work with non-Indonesian speakers, so that all students can benefit from preschool. Figure 43: Reading fluency by preschool attendance and home language
40.4
32.5 30.5 28.9
0 5
10 15 20 25 30 35 40 45
Attended preschool Did not attend preschool
Attended preschool Did not attend preschool
Speaks Indonesian as primary language Speaks minority language as primary language
Wor
ds r
ead
per
min
ute
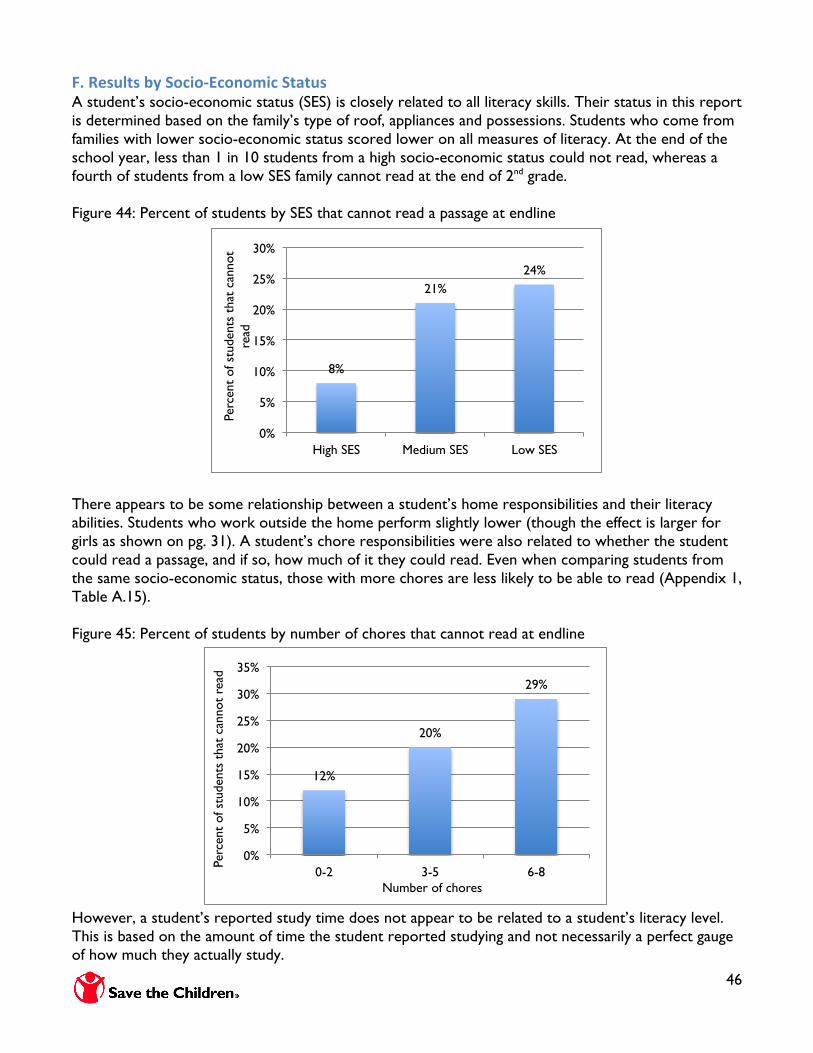
46
H"#G&7(@)7#D0#,2'*2>$'212-*'#,).)(7#A student’s socio-economic status (SES) is closely related to all literacy skills. Their status in this report is determined based on the family’s type of roof, appliances and possessions. Students who come from families with lower socio-economic status scored lower on all measures of literacy. At the end of the school year, less than 1 in 10 students from a high socio-economic status could not read, whereas a fourth of students from a low SES family cannot read at the end of 2nd grade. Figure 44: Percent of students by SES that cannot read a passage at endline
There appears to be some relationship between a student’s home responsibilities and their literacy abilities. Students who work outside the home perform slightly lower (though the effect is larger for girls as shown on pg. 31). A student’s chore responsibilities were also related to whether the student could read a passage, and if so, how much of it they could read. Even when comparing students from the same socio-economic status, those with more chores are less likely to be able to read (Appendix 1, Table A.15). Figure 45: Percent of students by number of chores that cannot read at endline
However, a student’s reported study time does not appear to be related to a student’s literacy level. This is based on the amount of time the student reported studying and not necessarily a perfect gauge of how much they actually study.
12%
20%
29%
0%
5%
10%
15%
20%
25%
30%
35%
0-2 3-5 6-8
Perc
ent
of s
tude
nts
that
can
not
read
Number of chores
8%
21% 24%
0%
5%
10%
15%
20%
25%
30%
High SES Medium SES Low SES
Perc
ent
of s
tude
nts
that
can
not
read

47
E!!"#G&'2--&13.)*217#
4"#8/29/.-#G&'2--&13.)*217#The recommendations below discuss how to improve the literacy skills of students in Belu. Some of these recommendations involve improvements for SC’s next phase of LB, BELAJAR, and some are more general and can be done by the Indonesian Ministry of Education, other NGO’s or individual schools that want to take initiative in increasing literacy in their schools. These recommendations fall into three categories. First, we look at what factors influence literacy and how we can most easily leverage those factors. Second, we review what limitations prevent the lowest performing students from attaining literacy; how to target those students; and what we can do to ensure every child becomes a strong reader. Finally, there are recommendations on improving data collection for next year. 1. School involvement in LB Students made larger gains at schools where the principal was trained, more teachers were trained, there was a well-functioning reading buddy program and book banks. This is a key area SC should focus on because small changes can have big effects. Some LB schools did not make any additional progress because they were not very involved. By working to get all schools fully involved, there are significant gains to be made. This is an easy area to target because a lot of resources have already been invested in working with that school. Putting in time for extra monitoring by phone and in person, additional meetings and refresher trainings for teachers can go a long way. Schools where principals were trained and schools that had a master trainer tended to be more involved overall in LB, so these are two ways to ensure there are active advocates for LB strategies at the school. One of the biggest issues preventing schools from implementing LB well was a lack of initiative to keep the program going strong throughout the year. Schools mentioned barriers like rains damaging reading materials on the walls, staff members leaving, lack of space for book banks, etc. However, few contacted SC staff or worked to find a solution to the problem. This suggests that teachers do not have ownership over the LB program and do not feel a drive to keep it going over the course of the year. Part of the training should include “problem solving” workshops for teachers and principals to think through what to do if they run into obstacles. Teachers and principals also need to truly want to implement these strategies. This requires them to have internal motivation from knowing the program will actually help their students and/or external rewards. 2. Using LB teaching strategies There are several ways to make sure more teachers use the LB strategies. First is to ensure all teachers attend all parts of the training. Many teachers did not attend training and others only attended one or two sessions. Second is ensuring the training is effective so that the teachers both know how to use the techniques and are motivated to use them (shown evidence that the techniques work). Lastly, even if the teachers know how to use the techniques it is very common to fall back into old habits of teaching. Therefore, there needs to be continual monitoring and encouragement, especially from the principal, to continue to use the strategies. Additionally, when teachers face problems in implementing the teaching methods, master trainers or school supervisors need to take a more active role in problem solving with the teacher. 3. Synchronizing with other education initiatives In discussions with SC staff, teachers and principals, they noted because LB strategies were created in the US and have not been applied previously in Indonesia more work needs to be done to align them

48
to the context. First, as SC staff needs to train teachers in these strategies they need a solid understanding of literacy pedagogy. More time needs to be dedicated to building staff’s technical capacity in these teaching strategies. While staff this year understood the main components, they had trouble when teachers questioned them about potential scenarios or asked for evidence that the strategies would work in their classrooms. The findings from this report show that teachers who use more of the strategies have students that perform higher (controlling for other differences), so this is strong evidence that these strategies work. Second, the Ministry of Education already has several education initiatives it is advocating for such as thematic learning, active learning and an existing reading curriculum. SC needs to take time to integrate LB strategies into the larger framework of education policy in the country. 4. Support from family The data suggests the more people a student has encouraging them to study and telling them stories, the better they will do. However, whether a child sees a family member read or is read to directly does not appear to affect the student’s literacy. This is good news because it means that parents who are illiterate can support their student just by encouraging their student to study and telling stories. There should also be a push to meet with more parents as this year’s SC staff had trouble reaching parents. 5. Reading materials at home Access to reading materials at home is also related to student success. Therefore, part of the parent meetings should discuss increasing their print materials at home. Students should also have more opportunities to make reading materials to take home. Teacher training and reading camp volunteer training should focus on how students can create books to read. There could even be a program where students trade books they made. 6. Nutrition Student’s nutrition plays an important role in learning. Even for students from similar socio-economic backgrounds, those that eat breakfast each day are more likely to perform well in school. We recommend that discussion of health factors affecting literacy be added to parent meeting discussions. We also recommend using healthy breakfasts as an incentive for reading camps. Eating breakfast will allow students to concentrate better on learning and the meal will serve as an incentive to increase turnout. Providing vitamins or other nutritional supplements is another way to make a big impact on student’s reading abilities. 7. Consolidation of roles In discussions with teachers and principals, there appeared to be many different people with varying roles in LB at each school: master trainer, reading buddy coordinator, etc. However, from our discussions there did not appear to be one go-to person that ensured each piece of LB was functioning well throughout the year. Each person had their own responsibility and if they faced challenges or could not complete the task, there was no one at the school to report to or get support from. If possible, these roles should be consolidated so fewer people are in charge of disparate tasks. There also needs to be one sole person in charge of ensuring each aspect of LB is operating well, including that teachers are using the LB teaching strategies. It is preferable this role falls to a principal, as they have more influence over teachers and can more successfully hold them accountable. However, many principals we spoke with were very disengaged from LB, so if this is the case, a highly motivated teacher would likely function as a better point person.

49
As this role will consist of a larger time commitment, there should be ways to compensate the person for their efforts. If it is a teacher, maybe they could have fewer additional responsibilities at the school or receive a small stipend. Similarly there should be one point person in the community that is responsible for overseeing reading camps and parent meetings. 8. More frequent communication with school & community point person Related to the above suggestion, SC should be in frequent communication with the point person at each school and in the communities. As the staff this year faced challenges in physically getting to the schools as often as they had planned, we recommend speaking on the phone with these supervisors every other week to ensure the components are operating smoothly and to discuss any problems that have arisen. SC staff should also be in contact with the community point person. 9. Push for 100% attendance at teacher training Many schools noted they did not want to send all of their teachers to training because then there would not be enough staff at the school to watch the students. Many schools would send one teacher from each grade and teachers remaining at the school for the day would watch several classes. There is clear evidence that using LB strategies makes a significant impact over the course of the year, and the gains students make accounts for much more than the couple days of missed schooling when their teacher is at training. While it is not ideal for students to have the day off school, the eventual benefits in learning significantly outweigh several days without school. Another option is to have reading camp leaders come to the school for the day and lead activities while the teachers are at training. This allows all early grade teachers to receive crucial training, while students do not miss a day of learning. Additionally exposing all of the students to the reading camp leaders and activities may make them more likely to attend the weekly camps in their community. 10. Take advantage of 1st & 2nd graders short schedule As 1st and 2nd grade students have shorter school hours with 1st graders attending in the morning for several hours and 2nd graders coming afterwards for several hours, these students have free time while school is in session. We recommend schools provide opportunities for 1st graders to stay after their session is over and 2nd graders to come early. Students could use book banks, letter cards or work on homework. If possible, schools can allocate a room (potentially the library if they have one) or area of the school for these students to take part in academic work. Many of these students already hang around the school area during these times, so this could be an easy way to increase the hours students spent on literacy. 11. Acknowledge & reward good work At the reading festival at the end of the year, schools from all over the area spent many hours preparing visual aids, student performances and reading demonstrations to compete with other schools. Schools and teachers were then recognized for their hard work in front of their peers. Judging from the significant turnout (hundreds of staff and students) and overall level of enthusiasm and time spent, it was clear this was something the staff cared about and was willing to put significant effort into. However this should not be the only time we recognize teachers. Throughout the school year there should be continual school competitions and recognition for hard work. Since so many people are volunteering their time and choosing to make changes in the way they teach, they should be acknowledged for the effort they are putting in. Villages can compete for how many students attend reading camps with the reward being lunch provided at the next reading camp. Principals should recognize teachers based on their improvement in teaching techniques over the year. Students who

50
make the most growth in reading words from their class each month can be given a certificate. All of these aspects show the students, schools and communities that someone recognizes the improvements they are making. 12. Using assessments for teaching A component of the LB strategy is to use assessments to inform teaching throughout the year. From conversations with teachers, this appeared to be one component of the training that was less frequently used. When asked about what they learned from training most teachers discussed areas like phonemic awareness, reading comprehension skills and vocabulary. Few mentioned the use of assessments and those that did discussed the challenges of implementing them without it sucking up a lot of time. Additionally teachers need strategies on how to provide work for other students to do while teacher test students individually in reading. They also need strategies for how to test student all together. For example, teachers can give students a list of words to read and students can demonstrate they know the word by drawing a picture of it. This allows everyone to be tested at once. Future trainings need to focus more on this area as tracking a student’s progress is crucial to giving each student the support they need. Easy techniques like a tracking chart on the wall provide motivation for students to make more progress. Use of frequent assessments is a critical component of LB and increasing the use of this strategy will likely provide further gains for LB students. Focusing on the lowest students 1. Who are they? Low performing students are defined as students who could not read any words from a list of common words and knew fewer than 2/3 of the letters at baseline. Low scoring students are more likely to be from lower SES families, non-Indonesian speakers, those with lower health, boys, girls who work outside the home, those who do not treat their water and those with few reading materials at home. Low performing students were almost twice as likely to be absent at endline, as well. 2. Where are they? In 1/3 of the schools 30-60% of their students were low performers. This high concentration of low performers in certain schools makes them a great place to target additional support. 3. How can we help them? First, since these students are much more concentrated in certain schools, there should be greater attention paid to those schools. Second, the LB activities at these schools should be tailored to students with lower abilities. Currently low performing students do not attend as many activities, so there needs to be more done to adapt these activities to them. At reading camps, there should be an emphasis on low-level skills. Reading camps should also be marketed as something for those who struggle with reading to attend, as the name alone implies it might be an activity for those who can already read. The reading buddies pairing should focus specifically on the lowest students. Those that need the most support should be paired with older, supportive students first, and teachers should monitor throughout the year to make sure the student is learning from their buddy. Third, identification of students’ abilities is crucial to giving them the right support. Therefore, students need to be tested in the beginning of the year so teachers know who needs additional support and what their students’ actual abilities are instead of just teaching to the average students. These techniques need to be a focus of the LB training for next year. Finally, there needs to be a belief that every single student can succeed. From conversations with teachers and staff this is not the current mentality, and so there needs to be a commitment from all levels that every student can become a strong reader.

51
6"#C.).#<2@@&')*21#G&'2--&13.)*217#1. Ensure the assessment works well for both baseline and endline (not too easy or hard) Since the same assessment is used at both the baseline and endline, staff needs to ensure that is it not too hard at baseline or too easy at endline. At this round of the endline, there were many students who scored the highest score possible on each component of the exam. This is problematic because then we do not know their actual level of growth over the year because it surpasses the upper end of the exam. To solve this problem the instrument can be pilot tested with students entering both 2nd and 3rd grade. The 3rd graders will be at a similar reading level as a 2nd grader at the end of the year allowing us to see if the assessment is too easy. 2. Collect data on parents’ attitudes towards literacy In the Nepal endline, enumerators randomly selected students’ homes to visit and asked parents questions about their attitude towards literacy. Parents agreed or disagreed with statements such as “Parents should be involved in teaching their children how to read”, “I do not know how to help my child learn to read” and “the teacher is the only person responsible for teaching children how to read”. The results showed that in general parents valued reading, wanted to help support their student but did not know how. These findings contradict a common notion that parents expect teachers to be the sole person responsible for teaching students. It also shows that parents need support in learning methods to help their student, especially when they themselves cannot read. Performing a similar survey at the baseline for the next round of LB could provide helpful information on how SC can more appropriately support parents. Finally, having data on parental attitudes will help us better understand if some aspects of home literacy environment are in and of itself the factor related to literacy or if there is a deeper underlying variable that affects literacy. For example, access to reading materials at home is positively correlated with literacy, but we do not know if it is the reading materials themselves that matter or if it is that parents that care about education would own more books and also provide other supports for their student to ensure they are successful in school. Understanding parental attitudes allows us to disentangle some of these effects. 3. Expand reading comprehension section As the current instrument only includes five comprehension questions there are challenges in assessing the results, as there are so few questions. Adding a couple more questions would improve the reliability of the results on this component. 4. Increased accuracy from data collection to data entry For several questions, the option “other” and “don’t know” should be provided for students to choose from to prevent the assessor from leaving the question blank. The codes in Excel should match exactly with the codes from the questionnaire including options for “other”, “don’t know” and student simply not answering the question. At the end of a day of data entry, enumerators should switch and randomly check one student the other assessor entered. This will help catch typos and catch and any differences in the way certain assessors enter data. To enter birthdays there should be a column for day, month and year separately.

52
6*D@*29/.F;0#!Badan Pusat Statistik - Statistics Indonesia, 2012 Cohen, J. (1988). Statistical Power Analysis for the Behavioral Sciences (second edition). Lawrence
Erlbaum Associates. Friendlander, E., Hordofa, T., Diyana, F., Hassen, O., Dowd, A. (2012). Literacy Boost Ethiopia: Year 2
Report. Washington, DC: Save the Children Martorell, R. 1996. "Undernutrition During Pregnancy and Early Childhood and its Consequences for
Behavioral Development." Paper prepared for World Bank's conference on Early Child Development: Investing in the Future, April 8 & 9, 1996.
Salem, R. (2007). “Is Gender Bias in Education Mediated by Sibling Configuration”. Office of Population
Research: Princeton University. UNESCO, Education for All Global Monitoring Report, Why Literacy Matters (2006). ## #

53
4FF&13*%#M#[#G&9/&77*21#R()F()7# Table A.1: Logistic Regression Predicting Attrition VARIABLES Attrition
Literacy Boost 0.1500 -0.165 -0.0568 -0.0932 0.0390 -0.0263 0.242
(0.2448) (0.212) (0.201) (0.193) (0.218) (0.255) (0.287)
Age 0.0450
-0.2558*** (0.0270) (0.0899)
Household size -0.320***
0.0899
(0.0399) (0.0650)
Size of lunch
-1.010***
-0.631**
(0.0976) (0.213)
Student reported feeling healthy
-1.809***
-0.541
(0.168) (0.439)
Concepts about print
-0.223***
-0.0162
(0.0220) (0.0620)
Total letters identified
-0.0471*** -0.0291**
(0.00536) (0.00952)
Observations 590 670 669 666 672 672 582 *** p<0.001, ** p<0.01, * p<0.05. Robust standard errors in parentheses. Table A.2: Logistic Regression Predicting Attrition by Background Characteristics VARIABLES Attrition
Gender -0.770** -0.774**
(0.272) (0.278)
Repeated 1st grade 0.677** 0.634**
(0.233) (0.240)
Constant -1.539*** -2.077*** -1.751***
(0.147) (0.143) (0.182)
Observations 672 671 671
*** p<0.001, ** p<0.01, * p<0.05. Robust standard errors in parentheses.

54
Table A.3: Logistic Regression Predicting Attrition by Background Characteristics in Literacy Boost Schools VARIABLES Attrition
Sex -0.759* -0.670
(0.338)
(0.378)
Age 0.238
0.203
(0.154) (0.205)
Repeated 2nd grade 1.337*** 1.064*
(0.402) (0.490)
Number of chores 0.200 0.154
(0.132) (0.142)
Total letters identified
-0.0149 -0.00151
(0.0106) (0.0161)
Individual words read
-0.0292 -0.0256
(0.0177) (0.0242)
Stunted -1.025**
(0.396)
Constant -1.367*** -3.529** -1.848*** -2.182*** -0.790*** -1.134** -1.399*** -2.826
(0.160) (1.201) (0.134) (0.402) (0.138) (0.433) (0.208) (1.481)
Observations 394 354 392 394 394 394 393 352 *** p<0.001, ** p<0.01, * p<0.05. Robust standard errors in parentheses.

55
Table A.4: Regression Models Predicting Change in Scores from Baseline to Endline with Baseline Controls
VARIABLES Gain oral comprehension
Gain reading fluency
Gain reading comprehension
Gain concepts about print
Gain letters Gain individual words
Gain reading accuracy
Gain non-reader
Literacy Boost 0.691* 4.822~ 0.402* 0.292 -0.163 -0.456 -0.954 0.00323
(0.252) (2.531) (0.195) (0.259) (0.941) (0.892) (-5.653) (-0.0567)
Baseline oral comprehension
-0.409*** (0.0854)
Diarrhea for more than 3 days
0.185 1.307 -0.209 (0.411) (2.85) (0.295)
Size of lunch -3.760* -0.416 -0.476 (1.672) (0.345) (0.366)
Baseline reading comprehension
-0.774***
(0.0388)
Distance from city center
-0.0155* -0.0214*
(0.00602) (-0.00934) Baseline CAP score -0.812***
(0.0302)
Baseline letters -0.53***
(0.064) Amt earned working
-5.98E-05
(5.12E-05)
Baseline individual words
-0.605***
(0.065)
Baseline reading accuracy
-0.490***
(0.062) Non-reader at baseline
-0.634***
(0.0613)
Constant 1.432*** 23.89*** 3.649*** 7.904*** 29.02*** 13.85*** 61.06*** 0.0171
(0.233) (3.551) (0.191) (0.357) (2.919) (1.194) (6.351) (0.0352)
Observations 96 510 390 549 562 578 574 580 R-squared 0.201 0.032 0.543 0.576 0.605 0.517 0.269 0.458
*** p<0.001, ** p<0.01, * p<0.05, ~p<0.1. Robust standard errors in parentheses.

56
Table A.5: Regression Model Predicting School Involvement & Use of Teaching Strategies by Baseline Characteristics
VARIABLES School involvement in LB components
# of LB teaching strategies used
Km from city center
0.0138* (0.00652)
School day length (hours)
5.745~
(2.860)
Constant 1.096*** 11.57
(0.129) (9.621)
Observations 374 335
R-squared 0.157 0.158
*** p<0.001, ** p<0.01, * p<0.05. Robust standard errors in parentheses. Table A.6: Regression Model Predicting Fluency Gain by Involvement in LB with Baseline Controls
VARIABLES Gain reading fluency
Gain reading fluency
Gain reading comprehension
Fluency (baseline)
0.0749 0.0617 (0.0626) (0.0629)
School involvement in LB components
9.042* (3.222)
Km from city center -0.167 (0.118)
# of LB teaching strategies used 0.655* 0.0495*
(0.281) (0.0215)
School day length (hours) 1.178 -0.147
(2.181) (0.138)
Reading comprehension (baseline) -0.758***
(0.0554)
Constant 10.57** 9.902~ 3.623***
(3.554) (5.715) (0.576)
Observations 322 333 275
R-squared 0.037 0.034 0.601 *** p<0.001, ** p<0.01, * p<0.05, ~ p<0.1. Robust standard errors in parentheses

57
Table A.7: Regression Model Predicting LB Activity Reported Attendance by Baseline Characteristics
*** p<0.001, ** p<0.01, * p<0.05. Robust standard errors in parentheses. Table A.8: Regression Model Predicting Gain in Letter Identification by LB Activity Attendance with Baseline Controls VARIABLES Gain in letters identified
Number of LB activities student reported attending recently
0.269**
(0.12)
Reading materials at home (baseline) -0.304
(0.236)
Number of chores (baseline) -0.622**
(0.229)
Letters (baseline) -0.560***
-0.0913
% of family that told story to student (baseline)
-2.016
-1.329
Constant 31.24***
-3.629
Observations 325
R-squared 0.631 *** p<0.001, ** p<0.01, * p<0.05. Robust standard errors in parentheses.
VARIABLES Number of LB activities student reported attending recently
Reading materials at home (baseline)
0.462*** 0.355*** (0.101) (0.0975)
Number of chores (baseline) 0.341** 0.350**
(0.128) (0.152)
Letters (baseline) 0.0310** 0.0252*
(0.0113) (0.0125)
% of family that told story to student (baseline)
1.951** 1.491*
(0.792) (0.843)
Constant 2.297*** 2.873*** 2.409*** 3.187*** 0.485 (0.308) (0.366) (0.405) (0.32) (0.551)
Observations 328 328 328 325 325 R-squared 0.041 0.021 0.021 0.02 0.084

58
Table A.9: Regression Predicting Endline Fluency with Interactions between Gender, Household Size
VARIABLES Reading Fluency
(Endline)
Gender 25.42***
(5.578)
Household size -0.555
(0.925)
Interaction between gender & household size
-3.117**
(1.062)
Constant 33.63***
(6.057)
Observations 581
R-squared 0.052
*** p<0.001, ** p<0.01, * p<0.05. Robust standard errors in parentheses. Table A.10: Regression Predicting Fluency by Health Characteristics VARIABLES Reading Fluency (endline)
Stunted
-5.315~ -5.448~
(2.909) (2.790)
Underweight -7.784* -6.727*
(2.957) (2.973)
Socio-economic status 1.138
(0.760)
Constant 42.39*** 35.45***
(3.599) (5.628)
Observations 509 506
R-squared 0.038 0.047

59
Table A.11: Regression Predicting Endline Literacy by Breakfast Size
VARIABLES Reading fluency
(endline) Letter identification
(endline) Student cannot read
(endline) Individual words read
(endline)
Size of breakfast 4.466* 1.297* -0.0621* 0.864*
(1.869) (0.604) (0.0291) (0.409)
Socio-economic status 1.759* 0.434* -0.0256* 0.320*
(0.780) (0.171) (0.00949) (0.129)
Constant 17.12** 41.89*** 0.432*** 13.86***
(5.930) (2.152) (0.107) (1.612)
Observations 576 576 576 576
R-squared 0.031 0.022 0.034 0.024
*** p<0.001, ** p<0.01, * p<0.05. Robust standard errors in parentheses. Table A.12: Regression Predicting Fluency by Water Treatment
VARIABLES Fluency (endline)
Accuracy (endline)
Letters identified (endline)
Concepts about print (endline)
Individual words read
(endline)
Student cannot read
(endline)
Reading comprehension
(endline)
Socio-economic status
1.578~ 2.259* 0.393* 0.118** 0.283* -0.0238* 0.150***
(0.786) (0.971) (0.164) (0.0368) (0.124) (0.00923) (0.0264)
Treats water 7.530* 14.07* 2.945** 0.605* 1.930* -0.118~ 0.749***
(3.306) (6.071) (1.057) (0.244) (0.805) (0.0626) (0.204)
Constant 19.33** 57.28*** 41.85*** 8.141*** 13.90*** 0.417*** 2.369***
(6.483) (10.89) (2.002) (0.374) (1.463) (0.107) (0.258)
Observations 567 567 567 567 567 567 463
R-squared 0.027 0.033 0.026 0.037 0.027 0.033 0.090

60
Table A. 13: Regression Predicting Fluency & Reader Status by Home Literacy Environment with Interactions
VARIABLES Student cannot read
(endline) Reading fluency (endline)
Types of reading materials at home -0.0510* 3.505* 3.414* 7.386** (0.0213) (1.398) (1.400) (2.421)
Socio-economic status -0.0560* 3.506 4.639* 3.356 10.73* (0.0249) (2.476) (2.278) (2.394) (5.253)
% of family that helps student study
17.33** 16.68**
(4.875) (4.686)
Interaction between SES & reading materials
-2.151~
(1.123)
Gender 0.686
(3.482)
% of family student has seen read -5.669
(5.810)
Interaction between gender & % of family students has seen read
20.30**
(7.069)
Constant 0.451*** 16.83* 19.77** 11.51~ 4.360 32.25***
(0.119) (6.472) (5.990) (6.697) (10.38) (3.587)
Observations 576 576 576 576 576 579
R-squared 0.054 0.045 0.038 0.061 0.052 0.029

61
Table A.14: Regression Predicting Fluency by Language & Preschool Attendance with Interaction
VARIABLES Reading Fluency
(endline)
Indonesian not primary language
1.461
(4.601)
Attended preschool 12.28**
(4.412)
Interaction between language & preschool attendance
-13.59*
(5.417)
Constant 29.10***
(4.176)
Observations 580
R-squared 0.043
*** p<0.001, ** p<0.01, * p<0.05. Robust standard errors in parentheses. Table A. 15: Regression Predicting Reader Status by Chores VARIABLES Student cannot read (endline)
Number of chores
0.0290* 0.0237~
(0.0129) (0.0122)
Socio-economic status -0.0216*
(0.00874)
Constant 0.0828~ 0.218**
(0.0426) (0.0781)
Observations 580 575
R-squared 0.018 0.038

62
!""#$%&'()*(+$%&,&%-./(01233/(4#5-/65( Table B.1: Literacy skills at endline & gain made over 1 year at each school
!"!
#$%&$#'!"!(%)*!)*!#$%&$#'!
+,-$*./!012!3456!
7%)*!)*!2,-$*./!
8..-#%./!012!3456!
7%)*!)*!%..-#%./!
9$::$#'!012!;<6!
7%)*!)*!,$::$#'!
=1.%>!012!<46!
7%)*!?1.%>!
@1*.$A:'!%>1-:!A#)*:!
7%)*!)*!@8B!
C$%&)*(!.1DAE!012!;6!
7%)*!)*!#$%&)*(!.1DAE!
7( F4! 34! ;;EF! <4EG! FHEG! 3FE5! ;4EG! <E5! 3FE3! <EI! 34E<! J4EI! IEK! 4EI!)( 344! 4! H4EH! <GEF! 34IE;! 3HE3! ;4EF! 3E;! 3FEF! 4EI! FE5! J4EG! IE5! 3E<!8( 344! 34! G5E5! <3E;! 34;E5! 3FEH! IFEH! <E3! 3FEF! 4EK! 34EG! J3E3! IE;! 3EK!9( 344! 4! GKE3! <;E<! 34GE<! 35E<! ;3! <EG! <4! 4EI! FE;! 3EK! IE<! <EI!:( 344! 34! ;KE5! K4E<! 343EK! K;EG! IFE<! 3EG! 3FEH! 3E;! 34EG! J4EG! KEH! 3!;( I4! 34! 3<EF! 5EK! KHEH! <IEF! KFEG! 3IEG! 34EI! IEF! GE;! <EI! IEI! 3E5!<( F4! 54! <<E;! <3E;! 55E3! 5KEK! ;4EH! 3;E3! 3FEG! 3;EF! H! <EI! IE3! 4!=( G4! I4! 34EH! 5EH! ;5E;! IHE<! I;EF! GE5! 3GEK! HE5! G! KE<! <E5! I!>( F4! 34! ;4EI! KKE3! FHEG! KGE3! ;4EG! KEH! 3FEK! KEF! FE<! 4EI! IE5! 3EI!7?( F4! G4! KHEF! K3E<! 55EG! G5EK! IHE;! 5EK! 3HEG! 33E3! GEG! <! IE3! J!77( 344! 34! ;<E<! <IE;! 34<EF! KKE5! IFEF! IE<! 3FEH! KE<! FE;! 4EG! IE;! 3E<!7)( 344! <4! ;FEG! <<EF! 34IE3! K<E3! ;4E;! IEI! 3FEF! <EH! FEH! 4E;! IE;! 4E;!78( 54! K4! <IEF! 35EF! H;EG! IKE<! IIEG! 3;EK! 3HEF! 5E5! ;EH! KE;! KE;! <EK!79( I4! 34! 3HEG! 3K! KG! 3GE3! K3! FE<! 5EF! KE;! GE;! <E<! K! <E;!7:( 54! 54! 35E<! 35E<! HGEI! HGEK! IHEH! 3;EF! 3HEI! 3KE;! HE;! 3EK! KE;! J!7;( H4! H4! 3<E3! 3<E3! G4E<! G4E<! I5E3! 3IE3! 3;EI! 3IE3! ;! KE5! <E3! J!7<( H4! K4! KIEK! 35E<! H4E;! K3E5! I;EH! HE3! 3GEI! GEF! 5! <E3! IEI! 3E<!7=( F4! 34! I<EF! KKEI! 5GE<! KIEG! I5E;! ;E<! 35EG! ;EK! FE<! 4EF! IEK! 3EH!7>( 344! K4! IGE3! <KE;! 343EI! I<EI! IFEH! ;E;! 3FEG! KE3! FEG! 4EF! IEH! 3EI!)?( H4! ;4! 3KE3! HEK! G4E;! IIE3! IFE;! 34EF! 3G! 3<E3! ;EF! <E3! <E;! J!)7( F4! K4! I<EG! <;EI! FGEI! IIEH! ;4E<! KE3! 35EF! IEF! 5EF! 4EI! <E<! 4EI!))( G4! I4! 3IE<! 3<E;! ;HE3! IIEI! KFE5! FEK! 3IE<! FE5! GE<! <E;! KEK! J!)8( K4! <4! FE;! HEF! <FEG! <IEH! K<EK! 3<! 34EK! GE5! HEH! J4EH! <E5! 3!)9( 344! K4! KKEI! <;E3! 34KE3! G<! I5EG! HEH! 3FEG! 5E3! HEG! <E3! <EF! 3!):( F4! 34! IIE<! <GEH! FIE;! K<EH! I5E3! KE3! 35EG! <EK! 34E<! J4EK! IE;! 3EI!);( G4! I4! <IE<! <4E5! ;5E5! I;E5! I3EH! 3;EF! 3<E<! HEG! HE;! 4E5! IEI! 4!)<( F4! 34! IGE5! 3FE5! F5EG! <GEF! IFE<! KE5! 35EF! IE3! 5EF! 4EH! IE;! <E3!)=( I4! 34! 34EI! HEH! KFE3! <3EF! I3! 3<E5! 5E5! IEG! 5E3! J4E5! IEG! 3EK!)>( H4! I4! 3HEF! 3<EI! G;E3! I3EF! KFE3! 5E3! 3KE5! GEI! 5EH! 4E3! KEG! 3E<!8?( 344! 4! IKEG! 3HEF! 34;EI! <5EG! ;3E<! <EG! 3FEF! <E5! FEI! 4! IEH! <EI!87( F4! <4! I5E5! <HE;! FGE<! <5EH! IFE3! <EH! 3FEG! <E5! FE5! 4E;! IE3! 3E5!8)( F4! 34! <GEK! 3KEK! 5;E;! <FEF! IIEF! KE5! 3HEF! KE5! 5EK! 3E3! KE3! <E;!88( 54! 54! 3FE3! 35EI! HHEI! HKE3! I;E5! 3KE5! 3;EG! 33EG! 5E<! 4! KEK! I!89( 344! <4! K<E3! <KE<! 344EG! ;;EG! IHEI! <E5! 3FEH! GEH! HEK! 3EI! <EH! 3EF!
8;( F4! ;4! <IEK! <4E3! 5FE3! GHEI! I5E;! 3KEK! 35EF! 3<E;! HEH! 3E5! KE;! J4EK!

63
Table B.2: Histogram of Gains in Fluency made by Students by LB School
Gain in words read per minute at each school
-50 0 50 100 -50 0 50 100 -50 0 50 100 -50 0 50 100 -50 0 50 100
-50 0 50 100 -50 0 50 100 -50 0 50 100 -50 0 50 100 -50 0 50 100
-50 0 50 100 -50 0 50 100 -50 0 50 100 -50 0 50 100 -50 0 50 100
-50 0 50 100 -50 0 50 100 -50 0 50 100 -50 0 50 100 -50 0 50 100
1 3 4 5 6
7 8 9 10 11
12 13 14 16 18
19 25 26 27 29
Gain in words read per minuteBy school