literature review - 100907 - ipart · literature review underlying costs and ... qvb post office...
TRANSCRIPT

Independent Pricing and Regulatory Tribunal
Literature Review
Underlying costs and industry structures of
metropolitan water industries
September 2007
IPART cvr_water_A4.indd 1 11/09/2007 10:27:53 AM


Literature Review Underlying costs and industry structures of metropolitan water industries
September 2007

IPART Literature Review
© Independent Pricing and Regulatory Tribunal of New South Wales 2007
This work is copyright. The Copyright Act 1968 permits fair dealing for study, research, news reporting, criticism and review. Selected passages, tables or diagrams may be reproduced for such purposes provided acknowledgement of the source is included. ISBN 978-1-921328-07-7
Inquiries regarding this document should be directed to:
Jennie Cooper (02) 9290 8403
Richard Warner (02) 9290 8406
Colin Reid (02) 9290 8414
Independent Pricing and Regulatory Tribunal of New South Wales PO Box Q290, QVB Post Office NSW 1230 Level 2, 44 Market Street, Sydney NSW 2000
T (02) 9290 8400 F (02) 9290 2061
www.ipart.nsw.gov.au

Contents
Literature Review IPART
Contents
1 Introduction 1
2 Cost Structures 2 2.1 Functional elements of water and wastewater services supply 2 2.2 Key cost characteristics of water and wastewater services 9 2.3 Economies of scale and scope 22
3 Industry Structures 25 3.1 Monopoly supply 26 3.2 Yardstick competition 32 3.3 Competition for the market 36 3.4 Competition for supply inputs 46 3.5 Competition in the market 47
Bibliography 57
Appendices 65 A Studies Reviewed on Economies of Scale and Scope 67

Contents
IPART Literature Review

1 Introduction
Literature Review IPART 1
1 Introduction
In 2004, the NSW Government asked the Independent Pricing and Regulatory Tribunal (IPART) to investigate alternative arrangements for the delivery of water and wastewater services, including possible private sector involvement. IPART released its final report in late 20051 and the NSW Government introduced the Water Industry Competition Act 2006 (the WICA) to give effect to IPART’s recommendations. The aim of the WICA is to harness private sector innovation and investment in the NSW water and wastewater industries, and to promote competition.
Set against a background of increased private sector participation in the provision of water and wastewater services, IPART has undertaken a review of the literature on the cost structures of metropolitan water industries, as well as the different ways in which metropolitan water industries are structured, both in Australia and elsewhere.
The results of this literature review are presented below:
Section 2 focuses on cost structures, summarising the literature on the functional elements and cost characteristics of water and wastewater supply
Section 3 discusses industry structures, looking at various examples of different water industry structures or configurations in metropolitan areas in Australia and other countries.
1 See IPART, Investigation into Water and Wastewater Service Provision in the Greater Sydney Region, Final
report, October 2005.

2 Cost Structures
2 IPART Literature Review
2 Cost Structures
The cost structures and cost characteristics of the water and wastewater industry are important when considering the potential scope for competition in and/or the optimal configuration of the industry, including potential third party access arrangements. For example, Ballance and Taylor (2005) state that the starting point for assessing whether a market of multiple sellers could work in water is “observing some of the basic costs and characteristics of water supply.”2
Similarly, in response to stakeholders’ concerns that market competition in the England and Wales water industry will be stifled until the costs of supplying water to customers are more easily understood and readily identified, Ofwat recently stated that:3
…there is a need to better understand the value of water and sewerage services, and the costs the companies incur along the supply chain. This cost allocation work will underpin many of Ofwat’s priorities.
The sections below discuss the findings of the literature review, including findings on the functional elements of water and wastewater service supply, the key cost characteristics of the water and wastewater industry, and the economies of scale and scope in the industry.
2.1 Functional elements of water and wastewater services supply
In considering the cost structure of the water and wastewater industry, it is important to understand the elements of the water and wastewater supply chains.
2 Ballance, T. and Taylor, A. (2005) Competition and Economic Regulation in Water – The Future of the
European Water Industry, IWA Publishing: London, UK, p 12. 3 Ofwat, Outcomes of Ofwat’s internal review of market competition in the water sector, 4 April 2007, p 41.

2 Cost Structures
Literature Review IPART 3
2.1.1 Traditional elements of water and wastewater services supply
There is general consensus in the literature that metropolitan water supply chains comprise the following key elements or activities:4
a source of water supply – such as dams to capture and store surface water run-off, groundwater reservoirs, etc
treatment plants – to remove natural and other pollutants, and to treat raw water to a useable (potable or non-potable) standard
distribution infrastructure – including large/trunk pipelines before and after treatment plants, and reticulation networks (medium and small pipelines), pumping stations and local reservoirs, to transport water from its source to treatment plants and then from treatment plants onto customers5
customer service activities, often referred to as retailing – including billing, meter reading, and responding to complaints or service failures.
4 For example, see: Armstrong, M., Cowan, S., and Vickers, J. (1994) Regulatory Reform: Economic
Analysis and British Experience, The MIT Press: Cambridge, Massachusetts, pp 323-324; Spellman, F.R. and Drinan, J. (2000) The Drinking Water Handbook, CRC Press, p 61; Ofwat, Guideline for the Analysis of Operating Costs and Assets, Regulatory Accounting Guideline 4.03, Operative: Financial Year 2006-07, February 2007; Ballance, T. and Taylor, A. (2005) Competition and Economic Regulation in Water – The Future of the European Water Industry, IWA Publishing: London, UK, p 10; Raftelis, G. (1993) Comprehensive Guide to Water and Wastewater Finance and Pricing (2nd ed), Lewis Publishing: United States, pp 163-180; Grigg, N. (2003) Water, Wastewater, and Stormwater Infrastructure Management, Lewis Publishers: United States, pp 19-50; Tasman Asia Pacific, Third Party Access in the Water Industry – An Assessment of the Extent to which Services Provided by Water Facilities Meet the Criteria for Declaration of Access, September 1997, pp 1–15.
5 Grigg (2003) reports that the American Water Works Association describes four types of pipes: • Transmission lines – lines (typically large) that carry water from source to plant or from plant to
distribution system • In-plant piping – piping located in pump stations or treatment plants • Distribution mains – pipelines that distribute water around a community • Service (services) – small-diameter pipes from distribution mains to use points. (See Grigg, N. (2003) Water, Wastewater, and Stormwater Infrastructure Management, Lewis Publishers: United States, p 29).

2 Cost Structures
4 IPART Literature Review
Likewise, there appears to be general agreement that wastewater service systems are typically made up of the following elements or activities:6
wastewater collection and transmission infrastructure - to transport wastewater from customers to wastewater treatment plants (including reticulation pipelines and associated fittings to transport wastewater from source to trunk network, trunk pipelines to transport wastewater from the local collection network to treatment plants, pump stations and overflow structures)
treatment and disposal facilities - which comprise wastewater treatment plants to remove the sludge or biosolids from the wastewater, treat the wastewater to varying levels (eg, primary or tertiary treatment, depending on the receiving environment and prevailing environmental standards), and then dispose of the wastewater via emissions to rivers or the ocean or by providing it for recycled water generation
residuals management - which involves removing sludge or biosolids from the wastewater, and then incinerating them, dumping them at sea or using them as fertilizer on farm land
customer service activities - including billing, meter reading, and responding to customer issues.
Water and wastewater utilities also have activities or assets that support, and are common to, more than one of these supply chain elements. These include, for example, accounting, finance and general administration activities and assets (ie, corporate overheads). These ‘shared’ activities/assets translate into shared costs (ie, ‘joint’ or ‘common’ costs). The allocation of common or joint costs to particular activities or services is discussed in section 2.2.2 below.
2.1.2 Recent changes to water and wastewater service supply
In recent times, traditional water and wastewater supply chains have evolved to some extent. The primary driver of this change appears to be increasing water scarcity from traditional sources (ie, dams), and the resulting need to develop alternative supply sources.7 For example, in many areas throughout Australia, water
6 For example, see: Armstrong, M., Cowan, S., and Vickers, J. (1994) Regulatory Reform: Economic
Analysis and British Experience, The MIT Press: Cambridge, Massachusetts, pp 323-324; Spellman, F.R. and Drinan, J. (2000) The Drinking Water Handbook, CRC Press, p 61; Ofwat, Guideline for the Analysis of Operating Costs and Assets, Regulatory Accounting Guideline 4.03, Operative: Financial Year 2006-07, February 2007; Ballance, T. and Taylor, A. (2005) Competition and Economic Regulation in Water – The Future of the European Water Industry, IWA Publishing: London, UK, p 10; Raftelis, G. (1993) Comprehensive Guide to Water and Wastewater Finance and Pricing (2nd ed), Lewis Publishing: United States, pp 163-180; Grigg, N. (2003) Water, Wastewater, and Stormwater Infrastructure Management, Lewis Publishers: United States, pp 19-50; Tasman Asia Pacific, Third Party Access in the Water Industry – An Assessment of the Extent to which Services Provided by Water Facilities Meet the Criteria for Declaration of Access, September 1997, pp 1–15.
7 For example, this issue is discussed in the NSW Government’s 2006 Metropolitan Water Plan.

2 Cost Structures
Literature Review IPART 5
recycling has emerged as an alternative means of wastewater disposal and of water supply augmentation. The Water Services Association of Australia (WSAA) notes:8
Wastewater has gained greater recognition as an increasingly valuable resource and the adoption of wastewater recycling technology has expanded significantly in recent years. …The recent drought conditions have confirmed the role of recycled water as a valuable resource and current efforts are focused on large scale, often high technology, recycled water schemes. Applications for recycled water have included agriculture, industry, aquifer recharge and third pipe residential solutions.
…Water recycling may occur at the household level, at the local neighbourhood level, prior to centralised treatment, after treatment or even as extraction from a river downstream of a utility’s discharge point. Although the role of water recycling is still being developed in Australia, the potential impact in the future may be substantial.
To date in Australia, recycled water has been kept separate from potable water supply. That is, separate infrastructure has been installed to reticulate recycled water to parks and golf courses, or to provide recycled water to households for outdoor, non-potable use. However, in some locations throughout the world, recycled water is produced for planned ‘indirect potable’ use. This involves treating recycled water, and then injecting it into the water source (dam or underground reservoir) from which raw water is drawn for treatment and then potable use. For example, Singapore’s NEWater scheme involves augmenting water supplies via planed ‘indirect potable’ use. NEWater currently accounts for about 1 per cent of Singapore’s total daily water consumption. However, there are plans to increase this to 2.5 per cent by 2011.9
8 Water Services Association of Australia (WSAA), Identifying Costs for Wastewater Services, WSAA
Occasional Paper No. 16, January 2007, pp 38-39. 9 Singapore Government, NEWater – Overview, downloaded from: www.pub.gov.sg on 30 April 2007.

2 Cost Structures
6 IPART Literature Review
Desalination plants have also emerged as a means of augmenting water supply from traditional sources and improving management of security of supply. For example, Perth recently constructed a desalination plant (and has plans to build a second), while the NSW Government has decided to build one for Sydney.10 Internationally, desalination is used extensively as a major supply of water in areas such as the Middle East, North Africa, the Caribbean, Southern Europe, China, Singapore and the USA.11 The world’s largest desalination plant is in Israel: the Askelon plant was completed in 2005 and has an annual production capacity of 108GL. It produces water at a cost (at the factory gate) of around $A0.83 per kilolitre.12 Reddy and Ghaffour (2007), Barron (2006), and Grigg (2003) report that desalination has become more feasible in recent times, as costs have come down and technology (including reverse osmosis) has improved.13
Trading between urban water utilities and irrigation markets has also occurred to a limited extent in some areas. For instance, the Water Corporation in Western Australia has purchased water from the Harvey irrigation district, and will look at further trading opportunities as a means of augmenting water supplies.14
10 Examples of desalination plants constructed or proposed include:
• Perth - Australia’s first large scale desalination plant commenced operation in Perth in late 2006 and will supply 17 per cent of the city’s water. (See Water Corporation, Perth Seawater Desalination Project and Frequently Asked Questions – Supply of desalinated water into the IWSS, downloaded from: www.watercorporation.com.au on 21 March 2007). The Government has also announced plans to build a second desalination plant. (See Sydney Morning Herald, New desalination plant for Western Australia, 15 May 2007.)
• Gold Coast - a desalination plant is currently being constructed and is expected to supply 125 megalitres per day by the end of 2008. (See Queensland Government, Ministerial Media Statement (Hon. Anna Bligh), Early Works Commence on QLD’s Largest Desalination Facility, 19 September 2006). The Queensland Government is also investigating the possibility of boosting capacity to 170 megalitres per day. (See Queensland Water Commission, Media Release - New plan to increase desalinated water output: Bligh, 9 August 2007).
• Victoria – construction will begin in 2009 on a desalination plant in the Wonthaggi region, which will supply water to Melbourne, Geelong and South Gippsland and Western Port towns. The plant is expected to be operational by the end of 2011. (See Victorian Government, Desalination Plant – Frequently asked questions, downloaded from: www.ourwater.vic.gov.au on 13 August 2007.)
• Sydney - construction will shortly commence on a desalination plant at Kurnell. The plant will be capable of producing 250 megalitres per day, with the potential to increase to 500 megalitres per day in the future. (See Sydney Water, Media Release – Contract signed for Sydney’s desalination project, 19 July 2007).
11 Western Australia Water Corporation (2006), Desalinisation, Paper prepared for the 2006 Australian State of the Environment Committee, Department of the Environment and Heritage, Canberra.
12 The Israeli Government (under its 2000 Desalination Master Plan) has called for a series of desalination plants, which will, together, produce 750 GL/year by 2020. See Allen Consulting Group, Saying goodbye to permanent water restrictions in Australia’s cities – Key priorities for achieving water security, Report Commissioned by Infrastructure Partnerships Australia, May 2007, p 17.
13 Barron, O., Desalination Options and their Possible Implementation in Western Australia: Potential Role for CSIRO Land and Water, CSIRO: Water for a Healthy Country National Research Flagship, June 2006; Reddy, K. and Ghaffour, N. (2007) “Overview of the cost of desalinated water and costing methodologies”, Desalination, 205, pp 340-353; and Grigg, N. (2003) Water, Wastewater, and Stormwater Infrastructure Management, Lewis Publishers: United States, p 24.
14 Water Corporation, Integrated Water Supply Scheme Source Development Plan 2005-2050 – An Overview, 2005, downloaded from: www.watercorporation.com.au on 10 May 2007. See also, Allen Consulting Group, Saying goodbye to permanent water restrictions in Australia’s cities – Key priorities for achieving water security, Report Commissioned by Infrastructure Partnerships Australia, May 2007, p 15.
2 Cost Structures
Literature Review IPART 7
In terms of other sources of water supply, South Australia has a stormwater capture and reuse project in place for municipal irrigation use,15 and in New South Wales, an increasing number of rainwater tanks have been installed at properties in recent years (supported by the NSW Government’s Rainwater Tank Rebate Program). Tanks provide a very localised means of water supply augmentation.
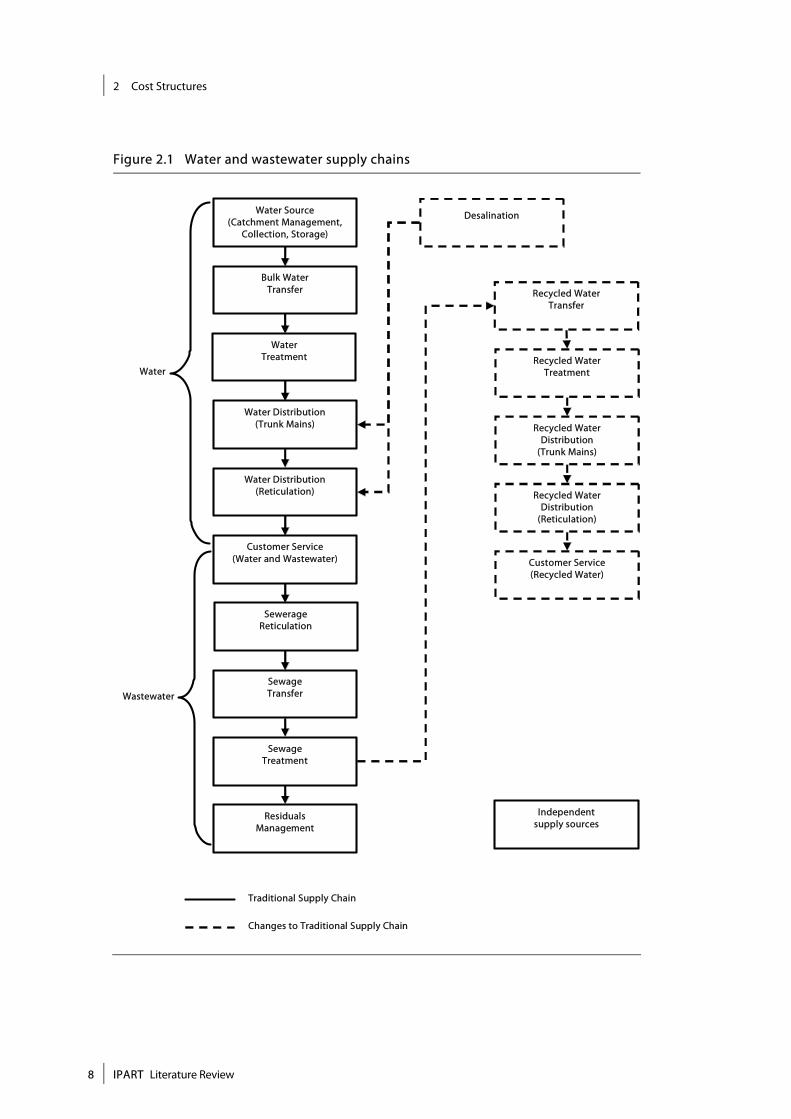
Based on a review of the literature,16 Figure 2.1 below depicts the water and wastewater supply chains, including recent changes to elements of these supply chains. The figure assumes that recycled water is not sourced for direct or indirect potable use.
15 The Salisbury City Council has developed an initiative, whereby suburban stormwater run-off is
collected in a wetland, waste is filtered out, and the cleaned water is then injected into aquifers during wet periods to be harvested during dry periods. See Australian Financial Review, All’s well in the expanding world of man-made aquifers, 22 March 2007; and Prime Minister’s Science, Engineering and Innovation Council (PMSEIC), Recycling Water for our Cities, 28 November 2003, p 6.
16 For example, see: Armstrong, M., Cowan, S., and Vickers, J. (1994) Regulatory Reform: Economic Analysis and British Experience, The MIT Press: Cambridge, Massachusetts, pp 323-324; Spellman, F.R. and Spellman, F.R. and Drinan, J. (2000) The Drinking Water Handbook, CRC Press, p 61; Ofwat, Guideline for the Analysis of Operating Costs and Assets, Regulatory Accounting Guideline 4.03, Operative: Financial Year 2006-07, February 2007; Ballance, T. and Taylor, A. (2005) Competition and Economic Regulation in Water – The Future of the European Water Industry, IWA Publishing: London, UK, p 10; Raftelis, G. (1993) Comprehensive Guide to Water and Wastewater Finance and Pricing (2nd ed), Lewis Publishing: United States, pp 19-50; Tasman Asia Pacific, Third Party Access in the Water Industry – An Assessment of the Extent to which Services Provided by Water Facilities Meet the Criteria for Declaration of Access, September 1997, pp 1–15; Water Services Association of Australia, Identifying Costs for Wastewater Services, WSAA Occasional Paper No. 16, 2007.
2 Cost Structures
8 IPART Literature Review
Figure 2.1 Water and wastewater supply chains
Wastewater
Water Distribution (Trunk Mains)
Water Distribution (Reticulation)
Customer Service (Water and Wastewater)
Sewerage Reticulation
Sewage Transfer
Sewage Treatment
Residuals Management
Water
Desalination
Recycled Water Transfer
Recycled Water Treatment
Recycled Water Distribution
(Trunk Mains)
Recycled Water Distribution
(Reticulation)
Customer Service (Recycled Water)
Independent supply sources
Water Source (Catchment Management,
Collection, Storage)
Bulk Water Transfer
Water Treatment
Traditional Supply Chain
Changes to Traditional Supply Chain

2 Cost Structures
Literature Review IPART 9
2.2 Key cost characteristics of water and wastewater services
The water industry is recognised as being very capital intensive, with a high proportion of its fixed assets having very long lives (50 years or more). Many of the fixed assets have little or no alternative use and as such represent large sunk costs.17 The transmission and distribution networks comprise a significant proportion of overall costs, and it is generally uneconomic to duplicate this infrastructure.
As a consequence of these characteristics, the provision of reticulated water and wastewater services are usually considered natural monopolies. For example, Cowan (1997) argues that “the water industry has the most characteristics of a monopoly of all the utilities that have been privatised in the United Kingdom.”18 Kessides (2004) reports that: “The natural monopoly character of water supply is so strong that structural unbundling is rare, making vertical integration of utilities dominant even in industrial countries.”19 Noll et al (2000) report that “the consensus view” is that water is “the most likely infrastructure industry to be a natural monopoly”.20
However, some analysts note that there is potential for competition in water and/or wastewater supply, by providing third party access to monopoly infrastructure (the distribution network). This would facilitate competition in upstream or downstream services, as has occurred in the gas and electricity industries.21 There are also other ways in which forms of competition can be introduced into the industry (see chapter 3).
The key cost characteristics of the water and wastewater industry – including fixed/variable costs, direct/common costs, cost drivers, the cost characteristics of functional elements, and the significance of natural monopoly components versus potentially competitive elements – are discussed further below.
17 Ballance, T. and Taylor, A. (2005) Competition and Economic Regulation in Water – The Future of the
European Water Industry, IWA Publishing: London, UK, pp 12-13 and p 59; and Armstrong, M., Cowan, S., and Vickers, J. (1994) Regulatory Reform: Economic Analysis and British Experience, The MIT Press: Cambridge, Massachusetts, p 325.
18 Cowan, S. (1997) “Competition in the Water Industry” Oxford Review of Economic Policy, 13(1), p 83. 19 Kessides, I.N. (2004) Reforming Infrastructure – Privatization, Regulation, and Competition, World Bank
and Oxford University Press: Washington DC, p 228. 20 Noll, R., Shirley, M. and Cowan, S. (2000) Reforming Urban Water Systems in Developing Countries,
Stanford Institute for Economic Policy Research (SIEPR) Discussion Paper No. 99-32, p 4. 21 Webb, M. and Ehrhardt, D. “Improving Water Services through Competition”, Note No. 164 in Public
Policy for the Private Sector. World Bank Group: Washington DC, December 1998; and Foellmi, R. and Meister, U. “Product Market Competition in the Water Industry: Voluntary Non-discriminatory Pricing” Journal of Industry, Competition and Trade, 5(2), 2005.

2 Cost Structures
10 IPART Literature Review
2.2.1 Fixed/variable costs
The fixed costs of a water system are usually very high compared to the variable costs (although operating costs can be substantial for treatment facilities, transport options that involve extensive pumping, and new supply technologies such as desalination).22 For example, it has been estimated that fixed costs account for up to 80 per cent of the costs of supplying water in the United Kingdom.23
Operating costs do not necessarily equate to variable costs, as some items contained within an entity’s operating expenditure might actually reflect fixed costs (eg, long-term lease costs, capital maintenance or other costs that don’t necessarily change with output). Nevertheless, operating cost data can be used to provide some indication of the variable/fixed cost ratio of water and wastewater services. According to WSAA, which reports annually on the costs (and other operating characteristics) of water utilities in Australia, operating costs made up about 45 per cent of Sydney Water’s wastewater costs and 58 per cent of its water costs in 2004-05.24 For Hunter Water, these figures were 38 per cent and 43 per cent, respectively.25
Tables 2.1 and 2.2 below summarise the results of Ofwat’s International Comparison of Water and Sewerage Service.26 The tables show operating costs relative to capital and total costs for a range of utilities. They also show the extent to which costs can vary between utilities and regions.
22 Noll, R., Shirley, M. and Cowan, S. (2000) Reforming Urban Water Systems in Developing Countries,
Stanford Institute for Economic Policy Research (SIEPR) Discussion Paper No. 99-32, pp 3-4; and Tasman Asia Pacific, Third Party Access in the Water Industry – An Assessment of the Extent to which Services Provided by Water Facilities Meet the Criteria for Declaration of Access, September 1997, p 3.
23 Armstrong, M., Cowan, S., and Vickers, J. (1994) Regulatory Reform: Economic Analysis and British Experience, The MIT Press: Cambridge, Massachusetts, p 352.
24 Water Services Association of Australia (WSAA), WSAAfacts 2005, 2005. 25 The total cost figures used to derive these percentages is based on operating costs plus depreciation
plus a 4 per cent return on assets. Therefore, as the assumed rate of return increases, capital costs become a greater share of total costs.
26 Ofwat, International comparison of water and sewerage service 2007 report - covering the period 2004-05, April 2007, pp 54 and 60.

11 Literature Review
IPART
2 Cost Structures
Table 2.1 Water delivered unit costs (£/property)
Company Name Area served Resources and
treatmenta
Distributiona Business activitya
Operating costsa
Capital costs
Total cost
England and Wales (average) England and Wales 21 22 23 65 87 152
England and Wales (range) England and Wales 15-42 14-31 17-42 52-98 na 102-200
Scottish Water Scotland 17 21 24 62 107 170
Gothenburg Water City of Gothenburg 15 17 17 50 18 67
Helsinki Water City of Helsinki 21 14 na na na na
Malmö Water and Wastewater City of Malmö 20 12 9 42 59 101
Stockholm Water City of Stockholm 11 16 11 38 39 77
Duinwaterbedrijf Zuid-Holland South Holland na na na 83 49 132
Gemeentewaterleidingen Amsterdam
Amsterdam na na na 96 17 112
PWN Waterleidingbedrijf North Holland na na na 100 49 149
Vitens Gelderland, Overijssel and Friesland na na na 63 61 124
Waterleiding Maatschappij Limburg Limburg (Maastricht) na na na 73 65 138
Hydron Midden-Nedderland Mid-Netherlands (Utrecht) na na na 50 52 101
Brabent Water North Brabant na na na 60 62 123
Brisbane Water Brisbane, Queensland na na na 85 92 177
City West Water Limited Melbourne, Victoria na na na 118 32 150
Gold Coast Water Gold Coast, Queensland na na na 63 120 183
South Australian Water Corporation Adelaide, South Australia na na na 70 102 172
South East Water Limited Melbourne, Victoria na na na 71 32 102
Sydney Water Corporation Sydney, Illawarra and Blue Mountains
na na na 93 48 141
Water Corporation Perth na na na 70 96 166

2 Cost Structures
12IPA
RT Literature Review
Company Name Area served Resources and
treatmenta
Distributiona Business activitya
Operating costsa
Capital costs
Total cost
Yarra Valley Water Melbourne, Victoria na na na 72 35 107
California Water Service Company Various communities including East LA and South San Francisco
150 33 71 254 111 366
Elizabethtown Water Company Parts of Northern New Jersey 68 30 73 171 247 418
Illinois American Water Various communities including Chicago, Peoria and Alton
66 15 86 167 156 322
Indiana American Water Company Indiana 23 17 55 95 176 271
Missouri-American Water Company Missouri 26 15 53 94 93 188
New Jersey-American Water Monmouth, Camden, Cape May, Hunterdon
79 20 86 186 218 404
Penn American Water Various communities including Pittsburgh and Hershey
36 21 87 143 198 342
San Jose Water Company San Jose Metropolitan Area 182 26 51 259 142 401
Southern California Water Company Sacramento, Santa Barbara, LA 144 21 85 250 171 421
Companies regulated by the Instituto Regulador de Águas e Resíduos (IRAR)
A range of municipalities representing 15% of Portugal’s
population
48 na na na na na
a Operating costs comprise the functional elements of ‘resources and treatment’, ‘distribution’ and ‘business activity’.
Note: na = data not available. Numbers may not add due to rounding.
Source: Ofwat, International comparison of water and sewerage service 2007 report - covering the period 2004-05, April 2007, p 54.

13 Literature Review
IPART
2 Cost Structures
Table 2.2 Sewage collected unit costs (£/property)
Company Name Area served Seweragea Sewage treatmenta
Sludge treatment
and disposala
Business activitya
Operating costsa
Capital costs
Total cost
England and Wales (average) England and Wales 10 19 13 18 60 108 167
England and Wales (range) England and Wales 7-16 13-40 10-19 13-28 47-88 na 120-170
Scottish Water Scotland 15 14 4 20 53 171 224
Gothenburg Water City of Gothenburg 12 31 na 12 55 45 101
Helsinki Water City of Helsinki 6 15 na na na na na
Malmö Water and Wastewater City of Malmö 18 31 na 13 61 53 114
Stockholm Water City of Stockholm 18 16 na 15 49 78 126
Brisbane Water Brisbane, Queensland na na na na 65 119 185
City West Water Limited Melbourne, Victoria na na na na 93 32 125
Gold Coast Water Gold Coast, Queensland na na na na 79 142 222
South Australian Water Corporation
Adelaide, South Australia na na na na 58 146 204
South East Water Limited Melbourne, Victoria na na na na 81 45 127
Sydney Water Corporation Sydney, Illawarra and Blue Mountains
na na na na 81 86 167
Water Corporation Perth na na na na 70 191 261
Yarra Valley Water Melbourne, Victoria na na na na 95 27 122
a Operating costs comprise the functional elements of ‘sewerage’, ‘sewage treatment’, ‘sludge treatment and disposal’, and ‘business activity’.
Note: na = data not available. Numbers may not add due to rounding.
Source: Ofwat, International comparison of water and sewerage service 2007 report - covering the period 2004-05, April 2007, p 60.

2 Cost Structures
14 IPART Literature Review
2.2.2 Direct/common costs
Costs in the water and wastewater industry can also be divided into ‘direct’ costs and joint or common costs. In contrast to direct costs – which can be specifically attributed to a particular service or activity (ie, supply chain component) on the basis of cost causation – common costs cannot be directly attributed to any one service, as they are incurred in the supply of two or more services.27 Examples of common costs include general administration and corporate support activities.
While the allocation of common costs will always be somewhat arbitrary, a range of possible approaches can be used to allocate these costs to particular services.28 The Australian Competition and Consumer Commission (ACCC) has explained that the application of a Ramsey pricing approach would lead to an economically efficient outcome, but is difficult to apply in practice:29
Under a Ramsey pricing approach, the common costs would be allocated in inverse proportion to the elasticity of demand for the services over which the common costs relate. That is, a greater proportional mark-up is allocated towards the service which is relatively price inelastic, and a lesser proportional mark-up towards the service which is relatively price elastic. This ensures that the distortions to demand for these services are minimised and that common cost contribution can be achieved with the least overall cost to economic efficiency. In practice there are substantial informational difficulties with applying Ramsey pricing, as elasticity estimates would need to be developed.
Accordingly, alternative cost allocation methodologies have been proposed. A widely used approach is fully distributed costs (FDC), which uses accounting rules to allocate costs between services. For instance, it may allocate costs on the basis of each service’s share of total output or total revenue. However, as pointed out by Stone and Webster, critics have argued that the approach “can be arbitrary and bear no relation to efficient pricing rules…”.30 In a recent report on the pricing of access to certain telecommunications services, the ACCC refers to an approach called ‘equi-proportionate mark-up over directly attributable costs’. It explains that this is a commonly used approach, which measures the directly attributable costs of each service within a group and allocates the common costs based on each service’s proportion of the total directly attributable costs.31
27 These costs are associated with economies of scope. 28 Australian Competition and Consumer Commission, Pricing Principles for Declared Transmission
Capacity Services – Final Report, September 2004, p 17. 29 Ibid, p 18. This point is also made by others, see for example, Stone and Webster Consultants Ltd,
Analysis of whether there are significant Cross-Subsidies between the different Customer Groups served by Scottish Water, A Final Report for the Scottish Executive, February 2005, pp 5-6; and Network Economics Consulting Group, ‘Dual Till’ at Sydney Airport, Final Report prepared for the Australian Competition and Consumer Commission, May 2000, p 4.
30 Stone and Webster Consultants Ltd, Analysis of whether there are significant Cross-Subsidies between the different Customer Groups served by Scottish Water, A Final Report for the Scottish Executive, February 2005, p 5.
31 Australian Competition and Consumer Commission, Pricing Principles for Declared Transmission Capacity Services – Final Report, September 2004, p 17.

2 Cost Structures
Literature Review IPART 15
2.2.3 Cost drivers
It is important to understand the impact of cost drivers when examining the cost structure of the water and wastewater industry. Differences in cost drivers help to explain cost differences within and between utilities.
For example, according to WSAA:32
An understanding of factors driving the costs of urban water businesses is vital to a valid interpretation of statistics. Differences in the cost drivers between individual businesses make comparison of different water businesses a complex exercise, particularly in the case of international comparisons.
Ofwat also recognises this point, as it identifies a number of cost drivers that could explain differences in costs between utilities and jurisdictions (and hence complicate a comparison of utilities’ efficiency on the basis of the data in Tables 2.1 and 2.2 above). These include the quality of treatment, population density, regulatory customer service and environmental standards and energy costs.33
WSAA identifies the “principal cost drivers for the Australian and New Zealand urban water businesses” as follows:34
customer service standards, including those related to continuity of supply, minimum pressure rates of flow and fire suppression
population density – the water and wastewater transportation networks are the major investment component of urban water businesses, therefore the low density of Australian urban development (compared to Europe) may result in higher transportation costs per property
health and environmental standards – including standards for drinking water quality and wastewater discharges to the environment
variability of wastewater flows (ie, wet weather flows)
asset life cycles – recently constructed distribution systems have much lower requirements for expenditure on asset maintenance and replacement compared to older systems
the physical operating environment – geology and topography can have a significant impact on water transportation costs, and prevailing weather conditions impacting on water demands and peak requirements can also drive both capital and operating costs.
Cost drivers for wastewater service supply are considered in more detail in Box 2.1. In discussing these cost drivers, WSAA emphasises that their impact and relative significance can vary from region to region.35
32 Water Services Association of Australia (WSAA), WSSAfacts 2005, p 8. 33 Ofwat, International comparison of water and sewerage service 2007 report - covering the period 2004-05,
April 2007, pp 53-64. 34 Water Services Association of Australia (WSAA), WSSAfacts 2005, p 8.

2 Cost Structures
16 IPART Literature Review
In terms of new sources of water and technologies, Winter et al (2001) report that, while desalination costs will vary with the type of process or technology used, the three factors that have the largest effect on the cost of desalination per unit of fresh water produced are:
Feedwater salinity level – “increasing the salt content of the feedwater generally increases the operating costs as more apparatus (such as membrane area or the number of stages of distillation) is needed”.
Energy costs – a major characteristic of all desalination processes is their requirement for thermal or electric energy input, which can represent 50 to 75 per cent of operating costs. “Reverse osmosis has the lowest energy demand and this consequently makes it more attractive in many instances”.
The size of the plant – “Economies of size are evident in all desalination processes, but to different extents. Reverse osmosis exhibits little scope for economies of size, while distillation processes show the greatest economies of size.”36
Finally, an important cost consideration or determinant for both water and wastewater is the size and timing of capacity increments. As WSAA points out:37
Both backward and forward looking costs will be a function of the minimum size of capacity augmentations and the point at which the business is placed in the infrastructure expansion cycle. If a recent upgrade has just been conducted, one would expect historic costs to appear high and future expenditure requirements to appear low. If the system is currently approaching maximum capacity and major upgrades are due in the short term, then capital expenditure could be expected to be approaching a peak.
35 Water Services Association of Australia (WSAA), Identifying Costs for Wastewater Services, WSAA
Occasional Paper No 16, January 2007, pp 36-44. 36 Winter, T., Pannell, D. and McCann, L. (2001), “The Economics of Desalination and its Potential
Application in Australia”, Sustainability and Economics in Agriculture Working Paper 01/02, University of Western Australia, downloaded from: http://www.crcsalinity.com.au/newsletter/SeaNews/dpap0102.htm on 10 May 2007. See also: Dore, M. (2005) “Forecasting the economic costs of desalination technology” Desalination, 172, pp 207-214.
37 Water Services Association of Australia (WSAA), Identifying Costs for Wastewater Services, WSAA Occasional Paper No 16, January 2007, p 43.

2 Cost Structures
Literature Review IPART 17
Box 2.1 Cost drivers for wastewater services38
Number of connections / growth in connections The number of connections impacts on the cost of all elements of the business (retail, collection,transmission, treatment and disposal costs), and is typically the largest driver of capital expenditure. Thegreater the number of connections, the more infrastructure and administrative support is required, exceptwhere spare capacity exits.
Disposal method and degree of treatment
Treatment can be to primary, secondary or tertiary levels. Lower levels will typically affect the receivingenvironment more, while higher levels require higher energy use. Disposal methods include discharge tooceans, discharge to inland rivers, and recycling.
Volume and chemical/biological load Collection and transmission Collection and transmission infrastructure costs are primarily driven by the pipeline capacity required toservice peak volume – ie, peak wet weather flows (PWWF). The PWWF is typically between 3 to 5 times the peak dry weather flow (PDWF), although this ratio can vary substantially between cities.
Biological oxygen demand (BOD) can also impact on costs, via corrosion of pipelines. The cost of
combating this can range from minimal to almost 20 per cent of capital costs and 25 per cent of operating expenditure. The impact of chemical/biological load on collection and transmission system costs willdepend on a combination of factors, including pipe material, maintenance practices, wastewater detention times, ground conditions and pipe lining.
Treatment and disposal Most pre-treatment infrastructure costs are driven by the volume of wastewater treated, while secondarytreatment costs are mainly driven by the level of BOD, suspended solids and other relevant load factors. Salt load is also emerging as a significant issue, with the increasing use of recycling. The precise impact ofeach load driver on treatment costs will depend on the technology employed and standard of service required, including the level of treatment, method of disposal, odour control technology and practices,wastewater detention times and discharge requirements.
Topography The natural topography of a city has a significant impact on wastewater transmission costs. A natural slope toward the ocean (or other disposal site) will allow extensive use of gravity systems and a relativelyshallow depth of sewer. Added pumping requirements increase capital and operating costs.
Density of development
The density of development (or the size of lot frontages) affects the cost of the wastewater collection(reticulation) system. The density of development also has a flow-on impact on the total length and breadth of the settlement and therefore on transmission distances. Notably, collection (reticulation) capital costs are typically met by land developers in Australia.
Transmission/disposal distance
Pipeline costs typically represent two-thirds or more of a wastewater service provider’s total asset base.Thus the length of sewers required is a key driver of industry costs.
38 Ibid, pp 36-44.

2 Cost Structures
18 IPART Literature Review
2.2.4 Cost characteristics of functional elements
In discussing the cost characteristics of the functional elements of the water and wastewater supply chains, the literature generally focuses on distinguishing between natural monopoly and potentially competitive elements.
The existence of a natural monopoly means that it is more economical for one facility to meet market demand, rather than two or more facilities. Natural monopolies are characterised by large fixed costs and significant economies of scale – meaning that average costs decline over a large range of output levels. The identification of potentially competitive versus natural monopoly elements of the supply chain is significant, as it is the starting point for determining the potential for introducing competition in the market for water and/or wastewater supply.39
Empirical studies tend to focus on the existence of economies of scale at the utility level, rather than analysing each component of the supply chain, and there have been relatively few studies on economies of scope between supply chain elements (see Appendix A and section 2.3). Nevertheless, there is general consensus in the literature that water and wastewater transmission and distribution networks are natural monopolies.40 For example, Ballance and Taylor (2005) report that economies of scale are present, partly due to the physical characteristics of this infrastructure, and because these networks are generally constructed with a significant excess capacity due to the irreversibility of the investment and the high adjustment costs of having to change the level of capacity:41
As a result, the low marginal cost of transporting additional water and the high sunk costs of network investment form a formidable barrier to new entry.42
The literature is less explicit on the cost characteristics of other components of the water and wastewater supply chain. However, in discussing potential third party access (or ‘competition in the market’) in the water/wastewater industry, there appears to be implicit agreement that services ‘upstream’ and ‘downstream’ of distribution infrastructure (ie, water production, water and wastewater treatment,
39 Ballance, T. and Taylor, A. (2005) Competition and Economic Regulation in Water – The Future of the
European Water Industry, IWA Publishing: London, UK, p 11. 40 See, for example, Frontier Economics, Facilitating competition in water services – a report prepared for
Sydney Water, November 2004, pp 13-14; and Ballance, T. and Taylor, A. (2005) Competition and Economic Regulation in Water – The Future of the European Water Industry, IWA Publishing: London, UK, p 11.
41 Ballance, T. and Taylor, A. (2005) Competition and Economic Regulation in Water – The Future of the European Water Industry, IWA Publishing: London, UK, pp 11-12.
42 London Economics (1997) notes that economies of scale in distribution can depend on the dimension being examined. It anticipates economies of scale in regards to the volume of water supplied through the network and density of connections, but not in terms of the size of the network. In terms of the latter, London Economics explains that: “If company A has a similar customer density to company B, but has twice the number of customers and twice the length of mains, we would not expect company A to have lower unit distribution costs than B.” See London Economics, Water Pricing: The Importance of Long Run Marginal Costs, Prepared for Ofwat, February 1997, pp 4-5.

2 Cost Structures
Literature Review IPART 19
and retail or customer service activities) are potentially competitive.43 This seems to be due to the physical or technical features of these services, as well as the nature of the market and their cost structures.
In terms of sources of water such as dams, there is recognition that individual sources generally experience increasing returns to scale (with respect to volume). However, this is only up to a certain point, and in many areas (over a period of time) more than one source is required. Noll et al (2000) state that a reservoir typically exhibits substantial economies of scale, but only “up to an upper bound that is determined by the geology of the site and the intertemporal variation in water flow.”44 London Economics (1997) points out that as lower cost resources are exploited first, the cost of the next source of water will be higher – meaning that over the long run, water resources are expected to exhibit diminishing returns to scale with respect to volume (and long run marginal cost will be greater than the average cost of supply).45 Noll et al (2000) observe that:46
A large minimum efficient scale of a single reservoir…does not imply a natural monopoly in either the entire system or even in that part of the system that requires these facilities. In multi-reservoir water systems, a single reservoir is like a single electric generation facility in a large electrical grid. Analogously to electric utilities, in a multi-reservoir system one can imagine a decentralised, competitive wholesale market in which competing reservoirs bid to deliver water to either long-distance transportation systems or user communities.
Similarly, individual treatment plants (of water and wastewater) may be subject to economies of scale up to a certain point.47 However, as demand increases it is possible that more complex treatment is required, offsetting the economies of larger treatment works,48 or that extra capacity is required. Tasman Asia Pacific (1997) also report that recent technological innovations have made small scale water and wastewater treatment operations increasingly feasible.49
43 See, for example: Ballance, T. and Taylor, A. (2005) Competition and Economic Regulation in Water – The
Future of the European Water Industry, IWA Publishing: London, UK, pp 9-11; Marsden Jacob Associates, Third Party Access in Water and Sewerage Infrastructure: Implications for Australia – Research paper prepared for the Australian Government Department of Agriculture, Fisheries and Forestry, 8 December 2005, pp 32-37; Webb, M. and Ehrhardt, D. “Improving Water Services through Competition”, Note No. 164 in Public Policy for the Private Sector. World Bank Group: Washington DC, December 1998, p 4.
44 Noll, R., Shirley, M. and Cowan, S. (2000) Reforming Urban Water Systems in Developing Countries, Stanford Institute for Economic Policy Research (SIEPR) Discussion Paper No. 99-32, p 4.
45 London Economics, Water Pricing: The Importance of Long Run Marginal Costs, Prepared for Ofwat, February 1997, pp 4-5.
46 Noll, R., Shirley, M. and Cowan, S. (2000) Reforming Urban Water Systems in Developing Countries, Stanford Institute for Economic Policy Research (SIEPR) Discussion Paper No. 99-32, p 5.
47 London Economics, Water Pricing: The Importance of Long Run Marginal Costs, Prepared for Ofwat, February 1997, pp 4-5; and Tasman Asia Pacific, Third Party Access in the Water Industry – An Assessment of the Extent to which Services Provided by Water Facilities Meet the Criteria for Declaration of Access, September 1997, p 27.
48 London Economics, Water Pricing: The Importance of Long Run Marginal Costs, Prepared for Ofwat, February 1997, pp 4-5.
49 Tasman Asia Pacific, Third Party Access in the Water Industry – An Assessment of the Extent to which Services Provided by Water Facilities Meet the Criteria for Declaration of Access, September 1997, p 27.

2 Cost Structures
20 IPART Literature Review
2.2.5 Significance of natural monopoly components versus potentially competitive elements
In discussing the potential for competition in water and wastewater supply, several authors highlight that the significance of transportation costs (ie, the natural monopoly element of supply) may have implications for the potential scope for, and benefits of, competition (see Box 2.2 below). Some also note that the high costs of water transportation explain the general lack of national (or inter-regional) water transmission grids, and hence the localised nature of water supply (which, in itself, can have implications for the scope for competition).50
However, it has also been pointed out that the significance of particular supply chain components, and hence the potential for competition in the market, can vary between locations and can change over time (with factors such as increasing scarcity of water from traditional supply sources and technological development). For instance, Marsden Jacob Associates (2005) note that production costs have traditionally been dominated by relatively low cost sources, but as expanding water supplies become more costly to produce, “the ability for entrants to provide competitive solutions might be eased.”51 Similarly, the NSW Government’s 2006 Metropolitan Water Plan shows that significant investment will need to be made in water supply augmentation in coming years, suggesting that the relative value of this potentially competitive part of the supply chain will increase.
Competition in the market is discussed further in section 3.5.
50 Ballance, T. and Taylor, A. (2005) Competition and Economic Regulation in Water – The Future of the
European Water Industry, IWA Publishing: London, UK, pp 13 – 14; and Marsden Jacob Associates, Third Party Access in Water and Sewerage Infrastructure: Implications for Australia – Research paper prepared for the Australian Government Department of Agriculture, Fisheries and Forestry, 8 December 2005, pp 35-37.
51 Marsden Jacob Associates, Third Party Access in Water and Sewerage Infrastructure: Implications for Australia – Research paper prepared for the Australian Government Department of Agriculture, Fisheries and Forestry, 8 December 2005, p 36.

2 Cost Structures
Literature Review IPART 21
Box 2.2 Significance of the natural monopoly element in water/wastewater supply
According to Ballance and Taylor (2005):52
… the potentially competitive elements (eg, of raw water and possibly treatment) of the supply chaincomprise only a small element of the overall cost, which in itself makes the potential benefits fromcompetition less rewarding than in other sectors.
Drawing on Ofwat data, Ballance and Taylor (2005) also report that:53
In the 5-year period to 2002-03, around 64% of investment in the water sector in England & Wales wason the distribution network. The majority of the remaining investment was in water treatment, with investment in water resources accounting for around 5% of the total investment over the 5-year period.
Rowson (2000)54 estimates that the potentially competitive parts of the UK water supply chain(‘supply’ and ‘production’) account for only 36 per cent of total expenditure, thusdemonstrating the significance of monopoly distribution elements.
Webb and Ehrhardt (1998) state that:55
In water, a greater share of costs is in the network (which will remain uncompetitive) than in the potentially competitive areas. This is the reverse situation in electricity, for example, where more than50 percent of the costs are in the competitive generation and retail segments.
Tasman Asia Pacific (1997)56 contrasts the significance of water/wastewater transportation costs relative to other industries such as electricity and gas as follows:
Transportation Transportation costs Production costs as a
Infrastructure as a % of as a % of total costs % of industry costs assets Water 70 21 31
Electricity 50 8 50
Gas 60 14 40
Marsden Jacob Associates (2005) report that:57
As the transmission network is the key element of water costs and is the monopoly element of the incumbent, there is relatively less ’room’ for cost savings in the delivered price of water from different suppliers. For an entrant to provide a significant cost saving for the delivered service, they musttherefore make greater savings in, say, source development.
52 Ballance, T. and Taylor, A. (2005) Competition and Economic Regulation in Water – The Future of the
European Water Industry, IWA Publishing: London, UK, p 13. 53 Ibid, p 13. 54 Sourced from: Ballance, T. and Taylor, A. (2005) Competition and Economic Regulation in Water – The
Future of the European Water Industry, IWA Publishing: London, UK, p 13. 55 Webb, M. and Ehrhardt, D. “Improving Water Services through Competition”, Note No. 164 in Public
Policy for the Private Sector. World Bank Group: Washington DC, December 1998, p 4. 56 Tasman Asia Pacific, Third Party Access in the Water Industry – An Assessment of the Extent to which
Services Provided by Water Facilities Meet the Criteria for Declaration of Access, September 1997, pp 4- 5. 57 Marsden Jacob Associates, Third Party Access in Water and Sewerage Infrastructure: Implications for
Australia – Research paper prepared for the Australian Government Department of Agriculture, Fisheries and Forestry, 8 December 2005, p 36.

2 Cost Structures
22 IPART Literature Review
2.3 Economies of scale and scope
IPART identified a range of studies of economies of scale in water and wastewater industries, nearly all of which were undertaken in other countries. However, it found very few studies that had examined economies of scope.
2.3.1 Economies of scale at the water and/or wastewater utility level
In its 2005 Investigation into Water and Wastewater Service Provision in the Greater Sydney Region,58 IPART examined a number of studies conducted on economies and diseconomies of scale in the water industry. A summary of the results – extended to include further studies – is presented in Appendix A. As noted above, these studies have tended to focus on economies of scale at the utility level, rather than examining particular supply chain elements.
As IPART noted in its 2005 investigation:59
…there is evidence to suggest that water and wastewater services are characterised by significant economies of scale, which occur when the unit cost of production decreases as the volume of output increases. However, there is also evidence to suggest that when water utilities reach a certain size (for example, in terms of number of connections served), they begin to experience diseconomies of scale – that is, the unit costs of production begin to increase as output increases.
….Based on the findings of these studies, the Tribunal concluded that, in serving approximately 1.6 million connections, Sydney Water is at or approaching a size at which water utilities in other jurisdictions have been found to experience diseconomies of scale. The Tribunal also noted that this number of connections is significantly larger than the minimum number that some sources assert is required to achieve economies of scale.60
However, as IPART also noted, the results of studies in one jurisdiction cannot be automatically applied to another, given that operational characteristics can differ significantly between water utilities and regions (per the above discussion on cost drivers). This view is echoed in the literature. In undertaking a study of economies of scale and scope in the UK water and wastewater industry, Stone and Webster (2004) note:61
The value of [previous work on water industry structure in other countries] lies in the methodological approaches used…The evidence on economies of scale is of less relevance per se given that the water industry in other countries has typically been organised very differently to the current industry structure observed for England & Wales. Broadly, the current structure in England & Wales is fairly unique in terms of the existing scale (typically larger) and scope (typically wider) of [its] water service companies.
58 IPART, Investigation into Water and Wastewater Service Provision in the Greater Sydney Region, Final
Report, October 2005, p 53. 59 Ibid. 60 See Strategic Management Consultants (2002) and World Bank (1997) in Appendix A. 61 Stone and Webster Consultants Ltd, Investigation into evidence for economies of scale in the water and
sewerage industry in England and Wales, Final Report, for the Office of Water Services (Ofwat), January 2004, p 23.

2 Cost Structures
Literature Review IPART 23
Similarly, Frontier Economics (2004) notes that studies in other jurisdictions may be of limited relevance to Sydney:62
One has to be very careful about drawing inferences from cost studies in jurisdictions whose institutional arrangements are markedly different from our own. One of these differences relates to the size of the networks of pipes. For reasons of history, Japan and the United States have networks that are very small compared with that of Sydney Water. If scale economies are evaluated at the means of the sample data, the evidence of economies of scale from these much smaller networks may have little relevance to the Sydney Water pipes. Studies of water companies in England and Wales provide evidence of most relevance to Sydney.
Some authors stress that caution should be used when interpreting the results of economies of scale studies, even when they are location-specific. In reporting on Stone and Webster’s findings (listed in Appendix A) that large water and sewerage companies in England and Wales were characterised by significant diseconomies of scale, Ballance and Taylor (2005) note that:63
…while the findings from the study might indicate that a more efficient structure than the one observed at present is possible, the transaction costs associated with changing the current structure should not be ignored and one would want to be a lot more confident of the benefits.
Ballance and Taylor (2005) also argue that it is important to distinguish between short-run economies of scale (“where it is progressively less expensive to supply increased volumes or numbers of customers through a network or to an area of a fixed or given size”) and long-run economies of scale (“where network size is not treated as fixed”), as “the latter concept is of most relevance to issues such as the efficient scale of a water utility”.64
Noll et al (2000) distinguish between different types or sources of economies of scale, pointing out that, among other factors, engineering scale economies can be offset by diseconomies of scale in organisational management.65
62 Frontier Economics, Promoting competition in Sydney sewerage markets, 2 November 2004, p 20. 63 Ballance, T. and Taylor, A. (2005) Competition and Economic Regulation in Water – The Future of the
European Water Industry, IWA Publishing: London, UK, p 61. 64 Ibid, p 11. 65 Noll, R., Shirley, M. and Cowan, S. (2000) Reforming Urban Water Systems in Developing Countries,
Stanford Institute for Economic Policy Research (SIEPR) Discussion Paper No. 99-32, p 4.

2 Cost Structures
24 IPART Literature Review
2.3.2 Economies of Scope
The existence of economies of scope means that it is cheaper for one firm to provide two or more related products together, than for each of them to be provided by a separate firm. Economies of scope may arise from:
the vertical integration of elements of the supply chain (eg, water treatment and distribution)
the horizontal integration of two or more supply chains (eg, water and wastewater), and/or
the horizontal integration of specific elements of supply chains (eg, water treatment and wastewater treatment).
In contrast to the relatively large number of studies on economies of scale, IPART found only a few studies on economies of scope in the water industry (see Appendix A). It appears that a study of the UK water industry by Stone and Webster is the most comprehensive undertaken so far.66
Stone and Webster (2004) found that there was some evidence of economies of scope from the vertical integration of water production and distribution functions, but diseconomies of scope from the vertical integration of wastewater collection and treatment/disposal functions. A study of the US water industry by Hayes (1987) concluded that there were economies of scope from the joint production of wholesale and retail water at low levels of output, with diseconomies setting in at higher levels.
Evidence of economies of scope from the horizontal integration of water and wastewater services is mixed. While Hunt and Lynk (1995) found evidence of economies of scope,67 Stone and Webster (2004) found evidence of diseconomies of scope. On the other hand, Saal and Parker (2000) did not find evidence of economies of scope, but nor did they report finding evidence of diseconomies of scope.
Stone and Webster’s analysis was extended to consider whether there were economies of scope from the integration of certain water and wastewater functions, despite a finding of overall diseconomies. There was evidence of economies of scope from combining those elements where there was a greater sharing of inputs (ie, water and wastewater production activities).68 For instance, savings from the purchase of power and chemicals for water and wastewater treatment plants was identified as a potential source of economies from undertaking water and wastewater production activities jointly. However, diseconomies of scope were found across functions where the sharing of inputs was limited and these diseconomies were found to dominate the overall result.
66 Stone and Webster Consultants Ltd, Investigation into evidence for economies of scale in the water and
sewerage industry in England and Wales, Final Report, for the Office of Water Services (Ofwat), January 2004.
67 Similar evidence was reported in Lynk (1993). 68 While there was also some evidence that water and sewerage connections were also characterised by
economies of scope, the evidence was not conclusive.

3 Industry Structures
Literature Review IPART 25
3 Industry Structures
Kessides (2004) reports that the water industry is usually characterised by a single, vertically integrated utility supplying a geographic area.69 This is consistent with the view that, as discussed in section 2.2 above, significant components of the water and wastewater supply chains are natural monopolies. Kessides (2004) also points out that, relative to other infrastructure sectors, examples of major reform in the water industry are limited:70
Structural and regulatory reforms and private participation are more recent and less common in water than in other infrastructure sectors, making it harder to obtain a clear picture of outcomes.
However, a survey of the literature has found that there are various ways in which water industry structures or configurations vary between metropolitan areas. Of particular significance are variations in the extent of vertical integration, the number and size of utilities (including horizontal disaggregation), the level of competition for supply, and arrangements for competition in supply.
In general, the range of industry ‘structures’ or arrangements operating in urban water markets within Australia and overseas can be grouped under the following headings:
monopoly supply (including vertically integrated supply and with varying levels of vertical and/or horizontal disaggregation)
‘yardstick’ or comparative competition
competition for the market
varying levels of competitive procurement of services or supply inputs (closely related to competition for the market)
competition in the market.
There can be some overlap between these types of industry structures or arrangements, and they can occur separately or together. For instance, yardstick competition can occur in the presence of competition in the market; competition for the market ultimately leads to monopoly supply of services; competitive procurement of services or supply inputs can occur under any of the ‘structures’
69 Kessides, I.N. (2004) Reforming Infrastructure – Privatization, Regulation, and Competition, World Bank
and Oxford University Press: Washington DC, p 228. 70 Ibid, p 252. See also IPART, Investigation into Water and Wastewater Service Provision in the Greater
Sydney Region, Final report, October 2005, p 2.

3 Industry Structures
26 IPART Literature Review
(although the extent of its use may vary between utilities); and each structure can be characterised by varying levels of vertical and/or horizontal disaggregation.
Nevertheless, these groupings provide a useful way of discussing the different urban water industry structures (and the potential range of different industry configurations). The sections below discuss the literature on each type of industry structure. They aim to give the reader a sense of the different industry structure models, and provide examples of the locations in which they have been adopted and, where possible, explain the reasons for their adoption. Most of these examples are developed countries. Recent reforms in developing countries have tended to focus on securing expertise and funding from the private sector in order to rehabilitate infrastructure and address problems such as unsafe water and poor service coverage.71
3.1 Monopoly supply
As discussed above, the water industry is usually characterised by a single, vertically integrated utility supplying a geographic area. As Kessides (2004) explains:72
The natural monopoly character of water supply is so strong that structural unbundling is rare, making vertical integration of utilities dominant even in industrial countries. Horizontal integration is also common, in the sense of a single utility being responsible for an entire urban market (multiple utility providers within a city are relatively rare, though more likely in large cities).
In its Investigation into water and wastewater service provision in the greater Sydney region, IPART explained that increasing competition into a monopoly industry like water is likely to involve tradeoffs between the productive efficiency that can result from the economies of scale and scope associated with one vertically integrated service provider, and the dynamic and productive efficiency gains that might be achieved through increased competition (net of any increase in transactions costs and transition costs).73
Reform in some utility industries has focused on introducing competition without major structural change, by introducing competition into the potentially competitive parts of the industry, by providing third-party access to the natural monopoly elements of a vertically integrated business. Examples include the telecommunications reforms in Australia and the recent changes to the water industry in England and Wales (see section 3.5.2 below for further information).74 In
71 See Marin, P. and Izaguirre, A.K., “Private participation in water – Toward a new generation of
projects?” Public-Private Infrastructure Advisory Facility, Note No. 14, September 2006, p 1; and Kessides, I.N. (2004) Reforming Infrastructure – Privatization, Regulation, and Competition, World Bank and Oxford University Press: Washington DC, p 220.
72 Kessides, I.N. (2004) Reforming Infrastructure – Privatization, Regulation, and Competition, World Bank and Oxford University Press: Washington DC, p 228.
73 IPART, Investigation into Water and Wastewater Service Provision in the Greater Sydney Region, Issues Paper, May 2005, p 13.
74 Ibid, p 22.

3 Industry Structures
Literature Review IPART 27
other utility industries (for example, the electricity, gas and rail industries in Australia) concerns about the potential for upstream monopolies to behave anti-competitively in potentially competitive downstream markets have led to the structural unbundling of vertically integrated firms into their monopoly and potentially competitive elements.75 As King (1999) points out:76
The Hilmer report noted that a vertically integrated utility that supplies an essential input to its downstream competitors may ‘cross subsidise’ its competitive operations from its monopoly service. Regulatory intervention, such as access pricing rules and ‘ring fencing’ the competitive and monopoly parts of the same company will be ineffective to prevent anti-competitive cross subsidies.
However, King (2000) also explains that vertical integration may result in lower retail prices, because it can reduce the problem of double marginalisation:77
One benefit of vertical integration focused on by existing studies is the moderation of double marginalization. In a one-shot model of competition, if the regulated input price exceeds marginal cost then downstream competitors face a distorted price and as a result set the retail price ‘too high’. If the upstream monopolist also competes downstream then it faces the true marginal cost of the essential input and tends to price more aggressively. As a result, integration can lower the retail price.
In addition to vertically disaggregating a utility to facilitate open access competition, structural change may be pursued through horizontal disaggregation. For instance, this could involve breaking up a utility to form two or more new water and wastewater businesses that would serve different geographical regions.
In its 2005 investigation, IPART identified three potential sources of benefits from horizontally disaggregating Sydney Water in this manner:78
scale efficiencies – disaggregation could lead to efficiency gains if Sydney Water is currently larger than the optimal size for a water utility and thus characterised by diseconomies of scale
comparative performance and yardstick competition – disaggregation could lead to efficiency gains if it resulted in effective yardstick competition between the newly formed businesses
changes in management approaches and culture – disaggregation could lead to efficiency gains if it resulted in positive changes to management approaches and decision-making in the newly formed businesses.
A key conclusion of IPART’s investigation was that Sydney Water should not be disaggregated (either vertically or horizontally), but that the costs and benefits of
75 King, S., Does structure dominate regulation? The case of an input monopolist, 9 October 2000, p 1. 76 King, S., (1999) “Price Discrimination, Separation and Access: Protecting Competition or Protecting
Competitors?” Australian Journal of Management, 24(1), p 22. 77 King, S., Does structure dominate regulation? The case of an input monopolist, 9 October 2000, p 2. 78 IPART, Investigation into Water and Wastewater Service Provision in the Greater Sydney Region, Final
Report, October 2005, p 52.

3 Industry Structures
28 IPART Literature Review
such reform should continue to be examined.79 Examples of monopoly supply (from a single vertically integrated monopoly to varying levels of vertical and/or horizontal disaggregation) are provided below.
3.1.1 Single vertically integrated monopoly
This involves a single utility owning and/or operating bulk water supply, treatment, distribution and retail activities and/or wastewater collection, treatment and disposal activities. Hunter Water is an example of a vertically integrated monopoly.
Hunter region, NSW80
Hunter Water provides water and wastewater services to almost half a million people within the local government areas of Newcastle, Lake Macquarie, Maitland, Cessnock and Port Stephens. Hunter Water also supplies bulk water to the towns of Dungog, Clarence Town and Paterson. Three major water sources supply water to Hunter Water – Chichester and Grahamstown Dams and the Tomago Sandbeds. Hunter Water is also able to access other groundwater sources at Nelson Bay and Lemon Tree Passage if required.
In 1992, the then Hunter Water Board was corporatised to form Hunter Water Corporation, a state-owned corporation. Hunter Water was one of the first authorities in Australia to be corporatised and, as such, it introduced the type of regulatory structure that now exists for Sydney Water.
3.1.2 Varying levels of vertical and/or horizontal disaggregation
Monopoly supply to a specific geographic area can also involve varying levels of vertical and/or horizontal disaggregation:
vertical disaggregation involves separate entities owning/operating different parts of the supply chain (ie, the status quo in Sydney)
horizontal disaggregation involves more than one vertically integrated utility servicing a metropolitan area (Manila and Paris are examples of cities that are supplied by two utilities, each operating in a different zone of the city)81
vertical and horizontal disaggregation involves a combination of vertical and horizontal disaggregation (for example, in Melbourne, bulk water and wastewater disposal are provided by Melbourne Water to three regionally based retailers, who are each responsible for local distribution and retailing services to their respective areas).
79 Ibid, p 61. 80 Information obtained from: IPART, Review of Metropolitan Water Agency Prices, Issues Paper, June 2002,
p 8; and Hunter Water, The Corporation – Introduction, downloaded from: www.hunterwater.com.au on 30 March 2007.
81 Dumol, M., The Manila Water Concession: A Key Government Official’s Diary of the World’s Largest Water Privatisation, World Bank: Washington DC, July 2000, pp 45-46.

3 Industry Structures
Literature Review IPART 29
Several examples are discussed in more detail below, including:
Sydney region, NSW (vertical disaggregation)
Manila, The Philippines (horizontal disaggregation)
Auckland, New Zealand; South East Queensland; and Melbourne, Victoria (vertical and horizontal disaggregation).
Sydney region, NSW82
Sydney Water Corporation provides water and wastewater services to over 4 million people in Sydney, the Blue Mountains and Illawarra regions.83 However, Sydney Water does not manage its own bulk water supplies. Instead, the Sydney Catchment Authority, from whom Sydney Water purchases bulk water, manages Sydney’s drinking water storages and catchments.
The Sydney Catchment Authority (SCA) was established to manage water supply and protect catchments, supply bulk water and regulate activities within Sydney’s catchment areas to improve water quality and protect public health and the environment. As such the SCA has primary responsibility for Sydney’s bulk water supply, which is drawn from the catchments of four major river systems – the Warragamba, Upper Nepean, Woronora and Shoalhaven. These catchments extend over 16,000 square kilometres and surround the Sydney greater metropolitan region.
The SCA was created as a result of the Sydney Water Inquiry, headed by Peter McClellan QC (the McClellan Inquiry). The McClellan Inquiry investigated the water quality incidents experienced in Sydney between July and September 1998. The Inquiry found that the catchments were seriously compromised by many possible sources of contamination and that in relation to catchment management, there were:84
…a large number of government and non-government agencies operating with fragmented responsibilities potential overlaps and gaps. No one body is responsible for ensuring the catchment is managed to minimise contamination of the available waters.
In order to correct these deficiencies, the McClellan Inquiry recommended the establishment of an independent agency:85
…tasked to protect the water quality in the Inner and Outer Catchments and given management responsibilities for the Inner Catchment and powers to oversight a new strong and strategic Regional Environmental Plan for the whole catchment.
82 Information obtained from: IPART, Investigation into Water and Wastewater Service Provision in the
Greater Sydney Region, Final Report, October 2005, p 2; and IPART, Review of Metropolitan Water Agency Prices, Issues Paper, June 2002, pp 6-8.
83 Note that Sydney Water contracts the delivery of some aspects of its services to private firms via a competitive tendering process.
84 Sydney Water Inquiry, Third Report: Assessment of the contamination events and future directions for the management of the catchment, October 1998, p 101.
85 Ibid, p 117.

3 Industry Structures
30 IPART Literature Review
In response to the McClellan Inquiry, the State Government enacted the Sydney Water Catchment Management Act 1998, which created the SCA. The Authority became operational on 2 July 1999.
Auckland, New Zealand
In New Zealand, water and wastewater services are usually provided by local councils. Through the provisions of the Local Government Act, each council has a statutory monopoly over the provision of services in its district.86 In most cases, services are provided by a department of the council, although in some cases, councils have set up a business unit (which may be a limited liability company owned by the council).87
In the Auckland region, bulk water and wastewater operations are separated from retail operations.88 Watercare Services Limited is the sole supplier of bulk water. It is publicly owned by the six councils to whom it supplies water.89 Although some of the councils operate their own wastewater treatment plants, Watercare collects and treats the vast majority of wastewater from four of the region’s councils.90 However, two of the councils undertake all of their own wastewater treatment.91
Papakura District Council is the only council in the Auckland region that does not operate its water and wastewater system. Following a competitive tendering process, the council contracted out the provision of these services to a private company, United Water, in 1997.92 Under the 50-year franchise agreement,93 United Water is responsible for managing, maintaining and operating the water and wastewater network and for billing customers. However, asset ownership remains with the council.94
86 Commerce Commission, “Commerce Act issues relevant to the water industry” in Issue No. 50 of
Fairs Fair, March 1998, p 2. 87 Water New Zealand, Introduction to the New Zealand Water Industry, downloaded from:
www.waternz.co.nz on 20 April 2007. 88 In New Zealand’s capital city, Wellington, local councils similarly obtain water from one supplier -
the Wellington Regional Council. Elsewhere in New Zealand, the industry is generally vertically integrated. See Water New Zealand, Introduction to the New Zealand Water Industry, downloaded from: www.waternz.co.nz on 20 April 2007.
89 Auckland Water Industry, Annual Performance Review 2004/05, p 6. 90 Watercare Services Limited, About Watercare, downloaded from: www.watercare.co.nz on 30 March
2007. 91 Auckland Water Industry, Annual Performance Review 2004/05, p 7. 92 Report of the Controller and Auditor General on Papakura District Council: Water and Wastewater Franchise,
April 1998, p 12. 93 Note that, although the initial term is only 30 years, the contract may be renewed for a further 20
years. Ibid. 94 Auckland Water Industry, Annual Performance Review 2004/05, p 19; United Water, About United
Water, downloaded from: www.uwi.com.au on 30 March 2007; and Papakura District Council, Water and Wastewater, downloaded from: www.pdc.govt.nz on 4 April 2007.

3 Industry Structures
Literature Review IPART 31
South East Queensland (Water Grid)
South East Queensland Water (SEQWater) is currently the major supplier of bulk water to local governments and industries in South East Queensland,95 including to Brisbane Water,96 which is responsible for providing water and wastewater services to around one million consumers.97
The South East Queensland region is currently experiencing a severe drought. Coupled with strong forecasts in population growth (particularly in Brisbane and the Gold Coast), this is placing a strain on the region’s water resources. Measures proposed (or adopted) to address the problem include water restrictions, demand management programs and the development of additional supplies.98
In addition, the Queensland Government is building a water grid to connect all major water sources in South East Queensland, including storage dams, the desalination plant on the Gold Coast and the Western Corridor Recycled Water Scheme. It is intended that the grid will facilitate water sharing by enabling water to be moved from areas of surplus to areas of shortage.99
In May 2007, the Queensland Water Commission (QWC) released a report to the State Government100 outlining proposed arrangements for the management of the water grid, including the establishment of a grid manager. Further reforms on structural change to the industry were also proposed. This included the relinquishing of local government ownership of major supply and bulk transport assets to the State Government and the creation of four new local government owned retail and distribution businesses101 from the 17 local governments currently providing these services.102
The QWC has also recommended that an assessment of the introduction of retail competition be undertaken.103
95 SEQWater is publicly owned. Ownership is shared between the Queensland Government (20%),
Brisbane City Council (45%) and other local governments (35%). 96 Brisbane Water is a business unit of the Brisbane City Council. 97 Marsden Jacob Associates, Securing Australia’s Urban Water Supply: Research notes for selected case
studies, 20 November 2006, pp 58 and 63. 98 Ibid, pp 60-61. 99 Queensland Government, Department of Infrastructure, South East Queensland Water Grid,
downloaded from: www.thepremier.qld.gov.au on 13 August 2007. 100 Queensland Water Commission, Urban water supply arrangements in South East Queensland, Final
Report, May 2007. 101 This will comprise three retail businesses and one distribution business. 102 See: Queensland Water Commission, Media Release – Major changes proposed for South East Queensland’s
urban water industry, 24 May 2007; Queensland Water Commission, Fact Sheet 1 - Urban Water Supply Arrangements in SEQ: Changes from Present Arrangements, downloaded from: www.qwc.qld.gov.au on 13 August 2007; and Queensland Water Commission, Fact Sheet 2 - Urban Water Supply Arrangements in SEQ: An Overview, downloaded from: www.qwc.qld.gov.au on 13 August 2007.
103 Queensland Water Commission, Urban water supply arrangements in South East Queensland, Final Report, May 2007, p 37.

3 Industry Structures
32 IPART Literature Review
3.2 Yardstick competition
As explained in IPART’s Investigation into water and wastewater service provision in the greater Sydney region,104 yardstick (or comparative) competition involves arrangements under which competitive pressure is exerted on a firm with a monopoly in one particular geographic area by assessing its performance through comparison with similar firms in other geographic areas. Such a regime anticipates that information about the relative performance of particular geographic monopolies will drive each one to improve performance.
Yardstick competition may be used to benchmark companies against one another in order to estimate efficiency and set prices. It can also be applied in a simpler form, whereby comparisons of company performance and efficiency is publicly released, but is not explicitly used in the price setting process.105 However, there is no standard method for establishing the comparability of different businesses, particularly in relation to efficient costs.106 As explained by Kessides (2004):107
Even though a regulator can capture certain facts of firms’ heterogeneity, the application of yardstick competition remains inherently subjective.
In England and Wales, Ofwat uses yardstick competition extensively, relying on sophisticated benchmarking techniques. It is also used in Melbourne, though not to the same extent as in England and Wales. Yardstick competition was also a key driver for splitting Manila into two zones and awarding franchises to different companies to supply each of the zones.
3.2.1 England and Wales
The water industry in England and Wales was privatised in 1989, when 10 publicly owned, vertically integrated water and sewerage companies (WaSCs) were sold. At the time of privatisation, there were also 28 water only companies (WoCs). However, since then there have been a number of mergers, which has reduced the number of WoCs.108
104 IPART, Investigation into Water and Wastewater Service Provision in the Greater Sydney Region, Issues
Paper, May 2005, p 26. 105 Webb, M. and Ehrhardt, D. “Improving Water Services through Competition”, Note No. 164 in Public
Policy for the Private Sector. World Bank Group: Washington DC, December 1998, p 8. 106 IPART, Investigation into Water and Wastewater Service Provision in the Greater Sydney Region, Issues
Paper, May 2005, p 26. 107 Kessides, I.N. (2004) Reforming Infrastructure – Privatization, Regulation, and Competition, World Bank
and Oxford University Press: Washington DC, p 242. 108 Hern, R. (2001) “Competition and access pricing in the UK water industry”. Utilities Policy, 10, pp 117-
118.

3 Industry Structures
Literature Review IPART 33
The privatisation of the entire system was unique to England and Wales and followed a period of commercialisation that began in the late 1970s.109 Privatisation was accompanied by the appointment of an economic regulator (Ofwat) and the development of price control based on industry benchmarking.110 The option to use a privatisation model based on competition for the market through franchising was rejected, because it would result in infrequent competition and provide incentives on the franchisee to under-invest.111
The Government does not plan to pursue the vertical disaggregation of the WoCs and WaSCs because it believes that the benefits of vertical integration outweigh the potential benefits of separation.112
Since the WaSCs and WoCs have effective monopoly status over their respective geographic areas, Ofwat uses yardstick competition to place competitive pressure on the companies. The relative efficiency of the companies is assessed using benchmarking techniques and this information feeds into the price setting process. Ofwat also publishes an annual report on the costs and efficiency of the companies.113 Given Ofwat’s reliance on yardstick competition, a number of proposed mergers between WoCs114 have been blocked because they would result in the loss of a comparator.115
The United Kingdom has advanced the furthest in applying yardstick competition.116 However, Frontier Economics (2004) reports that using benchmarking to set prices has not been without problems:117
UK experience has demonstrated that it is far from easy to compare the relative efficiency of water and sewerage companies (particularly in respect of capital costs). These problems, and the regulators’ desire to ensure that prices enable firms to be financially viable, can result in regulated prices deviating from those implied by the estimated relative efficiency. Notwithstanding this, it is regarded by some as a powerful regulatory tool in the UK that has assisted the regulator to set price caps.
109 Sturgess, G. L. (2007) “Will water float? Competition and private provision in urban water supply”
in Water that Works – sustainable water management in the commercial sector, Committee for Economic Development of Australia, February 2007, p 47.
110 Ibid. 111 Armstrong, M., Cowan, S., and Vickers, J. (1994) Regulatory Reform: Economic Analysis and British
Experience, The MIT Press: Cambridge, Massachusetts, p 334. 112 Department for Environment, Food and Rural Affairs and Welsh Assembly Government, Extending
opportunities for competition in the water industry in England and Wales – Consultation document, July 2002, p 35.
113 The most recent report was released in late 2006. See Ofwat, Water and sewerage service unit costs and relative efficiency – 2005-06 report, December 2006.
114 Mergers between WaSCs are prohibited. 115 Ballance, T. and Taylor, A. (2005) Competition and Economic Regulation in Water – The Future of the
European Water Industry, IWA Publishing: London, UK, pp 32, 47-49. 116 Webb, M. and Ehrhardt, D. “Improving Water Services through Competition”, Note No. 164 in Public
Policy for the Private Sector. World Bank Group: Washington DC, December 1998, p 8; and Kessides, I.N. (2004) Reforming Infrastructure – Privatization, Regulation, and Competition, World Bank and Oxford University Press: Washington DC, p 243.
117 Frontier Economics, Facilitating competition in water services – a report prepared for Sydney Water, November 2004, p 22.

3 Industry Structures
34 IPART Literature Review
In a 2002 consultation paper, the Department for Environment, Food and Rural Affairs stated that:118
[comparative competition], combined with the external discipline of having to compete for private sector finance, has been effective in incentivising undertakers to reduce costs and provide higher standards of service…[however], the incentives to increase efficiency, improve the quality of service, introduce innovative practices and drive down prices may … be somewhat weaker than those provided by direct market competition.
England and Wales have also attempted to introduce direct competition into the industry through inset appointments and, more recently, water supply licensing (see sections 3.3.6 and 3.5.2 below).
3.2.2 Melbourne, Victoria
In 1994, Melbourne Water, a vertically integrated wholesaler and retailer of Melbourne’s water and wastewater services, was disaggregated. Three regionally based water and wastewater retail companies were created with responsibility for the local distribution network and retailing services. Bulk potable and recycled water supply and bulk wastewater disposal is provided to these retail companies by Melbourne Water.119
The three state-owned retail suppliers are:120
Yarra Valley Water, which provides services to 1.5 million people in the Yarra River catchment area
South East Water, which provides services to 1.4 million people from Port Melbourne to Portsea and Mordialloc to around 40 kilometres east of Berwick
City West Water, which provides services to 700,000 people in Melbourne’s central business district and its inner and western suburbs.
As each of the retailers serves a particular geographic area, there is no direct competition for customers. However, Frontier Economics (quoting a report issued by the Victorian Office of State Owned Enterprises) reports that competition by
118 Department for Environment, Food and Rural Affairs and Welsh Assembly Government, Extending
opportunities for competition in the water industry in England and Wales – Consultation document, July 2002, p 10.
119 Essential Services Commission, Water Performance Report: Performance of Urban Water and Sewerage Businesses 2005-06, February 2007, pp 6-7; and Frontier Economics, Promoting competition in Sydney sewerage markets, 2 November 2004, pp 38-40.
120 See Essential Services Commission, Water Performance Report: Performance of Urban Water and Sewerage Businesses 2005-06, February 2007, p 7; Marsden Jacob Associates, Securing Australia’s Urban Water Supply: Research notes for selected case studies, 20 November 2006, p 44; and Allen Consulting Group, NCC Occasional Series: Microeconomic Reform in Australia – Comparison to Other OECD Countries, November 2004, p 76.

3 Industry Structures
Literature Review IPART 35
comparison (or yardstick competition) was the reason behind Melbourne Water’s disaggregation:121
The businesses have been established as State owned companies because this corporate form best replicates a commercial operating environment. The focus of each business is attaining best practice. This will be achieved by competing by comparison – mainly with other regional businesses, but also with equivalent businesses interstate and internationally.
Since 1995, the Essential Services Commission (ESC) has monitored, and published public reports on, the relative performance of the three metropolitan retailers in relation to affordability, customer service, network reliability and efficiency, drinking water quality, environmental performance, delivery of major projects and the results of regulatory audits.122 The aim of the reports is:123
…to stimulate ‘competition by comparison’ among the urban water businesses and to inform customers about the level of service they receive.
The most recent report (covering 2005/06) showed that there was a small difference between the average household water and wastewater bills of each of the three retailers.124 City West Water had the lowest bill ($457), followed by South East Water ($463) and Yarra Valley Water ($499).125
Frontier Economics (2004) explains that the form of yardstick competition used in Melbourne (ie, limited to publishing annual performance reports) is not as extensive as that pursued in England and Wales:126
The principle difference has been the respective power of the regulators. Ofwat has been active in securing and analysing a large data set about the quality and cost of service; it has used this information in setting prices. That is, the regulator used information about costs to put pressure on the prices that water businesses could charge – in an effort to extract efficiencies of operation and investment.
However, the ESC has recently stated that companies may submit the results of benchmarking studies in support of the efficiency of their cost forecasts. Although the ESC does not favour a particular benchmarking framework, it explains that it would give greater weighting to those studies that involve a large number of participants and are conducted independently of the business.127
121 Victorian Office of State Owned Enterprises, Department of the Treasury, Reforming Victoria’s Water
Industry, The Restructured Metropolitan Industry, January 1995, p 5 as quoted in Frontier Economics, Promoting competition in Sydney sewerage markets, 2 November 2004, p 39.
122 See Essential Services Commission, Water Performance Report: Performance of Urban Water and Sewerage Businesses 2005-06, February 2007.
123 Essential Services Commission, Water Performance Report: Performance of Urban Water and Sewerage Businesses 2005-06, February 2007, p III.
124 Average household bills are calculated using the average consumption of each retailer’s customers. 125 Essential Services Commission, Water Performance Report: Performance of Urban Water and Sewerage
Businesses 2005-06, February 2007, p 15. 126 Frontier Economics, Promoting competition in Sydney sewerage markets, 2 November 2004, p 39. 127 Essential Services Commission, 2008 Water Price Review Guidance Paper, March 2007, pp 25 and 29.

3 Industry Structures
36 IPART Literature Review
Anecdotal evidence suggests that the process of restructuring the Melbourne water industry revealed many opportunities for improving productive efficiency and introduced a more productive workplace culture.128 However, the Victorian Premier has recently announced that a review of the metropolitan retail sector will take place in order to determine whether the current structure is the most effective.129
3.3 Competition for the market
Competition for the market is the approach most commonly used by governments around the world to introduce competition in the supply of water and wastewater services.130 As explained in IPART’s Investigation into water and wastewater service provision in the greater Sydney region, this option involves auctioning the exclusive right to supply water and wastewater services to a specified standard to customers within a specific area.131 Franchise agreements may be short term (around 5 years) or long term (20 to 30 years), with the risk and responsibility transferred to the private sector increasing with the length of the contract.132
As explained by Webb and Ehrhardt (1998), many
…water sector reforms have relied on competition for the market as an efficient way of introducing private sector participation and delivering benefits to consumers. It can lead to an efficient outcome because bidders are forced to reveal the minimum cost of providing services.133
Establishing the length (and scope) of such arrangements generally involves making a trade-off between the competitive pressure maintained by re-tendering rights, and the greater scope for gains from longer-term arrangements (in which the private operator takes on more risk and responsibility). However, the competitive discipline (from re-tendering rights) may be lessened by the advantages enjoyed by incumbents (eg, superior information and sunk costs).134 A further consideration is the size of entry and exit costs, which may be large enough to preclude the initial competition in the absence of long-term contracts, or to limit subsequent competition.135
128 These comments were based on meetings between the IPART Secretariat and participants in the
Melbourne Water restructure/reform in 2005. See IPART, Investigation into Water and Wastewater Service Provision in the Greater Sydney Region, Draft Report, September 2005, p 46.
129 See Premier of Victoria, Media Release – Reform of Melbourne’s water industry, 14 August 2007. 130 Frontier Economics, Facilitating competition in water services – a report prepared for Sydney Water,
November 2004, p 24. 131 IPART, Investigation into Water and Wastewater Service Provision in the Greater Sydney Region, Issues
Paper, May 2005, p 26. 132 Frontier Economics, Facilitating competition in water services – a report prepared for Sydney Water,
November 2004, pp 24-25. 133 Webb, M. and Ehrhardt, D. “Improving Water Services through Competition”, Note No. 164 in Public
Policy for the Private Sector. World Bank Group: Washington DC, December 1998, p 7. 134 Frontier Economics, Facilitating competition in water services – a report prepared for Sydney Water,
November 2004, pp 24-25. 135 IPART, Investigation into Water and Wastewater Service Provision in the Greater Sydney Region, Issues
Paper, May 2005, p 26.

3 Industry Structures
Literature Review IPART 37
Frontier Economics (2004) reports that evidence regarding the effectiveness of competition for the market in improving service quality, promoting productive efficiency and lowering prices is mixed. It also notes that most of the evidence focuses on developing countries, and so may not be a good indication of its likely success in Australia.136
There are a few examples of competition for the market in Australia and many examples internationally, particularly in the developing world. The arrangements in two Australian cities (Canberra and Adelaide) and four international jurisdictions (France, Manila, the United Kingdom and Germany) are described below. Note that, although the inset appointment arrangements in the United Kingdom have been described by Ofwat as a type of competition for the market, they differ from the other examples in that the private sector is not approached to engage in a competitive tendering process. Instead, a company can apply to Ofwat to replace the current incumbent provider.
3.3.1 Canberra, Australian Capital Territory
ActewAGL was formed in October 2000 when a private sector group, the Australian Gas Light Company (AGL) entered into a joint venture with a government-owned enterprise (ACTEW Corporation) to provide water and wastewater services.137 ActewAGL is the first Australian multi-utility. It provides electricity and natural gas services in addition to water and wastewater services.138
ACTEW explains that the opening of energy markets to competition was the motivation for entering into a partnership with the private sector:139
In a fast changing world of deregulation, and a national energy market where local markets such as the [Australian Capital Territory] are open to competition from perhaps a score of companies, ACTEW had to change its style of operation. It had to get bigger through acquisition or merger, or it had to be prepared to wither on the vine while other well-funded utility companies starved it out of business.
With national energy market leader AGL as a joint-venture partner, future risks are shared and our marketing position secured.
In 1999, ACTEW selected AGL as its preferred partner following an analysis of 29 expressions of interest received from Australian and international organisations. This decision was endorsed by the ACT Government.140,141
136 Frontier Economics, Facilitating competition in water services – a report prepared for Sydney Water,
November 2004, p 26. 137 IPART, Investigation into Water and Wastewater Service Provision in the Greater Sydney Region, Issues
Paper, May 2005, p 31. 138 ActewAGL, Media Release: ACTEW – AGL Partnership Commences, 3 October 2000. 139 Actew, Frequently asked questions, downloaded from: www.actew.com.au on 23 April 2007. 140 AGL, Media Release: ACT Government Endorses AGL-ACTEW Joint Venture Proposal, 7 December 1999. 141 The Government did not follow a competitive tendering process, because it believed that proposals
could not easily be compared given that different companies would be tendering for different kinds of relationships. See Legislative Assembly for the ACT: 2000 Week 1 Hansard (16 February), p 180.

3 Industry Structures
38 IPART Literature Review
ActewAGL is organised into two partnerships – ActewAGL Distribution and ActewAGL Retail. The ActewAGL Distribution partners are ACTEW Distribution Limited and Alinta GCA Pty Limited. Under the distribution arm:142
ActewAGL Networks plan, develop, construct, operate and maintain the electricity network in the ACT and the gas networks in the ACT, Queanbeyan and Nowra.
ActewAGL Water division provide water and wastewater services under contract to ACTEW Corporation who have ownership of the ACT's water and wastewater assets.
The ActewAGL Retail partners are ACTEW Retail Limited and AGL ACT Retail Investments Proprietary Limited. Under the retail arm, ActewAGL supplies electricity, natural gas, water and wastewater services to customers.143
3.3.2 Adelaide, South Australia144
In 1996 the South Australian Government awarded United Water a 15-year contract to manage and operate the metropolitan Adelaide water and wastewater systems on behalf of SA Water. The award of the contract followed a request-for-proposal process in which four international companies were invited to participate. The request-for-proposal process differed from a request-for-tender process in two key ways. First, the request-for-proposal documentation was less prescriptive, to provide an opportunity for proponents to submit innovative proposals to meet the project’s objectives. Second, the contract was not awarded on the basis of the initial proposal. That is, a process of negotiation and clarification followed the evaluation process.145
The United Water contract is the largest outsourcing contract in Australia. United Water’s contract with SA Water requires it to meet specific quality standards. The contract also sets strict performance targets for customer service based on response times to water mains bursts and other problems. SA Water retains ownership over the assets and control over core functions, such as strategy and planning. As the contract is outcome based, a large proportion of United Water’s remuneration is incentive based. Marsden Jacob Associates (2005) reports that cost reduction objectives have been met, with an estimated 20 per cent saving against SA Water’s
142 ActewAGL, Company Structure, downloaded from: www.actewagl.com.au on 23 April 2007. 143 Ibid. 144 Information on the arrangements in Adelaide was obtained from: IPART, Investigation into Water and
Wastewater Service Provision in the Greater Sydney Region, Issues Paper, May 2005, p 25; Marsden Jacob Associates, Third Party Access in Water and Sewerage Infrastructure: Implications for Australia – Research paper prepared for the Australian Government Department of Agriculture, Fisheries and Forestry, 8 December 2005, p 48; Australian Government Department of the Prime Minister and Cabinet, A Discussion Paper on the Role of the Private Sector in the Supply of Water and Wastewater Services, August 2006, p 2; and Laval, P. (United Water), The Adelaide Contract: the Contribution of Outsourcing to Sustainability, [undated].
145 Laval, P. (United Water), The Adelaide Contract: the Contribution of Outsourcing to Sustainability, [undated], p 34.

3 Industry Structures
Literature Review IPART 39
historical costs. United Water also has a 99 per cent compliance rate against its performance standards.
3.3.3 France146
In France, ownership and responsibility for the provision of water and wastewater services falls to the municipal governments (of which there are more than 30,000). Although municipalities are, by law, prohibited from selling their water and wastewater assets to private companies, they are permitted to delegate the management of these services to private companies. However, responsibility for water collection infrastructure (such as reservoirs) is not delegated and remains the responsibility of the municipalities.147
Delegation is organised under a contracting arrangement between the municipalities and private operators. Municipalities are required to follow a competitive tendering basis before awarding contracts to private operators. The successful operator is then granted an exclusive right to supply services for the duration of the contract.148 Contracts vary in duration, as discussed in more detail below.
There has been private sector participation in France for more than 150 years. Securing access to private capital and technical expertise and the efficient provision of services have been key motivations for engaging the private sector in the past. Boscheck (2002) reports that, by 1999, the estimated share of the population receiving water and wastewater services from the private sector was 75 per cent and 40 per cent respectively.149 The industry is currently dominated by three major private sector operators, which also have extensive operations outside of France.
There are three main types of contracting arrangements, of varying durations. Longer contracts allocate a greater share of risks and responsibilities to the private sector than shorter contracts. However, a common theme is the separation of asset
146 Information on the structure of the industry in France was obtained from: Ballance, T. and Taylor, A.
(2005) Competition and Economic Regulation in Water – The Future of the European Water Industry, IWA Publishing: London, UK, pp 82-107; Ballance, T. and Taylor, A., Competition and Economic Regulation in Water – The Future of the European Water Industry, January 2001, pp 79-104; Boscheck, R. (2002) “European Water Infrastructures: Regulatory Flux void of Reference? The Cases of Germany, France and England and Wales” Intereconomics, 37(3), pp 143-144; Brown, A., Stern, J., Tenenbaum, B., and Genger, D. Handbook for Evaluating Infrastructure Regulatory Systems. World Bank: Washington DC, June 2006, pp 338-342; Elnaboulshi, J.C. (2001) “Organisation, Management and Delegation in the French Water Industry” Annals of Public and Cooperative Economics, 72(4), pp 507-547; and Pezon, C., Water supply regulation in France from 1848 to 2001: a jurisprudence based analysis. Presentation at the Annual Conference of the International Society for New Institutional Economics, Budapest, Hungary, September 2003.
147 In addition, in order to take advantage of economies of scale and to provide services more efficiently, several smaller municipalities have made arrangements to jointly provide water and wastewater services.
148 Of note is that water tariffs can vary significantly between municipalities, because they are set on a local basis. The tariffs of publicly owned water utilities are set by the municipal government, while the tariffs of private operators are set out in the contract between the operator and municipality.
149 Boscheck, R. (2002) “European Water Infrastructures: Regulatory Flux void of Reference? The Cases of Germany, France and England and Wales” Intereconomics, 37(3), p 143.

3 Industry Structures
40 IPART Literature Review
ownership (retained by the public sector) and asset management (delegated to the private sector). A brief explanation of each type of contracting arrangement is provided in Box 3.1 below.
Box 3.1 Types of contracts
Management contracts
These are short-term contracts (typically 5 years). Under a management contract, the private operator is responsible for providing all staff and expertise required to run a system (such as, a treatment plant). It isnot required to provide working capital or investment funds, as this remains the responsibility of the municipality. The private operator may be remunerated by payment of a fixed fee or partially/wholly onthe basis of measurable results (eg, productivity).
Lease contracts (affermage)
These are medium-term contract (typically 10 to 12 years). Under a lease contract, the private operator is responsible for system operation and maintenance, renewals and rehabilitation and for providing adviceon new investment requirements. The private operator may also (under a separate contract) be involvedin the implementation of capital investment decisions. The private operator is remunerated directly byconsumers. The municipality is responsible for financing capital expenditure and making investmentdecisions.
Concession contracts
These are long-term contract (recently limited to 20 years). Under a concession contract, the privateoperator is responsible for financing new investment in the network and treatment facilities over the lifeof the network, with the assets transferred to the municipality at the end of the contract. However, the municipality may undertake some investment to benefit from government subsidies or cheaper finance.The private operator is remunerated directly by consumers.
While lease contracts (affermage) are the most common form of contract, there has been an increase in the use of concession contracts, particularly in urban areas, due to the need for increased investment to meet stronger environmental regulations. Hybrids of these options also exist.
Assessment of the effectiveness of private sector involvement in France is necessarily focused on management of services rather then planning and development of new sources. Boscheck (2002) notes that views on the success of the arrangements in France are mixed:150
To some, the French system provides a compelling model of delegated regulation, localized adaptation of a national approach to integrated water resource management and effective, market-led infrastructure provision. To others, decentralization has weakened economic and environmental regulation and diffused enforcement powers vis-à-vis the three major private water companies jointly “organizing competition” of 95% of the private water supply and sanitation services.
150 Ibid.

3 Industry Structures
Literature Review IPART 41
Ballance and Taylor (2001, 2005) conclude that it is difficult to make a good assessment of the efficiency of the industry due to a lack of data. However, they believe that it is reasonably productively and allocatively efficient. From a dynamic efficiency point of view, they conclude that the industry appears to be performing well, given the size of the private companies, and their development of new technologies and commitment to research and development. Technological innovations in drinking water treatment, distribution system management and information technology are mentioned. Seidenstat, Nadol and Hakim (2000) note that the major players are well recognised for their innovation, as well as for their provision of high quality services.151
Ballance and Taylor (2001, 2005) also found that the operation of the contract tendering market appears to be working reasonably well. While acknowledging that the tendering process – which tends to result in contracts being re-awarded to the current (incumbent) operator rather than a new operator – is often criticised as being a result of market rigidities and information asymmetries, they believe that this result could also be explained by the superior efficiency of incumbent operators. However, Boscheck (2002) points out that there are cases of incumbent companies abusing their dominant position, by withholding information from other tenderers when contracts have come up for renewal, leading to the incumbent being reinstated.152
Elnaboulsi (2001) concludes that competition is not as effective as it could be, given the dominance of a small number of large private operators. On the other hand, Ballance and Taylor (2001) believe that the number of bidders for each contract is likely to be significant enough to result in effective competition, as supported by a decline in prices following the award of a tender.
Nevertheless, Ballance and Taylor (2001, 2005) also highlight that the franchising process has some shortcomings. For example, they consider that limitations placed on the level of market share that companies may attain could be protecting less efficient operators, by reducing the number of private operators that are eligible to tender for future contracts.153 Further, they note that corruption (through the payment of bribes in order to secure contracts) has been a problem in the past.154 However, the passing of a law that requires greater transparency in the tendering process is believed to have reduced this problem. In addition, they believe that the
151 Seidenstat, P., Nadol, M. and Hakim, S. (2000) America’s Water and Wastewater Industries – Competition
and Privatization. Public Utilities Reports Inc, p 5. 152 Boscheck, R. (2002) “European Water Infrastructures: Regulatory Flux void of Reference? The Cases
of Germany, France and England and Wales” Intereconomics, 37(3), p 144. 153 Ballance and Taylor (2005) report that “the French Competition Council has taken the view that an
operator should not be allowed a market share greater than 50% of the private market in a department except when the operator is itself not a dominant player in the national sphere.” See Ballance, T. and Taylor, A. (2005) Competition and Economic Regulation in Water – The Future of the European Water Industry, IWA Publishing: London, UK, p 98.
154 See also: Boscheck, R. (2002) “European Water Infrastructures: Regulatory Flux void of Reference? The Cases of Germany, France and England and Wales” Intereconomics, 37(3), p 144; and Seidenstat, P., Nadol, M. and Hakim, S. (2000) America’s Water and Wastewater Industries – Competition and Privatization. Public Utilities Reports Inc, p 5.

3 Industry Structures
42 IPART Literature Review
competitiveness of the tendering market could be enhanced if there were better information flows in the franchise market, as this would allow municipalities to better assess tenders and to evaluate the performance of private operators once the contracts are in place.
3.3.4 Manila, The Philippines
The Government-owned Metropolitan Waterworks and Sewerage System (MWSS) was established in 1878 and is responsible for providing water and wastewater services to greater Manila.155 In the mid-1990s, the Government began to explore options for reforming the water sector. By this time, MWSS was supplying water to only two-thirds of its coverage population (on an intermittent basis) and wastewater services to just 8 per cent. In addition, over 50 per cent of the water produced was not billed due to leaks, defective water meters and theft.156
In 1994, a private group approached the Government with a proposal to purchase MWSS and improve water services. The proposal was unsuccessful for two main reasons. First, it was illegal to sell MWSS. Second, negotiating with a single group was believed to be unsuitable for such a large, politically sensitive transaction. Nevertheless, the Government continued to pursue options for private sector involvement. Despite two further proposals to acquire MWSS on a negotiated basis, the decision was made to offer concessions to operate MWSS via a competitive tendering process.157
MWSS was split into two zones (east and west) and tenders were sought to supply each area. Although tenderers were required to bid for both areas, no one tenderer could secure both concessions.158 The key driver for the split was to enable the regulator to benchmark the concessionaires against one another in order to determine whether costs were efficient, as well as to foster competition between the two entities. A secondary driver was that one concessionaire could provide services in the other’s area if that concessionaire got into financial difficulty.159 In 1997, the Government awarded 25-year concessions to Manila Water (to supply the east zone) and Maynilad (to supply the west zone).160
In 2000, the Asian Development Bank reported that the bidding process and transition period had worked well.161 However, Slattery (2003) reports that Manila Water was more successful at achieving operating efficiencies than Maynilad. In addition, Maynilad’s cost per cubic metre of water was almost twice as high as 155 Dumol, M., The Manila Water Concession: A Key Government Official’s Diary of the World’s Largest Water
Privatisation, World Bank: Washington DC, July 2000, p 5. 156 Ibid, pp 5 and 11. 157 Ibid, pp 9-11. 158 Ibid, pp 45-47. 159 Ibid. 160 Slattery, K. (2003) What Went Wrong? Lessons from Cochabamba, Manila, Buenos Aires, and Atlanta,
Annual Privatization Report 2003, pp 4-5. 161 Asian Development Bank, Developing Best Practices for Promoting Private Sector Investment in
Infrastructure – Water Supply, 2000, Appendix 1, pp 34-35.

3 Industry Structures
Literature Review IPART 43
Manila Water’s.162 Hall, et al (2004) note that promised increases to service standards and lower tariffs have not eventuated.163
Further, in late 2002, Maynilad gave notice of early termination of its concession agreement with MWSS. The key reason given was MWSS’s refusal to allow a rate adjustment to recover foreign exchange losses incurred as a result of the 1997 Asian financial crisis.164 The agreement was terminated in early 2003, with responsibility for water services reverting to MWSS.165 In late 2006, following a new round of bidding, the concession for the west zone was awarded to a consortium lead by DMCI Holdings Inc.166
3.3.5 Germany167
In Germany, municipalities are responsible for the provision of water and wastewater services. The German water industry is relatively fragmented. It is estimated that there are around 6,500 to 7,500 water companies, servicing approximately 8,500 municipal areas in the former West Germany and 7,800 local authorities in the former East Germany.
Water and wastewater services may be provided directly by the municipality (ie, by a department or agency of the municipality, a company owned by the municipality, or a cooperative between municipalities) or under an arrangement with the private sector. Although private sector participation has been allowed relatively recently, it is on the increase.168
In larger urban areas, the main utility service providers are multi-sector utilities (known as stadtwerke). These utilities may provide energy, public transport and other services in addition to water and wastewater. Of municipal areas with more than 100,000 inhabitants, more than 90 per cent have stadtwerke. In addition, one third of stadtwerke have some private sector involvement.
162 Slattery, K. (2003) What Went Wrong? Lessons from Cochabamba, Manila, Buenos Aires, and Atlanta,
Annual Privatization Report 2003, pp 4-5. 163 Hall, D., Corral, V., Lobina, E., and de la Motte, R., Water privatisation and restructuring in Asia-Pacific –
a report commissioned by Public Services International, December 2004 (with minor corrections January 2005), p 20.
164 This problem arose because the west zone concession was allocated the debt portfolio of MWSS. See Kessides, I.N. (2004) Reforming Infrastructure – Privatization, Regulation, and Competition, World Bank and Oxford University Press: Washington DC, p 224.
165 Slattery, K. (2003) What Went Wrong? Lessons from Cochabamba, Manila, Buenos Aires, and Atlanta, Annual Privatization Report 2003, p 4.
166 The Manila Times, DMCI, Metro Pacific win Maynilad bid, 6 December 2006. 167 Information on the arrangements in Germany was obtained from: Ballance, T. and Taylor, A. (2005)
Competition and Economic Regulation in Water – The Future of the European Water Industry, IWA Publishing: London, UK, pp 108-120.
168 There has been significantly less private involvement in wastewater than water. In a number of states wastewater is regarded as a sovereign responsibility, ie, a service that must be provided directly by the state. On the other hand, water is traditionally seen as a service that can be delegated to the private sector.

3 Industry Structures
44 IPART Literature Review
There are two major models of private sector involvement:169
the contract-based model
the joint-venture model.
The contract-based model has two main forms. The Betriebsführungsmodell is similar to a French style concession, affermage or management contract. As in France, the private company has different responsibilities depending on the type of contract. The Betreibermodell is the equivalent of the build own operate (BOO) and build operate transfer (BOT) models. The contract-based model has been less popular than the joint-venture model.
Under the joint venture model, a company formed between the municipality and a private firm takes ownership of infrastructure assets. The municipality often has a majority share in the company and an option to buy back the private firm’s shareholding. Responsibility for operation and maintenance of the assets is usually assigned to the private operator, while the joint-venture company is responsible for financing new investment. Although this type of model has been adopted by a relatively small number of municipalities, those municipalities that have adopted it have been relatively large in size. The joint-venture model of private participation is also a feature of a number of stadtwerke.
The advantages of the joint venture model include the ability to operate under the favourable tax regime that applies to public firms, the provision of public oversight of the private operator and the fostering of trust and partnership between the parties. Ballance and Taylor (2005) also point out that:170
The [joint-venture model] is probably successful in Germany because it is consistent with the traditional German management arrangements in that it is likely to combine well with both the stakeholder model of corporate governance that is practised in Germany and the traditional preference for a consensus-based approach to decision making.
Recently, there has also been a lot of discussion on the possible liberalisation of the German water industry, including the possible removal of a section of the Competition Act that allows water supply companies to have local monopolies and to refuse third party access to their networks. However, major reform is not expected in the near future.
169 Note that full privatisation (ie, the sale of an entire utility and its assets) is prohibited in most German
states. 170 Ballance, T. and Taylor, A. (2005) Competition and Economic Regulation in Water – The Future of the
European Water Industry, IWA Publishing: London, UK, p 113.

3 Industry Structures
Literature Review IPART 45
3.3.6 England and Wales
The first major attempt to introduce direct competition into the industry was through inset appointments. The concept was introduced under the Water Act 1989. An inset appointment can be granted to supply water or wastewater services and allows a competitor to replace the incumbent as the undertaker for a specific geographic area, within the incumbent’s appointed area.171 Ofwat describes the arrangements as a type of ‘competition for the market’, because there is one-off competition between potential appointees to secure the appointment. However, inset appointees are also subject to the yardstick competition regime.172
When first introduced, only new customers (such as greenfield development sites) were eligible to receive supply from an inset appointee.173 However, the arrangements have been extended over time and the circumstances in which an inset appointment may currently be granted are as follows:174
the customer uses (or is likely to use) at least 50 megalitres of water per year in England or 250 megalitres of water in Wales, or
the site is not currently serviced by a water and/or wastewater undertaker, or
the existing undertaker agrees to the inset.
Ofwat has made a total of 11 inset appointments,175 all of which are in respect of business customers. Of these, four are large user appointments, six are for unserved (greenfield) sites and one is by incumbent consent.176
The Government believes that inset appointments have sharpened incentives for appointed undertakers to introduce lower tariffs and better services for large users.177 Cowan (1997) reports that several companies have introduced tariffs for large users that have resulted in discounts from about 1 per cent to 30 per cent.178 However, the Government believes that the impact is lessened because not all potential entrants want to become appointed undertakers. It also notes that the application process has attracted criticism for being onerous and slow.179
171 Department for Environment, Food and Rural Affairs and Welsh Assembly Government, Extending
opportunities for competition in the water industry in England and Wales – Consultation document, July 2002, para 19, p 10.
172 Ofwat, Outcomes of Ofwat’s internal review of market competition in the water sector, 4 April 2007, pp 16-17.
173 Cowan, S. (1997) “Competition in the Water Industry” Oxford Review of Economic Policy, 13(1), p 87. 174 Ofwat (with the input of Defra), The Development of the Water Industry in England and Wales, February
2006, p 98. 175 The first inset appointment was made in May 1997 and the latest in August 2004. See Ofwat, Inset
Applications and Appointments, downloaded from: www.ofwat.gov.uk on 13 August 2007. 176 Ofwat, Outcomes of Ofwat’s internal review of market competition in the water sector, 4 April 2007, p 17. 177 Department for Environment, Food and Rural Affairs and Welsh Assembly Government, Extending
opportunities for competition in the water industry in England and Wales – Consultation document, July 2002, para 19, p 10.
178 Cowan, S. (1997) “Competition in the Water Industry” Oxford Review of Economic Policy, 13(1), p 87. 179 Department for Environment, Food and Rural Affairs and Welsh Assembly Government, Extending
opportunities for competition in the water industry in England and Wales – Consultation document, July 2002, para 19, p 10.

3 Industry Structures
46 IPART Literature Review
Ballance and Taylor (2005) conclude that inset appointments have not successfully introduced widespread competition into the water sector and are unlikely to do so in the future.180
3.4 Competition for supply inputs
The contracting out of services through a competitive tendering process can enhance efficiency through the delivery of cost savings.181 It is closely related to competition for the market and is employed extensively by water utilities.182
In its Investigation into water and wastewater service provision in the greater Sydney region, IPART noted that Sydney Water contracts out some of its activities to the private sector using a competitive procurement process. The services it contracts in this way range from operations and maintenance work, which may be administered through a service contract, through to large capital works, which may be administered through build-own-operate (BOO) or build-own-operate-transfer (BOOT) arrangements.183 Under these arrangements, Sydney Water (often in conjunction with other Government agencies) determines the approach to be taken to deliver the required outcome and plans a project to implement this approach, which can include specifying the details of the engineering solution required. It then competitively procures various inputs to the projects, or tenders for private sector provision of the entire project.184
In the same report, IPART also discussed the merits of a more flexible approach to tendering – ie, competitive sourcing. Competitive sourcing is defined as “the competitive procurement of a clearly defined service outcome where the processes or approaches to be used to deliver this outcome are not specified in detail.”185 That is, tenders are sought to meet certain objectives/requirements (eg, a certain quantity of bulk water supply) rather than for a defined project (eg, a pipeline to bring water from a dam outside the metropolitan area).186
While noting that competitive procurement can produce a level of competition that minimises the cost to Sydney Water and exposes it to a range of technological options, IPART explained that greater use of competitive sourcing can facilitate a much greater level of private sector innovation in the supply of water resources, 180 Ballance, T. and Taylor, A. (2005) Competition and Economic Regulation in Water – The Future of the
European Water Industry, IWA Publishing: London, UK, p 44. 181 Cowan, S. (1997) “Competition in the Water Industry” Oxford Review of Economic Policy, 13(1), pp 85-
86; and Webb, M. and Ehrhardt, D. “Improving Water Services through Competition”, Note No. 164 in Public Policy for the Private Sector. World Bank Group: Washington DC, December 1998, pp 6-7.
182 Cowan, S. (1997) “Competition in the Water Industry” Oxford Review of Economic Policy, 13(1), pp 85-86.
183 IPART, Investigation into Water and Wastewater Service Provision in the Greater Sydney Region, Issues Paper, May 2005, p 24.
184 IPART, Investigation into Water and Wastewater Service Provision in the Greater Sydney Region, Final Report, October 2005, p 15.
185 Ibid, p 14. 186 IPART, Investigation into Water and Wastewater Service Provision in the Greater Sydney Region, Issues
Paper, May 2005, p 24.

3 Industry Structures
Literature Review IPART 47
expose the water authority to a greater range of technological options and thus increase the potential for efficiency gains.187
Given the widespread use of competitive tendering (including by Sydney Water), practical examples are not provided here. However, Marsden Jacob Associates (2005) provide a number of Australian examples.188 IPART’s Investigation into water and wastewater service provision in the greater Sydney region also provides two examples of jurisdictions that have used competitive sourcing. In addition, IPART notes that competitive sourcing techniques have been used in other utility sectors (such as electricity) for some time.189
3.5 Competition in the market
Competition in the market can be described as multiple providers competing to supply a good or service to the same group of consumers.190
In network industries such as gas and electricity, competition has been introduced by providing access to the facilities in the vertical supply chain that exhibit natural monopoly characteristics (ie, the network), in order to promote competition in those parts of the supply chain that are potentially competitive.191 However, there are currently very few examples of this type of competition in the water and wastewater industry.192
In looking at the cost structure of the water industry, Marsden Jacob Associates (2005) and Webb and Ehrhardt (1998) argue that access regimes have not been as common in water as in other network utilities because:
in water, a greater share of costs are in the transportation network (ie, the natural monopoly element of the supply chain) than in the potentially competitive areas. (In contrast, gas and electricity are expensive to produce, but relatively inexpensive to transport)
water has traditionally been less valuable than the products or services provided by other network industries, so a given percentage gain in efficiency has been worth less in water than in other industries.
187 IPART, Investigation into Water and Wastewater Service Provision in the Greater Sydney Region, Final
Report, October 2005, p 15. 188 Marsden Jacob Associates, Third Party Access in Water and Sewerage Infrastructure: Implications for
Australia – Research paper prepared for the Australian Government Department of Agriculture, Fisheries and Forestry, 8 December 2005, pp 47-49.
189 IPART, Investigation into Water and Wastewater Service Provision in the Greater Sydney Region, Final Report, October 2005, pp 18-19.
190 See Frontier Economics, Facilitating competition in water services – a report prepared for Sydney Water, November 2004, p 13; and Ballance, T., and Taylor, A. (2002) “Competition in the water market: a review of the issues”, in Water 21, IWA Publishing.
191 Frontier Economics, Facilitating competition in water services – a report prepared for Sydney Water, November 2004, p 16.
192 Kessides, I.N. (2004) Reforming Infrastructure – Privatization, Regulation, and Competition, World Bank and Oxford University Press: Washington DC, p 231.

3 Industry Structures
48 IPART Literature Review
However, Webb and Ehrhardt (1998) note that the net gains from competition have been “huge” in many industries and that if even a fraction of these gains could be realised in water, the costs of establishing and maintaining an access regime could be worthwhile. They also state that, as a general rule, complex forms of competition involving common carriage (third party access) are worth contemplating where administrative capacity is high, water is high cost, and the incumbent’s network is in reasonable shape.193
Similarly, despite suggesting that the success of third party access in the gas and electricity industries may not be repeated to the same extent in water, Marsden Jacob Associates (2005) note that the potential scope for third party access has increased due to factors such as the increasing scarcity (and hence cost) of water from traditional sources, the growing recognition that recycled water is a viable alternative source, and technological developments associated with desalination:194
As expanding water supplies becomes more costly to produce, the ability for entrants to provide competitive solutions might be eased.
However, Marsden Jacob Associates also note that due to the high cost of transporting water, access is likely to be for localised networks, rather than the large (intercity) transmission networks seen in gas and electricity:195
As a result of the shifts in cost schedules for membrane technology, the falling costs of desalination are making investment in long distance pipelines carrying first use water between coastal centres increasingly less attractive. For instance, in Queensland, the potential to supply the Gold Coast with desalinated water is a challenge to the option of building a 120km pipeline from the Wivenhoe Dam to supply the Gold Coast.
These shifts in costs appear likely to reduce demand for access to major transmission pipelines supplying coastal cities, but may increase demand for access to reticulation infrastructure to supply contracting customers with desalinated water.
Nevertheless, Foellmi and Meister (2005) point out:196
…both practical experience and theoretical research about the effects and the efficiency of [access based competition in the market] are still very limited in the piped water industry.
Although competition in the market facilitated by third party access receives much of the attention in the literature, competition in the market may also occur in the competitive elements of the supply chain without third party access. For example, entrants may compete in retail services only. In this case, the water is still delivered
193 Webb, M. and Ehrhardt, D. “Improving Water Services through Competition”, Note No. 164 in Public
Policy for the Private Sector. World Bank Group: Washington DC, December 1998, p 5. 194 Marsden Jacob Associates, Third Party Access in Water and Sewerage Infrastructure: Implications for
Australia – Research paper prepared for the Australian Government Department of Agriculture, Fisheries and Forestry, 8 December 2005, p 37.
195 Ibid. 196 Foellmi, R. and Meister, U. (2005) “Product Market Competition in the Water Industry: Voluntary
Non-discriminatory Pricing” Journal of Industry, Competition and Trade, 5(2), pp 115-116.

3 Industry Structures
Literature Review IPART 49
to end users by the incumbent provider, but the entrant provides the retail functions, such as customer service and billing.197
As mentioned above, there is currently no competition in the market in water or wastewater in Australia.198 However, there have been two examples of third party access being sought under the Trade Practices Act 1974 (the Commonwealth’s generic access regime). There have also been a few instances of access being achieved by voluntary negotiation. This is discussed in more detail below.
Internationally, the only known third party access precedents are the United Kingdom (England and Wales) and the United States (California). In Scotland, new entrants will be allowed to compete to supply business customers from 2008. However, because third party access to the incumbent’s network is prohibited, competition is limited to retailing. The arrangements in England and Wales, California and Scotland are also discussed below.
3.5.1 Australia
In its Investigation into water and wastewater service provision in the greater Sydney region, IPART recommended the establishment of a state-based access regime for water and wastewater infrastructure, on the basis that access-based competition has the potential to improve the efficiency and effectiveness of service provision.199 IPART further recommended that the regime be based on a ‘negotiate and arbitrate’ model. The Government adopted IPART’s recommendations, with the establishment of an access regime under the Water Industry Competition Act 2006 (the WICA). However, the WICA has not yet commenced.
Currently, access to water infrastructure services is also supported by the generic provisions of the national access regime, which is set out in Part IIIA of the Trade Practices Act 1974. As explained by the National Competition Council (NCC):200
The regime set out in Part IIIA establishes legal rights for third parties to share the use of certain infrastructure services of national significance on reasonable terms and conditions.
197 Webb, M. and Ehrhardt, D. “Improving Water Services through Competition”, Note No. 164 in Public
Policy for the Private Sector. World Bank Group: Washington DC, December 1998, pp 1-2. 198 Marsden Jacob Associates, Third Party Access in Water and Sewerage Infrastructure: Implications for
Australia – Research paper prepared for the Australian Government Department of Agriculture, Fisheries and Forestry, 8 December 2005, p 47.
199 IPART, Investigation into Water and Wastewater Service Provision in the Greater Sydney Region, Final Report, October 2005, pp 29-38.
200 National Competition Council, The National Access Regime: A Guide to Part IIIA of the Trade Practices Act 1974, Part A – Overview, December 2002, p 3.

3 Industry Structures
50 IPART Literature Review
Part IIIA establishes three means of seeking access to an infrastructure service:201
Declaration – a business may apply to the NCC to have the service declared. A service will only be declared if it satisfies certain criteria.
An effective access regime – if the infrastructure services are already the subject of an access regime, (eg, a state-based access regime) which is deemed to be effective (through a process of ‘certification’), then declaration is not available to those services under Part IIIA, but may be sought under the “effective access regime”.
A voluntary undertaking – where the undertaking (which contains the terms and conditions of access) has been approved by the Australian Competition and Consumer Commission (ACCC).
To date, access to water infrastructure services have only been sought under the declaration provisions of Part IIIA. There have been two applications for declaration:
Lakes R Us – which unsuccessfully sought to have services provided by the storage and transport infrastructure of Snowy Hydro Limited and State Water Corporation declared,202 and
Services Sydney – which successfully applied to have services provided by parts of Sydney Water’s wastewater network declared.203 In late 2006 the ACCC was asked to arbitrate a dispute between Services Sydney and Sydney Water in relation to the methodology used to calculate access prices.204 The ACCC released its final determination in June 2007.205
201 Ibid, pp 8-11. 202 See National Competition Council, The Lakes R Us application for declaration of water storage and release
services, January 2006; and Marsden Jacob Associates, Third Party Access in Water and Sewerage Infrastructure: Implications for Australia – Research paper prepared for the Australian Government Department of Agriculture, Fisheries and Forestry, 8 December 2005, pp 22-24.
203 See National Competition Council, Services Sydney Application for declaration of Sydney sewerage network services, December 2005; and Marsden Jacob Associates, Third Party Access in Water and Sewerage Infrastructure: Implications for Australia – Research paper prepared for the Australian Government Department of Agriculture, Fisheries and Forestry, 8 December 2005, pp 25-29.
204 Australian Competition and Consumer Commission, Media Release - Access dispute in relation to declared services provided by Sydney Water, 15 November 2006.
205 The ACCC determined that “the access price that Services Sydney is to pay Sydney Water in respect of the customers supplied by Services Sydney is Sydney Water's regulated retail price for those customers minus Sydney Water's avoidable costs, plus any facilitation costs associated with providing access.” See Australian Competition and Consumer Commission, Media Release – ACCC determination – Sydney Water access dispute, 19 July 2007.

3 Industry Structures
Literature Review IPART 51
However, an examination of the literature has identified two examples of third party access being achieved on a voluntary basis:206
In South Australia, a consortium of Barossa Valley wine grape growers (Barossa Infrastructure Limited (BIL)) obtained the right to extract water from the Murray River and negotiated access to the South Australian Water Corporation’s infrastructure to transport the water to the Barossa Valley. BIL developed its own water distribution system in the Barossa Valley. The Water Transportation Agreement between the two parties became operational in late 2001.207
In Queensland, local government owned water businesses (including Logan Water and Ipswich Water) purchase bulk water from South East Queensland Water and have negotiated access to Brisbane Water’s treatment and transmission infrastructure in order to supply their customers.208
Note that in both these cases, the access seeker and access provider were supplying different customers (ie, the access seeker did not intend to compete with the access provider to supply its customers).
3.5.2 England and Wales
In 2002, the UK Government signalled its intention to extend the opportunities for competition in water supply to eligible large users, supported by the introduction of new legislation.209 The Government explained that its objective was to develop competition for the benefit of customers:210
The Government believes that the properly managed development of competition in the water industry in England and Wales is desirable as this should lead to greater efficiencies, keener prices, innovation and better services, to the benefit of customers. The Government also believes that competition must be balanced against its wider objectives to protect public health, protect and improve the environment, meet the Government’s social goals, and to safeguard services to customers.
206 See Marsden Jacob Associates, Third Party Access in Water and Sewerage Infrastructure: Implications for
Australia – Research paper prepared for the Australian Government Department of Agriculture, Fisheries and Forestry, 8 December 2005, pp 21-22; and Australian Government Department of the Prime Minister and Cabinet, A Discussion Paper on the Role of the Private Sector in the Supply of Water and Wastewater Services, August 2006, p 14.
207 See also: South Australia Water Corporation, Barossa Water Supply System Upgrade – Report to the Parliamentary Public Works Committee, June 2001.
208 See also Water Services Association of Australia (WSAA), Submission to the Commonwealth Productivity Commission Review of the Regulation Impact Statement – National Competition Policy Arrangements, 10 June 2004.
209 Department for Environment, Food and Rural Affairs and Welsh Assembly Government, Extending opportunities for competition in the water industry in England and Wales – Consultation document, July 2002, para 1, p 6.
210 Ibid.

3 Industry Structures
52 IPART Literature Review
The Water Act 2003 provided this framework for competition. It also provided, for the first time, a formal framework for licensees to access a water undertaker’s system for the purposes of competing to supply large water users.211
Since December 2005, companies have been allowed to compete to supply non-household customers who consume at least 50 megalitres of water per year if they successfully obtain a water licence. Ofwat estimates that around 2,200 businesses – who collectively spend around £210 million (in 2003-04 figures) annually – meet this criterion.212
Competition to supply household customers was not introduced. The reasons given include the following:213
the potential for cross-subsidies present in household tariffs to be unwound
the need for a complex and costly regulatory regime to ensure that public health, social and environmental objectives are met, which would still leave substantial uncertainties, particularly regarding the effects on individual customers’ bills.
The reasons why competition was believed to be practicable for large users include the following:214
cross-subsidies in tariffs for large users have largely been unwound
there are likely to be benefits from entering into contractual arrangements to meet the individual requirements of large users
it may be economic for a new entrant to develop a small source of water for a particular customer, whereas it would not be economic for an undertaker to do so.
In addition, the competition framework was not extended to include wastewater services, because the Government believed that a significant level of competition in sewerage and effluent treatment already existed (for example, in tankered removal/treatment and stand-alone on-site facilities) and no interest had been expressed for doing so.215
211 Prior to this (for example to provide services as an inset appointee), new entrants had to rely on the
generic provisions of the Competition Act 1998 (which prohibits anti-competitive behaviour) to gain access. Water undertakers could risk breaching the Act if they refused access to any parts of their infrastructure deemed to be an “essential facility” without objective justification, or if they offered access on unreasonable terms. See Ballance, T. and Taylor, A. (2005) Competition and Economic Regulation in Water – The Future of the European Water Industry, IWA Publishing: London, UK, pp 44- 45; and Hern, R. (2001) “Competition and access pricing in the UK water industry” Utilities Policy, 10, p 117.
212 Ofwat, Press Notice 31/05 - New Competition Opportunities in the Water Industry, 1 December 2005; and Ofwat (with the input of Defra), The Development of the Water Industry in England and Wales, February 2006, p 98.
213 Department for Environment, Food and Rural Affairs and Welsh Assembly Government, Extending opportunities for competition in the water industry in England and Wales – Consultation document, July 2002, pp 12-13.
214 Ibid, p 13. 215 Ibid, p 14.

3 Industry Structures
Literature Review IPART 53
In order to compete, new companies must first obtain a licence from Ofwat. Two types of licence are available:216
a retail licence, which authorises the licensee to purchase a wholesale supply of water from an appointed water company and to use its supply system for the purpose of supplying water to a customer’s premises
a combined licence, which authorises the licensee to introduce water into an appointed water company's supply system and to supply the water to a customer’s premises.
As at August 2007, Ofwat had granted licenses under this regime to all seven companies who had applied for them. Of the licences granted, six were combined licences and one was a retail licence.217 However, no customers have yet switched suppliers under this regime.218
Access pricing
The Water Act 2003 (by amendment to the Water Industry Act 1991) requires that access prices be set according to a ‘costs principle’ that is defined in the legislation. Ofwat issues guidance to access providers, including the calculation of access prices according to the costs principle.219 The guidance states that the costs principle is essentially a retail-minus approach, which should be applied as follows: 220
Access price = any expenses reasonably incurred + retail charge – ARROW costs221
Ofwat notes that the costs principle was designed to encourage efficient competition, with appropriate protection for ineligible customers (ie, because those customers that do not participate in the new regime do not subsidise those who do).222
In a recent ruling on access pricing, the Competition Appeal Tribunal (CAT) expressed concern about Ofwat’s interpretation of the costs principle. In particular, its view was that the retail price is the appropriate starting point only if it is reasonably cost-based and that Ofwat’s interpretation of ARROW costs is:223
216 Ofwat, Competition, downloaded from: www.ofwat.gov.uk on 27 February 2007. 217 See: Ofwat, Notices of Application, downloaded from: www.ofwat.gov.uk on 13 August 2007; and
Ofwat, Water Supply Licences, downloaded from: www.ofwat.gov.uk on 13 August 2007. 218 Ofwat, The Water Supply Licensing Bulletin, July 2007, p 1. 219 Ofwat, Water Act 2003 - Access Codes: Guidance, September 2006. 220 Ibid, p 48. 221 The guidance document defines ARROW costs as “expenses [of the access provider] that can be
avoided or reduced; or any amount that is recoverable in some other way (other than from other customers of the water undertaker).” See Ofwat, Water Act 2003 - Access Codes: Guidance, September 2006, p 47.
222 Ofwat, Letter to Access Water Management Limited, Aquavitae (UK) Limited and Albion Water Limited entitled “Competition – Water Act 2003”, 13 July 2005, pp 2-3.
223 Albion Water Limited v Water Services Regulation Authority (formerly the Director General of Water Services) (Dŵr Cymru/Shotton Paper), Case Number 1046/2/4/04, Judgement (Abridged Version), 6 October 2006, paragraph 981.

3 Industry Structures
54 IPART Literature Review
…open to serious question, since that interpretation would on the evidence preclude virtually any effective competition or market entry.
Addressing the CAT’s comments, Ofwat recently stated:224
The case concerns a proposed common carriage arrangement … that pre-dates the [water supply licensing] regime … The CAT criticised the result produced by Ofwat’s interpretation of the Costs Principle but it did not identify any specific error or flaw in the access codes guidance.
Recent developments
In late 2006, Ofwat wrote to the Government225 outlining its concerns that there had been limited progress in the development of competition. Ofwat identified two key factors as constraining the development of competition:
the threshold for contestability – the size of the contestable market is limited to approximately 2,300 potential customers
the costs principle – the application of the pricing rule for access is resulting in low margins for entrants.
Ofwat has since commenced a review of market competition. In a recently released consultation paper,226 Ofwat has further canvassed its views in relation to the eligibility threshold and access pricing methodology. In particular, it considers that a significant one-off reduction in the eligibility threshold and higher margins for entrants will help to facilitate effective competition. In relation to the access pricing methodology, Ofwat considers that:227
…it would be appropriate to develop an access pricing regime that better reflects the underlying cost of access and is better designed to aid new entry and the development of effective competition. Given the need to explore fully the most effective access pricing regimes, and the fact that it may be necessary to tailor approaches to particular circumstances (for example, to have different access regimes depending on the services that a new entrant wanted to buy), we consider that it would be appropriate for the relevant legislation to set out clearly the policy framework for the development of competition and to charge Ofwat as the economic regulator of the sector to implement access pricing regimes that meet those principles.
Ofwat has also sought stakeholder comment on a range of other issues, for example, the possibility of introducing competition for household customers and the development of competition in the production and abstraction of water.
224 Ofwat, Outcomes of Ofwat’s internal review of market competition in the water sector, 4 April 2007, pp 11-
12. 225 Ofwat, Letter from Regina Finn (Chief Executive of Ofwat) to Ian Pearson MP (Minister for Climate
Change and the Environment), 28 November 2006, available from: www.ofwat.gov.uk. 226 Ofwat, Consultation on market competition in the water and sewerage industries in England and Wales, 13
July 2007. 227 Ibid, p. 21.

3 Industry Structures
Literature Review IPART 55
3.5.3 California, United States228
The US water and wastewater industry is highly fragmented, with around 52,500 water systems. Most of the US population (around 85 per cent) are served by publicly owned companies (usually municipalities), with the remainder being served by privately owned companies. Further, larger urban areas are predominately served by municipalities, with privately owned companies generally serving smaller population centres.
Although the industry is generally characterised by vertical integration and monopoly service provision, there has been increasing involvement by the private sector. Since the 1980s, there has been steady growth in the number of large cities entering into short-term operations and maintenance contracts. However, in 1997 the Internal Revenue Service (IRS) issued new regulations to allow public utilities to enter into longer term contracts and numerous cities have since done so. The expectation is that there will be greater private sector involvement in the future.
The Californian water system is also characterised by multiple water districts and fragmentation. Over 85 per cent of the population receives its water from 380 separate retail water agencies. Similar to NSW, California faces water supply and demand imbalances. Following a short but severe drought in 1978, a Governor’s Commission was convened to improve California’s water rights law. One of the conclusions of the review was that water transfers should be encouraged to promote the efficient use of water. However, impediments to the physical transfer of water were not addressed. In particular, facility owners largely controlled access to their own facilities and there was little recourse available to access seekers if their attempts to gain access failed.
When it became apparent that this was an impediment to the opening up of water markets, attempts were made to rectify the problem with the passing of Katz Wheeling Law in the mid 1980s. This law requires owners of water conveyance systems with unused capacity to allow third parties to use those facilities to transport water, provided that “fair compensation” is paid.229 However, there have been conflicting legal decisions in relation to the interpretation of “fair compensation”, and in particular whether the facility owner is entitled to recover costs associated with lost sales. This is believed to be a further barrier to the development of water trading markets.
228 Information obtained from: Marsden Jacob Associates, Third Party Access in Water and Sewerage
Infrastructure: Implications for Australia – Research paper prepared for the Australian Government Department of Agriculture, Fisheries and Forestry, 8 December 2005, pp 18-20; Slater, S. (2005) “A Prescription for Fulfilling the Promise of a Robust Water Market” McGeorge Law Review, 36; Beecher, J.A. and Rubin, S.J. (2000) Deregulation! Impacts on the Water Industry, AWWA Research Foundation and American Water Works Association: Denver, CO., pp xvi to xxiii; and Johnson, R.A. and Moore, A.T. (2002) “Improving Urban Water Infrastructure through Public-Private Partnerships” in Mays, L.W. (ed), Urban Water Supply Handbook, McGraw-Hill: United States, chapter 3.
229 Fair compensation means “the reasonable charges incurred by the owner of the conveyance system, including capital, operation, maintenance, and replacement costs, increased costs from any necessitated purchase of supplemental power, and including reasonable credit for any offsetting benefits for the use of the conveyance system.”

3 Industry Structures
56 IPART Literature Review
3.5.4 Scotland230
Scottish Water is a publicly owned business and is currently the monopoly provider of water and wastewater services in Scotland.231 However, the process of introducing competition into the industry is underway with the introduction of the Water Services etc. (Scotland) Act 2005.
The Act will allow new businesses to compete with Scottish Water to supply retail services to non-household water and wastewater customers. From 1 April 2008, all non-household customers (not just large customers, as is the case in England and Wales) will be allowed to switch to a new retail supplier. As third party access is prohibited, Scottish Water will remain the sole provider of wholesale services.
To facilitate competition, Scottish Water is required to establish a separate retail entity to supply non-household customers. This will involve separation of management, governance, assets and activities. The aim of separation is to ensure that the incumbent and new entrants are competing on a level playing field.
The regulator (the Water Industry Commission for Scotland) will be responsible for regulating wholesale charges, while businesses will be allowed to set their own retail prices. However, they will also be required to offer a default retail tariff that is properly related to the regulated wholesale price.
230 Information on the arrangements in Scotland was obtained from the following documents
downloaded from the website of the Water Industry Commission for Scotland (www.watercommission.co.uk) on 27 March 2007: • Information Note 02: The Licensing Regime Under the Water Services etc. (Scotland) Act; • Information Note 06: Retailing Choices for Business Customers; FAQs; • The Strategic Review of Charges 2006-10: The final determination, 30 November 2005; and • Changing the Taps – Regulating Water in Scotland – A Speech by Sir Ian Byatt, 2006.
231 Scottish Water was formed in 2002 following the consolidation of three water authorities. Prior to the formation of the three water authorities in 1996, local authorities were responsible for the provision of water services.

Bibliography
Literature Review IPART 57
Bibliography
Actew, Frequently asked questions, downloaded from: www.actew.com.au on 23 April 2007.
ActewAGL, Company Structure, downloaded from: www.actewagl.com.au on 23 April 2007.
ActewAGL, Media Release: ACTEW – AGL Partnership Commences, 3 October 2000.
AGL, Media Release: ACT Government Endorses AGL-ACTEW Joint Venture Proposal, 7 December 1999.
Albion Water Limited v Water Services Regulation Authority (formerly the Director General of Water Services) (Dŵr Cymru/Shotton Paper), Case Number 1046/2/4/04, Judgement (Abridged Version), 6 October 2006.
Allen Consulting Group, NCC Occasional Series: Microeconomic Reform in Australia – Comparison to Other OECD Countries, November 2004.
Allen Consulting Group, Saying goodbye to permanent water restrictions in Australia’s cities – Key priorities for achieving water security, Report Commissioned by Infrastructure Partnerships Australia, May 2007.
Armstrong, M., Cowan, S., and Vickers, J. (1994) Regulatory Reform: Economic Analysis and British Experience, The MIT Press: Cambridge, Massachusetts.
Ashton, J. (2003) “Capital Utilisation and Scale in the English and Welsh Water Industry”, The Services Industry Journal, 23(5).
Asian Development Bank, Developing Best Practices for Promoting Private Sector Investment in Infrastructure – Water Supply, 2000.
Auckland Water Industry, Annual Performance Review 2004/05.
Australian Competition and Consumer Commission, Media Release – ACCC determination – Sydney Water access dispute, 19 July 2007.
Australian Competition and Consumer Commission, Media Release - Access dispute in relation to declared services provided by Sydney Water, 15 November 2006.
Australian Competition and Consumer Commission, Pricing Principles for Declared Transmission Capacity Services – Final Report, September 2004.
Australian Financial Review, All’s well in the expanding world of man-made aquifers, 22 March 2007.
Australian Government Department of the Prime Minister and Cabinet, A Discussion Paper on the Role of the Private Sector in the Supply of Water and Wastewater Services, August 2006.
Ballance, T. and Taylor, A., Competition and Economic Regulation in Water – The Future of the European Water Industry, January 2001.
Ballance, T. and Taylor, A. (2002) “Competition in the water market: a review of the issues”, in Water 21, IWA Publishing.

Bibliography
58 IPART Literature Review
Ballance, T. and Taylor, A. (2005) Competition and Economic Regulation in Water – The Future of the European Water Industry, IWA Publishing: London, UK.
Barron, O., Desalination Options and their Possible Implementation in Western Australia: Potential Role for CSIRO Land and Water, CSIRO: Water for a Healthy Country National Research Flagship, June 2006.
Beecher, J.A. and Rubin, S.J. (2000) Deregulation! Impacts on the Water Industry, AWWA Research Foundation and American Water Works Association: Denver, CO.
Bhattacharyya, A., Parker, E. and Raffiee, K. (1994) “An Examination of the Effect of Ownership on the Relative Efficiency of Public and Private Water Utilities” Land Economics, 70(2).
Boscheck, R. (2002) “European Water Infrastructures: Regulatory Flux void of Reference? The Cases of Germany, France and England and Wales” Intereconomics, 37(3).
Brown, A., Stern, J., Tenenbaum, B., and Genger, D., Handbook for Evaluating Infrastructure Regulatory Systems. World Bank: Washington DC, June 2006.
Commerce Commission, “Commerce Act issues relevant to the water industry” in Issue No. 50 of Fairs Fair, March 1998.
Cowan, S. (1997) “Competition in the Water Industry” Oxford Review of Economic Policy, 13(1).
Department for Environment, Food and Rural Affairs and Welsh Assembly Government, Extending opportunities for competition in the water industry in England and Wales – Consultation document, July 2002.
Dore M. (2005) “Forecasting the economic costs of desalination technology” Desalination, 172.
Dumol, M., The Manila Water Concession: A Key Government Official’s Diary of the World’s Largest Water Privatisation, World Bank: Washington DC, July 2000.
Elnaboulshi, J.C. (2001) “Organisation, Management and Delegation in the French Water Industry” Annals of Public and Cooperative Economics, 72(4).
Essential Services Commission, 2008 Water Price Review Guidance Paper, March 2007.
Essential Services Commission, Water Performance Report: Performance of Urban Water and Sewerage Businesses 2005-06, February 2007.
Fabbri, P. and Fraquelli, G. (2000) “Cost and Structure of Technology in the Italian Water Industry” Empirica, 27.
Foellmi, R. and Meister, U. (2005) “Product Market Competition in the Water Industry: Voluntary Non-discriminatory Pricing” Journal of Industry, Competition and Trade, 5(2).
Fraquelli, G. and Giandrone, R. (2003) “Reforming the wastewater treatment sector in Italy: Implications of plant size, structure and scale economies” Water Resources Research, 39(10), 1293.
Fraquelli, G. and Moiso, V. (2005) “Cost Efficiency and Economies of Scale in the Italian Water Industry”.
Frontier Economics, Facilitating competition in water services – a report prepared for Sydney Water, November 2004.
Frontier Economics, Promoting competition in Sydney sewerage markets, 2 November 2004.

Bibliography
Literature Review IPART 59
Grigg, N. (2003) Water, Wastewater, and Stormwater Infrastructure Management, Lewis Publishers: United States.
Hall, D., Corral, V., Lobina, E., and de la Motte, R., Water privatisation and restructuring in Asia-Pacific – a report commissioned by Public Services International, December 2004 (with minor corrections January 2005).
Hayes, K. (1987) “Cost Structure of the water utility industry” Applied Economics, 19.
Hern, R. (2001) “Competition and access pricing in the UK water industry” Utilities Policy, 10.
Hunter Water, The Corporation – Introduction, downloaded from: www.hunterwater.com.au on 30 March 2007.
Houtsma, J., Water Supply in California: Economies of Scale, Water Charges, Efficiency, and Privatization, to be presented at ERSA 2003 Congress, August 2003.
Indepen Consulting and Accenture, Water merger policy: Time for review, sponsored by Severn Trent, South East Water, Swan Group and United Utilities water companies, July 2002.
IPART, Investigation into Water and Wastewater Service Provision in the Greater Sydney Region, Issues Paper, May 2005.
IPART, Investigation into Water and Wastewater Service Provision in the Greater Sydney Region, Draft Report, September 2005.
IPART, Investigation into Water and Wastewater Service Provision in the Greater Sydney Region, Final report, October 2005.
IPART, Review of Metropolitan Water Agency Prices, Issues Paper, June 2002.
Johnson, R.A. and Moore, A.T. (2002) “Improving Urban Water Infrastructure through Public-Private Partnerships” in Mays, L.W. (ed), Urban Water Supply Handbook, McGraw-Hill: United States.
Kennedy, D., Competition in the Water Industry, Centre for the Study of Regulated Industries, Discussion Paper 16, February 1997.
Kessides, I.N. (2004) Reforming Infrastructure – Privatization, Regulation, and Competition, World Bank and Oxford University Press: Washington DC.
Kim, H.Y. and Clark, R.M. (1988) “Economies of Scale and Scope in Water Supply” Regional Science and Urban Economics, 18.
King, S., Does structure dominate regulation? The case of an input monopolist, 9 October 2000.
King, S. (1999) “Price Discrimination, Separation and Access: Protecting Competition or Protecting Competitors?” Australian Journal of Management, 24(1).
Laval, P. (United Water), The Adelaide Contract: the Contribution of Outsourcing to Sustainability, [undated].
Legislative Assembly for the ACT: 2000 Week 1 Hansard (16 February).
London Economics, Water Pricing: The Importance of Long Run Marginal Costs, Prepared for Ofwat, February 1997, pp. 4-5.
Lynk, E.L. (1993) “Privatisation, Joint Production and the Comparative Efficiencies of Private and Public Ownership: The UK Water Industry Case” Fiscal Studies, 14(2).

Bibliography
60 IPART Literature Review
Marin, P. and Izaguirre, A.K., “Private participation in water – Toward a new generation of projects?” Public-Private Infrastructure Advisory Facility, Note No. 14, September 2006.
Marsden Jacob Associates, Third Party Access in Water and Sewerage Infrastructure: Implications for Australia – Research paper prepared for the Australian Government Department of Agriculture, Fisheries and Forestry, 8 December 2005.
Marsden Jacob Associates, Securing Australia’s Urban Water Supply: Research notes for selected case studies, 20 November 2006.
Mizutani, F. and Urakami, T. (2001), “Identifying network density and scale economies for Japanese water supply organizations”, Papers in Regional Science, 80.
National Competition Council, Services Sydney Application for declaration of Sydney sewerage network services, December 2005.
National Competition Council, The Lakes R Us application for declaration of water storage and release services, January 2006.
National Competition Council, The National Access Regime: A Guide to Part IIIA of the Trade Practices Act 1974, Part A – Overview, December 2002.
Network Economics Consulting Group, ‘Dual Till’ at Sydney Airport, Final Report prepared for the Australian Competition and Consumer Commission, May 2000.
Noll, R., Shirley, M. and Cowan, S. (2000) Reforming Urban Water Systems in Developing Countries, Stanford Institute for Economic Policy Research (SIEPR) Discussion Paper No. 99-32.
Ofwat, Competition, downloaded from: www.ofwat.gov.uk on 27 February 2007.
Ofwat, Consultation on market competition in the water and sewerage industries in England and Wales, 13 July 2007.
Ofwat, Guideline for the Analysis of Operating Costs and Assets, Regulatory Accounting Guideline 4.03, Operative: Financial Year 2006-07, February 2007.
Ofwat, Inset Applications and Appointments, downloaded from: www.ofwat.gov.uk on 13 August 2007.
Ofwat, International comparison of water and sewerage service 2007 report - covering the period 2004-05, April 2007.
Ofwat, Letter from Regina Finn (Chief Executive of Ofwat) to Ian Pearson MP (Minister for Climate Change and the Environment), 28 November 2006, available from: www.ofwat.gov.uk.
Ofwat, Letter to Access Water Management Limited, Aquavitae (UK) Limited and Albion Water Limited entitled “Competition – Water Act 2003”, 13 July 2005.
Ofwat, Notices of Application, downloaded from: www.ofwat.gov.uk on 13 August 2007
Ofwat, Outcomes of Ofwat’s internal review of market competition in the water sector, 4 April 2007.
Ofwat, Press Notice 31/05 - New Competition Opportunities in the Water Industry, 1 December 2005.
Ofwat (with the input of Defra), The Development of the Water Industry in England and Wales, February 2006.
Ofwat, The Water Supply Licensing Bulletin, July 2007.

Bibliography
Literature Review IPART 61
Ofwat, Water Act 2003 - Access Codes: Guidance, September 2006.
Ofwat, Water and sewerage service unit costs and relative efficiency – 2005-06 report, December 2006.
Ofwat, Water Supply Licences, downloaded from: www.ofwat.gov.uk on 13 August 2007.
Papakura District Council, Water and Wastewater, downloaded from: www.pdc.govt.nz on 4 April 2007.
Pezon, C., Water supply regulation in France from 1848 to 2001: a jurisprudence based analysis. Presentation at the Annual Conference of the International Society for New Institutional Economics, Budapest, Hungary, September 2003.
Prime Minister’s Science, Engineering and Innovation Council (PMSEIC), Recycling Water for our Cities, 28 November 2003.
Queensland Government, Ministerial Media Statement (Hon. Anna Bligh), Early Works Commence on QLD’s Largest Desalination Facility, 19 September 2006.
Queensland Government, Department of Infrastructure, South East Queensland Water Grid, downloaded from: www.thepremier.qld.gov.au on 13 August 2007.
Queensland Water Commission, Fact Sheet 1 – Urban Water Supply Arrangements in SEQ: Changes from Present Arrangements, downloaded from: www.qwc.qld.gov.au on 13 August 2007.
Queensland Water Commission, Fact Sheet 2 - Urban Water Supply Arrangements in SEQ: An Overview, downloaded from: www.qwc.qld.gov.au on 13 August 2007.
Queensland Water Commission, Media Release – Major changes proposed for South East Queensland’s urban water industry, 24 May 2007.
Queensland Water Commission, Media Release - New plan to increase desalinated water output: Bligh, 9 August 2007.
Queensland Water Commission, Urban water supply arrangements in South East Queensland, Final Report, May 2007.
Raftelis, G. (1993) Comprehensive Guide to Water and Wastewater Finance and Pricing (2nd ed), Lewis Publishing: United States.
Reddy, K. and Ghaffour, N. (2007) “Overview of the cost of desalinated water and costing methodologies”, Desalination, 205.
Report of the Controller and Auditor General on Papakura District Council: Water and Wastewater Franchise, April 1998.
Saal, D.S. and Parker, D. (2000) “The impact of Privatization and Regulation on the Water and Sewerage Industry in England and Wales: A Translog Cost Function Model” Managerial and Decision Economics, 21(6).
Saal, D.S. and Parker, D. (2001) “Productivity and Price Performance in the Privatised Water and Sewerage Companies of England and Wales” Journal of Regulatory Economics, 20(1).
Saal, D.S, Parker, D. and Weyman-Jones, T. (2004) “Determining the Contribution of Technical, Efficiency, and Scale Change to Productivity Growth in the Privatized English and Welsh Water and Sewerage Industry: 1985-2000”. Aston Business School Working Paper RP0433.

Bibliography
62 IPART Literature Review
Seidenstat, P., Nadol, M. and Hakim, S. (2000) America’s Water and Wastewater Industries – Competition and Privatization. Public Utilities Reports Inc.
Singapore Government, NEWater – Overview, downloaded from: www.pub.gov.sg on 30 April 2007.
Slater, S. (2005) “A Prescription for Fulfilling the Promise of a Robust Water Market” McGeorge Law Review, 36.
Slattery, K. (2003) What Went Wrong? Lessons from Cochabamba, Manila, Buenos Aires, and Atlanta, Annual Privatization Report 2003.
South Australia Water Corporation, Barossa Water Supply System Upgrade – Report to the Parliamentary Public Works Committee, June 2001.
Spellman, F.R. and Drinan, J. (2000) The Drinking Water Handbook, CRC Press.
Stone and Webster Consultants Ltd, Analysis of whether there are significant Cross-Subsidies between the different Customer Groups served by Scottish Water, A Final Report for the Scottish Executive, February 2005.
Stone and Webster Consultants Ltd, Investigation into evidence for economies of scale in the water and sewerage industry in England and Wales, Final Report, for the Office of Water Services (Ofwat), January 2004.
Sturgess, G. L. (2007) “Will water float? Competition and private provision in urban water supply” in Water that Works – sustainable water management in the commercial sector, Committee for Economic Development of Australia, February 2007.
Sydney Morning Herald, New desalination plant for Western Australia, 15 May 2007.
Sydney Water, Media Release – Contract signed for Sydney’s desalination project, 19 July 2007.
Sydney Water, Sydney Water Submission to the Independent Pricing and Regulatory Tribunal Review of Metropolitan Water Agency Prices, November 2004.
Sydney Water Inquiry, Third Report: Assessment of the contamination events and future directions for the management of the catchment, October 1998.
Tasman Asia Pacific, Third Party Access in the Water Industry – An Assessment of the Extent to which Services Provided by Water Facilities Meet the Criteria for Declaration of Access, September 1997.
The Manila Times, DMCI, Metro Pacific win Maynilad bid, 6 December 2006.
Tynan, N. and Kingdom, B. (2005) “Optimal Size for Utilities?” Public Policy for the Private Sector, Note Number 283, The World Bank Group.
United Water, About United Water, downloaded from: www.uwi.com.au on 30 March 2007.
Victorian Government, Desalination Plant – Frequently asked questions, downloaded from: www.ourwater.vic.gov.au on 13 August 2007.
Water Corporation, Integrated Water Supply Scheme Source Development Plan 2005-2050 – An Overview, 2005, downloaded from: www.watercorporation.com.au on 10 May 2007.
Water Corporation, Perth Seawater Desalination Project and Frequently Asked Questions – Supply of desalinated water into the IWSS, downloaded from: www.watercorporation.com.au on 21 March 2007.

Bibliography
Literature Review IPART 63
Water Industry Commission for Scotland, Changing the Taps – Regulating Water in Scotland – A Speech by Sir Ian Byatt, 2006, available from: www.watercommission.co.uk.
Water Industry Commission for Scotland, Information Note 02: The Licensing Regime Under the Water Services etc. (Scotland) Act; downloaded from: www.watercommission.co.uk on 27 March 2007.
Water Industry Commission for Scotland, Information Note 06: Retailing Choices for Business Customers; FAQs, downloaded from: www.watercommission.co.uk on 27 March 2007.
Water Industry Commission for Scotland, The Strategic Review of Charges 2006-10: The final determination, 30 November 2005.
Water New Zealand, Introduction to the New Zealand Water Industry, downloaded from: www.waternz.co.nz on 20 April 2007.
Watercare Services Limited, About Watercare, downloaded from: www.watercare.co.nz on 30 March 2007.
Webb, M. and Ehrhardt, D. “Improving Water Services through Competition”, Note No. 164 in Public Policy for the Private Sector. World Bank Group: Washington DC, December 1998.
World Bank Group (1997) “Toolkits for private participation in water and sanitation”, see www.worldbank.org/html/fpd/water/wstoolkits/Kit1/frame.html.
Water Services Association of Australia (WSAA), Submission to the Commonwealth Productivity Commission Review of the Regulation Impact Statement – National Competition Policy Arrangements, 10 June 2004.
Water Services Association of Australia (WSAA), Identifying Costs for Wastewater Services, WSAA Occasional Paper No. 16, January 2007.
Water Services Association of Australia (WSAA), WSAAfacts 2005, 2005.
Western Australia Water Corporation (2006), Desalinisation, Paper prepared for the 2006 Australian State of the Environment Committee, Department of the Environment and Heritage, Canberra.
Winter, T., Pannell, D. and McCann, L. (2001), “The Economics of Desalination and its Potential Application in Australia”, Sustainability and Economics in Agriculture Working Paper 01/02, University of Western Australia, downloaded from: http://www.crcsalinity.com.au/newsletter/SeaNews/dpap0102.htm on 10 May 2007.

64 IPART Literature Review

Literature Review IPART 65
Appendices

66 IPART Literature Review

67 Literature Review
IPART
A Studies Review
ed on Economies of Scale and Scope
A Studies Reviewed on Economies of Scale and Scope
Study Summary Results
Tynan, N. and Kingdom, B. (2005) “Optimal Size for Utilities?” Public Policy for the Private Sector, Note Number 283, The World Bank Group.
Using data from 270 water and sanitation providers in Africa, Indonesia, Peru, the United States and Vietnam, this study uses a ‘standard econometric model’ to estimate economies of scale.
Economies of Scale:
While results are mixed, this paper shows that utilities serving a population of 125,000 or less could reduce per customer operating costs by increasing their scale of operation.
In some cases, diseconomies of scale can occur when a large utility (serving more than 125,000) doubles in size. In other case, such an increase in scale does not result in diseconomies.
Fraquelli, G. and Moiso, V. (2005) “Cost Efficiency and Economies of Scale in the Italian Water Industry”.
An empirical analysis based on a 30 year unbalanced panel data of 18 territorial areas in Italy. A stochastic cost frontier approach is adopted using a flexible functional form (ie, a translog specification).
Economies of Scale:
Evidence of economics of output density for all firm sizes (but higher for smaller firms than larger firms).
Evidence of economies of scale up to 90 million cubic metres (ie, a population of about 1 million) and diseconomies of scale thereafter.
Stone and Webster Consultants Ltd, Investigation into evidence for economies of scale in the water and sewerage industry in England and Wales, Final Report, for the Office of Water Services (Ofwat), January 2004.
This study employs econometric methodologies to estimate models of industry costs, for both water and sewerage companies (WaSCs) and water only companies (WoCs) in the United Kingdom, over the period 1992/93 to 2002/03.
Economies of Scale:
There is evidence of diseconomies of scale for the average-sized WaSCs (about 2 million water supply connections and 2.3 million sewerage connections in 2002/03), but these diseconomies are declining over the sample period.
The models show small economies of scale for the average sized WoC (about 350,000 water supply connections). However, the presence of constant returns to scale cannot be rejected, and it would therefore be inappropriate to assume that the average sized WoC is characterised by economies of scale.

A Studies Review
ed on Economies of Scale and Scope
68IPA
RT Literature Review
Study Summary Results
Economies of Scope:
There is evidence of economies of scope from the vertical integration of water production and distribution to connected properties. However, the cost savings are most evident for WoCs. For WaSCs, in the more robust models, zero scope economies cannot be rejected.
There is evidence of diseconomies of scope from the vertical integration of sewerage service functions, implying that sewerage services could be more efficiently provided by separating the functions of treatment & disposal and wastewater collection.
There is evidence of overall diseconomies of scope from the horizontal integration of water and sewerage services. However, evidence of economies of scope between individual production elements is mixed.
There is evidence of economies of scope from the integration of water and sewerage production activities.
There is evidence of diseconomies of scope from the integration of activities where the sharing of inputs is more limited, ie, water production and sewerage connections and sewage treatment & disposal and water connections.
Evidence of economies of scope between water and sewerage connections is inconclusive, although it is noted that the ability to share inputs across these activities is perhaps greatest, ie, through shared network management and common billing.
Saal, D.S, Parker, D. and Weyman-Jones, T. (2004) “Determining the Contribution of Technical, Efficiency, and Scale Change to Productivity Growth in the Privatized English and Welsh Water and Sewerage Industry: 1985-2000”. Aston Business School Working Paper RP0433.
This study estimates the productivity performance of the water and sewerage industry in England and Wales (before and after privatisation) over the period 1985-2000. A quality-adjusted input distance function is estimated, with stochastic frontier techniques.
Economies of Scale:
There is evidence that the average water and sewerage company (WaSC) is characterised by diseconomies of scale.
Ashton, J. (2003) “Capital Utilisation and Scale in the English and Welsh Water
This study estimates a variable cost model of the UK water industry. From this variable cost
Economies of Scale:

69 Literature Review
IPART
A Studies Review
ed on Economies of Scale and Scope
Study Summary Results
Industry”, The Services Industry Journal, 23(5), pp 137-149.
function, estimates of economies of scale and economies of capital utilisation and capacity utilisation are made (for the period 1991-1996).
The data used in the study consist of 20 English and Welsh water companies (average population serviced is 660,000 and average length of water mains is 3,726km).
The results indicate that “slight, albeit significant diseconomies of scale and substantial diseconomies of capital utilisation exist in the industry.”
Houtsma, J., Water Supply in California: Economies of Scale, Water Charges, Efficiency, and Privatization, to be presented at ERSA 2003 Congress, August 2003.
The study considered whether there are significant economies of scale in California’s water supply industry, and if so, at which population size levels.
A statistical analysis of water charge data collected for the period 1995 – 2003 was undertaken. A key underlying assumption was that the water charges generally reflect the cost of production.
Economies of Scale:
Evidence of significant economies of scale in California’s water supply industry. Average charge levels drop for communities with population sizes in excess of 10,000. A further drop was observed when population levels exceed 125,000.
Fraquelli, G. and Giandrone, R. (2003) “Reforming the wastewater treatment sector in Italy: Implications of plant size, structure and scale economies” Water Resources Research, 39(10), 1293.
This study uses data from 103 urban wastewater treatment plants in Italy, in 1996, to estimate a Cobb-Douglas cost function.
Economies of Scale:
Evidence of strong economies of scale for smaller wastewater treatment plants, with economies of scale exhausted at around 15 million cubic metres per year (about 100,000 inhabitants).
Economies of Scope:
Although the study refers to evidence of economies of scope from vertical integration and references are made to water distribution and sewerage collection, the meaning of this is unclear.
Strategic Management Consultants (2002), Optimal entity size in the water industry of England and Wales: a review of factors which influence the size of companies, unpublished report to Ofwat.
(Sourced from Stone & Webster, 2004)
According to Stone and Webster (2004, p 24) the report “examines some of the technical and organisational factors that would underlie the presence of economies of scale rather than the standard economics focus on the analysis of costs and cost functions.”
Economies of Scale:
According to Stone and Webster (2004, p 24), “the principal conclusion in this report is that technical economies of scale are exhausted at about 400,000 connected properties.”
Indepen Consulting and Accenture, Water merger policy: Time for review, sponsored by Severn Trent, South East
Analyses the case for reform of the current merger policy in the water sector in England and Wales. The approach considers four broad company types
Economies of Scale:
Based on a ‘bottom up’ assessment (ie, looking at the potential for
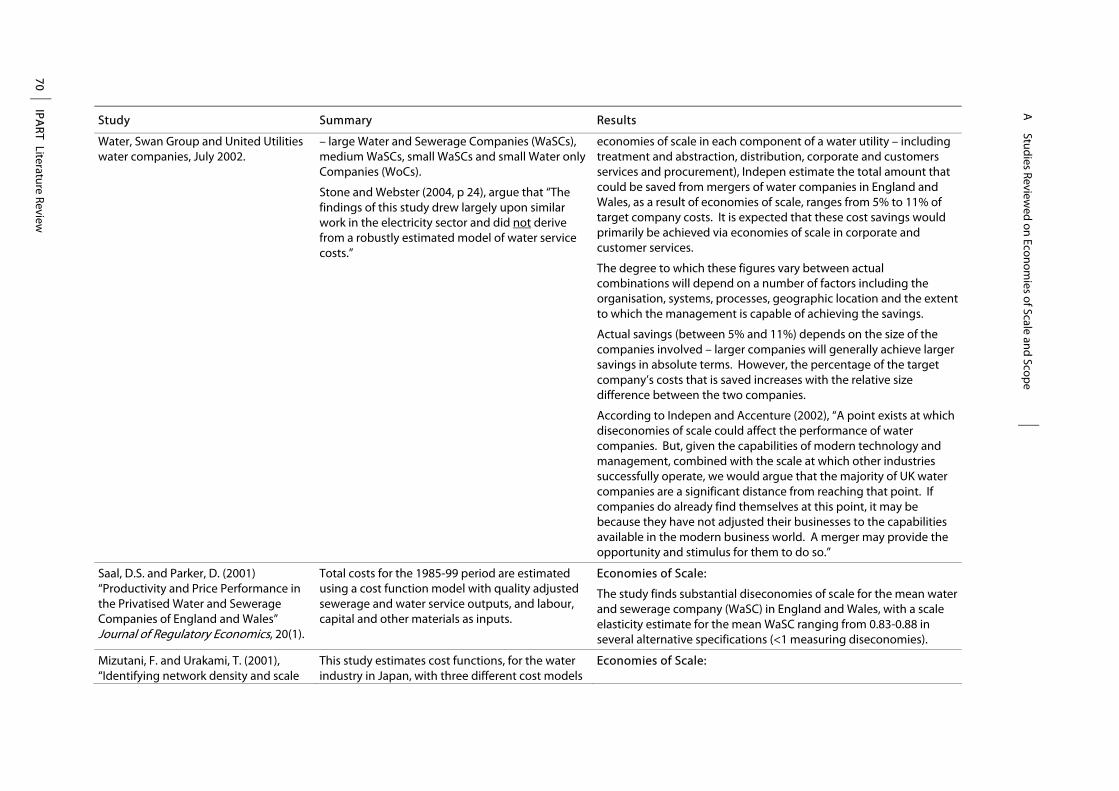
A Studies Review
ed on Economies of Scale and Scope
70IPA
RT Literature Review
Study Summary Results
Water, Swan Group and United Utilities water companies, July 2002.
– large Water and Sewerage Companies (WaSCs), medium WaSCs, small WaSCs and small Water only Companies (WoCs).
Stone and Webster (2004, p 24), argue that “The findings of this study drew largely upon similar work in the electricity sector and did not derive from a robustly estimated model of water service costs.”
economies of scale in each component of a water utility – including treatment and abstraction, distribution, corporate and customers services and procurement), Indepen estimate the total amount that could be saved from mergers of water companies in England and Wales, as a result of economies of scale, ranges from 5% to 11% of target company costs. It is expected that these cost savings would primarily be achieved via economies of scale in corporate and customer services.
The degree to which these figures vary between actual combinations will depend on a number of factors including the organisation, systems, processes, geographic location and the extent to which the management is capable of achieving the savings.
Actual savings (between 5% and 11%) depends on the size of the companies involved – larger companies will generally achieve larger savings in absolute terms. However, the percentage of the target company’s costs that is saved increases with the relative size difference between the two companies.
According to Indepen and Accenture (2002), “A point exists at which diseconomies of scale could affect the performance of water companies. But, given the capabilities of modern technology and management, combined with the scale at which other industries successfully operate, we would argue that the majority of UK water companies are a significant distance from reaching that point. If companies do already find themselves at this point, it may be because they have not adjusted their businesses to the capabilities available in the modern business world. A merger may provide the opportunity and stimulus for them to do so.”
Saal, D.S. and Parker, D. (2001) “Productivity and Price Performance in the Privatised Water and Sewerage Companies of England and Wales” Journal of Regulatory Economics, 20(1).
Total costs for the 1985-99 period are estimated using a cost function model with quality adjusted sewerage and water service outputs, and labour, capital and other materials as inputs.
Economies of Scale:
The study finds substantial diseconomies of scale for the mean water and sewerage company (WaSC) in England and Wales, with a scale elasticity estimate for the mean WaSC ranging from 0.83-0.88 in several alternative specifications (<1 measuring diseconomies).
Mizutani, F. and Urakami, T. (2001), “Identifying network density and scale
This study estimates cost functions, for the water industry in Japan, with three different cost models
Economies of Scale:

71 Literature Review
IPART
A Studies Review
ed on Economies of Scale and Scope
Study Summary Results
economies for Japanese water supply organizations”, Papers in Regional Science, 80.
(log-linear, translog and translog with a hedonic function).
There are diseconomies of scale at the sample mean.
The optimal size (which is the size that attains minimum average cost) of a water supply agency is a size of 261,084 thousands m3 and a network length of 1,221 km.
For this output and network size, the optimal size of a water-supplied population is about 766,000.
Saal, D.S. and Parker, D. (2000) “The impact of Privatization and Regulation on the Water and Sewerage Industry in England and Wales: A Translog Cost Function Model” Managerial and Decision Economics, 21(6).
This study analysed the extent of scale and scope economies in the UK water and sewerage industry, as well as the impact of privatisation and economic regulation on economic efficiency.
A translog multiple output cost function is estimated for the period 1985 to 1999 to assess the performance of the 10 WaSCs.
Economies of Scale:
There is evidence that the mean WaSC is characterised by diseconomies of scale.
Economies of Scope:
There was a rejection of the hypothesis that economies of scope between water and sewerage functions exist.
There may be ‘quality-driven scope economies’ whereby an improvement in the quality of one output may reduce the cost of producing another. These results were presented in the context of increases in post-privatisation costs to improve drinking water and sewerage treatment quality that may have been offset by a reduction in other costs.
Fabbri, P. and Fraquelli, G. (2000) “Cost and Structure of Technology in the Italian Water Industry” Empirica, 27.
A study of 173 public Italian water firms in 1991 to analyse economies of scale and identify the best functional form. This is in the context of the consolidation of the fragmented Italian water industry. The translog functional form is the preferred model and the study highlights the importance of controlling for hedonic influences on firm costs.
Economies of Scale:
Evidence of constant returns to scale at the sample mean output (ie, at an output level of approximately 19 million cubic metres serving a population of approximately 160,000).
Evidence of economies of scale at lower levels of supply and diseconomies of scale at higher levels of supply.
Kim, E. and Lee, H. (1998) “Spatial Integration of Urban Water Services and Economies of Scale” Review of Urban and Regional Development Studies, 10(1).
(Sourced from Stone & Webster, 2004)
A study of economies of scale in water supply in Korea using data from 1989 – 1995 for 42 municipal water supply companies. A translog cost function and input share equations are estimated.
Economies of Scale:
Evidence of economies of scale given the average size of the enterprises in the relevant study period.
However, decomposing the results found evidence of diseconomies of scale in four cities, constant returns to scale in twelve cities and economies of scale in twelve cities.

A Studies Review
ed on Economies of Scale and Scope
72IPA
RT Literature Review
Study Summary Results
World Bank Group (1997) “Toolkits for private participation in water and sanitation”, see http://www.worldbank.org/html/fpd/water/wstoolkits/Kit1/frame.html.
No study undertaken. Economies of Scale:
This source merely states that “U.K. experience suggests that a service area of less than about 500,000 customers leads to suboptimal operation.”
Hunt, L.C. and Lynk, E.L. (1995) “Privatisation and Economic Efficiency in the UK Water Industry” Oxford Bulletin of Economics and Statistics, 57(3).
(Sourced from Stone and Webster, 2004 and Saal and Parker, 2000)
A study of regional water authorities in the UK prior to privatisation using a multi-product cost function.
Economies of Scope:
Evidence of economies of scope between the provision of water or sewerage (trade waste) and environmental services (transferred to the National Rivers Authority, subsequently the Environment Agency at privatisation). (Sourced from Stone and Webster, 2004)
Evidence of economies of scope between water and sewerage services. (Sourced from Saal and Parker, 2000)
Bhattacharyya, A., Parker, E. and Raffiee, K. (1994) “An Examination of the Effect of Ownership on the Relative Efficiency of Public and Private Water Utilities” Land Economics, 70(2).
A study of 257 water companies in the USA (of which 32 were private) in 1992 on the relative efficiency of public versus private firms using a stochastic cost function.
Economies of Scale:
Evidence of significant economies of scale for both public and private water companies.
Lynk, E.L. (1993) “Privatisation, Joint Production and the Comparative Efficiencies of Private and Public Ownership: The UK Water Industry Case” Fiscal Studies, 14(2).
Analysis of the efficiency of WaSCs and WoCs using (pre-privatisation) data from 1980 to 1988 using stochastic frontier analysis.
Economies of Scope:
Evidence of significant cost complementarities (or benefits of joint production) between: (1) water supply activities and sewerage (trade effluent) activities; and (2) water supply activities and environmental activities.
Kim, H.Y. and Clark, R.M. (1988) “Economies of Scale and Scope in Water Supply” Regional Science and Urban Economics, 18.
A translog cost function is estimated using data from a cross-section of 60 water utilities in the United States for 1973 in order to estimate economies of scale and scope.
Economies of Scale:
There is evidence of constant returns to scale for the average firm producing water for both residential and non-residential customers.
There is evidence of diseconomies of scale in supplying water to residential customers.
There is evidence of economies of scale in supplying water to non-residential customers.
Economies of Scope:
There is evidence of economies of scope (for the average utility

73 Literature Review
IPART
A Studies Review
ed on Economies of Scale and Scope
Study Summary Results
facing the sample mean of the variables) associated with the joint production of the two services (ie, the supply of water to residential and non-residential customers).
Hayes, K. (1987) “Cost Structure of the water utility industry” Applied Economics, 19.
An analysis of vertical integration between retail and wholesale water suppliers in the United States, using data on 475 water utilities in 1960, 1970 and 1976. A generalized quadratic cost function was used to estimate economies of scope.
Economies of Scope:
Evidence of economies of scope (from the joint production of wholesale and retail water) in the entire 1960 sample and over a broad range of outputs in the 1970 and 1976 sample.
Economies of scope are not observed for the largest joint output cases in 1970 and 1976.
The results also show that the degree of economies of scope tend to fall over time for the largest firms and increase for the smaller firms.
The study concludes that there is evidence of economies of scope when joint output is relatively low and diseconomies of scope when joint output is high.
Sydney Water, Sydney Water Submission to the Independent Pricing and Regulatory Tribunal Review of Metropolitan Water Agency Prices, November 2004, Appendix A, pp 6-11.
Sydney Water refers to a study that it commissioned from the Centre for Efficiency and Productivity Analysis (CEPA), completed in 2002.
Economies of Scale:
There is evidence that Sydney Water is operating above optimal scale in relation to (1) water supply; (2) wastewater supply; and (3) water and wastewater combined.

74 IPART Literature Review