lithium ion battery value chain and related opportunities
TRANSCRIPT

Lithium ion battery value chain and related opportunities for Europe
Natalia Lebedeva
Franco Di Persio
Lois Boon-Brett
This publication is a Science for Policy report by the Joint Research Centre (JRC) the European Commissionrsquos
science and knowledge service It aims to provide evidence-based scientific support to the European
policymaking process The scientific output expressed does not imply a policy position of the European
Commission Neither the European Commission nor any person acting on behalf of the Commission is
responsible for the use that might be made of this publication
JRC Science Hub
httpseceuropaeujrc
JRC105010
copy European Union 2016
The reuse of the document is authorised provided the source is acknowledged and the original meaning or
message of the texts are not distorted The European Commission shall not be held liable for any consequences
stemming from the reuse
How to cite this report Lebedeva N Di Persio F Boon-Brett L Lithium ion battery value chain and related
opportunities for Europe European Commission Petten 2016
All images copy European Union 2016 unless otherwise specified
Title Lithium ion battery value chain and related opportunities for Europe
Abstract
Outline of automotive Li-ion battery value chain identifying current market volumes leaders and status of the
EU industry The EU industry is far from being self-sufficient in all segments of the value chain RampI investment
are essential to respond to new opportunities presented by the EV market
Printed in The Netherlands
i
Contents
Acknowledgements 1
1 Introduction 2
2 Automotive lithium-ion battery value chain 5
3 Value chain segments ndash status recent developments and opportunities 7
31 Raw and processed material 7
311 Cobalt 9
312 Natural graphite 9
313 Silicon metal 10
314 Lithium 10
32 Cell components manufacturing 12
321 Cathode materials 12
322 Anode materials 15
323 Electrolytes 17
324 Separators 19
325 Future cell chemistries 21
33 Cell manufacturing 26
331 Cell manufacturing ndash current status 26
332 Projected market growth 34
333 Global cell production over-capacity 35
34 Battery pack manufacturing 39
35 Electric vehicles manufacturing 45
351 Production volumes and deployment 45
352 OEMs Tier 1 and Tier 2 supply chain 52
36 Recycling 55
4 Conclusions 62
5 References 65
List of abbreviations and definitions 72
List of figures 73
List of tables 75
1
Acknowledgements
Authors gratefully acknowledge helpful discussions with C Pillot (Avicenne Energy)
M Krausa (Kompetenznetzwerk Lithium-Ionen Batterien eV (KLiB)) D Chung (National
Renewable Energy Laboratory) V Ries (DK Recycling and Roheisen) AD Devaney
(Albemarle Lithium) T Buhrmester (Rockwood Lithium GmbH an Albemarle Company)
D Klanecky (Albemarle Corporation)
Authors
Natalia Lebedeva
Franco Di Persio
Lois Boon-Brett
2
1 Introduction
Europe is on the cusp of an energy transformation - a transformation reducing energy
demand improving energy use efficiency and moving away from a high reliance on fossil
fuels to an increased use of renewable energy sources for power and heat production
and for transportation The economic impacts of the energy transformation are
important to consider as it should not hinder growth of the European economy - on the
contrary Europes ambition is to exploit its energy transformation as an opportunity for
high value job creation and increased economic output in addition to creating a more
secure and resilient energy system with an ambitious climate policy
Against this backdrop Europe has adopted the Energy Union Framework Strategy (COM
(2015) 80 final) as part of its commitment to bring about the transition to a low-carbon
secure and competitive economy The Energy Union Strategy is structured around five
closely interrelated and mutually reinforcing dimensions addressing (i) energy supply
security (ii) a fully-integrated energy market (iii) energy efficiency (iv) decarbonising
the economy and (v) research innovation and competitiveness
In September 2015 the Commission published a Communication on an Integrated
Strategic Energy Technologies Plan (SET-Plan) [1] This Communication defines a new
European RampI Strategy for the coming years and as such is the first deliverable on which
the fifth (v) dimension of the Energy Union will be built It provides the overall
framework for promoting strengthened cooperation in RampI between the European
Commission Member States and stakeholders such as research institutes universities
and industry (eg car manufacturers chemical industry mining industry battery
manufacturers collectors and recycling industry) in order to step up the efforts to bring
new and more efficient low-carbon technologies faster to the market and to deliver the
energy transition in a cost-competitive way Based on an integrated approach going
beyond technology silos the Integrated SET-Plan identifies 10 RampI Key Actions to
accelerate Europes energy system transformation The Integrated SET-Plan is
supported by the EU Industrial policy (COM(2014) 14 final) which aims to stimulate
growth and foster competitiveness in the manufacturing sector and the EU economy as a
whole by encouraging innovation through the support of actions related to innovation
and research
Key Action 7 of the Integrated SET-Plan (Become competitive in the global battery sector
to drive e-mobility forward) is one of two Key Actions dedicated to the pursuit of more
sustainable efficient low-emission transport systems explicitly identified in the fifth
dimension of the Energy Union Strategic RampI targets and priorities up to 2030 have
been set in Key Action 7 to strengthen European competences and capacities to become
competitive in the global battery sector
3
Similar as in other Key Actions these targets have been agreed in consultations between
the European Commission and European experts from industry academia and Member
States The targets are enshrined in a so-called Declaration of Intent [2] Targets set
in Key Action 7 aim at fostering research and innovation in the European battery sector
to make EU industry more competitive Unlike the other Key Actions which cover
exclusively research and innovation aspects Action 7 explicitly considers
competitiveness with respect to scaled-up manufacturing of higher performance
batteries Accordingly targets set in Action 7 cover not only battery technology
performance and cost parameters they also cover battery manufacturing and recycling
Ratified by the national representatives from the SET-Plan countries and the
Commission these targets help define the expected actions deliverables and time
frames for a co-ordinated RampIampC agenda in the European battery sector
Related to the competitiveness aspect of Key Action 7 a number of questions arise when
considering ways for Europe to co-ordinate its RampI efforts and where to invest available
research resources For example is it reasonable to assume that Europe could be
competitive in all segments of the battery value chain or should European RampIampC
investments focus on certain segments only Which segment could offer the best return
on investment in terms of the overall return to the European economy
Answering such strategic questions demands judicious consideration of the current
status and market outlook for electric vehicle batteries but also for batteries used in
other applications as well as of the position and competitive edge enjoyed by the
various global economies active in this sector The European Commissions Joint
Research Centre (JRC) has prepared the current report for this purpose This report
outlines the Li-ion battery value chain and indicates for each segment current market
volumes and leaders as well as the status of the EU industry This report does not
provide an exhaustive economic assessment with a detailed entry barrier analysis (eg
evaluation of market centralization rate capital requirements human resources
consumer purchase behaviour) for the return of the investments in terms of productivity
and global competitiveness Nevertheless the information can be used to help underpin
decisions regarding where RampI investments having the biggest impact in terms of
boosting European competitiveness can be made In this context the global dimension
of the battery sector should be considered bearing in mind the competition from the US
and Asia delocalization of manufacturing capacity and potential dispersion of the
knowledge base which has the tendency to move where production sites are located [3]
The scope of this report largely matches that of the Key Action 7 Declaration of Intent
which considers lithium ion and post lithium ion chemistries the most promising and
relevant chemistries for electrochemical energy storage in the time frame up to 2030
4
Contrary to the Declaration of Intent this report considers only automotive traction
battery applications for which relevant data on the current market situation position of
the main global players and future market outlook has been sourced Doing so does not
preclude the need or importance of battery RampI to advance the European position in
other applications such as for stationary energy storage where European
competitiveness can be further improved and enhanced Indeed development of
affordable and integrated energy storage solutions to accelerate full integration of
storage devices (including electrochemical) into a low-carbon energy system is explicitly
mentioned in addition to electro-mobility in the Accelerating Clean Energy Innovation
Communication (COM(2016) 763) As such it is one of the priority areas where future
EU funding under Horizon 2020 will be focused Notwithstanding this competitiveness
of the European battery sector for applications other than e-mobility is beyond the scope
of this report
5
2 Automotive lithium-ion battery value chain
Figure 1 illustrates the value chain for automotive Li-ion batteries The value chain is
divided into 6 segments spanning the spectrum from raw material mining to battery
recycling Mining and chemical industries provide the myriad of raw and processed
materials used in the production of the various cell components including the anode
cathode electrolyte and separator These components are then assembled in individual
cells Some materials are produced and used exclusively in Li-ion cell production while
others can be used for other purposes While the majority of the produced Li-ion cells
are assembled for use in portable electronic devices a fast growing share is destined for
use in battery packs for electric vehicles When batteries reach the end of life in their
first application they can be recycled or alternatively employed in a second use
application (eg for stationary energy storage)
In the following section each battery value chain segment is discussed highlighting key
figures and relevant industry revenues Revenues provided for cell component cell and
pack manufacturing refer to the global Li-ion battery industry whereas for other value
chain segments the relevant EU industry revenue is provided While revenues specific to
the Li-ion traction battery industry are still marginal its Compound Annual Growth Rate
(CAGR) for the upcoming years is quite significant
Where possible key global and European players have been identified for each segment
It is worth noting that activities of some companies cover different segments of the
value chain For instance some cell manufacturers also manufacture cell components
especially for the cathode while other players active in the recycling sector are also
active in the materials processing segment Furthermore the US electric vehicle
manufacturer Tesla demonstrates an approach to also lay claim on the manufacturing of
cells and battery packs
The data presented for all segments was at the time of publication of this report the
most up-to-date representative data retrievable by the authors However the extremely
dynamic nature of the market being considered is such that the absolute and relative
magnitude of the data reported is changing rapidly
In this report the term Automotive batteries refers to batteries on-board a vehicle used for traction and is used as a synonym of industrial batteries as defined in the Battery Directive 200666EU
6
Mo
st
Rele
van
t S
tati
sti
cs
51 43 88 40 31 50
Democratic Republic of
Congos share of global
cobalt production [4] -
a critical material for Li-
ion technology
Cathode revenue
as share of cell
components
market [5]
Asian share of Li-ion
cell manufacturing
market [6]
Share of pack
assembly cost over
the total battery pack
cost [7]
Automotive share of
Li-ion cell market in
volume (MWh) [8]
Recycling efficiency
for Li-ion batteries set
in the Battery
Directive [9]
Reven
ues
EU Mining and
quarrying industry
revenues B$ 19 [1]
EU Chemical industry
Revenues B$ 28 [1]
Global Li-ion cell
components
Industry revenues
B$ 7 [5]
Global Li-ion cell
manufacturing
revenues B$ 167
[5]
Global automotive
battery pack
manufacturing
revenues B$ 22 [5]
EU Automotive
industry
Revenues B$ 900
[10] 20 of
worldwide [11]
EU Waste collection amp
Recycling Industry
Revenues B$ 150
[10]
75 of worldwide
[12]
Figure 1 Automotive lithium-ion battery value chain (data from 2015)
Raw and processed materials
Cell component
manufacturing
Cell manufacturing
Battery pack manufacturing
Electric vehicle manufacturing
Recycling
7
3 Value chain segments ndash status recent developments and
opportunities
31 Raw and processed material
A wide range of elements is used in Li-ion battery cells including lithium (Li) nickel (Ni)
cobalt (Co) manganese (Mn) aluminium (Al) copper (Cu) silicon (Si) tin (Sn)
titanium (Ti) and carbon (C) in a variety of forms eg natural graphite These elements
are harvested from raw materials mined from the earths crust or recovered from surface
water
Some of these materials have a high economic importance while at the same time have
a high supply-risk and as such are termed critical raw materials (CRMs) [4] [13] [14]
The European Commission publishes a list of CRMs which is reviewed and updated every
three years As explained in the EC Communication [4] The purpose of the list is to
contribute to the implementation of the EU industrial policy and to ensure that European
industrial competitiveness is strengthened through actions in other policy areas This
should increase the overall competitiveness of the EU economy in line with the
Commissionacutes aspiration of raising industryrsquos contribution to GDP to as much as 20 by
2020 It should also help to incentivise the European production of critical raw materials
and facilitate the launching of new mining activities The list is also being used to help
prioritise needs and actions For example it serves as a supporting element when
negotiating trade agreements challenging trade distortion measures or promoting
research and innovation [4] A new CRM list is expected to be published in 2017
Among the materials used in Li-ion cells three are listed as CRMs namely cobalt
natural graphite and silicon (metal) [4] Uses current supply and forecasted availability
of each of these materials are reported in this section Similar information is also
reported for lithium even though it is not considered a CRM However for obvious
reasons availability and supply of lithium has a high impact on the Li-ion battery
industry Table 1 lists the main producers main European import sources the
substitutability indexdagger and the end of life recycling input rateDagger for each CRM and for
lithium
dagger lsquoSubstitutability indexrsquo is a measure of the difficulty in substituting the material scored and weighted across all applications Values are between 0 and 1 with 1 being the least substitutable Dagger lsquoEnd-of-life recycling input ratersquo measures the proportion of metal and metal products that are produced from end-of-life scrap and other metal-bearing low grade residues in end-of-life scrap worldwide
8
Table 1 Main producers main source of import into EU substitutability index and recycling rate
of cobalt natural graphite silicon metal and lithium [4 15-18]
Raw material Main
producers
(2014-2015)
Main sources
of imports
into the EU
(mainly 2012)
Substitutability
index
End-of-life
recycling
input rate
Critical raw materials used in Li-ion batteries
Cobalt Democratic
Republic of
Congo 51
China 6
Russia 5
Canada 5
Australia 5
Russia 96
(cobalt ores
and
concentrates)
USA 3
(cobalt ores
and
concentrates)
071 16
Natural
graphite
China 66
India 14
Brazil 7
China 57
Brazil 15
Norway 9
072 0
Silicon metal China 68
Russia 8
USA 5
Norway 4
Norway 38
Brazil 24
China 8
Russia 7
081 0
Non-critical raw material used in Li-ion batteries
Lithium Australia 41
Chile 36
Argentina 12
China 7
na na
9
311 Cobalt
Cobalt is used for a number of industrial applications such as in batteries superalloys
hard materials ndash carbides diamond tooling pigments catalysts magnets etc [14] Use
in batteries has the biggest share among these applications equivalent to around 37
[4] In Li-ion batteries cobalt is a component in several widely used cathode active
materials
Identified world terrestrial cobalt resources are about 25 million tons (for definitions of
resources and reserves please see [19]) More than 120 million tons of cobalt resources
have been identified in manganese nodules and crusts on the floor of the Atlantic
Indian and Pacific Oceans [15] At the beginning of 2016 world reserves were estimated
to be 71 million tons and total world production of cobalt in 2015 amounted to 0124
million tons [15] Just as in previous years production of cobalt in 2014-2015 was highly
concentrated Democratic Republic of Congo (DRC) continued to be the worlds leading
source of mined cobalt supplying 51 of the cobalt market volume (see Table 1) [15]
with China Russia Canada and Australia each having a much lower share (see Table 1)
[15] In addition to the high concentration of cobalt production there are further
concerns regarding the social aspects of cobalt mining in the DRC such as forced and
child labour and unsafe working conditions [20]
The vast majority of cobalt import into the EU comes from Russia (96 ) Cobalt has a
low substitutability (substitutability index for all applications is 071 and for batteries it is
08) and a reasonably low end-of-life recycling input rate for all applications of 16 [4]
The forecasted market balance for cobalt covering all applications until 2020 indicates a
small surplus while the market is forecasted to be balanced in 2020 (ie supply
matching demand within 1 ) [13] Longer term projections for penetration of electric
vehicles up to 2050 show that the cumulative demand for cobalt would require all the
resources known today even considering its relatively high recycling rate in the battery
sector However this estimation is based on the assumption that NMC technology
continues to be widely used up to 2050 [21] which is unlikely as gradual introduction of
other cobalt-free chemistries is expected in this time frame (see Future cell chemistries
section)
312 Natural graphite
Natural graphite is used in a number of industrial applications electrodes refractories
lubricants foundries and in batteries as anode active material [13] Application in
batteries has a relatively low share of 4 [13]
Worlds inferred resources exceed 800 million tons of recoverable graphite reserves of
natural graphite are estimated to be 230000 tons and world mine production in 2015
10
amounted to ca 1200 tons [16] Production of natural graphite is highly concentrated
with China producing 66 India 14 and Brazil 7 of the natural graphite market
volume (see Table 1) [16] The majority of natural graphite import into the EU comes
from China (57 ) followed by Brazil (15 ) and Norway (9 ) In some applications
natural graphite has a (very) low substitutability (substitutability index for all
applications is 072) but in batteries substitution of natural graphite by other materials
is feasible (substitutability index is 03) [13] The end-of-life recycling input rate of
natural graphite is 0
It is forecasted that the natural graphite market in 2020 will experience a large surplus
of production (ie supply exceeding demand by more than 10 ) [13]
313 Silicon metal
Silicon metal is widely used in the chemical pigments metallurgy and electronics
industries [13] Silicon metal and silicon alloys are also emerging as anode active
materials for Li-ion battery cells but at present their share is negligible compared to
other applications
World resources for making silicon metal and alloys are abundant and adequate to
supply world requirements for many decades The source of silicon is silica in various
natural forms such as quartzite The reserves in most major producing countries are
also ample in relation to demand but no quantitative estimates are available [17]
Worlds production of silicon metal in 2015 amounted to 8100 tons and was highly
concentrated with China producing 68 Russia 8 USA 5 and Norway 4 of the
silicon metal market volume (see Table 1) [17] The majority of silicon metal imported
into the EU comes from Norway (38 ) followed by Brazil (24 ) China (8 ) and
Russia (7 ) Silicon metal has a (very) low substitutability having a substitutability
index of 081 for all applications [13] The end-of-life recycling input rate of silicon metal
is 0 [13]
It is forecasted that the silicon metal market in 2020 will be balanced (ie supply
matching demand within 1 ) [13]
314 Lithium
Although lithium is not classified as a critical raw material it is an important element in
lithium-ion battery technologies Lithium has a relatively high average abundance in the
earthrsquos crust of 17 ppm [22] making it the 27th most abundant element in the
lithosphere For various reasons outlined in [22] exact data on global resources
reserves and production of lithium is not available figures cited below are best estimates
available A comprehensive overview of lithium resources reserves production volume
and producers is given in [22] Global resources and reserves are estimated to be 395-
11
452 million tons and 122-14 million tons Li metal equivalentsect (LME) respectively [18
21 22] Geographical distribution of resources and reserves is shown in Figure 2
Figure 2 Geographical distribution of Li resources and reserves Source [22]
Major Li resources and reserves - nearly 25 million tons Li metal equivalent (LME) and
85 million tons LME respectively - are identified in South America notably in Argentina
Chile Bolivia and Brazil where 55 of the global resources and 69 of the global
reserves are located [22] China possesses the biggest part of Li resources and reserves
found in Asia (ca 53 million tons LME and 21 million tons LME respectively)
corresponding to around 12 of the global resources and nearly 17 of the global
reserves [22] EUs share of the global Li resources and reserves is limited ndash slightly less
than 04 million tons LME and 0013 million tons LME respectively [22] However
unique deposits of jadarite ndash lithium boron silicate ndash were discovered in 2004 in Serbia
So far only one such deposit is known its resource is 15 million tons LME which
corresponds to ca 2 of the global resources [22] Significant Li resources and reserves
are identified in North America ndash nearly 6 million tons LME and 08 million tons LME
respectively More than half of these is located in the USA corresponding to nearly 8
of the global resources and 5 of the global reserves [22]
Global supply of lithium has been historically dominated by hard-rock mineral sources
however development of large-scale lithium brine operations in South America
commenced in the early 1980rsquos The actual global supply market for lithium products is
sect Lithium is found in nature in a number of mineral forms and compounds with different Li metal content To
account for this numbers for Li resources and reserves are given in literature recalculated to Li metal equivalent ie amount of Li contained in ores brines etc
55
12
around 200000 tons of lithium carbonate equivalent (LCE) (1 kg LCE = 01895 kg Li)
with almost 83 of it being sourced from four major producers Albemarle (USA) SQM
(Chile) FMC (USA) and Sichuan Tianqi (China) with main fields located in Chile
Australia Argentina and China (see Table 1) [23]
In 2015 Li-ion batteries consumed around 40 of the global LCE production of which
14 was used for electric vehicle battery packs Projection for 2025 shows that electrical
vehicle demand alone will utilise 200000 tons of LCE which equates to the total current
global LCE supply [23]
Therefore the known lithium reserves are sufficient to cope with this foreseen increase in
demand even without recovery of lithium from the recycling of Li-ion batteries Today
the recovery of lithium from batteries is technically feasible but is still not economically
viable However foreseen long term lithium price development or new practices may
make lithium recovery more viable in the future [21]
32 Cell components manufacturing
321 Cathode materials
Aluminium foil is used as a current collector for cathodes in Li-ion cells Market leaders in
aluminium foil production for battery applications are Sumitomo Light Metal Industries
(JP) and Nippon Foil Mfg (JP) [24]
Complex transition metal oxides and phosphates are currently the main cathode active
materials used in Li-ion battery cells These include Lithium Cobalt Oxide (LCO) Lithium
Nickel Manganese Cobalt Oxide (NMC) Lithium Nickel Cobalt Aluminium Oxide (NCA)
Lithium Manganese Oxide (LMO) and Lithium Iron Phosphate (LFP) With the exception
of LCO all these materials are currently used in automotive Li-ion battery cells
[25][26] The total market demand for cathode materials for all applications of Li-ion
batteries was approximately 140000 tons in 2015 revenues generated were B$ 3 and
the market showed a sustained growth with compound annual growth rate (CAGR)
amounting to 16 between 2005 and 2015 [27] (see Figure 3) It is estimated that
approximately 25 of the total global demand of the cathode active materials or ca
5000 tons was used in Li-ion batteries for HEVs PHEVs and EVs
13
Figure 3 Left ndash Development of the cathode active materials market in 2000-2015 Right ndashdemand division per material type and regional distribution of the manufacturers (according to the location of the headquarters) in 2015 (Used with permission from Avicenne Energy [5])
Production of cathode active materials is dominated by Asia with China manufacturing
ca 39 (by weight) of the total amount of cathode materials in 2015 Japan ndash ca 19
and South Korea ndash ca 7 (see Figure 3)
Suppliers from the EU ndash Umicore (BE) and Johnson Matthey (UK) ndash together produced
ca 13 (by weight) of the total amount of cathode materials or ca 17700 tons in
2015 Umicore produced ca 5550 tons of LCO (note however that LCO is less relevant
for automotive applications) and ca 9600 tons of NMC and Johnson Matthey (UK)
produced ca 2560 tons of LFP
The cathode materials market remains very dynamic and is currently seeing de-
concentration with more and more companies entering the market and providing a
share of the global supply For example in 2011 61 of the global market for cathode
materials was shared by only three (3) dominating suppliers namely Umicore (BE) with
32 Nichia (JP) with 24 and Toda Kogyo (JP) with 5 [24] In 2014 six (6) main
suppliers together had a market share of ca 45 with Umicore (BE) having 11
Reshine (CN) 8 LampF (KR) 8 ShanShanTech (CN) 7 Nichia (JP) 7 and Sumitomo
Umicore is considered an EU-based company in this report despite the fact that the actual production of the cathode active materials takes place at the Umicores facility in South Korea
14
(JP) 5 [27] In just one year each of these main producers further increased their
production volume and together they held a 52 share of the total market in 2015 [5]
Companies such as BASF (DE) Dow (US) 3M (US) DuPont (US) Mitsubishi (JP) and LG
Chem (KR) have recently shown interest in this market but do not play a significant role
in the global supply of the cathode active materials yet [27]
Based on a number of assumptions [5] the market for cathode active materials is
expected to grow from ca 140000 tons in 2015 to ca 400000 tons in 2025 with the
relative fraction per material changing as shown in Figure 4 The highest growth rate is
expected for NMC (almost 5 times) NCA (ca 3 times) and LMO (24 times) and EU
suppliers have the opportunity to increase their supply of NMC Production of NCA
material currently dominated by Japan may also present an opportunity for
existingnew EU manufacturers
2015 2025 Expected
growth
ktons ktons times
LCO 26 37 16 64 17
NMC 29 40 48 192 48
LFP 23 32 16 64 20
LMO 12 17 10 40 24
NCA 10 14 10 40 29
Total 100 140 100 400 29
Figure 4 Expected market volume per material type in 2025 (left) and as compared to 2015 (right) (Used with permission from Avicenne Energy) [5]
However the potential of technical breakthrough that leads to use of different cathode
materialschemistry intensive competition and government policy interference will
continue to affect global cathode manufacturing sector [23]
The quality of the cathode material impacts the overall performance of the cell Quality
control starts in the raw material production stage and this is particularly true for
cathode manufacturing For this reason many of the major battery cell manufacturers
such as Panasonic (JP) LG Chem (KR) BYD (CN) have chosen to develop their own in-
house cathode materials production capacity [23]
15
322 Anode materials
Copper foil is used as a current collector for anodes in Li-ion cells Market leaders in
copper foil production for battery applications are Furukawa Electric (JP) Nippon Foil
Mfg (JP) and Nippon Denkai (JP) [24]
Various carbonaceous materials such as natural and artificial graphite meso-phase and
amorphous carbon and more recently tin and silicon oxides and alloys as well as Lithium
Titanium Oxide (LTO) are used as anode active materials [5 27]
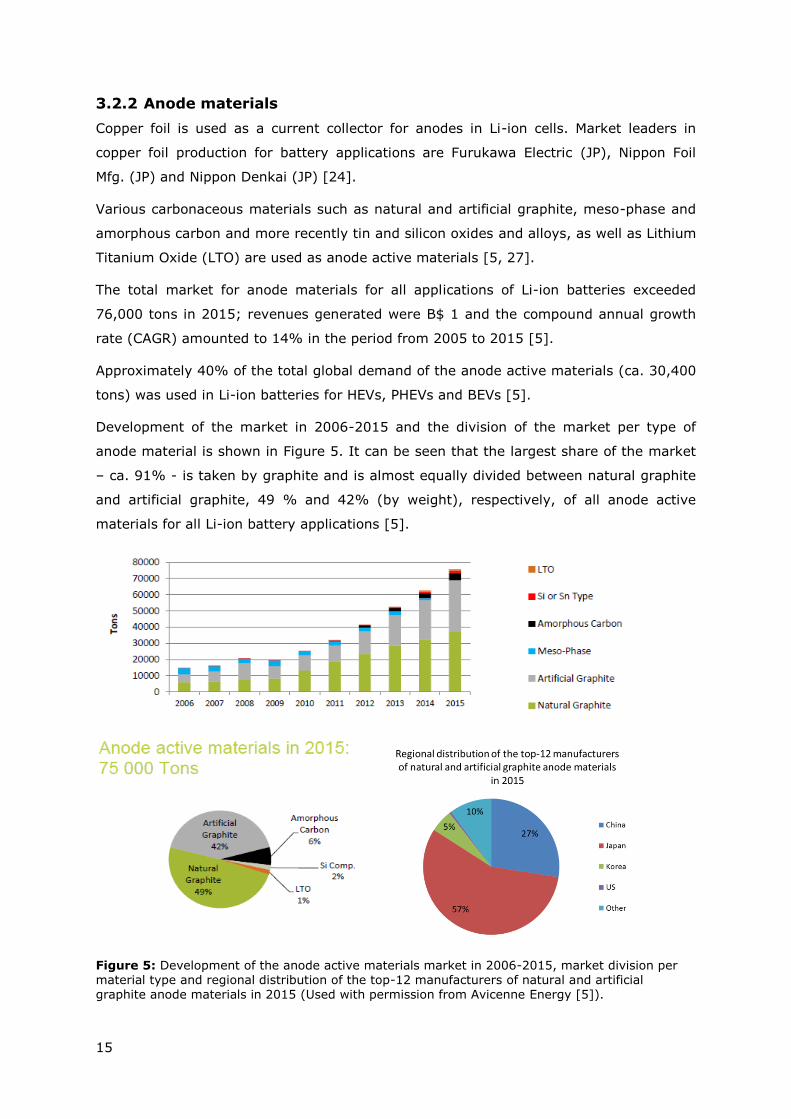
The total market for anode materials for all applications of Li-ion batteries exceeded
76000 tons in 2015 revenues generated were B$ 1 and the compound annual growth
rate (CAGR) amounted to 14 in the period from 2005 to 2015 [5]
Approximately 40 of the total global demand of the anode active materials (ca 30400
tons) was used in Li-ion batteries for HEVs PHEVs and BEVs [5]
Development of the market in 2006-2015 and the division of the market per type of
anode material is shown in Figure 5 It can be seen that the largest share of the market
ndash ca 91 - is taken by graphite and is almost equally divided between natural graphite
and artificial graphite 49 and 42 (by weight) respectively of all anode active
materials for all Li-ion battery applications [5]
Figure 5 Development of the anode active materials market in 2006-2015 market division per material type and regional distribution of the top-12 manufacturers of natural and artificial
graphite anode materials in 2015 (Used with permission from Avicenne Energy [5])
16
Historically the production of anode active materials has been dominated by Japan and
China (see Figure 5) [5 24 25] In 2011 three (3) producers together had a market
share of 65 with Hitachi Chemicals (JP) having a share of 34 Nippon Carbon (JP) ndash
19 and BTR Energy (CN) ndash 12 [24] [25] In 2015 these 3 companies remain the
leaders in the market of anode active materials supplying 61 of the market [5] Hitachi
Chemicals (JP) remains the largest producer (31 of the market) with BTR Energy (CN)
following in second place (19) and Nippon Carbon (JP) in third place (7) Other
producers of anode active materials include Mitsubishi Chemical (JP) LS Mtron Carbonics
(KR) ShanshanTech (CN) Tokai Carbon (JP) [5]
EU-based companies such as SGL (DE) Imerys (CH) and Heraeus (DE) as well as 3M
(US) DuPont (US) Dow (US) Dow Corning (US) Envia (US) ShinEtsu (JP) have
recently shown interest in the anode active materials market for Li-ion batteries but
currently do not play any significant role in the global supply
The market for anode active materials is expected to grow from 76000 to more than
250000 tons in 2025 The expected distribution of the market among various anode
active materials in 2025 is shown in Figure 6 The forecast is that the share of artificial
graphite will increase to 52 that of natural graphite decrease to 24 and the share of
other anode active materials will grow to 24 [5]
2015 2025 Expected
growth
ktons ktons times
Natural graphite
49 3675 24 60 16
Artificial
graphite
42 315 52 130 41
Amorphous carbon
6 45 10 25 56
LTO 1 075 8 20 267
Si compounds 2 15 6 15 10
Total 100 75 100 250
Figure 6 Forecast market division per anode active material type in 2025 (left) and as compared
to 2015 (right) (Used with permission from Avicenne Energy [5])
17
323 Electrolytes
The global market for electrolytes for all applications of Li-ion batteries was slightly
bigger than 62000 tons in 2015 revenues generated were B$ 09 and the compound
annual growth rate (CAGR) in 2005 to 2015 amounted to 20 [5]
The market for electrolytes for HEV PHEV and BEV batteries has experienced a rapid
growth in the period from 2010 to 2015 with electrolyte demand for these applications
increasing from ca 200 tons in 2010 to ca 20500 tons in 2015 (or ca 33 of the total
market volume for Li-ion batteries) [5 28]
Similar to cathode and anode active materials the production of electrolytes for Li-ion
batteries is dominated by the Asian suppliers with China currently producing close to
60 (by weight) of the total market Japan ndash 18 and Korea ndash 14 (see Figure 7)
Soulbrain - a producer with headquarters in the US and production facility in Korea ndash has
supplied 7 of the market in 2015 The EU-based electrolyte producer ndash BASF (DE) ndash
has supplied ca 200 tons of electrolyte or ca 04 of the total market volume in 2014
but decreased the supply significantly in 2015 [5 28]
Figure 7 Left ndash Development of the electrolyte market in 2000-2015 and right ndash Regional distribution of the electrolyte producers in 2015 (Used with permission from Avicenne Energy [5])
18
The competition in the market is very intense with Chinese companies expanding their
production volume quickly and others slowing their growth or even experiencing a
decline [5 28] One of the quickest growing Chinese electrolyte producers CapChem
has more than doubled its share on the market from ca 3500 tons in 2013 to 8600
tons in 2015 to become the global market leader with a 14 share of the total
electrolyte market Zhangjiagang Guotai-Huarong (GTHR) (CN) has also increased its
production from ca 3500 tons in 2011 to 8000 tons in 2015 becoming the second
biggest electrolyte supplier with a 13 share of the total electrolyte market in 2015
Conversely Korean (eg Panax-Etec) and mainly Japanese (eg Mitsui Chemicals and
Ube) electrolyte producers are currently experiencing a decrease of their market share
[5 27]
New entrants on the global market of electrolytes for Li-ion batteries are companies such
as LG Chem (KR) DuPont (US) and Daikin (JP) [5 28]
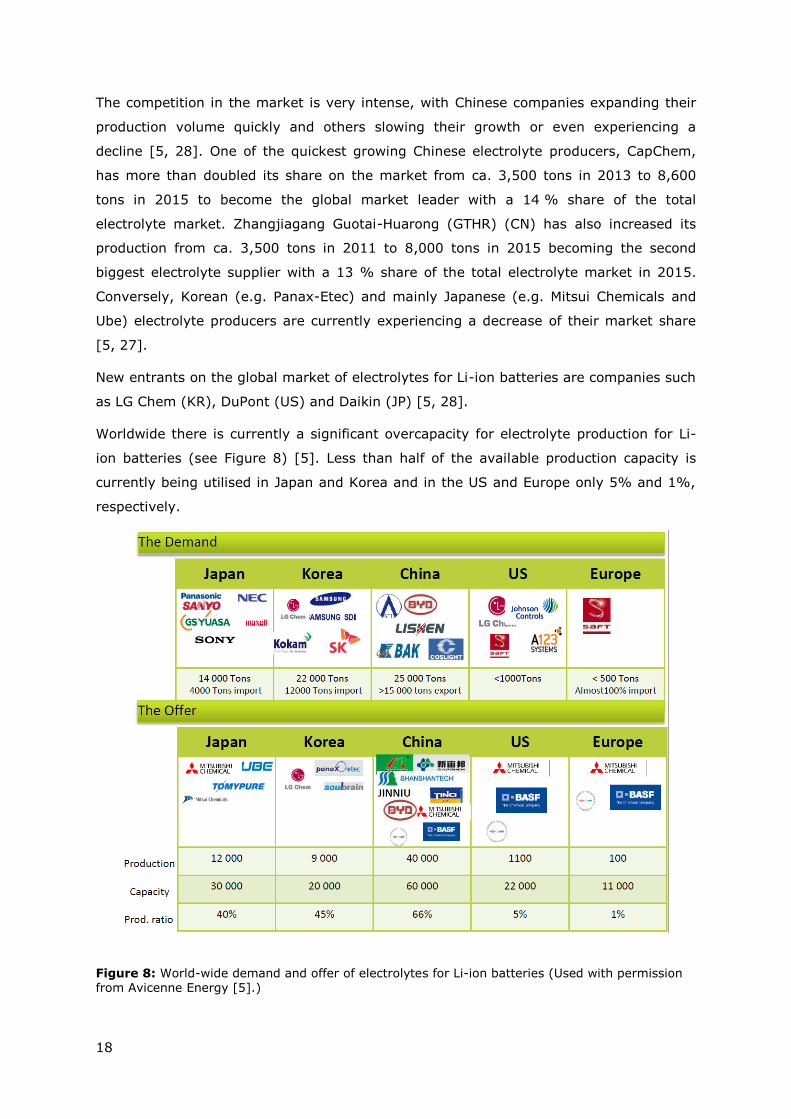
Worldwide there is currently a significant overcapacity for electrolyte production for Li-
ion batteries (see Figure 8) [5] Less than half of the available production capacity is
currently being utilised in Japan and Korea and in the US and Europe only 5 and 1
respectively
Figure 8 World-wide demand and offer of electrolytes for Li-ion batteries (Used with permission from Avicenne Energy [5])
19
Nevertheless there may be opportunities in formulation and production of new advanced
electrolytes eg for high-voltage Li-ion cells where advanced (likely fluorinated)
additives and solvents will be required [5] Given this dynamic market climate and taking
into account the expected market growth there may be business opportunities present
for EU-based producers
The market for electrolytes is expected to grow from the current 62000 tons to more
than 235000 tons in 2025 with the automotive share increasing from current ca 33
to ca 50 of the market see Figure 9 [5]
Figure 9 Electrolyte market forecast till 2025 (Used with permission from Avicenne Energy [5])
324 Separators
The total market for separators for all applications of Li-ion batteries was approximately
900 Mm2 in 2015 revenues generated were B$ 11 and the compound annual growth
rate (CAGR) amounted to 15 in the period between 2005 and 2015 [5] Approximately
30 of the global separator market volume or ca 300 Mm2 is supplied for production of
automotive Li-ion battery cells [5]
As for cathode and anode active materials and electrolytes the market of separators for
Li-ion batteries is dominated by Asia with Japans current market share of 48 (by
product surface area Mm2) of the total market supply China ndash 17 and Korea ndash 10
20
(see Figure 10) Market leaders are Asahi Kasei (JP) Toray (JP) and SK (KR) The
separator market position of the US is also strong with Celgard having a market share of
9 and Entek of 3 in 2015 [5]
Companies such as DuPont (US) Dow (US) LG Chem (KR) Teijin (JP) and Mitsubishi
(JP) have recently shown interest in the separator materials market for Li-ion batteries
but currently do not play any significant role in the global supply EU-based Evonik (DE)
is among the new entrants on the market of separator materials [5] Litarion (DE) has
manufacturing capacity to produce electrodes and ceramic separators for lithium-ion
battery cells but the actual production volume for 2015 is unknown [29]
Figure 10 Left ndash Development of the separator market in 2005-2015 [5] and right ndash Regional distribution of the separator producers in 2015 (Used with permission from Avicenne Energy [5])
It is expected that the separator market for Li-ion batteries will continue to grow steadily
with CAGR of 12 reaching ca 2700 Mm2 in 2025 [5] A major contribution to this
growth will come from the needs of electric vehicles and buses (see Figure 11)
21
Figure 11 Projected separator market growth (Used with permission from Avicenne Energy [5])
325 Future cell chemistries
Significant research effort is dedicated world-wide to the development of several future
cell chemistries which have the potential to outperform contemporary Li-ion cells
Chemistries which are often identified as the ones capable of advancing battery
technology to beyond the Li-ion include
a) Lithium metal (Li metal) batteries
b) Solid State batteries (SSB)
c) Lithium-sulphur (Li-S) batteries
d) Lithium-air (Li-air) batteries
The development status as well as challenges facing these chemistries are briefly
outlined in the following sections
Li metal [30]
With a specific capacity more than ten times that of the LiC6 anode used in present-day
lithium-ion batteries cells based on Li metal anodes are of particular interest Effective
22
strategies for stabilizing the anode in such cells are required for progress on future
storage technologies including LindashS and Lindashair batteries Several challenges mdash parasitic
reactions of Li metal with liquid electrolytes unstable and dendritic electrodeposition
and dendrite-induced short circuits mdash derailed early efforts to commercialize lithium
metal batteries
Recent research efforts to minimise reactions between the metal and electrolyte use
surface coatings to alter the composition and ion transport properties of the solid
electrolyte interface (SEI) layer and are expected to yield lithium-metal batteries based
on layered hybrid electrolytes in which Li anodes protected by an artificial SEI coexist
with conventional liquid electrolytes Artificial SEI designs which can also be applicable to
other reactive metal anodes eg Na Al or Zn are of particular interest because these
anodes exhibit similar parasitic reactions to Li
In the longer term the inherent design flexibility that comes from the malleability of Li
will be exploited allowing Li metal batteries to be lithographied 3D printed gelated from
sols or integrated into load-bearing structures through layer-by-layer deposition or self-
assembly Design of Li-metal anodes compatible with manufacturing outside the glove
box will emerge as an area of high priority
Solid State batteries [31]
Solid-state batteries (SSBs) that use solid electrolytes (SEs) (either inorganic or
polymer) instead of liquid ones could offer both high energy and high power density SEs
allow transfer of lithium ions only and act as functional separators with only minor self-
discharge (due to negligible electronic conductivity) Moreover lithium ions and anions
are mobile in liquid electrolytes causing severe concentration gradients of the
conducting salts during current flow and limiting the cell current whereas only lithium
ions are mobile in SEs so this bulk polarization cannot occur As a result higher current
densities and quicker charging times are conceivable in SSBs Some inorganic solid
electrolytes are stable at elevated temperatures improving battery safety The
mechanical rigidity of SEs may prevent the dendrite formation that is caused by the
electrodeposition of lithium and thus facilitate the use of lithium-metal anodes
Despite fast growing interest in SSBs many challenges remain in both manufacturing
and fundamental understanding of the technology For example lithium-ion conductivity
of the polymer electrolytes is too low for battery operation at room temperature and the
operation in electric vehicles requires temperatures above 80 degC Even then their rate
capability is limited preventing fast charging Hence the search for stable polymer
electrolytes for use with lithium-metal anodes and lithium nickel cobalt manganese oxide
23
or lithium nickel cobalt aluminum oxide cathodes at ambient temperature at sufficient C-
rates is one of the challenges scientists and engineers face in the forthcoming years
The major drawback of many inorganic SEs is their low thermodynamic stability Most
solid electrolytes are easily reduced at low potentials (for example by lithium metal) mdash
just like their liquid competitors mdash and oxidized at intermediate potentials Protecting
interphases are therefore required to stabilize the electrolyteelectrode contact as
happens in conventional lithium-ion batteries
Li-S [32]
Li-S batteries based on abundant sulphur high-capacity sulphur-containing cathodes and
lithium anodes are considered among the most promising candidates to achieve a low-
cost and high-energy-density system Fundamental challenges facing Li-S batteries
originate from the insulating properties of elemental sulphur and lithium sulphides the
dissolution of lithium polysulphides in the electrolyte the volume change at the cathode
on cycling and the need to passivate membranes at the anode to inhibit dendrite
formation Moreover it is now widely realized that high sulphur loading electrodes are
essential for Li-S technology in the marketplace
Li-air [33]
The Li-air battery which uses oxygen from air has the highest theoretical specific
energy density of any battery technology 3500 Whkg Estimates of practical energy
storage are uncertain as many factors are unknown but values in the range 500 to
1000 Whkg ndash sufficient to deliver significantly in excess of a 500 km driving range if
deployed in an electric vehicle battery ndash have been proposed Despite significant
research over the past decade there is a lack of a true understanding of the
underpinning chemistry and electrochemical processes in Li-air batteries Li-air batteries
combine two challenging electrodes Li metal and oxygen Li-metal electrodes still do not
deliver the necessary cycling efficiency (ratio of dischargecharge capacity) and related
suppression of dendrites Aprotic Li-O2 faces a number of challenges not least of which
is the stability of the electrolyte solution and the cathode towards reduced oxygen
species Also the issue of air handling and filtering would need to be addressed by new
engineering solutions
Technology evolution [34]
Given the numerous fundamental challenges facing the above-listed future battery
chemistries and taking into account that time-to-market for new battery materials and
24
concepts has historically been shown to range between 10 and 20 years [5] projections
regarding the commercialisation timeline of the future technologies need to be made
with caution According to the German National Platform for Electromobility
contemporary Li-ion cells (generations 1 and 2a in Figure 12) largely based on LFP
LMO NCA and NMC cathodes and graphite or carbon anodes will soon be gradually
substituted by generation 2b technology with nickel-rich cathodes and higher energy
density
Another advance is to be expected with the introduction of Generation 3 which is
characterized by the use of carbon-silicon anodes Generations 3a and 3b can be
expected to subsequently upper the cut-off voltage which will lead to an increase in
energy density
In the medium to long term a doubling of range or halving of costs appears to be
possible especially with traction battery cells of Generation 4 If the challenges related to
solid state and lithium-sulphur technology (and other conversion chemistries (Generation
4)) are resolved they can become important parallel technologies co-existing with
lithium-ion on the market (see Figure 12)
It is still largely an open question whether the theoretically proven advantage of the
higher energy density at the cellular level can be efficiently implemented at a battery
pack level Therefore at present a question whether and when a transition to post
lithium-ion technology (traction battery cells with conversion materials (Generation 4)
and lithium-air (Generation 5)) will take place in future cannot be answered with
certainty From todays perspective advancement to solid state systems in the near
future (Generation 4) looks more likely
For all of these chemistries no significant manufacturing base has yet been developed by
any global economy This leaves a potential opportunity open for Europe to break-in to
cell manufacturing for chemistries where currently no significant barrier to entry exists
25
Figure 12 Forecasted battery technology evolution [34]
26
33 Cell manufacturing
331 Cell manufacturing ndash current status
The total sales volume of Li-ion battery cells in 2015 was ca 5600 million cells
(equivalent to ca 60 GWh) and the cell market value was ca B$ 167 its compound
annual growth rate (CAGR) amounted to 22 for volume and 15 in value between
2005 and 2015 [5] In 2015 approximately 31 of the total Li-ion battery cell sales
equivalent to more than 18 GWh in volume and ca B$ 53 in value were used in
automotive applications [5] This number excludes Li-ion battery cells for SLI (Starting
Lighting and Ignition) application which at present has a very minor market share but
is expected to grow in the future [5]
Lithium-ion batteries were first commercialised in the early 1990s by Sony Their uptake
grew rapidly as they delivered a superior performance relative to other rechargeable
chemistries deployed at the time The surge in demand in terms of number and product
range for portable electronic devices drove the corresponding need for high
performance lithium ion batteries Asian battery manufacturers dominance in this
market positioned them favourably to respond quickly and competitively to the growing
demand This allowed establishment of a strong manufacturing base in Asia which later
enabled quick scaling up of the production volume further development and optimisation
of the technology and diversification of their product range toward emerging markets
including automotive [35] Asian companies notably Samsung SDI (KR) LG Chem (KR)
Sanyo-Panasonic (JP) Sony (JP) and BYD (CN) among others dominate the Li-ion
battery cell manufacturing (see Figure 13) [5 34 35]
Cell manufacturers for automotive applications include Panasonic (JP) Samsung SDI
(KR) LG Chem (KR) AESC (JP) GS Yuasa (JP) Li Energy Japan (JP) BYD (CN)
Wanxiang (CN) Lishen Tianjin (CN) and Toshiba (JP) [26 34 36]
27
Company Market volume
in 2015
million cells
Company Market value in
2015
million US $
Samsung SDI 1376 Samsung SDI 3000
LG Chem 1008 LG Chem 2530
SONY 490 ATL 1490
ATL 465 Sanyo-
Panasonic
1125
Tesla 430 BYD 1120
Sanyo-
Panasonic
408 SONY 1040
Lishen 290 Tesla 970
Coslight 185 Lishen 850
BYD 180 NEC 520
Maxell 76 Coslight 450
BAK 67 GS Yuasa 210
Other 625 Other 3395
Total 5600 Total 16700
Figure 13 Market share of various Li-ion cell producers in 2015 left ndash in volume right ndash in value (Used with permission from Avicenne Energy [5])
28
Table 2 illustrates the total completed under construction and planned Li-ion cell
manufacturing capacities in various regions in 2014 according to the data cited in reports
of the US Clean Energy Manufacturing Analysis Center (CEMAC) [7 37] As can be seen
in 2014 the global manufacturing capacity for Li-ion battery cells for all applications was
ca 763 GWh and 88 of this manufacturing capacity was located in Japan China and
South Korea (see Table 2) Production capacity for automotive Li-ion cells was 275 GWh
in 2014 79 of which was located in Asia [7 37] A similar number for the global
production capacity for automotive Li-ion battery cells - 272 GWh- is quoted by the
German National Platform for Electromobility [34]
According to Avicenne Energy the global production capacity for Li-ion battery cells for
all applications was approximately 100 GWh in 2015 from which 40 GWh were for
portable Li-ion cells and 60 GWh for all other applications including automotive [5]
In the time period from 2014 to 2016 the global manufacturing capacity for automotive
Li-ion cells has increased significantly (compare Table 2 and Table 3) [6 38] Korea has
increased its manufacturing capacity for automotive cells ca 15 times Japan ca 24
times and China 27 times from 2014 to 2016 China plans further expansion of its
manufacturing capacity for lithium-ion battery cells and has announced construction of
extra 193 GWh manufacturing capacity in addition to its 304 GWh Especially
aggressive growth in the manufacturing capacity for automotive cells is observed in the
USA where an explosive growth of the manufacturing capacity increasing almost 10
times from 2014 to 2016 is observed thanks to construction of the Tesla Gigafactory
The fully commissioned manufacturing capacity of the EU has not changed significantly
Please note that 5 GWh capacity mentioned as under construction in the CEMAC
reports [7 37] refers to a new BMZ Li-ion battery manufacturing facility in Karlstein (DE)
(see section 34)
29
Table 2 Annual manufacturing capacity of Li-ion cells worldwide in 2014 [7 37]
includes fully commissioned partially commissioned and under construction capacity excludes announced capacity
Please note that JRC analysis of the underlying data for the EU indicated that numbers for the EU include data on pack manufacturing [38]
Fully
commis-
sioned
(GWh)
Partially
commis-
sioned
(GWh)
Under
construc-
tion
(GWh)
Announced
(GWh)
Total
manufacturing
capacity
(GWh)
Share of
total global
capacity
Automotive
manufacturing
capacity
(GWh)
Share of
global
automotive
capacity
China 16704 3576 18730 12847 39010 51 11240 41
Japan 10778 0 1200 0 11978 16 5750 21
Korea 16059 0 0 0 16059 21 4600 17
US 3770 0 1200 350 4970 7 4600 17
EU 1798 0 0 0 1798 2 1300 5
Rest of
world
2440 0 0 0564 2440 3 0 0
TOTAL 51549 3576 21130 48412 76255 100 27490 100
30
Table 3 Annual manufacturing capacity of automotive Li-ion cells worldwide in 2016 [6 38]
Fully
commissioned
(GWh)
Partially
commissioned
(GWh)
Under
construction
(GWh)
Announced
(GWh)
Total
manufacturing
capacity
(GWh)
Increase
compared to
2014
()
China 11152 3038 16244 19246 30434 271
Japan 13623 13623 237
Korea 6570 6570 143
US 8925 8750 26250 0150 43925 955
EU 1293 5000 6293 0
Rest of world 3390 0120 3390 139
TOTAL 44953 11788 47494 19516 104235
includes fully commissioned partially commissioned and under construction capacity excludes announced capacity
Please note that JRC analysis of the underlying data for the EU indicated that numbers for the EU include data on pack manufacturing 5 GWh capacity
mentioned as under construction refers to a new BMZ Li-ion battery manufacturing facility in Karlstein (DE) (see section 34) [38]
31
The EU does not have a significant manufacturing capacity for Li-ion battery cells and
published data on capacity and on actual production differ slightly depending on the
sources
a) According to the US Clean Energy Manufacturing Analysis Center (CEMAC)
whose reports are based on data from Bloomberg New Energy Finance (BNEF) the total
production capacity of fully commissioned facilities in Europe was nearly 18 GWhyear in
2014 (corresponding to 2 in the global production capacity of Li-ion cells for all
applications) out of which 13 GWhyear were for automotive Li-ion cells (corresponding
to 5 of the global production capacity of automotive Li-ion cells) (see Table 2) [7 37]
(Please note that JRC analysis of the underlying data for the EU indicated that numbers
for the EU include data on pack manufacturing [38])
b) In its Roadmap integrated cell and battery production Germany the German
National Platform for Electromobility indicates that EUs production capacity for large
format Li-ion cells for automotive and energy storage applications was 15 GWhyear in
2014 [34] This number based on Roland Bergers data takes into account only an
estimate of production capacity of AESC (Nissan) facility in Sunderland (UK) [34]
c) According to the analysis of Avicenne Energy manufacturing capacity for Li-ion
cells in Europe was nearly 15 GWhyear in 2015 [5] distributed over a number of
relatively small producers however it quotes the actual production volume of Li-ion cells
in Europe at only ca 350 MWh [5]
Compared with Asian counterparts the number and relative size of European Li-ion cell
manufacturing companies are significantly smaller These manufacturers include (see
also Table 4)
SAFT recently taken over by Total [39] is currently the largest active European
producer of Li-ion cells Its manufacturing facility in Nersac (FR) has a production
capacity of 60 MWhyear [5 40] however SAFTs actual production volume in
2015 was 84 MWh exceeding its nominal capacity [5] SAFT cells and batteries
are used for various applications including space military and aircraft applications
[41]
ABSL Power Solutions in Culham (UK) recently acquired by EnerSys is a
European manufacturer of Li-ion battery cells for space applications [42]
AGM Batteries Ltd in Thurso (UK) develops and manufactures rechargeable Li-ion
cells and non-rechargeable lithium cells Its production facility with capacity of 50
MWh supplies Li-ion batteries across a range of markets including defence oil
and gas markets [43]
32
Switzerland-based Leclancheacute operates a production facility in Willstaumltt (DE)
where it produces Li-ion cells and batteries for energy storage applications The
current manufacturing capacity of this facility is 100 MWh [44]
EAS Germany GmbH located in Nordhausen Germany produces cylindrical cells
which are currently deployed in space submarine marine and automotive
applications in Europe Asia and North America [45] Production capacity of this
facility is 100 MWhyear while actual the production in 2015 was 40 MWh [46]
Litarion GmbH a subsidiary of Electrovaya in Kamenz (DE) is a supplier of
lithium-ion cells for mobile and stationary energy storage and other demanding
applications Furthermore Litarion has manufacturing capacity to produce
electrodes and ceramic separators as key components for high performance
lithium-ion battery cells [29] Production capacity of this facility for cells is 500
MWhyear actual production in 2015 was ca 25 MWh [46]
Custom Cells Itzehoe GmbH located in Itzehoe (DE) produces Li-ion pouch cells
for various applications and of various formats specified by the customers [47]
Production capacity of this facility is 20 MWhyear actual production in 2015 ndash 1
MWh [46]
SSL Energie GmbH in Kelheim (DE) manufactures Li-ion cells for energy storage
solutions for telecommunication and industrial plants as well as for
electromobility applications (on land and on water) [48] Production capacity of
this facility is 01 MWhyear while the actual production in 2015 was negligible
[46]
Liacon GmbH located in Itzehoe (DE) has a vertically integrated production plant
for large-scale lithium titanate polymer cells [49]
VARTA Microbattery GmbH located in Ellwangen (DE) is a manufacturer of
microbatteries and is one of the market leaders in the hearing aid battery and
nickel-metal hydride and lithium-ion coin battery segments [50]
European Battery Technologies Oy in Varkaus (FI) develops and manufactures
large rechargeable lithium-ion based prismatic cells and battery systems which
can be used to power hybrid and electric drive trains and to store energy
produced by renewable energy sources [51] Production capacity of this facility
was 30 MWhyear and the actual production volume amounted to 1 MWh in 2015
[46]
Advanced Lithium System Europe SA (ALSE SA) has a manufacturing facility in
Xanthi (GR) where Li-ion cells and batteries for defence applications such as
exercise torpedoes are produced [52] Production capacity of this facility is 100
MWhyear and the actual production volume amounted to 01 MWh in 2015 [46]
33
A special type of Li-ion cells - solid-state cells with a Li-metal anode ndash is produced
in France and in Canada by Bolloreacute (FR) The cell production capacity in France is
500 MWh per year and the actual production in 2015 amounted to 120 MWh [46]
Table 4 Li-ion cell actual production volume for 2015 and production capacity of selected European manufacturers Source [5 40] [43] [44] [46]
Company Actual production
in 2015 MWh
Production
capacity
MWh
SAFT (FR) 84 60
EAS Germany GmbH (DE) 40 100
Litarion GmbH (DE) 25 500
Leclancheacute GmbH (DE) 5 100
European Battery Technologies Oy (FI) 1 30
Custom Cells Itzehoe GmbH (DE) 1 20
Advanced Lithium System Europe SA
(GR)
01 100
AGM Batteries Ltd (UK) na 50
SSL Energie GmbH (DE) negligible 01
Bolloreacute (FR) 120 500
Total 2761 14601
Due to the high production costs Daimler subsidiary Li-Tec (DE) stopped production of
Li-ion battery cells and batteries at the end of 2015 marking the closure of the only
German factory producing cells for EVs [36 53] According to data of BNEF the
manufacturing capacity of this factory was 480 MWh [38]
Renault CEA (French Atomic Energy and Alternative Energies Commission) and Nissan
were planning to build a factory in Flins (France) to produce automotive Li-ion cells and
batteries with an annual manufacturing capacity of 100000 batteries [54] This cell and
34
battery production plant foreseen to supply batteries for Renaults ZOE electric vehicle
was delayed due to technical constraints [55] At present only a battery pack assembly
line is operational at this location [56] In 2009 Renault Nissan announced it would build
an advanced Li-ion electric vehicle battery factory in Cacia (Aveiro Portugal) to produce
50000 batteries per year starting in 2012 [57] However this plan did not go ahead and
the facility is currently still not operational [58]
In the meantime mature Asian cell manufacturers are planning to establish Li-ion
automotive cell and battery production in the EU For example LG Chem (KR) plans to
build a production plant in Poland (most likely in Wrocław) with an annual production
capacity of 50000 Li-ion automotive batteries [59 60] Samsung SDI (KR) has started
preparing for Li-ion battery (cell module and pack) production in Jaszfenyszaru
Hungary [61]
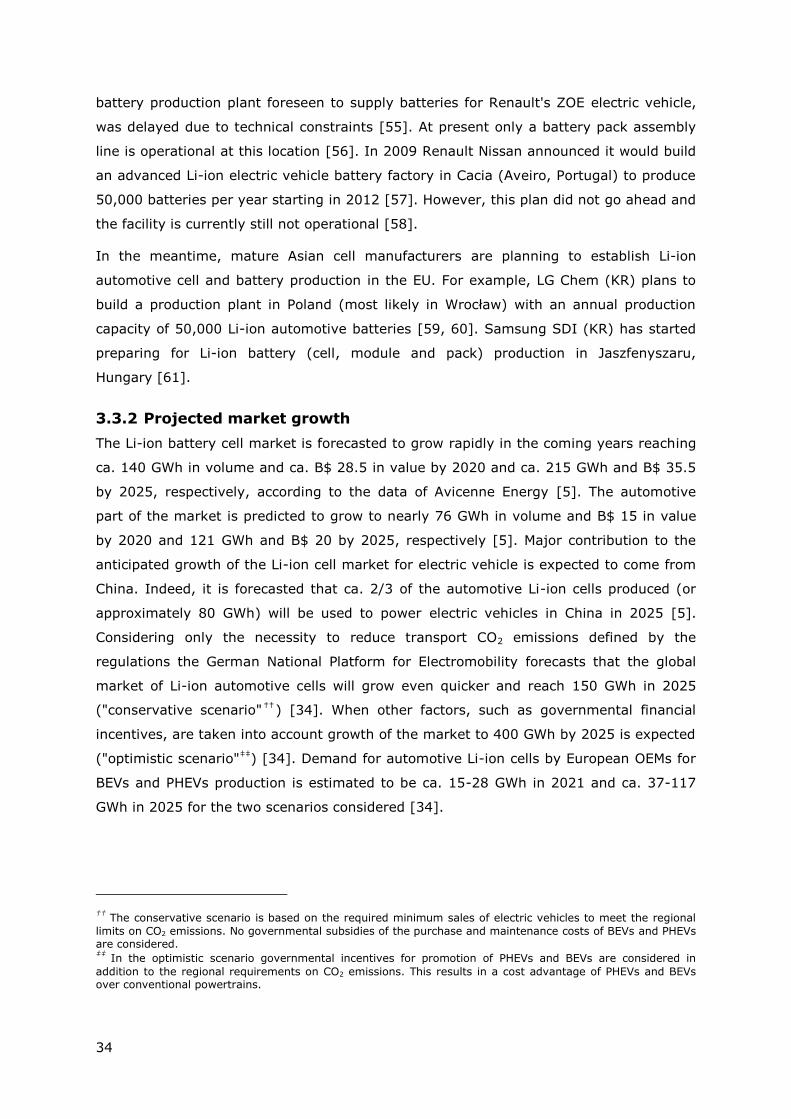
332 Projected market growth
The Li-ion battery cell market is forecasted to grow rapidly in the coming years reaching
ca 140 GWh in volume and ca B$ 285 in value by 2020 and ca 215 GWh and B$ 355
by 2025 respectively according to the data of Avicenne Energy [5] The automotive
part of the market is predicted to grow to nearly 76 GWh in volume and B$ 15 in value
by 2020 and 121 GWh and B$ 20 by 2025 respectively [5] Major contribution to the
anticipated growth of the Li-ion cell market for electric vehicle is expected to come from
China Indeed it is forecasted that ca 23 of the automotive Li-ion cells produced (or
approximately 80 GWh) will be used to power electric vehicles in China in 2025 [5]
Considering only the necessity to reduce transport CO2 emissions defined by the
regulations the German National Platform for Electromobility forecasts that the global
market of Li-ion automotive cells will grow even quicker and reach 150 GWh in 2025
(conservative scenariodaggerdagger) [34] When other factors such as governmental financial
incentives are taken into account growth of the market to 400 GWh by 2025 is expected
(optimistic scenarioDaggerDagger) [34] Demand for automotive Li-ion cells by European OEMs for
BEVs and PHEVs production is estimated to be ca 15-28 GWh in 2021 and ca 37-117
GWh in 2025 for the two scenarios considered [34]
daggerdagger The conservative scenario is based on the required minimum sales of electric vehicles to meet the regional
limits on CO2 emissions No governmental subsidies of the purchase and maintenance costs of BEVs and PHEVs are considered DaggerDagger
In the optimistic scenario governmental incentives for promotion of PHEVs and BEVs are considered in
addition to the regional requirements on CO2 emissions This results in a cost advantage of PHEVs and BEVs over conventional powertrains
35
333 Global cell production over-capacity
Comparing data on the manufacturing capacity for automotive Li-ion cells in 2014 ca
275 GWh [7 34 37] to the corresponding demand and sales volume 10-11 GWh [27
28 34] it can be seen that a noticeable global production overcapacity existed in 2014
Production overcapacity is however not unique for Li-ion cell for automotive
applications In fact a global manufacturing overcapacity albeit to a lower degree is
seen for all types of Li-ion cells and even in the mature and well-established lead-acid
battery sector (see Figure 14) [5]
Figure 14 Battery cell production capacity (Used with permission from Avicenne Energy [5])
Global overcapacity for automotive Li-ion cells was unevenly divided among the regions
in 2014 as shown in Figure 15 [7 37] The lowest utilisation of the manufacturing
facilities for automotive Li-ion cells ndash ca 10 - was observed for China and the highest
utilisation ndash ca 40 and 30 - for Japan and Korea respectively Utilisation for US and
EU was around 20 [7 37] Analysis by Avicenne Energy shows that domestic European
Li-ion cell manufacturing facilities continued to be under-utilised also in 2015 [46]
A possible reason for the current cell manufacturing over-capacity [6] may be that high
profitability of a supply chain segment covering a promising growing productservice will
36
naturally encourage investments in capacity expansion Also as explained in [7 37]
Initially overly optimistic assumptions regarding electric vehicle demand have
contributed to an overbuild of large format Li-ion battery cell production capacity
targeted at vehicle markets
The observed global production overcapacity for automotive Li-ion battery cells has likely
led European battery manufacturers and automotive OEMs to conclude in 2013 that
Current estimates suggest that international resources would be sufficient for the EU to
fulfil demand for hybrid electric and full electric vehicles for the foreseeable future [62]
Figure 15 Automotive Li-ion battery cell manufacturing capacity and utilization in 2014 Source[7 37]
This position was recently reiterated by Daimlers CEO according to Automotive News
website post from February 2016 [63] Daimler CEO Dieter Zetsche ruled out investing
in battery cell production for electric cars with other German premium brands for at least
another few years citing a massive overcapacity in the market that has turned cells into
a commodity The dumbest thing we could do is to add to that overcapacity Zetsche
said earlier this month in Stuttgart Contrary to the expectation four or six years ago
when everyone thought that the cells would be a rarity that could even be used as a tool
of industrial policy there is de facto a massive overcapacity in the market today and
cells have become a commodity he said
Nevertheless another automotive OEM ndash Volkswagen Group and also its brand Audi ndash
has recently expressed interest in domestic production of Li-ion cells for electric vehicles
[63-66]
37
According to CEMAC the market situation is expected to come into better balance in the
near future with global overcapacity decreasing in 2016 [6] Taking into account
projected market growth for automotive Li-ion cells and assuming the production
capacity remains at the present level CEMAC has estimated that the need for new
capacity will arise in 2019-2020 (see Figure 16) [6]
However data presented in the same report by CEMAC [6] also suggests that
manufacturing capacity is likely to continue growing and overcapacity conditions may
persist Nearly 25 GWh of capacity is currently either partially commissioned or under
construction and a further 55 GWh of capacity has been announced
Also the German National Platform for Electromobility has come to the conclusion that
even considering todays excess of manufacturing capacity for automotive Li-ion battery
cells a significant need for additional cell production capacity may be expected to arise
from about 2020 (see Figure 17) [34] According to the data published in [34] there will
be worldwidesectsect additional demand of about 5 GWhyear in 2020 and up to 100 GWhyear
by 2025 in the conservative scenario In the optimistic scenario the demand increases to
above 300 GWhyear Further demand is generated by buses and stationary
applications This situation opens up the possibility for competition-enabled cell
production also in Europe (Figure 17) [34]
Figure 16 Estimated electric vehicle Li-ion battery cell demand and global automotive Li-ion battery cell manufacturing capacity [6]
sectsect Following world regions are considered Europe Japan and South Korea China Canada USA and Mexico Their demand covers more than 90 of the total world demand
38
Figure 17 Worldwide demand for automotive Li-ion battery cells in 2015-2025 Source[34]
39
34 Battery pack manufacturing
The battery pack is a key part of the EV power train accounting for around 30 of the
total vehicle value The Li-ion battery pack market for all applications was more than B$
22 in value in 2015 and the automotive share was slightly less than 8 B$ [5] The
automotive battery pack market value is expected to grow to ca B$ 213 in 2020 [5 8]
and ca B$ 273 in 2025 [5] (see Figure 18)
Battery pack manufacturing accounts for approximately 40 of the total cost of the
battery pack [37] As a whole all the components of the electric powertrain (electric
engine power electronics battery pack and charging devices) will account for almost
half of the global automotive market expansion up to 2020 equivalent to euro100 billion
[67]
Figure 18 Projected growth of Li-ion pack market (Used with permission from Avicenne Energy [5])
Different car manufacturers have different strategies whether to invest and develop the
required pack manufacturing capacity in-house or to outsource it to specialist suppliers
40
The majority of OEMs producing electric vehicle maintain a technological core
competence around battery pack design and battery management system to keep some
control and profit margins Consideration of the specific circumstances of the lithium ion
cell manufacture value chain in different regions (US EU China Japan) can help explain
the different manufacturing strategies adopted by the OEMs located in these regions
Japanese and Chinese OEMs typically keep a higher control on all steps up to the
segment of the cell and battery pack manufacturing process whereas European OEMs
who are forced to relinquish control over cell manufacturing due to the absence of
significant domestic cell manufacturing capacity are trying to keep pack design and pack
assembly in-house
Table 5 OEMs Battery pack manufacturing strategy
OEMs battery pack manufacturing strategy and control
Per region
US CN EU JP
Lower control hellip hellip Higher control
Cells and pack
manufacturing
completely outsourced
Cellsmodules
manufacturing
outsourced through
Tier 1 suppliers
In-house pack design
and manufacturing
Cells production
through joint
venturescontrolled
subsidiary
companies In-house
pack design and
manufacturing
In-house
manufacturing of cells
pack design and
manufacturing
GM BMW Nissan Tesla (plan to)
Renault Mitsubishi BYD
Daimler
In the US the two main OEMs active in the EV business Tesla and GM are adopting
opposite strategies as illustrated in Table 5 Tesla (US) is the leader on the BEV-PHEV
market despite being less heavily resourced as some of its competitor OEMs Rather than
relying on the Tier 1 and Tier 2 supply chain Tesla is opting to produce the majority of
its key components in its California plant in Fremont This includes the battery packs for
its Tesla S and Tesla X vehicle model using cells supplied by Panasonic (JP) Those
models have also the biggest battery pack on the market (with an average energy
storage capacity of 90 kWh) For the upcoming Tesla Model 3 the full production of the
battery pack (estimated energy storage capacity of 50 kWh) including its cells is
41
planned to be performed at the Tesla Gigafactory plant in Nevada GM on the other
hand chooses to outsource its entire cell and pack manufacturing including the battery
management system
The Chinese OEM BYD shares a similar strategy as Tesla and is designing producing and
assembling the complete electrical power train system including cells battery pack and
BMS in-house
In Japan the full battery pack of the Mitsubishi Outlander PHEV is provided by Lithium
Energy Japan a joint venture between GS Yuasa Mitsubishi Corporation and Mitsubishi
Motors Corporation The battery pack is thus designed and produced in-house by
Mitsubishi albeit through this joint venture The Nissan Leaf battery pack is supplied by
Automotive Energy Supply Corporation (AESC) which is jointly owned by Nissan and the
Japanese electronics firm NEC Similar to Mitsubishi Nissan designs and manufactures
battery packs in-house for its own use Japanese Li-ion battery pack manufacturing
facilities in the EU include Nissans battery production plant in Sunderland (UK) ndash the
largest of its type in Europe ndash which became operational in 2013 producing Li-ion
batteries for the Nissan Leaf and the Nissan e-NV200 van [68] The full annual
production capacity of this plant is 50000 EVs and 60000 battery packs [69]
Within European OEMs the BMW Group has invested more than euro100 million in electric
drive technology in Dingolfing (DE) where they set up a plant to manufacture their
electric drive systems BMW designs and develops its core electric drive components
including the power electronics BMS and the whole vehicle electrical system [70] using
cells supplied by Samsung SDI Renault assembles its BEV model Renault Zoe in its
plant in Flins (FR) The battery pack including the BMS is developed in close partnership
with LG Chem who also provides the battery cells [56 71]
Daimler AG has heavily invested and committed to produce its own line of electric
vehicles challenging BMW and Tesla Deutsche ACCUMOTIVE founded in 2009 is a
wholly-owned subsidiary of Daimler AG At its manufacturing facility in Kamenz (DE) the
company develops and produces Li-ion traction batteries packs for hybrid and electric
vehicles [72] Since the start of series production in 2012 it has delivered more than
70000 lithium-ion batteries packs [73] Daimler AG recently announced it will invest
euro500 million into the creation of a second lithium-ion battery pack production facility in
Kamenz This new facility will produce lithium-ion batteries packs for use in electric
vehicles released under the Mercedes-Benz brand Daimler currently has a supply
agreement arrangement with LG Chem [73] who provides the cells for its battery packs
In addition to supplying batteries for Daimler automobiles Deutsche ACCUMOTIVE is
also entering the stationary battery storage market for residential and industrial
applications The scalability of the systems enables the use of lithium-ion batteries in
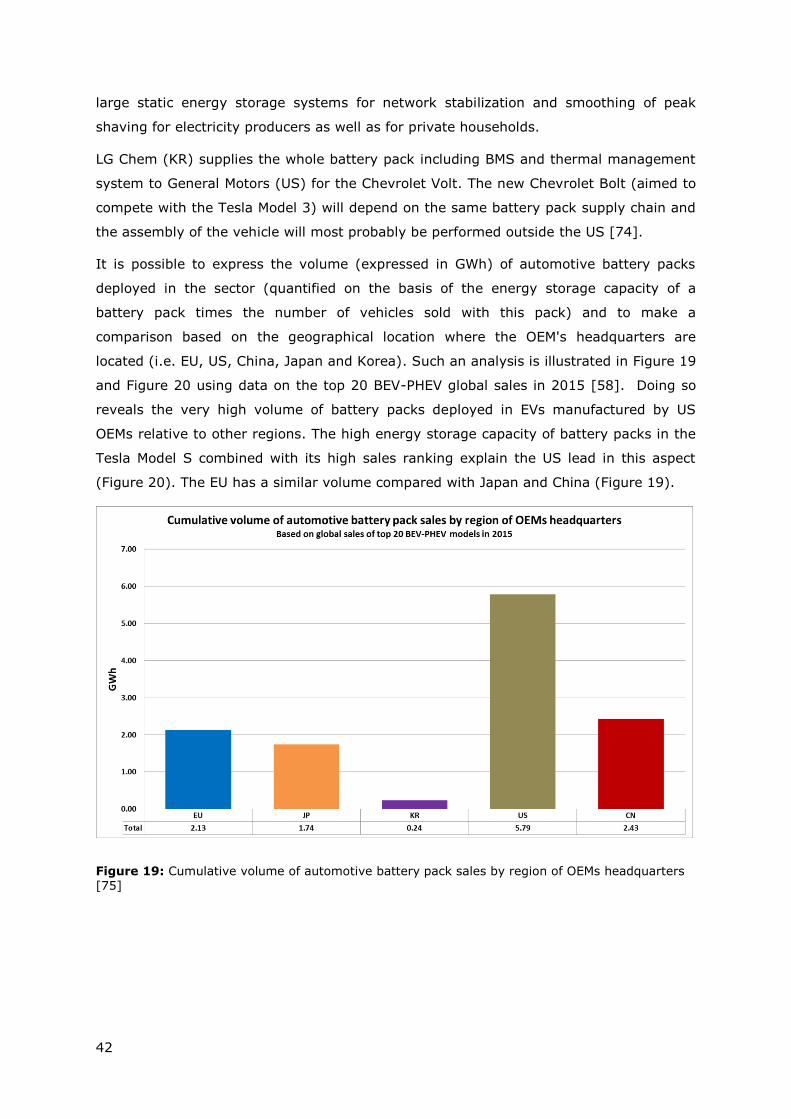
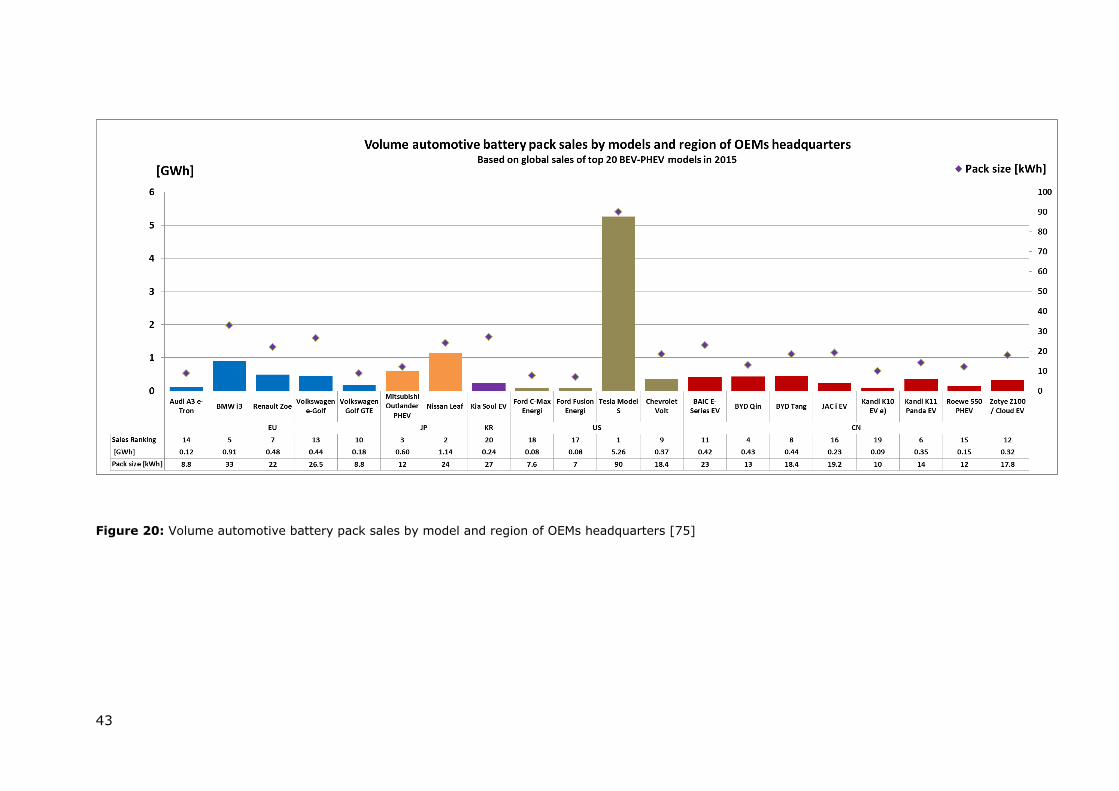
42
large static energy storage systems for network stabilization and smoothing of peak
shaving for electricity producers as well as for private households
LG Chem (KR) supplies the whole battery pack including BMS and thermal management
system to General Motors (US) for the Chevrolet Volt The new Chevrolet Bolt (aimed to
compete with the Tesla Model 3) will depend on the same battery pack supply chain and
the assembly of the vehicle will most probably be performed outside the US [74]
It is possible to express the volume (expressed in GWh) of automotive battery packs
deployed in the sector (quantified on the basis of the energy storage capacity of a
battery pack times the number of vehicles sold with this pack) and to make a
comparison based on the geographical location where the OEMs headquarters are
located (ie EU US China Japan and Korea) Such an analysis is illustrated in Figure 19
and Figure 20 using data on the top 20 BEV-PHEV global sales in 2015 [58] Doing so
reveals the very high volume of battery packs deployed in EVs manufactured by US
OEMs relative to other regions The high energy storage capacity of battery packs in the
Tesla Model S combined with its high sales ranking explain the US lead in this aspect
(Figure 20) The EU has a similar volume compared with Japan and China (Figure 19)
Figure 19 Cumulative volume of automotive battery pack sales by region of OEMs headquarters [75]
43
Figure 20 Volume automotive battery pack sales by model and region of OEMs headquarters [75]
44
Besides the European automotive OEMs with battery pack production interest other
companies with battery pack manufacturing business cases based in Europe worth
mentioning include
Kreisel Electric GmbH based in Freidstadt Austria is establishing a business
network with German automakers such as BMW and Volkswagen and the British
sports carmaker McLaren Automotive Kreisel Electric manufactures battery packs
and electric drive trains for orders up to 10000 vehicles They are also designing
lithium ion battery production lines for OEMs and creating prototypes for top-tier
automakers Kreisel has started the construction of a new 800MWh battery pack
factory for high energy density packs for EVs [76] Kreisel currently has a supply
agreement arrangement with Samsung SDI
Johnson Matthey Battery Systems (formerly Axeon) (UK) is one of Europersquos
largest Li-ion battery systems suppliers processing over 70 million cells a year
and supplying volume production of batteries for global markets [70]
The facility of Continental in Nuremberg (DE) assembles lithium-ion batteries for
hybrid electric vehicles such as Mercedes S400 BlueHYBRID [77] In September
2008 production commenced with a capacity output of 15000 lithium-ion
batteries per annum Full annual manufacturing capacity of this plant is 333 MWh
The plant incorporates recycling technology that allows at least 50 percent of the
content of lithium-ion cells to be recycled [77]
In 2015 BMZ GmbH has announced expansion of their battery-manufacturing
facility in Karlstein (DE) [78] to enable production of up to 80 million lithium-ion
batteries of various sizes with a total storage capacity of around 5 GWh annually
[78] This project is expected to be completed by 2020 BMZ GmbH (BMZ) is a
battery systems provider whose high-tech batteries are used to power a wide
range of products made by leading manufacturers including electric tools electric
vehicles e-bikes portable medical devices and batteries for use in the renewable
energy sector [78]
Dow Kokam has completed the construction of a 105 MWh lithium-ion battery
manufacturing plant Le Bouchet 2 located in France This battery facility is
designed to manufacture up to 15000 battery packs of 7 kWh to power 5000
fully electric vehicles annually (assuming a 21 kWh battery system) [7 37]
In 2015 Samsung SDI acquired the EV battery pack business of Magna Steyr an
Austrian-based operating unit of Magna International including production and
development sites [79] Magna Steyr Battery Systems product portfolio included
battery packs for HEVs PHEVs BEVs as well as for Heavy Duty Vehicles and 12 V
and 48 V systems [80 81] In 2014 the manufacturing capacity of Magna Steyr
Battery Systems for 16-36 kWh BEV packs was 3000 units per year for 6-18
45
kWh PHEV packs ndash more than 35000 units per year and for 025-3 kWh HEV
packs ndash 50000 packs per year [80 81]
Bolloreacute (FR) assembles battery packs for its BlueCar electric vehicles at the facility
in Ergue-Gaberic (FR) with manufacturing capacity of 300 MWh [41] [82]
35 Electric vehicles manufacturing
351 Production volumes and deployment
More than 685 million passenger vehicles were produced worldwide in 2015 with ca
24 of these or more than 165 million vehicles produced in the EU [83]
In recent years the development of hybrid electric vehicle (HEV) batteries has yielded a
relatively mature generation of vehicles with ca 19 million HEVs sold worldwide in 2014
and ca 18 million HEVs sold in 2015 [8] The majority of HEVs are sold in Japan (nearly
60 of the global sales) and USA (ca 22 of the global sales) resulting in current HEV
penetration level of ca 23 and 3 respectively [8 27 84] In Europe ca 234000
HEVs were sold in 2015 [8] ca 15 of the total car sales The leading producer and
supplier of HEV both historically and currently is Toyota (JP) whose market share in
HEV global sales was nearly 70 in 2014 and 2015 [8 27] Most of Toyota and Lexus
HEV models currently use NiMH traction batteries but the general market trend is that
NiMH traction batteries will gradually be substituted by Li-ion technology [84] Avicenne
Energy forecasts that 50 of HEVs will be equipped with a Li-ion battery by 2020 and
90 of HEVs by 2025 [84]
Production and sales numbers for PHEVs and BEVs increased rapidly in the past few
years Sales numbers cited vary depending on the source For example figures cited for
worldwide PHEV and BEV sales in 2014 range from ca 289000 [85] and to ca 318000ndash
390000 [27 75] and in 2015 this number increased to ca 462000ndash550000 [75 85]
In the EU between ca 71000 [86] and 100000 PHEVs and BEVs [27 75 85] were sold
in 2014 which corresponds to ca 22 - 25 of PHEVs and BEVs sold globally This
number doubled in 2015 and reached between 150000 [86] and 193500 [75] PHEVs
and BEVs sold corresponding to 27 - 35 of PHEVs and BEVs sold globally On
average the fraction of PHEVs and BEVs in the global passenger vehicle sales in 2015
was ca 08 - 11 [85] slightly lower than the ca 09 - 13 average in the EU
[87] It must be noted here however that PHEV and BEV penetration levels vary
significantly among the world regions [88] and even in the EU among its member states
[86 87] with countries such as Norway The Netherlands Denmark Sweden and USA
having a higher fraction of electric vehicles on the road (above 12 12 8 17
and 19 respectively) compared to the rest of the world [86 88]
46
In 2015 the American Tesla Model S was globally the most sold vehicle among PHEVs and
BEVs with a market share of ca 11 Tesla was closely followed by two Japanese
producers ndash Nissan with the Nissan Leaf (9 global market share) and Mitsubishi with
the Outlander PHEV model (9 market share) [75] ranking 2nd and 3rd respectively in
the top 20 BEV-PHEV 2015 global sales Chinese producers were leading in global PHEV
and BEV sales in 2015 with 33 of the market share BYD is currently the largest
electric vehicle manufacturer on Chinarsquos automotive market Automobile business
contributed 50 to the companyrsquos revenue in 2015 and nearly half of its 2015 vehicle
sales revenue was from EV models [89] BYD ranks respectively 4th and 8th with its
models Qin and Tang in the top 20 BEV-PHEV 2015 global sales Japanese USA and EU
producers had almost equal market share in PHEV and BEV sales of 21-22 (see Figure
21) [75]
Figure 21 Global market share of the top 20 PHEV and BEV producers based on [75] (Producer is assigned to a region according to the location of its Headquarters eg Toyota is considered to be a Japanese producer regardless of whether manufacturing is taking place in Japan or elsewhere)
Among European PHEV and BEV models BMW i3 Renault Zoe and Volkswagen Golf GTE
are globally the most sold ranking respectively 5th 7th and 10th in the top 20 global sales
for 2015
In Europe the Mitsubishi Outlander is the most sold model (ca 16 share of PHEV and
BEV sales) followed by Renault Zoe ( 10) Volkswagen Golf GTE (9) Tesla Model S
(9) and Nissan Leaf (8) [75]
All categories of electric vehicles ndash HEVs PHEVs and BEVs ndash are expected to gain ground
in the future However projections on electric vehicles deployment vary among sources
and depend strongly on the assumptions made eg what deployment driver is
47
considered most influential for the number of HEVs PHEVs and BEVs on the road globally
and regionally For example UBSs regulation-driven forecast as well as the projections
of the German National Platform for Electromobility in their conservative scenario are
based on the necessity to reduce transport CO2 emissions defined by the regulations [34
90] Bloomberg New Energy Finance forecast considers the total cost of ownership for
electric vehicles and their economic competitiveness with conventional ICE vehicles as a
major factor determining the rate and volume for their deployment [91 92] In the
following paragraph a non-exhaustive compilation of data available from different sources
is presented and discussed
Figure 22 shows projected global sales of new PHEVs and BEVs for the period between
2015 and 2040 Most of projections do not go beyond 2025 probably due to the high
development pace of this market Figure 23 shows a zoomed view of the time period
between 2015 and 2025 It can be seen that projections vary both in absolute numbers
and in predicted rate of market growth For example Bloomberg and German National
Platform for Electromobility (optimistic scenario) predict a steeper growth between 2020
and 2025 than UBS and Avicenne Energy As for the absolute numbers the optimistic
forecast by the German National Platform for Electromobility falls noticeably higher than
other projections while the base case forecast made by Avicenne Energy which does not
take into account strong anticipated growth in China falls below other projections Both
Avicenne Energy and the German National Platform for Electromobility point out that a
rapid growth of Chinese PHEV and BEV market is to be expected in the next decade [27
28 34] and therefore projections accounting for this may be more accurate
In short conservative projected numbers of global sales for PHEVs and BEVs are ca 15-
275 Myear in 2020 and ca 4-65 Myear in 2025 (see Figure 23) Europe will have a
significant share in this market with sales of new PHEVs and BEVs at 07-08 Myear in
2020 and 165-19 Myear in 2025 (see Figure 24) which corresponds to 25-50 of the
global sales Regarding HEV sales Avicenne Energy forecasts 25 Myear to be sold
globally in 2020 and 32 Myear in 2025 [8] and 08 Myear European sales in 2020 and
ca 14 Myear in 2025 [84]
48
Figure 22 Projected global sales of new PHEV and BEV vehicles Source [5 8 34 75 90-92]
Figure 23 Projected global sales of new PHEV and BEV vehicles for 2015-2025 Source [5 8 34 75 90-92]
49
Figure 24 Projected European sales of new PHEV and BEV vehicles for 2015-2025 Source [34 75 90]
An important driver for OEMs to reduce GHG (greenhouse gas) emissions of their fleet is
the requirements set by legislation in Europe as well as in Asia and US [53 93-96] Many
OEMs have demonstrated their commitment to decarbonisation of road transport by
developing new electric vehicle models in addition to alternative strategies which include
optimization of the internal combustion engine (ICE) [97] reducing vehicle weight and
development of fuel cell vehicles [98] However consumer demand as recently shown
by new players on the market (eg Tesla Model 3 early reservations) may soon become
another important motivation for OEMs to launch competitive and high performance
electrical vehicles on the market Introduction of a new vehicle on the market is a
massive time-consuming RampI undertaking with a time to market for a new vehicle
ranging between 4 to 7 years [8] In a rapidly evolving global electrical vehicle market
automotive OEMs that are not quick to react to market trends and customer demands
may lose their competitive edge On the other hand great opportunities exist for OEMs
that are willing and able to adapt and respond quickly to changes in this very dynamic
market In this sense the automotive market and customer base in Europe is not the
same as that in the US China or elsewhere OEMs need to consider regional variations in
driving expectations infrastructure economic affluence and government incentives that
may affect consumer preferences and hence impact sales of new electric vehicle models
(eg see the consumer view and expectations in the US [99])
In this respect it is interesting to look at the upcoming models (2017-2020) announced
by different OEMs particularly for models with a foreseen price below $ 50000 and with
50
a reasonable driving range When the exact vehicle price is not fully disclosed by OEMs
estimations based on similarprevious models are provided when possible The realistic
range in km is similarly provided A list of upcoming BEV and PHEV models filed below
while not exhaustive can reflect expected future trends in the automotive industry (see
Table 6)
Table 6 Price and range of upcoming EV models (2017-2020) as announced by OEMs differentiated by region
EU US JP KR CN
Brand Model Year of release Price [$] Range [km]
BMW Updated BMWi3 2017 lt 50000 200
Renault Updated Zoe 2017 ~ 35000 300
Daimler Updated Smart
ForTwo electric 2017 lt 30000 100
Tesla Model 3 2018 lt 40000 300
GM Chevrolet Bolt 2017 lt 40000 300
Ford Ford Focus
Electric 2017 lt 30000 150
Nissan Nissan Leaf
version 2017 2017 gt 30000 150
Nissan Nissan Leaf
version 2018 2019 lt 40000 300
Mitsubishi eX SUV 2019 lt 40000 300
Hyundai Ioniq model
BEV 2017 lt 35000 150
Kia Update of Soul
Electric 2018 ~ 35000 150
BYD BYD Qin EV300
BEV model 2017 ~ 35000 240
51
Among European OEMs BMW is announcing a new strategy where a further advance in
e-mobility is foreseen [100] In 2017 a new version of the BMW i3 will be launched with a
range of around 200 km [101] and its price is expected to be below $ 50000 [102]
Renault has announced delivery of a new version of the Renault ZOE in 2017 which will
have a driving range of up to 300 km The price with the battery on sale option should
be around $ 35000 [103]
Daimler is investing more than euro7 billion ($B 79) in green technologies in the next two
years alone As part of this strategy Mercedes-Benz will expand its PHEV fleet (GLC
Coupeacute 350 e 4MATIC E 350 e S 500 e) by 2018 [104] with all models priced well
above $ 50000 Daimler will also launch a new Smart ForTwo electric vehicle in 2017
with a range of 100 km [105] whose price is expected to be well below $ 30000 [106]
Volkswagen has confirmed its strategy to launch over 20 additional electric vehicle
models by 2020 but without disclosing concrete proposed models [60 107] Within the
group the brand Audi announced the launch by 2018 of the first large‑series battery‑
electric vehicle based on the PHEV Audi e-tron concept The models however have not
been released yet [61]
PSA Peugeot Citroeumln and Dongfeng Group (CN) have strengthened their strategic
partnership with the signing of a new agreement to design an electric version of the
Common Modular Platform (CMP) This future electric platform (e-CMP) will deliver all-
electric vehicles for the Peugeot Citroeumln DS and Dongfeng brands from 2019 However
no concrete model has been presented yet [57]
Outside Europe other automotive OEMs are proposing several electric vehicle models to
be launched in the next 2 - 3 years
Tesla is anticipated to be the worldwide frontrunner with the launch of the Tesla Model 3
announced for 2018 It will be priced below $ 40000 with a driving range above 300 km
[108]
Looking at other US OEMs General Motors will launch the Chevrolet Bolt in 2017 which
will also be priced below $ 40000 and with a driving range above 300 km [109] Ford
will not try to compete with the other two US OEMs in terms of driving range but rather
deliver lighter vehicles with a range of around 150 km at a more affordable price
estimated to be below $ 30000 (eg the new Ford Focus Electric to be launched in 2017)
[110]
Among Japanese OEMs Nissan is going to launch an updated version of Nissan Leaf in
2018-2019 with a driving range of 300 km and with a price estimated below $ 40000
52
[111] Before then the 2017 Nissan Leaf version is expected to have a driving range of
150 km and a price above $ 30000 [112]
Toyota has been reluctant to take on board the full electric vehicle concept with its
strategy focusing instead on HEV and PHEV for short-range urban applications and fuel
cell electric vehicles for longer-range applications However with the steady arrival of
competing battery-electric vehicles with ever increasing driving ranges (eg Chevrolet
Bolt EV Tesla Model 3) Toyota appears to be adjusting its thinking They recently
decided to establish an in-house venture company responsible for developing electric
vehicles (EVs) by 2020 [113] However no concrete models are expected to be launched
in the next 2 - 3 years other than new update versions of their PHEV fleet [114]
Thereafter by 2020 Toyota has announced plans to introduce a small all-electric SUV
[115]
Mitsubishi has announced the launch of the new eX SUV Concept in 2018-2019 with a
range above 300 km and a price below $ 40000 [116]
South Korean OEMs Hyundai and its sister company Kia together have aggressive plans
to become the worlds second highest-volume maker of green cars by 2020 after Toyota
Although HEV and PHEV models will be a substantial part of this plan full electric models
are also foreseen Hyundai is joining the race with a new all-electric SUV with 150 km
range by 2018 [117] but price pictures and previews are not available Hyundai has
also announced the launch in 2017 of the Ioniq model BEV with more than 150 km
driving range and a price below $ 35000 [118] Meanwhile Kia is preparing to launch a
new version of its Kia Soul Electric BEV in 2018 with an improved driving range close to
150 km and expected price of around $ 35000 [119]
Chinese OEMs are much more linked to delivery to the domestic market Looking at the
top 20 PHEV and BEV sales in 2016 (up to October) on the Chinese market [75] the only
non-Chinese electric vehicle model sold is the Tesla Model S (which ranks 17th) This
trend is expected to remain at least until 2020 mainly due to the competitive prices of
local models [120] Most sales are expected to be low-speed models (as is currently the
case eg Kandi Panda and Zotye E-2030 [89]) but also higher class vehicles such as
the new BEV version of the BYD Qin EV300 to be launched by 2017 with 240 km driving
range and price around $ 35000 [70]
352 OEMs Tier 1 and Tier 2 supply chain
The growing electrical vehicle market may be a challenge also for the consolidated EU
OEMs Tier 1 and Tier 2 supply chain industry which has an annual revenue amounting to
13 of the EU OEMs industry Electric vehicle manufacturers require suppliers of a range
of new components for electric power train other than cells and battery packs Such
53
components include connectors cables power electronics for controllers converters and
chargers novel system integration services innovative thermal management solutions
and new light materials for the car bodyframe such as aluminium or carbon fibre-
reinforced polymers OEMs need to build up a new set of suppliers for these products
which changes the traditional group of Tier 1 and Tier 2 suppliers (which are mainly
designing and producing parts for internal combustion engine powertrain such as pistons
camshafts spark plugs injection pumps turbo chargers fuel tanks alternators oil
pumps motor oils or manual and automatic gear boxes) The current status of Tier 1
OEMs suppliers shows a strong competitive position of EU companies with total revenue
of B$ 277 (see Table 7 and Figure 25) Besides that their manufacturing capacity is
globally distributed since their production plants for parts are normally located in the
proximity of OEMs vehicle assembling plants which are also distributed around the
globe The degree of manufacturing delocalization can be quantified looking at the
financials of the top 10 automotive suppliers with headquarters in Europe and North
America where it turns out that they generate 18 to 28 of revenues in Asia
supplying OEMs with their products [121] With a growing electrical vehicle market this
picture may change substantially and this competitive position of EU Tier 1 industry may
be challenged
Table 7 Geographical comparison of automotive suppliers 2014 financial indicators (figures in US$) [121]
54
Figure 25 4D analysis of top 20 automotive suppliers for EBIT margin (ratio of Earnings before Interest and Taxes to net revenue earned) and revenues (2014) [121]
The growing electrical vehicle market may create great opportunities for companies
accepting risks and willing to invest In this context besides the traditional OEMs
suppliers new companies are also supplying the car manufacturers Some traditional
suppliers are investing heavily in a range of new technologies relevant to e-mobility (eg
Continental (DE) Michelin (FR) ZF Friedrichshafen AG (DE)) or are looking to create
joint ventures with established companies already active in the e-mobility sector (eg
Bosch (DE)) Other companies traditionally operating in the industrial sector are also
becoming OEMs suppliers such as companies active in the power electronic field (eg
Semikron (DE) Mitsubishi (JP) Toshiba (JP) and Actia (FR)) or specialised in
convertercharger products (eg BRUSA Elektronik (CH) EDN GROUP (IT)) cable and
connectors (eg Lapp Holding AG (DE) Lem Holding SA (CH)) and electric engines (eg
Yasa Motors (UK) Sram Technology (IT) BorgWarner (USA)) Similarily companies who
traditionally supply the aerospace and military industry and who have already developed
suitable products and services for e-mobility (eg BAE Systems (UK) Ricardo (UK)) are
breaking into the OEM supply market In addition there are also companies providing
consulting services for system integration (eg AVL (AT) Lenze Schmidhauser (CH))
55
36 Recycling
Due to the constantly increasing significance of lithium ion batteries especially in the
growing automotive and energy storage sectors recycling processes and related issues
are highly relevant for the EU circular economy package [122] Greater recycling of
waste batteries and increased re-use or second use will bring benefits for both the
environment and the economy by boosting business and reducing waste Increased
recycling will also mitigate the dependence on certain critical materials such as cobalt
The Circular Economy Strategy is related to the transfer of the Extended Producer
Responsibility (EPR) and to the End-of-Waste status The EPR concept is aimed at
promoting the integration of environmental costs associated with goods throughout their
life cycles into the market price of the products The EU has issued a number of
directives aimed at increasing producer responsibility including the EU Battery Directive
(Directive 200666EC) [9] that introduces the EPR for battery waste The directive
enforces battery producers or third parties acting on their behalf to finance the net cost
of collecting treating and recycling waste batteries However the Directive needs to
consider the specificities of lithium-ion traction batteries in the absence of guidelines on
the transfer of ownership and changes to EPR with corresponding identification of
responsibilities for a second use option In addition the Battery Directive needs to be
harmonized with Directive 200053EC on end-of-life vehicles and with Directive
200898EC on waste (Waste Framework Directive)
Recycling of lithium-ion batteries is a complex and costly process hindered by the
absence of a standardised product across the lithium ion battery market which as a
result has a wide variety of chemistries and battery formats Furthermore additional
complexities arise from the need for dismantling and pre-treatment of large electric
vehicle batteries to reach sizes compatible with recycling process A comprehensive
overview of various steps in recycling processes is given in [22 123 124] Four types of
recycling technologies exist [22]
a) mechanical
b) pyrometallurgical
c) hydrometallurgical
d) thermal pre-treatment followed by hydrometallurgical method (often also called
a combination of pyrometallurgical and hydrometallurgical methods)
56
Mechanical treatment includes crushing and physical separation of components and
recovery of the black mass which contains valuable metals such as cobalt nickel
manganese lithium etc [22]
In pyrometallurgical processes spent Li-ion cells are processed at high temperature
without any mechanical pre-treatment as batteries are loaded into the furnace directly
This class of recycling process recovers cobalt nickel copper and iron in form of a metal
alloy Metals such as aluminium manganese and lithium are lost in the slag and plastic
and other organic components are incinerated [22]
Hydrometallurgical methods include mechanical pre-treatment and metal recovery from
the black mass by means of leaching precipitation solvent extraction ion-exchange
resins and bioleaching [22 123] In addition to cobalt nickel copper and iron
hydrometallurgical processes enable recovery of lithium with high purity
A hydrometallurgical process is often preceded by a thermal pre-treatment step (type d)
to remove organic compounds and graphite which adversely affect leaching and solid-
liquid separation steps of the recycling process [22]
At present the main focus in recycling of Li-ion batteries is the recovery of cobalt since
this metal has a high economic value and is a critical raw material for the EU [22] The
recycling rate of lithium from end-of-life products including batteries is currently below
1 according to the International Resources Panel [125] Nevertheless recovery of less
economically valuable metals including lithium may become viable in future [22]
Therefore RampI needs exist for improving the cost effectiveness of the recycling processes
and development of more efficient recycling processes
The efficiency of battery recycling is a combination of two factors collection rate and
recycling efficiency Collection rate expresses the fraction of produced lithium ion
batteries that are collected at their end-of-life while recycling efficiency is expressed as
the weight percentage of metals metal compounds plastics and other products
recovered from the collected waste that can be directly reused in battery production or in
other applications or processes Recycling efficiency is considered a key parameter for
assessing the quality of recycling however a methodology is not yet standardized for its
calculation Pre-normative research to develop standards and guidelines for collection
and transportation of used batteries as well as standards and guidelines for battery
second-use are needed
Efficiency of recycling for various elements in selected processes in terms of recovery
of different material are compared in Table 8
57
Table 8 Efficiency of recycling for various elements in selected processes for NMC and LFP
chemistries [75]
Material Combination of
pyrometallurgical amp
hydrometallurgical
processes - NMC and LFP
[]
Purely
hydrometallurgical
process - NMC only []
Purely
hydrometallurgical
process - LFP only
[]
Lithium 57 94 81
Nickel 95 97 NA
Manganese 0 ~ 100 NA
Cobalt 94 ~ 100 NA
Iron 0 NA 0
Phosphate 0 NA 0
Natural graphite 0 0 0
At present recycling of lithium ion batteries is mainly limited to portable batteries since
still there are no big volumes of waste electric vehicle battery that have reached their
end-of-life Spent Li-ion batteries are recycled industrially in many regions of the world
An overview of recycling companies and their processes is given in Table 9 Data was
compiled from various sources and where possible cross-checked with information on
the websites of the listed companies or by contacting listed companies directly
Table 9 Li-ion battery recycling companies processes and capacity Source [22 123 124 126 127]
Company
(HQ location)
Recycling
facility
location
Battery types Process Recycling
volume tons
of batteries
per year
Europe
Umicore Battery
Recycling(BE)
Hoboken (BE) Li-ion NiMH P 7000
Accurec Recycling
GmbH (DE)
Muumllheim (DE)
Krefeld (DE)
NiCd NiMH
Li-ion
P with H
1500-2000
58
treatment of
the slag and flu
e dust
6000
Glencore
(formerly
XStrata) (CH)
Sudbury (CA)
Rouyn-Noranda
(CA)
Kristiansand (NO)
Li-ion P with H
treatment of
the slag and
electrowinning
7000
Recupyl SA (FR) Grenoble (FR)
Singapore (SG)
Li-ion H 110
AEA Technology
(UK)
Sutherland (UK) Li-ion H
SNAM (FR) Saint Quentin
Fallavier (FR)
NiCd NiMH Li-
ion
P+ mechanical
separation + H
to extract Co
and Ni
300
AkkuSer Oy (FI) Nivala (FI) NiCd NiMH Li-
ion Zn alkaline
mechanical 1000 (Li-ion)
4000
Batrec Industrie
AG (CH)
Wimmis (CH) Li P + mechanical
treatment
200
Euro Dieuze
SARP (FR)
Dieuze (FR) Li-ion H 200
Valdi (ERAMET)
(FR)
Commentry (FR)
Various
including Li-ion
P 20000
(from 2017)
GampP Batteries
(UK)
Darlaston (UK) Various
including Li-ion
North America
Retriev Trail BC (CA) Li metal Li-ion H 4500
59
Technologies Inc
(CA)
Baltimore OH
(US)
Anaheim CA (US)
AERC Recycling
Solutions (US)
Allentown PA
(US)
West Melbourne
FL (US)
Richmond VA
(US)
All types
including Li-ion
and Li metal
P
Japan
Sony Electronics
Inc - Sumitomo
Metals and
Mining Co (JP)
Li-ion P 120-150
Nippon Recycle
Center Corp (JP)
Osaka (JP)
Aichi (JP)
Miyagi (JP)
Ni-Cd NiMH
Li-ion alkaline
P
Dowa Eco-System
Co Ltd (JP)
Various
including Li-ion
P 1000
JX Nippon Mining
and Metals Co
Various
including Li-ion
P 5000
China
Shenzhen Green
Eco-manufacturer
Hi-Tech Co
(GEM) (CN)
Jingmen
Hubei (CN)
NiMH Li-ion H 20000-
30000
Hunan BRUNP
(CN)
Ningxiang
Changsha Hunan
(CN)
Various
including NiMH
and Li-ion
H 3600-10000
gt6000
P ndash pyrometallurgical process H- hydrometallurgical process recycling capacity of the facility
60
In Europe companies such as Umicore (BE) and Recupyl (FR) active for several years in
the battery recycling sector have developed their own recycling processes Umicore has
developed a so-called Umicore process an ultrahigh temperature pyrometallurgical
process and runs a facility in Belgium with an annual capacity of 7000 tons of batteries
[21] Recupyl patented a hydrometallurgical recycling process which has a higher
material recycling efficiency (see Table 8) Accurec Recycling GmbH runs a facility Krefeld
(DE) recycling 1500-2000 tons of spent Li-ion batteries [22 128] Their annual capacity
for disassembly and subsequent recycling of Li-ion automotive batteries is more than 600
tons [128] Valdi (FR) a ERAMET Group subsidiary has transferred its battery recycling
facility from Le Palais-sur-Vienne (FR) to Commentry (FR) where batteries will be
recycled through a dedicated pyrometallurgical process [129] The unit will recover 100
of metal content enabling it to achieve a recycling efficiency target of 65 above the
minimum requirement of 50 stipulated by the EU Batteries Directive (Directive
200666EC) [129] From 2017 Valdi will have annual processing capacity of 20000
tons of batteries [130] AkkuSer Oy (FI) operates a battery recycling facility in Nivala
(FI) where Ni-Cd NiMH lead accumulators alkaline batteries and Li-ion batteries are
mechanically recycled in a so-called Dry-Technologyreg process [22 131] Annually about
1000 tons of spent Li-ion batteries coming from the European market are processed at
this facility [22]
In the United States there is no federal law governing EPR and each state may choose
to implement its own policy and laws California for example is pioneering a process for
waste regulation [132] but so far only portable batteries are considered and California
lacks the infrastructure to manage the forecasted volume of EV lithium ion batteries at
their end-of-life [133] Since 1996 a voluntary programme called Call2Recycle which is
funded by electronics manufacturers has recycled more than 385 million kilograms of
small consumer batteries and mobile phones in the US and Canada but this is still just a
tiny fraction of the total [134] In Canada provinces of British Columbia Quebec and
Manitoba have a mandatory recycling programme and in these places Call2Recycle
collects about 25 of what is sold [134] Retriev Technologies Inc (former Toxco Inc)
which has developed its own hydrometallurgical process is a leading battery recycling
company in Canada and the US Over the past 20 years Retriev has processed more
than 10000 tons of lithium ion batteries Retriev is researching a new recycling method
for Li-ion batteries called direct recovery originally developed by OnTo Technology a
research and development company in Bend (Oregon USA) [134] As explained in
[134] Rather than recovering basic elements as with pyrometallurgy or partially
breaking down the molecular structure of compounds as with hydrometallurgy this
method involves bathing the cathode in a soft chemical solution to rejuvenate it It is a
61
low-temperature low-energy low-emissions process with very limited waste Recycling
using this process is also significantly cheaper compared to conventional pyro- and
hydrometallurgical processes [134] Most of the cost savings come from not having to
rebuild the cathode again as materials are retained in their battery-ready state and since
direct recovery uses less energy than conventional methods [134]
Looking at the Asian region Japan has a legislation requirement for batteries similar to
the EU [135] Japan Portable Rechargeable Battery Recycle Center (JBRC) non-profit
organization provides used battery collection boxes across the country Companies such
as Sony and Nippon Recycle Center Corporation are contracted to receive these batteries
for recycling There are also contracts directly with companies to collect and recycle their
end-of-life batteries as well as battery production scrap material [136]
In China there is currently a shortage of appropriate policies and collection systems for
batteries despite of a growing community concern about the impact of waste lithium ion
batteries on the environment and public health Industry is increasingly expected to
report on and be accountable for the waste their products generate Furthermore the
criticality of some raw materials such as nickel and cobalt puts more pressure on
manufacturers and government to properly address battery recycling Therefore
appropriate policies and collection systems for batteries in China need to be defined and
recycling infrastructure also needs to be developed [137] Some Chinese companies are
active in the battery recycling business such as GEM Jingmen and BRUNP Hunan GEM
has an annual disposal capacity of waste batteries and Co and Ni scrap of about 30000
tons with an annual production of recycled cobalt and nickel more than 3300 tons [137]
A facility of BRUNP Hunan has a total designed processing capacity of 10000 tons per
year
62
4 Conclusions
This report has gathered data on the automotive traction battery value chain with a view
to underpin decisions where European RampI investments are needed considering where
these can create opportunities to boost European competitiveness in the automotive
battery sector On the basis of this data a number of opportunities for increased RampI
support in specific areas of the automotive battery value chain which may help achieve
the objective for increased European competitiveness in this sector have been identified
and are highlighted below
OEMs are facing increasingly stringent emission targets and they will need to consider
greater investment in efficient powertrain technologies going beyond optimization of the
internal combustion engine Furthermore OEMs are looking at evolving consumer
purchasing behaviour and electrical vehicle acceptance which may soon become relevant
in global sales How European OEMs will adjust their strategies varies however a growing
electrical vehicle market may justify growing RampI effort to support a competitive
domestic manufacturing in relevant segments of the value chain including cells for use in
vehicle battery packs
The information provided in this report shows that EU industry has some production base
in all segments of the battery value chain but it is far from being self-sufficient In the
raw and processed materials cell component and cell manufacturing value chain
segments Europe holds a minor share of the market whereas in the pack and vehicle
manufacturing and recycling segments Europe is among the market leaders Within the
car manufacturing segment EU industry is expected to maintain its position also for EV
production
European OEMs and their Tier 1 and Tier 2 suppliers need to be prepared to satisfy the
future demand for electric vehicles as projections for global electrical vehicle sales up to
2040 show an increase in demand Many European Tier 1 and Tier 2 automotive OEM
supply industries currently serving the ICE market are demonstrating their ability to
adapt and respond to new opportunities presented by the growing electrical vehicle
market This flexibility should be supported given the dynamic needs of their OEM
customers many of whom are still developing their own strategy on what part of pack
manufacturing to outsource
Support to RampI in this sector can help existing and new Tier 1 and Tier 2 industries
innovate and increase their flexibility and hence maintain a competitive edge
63
In the recent past the numbers of EV sales did not meet the anticipated level and for the
majority of European OEMs this may have been one reason not to start and sustain
private investments in competitive domestic cell manufacturing
Another factor which has discouraged large scale European cell manufacturing and which
is often cited by car manufacturers is the current global cell manufacturing overcapacity
Nevertheless looking to the future the current over-capacity in itself should not prelude
investments in this area since projections for large penetration of EV indicate that
automotive lithium-ion cell demand and supply may soon be matched (by around 2020)
To become competitive in this time frame however consolidated RampI action at a
European level is required in the short term to secure Europes strong industrial position
in pack manufacturing in the future
Current projections indicate a research trend to develop improved (eg higher voltage)
cells for automotive use based on conventional Li-ion chemistries such as NMC and LFP
The general approach being adopted is to develop advanced materials (eg silicon
enriched anode solid state electrolytes) rather than developing new chemistries at least
until 2025 These improved technologies are speculated to transition by 2030 towards
post Li-ion technologies (Li-air Li-S Na-ion) once their performance is proven in
automotive applications Li-ion technology is therefore expected to remain as the
dominant deployed technology at least until 2025 - 2030
RampI investments in improved contemporary chemistries from materials up to large scale
cell manufacturing capabilities are needed to satisfy the current incremental
performance improvements needed
Similar RampI investments are needed for post-lithium ion chemistries to allow sufficient
time for their development and subsequent translation into a manufacturing process to
realise significant improvements in performance
Failure to invest the necessary resources in this way will only prolong and exaggerate
Europes historical deficit in competitive cell manufacturing which may also threaten
Europes knowledge base which has the tendency to move where production sites are
located
Secure access to materials used in cell manufacture is a fundamental prerequisite if
Europe is to become competitive in this segment Issues associated with access and use
64
of critical materials for cell production can be addressed by (i) tapping new sources of
critical materials (ii) substituting critical materials with less critical ones and (iii)
recyclingreuse of critical materials
RampI support to develop new miningextraction techniques may alleviate potential supply
concerns for materials where reserves are located outside the EU territories
RampI on alternative Li-ion chemistries made of more accessible raw materials could cover
development of alternative chemistries to alleviate the need for the critical materials
cobalt and natural graphite
With regard to lithium projections suggest that reserves are sufficient to satisfy the
increase in demand brought about by increased use of batteries for automotive purposes
Benefits gained from mitigating dependence on critical materials will not be limited to the
raw material sector but and maybe most importantly can enhance opportunities for the
EU industry to break the foreign monopoly in the cell manufacturing sector by
substitution of materials
A sector where EU industry has a strong and dominant position is in the battery recycling
part of the value chain EU pioneering legislation in this area has made it possible to
develop a well-structured industry Recycling also helps alleviate concerns on the
security of supply of critical raw materials used in batteries However the battery
recycling sector is currently struggling to prepare for increased volumes of battery waste
expected from the automotive traction sector
RampI needs exist for improving the cost effectiveness of the recycling processes
development of more efficient processes pre-normative research to develop standards
and guidelines for collection and transportation of used batteries as well as standards and
guidelines for battery second-use
Opportunities for increased European RampI support in areas other than those identified in
this report may also exist including battery RampI for applications other than automotive
When pursued targeted and strategic RampI efforts should be performed in an integrated
approach to leverage the knowledge generated in a cost-effective and innovation-
enhancing manner
65
5 References
1 COM (2015) 6317 final -Towards an Integrated Strategic Energy Technology (SET)
Plan Accelerating the European Energy System Transformation EUROPEAN
COMMISSION Brussels
2 Declaration of Intent for Action 7 of the Integrated SET-Plan Become competitive in
the global battery sector to drive e-mobility forward Available from
httpssetiseceuropaeuimplementing-integrated-set-planbatteries-e-mobility-and-
stationary-storage-ongoing-work
3 Systems Perspectives on Electromobility 2013
4 COM(2014) 297 final On the review of the list of critical raw materials for the EU
and the implementation of the Raw Materials Initiative Communication from the
Commission to the European Parliament the Council the European Economic and
Social Committee and the Committee of the Regions
5 Pillot C The worldwide rechargeable battery market 2015-2025 June 2016
Avicenne Energy
6 Chung D Elgqvist E Santhanagopalan S Automotive Lithium-ion Cell
Manufacturing Regional Cost Structures and Supply Chain Considerations April
2016 Clean Energy Manufacturing Analysis Center (CEMAC)
7 Chung D Elgqvist E Automotive Lithium-ion Batteries in 2015 Research
Highlights CEMAC (CEMAC) Editor March 2016
8 Pillot C Battery Market for Hybrid Plug-in amp Electric Vehicles 25th Edition -
Avicenne Energy 2016
9 Directive 200666EC of the European Parliament and of the Council on Batteries and
Accumulators and waste batteries and accumulators and repealing Directive
91157EEC 2006 OJ L2661 26 September 2006
10 Eurostat
11 ACEA - Statistics Available from httpwwwaceabestatistics
12 BIR (Bureau of International Recycling) Available from httpwwwbirorg
13 Report on critical raw materials for the EU report of the Ad hoc working group on
defining critical raw materials D ENTR Editor 2014
14 Annexes to the report on critical raw materials for the EU report of the Ad hoc
working group on defining critical raw materials D ENTR Editor 2014
15 US Geological Survey Minerals Information Cobalt Statistics and Information
Mineral Commodity Summaries January 2016 Available from
httpmineralsusgsgovmineralspubscommoditycobaltindexhtmlmcs
16 US Geological Survey Minerals Information Graphite Statistics and Information
Mineral Commodity Summaries January 2016 Available from
httpmineralsusgsgovmineralspubscommoditygraphite
17 US Geological Survey Minerals Information Silicon Statistics and Information
Mineral Commodity Summaries January 2016 Available from
httpmineralsusgsgovmineralspubscommoditysilicon
66
18 US Geological Survey Minerals Information Lithium Statistics and Information
Mineral Commodity Summaries January 2016 Available from
httpmineralsusgsgovmineralspubscommoditylithium
19 US Geological Survey Minerals Information APPENDIX CmdashReserves and
Resources 2016 Available from
httpmineralsusgsgovmineralspubsmcs2016mcsapp2016pdf
20 Fichtner M and E Sheridan Novel Materials for Electrochemical Storage in EERA
Workshop2016 Brussels
21 Reuter B et al Future Resource Availability for the Production of Lithium-Ion
Vehicle Batteries 2014
22 Chagnes A and J Swiatowska eds Lithium Process Chemistry Resources
Extraction Batteries and Recycling 2015 Elsevier Amstedam
23 Hocking M et al Industry - Lithium 101 - Welcome to the Lithium-ion Age FITT in
Markets Research9 May 2016 Deutsche Bank
24 Bernhart W Powertrain 2020 The Li-ion battery value chain ndash trends and
implications 2011
25 Cost and performance of EV batteries in 2012 Element Energy Limited - The
Committee on Climate Change Cambridge p 100
26 Anderman M Tesla battery report 2014 Advanced Automotive Batteries p 39
27 Pillot C The rechargeable battery market and main trends 2014-2015 in Batteries
2015 - 2015 Nice France
28 Pillot C Battery Market Development for Consumer Electronics Automotive and
Industrial Materials Requirements and Trends in Qinghai EV Rally 20152015
Xining China
29 httpwwwlitarioncomindexhtml
30 Tikekar MD et al Design principles for electrolytes and interfaces for stable
lithium-matl batteries Nature Energy September 2016 1
31 Janek J and WG Zeier A solid future for battery development Nature Energy
September 2016 1
32 Pang Q et al Advances in lithium-sulfur batteries based on multifunctional
cathodes and electrolytes Nature Energy 2016 1 p 1-11
33 Aurbach D et al Advances in understanding mechanisms underpinning lithium-air
batteries Nature Energy 2016 1 p 1-11
34 Roadmap integrierte Zell- und Batterieproduktion Deutschland January 2016
Nationale Platform Elektromobilitat (AG 2 - Batterietechnologie) Berlin
35 EUROBAT e-mobility - Battery RampD Roadmap 2030 - Battery Technology for Vehicle
Applications 2015 EUROBAT p 36
36 E-mobility index Q3 2015 FKA and Roland Berger
37 Chung D Elgqvist E Santhanagopalan S Automotive Lithium-ion Battery (LIB)
Supply Chain and US Competitiveness Considerations June 2015 Clean Energy
Manufacturing Analysis Center (CEMAC)
67
38 DChung National Renewable Energy Laboratory (NREL) Personal communication
May 2016
39 httpwwwtotalcomenmedianewspress-releasestotal-takes-control-saft-groupe-
after-successful-tender-offer-which-will-be-re-opened-july-19-august
40 httpwwwsaftbatteriescompresspress-releasessaft-takes-control-nersac-lithium-
ion-battery-factory
41 Schamp EW The formation of a New Technological Trajectory of Electric
Propulsion in the French Automobile Industry Discussion Paper 122014 2014
German Development Institute Bonn
42 httpwwwabslspaceproductscomDefaultaspxpid=2
43 httpwwwagmbatteriescom
44 httpwwwleclanchecomtechnology-products
45 httpeas-germanyde
46 Pillot C Personal communication September 2016
47 httpencustomcellsde
48 httpswwwssl-energiedeproduktespeichern (in German only)
49 httpliacon-batteriesdezelltechnologie-3lang=en
50 httpwwwvarta-
microbatterycomfileadminuser_uploadmb_datacms_datanews_data1264f_16102
5_VARTA_PM_Electronica_ENGpdf
51 httpwwweuropeanbatteriescom
52 httpwwwlithium-systemscomproducts
53 httpwwwelectric-vehiclenewscom201411germany-exits-ev-battery-cellhtml
54 httpwwwieahevorgby-countryfrance-industry
55 httpsenwikipediaorgwikiRenault_Zoe
56 httpinsideevscomrenault-zoe-electrifies-the-flins-factory
57 httpwwwnissan-globalcomENNEWS2009_STORY091208-01-ehtml
58 httpeconomicosapoptnoticiasrenault-admite-projectos-para-antigo-espaco-para-
baterias-da-nissan_210018
59 httpinsideevscomlg-chem-build-battery-plant-europe
60 httpevobsessioncomlg-chem-to-open-ev-battery-factory-in-wroclaw-poland-my-
city
61 httpenkipostnetproductSamsung-established-EV-Battery-Factory-in-East-Europe-
seeking-Korean-China-East-Europe-triangle319
62 A Review of Battery Technologies for Automotive Applications 2013 EUROBAT
63 httpwwwautonewscomarticle20160225COPY01302269992daimler-declines-to-
invest-in-battery-cell-production
64 httpwwwsueddeutschedewirtschaftelektromobilitaet-der-staat-zahlt-mit-
12842354-2
68
65 httpwwwgreencarreportscomnews1104237_vw-to-make-big-electric-car-
commitment-battery-factory-too
66 httpwwwdwcomenvw-mulls-e-battery-factory-of-its-owna-19285371
67 Altenburg T From combustion engines to electric vehicles a study of technological
path creation and disruption in Germany2014 Dt Inst fuumlr Entwicklungspolitik
68 httpwwwautocarcoukcar-newsindustrynissan-invests-C2A3265m-
sunderland-battery-plant
69 httpwwwnissan-
globalcomENENVIRONMENTCARFUEL_BATTERYDEVELOPMENTLITHIUM
_ION_BATTERY
70 httpwwwjmbatterysystemscomcompanyabout-us
71 my renault zoe Available from httpmyrenaultzoecomindexphp201609
72 httpwwwaccumotivedeenhome-englischhtml
73 httpevobsessioncomdaimler-putting-e500-million-into-second-lithium-ion-battery-
plant-in-germany
74 SEC(2011) 1609 final - Materials Roadmap Enabling Low Carbon Energy
Technologies in Commission Staff Working Paper European Commission
75 httpev-salesblogspot JP- Available from httpevobsessioncom
76 hybridcars Available from httpwwwhybridcarscomkreisel-electric-gaining-
attention-from-automakers-looking-to-join-the-electric-car-revolution
77 httpwwwcontinental-
corporationcomwwwpressportal_com_enthemespress_releases3_automotive_grou
ppowertrainpress_releasespr_2008_09_24_liion_batteries_enhtml
78 httpwwwbmz-gmbhdepresspress-releases024545568html
79 Press Release Samsung SDI available at httpwwwsamsungsdicomsdi-
news379htmlpageIndex=1ampidx=379ampsearchCondition=0ampsearchKeyword=
80 Prosnigg F Key topics regarding safety out of automotive PHEV battery serial
development in Batteries 20142014 Nice France
81 Thanner HJ Development and Production of Li-ion Battery Packs for Transport
Application An Industry Perspective in 8th A3PS Conference Eco-Mobility
20132013 Vienna Austria
82 httpsenwikipediaorgwikiBollorC3A9_Bluecar
83 httpwwwoicanetcategoryproduction-statistics
84 Pillot C The Rechargeable Battery Market and Main Trends 2014-2025 in 32nd
International Battery Seminar amp ExhibitMarch 9 2015
85 Finance BNE Q1 2016 Global Electrified Transport Market Outlook February
2016
86 European Alternative Fuels Observatory httpwwweafoeu
87 Towards Low-Emission Mobility in European Political Strategy Centre (EPSC)
Strategic Notes20 July 2016 p 1-9
69
88 Global EV Outlook 2015 2015 IEA (International Energy Agency) p 1
89 Overview Document - Strategic Energy Technology (SET) Plan Towards an
Integrated Roadmap RampI challenges and Needs of the EU Energy System 2014
EUROPEAN COMMISSION Brussels p 54
90 Will solar batteries and electric cars re-shape the electricity system 2014 UBS p
58
91 Finance BNE Heres How Electric Cars Will Cause the Next Oil Crisis available
from httpwwwbloombergcomfeatures2016-ev-oil-crisis February 2016
92 Finance BNE press-release Electric vehicles to be 35 of global new car sales by
2040 available from httpaboutbnefcompress-releaseselectric-vehicles-to-be-35-
of-global-new-car-sales-by-2040 2016
93 European Commission - 2030 climate amp energy framework Available from
httpeceuropaeuclimapoliciesstrategies2030_en
94 Californiarsquos New Climate Legislation What Does it Mean for Electric Cars
Available from httpblogucsusaorgdave-reichmuthcalifornias-new-climate-
legislation-what-does-it-mean-for-electric-
cars_ga=1104530118778381001480416715
95 China to toughen vehicle emissions standards Available from
httpasianikkeicomPolitics-EconomyPolicy-PoliticsChina-to-toughen-vehicle-
emissions-standardspage=1
96 Europe When every gram counts 2015 PWC
97 van der Slot A et al Integrated Fuels and Vehicles Roadmap to 2030 and beyond
2016 Roland Berger
98 Toyota 2017 Mirai fuel cell vehicle remains $57500 312-mile electric range
Available from httpwwwgreencarcongresscom20160920160921-miraihtml
99 Singer M Consumer Views on Plug-in Electric Vehicles ndash National Benchmark
Report 2016 NREL (National Renewable Energy Laboratory)
100 Gallagher KG et al PHEV and EV Battery Performance and Cost Assessment
Presented at the 2015 US DOE VEHICLE TECHNOLOGIES OFFICE ANNUAL
MERIT REVIEW AND PEER EVALUATION MEETING June 9 2015 Argonne
National Laboratory
101 Longer Range All-New 2018 BMW i3 To Launch Next Year ndash Welt am Sonntag
Available from httpinsideevscomrumor-longer-range-new-2018-bmw-i3-launch-
next-year
102 BMW crams more batteries into compact 2017 i3 boosts range to 112 miles
Available from httpswwwcnetcomroadshowauto2017-bmw-i3preview
103 NEW Renault Zoe ZE 40 NEDC Range Specs Price Review Available from
httphanditechrenault-zoe-ze-40-2017-electric-car
104 Daimler investing gteuro7B in next 2 years in green tech fuel cell plug-in BEV
architecture 48V Available from
httpwwwgreencarcongresscom20160620160613-daimlerhtml
70
105 2018 Smart ForTwo Electric Drive details released before Paris Motor Show
Available from httpwwwgreencarreportscomnews1106298_2018-smart-fortwo-
electric-drive-details-released-before-paris-motor-show
106 Tackling the mean streets of Miami in Smarts pint-size electric car Available from
httpswwwcnetcomroadshowauto2017-smart-fortwopreview
107 STAKEHOLDER PRESENTATION VOLKSWAGEN AG June 21st 2016 European
Commission - European approach on battery cell production Brussels
108 TESLA MODEL 3 PERFORMANCE SPECS AND NEWS
109 2017 Chevy Bolt EV price electric car starts at $37495 before incentives (as
promised) Available from httpwwwgreencarreportscomnews1106177_2017-
chevy-bolt-ev-price-electric-car-starts-at-37495-before-incentives-as-promised
110 Next Nissan Leaf confirmed for 60-kwh battery 200 miles of range Available from
httpwwwgreencarreportscomnews1104610_next-nissan-leaf-confirmed-for-60-
kwh-battery-200-miles-of-range
111 Next Nissan Leaf EV will hit 200-mile range just like Chevy Bolt Tesla Model 3
Available from httpswwwextremetechcomextreme230550-next-nissan-leaf-ev-
will-hit-200-miles-just-like-chevy-bolt-tesla-model-3
112 2017 NISSAN LEAF PRICE RANGE amp RELEASE DATE
113 Toyota battery RampD will allow all-electric car in a few years likely 2020 Available
from httpwwwgreencarreportscomnews1107466_toyota-battery-rd-will-allow-
all-electric-car-in-a-few-years-likely-2020
114 Toyota to Establish In-house Venture Company for EV Development Available from
httpnewsroomtoyotacojpendetail14281296
115 httpwwwgreencarreportscomnews1107466_toyota-battery-rd-will-allow-all-
electric-car-in-a-few-years-likely-2020
116 Mitsubishi eX SUV Concept Available from http2016bestsuvscommitsubishi-ex-
suv-concept
117 Hyundai to launch all-electric SUV in 2018 with 200-mile range
118 2017 Hyundai Ioniq Electric To Feature 110 Mile Range Available from
httpevobsessioncom2017-hyundai-ioniq-electric-to-feature-110-mile-range
119 The importance of 2017 Kia Soul EV Available from
httppushevscom20160827the-importance-of-2017-kia-soul-ev
120 Skepticism surrounds China EV boom Available from
httpwwwautonewscomarticle20160501GLOBAL03305029967skepticism-
surrounds-china-ev-boom
121 Seider C AUTOMOTIVE 40 Sensing the road ahead for tier 1 suppliers December
2015 NTT DATA Deutschland - wwwnttdatacomde Munich
122 Dr Axel Thielmann AS Prof Dr Ralf Isenmann Prof Dr Martin Wietschel Dr
Patrick Ploumltz Product Roadmap Lithium-Ion Batteries 2030 2013 Fraunhofer
Institute for Systems and Innovation Research ISI p 20
123 Swain B Recovery and recycling of lithium A review Separation and Purification
Technology 2017 172 p 388-403
71
124 European Li-Ion Battery Advanced Manufacturing for Electric Vehicles in ELIBAMA
project report available from httpselibamafileswordpresscom201410v-d-
batteries-recycling1pdf2014
125 Reuter MAH C van Schaik A Heiskanen K Meskers C Hageluumlken C Metal
Recycling Opportunities Limits Infrastructure A Report of the Working Group on
the Global Metal Flows to the International Resource Panel 2013 United Nations
Environment Programme (UNEP)
126 Ellis TW and AH Mirza Battery Recycling defining the market and identifying
the technology required to keep high value materials in the economy and out of the
waste dump Available at
httpswwwnistgovsitesdefaultfilesdocumentstipwppswp245_battery_recycling_
defining_the_marketpdf
127 Saloojee F and J Lloyd Lithium Battery Recycling Process Available from
httpwwwsagreenfundorgzawordpresswp-contentuploads201507Lithium-
Battery-Recycling-Literature-Review-CM-Solutionspdf 31 March 2015 Crundwell
Management Solutions (PTY) LTD South Africa
128 httpwwwaccurecdeabout
129 Valdi Newsletter No7 available at
httpwwwerametcomsitesdefaultfilesvaldi_newsletter_7enpdf June 2016
130 httpwwwerametcomenvaldi-recycling-catalysts-batteries-and-metal-oxides
131 httpwwwakkuserfienservicehtm
132 Dr Axel Thielmann AS Prof Dr Ralf Isenmann Prof Dr Martin Wietschel
Technology Roadmap Energy storage for Electric mobility 2030 2013 Fraunhofer
Institute for Systems and Innovation Research ISI p 32
133 William Tokash AD Executive summary Market Data Advanced Batteries for
Utility-Scale Energy Storage 2016 Navigant research
134 Gies E Lazarus batteries Nature 2015 526 p S100-S101
135 BATTERY STORAGE FOR RENEWABLES MARKET STATUS AND TECHNOLOGY
OUTLOOK 2015 International Renewable Energy Agency (IRENA) p 60
136 httpwwwrecycle21cojprecycle-eservicedetailhtml
137 Zeng X J Li and L Liu Solving spent lithium-ion battery problems in China
Opportunities and challenges Renewable and Sustainable Energy Reviews 2015 52
p 1759-1767
72
List of abbreviations and definitions
LCO Lithium Cobalt Oxide ndash Cathode Material
NMC Nickel Manganese Cobalt Oxide ndash Cathode Material
NCA Nickel Cobalt Aluminium Oxide ndash Cathode Material
LFP Lithium Iron Phosphate - Cathode Material
LMO Lithium Manganese Oxide (spinel) ndash Cathode Material
EV Electric Vehicle
HEV Hybrid Electric Vehicle
PHEV Plug-in Hybrid Electric Vehicle
BEV Battery Electric Vehicle
ICE Internal Combustion Engine
CAGR Compound Annual Growth Rate
GWh Giga Watt Hour
kWh Kilo Watt Hour
ESS Energy Stationary Storage
GHG Green House Gases
LME Lithium Metal Equivalent
LCE Lithium Carbonate Equivalent
EPR Extended Producer Responsibility
US United States
KR South Korea
JP Japan
EU European Union
CN China
CH Switzerland
DE Germany
FR France
NL Netherland
BE Belgium
IT Italy
73
List of figures
Figure 1 Automotive lithium-ion battery value chain (data from 2015) 6
Figure 2 Geographical distribution of Li resources and reserves Source [22] 11
Figure 3 Left ndash Development of the cathode active materials market in 2000-2015
Right ndashdemand division per material type and regional distribution of the manufacturers
(according to the location of the headquarters) in 2015 (Used with permission from
Avicenne Energy [5]) 13
Figure 4 Expected market volume per material type in 2025 (left) and as compared to
2015 (right) (Used with permission from Avicenne Energy) [5] 14
Figure 5 Development of the anode active materials market in 2006-2015 market
division per material type and regional distribution of the top-12 manufacturers of natural
and artificial graphite anode materials in 2015 (Used with permission from Avicenne
Energy [5]) 15
Figure 6 Forecast market division per anode active material type in 2025 (left) and as
compared to 2015 (right) (Used with permission from Avicenne Energy [5]) 16
Figure 7 Left ndash Development of the electrolyte market in 2000-2015 and right ndash
Regional distribution of the electrolyte producers in 2015 (Used with permission from
Avicenne Energy [5]) 17
Figure 8 World-wide demand and offer of electrolytes for Li-ion batteries (Used with
permission from Avicenne Energy [5]) 18
Figure 9 Electrolyte market forecast till 2025 (Used with permission from Avicenne
Energy [5]) 19
Figure 10 Left ndash Development of the separator market in 2005-2015 [5] and right ndash
Regional distribution of the separator producers in 2015 (Used with permission from
Avicenne Energy [5]) 20
Figure 11 Projected separator market growth (Used with permission from Avicenne
Energy [5]) 21
Figure 12 Forecasted battery technology evolution [34] 25
Figure 13 Market share of various Li-ion cell producers in 2015 left ndash in volume right ndash
in value (Used with permission from Avicenne Energy [5]) 27
Figure 14 Battery cell production capacity (Used with permission from Avicenne Energy
[5]) 35
Figure 15 Automotive Li-ion battery cell manufacturing capacity and utilization in 2014
Source[7 37] 36
Figure 16 Estimated electric vehicle Li-ion battery cell demand and global automotive
Li-ion battery cell manufacturing capacity [6] 37
Figure 17 Worldwide demand for automotive Li-ion battery cells in 2015-2025
Source[34] 38
Figure 18 Projected growth of Li-ion pack market (Used with permission from Avicenne
Energy [5]) 39
Figure 19 Cumulative volume of automotive battery pack sales by region of OEMs
headquarters [75] 42
Figure 20 Volume automotive battery pack sales by model and region of OEMs
headquarters [75] 43
Figure 21 Global market share of the top 20 PHEV and BEV producers based on [75]
(Producer is assigned to a region according to the location of its Headquarters eg
74
Toyota is considered to be a Japanese producer regardless of whether manufacturing is
taking place in Japan or elsewhere) 46
Figure 22 Projected global sales of new PHEV and BEV vehicles Source [5 8 34 75
90-92] 48
Figure 23 Projected global sales of new PHEV and BEV vehicles for 2015-2025 Source
[5 8 34 75 90-92] 48
Figure 24 Projected European sales of new PHEV and BEV vehicles for 2015-2025
Source [34 75 90] 49
Figure 25 4D analysis of top 20 automotive suppliers for EBIT margin (ratio of Earnings
before Interest and Taxes to net revenue earned) and revenues (2014) [121] 54
75
List of tables
Table 1 Main producers main source of import into EU substitutability index and
recycling rate of cobalt natural graphite silicon metal and lithium [4 15-18] 8
Table 2 Annual manufacturing capacity of Li-ion cells worldwide in 2014 [7 37] 29
Table 3 Annual manufacturing capacity of automotive Li-ion cells worldwide in 2016 [6
38] 30
Table 4 Li-ion cell actual production volume for 2015 and production capacity of
selected European manufacturers Source [5 40] [43] [44] [46] 33
Table 5 OEMs Battery pack manufacturing strategy 40
Table 6 Price and range of upcoming EV models (2017-2020) as announced by OEMs
differentiated by region 50
Table 7 Geographical comparison of automotive suppliers 2014 financial indicators
(figures in US$) [121] 53
Table 8 Efficiency of recycling for various elements in selected processes for NMC and
LFP chemistries [75] 57
Table 9 Li-ion battery recycling companies processes and capacity Source [22 123
124 126 127] 57
Europe Direct is a service to help you find answers
to your questions about the European Union
Freephone number ()
00 800 6 7 8 9 10 11
() The information given is free as are most calls (though some operators phone boxes or hotels may
charge you)
More information on the European Union is available on the internet (httpeuropaeu)
HOW TO OBTAIN EU PUBLICATIONS
Free publications
bull one copy
via EU Bookshop (httpbookshopeuropaeu)
bull more than one copy or postersmaps
from the European Unionrsquos representations (httpeceuropaeurepresent_enhtm) from the delegations in non-EU countries (httpeeaseuropaeudelegationsindex_enhtm) by contacting the Europe Direct service (httpeuropaeueuropedirectindex_enhtm) or calling 00 800 6 7 8 9 10 11 (freephone number from anywhere in the EU) () () The information given is free as are most calls (though some operators phone boxes or hotels may charge you)
Priced publications
bull via EU Bookshop (httpbookshopeuropaeu)

This publication is a Science for Policy report by the Joint Research Centre (JRC) the European Commissionrsquos
science and knowledge service It aims to provide evidence-based scientific support to the European
policymaking process The scientific output expressed does not imply a policy position of the European
Commission Neither the European Commission nor any person acting on behalf of the Commission is
responsible for the use that might be made of this publication
JRC Science Hub
httpseceuropaeujrc
JRC105010
copy European Union 2016
The reuse of the document is authorised provided the source is acknowledged and the original meaning or
message of the texts are not distorted The European Commission shall not be held liable for any consequences
stemming from the reuse
How to cite this report Lebedeva N Di Persio F Boon-Brett L Lithium ion battery value chain and related
opportunities for Europe European Commission Petten 2016
All images copy European Union 2016 unless otherwise specified
Title Lithium ion battery value chain and related opportunities for Europe
Abstract
Outline of automotive Li-ion battery value chain identifying current market volumes leaders and status of the
EU industry The EU industry is far from being self-sufficient in all segments of the value chain RampI investment
are essential to respond to new opportunities presented by the EV market
Printed in The Netherlands
i
Contents
Acknowledgements 1
1 Introduction 2
2 Automotive lithium-ion battery value chain 5
3 Value chain segments ndash status recent developments and opportunities 7
31 Raw and processed material 7
311 Cobalt 9
312 Natural graphite 9
313 Silicon metal 10
314 Lithium 10
32 Cell components manufacturing 12
321 Cathode materials 12
322 Anode materials 15
323 Electrolytes 17
324 Separators 19
325 Future cell chemistries 21
33 Cell manufacturing 26
331 Cell manufacturing ndash current status 26
332 Projected market growth 34
333 Global cell production over-capacity 35
34 Battery pack manufacturing 39
35 Electric vehicles manufacturing 45
351 Production volumes and deployment 45
352 OEMs Tier 1 and Tier 2 supply chain 52
36 Recycling 55
4 Conclusions 62
5 References 65
List of abbreviations and definitions 72
List of figures 73
List of tables 75
1
Acknowledgements
Authors gratefully acknowledge helpful discussions with C Pillot (Avicenne Energy)
M Krausa (Kompetenznetzwerk Lithium-Ionen Batterien eV (KLiB)) D Chung (National
Renewable Energy Laboratory) V Ries (DK Recycling and Roheisen) AD Devaney
(Albemarle Lithium) T Buhrmester (Rockwood Lithium GmbH an Albemarle Company)
D Klanecky (Albemarle Corporation)
Authors
Natalia Lebedeva
Franco Di Persio
Lois Boon-Brett
2
1 Introduction
Europe is on the cusp of an energy transformation - a transformation reducing energy
demand improving energy use efficiency and moving away from a high reliance on fossil
fuels to an increased use of renewable energy sources for power and heat production
and for transportation The economic impacts of the energy transformation are
important to consider as it should not hinder growth of the European economy - on the
contrary Europes ambition is to exploit its energy transformation as an opportunity for
high value job creation and increased economic output in addition to creating a more
secure and resilient energy system with an ambitious climate policy
Against this backdrop Europe has adopted the Energy Union Framework Strategy (COM
(2015) 80 final) as part of its commitment to bring about the transition to a low-carbon
secure and competitive economy The Energy Union Strategy is structured around five
closely interrelated and mutually reinforcing dimensions addressing (i) energy supply
security (ii) a fully-integrated energy market (iii) energy efficiency (iv) decarbonising
the economy and (v) research innovation and competitiveness
In September 2015 the Commission published a Communication on an Integrated
Strategic Energy Technologies Plan (SET-Plan) [1] This Communication defines a new
European RampI Strategy for the coming years and as such is the first deliverable on which
the fifth (v) dimension of the Energy Union will be built It provides the overall
framework for promoting strengthened cooperation in RampI between the European
Commission Member States and stakeholders such as research institutes universities
and industry (eg car manufacturers chemical industry mining industry battery
manufacturers collectors and recycling industry) in order to step up the efforts to bring
new and more efficient low-carbon technologies faster to the market and to deliver the
energy transition in a cost-competitive way Based on an integrated approach going
beyond technology silos the Integrated SET-Plan identifies 10 RampI Key Actions to
accelerate Europes energy system transformation The Integrated SET-Plan is
supported by the EU Industrial policy (COM(2014) 14 final) which aims to stimulate
growth and foster competitiveness in the manufacturing sector and the EU economy as a
whole by encouraging innovation through the support of actions related to innovation
and research
Key Action 7 of the Integrated SET-Plan (Become competitive in the global battery sector
to drive e-mobility forward) is one of two Key Actions dedicated to the pursuit of more
sustainable efficient low-emission transport systems explicitly identified in the fifth
dimension of the Energy Union Strategic RampI targets and priorities up to 2030 have
been set in Key Action 7 to strengthen European competences and capacities to become
competitive in the global battery sector
3
Similar as in other Key Actions these targets have been agreed in consultations between
the European Commission and European experts from industry academia and Member
States The targets are enshrined in a so-called Declaration of Intent [2] Targets set
in Key Action 7 aim at fostering research and innovation in the European battery sector
to make EU industry more competitive Unlike the other Key Actions which cover
exclusively research and innovation aspects Action 7 explicitly considers
competitiveness with respect to scaled-up manufacturing of higher performance
batteries Accordingly targets set in Action 7 cover not only battery technology
performance and cost parameters they also cover battery manufacturing and recycling
Ratified by the national representatives from the SET-Plan countries and the
Commission these targets help define the expected actions deliverables and time
frames for a co-ordinated RampIampC agenda in the European battery sector
Related to the competitiveness aspect of Key Action 7 a number of questions arise when
considering ways for Europe to co-ordinate its RampI efforts and where to invest available
research resources For example is it reasonable to assume that Europe could be
competitive in all segments of the battery value chain or should European RampIampC
investments focus on certain segments only Which segment could offer the best return
on investment in terms of the overall return to the European economy
Answering such strategic questions demands judicious consideration of the current
status and market outlook for electric vehicle batteries but also for batteries used in
other applications as well as of the position and competitive edge enjoyed by the
various global economies active in this sector The European Commissions Joint
Research Centre (JRC) has prepared the current report for this purpose This report
outlines the Li-ion battery value chain and indicates for each segment current market
volumes and leaders as well as the status of the EU industry This report does not
provide an exhaustive economic assessment with a detailed entry barrier analysis (eg
evaluation of market centralization rate capital requirements human resources
consumer purchase behaviour) for the return of the investments in terms of productivity
and global competitiveness Nevertheless the information can be used to help underpin
decisions regarding where RampI investments having the biggest impact in terms of
boosting European competitiveness can be made In this context the global dimension
of the battery sector should be considered bearing in mind the competition from the US
and Asia delocalization of manufacturing capacity and potential dispersion of the
knowledge base which has the tendency to move where production sites are located [3]
The scope of this report largely matches that of the Key Action 7 Declaration of Intent
which considers lithium ion and post lithium ion chemistries the most promising and
relevant chemistries for electrochemical energy storage in the time frame up to 2030
4
Contrary to the Declaration of Intent this report considers only automotive traction
battery applications for which relevant data on the current market situation position of
the main global players and future market outlook has been sourced Doing so does not
preclude the need or importance of battery RampI to advance the European position in
other applications such as for stationary energy storage where European
competitiveness can be further improved and enhanced Indeed development of
affordable and integrated energy storage solutions to accelerate full integration of
storage devices (including electrochemical) into a low-carbon energy system is explicitly
mentioned in addition to electro-mobility in the Accelerating Clean Energy Innovation
Communication (COM(2016) 763) As such it is one of the priority areas where future
EU funding under Horizon 2020 will be focused Notwithstanding this competitiveness
of the European battery sector for applications other than e-mobility is beyond the scope
of this report
5
2 Automotive lithium-ion battery value chain
Figure 1 illustrates the value chain for automotive Li-ion batteries The value chain is
divided into 6 segments spanning the spectrum from raw material mining to battery
recycling Mining and chemical industries provide the myriad of raw and processed
materials used in the production of the various cell components including the anode
cathode electrolyte and separator These components are then assembled in individual
cells Some materials are produced and used exclusively in Li-ion cell production while
others can be used for other purposes While the majority of the produced Li-ion cells
are assembled for use in portable electronic devices a fast growing share is destined for
use in battery packs for electric vehicles When batteries reach the end of life in their
first application they can be recycled or alternatively employed in a second use
application (eg for stationary energy storage)
In the following section each battery value chain segment is discussed highlighting key
figures and relevant industry revenues Revenues provided for cell component cell and
pack manufacturing refer to the global Li-ion battery industry whereas for other value
chain segments the relevant EU industry revenue is provided While revenues specific to
the Li-ion traction battery industry are still marginal its Compound Annual Growth Rate
(CAGR) for the upcoming years is quite significant
Where possible key global and European players have been identified for each segment
It is worth noting that activities of some companies cover different segments of the
value chain For instance some cell manufacturers also manufacture cell components
especially for the cathode while other players active in the recycling sector are also
active in the materials processing segment Furthermore the US electric vehicle
manufacturer Tesla demonstrates an approach to also lay claim on the manufacturing of
cells and battery packs
The data presented for all segments was at the time of publication of this report the
most up-to-date representative data retrievable by the authors However the extremely
dynamic nature of the market being considered is such that the absolute and relative
magnitude of the data reported is changing rapidly
In this report the term Automotive batteries refers to batteries on-board a vehicle used for traction and is used as a synonym of industrial batteries as defined in the Battery Directive 200666EU
6
Mo
st
Rele
van
t S
tati
sti
cs
51 43 88 40 31 50
Democratic Republic of
Congos share of global
cobalt production [4] -
a critical material for Li-
ion technology
Cathode revenue
as share of cell
components
market [5]
Asian share of Li-ion
cell manufacturing
market [6]
Share of pack
assembly cost over
the total battery pack
cost [7]
Automotive share of
Li-ion cell market in
volume (MWh) [8]
Recycling efficiency
for Li-ion batteries set
in the Battery
Directive [9]
Reven
ues
EU Mining and
quarrying industry
revenues B$ 19 [1]
EU Chemical industry
Revenues B$ 28 [1]
Global Li-ion cell
components
Industry revenues
B$ 7 [5]
Global Li-ion cell
manufacturing
revenues B$ 167
[5]
Global automotive
battery pack
manufacturing
revenues B$ 22 [5]
EU Automotive
industry
Revenues B$ 900
[10] 20 of
worldwide [11]
EU Waste collection amp
Recycling Industry
Revenues B$ 150
[10]
75 of worldwide
[12]
Figure 1 Automotive lithium-ion battery value chain (data from 2015)
Raw and processed materials
Cell component
manufacturing
Cell manufacturing
Battery pack manufacturing
Electric vehicle manufacturing
Recycling
7
3 Value chain segments ndash status recent developments and
opportunities
31 Raw and processed material
A wide range of elements is used in Li-ion battery cells including lithium (Li) nickel (Ni)
cobalt (Co) manganese (Mn) aluminium (Al) copper (Cu) silicon (Si) tin (Sn)
titanium (Ti) and carbon (C) in a variety of forms eg natural graphite These elements
are harvested from raw materials mined from the earths crust or recovered from surface
water
Some of these materials have a high economic importance while at the same time have
a high supply-risk and as such are termed critical raw materials (CRMs) [4] [13] [14]
The European Commission publishes a list of CRMs which is reviewed and updated every
three years As explained in the EC Communication [4] The purpose of the list is to
contribute to the implementation of the EU industrial policy and to ensure that European
industrial competitiveness is strengthened through actions in other policy areas This
should increase the overall competitiveness of the EU economy in line with the
Commissionacutes aspiration of raising industryrsquos contribution to GDP to as much as 20 by
2020 It should also help to incentivise the European production of critical raw materials
and facilitate the launching of new mining activities The list is also being used to help
prioritise needs and actions For example it serves as a supporting element when
negotiating trade agreements challenging trade distortion measures or promoting
research and innovation [4] A new CRM list is expected to be published in 2017
Among the materials used in Li-ion cells three are listed as CRMs namely cobalt
natural graphite and silicon (metal) [4] Uses current supply and forecasted availability
of each of these materials are reported in this section Similar information is also
reported for lithium even though it is not considered a CRM However for obvious
reasons availability and supply of lithium has a high impact on the Li-ion battery
industry Table 1 lists the main producers main European import sources the
substitutability indexdagger and the end of life recycling input rateDagger for each CRM and for
lithium
dagger lsquoSubstitutability indexrsquo is a measure of the difficulty in substituting the material scored and weighted across all applications Values are between 0 and 1 with 1 being the least substitutable Dagger lsquoEnd-of-life recycling input ratersquo measures the proportion of metal and metal products that are produced from end-of-life scrap and other metal-bearing low grade residues in end-of-life scrap worldwide
8
Table 1 Main producers main source of import into EU substitutability index and recycling rate
of cobalt natural graphite silicon metal and lithium [4 15-18]
Raw material Main
producers
(2014-2015)
Main sources
of imports
into the EU
(mainly 2012)
Substitutability
index
End-of-life
recycling
input rate
Critical raw materials used in Li-ion batteries
Cobalt Democratic
Republic of
Congo 51
China 6
Russia 5
Canada 5
Australia 5
Russia 96
(cobalt ores
and
concentrates)
USA 3
(cobalt ores
and
concentrates)
071 16
Natural
graphite
China 66
India 14
Brazil 7
China 57
Brazil 15
Norway 9
072 0
Silicon metal China 68
Russia 8
USA 5
Norway 4
Norway 38
Brazil 24
China 8
Russia 7
081 0
Non-critical raw material used in Li-ion batteries
Lithium Australia 41
Chile 36
Argentina 12
China 7
na na
9
311 Cobalt
Cobalt is used for a number of industrial applications such as in batteries superalloys
hard materials ndash carbides diamond tooling pigments catalysts magnets etc [14] Use
in batteries has the biggest share among these applications equivalent to around 37
[4] In Li-ion batteries cobalt is a component in several widely used cathode active
materials
Identified world terrestrial cobalt resources are about 25 million tons (for definitions of
resources and reserves please see [19]) More than 120 million tons of cobalt resources
have been identified in manganese nodules and crusts on the floor of the Atlantic
Indian and Pacific Oceans [15] At the beginning of 2016 world reserves were estimated
to be 71 million tons and total world production of cobalt in 2015 amounted to 0124
million tons [15] Just as in previous years production of cobalt in 2014-2015 was highly
concentrated Democratic Republic of Congo (DRC) continued to be the worlds leading
source of mined cobalt supplying 51 of the cobalt market volume (see Table 1) [15]
with China Russia Canada and Australia each having a much lower share (see Table 1)
[15] In addition to the high concentration of cobalt production there are further
concerns regarding the social aspects of cobalt mining in the DRC such as forced and
child labour and unsafe working conditions [20]
The vast majority of cobalt import into the EU comes from Russia (96 ) Cobalt has a
low substitutability (substitutability index for all applications is 071 and for batteries it is
08) and a reasonably low end-of-life recycling input rate for all applications of 16 [4]
The forecasted market balance for cobalt covering all applications until 2020 indicates a
small surplus while the market is forecasted to be balanced in 2020 (ie supply
matching demand within 1 ) [13] Longer term projections for penetration of electric
vehicles up to 2050 show that the cumulative demand for cobalt would require all the
resources known today even considering its relatively high recycling rate in the battery
sector However this estimation is based on the assumption that NMC technology
continues to be widely used up to 2050 [21] which is unlikely as gradual introduction of
other cobalt-free chemistries is expected in this time frame (see Future cell chemistries
section)
312 Natural graphite
Natural graphite is used in a number of industrial applications electrodes refractories
lubricants foundries and in batteries as anode active material [13] Application in
batteries has a relatively low share of 4 [13]
Worlds inferred resources exceed 800 million tons of recoverable graphite reserves of
natural graphite are estimated to be 230000 tons and world mine production in 2015
10
amounted to ca 1200 tons [16] Production of natural graphite is highly concentrated
with China producing 66 India 14 and Brazil 7 of the natural graphite market
volume (see Table 1) [16] The majority of natural graphite import into the EU comes
from China (57 ) followed by Brazil (15 ) and Norway (9 ) In some applications
natural graphite has a (very) low substitutability (substitutability index for all
applications is 072) but in batteries substitution of natural graphite by other materials
is feasible (substitutability index is 03) [13] The end-of-life recycling input rate of
natural graphite is 0
It is forecasted that the natural graphite market in 2020 will experience a large surplus
of production (ie supply exceeding demand by more than 10 ) [13]
313 Silicon metal
Silicon metal is widely used in the chemical pigments metallurgy and electronics
industries [13] Silicon metal and silicon alloys are also emerging as anode active
materials for Li-ion battery cells but at present their share is negligible compared to
other applications
World resources for making silicon metal and alloys are abundant and adequate to
supply world requirements for many decades The source of silicon is silica in various
natural forms such as quartzite The reserves in most major producing countries are
also ample in relation to demand but no quantitative estimates are available [17]
Worlds production of silicon metal in 2015 amounted to 8100 tons and was highly
concentrated with China producing 68 Russia 8 USA 5 and Norway 4 of the
silicon metal market volume (see Table 1) [17] The majority of silicon metal imported
into the EU comes from Norway (38 ) followed by Brazil (24 ) China (8 ) and
Russia (7 ) Silicon metal has a (very) low substitutability having a substitutability
index of 081 for all applications [13] The end-of-life recycling input rate of silicon metal
is 0 [13]
It is forecasted that the silicon metal market in 2020 will be balanced (ie supply
matching demand within 1 ) [13]
314 Lithium
Although lithium is not classified as a critical raw material it is an important element in
lithium-ion battery technologies Lithium has a relatively high average abundance in the
earthrsquos crust of 17 ppm [22] making it the 27th most abundant element in the
lithosphere For various reasons outlined in [22] exact data on global resources
reserves and production of lithium is not available figures cited below are best estimates
available A comprehensive overview of lithium resources reserves production volume
and producers is given in [22] Global resources and reserves are estimated to be 395-
11
452 million tons and 122-14 million tons Li metal equivalentsect (LME) respectively [18
21 22] Geographical distribution of resources and reserves is shown in Figure 2
Figure 2 Geographical distribution of Li resources and reserves Source [22]
Major Li resources and reserves - nearly 25 million tons Li metal equivalent (LME) and
85 million tons LME respectively - are identified in South America notably in Argentina
Chile Bolivia and Brazil where 55 of the global resources and 69 of the global
reserves are located [22] China possesses the biggest part of Li resources and reserves
found in Asia (ca 53 million tons LME and 21 million tons LME respectively)
corresponding to around 12 of the global resources and nearly 17 of the global
reserves [22] EUs share of the global Li resources and reserves is limited ndash slightly less
than 04 million tons LME and 0013 million tons LME respectively [22] However
unique deposits of jadarite ndash lithium boron silicate ndash were discovered in 2004 in Serbia
So far only one such deposit is known its resource is 15 million tons LME which
corresponds to ca 2 of the global resources [22] Significant Li resources and reserves
are identified in North America ndash nearly 6 million tons LME and 08 million tons LME
respectively More than half of these is located in the USA corresponding to nearly 8
of the global resources and 5 of the global reserves [22]
Global supply of lithium has been historically dominated by hard-rock mineral sources
however development of large-scale lithium brine operations in South America
commenced in the early 1980rsquos The actual global supply market for lithium products is
sect Lithium is found in nature in a number of mineral forms and compounds with different Li metal content To
account for this numbers for Li resources and reserves are given in literature recalculated to Li metal equivalent ie amount of Li contained in ores brines etc
55
12
around 200000 tons of lithium carbonate equivalent (LCE) (1 kg LCE = 01895 kg Li)
with almost 83 of it being sourced from four major producers Albemarle (USA) SQM
(Chile) FMC (USA) and Sichuan Tianqi (China) with main fields located in Chile
Australia Argentina and China (see Table 1) [23]
In 2015 Li-ion batteries consumed around 40 of the global LCE production of which
14 was used for electric vehicle battery packs Projection for 2025 shows that electrical
vehicle demand alone will utilise 200000 tons of LCE which equates to the total current
global LCE supply [23]
Therefore the known lithium reserves are sufficient to cope with this foreseen increase in
demand even without recovery of lithium from the recycling of Li-ion batteries Today
the recovery of lithium from batteries is technically feasible but is still not economically
viable However foreseen long term lithium price development or new practices may
make lithium recovery more viable in the future [21]
32 Cell components manufacturing
321 Cathode materials
Aluminium foil is used as a current collector for cathodes in Li-ion cells Market leaders in
aluminium foil production for battery applications are Sumitomo Light Metal Industries
(JP) and Nippon Foil Mfg (JP) [24]
Complex transition metal oxides and phosphates are currently the main cathode active
materials used in Li-ion battery cells These include Lithium Cobalt Oxide (LCO) Lithium
Nickel Manganese Cobalt Oxide (NMC) Lithium Nickel Cobalt Aluminium Oxide (NCA)
Lithium Manganese Oxide (LMO) and Lithium Iron Phosphate (LFP) With the exception
of LCO all these materials are currently used in automotive Li-ion battery cells
[25][26] The total market demand for cathode materials for all applications of Li-ion
batteries was approximately 140000 tons in 2015 revenues generated were B$ 3 and
the market showed a sustained growth with compound annual growth rate (CAGR)
amounting to 16 between 2005 and 2015 [27] (see Figure 3) It is estimated that
approximately 25 of the total global demand of the cathode active materials or ca
5000 tons was used in Li-ion batteries for HEVs PHEVs and EVs
13
Figure 3 Left ndash Development of the cathode active materials market in 2000-2015 Right ndashdemand division per material type and regional distribution of the manufacturers (according to the location of the headquarters) in 2015 (Used with permission from Avicenne Energy [5])
Production of cathode active materials is dominated by Asia with China manufacturing
ca 39 (by weight) of the total amount of cathode materials in 2015 Japan ndash ca 19
and South Korea ndash ca 7 (see Figure 3)
Suppliers from the EU ndash Umicore (BE) and Johnson Matthey (UK) ndash together produced
ca 13 (by weight) of the total amount of cathode materials or ca 17700 tons in
2015 Umicore produced ca 5550 tons of LCO (note however that LCO is less relevant
for automotive applications) and ca 9600 tons of NMC and Johnson Matthey (UK)
produced ca 2560 tons of LFP
The cathode materials market remains very dynamic and is currently seeing de-
concentration with more and more companies entering the market and providing a
share of the global supply For example in 2011 61 of the global market for cathode
materials was shared by only three (3) dominating suppliers namely Umicore (BE) with
32 Nichia (JP) with 24 and Toda Kogyo (JP) with 5 [24] In 2014 six (6) main
suppliers together had a market share of ca 45 with Umicore (BE) having 11
Reshine (CN) 8 LampF (KR) 8 ShanShanTech (CN) 7 Nichia (JP) 7 and Sumitomo
Umicore is considered an EU-based company in this report despite the fact that the actual production of the cathode active materials takes place at the Umicores facility in South Korea
14
(JP) 5 [27] In just one year each of these main producers further increased their
production volume and together they held a 52 share of the total market in 2015 [5]
Companies such as BASF (DE) Dow (US) 3M (US) DuPont (US) Mitsubishi (JP) and LG
Chem (KR) have recently shown interest in this market but do not play a significant role
in the global supply of the cathode active materials yet [27]
Based on a number of assumptions [5] the market for cathode active materials is
expected to grow from ca 140000 tons in 2015 to ca 400000 tons in 2025 with the
relative fraction per material changing as shown in Figure 4 The highest growth rate is
expected for NMC (almost 5 times) NCA (ca 3 times) and LMO (24 times) and EU
suppliers have the opportunity to increase their supply of NMC Production of NCA
material currently dominated by Japan may also present an opportunity for
existingnew EU manufacturers
2015 2025 Expected
growth
ktons ktons times
LCO 26 37 16 64 17
NMC 29 40 48 192 48
LFP 23 32 16 64 20
LMO 12 17 10 40 24
NCA 10 14 10 40 29
Total 100 140 100 400 29
Figure 4 Expected market volume per material type in 2025 (left) and as compared to 2015 (right) (Used with permission from Avicenne Energy) [5]
However the potential of technical breakthrough that leads to use of different cathode
materialschemistry intensive competition and government policy interference will
continue to affect global cathode manufacturing sector [23]
The quality of the cathode material impacts the overall performance of the cell Quality
control starts in the raw material production stage and this is particularly true for
cathode manufacturing For this reason many of the major battery cell manufacturers
such as Panasonic (JP) LG Chem (KR) BYD (CN) have chosen to develop their own in-
house cathode materials production capacity [23]
15
322 Anode materials
Copper foil is used as a current collector for anodes in Li-ion cells Market leaders in
copper foil production for battery applications are Furukawa Electric (JP) Nippon Foil
Mfg (JP) and Nippon Denkai (JP) [24]
Various carbonaceous materials such as natural and artificial graphite meso-phase and
amorphous carbon and more recently tin and silicon oxides and alloys as well as Lithium
Titanium Oxide (LTO) are used as anode active materials [5 27]
The total market for anode materials for all applications of Li-ion batteries exceeded
76000 tons in 2015 revenues generated were B$ 1 and the compound annual growth
rate (CAGR) amounted to 14 in the period from 2005 to 2015 [5]
Approximately 40 of the total global demand of the anode active materials (ca 30400
tons) was used in Li-ion batteries for HEVs PHEVs and BEVs [5]
Development of the market in 2006-2015 and the division of the market per type of
anode material is shown in Figure 5 It can be seen that the largest share of the market
ndash ca 91 - is taken by graphite and is almost equally divided between natural graphite
and artificial graphite 49 and 42 (by weight) respectively of all anode active
materials for all Li-ion battery applications [5]
Figure 5 Development of the anode active materials market in 2006-2015 market division per material type and regional distribution of the top-12 manufacturers of natural and artificial
graphite anode materials in 2015 (Used with permission from Avicenne Energy [5])
16
Historically the production of anode active materials has been dominated by Japan and
China (see Figure 5) [5 24 25] In 2011 three (3) producers together had a market
share of 65 with Hitachi Chemicals (JP) having a share of 34 Nippon Carbon (JP) ndash
19 and BTR Energy (CN) ndash 12 [24] [25] In 2015 these 3 companies remain the
leaders in the market of anode active materials supplying 61 of the market [5] Hitachi
Chemicals (JP) remains the largest producer (31 of the market) with BTR Energy (CN)
following in second place (19) and Nippon Carbon (JP) in third place (7) Other
producers of anode active materials include Mitsubishi Chemical (JP) LS Mtron Carbonics
(KR) ShanshanTech (CN) Tokai Carbon (JP) [5]
EU-based companies such as SGL (DE) Imerys (CH) and Heraeus (DE) as well as 3M
(US) DuPont (US) Dow (US) Dow Corning (US) Envia (US) ShinEtsu (JP) have
recently shown interest in the anode active materials market for Li-ion batteries but
currently do not play any significant role in the global supply
The market for anode active materials is expected to grow from 76000 to more than
250000 tons in 2025 The expected distribution of the market among various anode
active materials in 2025 is shown in Figure 6 The forecast is that the share of artificial
graphite will increase to 52 that of natural graphite decrease to 24 and the share of
other anode active materials will grow to 24 [5]
2015 2025 Expected
growth
ktons ktons times
Natural graphite
49 3675 24 60 16
Artificial
graphite
42 315 52 130 41
Amorphous carbon
6 45 10 25 56
LTO 1 075 8 20 267
Si compounds 2 15 6 15 10
Total 100 75 100 250
Figure 6 Forecast market division per anode active material type in 2025 (left) and as compared
to 2015 (right) (Used with permission from Avicenne Energy [5])
17
323 Electrolytes
The global market for electrolytes for all applications of Li-ion batteries was slightly
bigger than 62000 tons in 2015 revenues generated were B$ 09 and the compound
annual growth rate (CAGR) in 2005 to 2015 amounted to 20 [5]
The market for electrolytes for HEV PHEV and BEV batteries has experienced a rapid
growth in the period from 2010 to 2015 with electrolyte demand for these applications
increasing from ca 200 tons in 2010 to ca 20500 tons in 2015 (or ca 33 of the total
market volume for Li-ion batteries) [5 28]
Similar to cathode and anode active materials the production of electrolytes for Li-ion
batteries is dominated by the Asian suppliers with China currently producing close to
60 (by weight) of the total market Japan ndash 18 and Korea ndash 14 (see Figure 7)
Soulbrain - a producer with headquarters in the US and production facility in Korea ndash has
supplied 7 of the market in 2015 The EU-based electrolyte producer ndash BASF (DE) ndash
has supplied ca 200 tons of electrolyte or ca 04 of the total market volume in 2014
but decreased the supply significantly in 2015 [5 28]
Figure 7 Left ndash Development of the electrolyte market in 2000-2015 and right ndash Regional distribution of the electrolyte producers in 2015 (Used with permission from Avicenne Energy [5])
18
The competition in the market is very intense with Chinese companies expanding their
production volume quickly and others slowing their growth or even experiencing a
decline [5 28] One of the quickest growing Chinese electrolyte producers CapChem
has more than doubled its share on the market from ca 3500 tons in 2013 to 8600
tons in 2015 to become the global market leader with a 14 share of the total
electrolyte market Zhangjiagang Guotai-Huarong (GTHR) (CN) has also increased its
production from ca 3500 tons in 2011 to 8000 tons in 2015 becoming the second
biggest electrolyte supplier with a 13 share of the total electrolyte market in 2015
Conversely Korean (eg Panax-Etec) and mainly Japanese (eg Mitsui Chemicals and
Ube) electrolyte producers are currently experiencing a decrease of their market share
[5 27]
New entrants on the global market of electrolytes for Li-ion batteries are companies such
as LG Chem (KR) DuPont (US) and Daikin (JP) [5 28]
Worldwide there is currently a significant overcapacity for electrolyte production for Li-
ion batteries (see Figure 8) [5] Less than half of the available production capacity is
currently being utilised in Japan and Korea and in the US and Europe only 5 and 1
respectively
Figure 8 World-wide demand and offer of electrolytes for Li-ion batteries (Used with permission from Avicenne Energy [5])
19
Nevertheless there may be opportunities in formulation and production of new advanced
electrolytes eg for high-voltage Li-ion cells where advanced (likely fluorinated)
additives and solvents will be required [5] Given this dynamic market climate and taking
into account the expected market growth there may be business opportunities present
for EU-based producers
The market for electrolytes is expected to grow from the current 62000 tons to more
than 235000 tons in 2025 with the automotive share increasing from current ca 33
to ca 50 of the market see Figure 9 [5]
Figure 9 Electrolyte market forecast till 2025 (Used with permission from Avicenne Energy [5])
324 Separators
The total market for separators for all applications of Li-ion batteries was approximately
900 Mm2 in 2015 revenues generated were B$ 11 and the compound annual growth
rate (CAGR) amounted to 15 in the period between 2005 and 2015 [5] Approximately
30 of the global separator market volume or ca 300 Mm2 is supplied for production of
automotive Li-ion battery cells [5]
As for cathode and anode active materials and electrolytes the market of separators for
Li-ion batteries is dominated by Asia with Japans current market share of 48 (by
product surface area Mm2) of the total market supply China ndash 17 and Korea ndash 10
20
(see Figure 10) Market leaders are Asahi Kasei (JP) Toray (JP) and SK (KR) The
separator market position of the US is also strong with Celgard having a market share of
9 and Entek of 3 in 2015 [5]
Companies such as DuPont (US) Dow (US) LG Chem (KR) Teijin (JP) and Mitsubishi
(JP) have recently shown interest in the separator materials market for Li-ion batteries
but currently do not play any significant role in the global supply EU-based Evonik (DE)
is among the new entrants on the market of separator materials [5] Litarion (DE) has
manufacturing capacity to produce electrodes and ceramic separators for lithium-ion
battery cells but the actual production volume for 2015 is unknown [29]
Figure 10 Left ndash Development of the separator market in 2005-2015 [5] and right ndash Regional distribution of the separator producers in 2015 (Used with permission from Avicenne Energy [5])
It is expected that the separator market for Li-ion batteries will continue to grow steadily
with CAGR of 12 reaching ca 2700 Mm2 in 2025 [5] A major contribution to this
growth will come from the needs of electric vehicles and buses (see Figure 11)
21
Figure 11 Projected separator market growth (Used with permission from Avicenne Energy [5])
325 Future cell chemistries
Significant research effort is dedicated world-wide to the development of several future
cell chemistries which have the potential to outperform contemporary Li-ion cells
Chemistries which are often identified as the ones capable of advancing battery
technology to beyond the Li-ion include
a) Lithium metal (Li metal) batteries
b) Solid State batteries (SSB)
c) Lithium-sulphur (Li-S) batteries
d) Lithium-air (Li-air) batteries
The development status as well as challenges facing these chemistries are briefly
outlined in the following sections
Li metal [30]
With a specific capacity more than ten times that of the LiC6 anode used in present-day
lithium-ion batteries cells based on Li metal anodes are of particular interest Effective
22
strategies for stabilizing the anode in such cells are required for progress on future
storage technologies including LindashS and Lindashair batteries Several challenges mdash parasitic
reactions of Li metal with liquid electrolytes unstable and dendritic electrodeposition
and dendrite-induced short circuits mdash derailed early efforts to commercialize lithium
metal batteries
Recent research efforts to minimise reactions between the metal and electrolyte use
surface coatings to alter the composition and ion transport properties of the solid
electrolyte interface (SEI) layer and are expected to yield lithium-metal batteries based
on layered hybrid electrolytes in which Li anodes protected by an artificial SEI coexist
with conventional liquid electrolytes Artificial SEI designs which can also be applicable to
other reactive metal anodes eg Na Al or Zn are of particular interest because these
anodes exhibit similar parasitic reactions to Li
In the longer term the inherent design flexibility that comes from the malleability of Li
will be exploited allowing Li metal batteries to be lithographied 3D printed gelated from
sols or integrated into load-bearing structures through layer-by-layer deposition or self-
assembly Design of Li-metal anodes compatible with manufacturing outside the glove
box will emerge as an area of high priority
Solid State batteries [31]
Solid-state batteries (SSBs) that use solid electrolytes (SEs) (either inorganic or
polymer) instead of liquid ones could offer both high energy and high power density SEs
allow transfer of lithium ions only and act as functional separators with only minor self-
discharge (due to negligible electronic conductivity) Moreover lithium ions and anions
are mobile in liquid electrolytes causing severe concentration gradients of the
conducting salts during current flow and limiting the cell current whereas only lithium
ions are mobile in SEs so this bulk polarization cannot occur As a result higher current
densities and quicker charging times are conceivable in SSBs Some inorganic solid
electrolytes are stable at elevated temperatures improving battery safety The
mechanical rigidity of SEs may prevent the dendrite formation that is caused by the
electrodeposition of lithium and thus facilitate the use of lithium-metal anodes
Despite fast growing interest in SSBs many challenges remain in both manufacturing
and fundamental understanding of the technology For example lithium-ion conductivity
of the polymer electrolytes is too low for battery operation at room temperature and the
operation in electric vehicles requires temperatures above 80 degC Even then their rate
capability is limited preventing fast charging Hence the search for stable polymer
electrolytes for use with lithium-metal anodes and lithium nickel cobalt manganese oxide
23
or lithium nickel cobalt aluminum oxide cathodes at ambient temperature at sufficient C-
rates is one of the challenges scientists and engineers face in the forthcoming years
The major drawback of many inorganic SEs is their low thermodynamic stability Most
solid electrolytes are easily reduced at low potentials (for example by lithium metal) mdash
just like their liquid competitors mdash and oxidized at intermediate potentials Protecting
interphases are therefore required to stabilize the electrolyteelectrode contact as
happens in conventional lithium-ion batteries
Li-S [32]
Li-S batteries based on abundant sulphur high-capacity sulphur-containing cathodes and
lithium anodes are considered among the most promising candidates to achieve a low-
cost and high-energy-density system Fundamental challenges facing Li-S batteries
originate from the insulating properties of elemental sulphur and lithium sulphides the
dissolution of lithium polysulphides in the electrolyte the volume change at the cathode
on cycling and the need to passivate membranes at the anode to inhibit dendrite
formation Moreover it is now widely realized that high sulphur loading electrodes are
essential for Li-S technology in the marketplace
Li-air [33]
The Li-air battery which uses oxygen from air has the highest theoretical specific
energy density of any battery technology 3500 Whkg Estimates of practical energy
storage are uncertain as many factors are unknown but values in the range 500 to
1000 Whkg ndash sufficient to deliver significantly in excess of a 500 km driving range if
deployed in an electric vehicle battery ndash have been proposed Despite significant
research over the past decade there is a lack of a true understanding of the
underpinning chemistry and electrochemical processes in Li-air batteries Li-air batteries
combine two challenging electrodes Li metal and oxygen Li-metal electrodes still do not
deliver the necessary cycling efficiency (ratio of dischargecharge capacity) and related
suppression of dendrites Aprotic Li-O2 faces a number of challenges not least of which
is the stability of the electrolyte solution and the cathode towards reduced oxygen
species Also the issue of air handling and filtering would need to be addressed by new
engineering solutions
Technology evolution [34]
Given the numerous fundamental challenges facing the above-listed future battery
chemistries and taking into account that time-to-market for new battery materials and
24
concepts has historically been shown to range between 10 and 20 years [5] projections
regarding the commercialisation timeline of the future technologies need to be made
with caution According to the German National Platform for Electromobility
contemporary Li-ion cells (generations 1 and 2a in Figure 12) largely based on LFP
LMO NCA and NMC cathodes and graphite or carbon anodes will soon be gradually
substituted by generation 2b technology with nickel-rich cathodes and higher energy
density
Another advance is to be expected with the introduction of Generation 3 which is
characterized by the use of carbon-silicon anodes Generations 3a and 3b can be
expected to subsequently upper the cut-off voltage which will lead to an increase in
energy density
In the medium to long term a doubling of range or halving of costs appears to be
possible especially with traction battery cells of Generation 4 If the challenges related to
solid state and lithium-sulphur technology (and other conversion chemistries (Generation
4)) are resolved they can become important parallel technologies co-existing with
lithium-ion on the market (see Figure 12)
It is still largely an open question whether the theoretically proven advantage of the
higher energy density at the cellular level can be efficiently implemented at a battery
pack level Therefore at present a question whether and when a transition to post
lithium-ion technology (traction battery cells with conversion materials (Generation 4)
and lithium-air (Generation 5)) will take place in future cannot be answered with
certainty From todays perspective advancement to solid state systems in the near
future (Generation 4) looks more likely
For all of these chemistries no significant manufacturing base has yet been developed by
any global economy This leaves a potential opportunity open for Europe to break-in to
cell manufacturing for chemistries where currently no significant barrier to entry exists
25
Figure 12 Forecasted battery technology evolution [34]
26
33 Cell manufacturing
331 Cell manufacturing ndash current status
The total sales volume of Li-ion battery cells in 2015 was ca 5600 million cells
(equivalent to ca 60 GWh) and the cell market value was ca B$ 167 its compound
annual growth rate (CAGR) amounted to 22 for volume and 15 in value between
2005 and 2015 [5] In 2015 approximately 31 of the total Li-ion battery cell sales
equivalent to more than 18 GWh in volume and ca B$ 53 in value were used in
automotive applications [5] This number excludes Li-ion battery cells for SLI (Starting
Lighting and Ignition) application which at present has a very minor market share but
is expected to grow in the future [5]
Lithium-ion batteries were first commercialised in the early 1990s by Sony Their uptake
grew rapidly as they delivered a superior performance relative to other rechargeable
chemistries deployed at the time The surge in demand in terms of number and product
range for portable electronic devices drove the corresponding need for high
performance lithium ion batteries Asian battery manufacturers dominance in this
market positioned them favourably to respond quickly and competitively to the growing
demand This allowed establishment of a strong manufacturing base in Asia which later
enabled quick scaling up of the production volume further development and optimisation
of the technology and diversification of their product range toward emerging markets
including automotive [35] Asian companies notably Samsung SDI (KR) LG Chem (KR)
Sanyo-Panasonic (JP) Sony (JP) and BYD (CN) among others dominate the Li-ion
battery cell manufacturing (see Figure 13) [5 34 35]
Cell manufacturers for automotive applications include Panasonic (JP) Samsung SDI
(KR) LG Chem (KR) AESC (JP) GS Yuasa (JP) Li Energy Japan (JP) BYD (CN)
Wanxiang (CN) Lishen Tianjin (CN) and Toshiba (JP) [26 34 36]
27
Company Market volume
in 2015
million cells
Company Market value in
2015
million US $
Samsung SDI 1376 Samsung SDI 3000
LG Chem 1008 LG Chem 2530
SONY 490 ATL 1490
ATL 465 Sanyo-
Panasonic
1125
Tesla 430 BYD 1120
Sanyo-
Panasonic
408 SONY 1040
Lishen 290 Tesla 970
Coslight 185 Lishen 850
BYD 180 NEC 520
Maxell 76 Coslight 450
BAK 67 GS Yuasa 210
Other 625 Other 3395
Total 5600 Total 16700
Figure 13 Market share of various Li-ion cell producers in 2015 left ndash in volume right ndash in value (Used with permission from Avicenne Energy [5])
28
Table 2 illustrates the total completed under construction and planned Li-ion cell
manufacturing capacities in various regions in 2014 according to the data cited in reports
of the US Clean Energy Manufacturing Analysis Center (CEMAC) [7 37] As can be seen
in 2014 the global manufacturing capacity for Li-ion battery cells for all applications was
ca 763 GWh and 88 of this manufacturing capacity was located in Japan China and
South Korea (see Table 2) Production capacity for automotive Li-ion cells was 275 GWh
in 2014 79 of which was located in Asia [7 37] A similar number for the global
production capacity for automotive Li-ion battery cells - 272 GWh- is quoted by the
German National Platform for Electromobility [34]
According to Avicenne Energy the global production capacity for Li-ion battery cells for
all applications was approximately 100 GWh in 2015 from which 40 GWh were for
portable Li-ion cells and 60 GWh for all other applications including automotive [5]
In the time period from 2014 to 2016 the global manufacturing capacity for automotive
Li-ion cells has increased significantly (compare Table 2 and Table 3) [6 38] Korea has
increased its manufacturing capacity for automotive cells ca 15 times Japan ca 24
times and China 27 times from 2014 to 2016 China plans further expansion of its
manufacturing capacity for lithium-ion battery cells and has announced construction of
extra 193 GWh manufacturing capacity in addition to its 304 GWh Especially
aggressive growth in the manufacturing capacity for automotive cells is observed in the
USA where an explosive growth of the manufacturing capacity increasing almost 10
times from 2014 to 2016 is observed thanks to construction of the Tesla Gigafactory
The fully commissioned manufacturing capacity of the EU has not changed significantly
Please note that 5 GWh capacity mentioned as under construction in the CEMAC
reports [7 37] refers to a new BMZ Li-ion battery manufacturing facility in Karlstein (DE)
(see section 34)
29
Table 2 Annual manufacturing capacity of Li-ion cells worldwide in 2014 [7 37]
includes fully commissioned partially commissioned and under construction capacity excludes announced capacity
Please note that JRC analysis of the underlying data for the EU indicated that numbers for the EU include data on pack manufacturing [38]
Fully
commis-
sioned
(GWh)
Partially
commis-
sioned
(GWh)
Under
construc-
tion
(GWh)
Announced
(GWh)
Total
manufacturing
capacity
(GWh)
Share of
total global
capacity
Automotive
manufacturing
capacity
(GWh)
Share of
global
automotive
capacity
China 16704 3576 18730 12847 39010 51 11240 41
Japan 10778 0 1200 0 11978 16 5750 21
Korea 16059 0 0 0 16059 21 4600 17
US 3770 0 1200 350 4970 7 4600 17
EU 1798 0 0 0 1798 2 1300 5
Rest of
world
2440 0 0 0564 2440 3 0 0
TOTAL 51549 3576 21130 48412 76255 100 27490 100
30
Table 3 Annual manufacturing capacity of automotive Li-ion cells worldwide in 2016 [6 38]
Fully
commissioned
(GWh)
Partially
commissioned
(GWh)
Under
construction
(GWh)
Announced
(GWh)
Total
manufacturing
capacity
(GWh)
Increase
compared to
2014
()
China 11152 3038 16244 19246 30434 271
Japan 13623 13623 237
Korea 6570 6570 143
US 8925 8750 26250 0150 43925 955
EU 1293 5000 6293 0
Rest of world 3390 0120 3390 139
TOTAL 44953 11788 47494 19516 104235
includes fully commissioned partially commissioned and under construction capacity excludes announced capacity
Please note that JRC analysis of the underlying data for the EU indicated that numbers for the EU include data on pack manufacturing 5 GWh capacity
mentioned as under construction refers to a new BMZ Li-ion battery manufacturing facility in Karlstein (DE) (see section 34) [38]
31
The EU does not have a significant manufacturing capacity for Li-ion battery cells and
published data on capacity and on actual production differ slightly depending on the
sources
a) According to the US Clean Energy Manufacturing Analysis Center (CEMAC)
whose reports are based on data from Bloomberg New Energy Finance (BNEF) the total
production capacity of fully commissioned facilities in Europe was nearly 18 GWhyear in
2014 (corresponding to 2 in the global production capacity of Li-ion cells for all
applications) out of which 13 GWhyear were for automotive Li-ion cells (corresponding
to 5 of the global production capacity of automotive Li-ion cells) (see Table 2) [7 37]
(Please note that JRC analysis of the underlying data for the EU indicated that numbers
for the EU include data on pack manufacturing [38])
b) In its Roadmap integrated cell and battery production Germany the German
National Platform for Electromobility indicates that EUs production capacity for large
format Li-ion cells for automotive and energy storage applications was 15 GWhyear in
2014 [34] This number based on Roland Bergers data takes into account only an
estimate of production capacity of AESC (Nissan) facility in Sunderland (UK) [34]
c) According to the analysis of Avicenne Energy manufacturing capacity for Li-ion
cells in Europe was nearly 15 GWhyear in 2015 [5] distributed over a number of
relatively small producers however it quotes the actual production volume of Li-ion cells
in Europe at only ca 350 MWh [5]
Compared with Asian counterparts the number and relative size of European Li-ion cell
manufacturing companies are significantly smaller These manufacturers include (see
also Table 4)
SAFT recently taken over by Total [39] is currently the largest active European
producer of Li-ion cells Its manufacturing facility in Nersac (FR) has a production
capacity of 60 MWhyear [5 40] however SAFTs actual production volume in
2015 was 84 MWh exceeding its nominal capacity [5] SAFT cells and batteries
are used for various applications including space military and aircraft applications
[41]
ABSL Power Solutions in Culham (UK) recently acquired by EnerSys is a
European manufacturer of Li-ion battery cells for space applications [42]
AGM Batteries Ltd in Thurso (UK) develops and manufactures rechargeable Li-ion
cells and non-rechargeable lithium cells Its production facility with capacity of 50
MWh supplies Li-ion batteries across a range of markets including defence oil
and gas markets [43]
32
Switzerland-based Leclancheacute operates a production facility in Willstaumltt (DE)
where it produces Li-ion cells and batteries for energy storage applications The
current manufacturing capacity of this facility is 100 MWh [44]
EAS Germany GmbH located in Nordhausen Germany produces cylindrical cells
which are currently deployed in space submarine marine and automotive
applications in Europe Asia and North America [45] Production capacity of this
facility is 100 MWhyear while actual the production in 2015 was 40 MWh [46]
Litarion GmbH a subsidiary of Electrovaya in Kamenz (DE) is a supplier of
lithium-ion cells for mobile and stationary energy storage and other demanding
applications Furthermore Litarion has manufacturing capacity to produce
electrodes and ceramic separators as key components for high performance
lithium-ion battery cells [29] Production capacity of this facility for cells is 500
MWhyear actual production in 2015 was ca 25 MWh [46]
Custom Cells Itzehoe GmbH located in Itzehoe (DE) produces Li-ion pouch cells
for various applications and of various formats specified by the customers [47]
Production capacity of this facility is 20 MWhyear actual production in 2015 ndash 1
MWh [46]
SSL Energie GmbH in Kelheim (DE) manufactures Li-ion cells for energy storage
solutions for telecommunication and industrial plants as well as for
electromobility applications (on land and on water) [48] Production capacity of
this facility is 01 MWhyear while the actual production in 2015 was negligible
[46]
Liacon GmbH located in Itzehoe (DE) has a vertically integrated production plant
for large-scale lithium titanate polymer cells [49]
VARTA Microbattery GmbH located in Ellwangen (DE) is a manufacturer of
microbatteries and is one of the market leaders in the hearing aid battery and
nickel-metal hydride and lithium-ion coin battery segments [50]
European Battery Technologies Oy in Varkaus (FI) develops and manufactures
large rechargeable lithium-ion based prismatic cells and battery systems which
can be used to power hybrid and electric drive trains and to store energy
produced by renewable energy sources [51] Production capacity of this facility
was 30 MWhyear and the actual production volume amounted to 1 MWh in 2015
[46]
Advanced Lithium System Europe SA (ALSE SA) has a manufacturing facility in
Xanthi (GR) where Li-ion cells and batteries for defence applications such as
exercise torpedoes are produced [52] Production capacity of this facility is 100
MWhyear and the actual production volume amounted to 01 MWh in 2015 [46]
33
A special type of Li-ion cells - solid-state cells with a Li-metal anode ndash is produced
in France and in Canada by Bolloreacute (FR) The cell production capacity in France is
500 MWh per year and the actual production in 2015 amounted to 120 MWh [46]
Table 4 Li-ion cell actual production volume for 2015 and production capacity of selected European manufacturers Source [5 40] [43] [44] [46]
Company Actual production
in 2015 MWh
Production
capacity
MWh
SAFT (FR) 84 60
EAS Germany GmbH (DE) 40 100
Litarion GmbH (DE) 25 500
Leclancheacute GmbH (DE) 5 100
European Battery Technologies Oy (FI) 1 30
Custom Cells Itzehoe GmbH (DE) 1 20
Advanced Lithium System Europe SA
(GR)
01 100
AGM Batteries Ltd (UK) na 50
SSL Energie GmbH (DE) negligible 01
Bolloreacute (FR) 120 500
Total 2761 14601
Due to the high production costs Daimler subsidiary Li-Tec (DE) stopped production of
Li-ion battery cells and batteries at the end of 2015 marking the closure of the only
German factory producing cells for EVs [36 53] According to data of BNEF the
manufacturing capacity of this factory was 480 MWh [38]
Renault CEA (French Atomic Energy and Alternative Energies Commission) and Nissan
were planning to build a factory in Flins (France) to produce automotive Li-ion cells and
batteries with an annual manufacturing capacity of 100000 batteries [54] This cell and
34
battery production plant foreseen to supply batteries for Renaults ZOE electric vehicle
was delayed due to technical constraints [55] At present only a battery pack assembly
line is operational at this location [56] In 2009 Renault Nissan announced it would build
an advanced Li-ion electric vehicle battery factory in Cacia (Aveiro Portugal) to produce
50000 batteries per year starting in 2012 [57] However this plan did not go ahead and
the facility is currently still not operational [58]
In the meantime mature Asian cell manufacturers are planning to establish Li-ion
automotive cell and battery production in the EU For example LG Chem (KR) plans to
build a production plant in Poland (most likely in Wrocław) with an annual production
capacity of 50000 Li-ion automotive batteries [59 60] Samsung SDI (KR) has started
preparing for Li-ion battery (cell module and pack) production in Jaszfenyszaru
Hungary [61]
332 Projected market growth
The Li-ion battery cell market is forecasted to grow rapidly in the coming years reaching
ca 140 GWh in volume and ca B$ 285 in value by 2020 and ca 215 GWh and B$ 355
by 2025 respectively according to the data of Avicenne Energy [5] The automotive
part of the market is predicted to grow to nearly 76 GWh in volume and B$ 15 in value
by 2020 and 121 GWh and B$ 20 by 2025 respectively [5] Major contribution to the
anticipated growth of the Li-ion cell market for electric vehicle is expected to come from
China Indeed it is forecasted that ca 23 of the automotive Li-ion cells produced (or
approximately 80 GWh) will be used to power electric vehicles in China in 2025 [5]
Considering only the necessity to reduce transport CO2 emissions defined by the
regulations the German National Platform for Electromobility forecasts that the global
market of Li-ion automotive cells will grow even quicker and reach 150 GWh in 2025
(conservative scenariodaggerdagger) [34] When other factors such as governmental financial
incentives are taken into account growth of the market to 400 GWh by 2025 is expected
(optimistic scenarioDaggerDagger) [34] Demand for automotive Li-ion cells by European OEMs for
BEVs and PHEVs production is estimated to be ca 15-28 GWh in 2021 and ca 37-117
GWh in 2025 for the two scenarios considered [34]
daggerdagger The conservative scenario is based on the required minimum sales of electric vehicles to meet the regional
limits on CO2 emissions No governmental subsidies of the purchase and maintenance costs of BEVs and PHEVs are considered DaggerDagger
In the optimistic scenario governmental incentives for promotion of PHEVs and BEVs are considered in
addition to the regional requirements on CO2 emissions This results in a cost advantage of PHEVs and BEVs over conventional powertrains
35
333 Global cell production over-capacity
Comparing data on the manufacturing capacity for automotive Li-ion cells in 2014 ca
275 GWh [7 34 37] to the corresponding demand and sales volume 10-11 GWh [27
28 34] it can be seen that a noticeable global production overcapacity existed in 2014
Production overcapacity is however not unique for Li-ion cell for automotive
applications In fact a global manufacturing overcapacity albeit to a lower degree is
seen for all types of Li-ion cells and even in the mature and well-established lead-acid
battery sector (see Figure 14) [5]
Figure 14 Battery cell production capacity (Used with permission from Avicenne Energy [5])
Global overcapacity for automotive Li-ion cells was unevenly divided among the regions
in 2014 as shown in Figure 15 [7 37] The lowest utilisation of the manufacturing
facilities for automotive Li-ion cells ndash ca 10 - was observed for China and the highest
utilisation ndash ca 40 and 30 - for Japan and Korea respectively Utilisation for US and
EU was around 20 [7 37] Analysis by Avicenne Energy shows that domestic European
Li-ion cell manufacturing facilities continued to be under-utilised also in 2015 [46]
A possible reason for the current cell manufacturing over-capacity [6] may be that high
profitability of a supply chain segment covering a promising growing productservice will
36
naturally encourage investments in capacity expansion Also as explained in [7 37]
Initially overly optimistic assumptions regarding electric vehicle demand have
contributed to an overbuild of large format Li-ion battery cell production capacity
targeted at vehicle markets
The observed global production overcapacity for automotive Li-ion battery cells has likely
led European battery manufacturers and automotive OEMs to conclude in 2013 that
Current estimates suggest that international resources would be sufficient for the EU to
fulfil demand for hybrid electric and full electric vehicles for the foreseeable future [62]
Figure 15 Automotive Li-ion battery cell manufacturing capacity and utilization in 2014 Source[7 37]
This position was recently reiterated by Daimlers CEO according to Automotive News
website post from February 2016 [63] Daimler CEO Dieter Zetsche ruled out investing
in battery cell production for electric cars with other German premium brands for at least
another few years citing a massive overcapacity in the market that has turned cells into
a commodity The dumbest thing we could do is to add to that overcapacity Zetsche
said earlier this month in Stuttgart Contrary to the expectation four or six years ago
when everyone thought that the cells would be a rarity that could even be used as a tool
of industrial policy there is de facto a massive overcapacity in the market today and
cells have become a commodity he said
Nevertheless another automotive OEM ndash Volkswagen Group and also its brand Audi ndash
has recently expressed interest in domestic production of Li-ion cells for electric vehicles
[63-66]
37
According to CEMAC the market situation is expected to come into better balance in the
near future with global overcapacity decreasing in 2016 [6] Taking into account
projected market growth for automotive Li-ion cells and assuming the production
capacity remains at the present level CEMAC has estimated that the need for new
capacity will arise in 2019-2020 (see Figure 16) [6]
However data presented in the same report by CEMAC [6] also suggests that
manufacturing capacity is likely to continue growing and overcapacity conditions may
persist Nearly 25 GWh of capacity is currently either partially commissioned or under
construction and a further 55 GWh of capacity has been announced
Also the German National Platform for Electromobility has come to the conclusion that
even considering todays excess of manufacturing capacity for automotive Li-ion battery
cells a significant need for additional cell production capacity may be expected to arise
from about 2020 (see Figure 17) [34] According to the data published in [34] there will
be worldwidesectsect additional demand of about 5 GWhyear in 2020 and up to 100 GWhyear
by 2025 in the conservative scenario In the optimistic scenario the demand increases to
above 300 GWhyear Further demand is generated by buses and stationary
applications This situation opens up the possibility for competition-enabled cell
production also in Europe (Figure 17) [34]
Figure 16 Estimated electric vehicle Li-ion battery cell demand and global automotive Li-ion battery cell manufacturing capacity [6]
sectsect Following world regions are considered Europe Japan and South Korea China Canada USA and Mexico Their demand covers more than 90 of the total world demand
38
Figure 17 Worldwide demand for automotive Li-ion battery cells in 2015-2025 Source[34]
39
34 Battery pack manufacturing
The battery pack is a key part of the EV power train accounting for around 30 of the
total vehicle value The Li-ion battery pack market for all applications was more than B$
22 in value in 2015 and the automotive share was slightly less than 8 B$ [5] The
automotive battery pack market value is expected to grow to ca B$ 213 in 2020 [5 8]
and ca B$ 273 in 2025 [5] (see Figure 18)
Battery pack manufacturing accounts for approximately 40 of the total cost of the
battery pack [37] As a whole all the components of the electric powertrain (electric
engine power electronics battery pack and charging devices) will account for almost
half of the global automotive market expansion up to 2020 equivalent to euro100 billion
[67]
Figure 18 Projected growth of Li-ion pack market (Used with permission from Avicenne Energy [5])
Different car manufacturers have different strategies whether to invest and develop the
required pack manufacturing capacity in-house or to outsource it to specialist suppliers
40
The majority of OEMs producing electric vehicle maintain a technological core
competence around battery pack design and battery management system to keep some
control and profit margins Consideration of the specific circumstances of the lithium ion
cell manufacture value chain in different regions (US EU China Japan) can help explain
the different manufacturing strategies adopted by the OEMs located in these regions
Japanese and Chinese OEMs typically keep a higher control on all steps up to the
segment of the cell and battery pack manufacturing process whereas European OEMs
who are forced to relinquish control over cell manufacturing due to the absence of
significant domestic cell manufacturing capacity are trying to keep pack design and pack
assembly in-house
Table 5 OEMs Battery pack manufacturing strategy
OEMs battery pack manufacturing strategy and control
Per region
US CN EU JP
Lower control hellip hellip Higher control
Cells and pack
manufacturing
completely outsourced
Cellsmodules
manufacturing
outsourced through
Tier 1 suppliers
In-house pack design
and manufacturing
Cells production
through joint
venturescontrolled
subsidiary
companies In-house
pack design and
manufacturing
In-house
manufacturing of cells
pack design and
manufacturing
GM BMW Nissan Tesla (plan to)
Renault Mitsubishi BYD
Daimler
In the US the two main OEMs active in the EV business Tesla and GM are adopting
opposite strategies as illustrated in Table 5 Tesla (US) is the leader on the BEV-PHEV
market despite being less heavily resourced as some of its competitor OEMs Rather than
relying on the Tier 1 and Tier 2 supply chain Tesla is opting to produce the majority of
its key components in its California plant in Fremont This includes the battery packs for
its Tesla S and Tesla X vehicle model using cells supplied by Panasonic (JP) Those
models have also the biggest battery pack on the market (with an average energy
storage capacity of 90 kWh) For the upcoming Tesla Model 3 the full production of the
battery pack (estimated energy storage capacity of 50 kWh) including its cells is
41
planned to be performed at the Tesla Gigafactory plant in Nevada GM on the other
hand chooses to outsource its entire cell and pack manufacturing including the battery
management system
The Chinese OEM BYD shares a similar strategy as Tesla and is designing producing and
assembling the complete electrical power train system including cells battery pack and
BMS in-house
In Japan the full battery pack of the Mitsubishi Outlander PHEV is provided by Lithium
Energy Japan a joint venture between GS Yuasa Mitsubishi Corporation and Mitsubishi
Motors Corporation The battery pack is thus designed and produced in-house by
Mitsubishi albeit through this joint venture The Nissan Leaf battery pack is supplied by
Automotive Energy Supply Corporation (AESC) which is jointly owned by Nissan and the
Japanese electronics firm NEC Similar to Mitsubishi Nissan designs and manufactures
battery packs in-house for its own use Japanese Li-ion battery pack manufacturing
facilities in the EU include Nissans battery production plant in Sunderland (UK) ndash the
largest of its type in Europe ndash which became operational in 2013 producing Li-ion
batteries for the Nissan Leaf and the Nissan e-NV200 van [68] The full annual
production capacity of this plant is 50000 EVs and 60000 battery packs [69]
Within European OEMs the BMW Group has invested more than euro100 million in electric
drive technology in Dingolfing (DE) where they set up a plant to manufacture their
electric drive systems BMW designs and develops its core electric drive components
including the power electronics BMS and the whole vehicle electrical system [70] using
cells supplied by Samsung SDI Renault assembles its BEV model Renault Zoe in its
plant in Flins (FR) The battery pack including the BMS is developed in close partnership
with LG Chem who also provides the battery cells [56 71]
Daimler AG has heavily invested and committed to produce its own line of electric
vehicles challenging BMW and Tesla Deutsche ACCUMOTIVE founded in 2009 is a
wholly-owned subsidiary of Daimler AG At its manufacturing facility in Kamenz (DE) the
company develops and produces Li-ion traction batteries packs for hybrid and electric
vehicles [72] Since the start of series production in 2012 it has delivered more than
70000 lithium-ion batteries packs [73] Daimler AG recently announced it will invest
euro500 million into the creation of a second lithium-ion battery pack production facility in
Kamenz This new facility will produce lithium-ion batteries packs for use in electric
vehicles released under the Mercedes-Benz brand Daimler currently has a supply
agreement arrangement with LG Chem [73] who provides the cells for its battery packs
In addition to supplying batteries for Daimler automobiles Deutsche ACCUMOTIVE is
also entering the stationary battery storage market for residential and industrial
applications The scalability of the systems enables the use of lithium-ion batteries in
42
large static energy storage systems for network stabilization and smoothing of peak
shaving for electricity producers as well as for private households
LG Chem (KR) supplies the whole battery pack including BMS and thermal management
system to General Motors (US) for the Chevrolet Volt The new Chevrolet Bolt (aimed to
compete with the Tesla Model 3) will depend on the same battery pack supply chain and
the assembly of the vehicle will most probably be performed outside the US [74]
It is possible to express the volume (expressed in GWh) of automotive battery packs
deployed in the sector (quantified on the basis of the energy storage capacity of a
battery pack times the number of vehicles sold with this pack) and to make a
comparison based on the geographical location where the OEMs headquarters are
located (ie EU US China Japan and Korea) Such an analysis is illustrated in Figure 19
and Figure 20 using data on the top 20 BEV-PHEV global sales in 2015 [58] Doing so
reveals the very high volume of battery packs deployed in EVs manufactured by US
OEMs relative to other regions The high energy storage capacity of battery packs in the
Tesla Model S combined with its high sales ranking explain the US lead in this aspect
(Figure 20) The EU has a similar volume compared with Japan and China (Figure 19)
Figure 19 Cumulative volume of automotive battery pack sales by region of OEMs headquarters [75]
43
Figure 20 Volume automotive battery pack sales by model and region of OEMs headquarters [75]
44
Besides the European automotive OEMs with battery pack production interest other
companies with battery pack manufacturing business cases based in Europe worth
mentioning include
Kreisel Electric GmbH based in Freidstadt Austria is establishing a business
network with German automakers such as BMW and Volkswagen and the British
sports carmaker McLaren Automotive Kreisel Electric manufactures battery packs
and electric drive trains for orders up to 10000 vehicles They are also designing
lithium ion battery production lines for OEMs and creating prototypes for top-tier
automakers Kreisel has started the construction of a new 800MWh battery pack
factory for high energy density packs for EVs [76] Kreisel currently has a supply
agreement arrangement with Samsung SDI
Johnson Matthey Battery Systems (formerly Axeon) (UK) is one of Europersquos
largest Li-ion battery systems suppliers processing over 70 million cells a year
and supplying volume production of batteries for global markets [70]
The facility of Continental in Nuremberg (DE) assembles lithium-ion batteries for
hybrid electric vehicles such as Mercedes S400 BlueHYBRID [77] In September
2008 production commenced with a capacity output of 15000 lithium-ion
batteries per annum Full annual manufacturing capacity of this plant is 333 MWh
The plant incorporates recycling technology that allows at least 50 percent of the
content of lithium-ion cells to be recycled [77]
In 2015 BMZ GmbH has announced expansion of their battery-manufacturing
facility in Karlstein (DE) [78] to enable production of up to 80 million lithium-ion
batteries of various sizes with a total storage capacity of around 5 GWh annually
[78] This project is expected to be completed by 2020 BMZ GmbH (BMZ) is a
battery systems provider whose high-tech batteries are used to power a wide
range of products made by leading manufacturers including electric tools electric
vehicles e-bikes portable medical devices and batteries for use in the renewable
energy sector [78]
Dow Kokam has completed the construction of a 105 MWh lithium-ion battery
manufacturing plant Le Bouchet 2 located in France This battery facility is
designed to manufacture up to 15000 battery packs of 7 kWh to power 5000
fully electric vehicles annually (assuming a 21 kWh battery system) [7 37]
In 2015 Samsung SDI acquired the EV battery pack business of Magna Steyr an
Austrian-based operating unit of Magna International including production and
development sites [79] Magna Steyr Battery Systems product portfolio included
battery packs for HEVs PHEVs BEVs as well as for Heavy Duty Vehicles and 12 V
and 48 V systems [80 81] In 2014 the manufacturing capacity of Magna Steyr
Battery Systems for 16-36 kWh BEV packs was 3000 units per year for 6-18
45
kWh PHEV packs ndash more than 35000 units per year and for 025-3 kWh HEV
packs ndash 50000 packs per year [80 81]
Bolloreacute (FR) assembles battery packs for its BlueCar electric vehicles at the facility
in Ergue-Gaberic (FR) with manufacturing capacity of 300 MWh [41] [82]
35 Electric vehicles manufacturing
351 Production volumes and deployment
More than 685 million passenger vehicles were produced worldwide in 2015 with ca
24 of these or more than 165 million vehicles produced in the EU [83]
In recent years the development of hybrid electric vehicle (HEV) batteries has yielded a
relatively mature generation of vehicles with ca 19 million HEVs sold worldwide in 2014
and ca 18 million HEVs sold in 2015 [8] The majority of HEVs are sold in Japan (nearly
60 of the global sales) and USA (ca 22 of the global sales) resulting in current HEV
penetration level of ca 23 and 3 respectively [8 27 84] In Europe ca 234000
HEVs were sold in 2015 [8] ca 15 of the total car sales The leading producer and
supplier of HEV both historically and currently is Toyota (JP) whose market share in
HEV global sales was nearly 70 in 2014 and 2015 [8 27] Most of Toyota and Lexus
HEV models currently use NiMH traction batteries but the general market trend is that
NiMH traction batteries will gradually be substituted by Li-ion technology [84] Avicenne
Energy forecasts that 50 of HEVs will be equipped with a Li-ion battery by 2020 and
90 of HEVs by 2025 [84]
Production and sales numbers for PHEVs and BEVs increased rapidly in the past few
years Sales numbers cited vary depending on the source For example figures cited for
worldwide PHEV and BEV sales in 2014 range from ca 289000 [85] and to ca 318000ndash
390000 [27 75] and in 2015 this number increased to ca 462000ndash550000 [75 85]
In the EU between ca 71000 [86] and 100000 PHEVs and BEVs [27 75 85] were sold
in 2014 which corresponds to ca 22 - 25 of PHEVs and BEVs sold globally This
number doubled in 2015 and reached between 150000 [86] and 193500 [75] PHEVs
and BEVs sold corresponding to 27 - 35 of PHEVs and BEVs sold globally On
average the fraction of PHEVs and BEVs in the global passenger vehicle sales in 2015
was ca 08 - 11 [85] slightly lower than the ca 09 - 13 average in the EU
[87] It must be noted here however that PHEV and BEV penetration levels vary
significantly among the world regions [88] and even in the EU among its member states
[86 87] with countries such as Norway The Netherlands Denmark Sweden and USA
having a higher fraction of electric vehicles on the road (above 12 12 8 17
and 19 respectively) compared to the rest of the world [86 88]
46
In 2015 the American Tesla Model S was globally the most sold vehicle among PHEVs and
BEVs with a market share of ca 11 Tesla was closely followed by two Japanese
producers ndash Nissan with the Nissan Leaf (9 global market share) and Mitsubishi with
the Outlander PHEV model (9 market share) [75] ranking 2nd and 3rd respectively in
the top 20 BEV-PHEV 2015 global sales Chinese producers were leading in global PHEV
and BEV sales in 2015 with 33 of the market share BYD is currently the largest
electric vehicle manufacturer on Chinarsquos automotive market Automobile business
contributed 50 to the companyrsquos revenue in 2015 and nearly half of its 2015 vehicle
sales revenue was from EV models [89] BYD ranks respectively 4th and 8th with its
models Qin and Tang in the top 20 BEV-PHEV 2015 global sales Japanese USA and EU
producers had almost equal market share in PHEV and BEV sales of 21-22 (see Figure
21) [75]
Figure 21 Global market share of the top 20 PHEV and BEV producers based on [75] (Producer is assigned to a region according to the location of its Headquarters eg Toyota is considered to be a Japanese producer regardless of whether manufacturing is taking place in Japan or elsewhere)
Among European PHEV and BEV models BMW i3 Renault Zoe and Volkswagen Golf GTE
are globally the most sold ranking respectively 5th 7th and 10th in the top 20 global sales
for 2015
In Europe the Mitsubishi Outlander is the most sold model (ca 16 share of PHEV and
BEV sales) followed by Renault Zoe ( 10) Volkswagen Golf GTE (9) Tesla Model S
(9) and Nissan Leaf (8) [75]
All categories of electric vehicles ndash HEVs PHEVs and BEVs ndash are expected to gain ground
in the future However projections on electric vehicles deployment vary among sources
and depend strongly on the assumptions made eg what deployment driver is
47
considered most influential for the number of HEVs PHEVs and BEVs on the road globally
and regionally For example UBSs regulation-driven forecast as well as the projections
of the German National Platform for Electromobility in their conservative scenario are
based on the necessity to reduce transport CO2 emissions defined by the regulations [34
90] Bloomberg New Energy Finance forecast considers the total cost of ownership for
electric vehicles and their economic competitiveness with conventional ICE vehicles as a
major factor determining the rate and volume for their deployment [91 92] In the
following paragraph a non-exhaustive compilation of data available from different sources
is presented and discussed
Figure 22 shows projected global sales of new PHEVs and BEVs for the period between
2015 and 2040 Most of projections do not go beyond 2025 probably due to the high
development pace of this market Figure 23 shows a zoomed view of the time period
between 2015 and 2025 It can be seen that projections vary both in absolute numbers
and in predicted rate of market growth For example Bloomberg and German National
Platform for Electromobility (optimistic scenario) predict a steeper growth between 2020
and 2025 than UBS and Avicenne Energy As for the absolute numbers the optimistic
forecast by the German National Platform for Electromobility falls noticeably higher than
other projections while the base case forecast made by Avicenne Energy which does not
take into account strong anticipated growth in China falls below other projections Both
Avicenne Energy and the German National Platform for Electromobility point out that a
rapid growth of Chinese PHEV and BEV market is to be expected in the next decade [27
28 34] and therefore projections accounting for this may be more accurate
In short conservative projected numbers of global sales for PHEVs and BEVs are ca 15-
275 Myear in 2020 and ca 4-65 Myear in 2025 (see Figure 23) Europe will have a
significant share in this market with sales of new PHEVs and BEVs at 07-08 Myear in
2020 and 165-19 Myear in 2025 (see Figure 24) which corresponds to 25-50 of the
global sales Regarding HEV sales Avicenne Energy forecasts 25 Myear to be sold
globally in 2020 and 32 Myear in 2025 [8] and 08 Myear European sales in 2020 and
ca 14 Myear in 2025 [84]
48
Figure 22 Projected global sales of new PHEV and BEV vehicles Source [5 8 34 75 90-92]
Figure 23 Projected global sales of new PHEV and BEV vehicles for 2015-2025 Source [5 8 34 75 90-92]
49
Figure 24 Projected European sales of new PHEV and BEV vehicles for 2015-2025 Source [34 75 90]
An important driver for OEMs to reduce GHG (greenhouse gas) emissions of their fleet is
the requirements set by legislation in Europe as well as in Asia and US [53 93-96] Many
OEMs have demonstrated their commitment to decarbonisation of road transport by
developing new electric vehicle models in addition to alternative strategies which include
optimization of the internal combustion engine (ICE) [97] reducing vehicle weight and
development of fuel cell vehicles [98] However consumer demand as recently shown
by new players on the market (eg Tesla Model 3 early reservations) may soon become
another important motivation for OEMs to launch competitive and high performance
electrical vehicles on the market Introduction of a new vehicle on the market is a
massive time-consuming RampI undertaking with a time to market for a new vehicle
ranging between 4 to 7 years [8] In a rapidly evolving global electrical vehicle market
automotive OEMs that are not quick to react to market trends and customer demands
may lose their competitive edge On the other hand great opportunities exist for OEMs
that are willing and able to adapt and respond quickly to changes in this very dynamic
market In this sense the automotive market and customer base in Europe is not the
same as that in the US China or elsewhere OEMs need to consider regional variations in
driving expectations infrastructure economic affluence and government incentives that
may affect consumer preferences and hence impact sales of new electric vehicle models
(eg see the consumer view and expectations in the US [99])
In this respect it is interesting to look at the upcoming models (2017-2020) announced
by different OEMs particularly for models with a foreseen price below $ 50000 and with
50
a reasonable driving range When the exact vehicle price is not fully disclosed by OEMs
estimations based on similarprevious models are provided when possible The realistic
range in km is similarly provided A list of upcoming BEV and PHEV models filed below
while not exhaustive can reflect expected future trends in the automotive industry (see
Table 6)
Table 6 Price and range of upcoming EV models (2017-2020) as announced by OEMs differentiated by region
EU US JP KR CN
Brand Model Year of release Price [$] Range [km]
BMW Updated BMWi3 2017 lt 50000 200
Renault Updated Zoe 2017 ~ 35000 300
Daimler Updated Smart
ForTwo electric 2017 lt 30000 100
Tesla Model 3 2018 lt 40000 300
GM Chevrolet Bolt 2017 lt 40000 300
Ford Ford Focus
Electric 2017 lt 30000 150
Nissan Nissan Leaf
version 2017 2017 gt 30000 150
Nissan Nissan Leaf
version 2018 2019 lt 40000 300
Mitsubishi eX SUV 2019 lt 40000 300
Hyundai Ioniq model
BEV 2017 lt 35000 150
Kia Update of Soul
Electric 2018 ~ 35000 150
BYD BYD Qin EV300
BEV model 2017 ~ 35000 240
51
Among European OEMs BMW is announcing a new strategy where a further advance in
e-mobility is foreseen [100] In 2017 a new version of the BMW i3 will be launched with a
range of around 200 km [101] and its price is expected to be below $ 50000 [102]
Renault has announced delivery of a new version of the Renault ZOE in 2017 which will
have a driving range of up to 300 km The price with the battery on sale option should
be around $ 35000 [103]
Daimler is investing more than euro7 billion ($B 79) in green technologies in the next two
years alone As part of this strategy Mercedes-Benz will expand its PHEV fleet (GLC
Coupeacute 350 e 4MATIC E 350 e S 500 e) by 2018 [104] with all models priced well
above $ 50000 Daimler will also launch a new Smart ForTwo electric vehicle in 2017
with a range of 100 km [105] whose price is expected to be well below $ 30000 [106]
Volkswagen has confirmed its strategy to launch over 20 additional electric vehicle
models by 2020 but without disclosing concrete proposed models [60 107] Within the
group the brand Audi announced the launch by 2018 of the first large‑series battery‑
electric vehicle based on the PHEV Audi e-tron concept The models however have not
been released yet [61]
PSA Peugeot Citroeumln and Dongfeng Group (CN) have strengthened their strategic
partnership with the signing of a new agreement to design an electric version of the
Common Modular Platform (CMP) This future electric platform (e-CMP) will deliver all-
electric vehicles for the Peugeot Citroeumln DS and Dongfeng brands from 2019 However
no concrete model has been presented yet [57]
Outside Europe other automotive OEMs are proposing several electric vehicle models to
be launched in the next 2 - 3 years
Tesla is anticipated to be the worldwide frontrunner with the launch of the Tesla Model 3
announced for 2018 It will be priced below $ 40000 with a driving range above 300 km
[108]
Looking at other US OEMs General Motors will launch the Chevrolet Bolt in 2017 which
will also be priced below $ 40000 and with a driving range above 300 km [109] Ford
will not try to compete with the other two US OEMs in terms of driving range but rather
deliver lighter vehicles with a range of around 150 km at a more affordable price
estimated to be below $ 30000 (eg the new Ford Focus Electric to be launched in 2017)
[110]
Among Japanese OEMs Nissan is going to launch an updated version of Nissan Leaf in
2018-2019 with a driving range of 300 km and with a price estimated below $ 40000
52
[111] Before then the 2017 Nissan Leaf version is expected to have a driving range of
150 km and a price above $ 30000 [112]
Toyota has been reluctant to take on board the full electric vehicle concept with its
strategy focusing instead on HEV and PHEV for short-range urban applications and fuel
cell electric vehicles for longer-range applications However with the steady arrival of
competing battery-electric vehicles with ever increasing driving ranges (eg Chevrolet
Bolt EV Tesla Model 3) Toyota appears to be adjusting its thinking They recently
decided to establish an in-house venture company responsible for developing electric
vehicles (EVs) by 2020 [113] However no concrete models are expected to be launched
in the next 2 - 3 years other than new update versions of their PHEV fleet [114]
Thereafter by 2020 Toyota has announced plans to introduce a small all-electric SUV
[115]
Mitsubishi has announced the launch of the new eX SUV Concept in 2018-2019 with a
range above 300 km and a price below $ 40000 [116]
South Korean OEMs Hyundai and its sister company Kia together have aggressive plans
to become the worlds second highest-volume maker of green cars by 2020 after Toyota
Although HEV and PHEV models will be a substantial part of this plan full electric models
are also foreseen Hyundai is joining the race with a new all-electric SUV with 150 km
range by 2018 [117] but price pictures and previews are not available Hyundai has
also announced the launch in 2017 of the Ioniq model BEV with more than 150 km
driving range and a price below $ 35000 [118] Meanwhile Kia is preparing to launch a
new version of its Kia Soul Electric BEV in 2018 with an improved driving range close to
150 km and expected price of around $ 35000 [119]
Chinese OEMs are much more linked to delivery to the domestic market Looking at the
top 20 PHEV and BEV sales in 2016 (up to October) on the Chinese market [75] the only
non-Chinese electric vehicle model sold is the Tesla Model S (which ranks 17th) This
trend is expected to remain at least until 2020 mainly due to the competitive prices of
local models [120] Most sales are expected to be low-speed models (as is currently the
case eg Kandi Panda and Zotye E-2030 [89]) but also higher class vehicles such as
the new BEV version of the BYD Qin EV300 to be launched by 2017 with 240 km driving
range and price around $ 35000 [70]
352 OEMs Tier 1 and Tier 2 supply chain
The growing electrical vehicle market may be a challenge also for the consolidated EU
OEMs Tier 1 and Tier 2 supply chain industry which has an annual revenue amounting to
13 of the EU OEMs industry Electric vehicle manufacturers require suppliers of a range
of new components for electric power train other than cells and battery packs Such
53
components include connectors cables power electronics for controllers converters and
chargers novel system integration services innovative thermal management solutions
and new light materials for the car bodyframe such as aluminium or carbon fibre-
reinforced polymers OEMs need to build up a new set of suppliers for these products
which changes the traditional group of Tier 1 and Tier 2 suppliers (which are mainly
designing and producing parts for internal combustion engine powertrain such as pistons
camshafts spark plugs injection pumps turbo chargers fuel tanks alternators oil
pumps motor oils or manual and automatic gear boxes) The current status of Tier 1
OEMs suppliers shows a strong competitive position of EU companies with total revenue
of B$ 277 (see Table 7 and Figure 25) Besides that their manufacturing capacity is
globally distributed since their production plants for parts are normally located in the
proximity of OEMs vehicle assembling plants which are also distributed around the
globe The degree of manufacturing delocalization can be quantified looking at the
financials of the top 10 automotive suppliers with headquarters in Europe and North
America where it turns out that they generate 18 to 28 of revenues in Asia
supplying OEMs with their products [121] With a growing electrical vehicle market this
picture may change substantially and this competitive position of EU Tier 1 industry may
be challenged
Table 7 Geographical comparison of automotive suppliers 2014 financial indicators (figures in US$) [121]
54
Figure 25 4D analysis of top 20 automotive suppliers for EBIT margin (ratio of Earnings before Interest and Taxes to net revenue earned) and revenues (2014) [121]
The growing electrical vehicle market may create great opportunities for companies
accepting risks and willing to invest In this context besides the traditional OEMs
suppliers new companies are also supplying the car manufacturers Some traditional
suppliers are investing heavily in a range of new technologies relevant to e-mobility (eg
Continental (DE) Michelin (FR) ZF Friedrichshafen AG (DE)) or are looking to create
joint ventures with established companies already active in the e-mobility sector (eg
Bosch (DE)) Other companies traditionally operating in the industrial sector are also
becoming OEMs suppliers such as companies active in the power electronic field (eg
Semikron (DE) Mitsubishi (JP) Toshiba (JP) and Actia (FR)) or specialised in
convertercharger products (eg BRUSA Elektronik (CH) EDN GROUP (IT)) cable and
connectors (eg Lapp Holding AG (DE) Lem Holding SA (CH)) and electric engines (eg
Yasa Motors (UK) Sram Technology (IT) BorgWarner (USA)) Similarily companies who
traditionally supply the aerospace and military industry and who have already developed
suitable products and services for e-mobility (eg BAE Systems (UK) Ricardo (UK)) are
breaking into the OEM supply market In addition there are also companies providing
consulting services for system integration (eg AVL (AT) Lenze Schmidhauser (CH))
55
36 Recycling
Due to the constantly increasing significance of lithium ion batteries especially in the
growing automotive and energy storage sectors recycling processes and related issues
are highly relevant for the EU circular economy package [122] Greater recycling of
waste batteries and increased re-use or second use will bring benefits for both the
environment and the economy by boosting business and reducing waste Increased
recycling will also mitigate the dependence on certain critical materials such as cobalt
The Circular Economy Strategy is related to the transfer of the Extended Producer
Responsibility (EPR) and to the End-of-Waste status The EPR concept is aimed at
promoting the integration of environmental costs associated with goods throughout their
life cycles into the market price of the products The EU has issued a number of
directives aimed at increasing producer responsibility including the EU Battery Directive
(Directive 200666EC) [9] that introduces the EPR for battery waste The directive
enforces battery producers or third parties acting on their behalf to finance the net cost
of collecting treating and recycling waste batteries However the Directive needs to
consider the specificities of lithium-ion traction batteries in the absence of guidelines on
the transfer of ownership and changes to EPR with corresponding identification of
responsibilities for a second use option In addition the Battery Directive needs to be
harmonized with Directive 200053EC on end-of-life vehicles and with Directive
200898EC on waste (Waste Framework Directive)
Recycling of lithium-ion batteries is a complex and costly process hindered by the
absence of a standardised product across the lithium ion battery market which as a
result has a wide variety of chemistries and battery formats Furthermore additional
complexities arise from the need for dismantling and pre-treatment of large electric
vehicle batteries to reach sizes compatible with recycling process A comprehensive
overview of various steps in recycling processes is given in [22 123 124] Four types of
recycling technologies exist [22]
a) mechanical
b) pyrometallurgical
c) hydrometallurgical
d) thermal pre-treatment followed by hydrometallurgical method (often also called
a combination of pyrometallurgical and hydrometallurgical methods)
56
Mechanical treatment includes crushing and physical separation of components and
recovery of the black mass which contains valuable metals such as cobalt nickel
manganese lithium etc [22]
In pyrometallurgical processes spent Li-ion cells are processed at high temperature
without any mechanical pre-treatment as batteries are loaded into the furnace directly
This class of recycling process recovers cobalt nickel copper and iron in form of a metal
alloy Metals such as aluminium manganese and lithium are lost in the slag and plastic
and other organic components are incinerated [22]
Hydrometallurgical methods include mechanical pre-treatment and metal recovery from
the black mass by means of leaching precipitation solvent extraction ion-exchange
resins and bioleaching [22 123] In addition to cobalt nickel copper and iron
hydrometallurgical processes enable recovery of lithium with high purity
A hydrometallurgical process is often preceded by a thermal pre-treatment step (type d)
to remove organic compounds and graphite which adversely affect leaching and solid-
liquid separation steps of the recycling process [22]
At present the main focus in recycling of Li-ion batteries is the recovery of cobalt since
this metal has a high economic value and is a critical raw material for the EU [22] The
recycling rate of lithium from end-of-life products including batteries is currently below
1 according to the International Resources Panel [125] Nevertheless recovery of less
economically valuable metals including lithium may become viable in future [22]
Therefore RampI needs exist for improving the cost effectiveness of the recycling processes
and development of more efficient recycling processes
The efficiency of battery recycling is a combination of two factors collection rate and
recycling efficiency Collection rate expresses the fraction of produced lithium ion
batteries that are collected at their end-of-life while recycling efficiency is expressed as
the weight percentage of metals metal compounds plastics and other products
recovered from the collected waste that can be directly reused in battery production or in
other applications or processes Recycling efficiency is considered a key parameter for
assessing the quality of recycling however a methodology is not yet standardized for its
calculation Pre-normative research to develop standards and guidelines for collection
and transportation of used batteries as well as standards and guidelines for battery
second-use are needed
Efficiency of recycling for various elements in selected processes in terms of recovery
of different material are compared in Table 8
57
Table 8 Efficiency of recycling for various elements in selected processes for NMC and LFP
chemistries [75]
Material Combination of
pyrometallurgical amp
hydrometallurgical
processes - NMC and LFP
[]
Purely
hydrometallurgical
process - NMC only []
Purely
hydrometallurgical
process - LFP only
[]
Lithium 57 94 81
Nickel 95 97 NA
Manganese 0 ~ 100 NA
Cobalt 94 ~ 100 NA
Iron 0 NA 0
Phosphate 0 NA 0
Natural graphite 0 0 0
At present recycling of lithium ion batteries is mainly limited to portable batteries since
still there are no big volumes of waste electric vehicle battery that have reached their
end-of-life Spent Li-ion batteries are recycled industrially in many regions of the world
An overview of recycling companies and their processes is given in Table 9 Data was
compiled from various sources and where possible cross-checked with information on
the websites of the listed companies or by contacting listed companies directly
Table 9 Li-ion battery recycling companies processes and capacity Source [22 123 124 126 127]
Company
(HQ location)
Recycling
facility
location
Battery types Process Recycling
volume tons
of batteries
per year
Europe
Umicore Battery
Recycling(BE)
Hoboken (BE) Li-ion NiMH P 7000
Accurec Recycling
GmbH (DE)
Muumllheim (DE)
Krefeld (DE)
NiCd NiMH
Li-ion
P with H
1500-2000
58
treatment of
the slag and flu
e dust
6000
Glencore
(formerly
XStrata) (CH)
Sudbury (CA)
Rouyn-Noranda
(CA)
Kristiansand (NO)
Li-ion P with H
treatment of
the slag and
electrowinning
7000
Recupyl SA (FR) Grenoble (FR)
Singapore (SG)
Li-ion H 110
AEA Technology
(UK)
Sutherland (UK) Li-ion H
SNAM (FR) Saint Quentin
Fallavier (FR)
NiCd NiMH Li-
ion
P+ mechanical
separation + H
to extract Co
and Ni
300
AkkuSer Oy (FI) Nivala (FI) NiCd NiMH Li-
ion Zn alkaline
mechanical 1000 (Li-ion)
4000
Batrec Industrie
AG (CH)
Wimmis (CH) Li P + mechanical
treatment
200
Euro Dieuze
SARP (FR)
Dieuze (FR) Li-ion H 200
Valdi (ERAMET)
(FR)
Commentry (FR)
Various
including Li-ion
P 20000
(from 2017)
GampP Batteries
(UK)
Darlaston (UK) Various
including Li-ion
North America
Retriev Trail BC (CA) Li metal Li-ion H 4500
59
Technologies Inc
(CA)
Baltimore OH
(US)
Anaheim CA (US)
AERC Recycling
Solutions (US)
Allentown PA
(US)
West Melbourne
FL (US)
Richmond VA
(US)
All types
including Li-ion
and Li metal
P
Japan
Sony Electronics
Inc - Sumitomo
Metals and
Mining Co (JP)
Li-ion P 120-150
Nippon Recycle
Center Corp (JP)
Osaka (JP)
Aichi (JP)
Miyagi (JP)
Ni-Cd NiMH
Li-ion alkaline
P
Dowa Eco-System
Co Ltd (JP)
Various
including Li-ion
P 1000
JX Nippon Mining
and Metals Co
Various
including Li-ion
P 5000
China
Shenzhen Green
Eco-manufacturer
Hi-Tech Co
(GEM) (CN)
Jingmen
Hubei (CN)
NiMH Li-ion H 20000-
30000
Hunan BRUNP
(CN)
Ningxiang
Changsha Hunan
(CN)
Various
including NiMH
and Li-ion
H 3600-10000
gt6000
P ndash pyrometallurgical process H- hydrometallurgical process recycling capacity of the facility
60
In Europe companies such as Umicore (BE) and Recupyl (FR) active for several years in
the battery recycling sector have developed their own recycling processes Umicore has
developed a so-called Umicore process an ultrahigh temperature pyrometallurgical
process and runs a facility in Belgium with an annual capacity of 7000 tons of batteries
[21] Recupyl patented a hydrometallurgical recycling process which has a higher
material recycling efficiency (see Table 8) Accurec Recycling GmbH runs a facility Krefeld
(DE) recycling 1500-2000 tons of spent Li-ion batteries [22 128] Their annual capacity
for disassembly and subsequent recycling of Li-ion automotive batteries is more than 600
tons [128] Valdi (FR) a ERAMET Group subsidiary has transferred its battery recycling
facility from Le Palais-sur-Vienne (FR) to Commentry (FR) where batteries will be
recycled through a dedicated pyrometallurgical process [129] The unit will recover 100
of metal content enabling it to achieve a recycling efficiency target of 65 above the
minimum requirement of 50 stipulated by the EU Batteries Directive (Directive
200666EC) [129] From 2017 Valdi will have annual processing capacity of 20000
tons of batteries [130] AkkuSer Oy (FI) operates a battery recycling facility in Nivala
(FI) where Ni-Cd NiMH lead accumulators alkaline batteries and Li-ion batteries are
mechanically recycled in a so-called Dry-Technologyreg process [22 131] Annually about
1000 tons of spent Li-ion batteries coming from the European market are processed at
this facility [22]
In the United States there is no federal law governing EPR and each state may choose
to implement its own policy and laws California for example is pioneering a process for
waste regulation [132] but so far only portable batteries are considered and California
lacks the infrastructure to manage the forecasted volume of EV lithium ion batteries at
their end-of-life [133] Since 1996 a voluntary programme called Call2Recycle which is
funded by electronics manufacturers has recycled more than 385 million kilograms of
small consumer batteries and mobile phones in the US and Canada but this is still just a
tiny fraction of the total [134] In Canada provinces of British Columbia Quebec and
Manitoba have a mandatory recycling programme and in these places Call2Recycle
collects about 25 of what is sold [134] Retriev Technologies Inc (former Toxco Inc)
which has developed its own hydrometallurgical process is a leading battery recycling
company in Canada and the US Over the past 20 years Retriev has processed more
than 10000 tons of lithium ion batteries Retriev is researching a new recycling method
for Li-ion batteries called direct recovery originally developed by OnTo Technology a
research and development company in Bend (Oregon USA) [134] As explained in
[134] Rather than recovering basic elements as with pyrometallurgy or partially
breaking down the molecular structure of compounds as with hydrometallurgy this
method involves bathing the cathode in a soft chemical solution to rejuvenate it It is a
61
low-temperature low-energy low-emissions process with very limited waste Recycling
using this process is also significantly cheaper compared to conventional pyro- and
hydrometallurgical processes [134] Most of the cost savings come from not having to
rebuild the cathode again as materials are retained in their battery-ready state and since
direct recovery uses less energy than conventional methods [134]
Looking at the Asian region Japan has a legislation requirement for batteries similar to
the EU [135] Japan Portable Rechargeable Battery Recycle Center (JBRC) non-profit
organization provides used battery collection boxes across the country Companies such
as Sony and Nippon Recycle Center Corporation are contracted to receive these batteries
for recycling There are also contracts directly with companies to collect and recycle their
end-of-life batteries as well as battery production scrap material [136]
In China there is currently a shortage of appropriate policies and collection systems for
batteries despite of a growing community concern about the impact of waste lithium ion
batteries on the environment and public health Industry is increasingly expected to
report on and be accountable for the waste their products generate Furthermore the
criticality of some raw materials such as nickel and cobalt puts more pressure on
manufacturers and government to properly address battery recycling Therefore
appropriate policies and collection systems for batteries in China need to be defined and
recycling infrastructure also needs to be developed [137] Some Chinese companies are
active in the battery recycling business such as GEM Jingmen and BRUNP Hunan GEM
has an annual disposal capacity of waste batteries and Co and Ni scrap of about 30000
tons with an annual production of recycled cobalt and nickel more than 3300 tons [137]
A facility of BRUNP Hunan has a total designed processing capacity of 10000 tons per
year
62
4 Conclusions
This report has gathered data on the automotive traction battery value chain with a view
to underpin decisions where European RampI investments are needed considering where
these can create opportunities to boost European competitiveness in the automotive
battery sector On the basis of this data a number of opportunities for increased RampI
support in specific areas of the automotive battery value chain which may help achieve
the objective for increased European competitiveness in this sector have been identified
and are highlighted below
OEMs are facing increasingly stringent emission targets and they will need to consider
greater investment in efficient powertrain technologies going beyond optimization of the
internal combustion engine Furthermore OEMs are looking at evolving consumer
purchasing behaviour and electrical vehicle acceptance which may soon become relevant
in global sales How European OEMs will adjust their strategies varies however a growing
electrical vehicle market may justify growing RampI effort to support a competitive
domestic manufacturing in relevant segments of the value chain including cells for use in
vehicle battery packs
The information provided in this report shows that EU industry has some production base
in all segments of the battery value chain but it is far from being self-sufficient In the
raw and processed materials cell component and cell manufacturing value chain
segments Europe holds a minor share of the market whereas in the pack and vehicle
manufacturing and recycling segments Europe is among the market leaders Within the
car manufacturing segment EU industry is expected to maintain its position also for EV
production
European OEMs and their Tier 1 and Tier 2 suppliers need to be prepared to satisfy the
future demand for electric vehicles as projections for global electrical vehicle sales up to
2040 show an increase in demand Many European Tier 1 and Tier 2 automotive OEM
supply industries currently serving the ICE market are demonstrating their ability to
adapt and respond to new opportunities presented by the growing electrical vehicle
market This flexibility should be supported given the dynamic needs of their OEM
customers many of whom are still developing their own strategy on what part of pack
manufacturing to outsource
Support to RampI in this sector can help existing and new Tier 1 and Tier 2 industries
innovate and increase their flexibility and hence maintain a competitive edge
63
In the recent past the numbers of EV sales did not meet the anticipated level and for the
majority of European OEMs this may have been one reason not to start and sustain
private investments in competitive domestic cell manufacturing
Another factor which has discouraged large scale European cell manufacturing and which
is often cited by car manufacturers is the current global cell manufacturing overcapacity
Nevertheless looking to the future the current over-capacity in itself should not prelude
investments in this area since projections for large penetration of EV indicate that
automotive lithium-ion cell demand and supply may soon be matched (by around 2020)
To become competitive in this time frame however consolidated RampI action at a
European level is required in the short term to secure Europes strong industrial position
in pack manufacturing in the future
Current projections indicate a research trend to develop improved (eg higher voltage)
cells for automotive use based on conventional Li-ion chemistries such as NMC and LFP
The general approach being adopted is to develop advanced materials (eg silicon
enriched anode solid state electrolytes) rather than developing new chemistries at least
until 2025 These improved technologies are speculated to transition by 2030 towards
post Li-ion technologies (Li-air Li-S Na-ion) once their performance is proven in
automotive applications Li-ion technology is therefore expected to remain as the
dominant deployed technology at least until 2025 - 2030
RampI investments in improved contemporary chemistries from materials up to large scale
cell manufacturing capabilities are needed to satisfy the current incremental
performance improvements needed
Similar RampI investments are needed for post-lithium ion chemistries to allow sufficient
time for their development and subsequent translation into a manufacturing process to
realise significant improvements in performance
Failure to invest the necessary resources in this way will only prolong and exaggerate
Europes historical deficit in competitive cell manufacturing which may also threaten
Europes knowledge base which has the tendency to move where production sites are
located
Secure access to materials used in cell manufacture is a fundamental prerequisite if
Europe is to become competitive in this segment Issues associated with access and use
64
of critical materials for cell production can be addressed by (i) tapping new sources of
critical materials (ii) substituting critical materials with less critical ones and (iii)
recyclingreuse of critical materials
RampI support to develop new miningextraction techniques may alleviate potential supply
concerns for materials where reserves are located outside the EU territories
RampI on alternative Li-ion chemistries made of more accessible raw materials could cover
development of alternative chemistries to alleviate the need for the critical materials
cobalt and natural graphite
With regard to lithium projections suggest that reserves are sufficient to satisfy the
increase in demand brought about by increased use of batteries for automotive purposes
Benefits gained from mitigating dependence on critical materials will not be limited to the
raw material sector but and maybe most importantly can enhance opportunities for the
EU industry to break the foreign monopoly in the cell manufacturing sector by
substitution of materials
A sector where EU industry has a strong and dominant position is in the battery recycling
part of the value chain EU pioneering legislation in this area has made it possible to
develop a well-structured industry Recycling also helps alleviate concerns on the
security of supply of critical raw materials used in batteries However the battery
recycling sector is currently struggling to prepare for increased volumes of battery waste
expected from the automotive traction sector
RampI needs exist for improving the cost effectiveness of the recycling processes
development of more efficient processes pre-normative research to develop standards
and guidelines for collection and transportation of used batteries as well as standards and
guidelines for battery second-use
Opportunities for increased European RampI support in areas other than those identified in
this report may also exist including battery RampI for applications other than automotive
When pursued targeted and strategic RampI efforts should be performed in an integrated
approach to leverage the knowledge generated in a cost-effective and innovation-
enhancing manner
65
5 References
1 COM (2015) 6317 final -Towards an Integrated Strategic Energy Technology (SET)
Plan Accelerating the European Energy System Transformation EUROPEAN
COMMISSION Brussels
2 Declaration of Intent for Action 7 of the Integrated SET-Plan Become competitive in
the global battery sector to drive e-mobility forward Available from
httpssetiseceuropaeuimplementing-integrated-set-planbatteries-e-mobility-and-
stationary-storage-ongoing-work
3 Systems Perspectives on Electromobility 2013
4 COM(2014) 297 final On the review of the list of critical raw materials for the EU
and the implementation of the Raw Materials Initiative Communication from the
Commission to the European Parliament the Council the European Economic and
Social Committee and the Committee of the Regions
5 Pillot C The worldwide rechargeable battery market 2015-2025 June 2016
Avicenne Energy
6 Chung D Elgqvist E Santhanagopalan S Automotive Lithium-ion Cell
Manufacturing Regional Cost Structures and Supply Chain Considerations April
2016 Clean Energy Manufacturing Analysis Center (CEMAC)
7 Chung D Elgqvist E Automotive Lithium-ion Batteries in 2015 Research
Highlights CEMAC (CEMAC) Editor March 2016
8 Pillot C Battery Market for Hybrid Plug-in amp Electric Vehicles 25th Edition -
Avicenne Energy 2016
9 Directive 200666EC of the European Parliament and of the Council on Batteries and
Accumulators and waste batteries and accumulators and repealing Directive
91157EEC 2006 OJ L2661 26 September 2006
10 Eurostat
11 ACEA - Statistics Available from httpwwwaceabestatistics
12 BIR (Bureau of International Recycling) Available from httpwwwbirorg
13 Report on critical raw materials for the EU report of the Ad hoc working group on
defining critical raw materials D ENTR Editor 2014
14 Annexes to the report on critical raw materials for the EU report of the Ad hoc
working group on defining critical raw materials D ENTR Editor 2014
15 US Geological Survey Minerals Information Cobalt Statistics and Information
Mineral Commodity Summaries January 2016 Available from
httpmineralsusgsgovmineralspubscommoditycobaltindexhtmlmcs
16 US Geological Survey Minerals Information Graphite Statistics and Information
Mineral Commodity Summaries January 2016 Available from
httpmineralsusgsgovmineralspubscommoditygraphite
17 US Geological Survey Minerals Information Silicon Statistics and Information
Mineral Commodity Summaries January 2016 Available from
httpmineralsusgsgovmineralspubscommoditysilicon
66
18 US Geological Survey Minerals Information Lithium Statistics and Information
Mineral Commodity Summaries January 2016 Available from
httpmineralsusgsgovmineralspubscommoditylithium
19 US Geological Survey Minerals Information APPENDIX CmdashReserves and
Resources 2016 Available from
httpmineralsusgsgovmineralspubsmcs2016mcsapp2016pdf
20 Fichtner M and E Sheridan Novel Materials for Electrochemical Storage in EERA
Workshop2016 Brussels
21 Reuter B et al Future Resource Availability for the Production of Lithium-Ion
Vehicle Batteries 2014
22 Chagnes A and J Swiatowska eds Lithium Process Chemistry Resources
Extraction Batteries and Recycling 2015 Elsevier Amstedam
23 Hocking M et al Industry - Lithium 101 - Welcome to the Lithium-ion Age FITT in
Markets Research9 May 2016 Deutsche Bank
24 Bernhart W Powertrain 2020 The Li-ion battery value chain ndash trends and
implications 2011
25 Cost and performance of EV batteries in 2012 Element Energy Limited - The
Committee on Climate Change Cambridge p 100
26 Anderman M Tesla battery report 2014 Advanced Automotive Batteries p 39
27 Pillot C The rechargeable battery market and main trends 2014-2015 in Batteries
2015 - 2015 Nice France
28 Pillot C Battery Market Development for Consumer Electronics Automotive and
Industrial Materials Requirements and Trends in Qinghai EV Rally 20152015
Xining China
29 httpwwwlitarioncomindexhtml
30 Tikekar MD et al Design principles for electrolytes and interfaces for stable
lithium-matl batteries Nature Energy September 2016 1
31 Janek J and WG Zeier A solid future for battery development Nature Energy
September 2016 1
32 Pang Q et al Advances in lithium-sulfur batteries based on multifunctional
cathodes and electrolytes Nature Energy 2016 1 p 1-11
33 Aurbach D et al Advances in understanding mechanisms underpinning lithium-air
batteries Nature Energy 2016 1 p 1-11
34 Roadmap integrierte Zell- und Batterieproduktion Deutschland January 2016
Nationale Platform Elektromobilitat (AG 2 - Batterietechnologie) Berlin
35 EUROBAT e-mobility - Battery RampD Roadmap 2030 - Battery Technology for Vehicle
Applications 2015 EUROBAT p 36
36 E-mobility index Q3 2015 FKA and Roland Berger
37 Chung D Elgqvist E Santhanagopalan S Automotive Lithium-ion Battery (LIB)
Supply Chain and US Competitiveness Considerations June 2015 Clean Energy
Manufacturing Analysis Center (CEMAC)
67
38 DChung National Renewable Energy Laboratory (NREL) Personal communication
May 2016
39 httpwwwtotalcomenmedianewspress-releasestotal-takes-control-saft-groupe-
after-successful-tender-offer-which-will-be-re-opened-july-19-august
40 httpwwwsaftbatteriescompresspress-releasessaft-takes-control-nersac-lithium-
ion-battery-factory
41 Schamp EW The formation of a New Technological Trajectory of Electric
Propulsion in the French Automobile Industry Discussion Paper 122014 2014
German Development Institute Bonn
42 httpwwwabslspaceproductscomDefaultaspxpid=2
43 httpwwwagmbatteriescom
44 httpwwwleclanchecomtechnology-products
45 httpeas-germanyde
46 Pillot C Personal communication September 2016
47 httpencustomcellsde
48 httpswwwssl-energiedeproduktespeichern (in German only)
49 httpliacon-batteriesdezelltechnologie-3lang=en
50 httpwwwvarta-
microbatterycomfileadminuser_uploadmb_datacms_datanews_data1264f_16102
5_VARTA_PM_Electronica_ENGpdf
51 httpwwweuropeanbatteriescom
52 httpwwwlithium-systemscomproducts
53 httpwwwelectric-vehiclenewscom201411germany-exits-ev-battery-cellhtml
54 httpwwwieahevorgby-countryfrance-industry
55 httpsenwikipediaorgwikiRenault_Zoe
56 httpinsideevscomrenault-zoe-electrifies-the-flins-factory
57 httpwwwnissan-globalcomENNEWS2009_STORY091208-01-ehtml
58 httpeconomicosapoptnoticiasrenault-admite-projectos-para-antigo-espaco-para-
baterias-da-nissan_210018
59 httpinsideevscomlg-chem-build-battery-plant-europe
60 httpevobsessioncomlg-chem-to-open-ev-battery-factory-in-wroclaw-poland-my-
city
61 httpenkipostnetproductSamsung-established-EV-Battery-Factory-in-East-Europe-
seeking-Korean-China-East-Europe-triangle319
62 A Review of Battery Technologies for Automotive Applications 2013 EUROBAT
63 httpwwwautonewscomarticle20160225COPY01302269992daimler-declines-to-
invest-in-battery-cell-production
64 httpwwwsueddeutschedewirtschaftelektromobilitaet-der-staat-zahlt-mit-
12842354-2
68
65 httpwwwgreencarreportscomnews1104237_vw-to-make-big-electric-car-
commitment-battery-factory-too
66 httpwwwdwcomenvw-mulls-e-battery-factory-of-its-owna-19285371
67 Altenburg T From combustion engines to electric vehicles a study of technological
path creation and disruption in Germany2014 Dt Inst fuumlr Entwicklungspolitik
68 httpwwwautocarcoukcar-newsindustrynissan-invests-C2A3265m-
sunderland-battery-plant
69 httpwwwnissan-
globalcomENENVIRONMENTCARFUEL_BATTERYDEVELOPMENTLITHIUM
_ION_BATTERY
70 httpwwwjmbatterysystemscomcompanyabout-us
71 my renault zoe Available from httpmyrenaultzoecomindexphp201609
72 httpwwwaccumotivedeenhome-englischhtml
73 httpevobsessioncomdaimler-putting-e500-million-into-second-lithium-ion-battery-
plant-in-germany
74 SEC(2011) 1609 final - Materials Roadmap Enabling Low Carbon Energy
Technologies in Commission Staff Working Paper European Commission
75 httpev-salesblogspot JP- Available from httpevobsessioncom
76 hybridcars Available from httpwwwhybridcarscomkreisel-electric-gaining-
attention-from-automakers-looking-to-join-the-electric-car-revolution
77 httpwwwcontinental-
corporationcomwwwpressportal_com_enthemespress_releases3_automotive_grou
ppowertrainpress_releasespr_2008_09_24_liion_batteries_enhtml
78 httpwwwbmz-gmbhdepresspress-releases024545568html
79 Press Release Samsung SDI available at httpwwwsamsungsdicomsdi-
news379htmlpageIndex=1ampidx=379ampsearchCondition=0ampsearchKeyword=
80 Prosnigg F Key topics regarding safety out of automotive PHEV battery serial
development in Batteries 20142014 Nice France
81 Thanner HJ Development and Production of Li-ion Battery Packs for Transport
Application An Industry Perspective in 8th A3PS Conference Eco-Mobility
20132013 Vienna Austria
82 httpsenwikipediaorgwikiBollorC3A9_Bluecar
83 httpwwwoicanetcategoryproduction-statistics
84 Pillot C The Rechargeable Battery Market and Main Trends 2014-2025 in 32nd
International Battery Seminar amp ExhibitMarch 9 2015
85 Finance BNE Q1 2016 Global Electrified Transport Market Outlook February
2016
86 European Alternative Fuels Observatory httpwwweafoeu
87 Towards Low-Emission Mobility in European Political Strategy Centre (EPSC)
Strategic Notes20 July 2016 p 1-9
69
88 Global EV Outlook 2015 2015 IEA (International Energy Agency) p 1
89 Overview Document - Strategic Energy Technology (SET) Plan Towards an
Integrated Roadmap RampI challenges and Needs of the EU Energy System 2014
EUROPEAN COMMISSION Brussels p 54
90 Will solar batteries and electric cars re-shape the electricity system 2014 UBS p
58
91 Finance BNE Heres How Electric Cars Will Cause the Next Oil Crisis available
from httpwwwbloombergcomfeatures2016-ev-oil-crisis February 2016
92 Finance BNE press-release Electric vehicles to be 35 of global new car sales by
2040 available from httpaboutbnefcompress-releaseselectric-vehicles-to-be-35-
of-global-new-car-sales-by-2040 2016
93 European Commission - 2030 climate amp energy framework Available from
httpeceuropaeuclimapoliciesstrategies2030_en
94 Californiarsquos New Climate Legislation What Does it Mean for Electric Cars
Available from httpblogucsusaorgdave-reichmuthcalifornias-new-climate-
legislation-what-does-it-mean-for-electric-
cars_ga=1104530118778381001480416715
95 China to toughen vehicle emissions standards Available from
httpasianikkeicomPolitics-EconomyPolicy-PoliticsChina-to-toughen-vehicle-
emissions-standardspage=1
96 Europe When every gram counts 2015 PWC
97 van der Slot A et al Integrated Fuels and Vehicles Roadmap to 2030 and beyond
2016 Roland Berger
98 Toyota 2017 Mirai fuel cell vehicle remains $57500 312-mile electric range
Available from httpwwwgreencarcongresscom20160920160921-miraihtml
99 Singer M Consumer Views on Plug-in Electric Vehicles ndash National Benchmark
Report 2016 NREL (National Renewable Energy Laboratory)
100 Gallagher KG et al PHEV and EV Battery Performance and Cost Assessment
Presented at the 2015 US DOE VEHICLE TECHNOLOGIES OFFICE ANNUAL
MERIT REVIEW AND PEER EVALUATION MEETING June 9 2015 Argonne
National Laboratory
101 Longer Range All-New 2018 BMW i3 To Launch Next Year ndash Welt am Sonntag
Available from httpinsideevscomrumor-longer-range-new-2018-bmw-i3-launch-
next-year
102 BMW crams more batteries into compact 2017 i3 boosts range to 112 miles
Available from httpswwwcnetcomroadshowauto2017-bmw-i3preview
103 NEW Renault Zoe ZE 40 NEDC Range Specs Price Review Available from
httphanditechrenault-zoe-ze-40-2017-electric-car
104 Daimler investing gteuro7B in next 2 years in green tech fuel cell plug-in BEV
architecture 48V Available from
httpwwwgreencarcongresscom20160620160613-daimlerhtml
70
105 2018 Smart ForTwo Electric Drive details released before Paris Motor Show
Available from httpwwwgreencarreportscomnews1106298_2018-smart-fortwo-
electric-drive-details-released-before-paris-motor-show
106 Tackling the mean streets of Miami in Smarts pint-size electric car Available from
httpswwwcnetcomroadshowauto2017-smart-fortwopreview
107 STAKEHOLDER PRESENTATION VOLKSWAGEN AG June 21st 2016 European
Commission - European approach on battery cell production Brussels
108 TESLA MODEL 3 PERFORMANCE SPECS AND NEWS
109 2017 Chevy Bolt EV price electric car starts at $37495 before incentives (as
promised) Available from httpwwwgreencarreportscomnews1106177_2017-
chevy-bolt-ev-price-electric-car-starts-at-37495-before-incentives-as-promised
110 Next Nissan Leaf confirmed for 60-kwh battery 200 miles of range Available from
httpwwwgreencarreportscomnews1104610_next-nissan-leaf-confirmed-for-60-
kwh-battery-200-miles-of-range
111 Next Nissan Leaf EV will hit 200-mile range just like Chevy Bolt Tesla Model 3
Available from httpswwwextremetechcomextreme230550-next-nissan-leaf-ev-
will-hit-200-miles-just-like-chevy-bolt-tesla-model-3
112 2017 NISSAN LEAF PRICE RANGE amp RELEASE DATE
113 Toyota battery RampD will allow all-electric car in a few years likely 2020 Available
from httpwwwgreencarreportscomnews1107466_toyota-battery-rd-will-allow-
all-electric-car-in-a-few-years-likely-2020
114 Toyota to Establish In-house Venture Company for EV Development Available from
httpnewsroomtoyotacojpendetail14281296
115 httpwwwgreencarreportscomnews1107466_toyota-battery-rd-will-allow-all-
electric-car-in-a-few-years-likely-2020
116 Mitsubishi eX SUV Concept Available from http2016bestsuvscommitsubishi-ex-
suv-concept
117 Hyundai to launch all-electric SUV in 2018 with 200-mile range
118 2017 Hyundai Ioniq Electric To Feature 110 Mile Range Available from
httpevobsessioncom2017-hyundai-ioniq-electric-to-feature-110-mile-range
119 The importance of 2017 Kia Soul EV Available from
httppushevscom20160827the-importance-of-2017-kia-soul-ev
120 Skepticism surrounds China EV boom Available from
httpwwwautonewscomarticle20160501GLOBAL03305029967skepticism-
surrounds-china-ev-boom
121 Seider C AUTOMOTIVE 40 Sensing the road ahead for tier 1 suppliers December
2015 NTT DATA Deutschland - wwwnttdatacomde Munich
122 Dr Axel Thielmann AS Prof Dr Ralf Isenmann Prof Dr Martin Wietschel Dr
Patrick Ploumltz Product Roadmap Lithium-Ion Batteries 2030 2013 Fraunhofer
Institute for Systems and Innovation Research ISI p 20
123 Swain B Recovery and recycling of lithium A review Separation and Purification
Technology 2017 172 p 388-403
71
124 European Li-Ion Battery Advanced Manufacturing for Electric Vehicles in ELIBAMA
project report available from httpselibamafileswordpresscom201410v-d-
batteries-recycling1pdf2014
125 Reuter MAH C van Schaik A Heiskanen K Meskers C Hageluumlken C Metal
Recycling Opportunities Limits Infrastructure A Report of the Working Group on
the Global Metal Flows to the International Resource Panel 2013 United Nations
Environment Programme (UNEP)
126 Ellis TW and AH Mirza Battery Recycling defining the market and identifying
the technology required to keep high value materials in the economy and out of the
waste dump Available at
httpswwwnistgovsitesdefaultfilesdocumentstipwppswp245_battery_recycling_
defining_the_marketpdf
127 Saloojee F and J Lloyd Lithium Battery Recycling Process Available from
httpwwwsagreenfundorgzawordpresswp-contentuploads201507Lithium-
Battery-Recycling-Literature-Review-CM-Solutionspdf 31 March 2015 Crundwell
Management Solutions (PTY) LTD South Africa
128 httpwwwaccurecdeabout
129 Valdi Newsletter No7 available at
httpwwwerametcomsitesdefaultfilesvaldi_newsletter_7enpdf June 2016
130 httpwwwerametcomenvaldi-recycling-catalysts-batteries-and-metal-oxides
131 httpwwwakkuserfienservicehtm
132 Dr Axel Thielmann AS Prof Dr Ralf Isenmann Prof Dr Martin Wietschel
Technology Roadmap Energy storage for Electric mobility 2030 2013 Fraunhofer
Institute for Systems and Innovation Research ISI p 32
133 William Tokash AD Executive summary Market Data Advanced Batteries for
Utility-Scale Energy Storage 2016 Navigant research
134 Gies E Lazarus batteries Nature 2015 526 p S100-S101
135 BATTERY STORAGE FOR RENEWABLES MARKET STATUS AND TECHNOLOGY
OUTLOOK 2015 International Renewable Energy Agency (IRENA) p 60
136 httpwwwrecycle21cojprecycle-eservicedetailhtml
137 Zeng X J Li and L Liu Solving spent lithium-ion battery problems in China
Opportunities and challenges Renewable and Sustainable Energy Reviews 2015 52
p 1759-1767
72
List of abbreviations and definitions
LCO Lithium Cobalt Oxide ndash Cathode Material
NMC Nickel Manganese Cobalt Oxide ndash Cathode Material
NCA Nickel Cobalt Aluminium Oxide ndash Cathode Material
LFP Lithium Iron Phosphate - Cathode Material
LMO Lithium Manganese Oxide (spinel) ndash Cathode Material
EV Electric Vehicle
HEV Hybrid Electric Vehicle
PHEV Plug-in Hybrid Electric Vehicle
BEV Battery Electric Vehicle
ICE Internal Combustion Engine
CAGR Compound Annual Growth Rate
GWh Giga Watt Hour
kWh Kilo Watt Hour
ESS Energy Stationary Storage
GHG Green House Gases
LME Lithium Metal Equivalent
LCE Lithium Carbonate Equivalent
EPR Extended Producer Responsibility
US United States
KR South Korea
JP Japan
EU European Union
CN China
CH Switzerland
DE Germany
FR France
NL Netherland
BE Belgium
IT Italy
73
List of figures
Figure 1 Automotive lithium-ion battery value chain (data from 2015) 6
Figure 2 Geographical distribution of Li resources and reserves Source [22] 11
Figure 3 Left ndash Development of the cathode active materials market in 2000-2015
Right ndashdemand division per material type and regional distribution of the manufacturers
(according to the location of the headquarters) in 2015 (Used with permission from
Avicenne Energy [5]) 13
Figure 4 Expected market volume per material type in 2025 (left) and as compared to
2015 (right) (Used with permission from Avicenne Energy) [5] 14
Figure 5 Development of the anode active materials market in 2006-2015 market
division per material type and regional distribution of the top-12 manufacturers of natural
and artificial graphite anode materials in 2015 (Used with permission from Avicenne
Energy [5]) 15
Figure 6 Forecast market division per anode active material type in 2025 (left) and as
compared to 2015 (right) (Used with permission from Avicenne Energy [5]) 16
Figure 7 Left ndash Development of the electrolyte market in 2000-2015 and right ndash
Regional distribution of the electrolyte producers in 2015 (Used with permission from
Avicenne Energy [5]) 17
Figure 8 World-wide demand and offer of electrolytes for Li-ion batteries (Used with
permission from Avicenne Energy [5]) 18
Figure 9 Electrolyte market forecast till 2025 (Used with permission from Avicenne
Energy [5]) 19
Figure 10 Left ndash Development of the separator market in 2005-2015 [5] and right ndash
Regional distribution of the separator producers in 2015 (Used with permission from
Avicenne Energy [5]) 20
Figure 11 Projected separator market growth (Used with permission from Avicenne
Energy [5]) 21
Figure 12 Forecasted battery technology evolution [34] 25
Figure 13 Market share of various Li-ion cell producers in 2015 left ndash in volume right ndash
in value (Used with permission from Avicenne Energy [5]) 27
Figure 14 Battery cell production capacity (Used with permission from Avicenne Energy
[5]) 35
Figure 15 Automotive Li-ion battery cell manufacturing capacity and utilization in 2014
Source[7 37] 36
Figure 16 Estimated electric vehicle Li-ion battery cell demand and global automotive
Li-ion battery cell manufacturing capacity [6] 37
Figure 17 Worldwide demand for automotive Li-ion battery cells in 2015-2025
Source[34] 38
Figure 18 Projected growth of Li-ion pack market (Used with permission from Avicenne
Energy [5]) 39
Figure 19 Cumulative volume of automotive battery pack sales by region of OEMs
headquarters [75] 42
Figure 20 Volume automotive battery pack sales by model and region of OEMs
headquarters [75] 43
Figure 21 Global market share of the top 20 PHEV and BEV producers based on [75]
(Producer is assigned to a region according to the location of its Headquarters eg
74
Toyota is considered to be a Japanese producer regardless of whether manufacturing is
taking place in Japan or elsewhere) 46
Figure 22 Projected global sales of new PHEV and BEV vehicles Source [5 8 34 75
90-92] 48
Figure 23 Projected global sales of new PHEV and BEV vehicles for 2015-2025 Source
[5 8 34 75 90-92] 48
Figure 24 Projected European sales of new PHEV and BEV vehicles for 2015-2025
Source [34 75 90] 49
Figure 25 4D analysis of top 20 automotive suppliers for EBIT margin (ratio of Earnings
before Interest and Taxes to net revenue earned) and revenues (2014) [121] 54
75
List of tables
Table 1 Main producers main source of import into EU substitutability index and
recycling rate of cobalt natural graphite silicon metal and lithium [4 15-18] 8
Table 2 Annual manufacturing capacity of Li-ion cells worldwide in 2014 [7 37] 29
Table 3 Annual manufacturing capacity of automotive Li-ion cells worldwide in 2016 [6
38] 30
Table 4 Li-ion cell actual production volume for 2015 and production capacity of
selected European manufacturers Source [5 40] [43] [44] [46] 33
Table 5 OEMs Battery pack manufacturing strategy 40
Table 6 Price and range of upcoming EV models (2017-2020) as announced by OEMs
differentiated by region 50
Table 7 Geographical comparison of automotive suppliers 2014 financial indicators
(figures in US$) [121] 53
Table 8 Efficiency of recycling for various elements in selected processes for NMC and
LFP chemistries [75] 57
Table 9 Li-ion battery recycling companies processes and capacity Source [22 123
124 126 127] 57
Europe Direct is a service to help you find answers
to your questions about the European Union
Freephone number ()
00 800 6 7 8 9 10 11
() The information given is free as are most calls (though some operators phone boxes or hotels may
charge you)
More information on the European Union is available on the internet (httpeuropaeu)
HOW TO OBTAIN EU PUBLICATIONS
Free publications
bull one copy
via EU Bookshop (httpbookshopeuropaeu)
bull more than one copy or postersmaps
from the European Unionrsquos representations (httpeceuropaeurepresent_enhtm) from the delegations in non-EU countries (httpeeaseuropaeudelegationsindex_enhtm) by contacting the Europe Direct service (httpeuropaeueuropedirectindex_enhtm) or calling 00 800 6 7 8 9 10 11 (freephone number from anywhere in the EU) () () The information given is free as are most calls (though some operators phone boxes or hotels may charge you)
Priced publications
bull via EU Bookshop (httpbookshopeuropaeu)
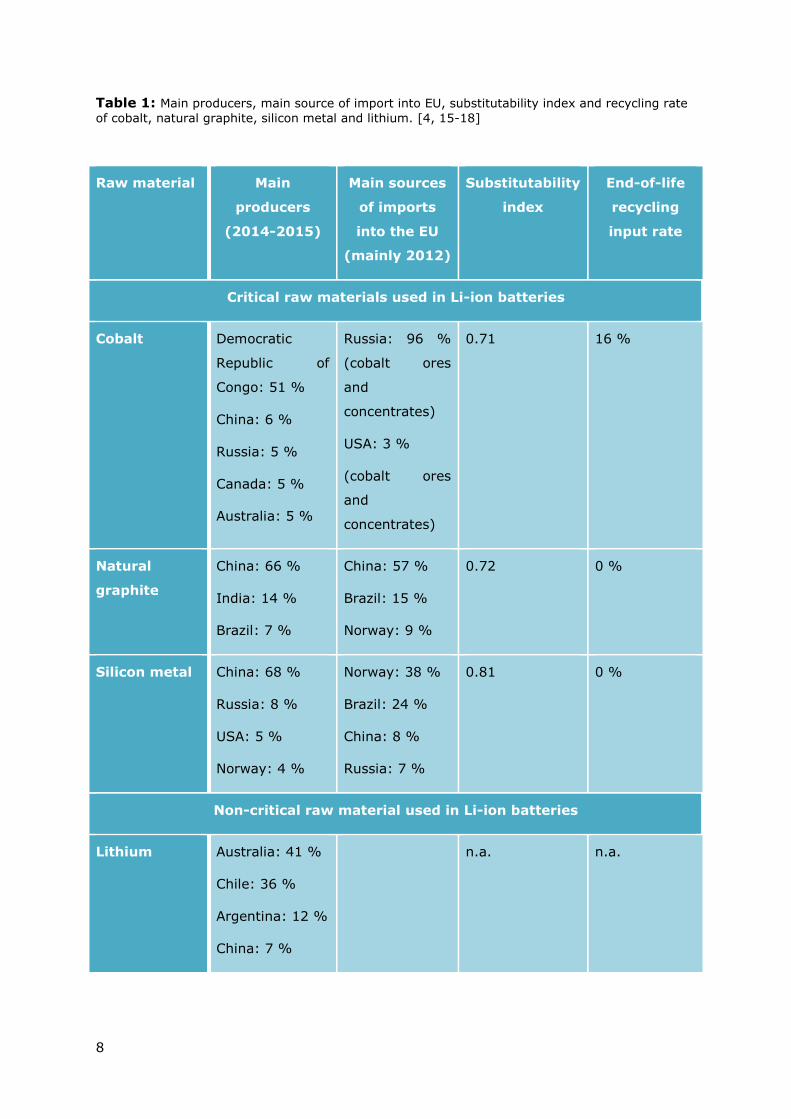