litter and
TRANSCRIPT

AMAP
LITTER AND MICROPLASTICS MONITORING GUIDELINES ARCTIC MONITORING & ASSESSMENT PROGRAMME
version 1.0
AMAP Arctic Monitoring and Assessment Programme (AMAP)

Educational use: This report (in part or in its entirely) and other AMAP products available
from www.amap.no can be used freely as teaching materials and for other educational
purposes.
The only condition for such use is acknowledgement of AMAP as the source of the material
according to the recommended citation.
In case of questions regarding educational use, please contact the AMAP Secretariat
Note: This report may contain material (e.g., photographs) for which permission for use will
need to be obtained from original copyright holders.
Disclaimer: The views expressed in this peer-reviewed report are the responsibility of the
authors of the report and do not necessarily reflect the views of the Arctic Council, its
members, or its observers.
AMAP
LITTER AND MICROPLASTICS
MONITORING GUIDELINES Version 1.0
AMAP Arctic Monitoring and Assessment Programme (AMAP) Tromsø, 2021

AMAP Litter and Microplastics Monitoring Guidelines
AMAP Litter and Microplastics Monitoring Guidelines
__________________________________________________________________________________
© Arctic Monitoring and Assessment Programme, 2021
Citation
AMAP, 2021. AMAP Litter and Microplastics Monitoring Guidelines. Version 1.0. Arctic Monitoring
and Assessment Programme (AMAP), Tromsø, Norway, 257pp.
Technical production management
Jan René Larsen (AMAP Secretariat)
Technical and linguistic editing
Carolyn Mallory
Cover photograph
Jakob Strand
Back cover photograph
Peter Murphy
AMAP Litter and Microplastics Monitoring Guidelines
Table of Contents
Preface ............................................................................................................................. 1
1.0 Introduction ................................................................................................................ 4
1.1 Purpose of the guidelines .................................................................................................... 5
1.2 Existing frameworks with relevance for litter and microplastics monitoring ......................... 6
1.3 Importance of harmonization and standardization in litter and microplastics work .............. 7
1.4 Examining litter and microplastics across the Arctic ............................................................. 9
2.0 Guidance for Monitoring Abiotic Environmental Compartments ................................ 15
2.1 Wet and dry atmospheric deposition ................................................................................. 15 2.1.1 Introduction and description of purpose/aims of monitoring ............................................................ 15 2.1.2 Summary of available information/existing monitoring frameworks ................................................. 16 2.1.3 Trends in literature in Arctic regions .................................................................................................. 17 2.1.4 Benefits and limitations ...................................................................................................................... 18 2.1.5 Sampling strategy and methodology .................................................................................................. 19 2.1.6 Quality assurance/quality control (QA/QC) and reporting/data management .................................. 21 2.1.7 Existing monitoring for populations/contaminants in the Arctic ........................................................ 22 2.1.8 Suggestion for future activities/knowledge gaps ............................................................................... 22
2.2 Water ............................................................................................................................... 30 2.2.1 Introduction ........................................................................................................................................ 30 2.2.2 Status of global science ....................................................................................................................... 30 2.2.3 Trends to date ..................................................................................................................................... 33 2.2.4 Benefits of using water samples ......................................................................................................... 33 2.2.5 Methods .............................................................................................................................................. 34 2.2.6 Quality assessment/quality control (QA/QC) specific to the compartment/matrix ........................... 36 2.2.7 Existing monitoring for populations/contaminants in the Arctic ........................................................ 36 2.2.8 Recommendations .............................................................................................................................. 37 2.2.9 Knowledge gaps and research priorities ............................................................................................. 40
2.3 Monitoring of microlitter in aquatic and shoreline sediments ............................................ 46 2.3.1 Introduction ........................................................................................................................................ 46 2.3.2. Status of global science ...................................................................................................................... 46 2.3.3 Current levels in the Arctic .................................................................................................................. 47 2.3.4 Benefits of using sediments as a plastic monitoring matrix ............................................................... 48 2.3.5 Limitations to using sediments as a plastic monitoring matrix ........................................................... 48 2.3.6 Methods .............................................................................................................................................. 49 2.3.7 Quality assurance/quality control (QA/QC) specific to the compartment/matrix .............................. 52 2.3.8 Existing monitoring for sediments/contaminants in the Arctic .......................................................... 53 2.3.9 Recommendations .............................................................................................................................. 53 2.3.10 Research gaps ................................................................................................................................... 54
2.4 Terrestrial soils ................................................................................................................. 63 2.4.1 Introduction ........................................................................................................................................ 63 2.4.2 Existing monitoring frameworks for microplastics in terrestrial soils ................................................. 64 2.4.3 Sampling .............................................................................................................................................. 64 2.4.4 Quality assurance/quality control (QA/QC) for microplastics in terrestrial soils ................................ 65 2.4.5 Recommendations for monitoring microplastics in soils .................................................................... 65 2.4.6 Conclusions ......................................................................................................................................... 66
2.5 Ice and snow (from lakes and rivers, glacier cores, sea ice) ................................................. 69 2.5.1 Introduction ........................................................................................................................................ 69 2.5.2 Status of global science ....................................................................................................................... 69 2.5.3 Trends to date ..................................................................................................................................... 70

AMAP Litter and Microplastics Monitoring Guidelines
2.5.4 Benefits ............................................................................................................................................... 71 2.5.5 Limitations .......................................................................................................................................... 71 2.5.6 Methods .............................................................................................................................................. 72 2.5.7 Plastic identification ............................................................................................................................ 73 2.5.8 Existing monitoring for populations/contaminants in the Arctic ........................................................ 73 2.5.9 Suggestions for future activities/knowledge gaps .............................................................................. 74
2.6 Litter on Arctic and sub-Arctic shorelines ........................................................................... 79 2.6.1 Introduction ........................................................................................................................................ 79 2.6.2 Status of global science ....................................................................................................................... 79 2.6.3 Trends to date ..................................................................................................................................... 80 2.6.4 Pros and cons of monitoring ............................................................................................................... 80 2.6.5 Methods .............................................................................................................................................. 81 2.6.6 Quality assurance/quality control (QA/QC) ........................................................................................ 92 2.6.7. Existing monitoring for marine litter on Arctic shorelines ................................................................. 93
2.7 Seabed ........................................................................................................................... 100 2.7.1 Introduction ...................................................................................................................................... 100 2.7.2 Status of global science ..................................................................................................................... 100 2.7.3 Seabed mapping in the Arctic ........................................................................................................... 101 2.7.4 Trends to date ................................................................................................................................... 102 2.7.5 Benefits of monitoring ...................................................................................................................... 103 2.7.6 Limitations ........................................................................................................................................ 103 2.7.7 Methods ............................................................................................................................................ 103 2.7.8 Litter estimates based on imagery .................................................................................................... 104 2.7.9 Fishing for litter - abandoned, lost, or otherwise discarded fishing gear (ALDFG) ........................... 104 2.7.10 Quality assurance/quality control (QA/QC) .................................................................................... 105 2.7.11 Existing monitoring for contaminants in the Arctic ........................................................................ 105 2.7.12 Recommendations .......................................................................................................................... 106
3.0 Guidance for Monitoring Biotic Environmental Compartments ................................ 116
3.1 Invertebrates (benthic and pelagic) ................................................................................. 116 3.1.1 Introduction ...................................................................................................................................... 116 3.1.2 Summary of information to date ...................................................................................................... 117 3.1.3 Sampling ............................................................................................................................................ 119 3.1.4. Extraction ......................................................................................................................................... 119 3.1.5 Quality assurance and quality control .............................................................................................. 120 3.1.6 Recommendations ............................................................................................................................ 120 3.1.7 Existing monitoring for invertebrates/contaminants in the Arctic ................................................... 122
3.2 Fish ................................................................................................................................ 130 3.2.1 Introduction to microplastics in Arctic fish ....................................................................................... 130 3.2.2 Status of global science on microplastics in fish ............................................................................... 130 3.2.3. Rationale for monitoring microplastics in Arctic fish ....................................................................... 135 3.2.4 Methods ............................................................................................................................................ 140 3.2.5. Quality assurance/quality control (QA/QC) ..................................................................................... 143 3.2.6 Existing population or contaminants (not microplastics) monitoring in the Arctic .......................... 144
3.3 Seabirds ......................................................................................................................... 153 3.3.1 Introduction ...................................................................................................................................... 153 3.3.2 Trends to date, globally and in the Arctic ......................................................................................... 154 3.3.3 Benefits of using seabirds as indicators ............................................................................................ 154 3.3.4 Limitations of using seabirds as indicators ....................................................................................... 155 3.3.5 Methods to assess litter and microplastics in seabirds .................................................................... 155 3.3.6 Quality assessment/quality control (QA/QC) specific to the compartment/matrix ......................... 156 3.3.7 Existing monitoring for populations/contaminants in the Arctic ...................................................... 156 3.3.8 Recommendations ............................................................................................................................ 157

AMAP Litter and Microplastics Monitoring Guidelines
3.4 Mammals ....................................................................................................................... 173 3.4.1 Introduction ...................................................................................................................................... 173 3.4.2 State of the global science ................................................................................................................ 173 3.4.3 Information from the Arctic, and trends to date .............................................................................. 174 3.4.6. Methods ........................................................................................................................................... 176 3.4.7 Quality assurance/quality control (QA/QC) specific to the compartment/matrix ............................ 178 3.4.8 Existing monitoring of mammals in the Arctic .................................................................................. 178 3.4.9 Recommendations ............................................................................................................................ 179 3.4.10 Research gaps ................................................................................................................................. 180
4.0 Guidance for Analyses, Modeling, and Data Reporting ............................................ 187
4.1 Types of litter and microplastics monitoring programs in the Arctic ................................. 187 4.1.1 Introduction ...................................................................................................................................... 187 4.1.2 Types of monitoring programs .......................................................................................................... 187 4.1.3 Characteristics of robust monitoring programs ................................................................................ 190
4.2 Data treatment ............................................................................................................... 194 4.2.1 General recommendations on data reporting .................................................................................. 194 4.2.2 Data reporting to NILU/EBAS ............................................................................................................ 194 4.2.3 Data reporting to ICES/DOME ........................................................................................................... 195
4.3 Analytical techniques for the identification of microplastics............................................. 203 4.3.1 Background ....................................................................................................................................... 203 4.3.2 Optical identification methods ......................................................................................................... 203 4.3.3 Chemical analysis techniques ........................................................................................................... 206 4.3.4 Outlook: promising methods for small plastic particle (< 10 µm) quantification ............................. 214 4.3.5 Guidelines for the identification of microplastics ............................................................................. 214
4.4 Modeling ........................................................................................................................ 235 4.4.1 Introduction ...................................................................................................................................... 235 4.4.2 Efforts to date ................................................................................................................................... 236 4.4.3 Difficulties or challenges ................................................................................................................... 236 4.4.4 Data needed and data gaps .............................................................................................................. 237 4.4.5 Long-term benefits ........................................................................................................................... 239
4.5 Synergies with other research and monitoring programs ................................................. 244 4.5.1 Including litter and microplastics monitoring in ongoing contaminant monitoring programs ......... 244 4.5.2 Including litter and microplastics monitoring in other types of programs ....................................... 245 4.5.3 Ongoing monitoring programs .......................................................................................................... 246
5.0 Future Work for AMAP ............................................................................................ 251
Acronyms and Abbreviations ........................................................................................ 253
Authors and Affiliations ................................................................................................ 256
Version history ............................................................................................................. 258

AMAP Litter and Microplastics Monitoring Guidelines
1
Preface
Concerns about microplastics and litter in the environment have been raised at both global and
regional (Arctic Council, EU, OSPAR, Nordic Council) levels. The Working Group on Marine litter
plastics and microplastics and its POPs and EDC1 components: challenges and measures to tackle
the issue (Gallo et al., 2017) discussed the potential impacts of marine plastics on marine biodiversity
and human health (November 2016).
The Nordic Council of Ministers’ declaration (2017) on reducing the environmental impacts of
plastics states that the Nordic countries aspire to be driving forces in efforts to promote a sustainable
approach to the production, use, waste management, and recycling of plastics, and the council has
decided to launch a program to follow up on this issue.
The Fairbanks Declaration from the Arctic Council (2017) notes “(…) growing concerns relating to
the increasing levels of microplastics in the Arctic and potential effects on ecosystems and human
health.”
The Arctic Monitoring and Assessment Programme (AMAP) is mandated to:
• monitor and assess the status of the Arctic region with respect to pollution and climate change
issues.
• document levels and trends, pathways and processes, and effects on ecosystems and humans, and
propose actions to reduce associated threats for consideration by governments.
• produce sound science-based, policy-relevant assessments and public outreach products to inform
policy and decision-making processes2.
AMAP (2017) reported on environmental concentrations and trends of marine plastics and
microplastics and about the biological and toxicological effects of microplastics (MP) in the Arctic.
The Arctic Council Working Group, Protection of the Arctic Marine Environment (PAME),
conducted a desktop study on marine litter in the Arctic region (PAME, 2019). The report
recommended developing a Regional Action Plan on Marine Litter in the Arctic (ML-RAP), and this
plan was approved by the Arctic Council in 2021.
Despite the significant increase in available data on MP pollution and litter debris globally, including
in the Arctic, status reports lack standardization in methodology and reporting consistency. For
macroplastics, methodology exists in some regions (e.g., OSPAR). For MP, there are at present no
harmonized measurements, monitoring methods, or environmental indicators. How the extreme
environmental conditions of the Arctic might affect plastic transport and degradation processes is not
yet known. Emerging knowledge from lower latitudes may not be transferable to the Arctic
environment, so studies specific to Arctic conditions are needed.
The AMAP Litter and Microplastics Expert Group (LMEG) was established in the spring of 2019
with the mandate to:
1 endocrine disrupting chemicals 2 https://www.amap.no/about

AMAP Litter and Microplastics Monitoring Guidelines
2
1. Develop a monitoring plan and program for the monitoring of MP and litter in the Arctic
environment. The program design should secure the necessary information that can quantify and
document levels, trends, and impact/effects of MP and litter in the Arctic environment.
2. Develop necessary technical guidelines supporting the monitoring plan and program. The
guidelines should include:
• Harmonized sampling of the biotic and abiotic matrices in the Arctic environment;
• Guidance on matrix and site selection;
• Standardized sample processing and analytical methods;
• Quality assurance/quality control (QA/QC) procedures;
• Guidance on data management and data reporting;
• To the extent possible, a proposed set of standardized methods that would lead to an
assessment process.
3. Formulate recommendations on these topics and identify areas in which new research and
development are necessary from an Arctic perspective.
These technical guidelines—the AMAP Litter and Microplastics Monitoring Guidelines—support the
AMAP Litter and Microplastics Monitoring Plan (AMAP, 2021) and the Regional Action Plan on
Marine Litter in the Arctic (PAME, 2021). The guidelines have been prepared by LMEG and its
experts from Canada, Denmark, Faroe Islands, France, Germany, Iceland, Italy, Norway, Sweden, and
the USA, and have been subjected to an independent, external review prior to publication.
This is version 1.0 of the document. It is expected that the document will be updated, and future
versions will be under version control.
The views expressed in this document are the responsibility of the authors of the report and do not
necessarily reflect the views of the AMAP Working Group, the Arctic Council, its members, or its
Observers.
References
Arctic Council, 2017. Arctic Council’s Fairbanks ministerial declaration. Arctic Council Secretariat,
Tromsø, Norway. 16pp. [online] URL: https://oaarchive.arctic-
council.org/bitstream/handle/11374/1910/EDOCS-4339-v1-
ACMMUS10_FAIRBANKS_2017_Fairbanks_Declaration_Brochure_Version_w_Layout.PDF?seque
nce=8&isAllowed=y
Arctic Monitoring and Assessment Programme (AMAP), 2017. AMAP Assessment 2016: Chemicals
of Emerging Arctic Concern. Arctic Monitoring and Assessment Programme, Oslo, Norway. 352pp.
[online] URL: https://www.amap.no/documents/doc/amap-assessment-2016-chemicals-of-emerging-
arctic-concern/1624
Arctic Monitoring and Assessment Programme (AMAP), 2021. AMAP Litter and Microplastics
Monitoring Plan. Arctic Monitoring and Assessment Programme (AMAP), Tromsø, Norway. 23 pp.
[online] URL: https://www.amap.no/documents/download/6713/inline
Gallo, F., C. Fossi, R. Weber, D. Santillo, M. Scheringer, J. Sousa, I. Ingram, A. Nadal, C. Perez, S.
Averous, F. Wang, F. Griffin, L. Devia, D. Lapešová and D. Romano, 2017. Working Group on

AMAP Litter and Microplastics Monitoring Guidelines
3
Marine litter plastics and microplastics and its POPs and EDC components: challenges and measures
to tackle the issue. Information Document of the working group of the Stockholm and Basel
Conventions Regional Activity Centers, April 2017. 16pp. [online] URL:
https://www.greenpeace.to/greenpeace/wp-content/uploads/2017/04/InfoDocument-WG-Plastics_BS-
Regional-Centres.pdf
Nordic Council of Ministers, 2017. Nordic Programme to Reduce the Environmental Impact of
Plastic. Nordic Council of Ministers, Copenhagen, Denmark. 24pp. [online] URL:
https://norden.diva-portal.org/smash/get/diva2:1092150/FULLTEXT01.pdf
Protection of the Arctic Marine Environment (PAME), 2019. Desktop Study on Marine Litter
Including Microplastics in the Arctic. PAME International Secretariat, Akureyri, Iceland. 118pp.
[online] URL: https://oaarchive.arctic-council.org/handle/11374/2389
Protection of the Arctic Marine Environment (PAME), 2021. Regional Action Plan on Marine Litter
in the Arctic. PAME International Secretariat, Akureyri, Iceland. 21pp. [online] URL:
https://oaarchive.arctic-council.org/handle/11374/2649
Beach litter survey in Nuuk, Greenland.
Photo: Jakob Strand

AMAP Litter and Microplastics Monitoring Guidelines
4
1.0 Introduction
Plastic pollution in the environment is of increasing ecological concern worldwide (UNEP, 2014). As
early as the 1970s, plastic litter in the marine environment was reported as a problem (Carpenter et al.,
1972). Today, plastic pollution is observed across all oceans as well as in terrestrial and freshwater
environments, even in remote regions such as the Arctic. Plastic pollution can enter the Arctic
environment through local sources such as communities, landfills, shipping, tourism, and fisheries
(PAME, 2019), but also from southern areas via transport by ocean currents, wind, sea ice, or biota
(Cózar et al., 2014a; Obbard et al., 2014). Consequently, plastic pollution has been found across the
Arctic environment, including on beaches (Bergmann et al., 2017; PAME, 2019), in snow (Bergmann et
al., 2019), in surface, subsurface, and seafloor water samples (Bergmann and Klages, 2012; Cózar et al.,
2014b; Huntington et al., 2020), and in sea ice (Obbard et al., 2014; Peeken et al., 2018). Recently,
microplastics (MP) have been reported in amphipods (Gammarus setosus; Iannilli et al., 2019), snow
crabs (Chionoecetes opilio; Sundet, 2014), and fish (Morgana et al., 2018), whereas the detection of
plastics in Arctic seabirds dates back to the 1960s (Provencher et al., 2017; PAME, 2019; Baak et al.,
2020).
Plastic pollution can have deleterious impacts on biota in a variety of ways, depending on consumer
species and the shape, size, and type of plastic (de Sá et al., 2018), but most documented impacts are from
entanglement and ingestion. Marine mammals, seabirds, turtles, and fish can become entangled in fishing
gear, rope, and plastic bags (Laist, 1987; Gregory, 2009; Provencher et al., 2017). If not directly causing
mortality, entanglement by and ingestion of plastic pollution may affect the fitness of individual
organisms by compromising their ability to capture and digest food, reproduce, migrate, and/or escape
from predators (Galloway et al., 2017; Rochman et al., 2019). As plastics break down in the environment,
they become available to a broader range of organisms. Ingestion of MP has, in some cases, resulted in
physical damage such as obstruction or internal abrasions (Wright and Kelly, 2017). In addition to
physical effects, marine plastics can transfer chemicals to the marine environment, concentrate them from
seawater, or act as vectors for alien species, such as bryozoans, barnacles, polychaete worms, hydroids,
and molluscs (Barnes et al., 2009; Hermabessiere et al., 2017). Despite the significant increase in
available data on MP pollution and litter debris globally, including in the Arctic, status reports lack
standardization in methodology and reporting consistency. For macroplastics, methodology exists in some
regions (e.g., OSPAR). For MP, there are at present no harmonized measurements, monitoring methods,
or environmental indicators.
Although first reports on plastics in the Arctic date back several decades, the environmental fate of litter
and MP is far from understood and is a field of ongoing research. How the extreme environmental
conditions of the Arctic might affect plastic transport and degradation processes is not yet known.
Emerging knowledge from lower latitudes may not be transferable to the Arctic environment, so studies
specific to Arctic conditions are needed. The role of chemical sorption to or release from plastic particles
is a subject of research interest, and of particularly great interest in the Arctic because of important
subsistence harvesting in the region. Improved understanding of processes related to plastics in the Arctic
will be highly relevant for modeling approaches as well as risk assessments and will likely further shape
the design of monitoring activities in the Arctic.

AMAP Litter and Microplastics Monitoring Guidelines
5
1.1 Purpose of the guidelines
The purpose of the guidelines is to review existing knowledge and provide guidance for designing an
Arctic monitoring program that will track litter and MP. The topics of litter, plastic pollution, and MP are
addressed in many fora, including several of the Arctic Council working groups: Arctic Monitoring and
Assessment Programme (AMAP; https://www.amap.no/documents/doc/amap-assessment-2016-
chemicals-of-emerging-arctic-concern/1624), Protection of the Marine Environment (PAME, 2019), and
Conservation of the Arctic Flora and Fauna (CAFF). The development of an Arctic monitoring program
and its technical approaches will be based on the work that already exists in other programs such as those
of OSPAR, the Helsinki Commission (HELCOM), the International Council for the Exploration of the
Sea (ICES), the Organisation for Economic Co-operation and Development (OECD), and the United
Nations Environment Programme (UNEP).
Plastic pollution is typically categorized into items and particles of macro-, micro-, and nano-sizes. These
guidelines address macrosized litter as well as MP (< 5 mm), essentially including smaller size ranges (>
1 µm). However, determination of nanoplastic (< 1 µm) particles is still hampered by technical
challenges, as addressed in Section 4.3 Analytical methods, and thus not currently considered in the
current recommendations. Although most studies have addressed marine litter and MP, these guidelines
also comprise the Arctic’s terrestrial and freshwater environments.
Thus, the objectives of the guidelines are to:
1) support litter and MP baseline mapping in the Arctic across a wide range of environmental
compartments to allow spatial and temporal comparisons in the coming years;
2) initiate monitoring to generate data to assess temporal and spatial trends;
3) recommend that Arctic countries develop and implement monitoring nationally via
community-based programs and other mechanisms, in the context of a pan-Arctic program;
4) provide data that can be used with the Marine Litter Regional Action Plan (ML-RAP) to
assess the effectiveness of mitigation strategies;
5) act as a catalyst for future work in the Arctic related to biological effects of plastics, including
determining environmentally relevant concentrations and informing cumulative effects
assessments;
6) identify areas in which research and development are needed from an Arctic perspective; and
7) provide recommendations for monitoring programs whose data will feed into future global
assessments to track litter and MP in the environment.
To achieve these objectives, the guidelines present indicators (with limitations) of litter and MP pollution
to be applied throughout the Arctic, and thus, form the basis for circumpolar comparability of approaches
and data. In addition, the guidelines present technical details for sampling, sample treatment, and plastic
determination, with harmonized and potentially standardized approaches. Furthermore, recommendations
are given on sampling locations and sampling frequency based on best available science to provide a
sound basis for spatial and temporal trend monitoring. As new data are gathered, and appropriate power
analyses can be undertaken, a review of the sampling sizes, locations, and frequencies should be initiated.

AMAP Litter and Microplastics Monitoring Guidelines
6
Plastic pollution is a local problem in Arctic communities, and thus, guidelines and references need to
include community-based monitoring projects to empower communities to establish plastics monitoring
with comparable results across the Arctic. Community-based monitoring is an integrated part of the
objectives of this report.
The monitoring program design and guidelines for its implementation are the necessary first steps for
monitoring and assessment of litter and MP in the Arctic. The work under the AMAP LMEG is taking a
phased approach under this new expert group. The first phase (which included the development of these
Monitoring Guidelines) focuses on a monitoring framework and set of techniques for physical plastics.
Later phases of the work will extend to assessments of levels, trends, and effects of litter and MP in the
Arctic environment.
The guidelines strictly cover environmental monitoring of litter and MP. This does not include drinking
water or indoor air quality tests. Additionally, although there is an emphasis on examining litter and MP
in biota that are consumed by humans, and thus of interest to human-health questions, the guidelines do
not consider MP ingestion by humans.
1.2 Existing frameworks with relevance for litter and microplastics monitoring
Legal frameworks applicable to marine plastic pollution are complex and consist of international,
national, regional, and local policies, which cover ocean- and land-based sources of marine plastic.
Several review documents exist for policies that directly or indirectly can be applied to mitigate the
impact of marine plastic (Pettipas et al., 2016; Xanthos and Walker, 2017; PAME, 2019; Linnebjerg et al.,
2021). The United Nations recommended that current international and regional frameworks on marine
plastic pollution be reviewed to identify gaps for policy improvement (UN, 2017). Although MP in
terrestrial ecosystems have been recognized as having a potential effect on biogeochemical processes
(Rillig and Lehmann, 2020), no similar frameworks have yet been established for the terrestrial
environment.
Preventing plastic pollution from entering the marine environment is a topic of priority across the globe,
and there are a range of legally binding and non-binding international conventions that directly or
indirectly address marine debris (e.g., Kershaw et al., 2013; PAME, 2019; Linnebjerg et al., 2021). One
of the first global treaties to protect the marine environment from human activities was The London
Convention that came into force in 1975. This convention was followed by The International Convention
for the Prevention of Pollution from Ships (MARPOL), the United Nations Convention on the Law of the
Sea (UNCLOS), and The Basel Convention. Together, all of these treaties have formed the foundation of
international regulations to reduce this environmental pollutant.
The protection of specific marine environments through regional regulations plays an important role in
the concretization of international regulatory frameworks. One of United Nations Environment
Programme’s (UNEP) initiatives is The Regional Seas Programme (launched in 1974), and, in
cooperation with regional organizers, it has implemented activities related to the prevention and reduction
of marine debris that have been consolidated by legal frameworks, e.g., the Convention for the Protection
of the Marine Environment of the North-East Atlantic (OSPAR). A list of international conventions, with

AMAP Litter and Microplastics Monitoring Guidelines
7
relevance to the Arctic, which addresses the reduction of marine debris is presented in Linnebjerg et al.,
2021.
Non-governmental organizations (NGOs) also play an important role in creating awareness about marine
debris. One example is the International Coastal Cleanup from the US-based NGO, Ocean Conservancy,
which removes marine debris from coastlines and collects data on the amount and types of marine debris
removed (Ocean Conservancy, 2020). The Greenpeace Call for a Plastic-Free Future (Greenpeace, 2020)
based on Zero Waste Standards and Policies (ZWIA, 2014) is another global initiative that aims to reduce
plastic waste production and consumption. For example, in Russia, this initiative has resulted in many
leading commercial networks considerably reducing the use of disposable plastic bags (Greenpeace,
2018).
For a thorough review of the policies that cover litter and MP in the Arctic see Linnebjerg et al., 2021.
Briefly, among the Arctic countries, the Kingdom of Denmark (incl. Greenland and the Faroe Islands),
Finland, Iceland, Norway, and Sweden have signed the OSPAR Convention. Denmark, Norway, and
Iceland have implemented the OSPAR seabird monitoring component, however, Sweden has determined
that monitoring fulmars is not feasible in Swedish waters. And, in Denmark and Norway, the OSPAR-
based seabird monitoring takes place outside of the Arctic. Although other Arctic countries have applied
the seabird protocol opportunistically (e.g., Canada; Poon et al., 2017), these studies are not part of a
coordinated national policy or long-term monitoring program. Monitoring programs have also been
initiated by the European Union, under the Marine Strategy Framework Directive (Galgani et al., 2013),
by HELCOM, and in a number of national initiatives, for example, under the Northern Contaminants
Program of Canada, as part of Canada’s Plastics Science Agenda (ECCC, 2019).
Importantly, policies on plastic pollution vary widely across Arctic countries. Given that plastic pollution
is subject to long-range transport, this inconsistency across the region is likely to reduce efficacy of
actions for reducing plastic pollution and for monitoring changes over time. Therefore, for policies to be
more effective, pan-Arctic coordination is required so that similar programs can be implemented in a
harmonized and consistent manner. This cooperation needs to be facilitated at both the regional and
international levels to ensure that litter and MP data from the Arctic are used in the context of global
efforts to reduce litter and plastic pollution and minimize harm to the environment.
1.3 Importance of harmonization and standardization in litter and microplastics
work
Efforts to map and categorize plastics in the Arctic have increased and coordinated monitoring under the
auspices of AMAP is envisaged. Comparability of data in litter and MP is an ongoing challenge in plastic
pollution research (Cowger et al., 2020; Provencher et al., 2020). Briefly, the term standardization refers
to the application of specific methods according to robust criteria. These methods typically have limited
flexibility to allow for comparability between laboratories. The benefit of this practice is that the
community can understand how to compare the data to assess temporal and spatial trends. The limitation
of this practice is that it significantly restricts the scientific freedom of method development. These
standardized methods are commonly applied for standard analytical procedures, such as the International
Organization for Standardization (ISO) and General Laboratory Practices (GLP) approaches.

AMAP Litter and Microplastics Monitoring Guidelines
8
Harmonization means that differing methods have been rigorously tested to the point that results can be
viewed as comparable despite differences in methodologies. The benefit of harmonization is that data can
be generated across projects that employ similar, but not necessarily identical methods. Importantly, the
limitations of each method are known, and the different activities/data generated can be combined.
Comparison coefficients or scaling factors can be used when combing datasets.
There are examples in the litter and MP literature in which harmonization rather than standardization has
led to studies from different regions being compared to assess spatial trends. For example, in the North
Sea, the OSPAR Convention has developed a standard protocol for the collection and examination of
Northern Fulmars (Fulmarus glacialis) to track trends in environmental plastic pollution (> 1 mm) in the
region (van Franeker et al., 2011; van Franeker and Kühn, 2020). The North Sea protocol is based on
beached birds being examined for ingested plastics. Since the early 2000s, the protocol has been applied
to regions outside of the OSPAR, but often in regions where beached bird surveys are not possible
(Provencher et al., 2017). In regions such as Arctic Canada, collections depend on local Inuit hunters to
collect carcasses from local colonies or on fishers submitting fulmar incidentally caught in their nets.
Although the collection methods are different, harmonization has been achieved and allows comparisons
across and between larger regions. Researchers in the region have worked with international colleagues to
ensure that methods are harmonized and thus can contribute to reporting standardized, comparable data
across the northern hemisphere (Provencher et al., 2017).
Unfortunately, there are limited standardized methods for determining and assessing litter and MP in
samples, although work is ongoing under ISO on standardized approaches for MP. Therefore, at this time,
the litter and MP community is striving to harmonize methods in real time to compare levels and trends
around the globe. We encourage the Arctic litter and MP community to engage in these global efforts to
ensure comparability across studies. This includes global efforts to define methods, standard reference
material, interlab comparisons, and suitable controls. Several efforts have focused on such harmonization,
including those of the UN’s Joint Group of Experts on the Scientific Aspects of Marine Environmental
Protection (GESAMP), and the Marine Strategy Framework Directive (MSFD) Technical Group for
Marine Litter. Although the focus of these guidelines is the Arctic, it is important to recognize these
global efforts so that any data collected in the Arctic on litter and MP are comparable globally and useful
in larger litter and MP assessments. Thus, the following technical sections covering litter and MP
methods in abiotic and biotic compartments are aiming for harmonized methods, which in some cases,
may lead to standardized methods.
A monitoring program should provide concentrations of a target analyte in the medium, representative of
the location and time of sampling. General issues to be considered are (1) definition of the target analyte
in the case of plastic litter and MP, (2) detection limits (and other parameters describing data quality), and
(3) detectability of temporal and spatial trends. Because national monitoring initiatives for plastic litter
and MP should feed into circumpolar AMAP assessments, it is essential that they produce comparable
data.
Plastics occur in a number of sizes, shapes, colors, and materials. As addressed above, the guidelines
include all sizes of litter and plastics. Shapes include fibers, films, foams, beads, etc., also giving some
indication of original products or materials. It is common practice to report a number of plastic particles
or a mass of plastics per sample mass or volume, usually for a certain size range and/or for certain shapes.

AMAP Litter and Microplastics Monitoring Guidelines
9
This alone introduces variability in reporting, which makes comparisons between studies difficult.
Weathering processes can have an impact on the number and characteristics of plastic particles. In
addition, a plastic sample can include several types of synthetic polymers. This means standardization in
terms of what is measured and reported is important, i.e., a definition of the target analytes.
Plastic materials are omnipresent in everyday use, and thus contamination of samples (and reporting of
false positives) is a serious risk in all steps of sample handling. Any contamination and background levels
also have direct impacts on the detection limits of the monitoring program. Therefore,
standardized/harmonized measures must be taken to minimize this risk and to monitor potential
contamination. Similarly, other parameters describing data quality, such as measurement uncertainty, will
be affected by random contamination.
The importance of standardization and harmonization also applies to methods of sampling, storage and
transport, sample processing, analytical determination, and quality assurance/quality control (QA/QC). In
all steps, variability can be introduced. In general, knowledge of these sources of variability is still limited
and will be explored further in the guidelines. The variability in the sampling and analysis has direct
consequences for the detectability of temporal and spatial trends because large uncertainties will affect
their statistical power.
1.4 Examining litter and microplastics across the Arctic
The following sections discuss litter and MP in 11 environmental compartments: air, ice/snow, terrestrial
soils, aquatic and shoreline sediments, beaches, water, seabed litter, invertebrates, fish, seabirds, and
mammals. These compartments span several Arctic ecosystems (e.g., tundra, lakes, rivers, coastlines,
subtidal). Data from these compartments can be used to document the presence of a range of size classes
of litter and MP in the environment and to improve the understanding of underlying processes.
For each of these environmental compartments, the following sections review the state of knowledge in
the relevant compartment and identify a suite of primary and secondary monitoring indicators that have
been described in relation to (1) the current state of methodologies (in each compartment) and (2) the
feasibility for their use in monitoring initiatives across the Arctic. Primary monitoring indicators are those
within each compartment that can be implemented immediately with current protocols and technologies
to inform future litter and MP assessments in the Arctic. For example, examination of stomach contents in
Northern Fulmars is the primary indicator identified in the seabird section for immediate implementation
where possible.
Secondary monitoring indicators are those within each compartment that are viewed as needed for a
holistic understanding of litter and MP in Arctic ecosystems but need further efforts to develop
methodologies before being implemented at the pan-Arctic level. For example, in the seabird
compartment, gut analysis of other species, as well as nest incorporation of litter are listed as secondary
indicators that require more development before widespread implementation.
Some secondary monitoring indicators may also serve other specific monitoring purposes, for example,
effect monitoring in relation to chemicals associated with plastic pollution that are of wide interest. The
primary and secondary monitoring indicators are also thus linked to different types of monitoring with the

AMAP Litter and Microplastics Monitoring Guidelines
10
main focus on baseline establishment, trend monitoring, and source/surveillance monitoring. Importantly,
in each compartment, these primary and secondary monitoring indicators also address the actions outlined
in the Marine Litter Regional Action Plan (ML-RAP).
Photo: Maria E. Granberg
AMAP Litter and Microplastics Monitoring Guidelines
11
References
Baak, J.E., J.F. Provencher and M.L. Mallory, 2020. Plastic ingestion by four seabird species in the
Canadian Arctic: comparisons across species and time. Marine Pollution Bulletin, 158:111386.
https://doi.org/10.1016/j.marpolbul.2020.111386
Barnes, D.K.A., F. Galgani, R.C. Thompson and M. Barlaz, 2009. Accumulation and fragmentation of
plastic debris in global environments. Philosophical Transactions of the Royal Society B: Biological
Sciences, 364:1985-1998. https://doi.org/10.1098/rstb.2008.0205
Bergmann, M. and M. Klages, 2012. Increase of litter at the Arctic deep-sea observatory
HAUSGARTEN. Marine Pollution Bulletin, 64:2734–2741.
https://doi.org/10.1016/j.marpolbul.2012.09.018
Bergmann, M., S. Mützel, S. Primpke, M.B. Tekman, J. Trachsel and G. Gerdts, 2019. White and
wonderful? Microplastics prevail in snow from the Alps to the Arctic. Science Advances, 5:eaax1157.
https://doi.org/10.1126/sciadv.aax1157
Bergmann, M., V. Wirzberger, T. Krumpen, C. Lorenz, S. Primpke, M.B. Tekman and G. Gerdts, 2017.
High quantities of microplastic in Arctic deep-sea sediments from the HAUSGARTEN Observatory.
Environmental Science and Technology, 3:11000-11010. https://doi.org/10.1021/acs.est.7b03331
Carpenter, E.J., S.J. Anderson, G.R. Harvey, H.P. Miklas and B.B. Peck, 1972. Polystyrene spherules in
coastal waters. Science, 178:749-750. https://doi.org/10.1126/science.178.4062.749
Cowger, W., A.M. Booth, B.M. Hamilton, C. Thaysen, S. Primpke, K. Munno, A.L. Lusher, A. Dehaut,
V.P. Vaz, M. Liboiron, L.I. Devriese, L. Hermabessiere, C. Rochman, S.N. Athey, J.M. Lynch, H. De
Frond, A. Gray, O.A.H. Jones, S. Brander, C. Steele, S. Moore, A. Sanchez and H. Nel, 2020. Reporting
guidelines to increase the reproducibility and comparability of research on microplastics. Applied
Spectroscopy, 74:1066-1077. https://doi.org/10.1177/0003702820930292
Cózar, A., F. Echevarría, J.I. González-Gordillo, X. Irigoien, B. Úbeda, S. Hernández-León, Á.T. Palma,
S. Navarro, J. García-de-Lomas, A. Ruiz, M.L. Fernández-de-Puelles and C.M. Duarte, 2014b. Plastic
debris in the open ocean. Proceedings of the National Academy of Sciences, 111:10239-10244.
https://doi.org/10.1073/pnas.1314705111
Cózar, A., E. Marti, C.M. Duarte, J. García-de-Lomas, E. van Sebille, T.J. Ballatore, V.M. Eguíluz, J.I.
González-Gordillo, M.L. Pedrotti, F. Echevarría, R. Troublè and X. Irigoien, 2014a. The Arctic Ocean as
a dead end for floating plastics in the North Atlantic branch of the Thermohaline Circulation. Science
Advances, 3:e1600582. https://doi.org/10.1126/sciadv.1600582
de Sá, L.C., M. Oliveira, F. Ribeiro, T.L. Rocha and M.N. Futter, 2018. Studies of the effects of
microplastics on aquatic organisms: what do we know and where should we focus our efforts in the
future? Science of the Total Environment, 645:1029-1039. https://doi.org/10.1016/j.scitotenv.2018.07.207

AMAP Litter and Microplastics Monitoring Guidelines
12
Environment Canada and Climate Change (ECCC), 2019. Canada’s plastics science agenda. Accessed at
https://www.canada.ca/en/environment-climate-change/services/science-technology/canada-science-
plastic-agenda.html on 7 January 2020.
Galgani, F., G. Hanke, S. Werner and L. De Vrees, 2013. Marine litter within the European Marine
Strategy Framework Directive. ICES Journal of Marine Science, 70:1055-1064.
https://doi.org/10.1093/icesjms/fst122
Galloway, T.S., M. Cole and C. Lewis, 2017. Interactions of microplastic debris throughout the marine
ecosystem. Nature Ecology and Evolution, 1:0116. https://doi.org/10.1038/s41559-017-0116
Greenpeace, 2018. Russian supermarkets turn green. Accessed at
https://greenpeace.ru/blogs/2019/07/15/rossijskie-supermarkety-zelenejut/ on 5 May 2020.
Greenpeace, 2020. Toolkit for a plastic-free future. Accessed at
https://www.greenpeace.org/international/campaign/toolkit-plastic-free-future on 20 April 2020.
Gregory, M.R., 2009. Environmental implications of plastic debris in marine settings—entanglement,
ingestion, smothering, hangers-on, hitch-hiking and alien invasions. Philosophical Transactions of the
Royal Society B, 364:2013-2025. https://doi.org/10.1098/rstb.2008.0265
Hermabessiere, L., A. Dehaut, I. Paul-Pont, C. Lacroix, R. Jezequel, P. Soudant and G. Duflos, 2017.
Occurrence and effects of plastic additives on marine environments and organisms: a review.
Chemosphere, 182:781-793. https://doi.org/10.1016/j.chemosphere.2017.05.096
Huntington, A., P.L. Corcoran, L. Jantunen, C. Thaysen, S. Bernstein, G.A. Stern and C.M. Rochman,
2020. A first assessment of microplastics and other anthropogenic particles in Hudson Bay and the
surrounding eastern Canadian Arctic waters of Nunavut. FACETS, 5. https://doi.org/10.1139/facets-2020-
0053
Iannilli, V., V. Pasquali, A. Setini and F. Corami, 2019. First evidence of microplastics ingestion in
benthic amphipods from Svalbard. Environmental Research, 179:108811.
https://doi.org/10.1016/j.envres.2019.108811
Kershaw, P., L. Alcaro, E. Garnacho, T. Doyle, T. Maes and S. Painting, 2013. Review of existing
policies that may be applied to mitigate the impact of marine litter. MARine Litter in Europe Seas: Social
AwarenesS and CO-Responsibility. Marlisco, Teramo, Italy. [online] URL:
https://www.marlisco.eu/review-of-existing-policies-that-may-be-applied-to-mitigate-the-impact-of-
marine-litter.en.html
Laist, D.W., 1987. Overview of the biological effects of lost and discarded plastic debris in the marine
environment. Marine Pollution Bulletin, 18:319-326. https://doi.org/10.1016/s0025-326x(87)80019-x
Linnebjerg, J.F., J.E. Baak, T. Barry, M. Gavrilo, M.L. Mallory, F.R. Merkel, C. Price, J. Strand, T.R.
Walker and J.F. Provencher, 2021. Review of plastic pollution policies of Arctic countries in relation to
seabirds. FACETS, 6(1). https://doi.org/10.1139/facets-2020-0052

AMAP Litter and Microplastics Monitoring Guidelines
13
Morgana, S., L. Ghigliotti, N. Estévez-Calvar, R. Stifanese, A. Wieckzorek, T. Doyle, J.S. Christiansen,
M. Faimali and F. Garaventa, 2018. Microplastics in the Arctic: a case study with sub-surface water and
fish samples off Northeast Greenland. Environmental Pollution, 242:1078-1086.
https://doi.org/10.1016/j.envpol.2018.08.001
Obbard, R.W., S. Sadri, Y.Q. Wong, A.A. Khitun, I. Baker and R.C. Thompson, 2014. Global warming
releases microplastic legacy frozen in Arctic Sea ice. Earth’s Future, 2:315-320.
https://doi.org/10.1002/2014ef000240
Ocean Conservancy, 2020. Fighting for trash free seas: ending the flow of trash at the source. Accessed at
https://oceanconservancy.org/trash-free-seas/ on 20 April 2020.
Protection of the Arctic Marine Environment (PAME), 2019. Desktop Study on Marine Litter Including
Microplastics in the Arctic. 11th Arctic Council Ministerial Meeting, Rovaniemi, Finland, 7 May 2019.
PAME, Akureyri, Iceland. 114pp. [online] URL:
https://www.pame.is/images/03_Projects/Arctic_Marine_Pollution/Litter/Desktop_study/Desktop_Study_
on_marine_litter.pdf
Peeken, I., S. Primpke, B. Beyer, J. Gütermann, C. Katlein, T. Krumpen, M. Bergmann, L. Hehemann
and G. Gerdts, 2018. Arctic sea ice is an important temporal sink and means of transport for microplastic.
Nature Communications, 9:1-12. https://doi.org/10.1038/s41467-018-03825-5
Pettipas, S., M. Bernier and T.R. Walker, 2016. A Canadian policy framework to mitigate plastic marine
pollution. Marine Policy, 68:117-122. https://doi.org/10.1016/j.marpol.2016.02.025
Poon, F.E., J.F. Provencher, M.L. Mallory, B.M. Braune and P.A. Smith, 2017. Levels of ingested debris
vary across species in Canadian Arctic seabirds. Marine Pollution Bulletin, 116:517-520.
https://doi.org/10.1016/j.marpolbul.2016.11.051
Provencher, J.F., A.L. Bond, S. Avery-Gomm, S.B. Borrelle, E.L. Bravo Rebolledo, S. Hammer, S. Kühn,
J.L. Lavers, M.L. Mallory, A. Trevail and J.A. van Franeker, 2017. Quantifying ingested debris in marine
megafauna: a review and recommendations for standardization. Analytical Methods, 9:1454-1469.
https://doi.org/10.1039/c6ay02419j
Provencher, J.F., G.A. Covernton, R.C. Moore, D.A. Horn, J.L. Conkle and A.L. Lusher, 2020. Proceed
with caution: the need to raise the publication bar for microplastics research. Science of the Total
Environment, 748:141426. https://doi.org/10.1016/j.scitotenv.2020.141426
Rillig, M.C. and A. Lehmann, 2020. Microplastic in terrestrial ecosystems. Science, 368:1430-1431.
https://doi.org/10.1126/science.abb5979
Rochman, C.M., C. Brookson, J. Bikker, N. Djuric, A. Earn, K. Bucci, S. Athey, A. Huntington, H.
McIlwraith, K. Munno, H. De Frond, A. Kolomijeca, L. Erdle, J. Grbic, M. Bayoumi, S.B. Borrelle, T.
Wu, S. Santoro, L.M. Werbowski, X. Zhu, R.K. Giles, B.M. Hamilton, C. Thaysen, A. Kaura, N. Klasios,
AMAP Litter and Microplastics Monitoring Guidelines
14
L. Ead, J. Kim, C. Sherlock, A. Ho and C. Hung, 2019. Rethinking microplastics as a diverse contaminant
suite. Environmental Toxicology and Chemistry, 38:703-711. https://doi.org/10.1002/etc.4371
Sundet, J., 2014. Status on the snow crab in the Barents Sea (No. Joint Russian-Norwegian report series,
no 18/2014), Presentation on the Norwegian-Russian workshop on king– and snow crabs in the Barents
Sea, Tromsø, March 11–12, 2014. [online] URL: https://www.hi.no/resources/publikasjoner/rapport-fra-
havforskningen/2014/hi-rapp_18-2014_king_and_snow_til_web.pdf
United Nations (UN), 2017. Resolution Adopted by the General Assembly. United Nations, Rome, Italy.
[online] URL: https://undocs.org/A/RES/71/313
United Nations Environment Programme (UNEP), 2014. UNEP Year Book 2014: emerging issues in our
global environment. United Nations Environment Programme, Nairobi, Kenya. [online] URL:
https://wedocs.unep.org/handle/20.500.11822/9240
van Franeker, J.A., C. Blaize, J. Danielsen, K. Fairclough, J. Gollan, N. Guse, P.-L. Hansen, M. Heubeck,
J.-K. Jensen, G. Le Guillou, B. Olsen, K.-O. Olsen, J. Pedersen, E.W.M. Stienen and D.M. Turner, 2011.
Monitoring plastic ingestion by the northern fulmar Fulmarus glacialis in the North Sea. Environmental
Pollution, 159:2609-2615. https://doi.org/10.1016/j.envpol.2011.06.008
van Franeker, J.A. and S. Kühn, 2020. Fulmar litter EcoQO monitoring in the Netherlands - Update 2019.
Wageningen Marine Research Report C074/20 & RWS Centrale Informatievoorziening BM 20.16.
https://doi.org/10.18174/529399
Wright, S.L. and F.J. Kelly, 2017. Plastic and human health: a micro issue? Environmental Science and
Technology, 51:6634-6647. https://doi.org/10.1021/acs.est.7b00423
Xanthos, D. and T.R. Walker, 2017. International policies to reduce plastic marine pollution from single-
use plastics (plastic bags and microbeads): a review. Marine Pollution Bulletin, 118:17-26.
https://doi.org/10.1016/j.marpolbul.2017.02.048
Zero Waste International Alliance (ZWIA), 2014. Standards and policies. Accessed at
http://zwia.org/policies/ on 20 April 2020.
AMAP Litter and Microplastics Monitoring Guidelines
15
2.0 Guidance for Monitoring Abiotic Environmental Compartments
2.1 Wet and dry atmospheric deposition AUTHORS: LIISA JANTUNEN AND DORTE HERZKE
2.1.1 Introduction and description of purpose/aims of monitoring
Even with major research efforts happening on marine plastic pollution, the PAME report identified
atmospheric circulation as a pathway to marine pollution still lacking in empirical data (PAME,
2019). Because there are only sporadic data available at this point and no harmonized methodology,
no global estimate on the magnitude of atmospheric transport of microplastics (MP) to the Arctic is
available. Nor will it be available in the near future. Additionally, local sources have not yet been
investigated, thus the delocalization of macroplastic waste from landfills and urban settlements during
storms is a possible route of transport within short distances (PAME, 2019).
Due to the still experimental nature of atmospheric sampling and the small number of peer-reviewed
publications describing validated methods, no final recommendations on robust procedures are
possible at this time. As an alternative, until validated methods are available, we are reporting on
methodology by relevant publications and recommending best practices.
Like their marine counterparts, atmospheric MP consist of a variety of polymer types (Enyoh et al.,
2019). Their morphologies show a similar variety of forms such as fragments, foams, films, granules,
fibers, and microbeads (Enyoh et al., 2019), with fragments and fibers being the dominant MP (Dris et
al., 2016, 2017; Cai et al., 2017; Zhou et al., 2017; Catarino et al., 2018; Allen et al., 2019; Ambrosini
et al., 2019; Liu et al., 2019a, b). Allen et al. (2020) found that seaward winds had higher levels of MP
associated with them than land-originating winds, suggesting that sea spray contributes to the
atmospheric loads of MP.
Like marine MP, atmospheric MP may consist of up to 70% of additives and contaminants (Rummel
et al., 2019). A recent report on nanoplastics in high altitude alpine snow indicates airborne transport
of very small plastic particles that have unknown environmental and health impacts (Materić et al.,
2020). Therefore, research on MP and especially microfiber transport in remote regions, like the
Arctic, is utterly important in determining the dispersion of MP so that all aspects of their
environmental impacts can be assessed.
Within the frame of atmospheric MP occurrence, three groups of MP distribution can be
distinguished:
i) wet deposition (mist, rain, and snow),
ii) dry deposition (dust), and
iii) suspended particles.
Microplastics in snow and ice on land are a direct result of atmospheric deposition combining wet and
dry deposition (Ambrosini et al., 2019; Bergmann et al., 2019; Geilfusa et al., 2019); however, it is
unknown if precipitation or snow deposits are a good proxy for deposition of airborne MP. In places
like the Arctic, precipitation can vary substantially locally and is especially low in the desert-like
conditions of the Canadian High Arctic. Precipitation is higher in the European Arctic.
AMAP Litter and Microplastics Monitoring Guidelines
16
Sea ice is not a good proxy for air pollution because sea ice will incorporate MP and microfibers from
seawater into the ice. Microplastics in sea ice and snow on ice are discussed in Section 2.5, whereas
land-based precipitation is covered in this section.
Compared to ocean currents, air currents can distribute atmospheric particles very quickly, within a
matter of hours and days (Stohl, 2006). Like other atmospheric particles, MP are expected to undergo
long-range transport in air currents followed by wet and dry deposition onto water and land (Allen et
al., 2019) and will also undergo changes in the atmosphere, including hydrolysis, UV degradation,
accumulation of organic films, and aggregation with other particles (Gewert et al., 2015).
Microplastics may also fragment into smaller pieces in the atmosphere, most likely increasing their
long-range transport abilities (Biber et al., 2019). Microplastics vary in densities and shapes, causing,
for example, microfibers to be more likely to travel longer distances than other MP because both the
diameter and length matter for atmospheric transport (Allen et al., 2019; Zhang et al., 2020). In
general, the atmospheric dry and wet deposition, or “fallout,” as some plastics’ publications
erroneously refer to it, has not been well quantified as to its contributions to aquatic and terrestrial
environments.
Local sources also exist in the Arctic, with short-range transport being relevant even with sparse
populations. The contribution of local and long-range transport sources to MP in the Arctic are not
quantified at this time.
2.1.2 Summary of available information/existing monitoring frameworks
The nature of atmospheric MP sampling and analyses is still in its infancy; thus, a number of locations
have been investigated applying mostly experimental sampling methods. Reports from Europe (Dris
et al., 2015, 2016, 2017; Catarino et al., 2018; Allen et al., 2019; Bergmann et al., 2019; Klein and
Fischer, 2019; Vianello et al., 2019), China (Cai et al., 2017; Zhou et al., 2017; Liu et al., 2019a, b),
Iran (Dehghani et al., 2017; Abbasi et al., 2019), and the Pacific Ocean (Liu et al., 2019b) have been
published on airborne MP and reviewed by Zhang et al. 2020. The MP deposition, in the above
studies, ranges from 1.5-221 MP/m2/day. Of the conducted studies, atmospheric MP were found in a
range of different compounds and morphologies akin to their marine counterparts. Abundance across
studies varied considerably, and collectively they provided little information about size ranges and
chemical composition.
The occurrence and distribution of suspended atmospheric MP (SAMPs) in the western Pacific Ocean
provide field-based evidence that MP in the air can act as an important source of MP to the ocean (Liu
et al., 2019b).
So far, there are no standard sampling and particle quantification/identification procedures for
airborne MP. Further, reported sampling methods vary depending on indoor or outdoor sampling, as
well as on whether measuring wet or dry deposition. A selection of reported sampling techniques is
listed below:
Atmospheric microplastics
o Atmospheric deposition sample: passive air sampling using wet and/or dry deposition
collector
• Wet deposition sample: no data for wet deposition alone
• Dry deposition sample: indoor air (Dris et al., 2016)

AMAP Litter and Microplastics Monitoring Guidelines
17
• Dry/wet combined deposition sample: urban (Dris et al., 2015, 2016; Cai et al., 2017),
alpine catchment (Allen et al., 2019)
o Suspended air sample: active air samples using the pumps (low/middle or vacuum pump)
equipped with particle filtering parts or mist sampler
• indoor (Dris et al., 2017), urban outdoor (Kaya et al., 2018), suspended road dust
(Abbasi et al., 2019), Northwest Pacific Ocean air (Liu et al., 2019), coastal air (Allen
et al., 2020)
• coastal mist using an active strand cloudwater collector (Allen et al., 2020)
o Samples deposited on the surface: exclusive atmospheric-driven samples collected from the
surface
• deposited road dust (Abbasi et al., 2019), alpine and Arctic ice floe snow (Bergmann
et al., 2019), alpine snow (Materić et al., 2020)
Monitoring airborne MP throughout the year in the Arctic is important to assess the impact of
seasonal changes in wind patterns and the presence of UV light, as well as the impact of sea spray on
atmospheric levels of MP and nanoplastics in both air and water (Allen et al., 2020).
Recommended particle size range for air sampling is 10-500 µm (although larger sizes should not be
excluded) because the highest proportion of reported MP are < 500 µm (Enyoh et al., 2019; Zhang et
al., 2019, 2020). For snow in European and Arctic regions, 98% of all MP were < 100 μm (Bergmann
et al., 2019).
The lack of standardized active and passive sampling methods is hampering the comparability of
studies, so no recommendations based on validated procedures and practices can be made at this time.
However, strict quality assurance/quality control (QA/QC) procedures need to be followed to ensure
reliable data, preferably carrying out sample treatment in a cleanroom or a laminar flow cabinet. To
the extent possible, plastic-containing equipment should be avoided during field and lab activities (see
subsection 2.1.6 for more details on QA/QC).
Chemicals transported by microplastics in air
As with MP found in the marine environment, both adsorbed pollutants as well as additives are part of
atmospheric MP’ chemical make-up. A broad range of analytical methods are available to determine
the composition and concentrations of these chemicals (see earlier sections for more details). In
general, adsorbed components (organic and inorganic, i.e., metals) are present at much lower
concentrations compared to the additives, thus requiring ultra-trace analytical methods, whereas
additive determination relies on the availability of a multitude of analytical techniques and
instrumentations.
2.1.3 Trends in literature in Arctic regions
Atmospheric microplastics
So far, no atmospheric field studies have been conducted in the Arctic. The most recent examples for
wet deposition are studies that reported MP in Arctic snow (Bergmann et al., 2019) and in alpine
snow (Allen et al., 2019; Ambrosini et al., 2019; Materić et al., 2020). A recent modeling study
(Evangeliou et al., 2020) globally simulated atmospheric transport of MP particles produced by road
traffic (TWPs, i.e., tire wear particles and BWP, i.e., brake wear particles). The authors found high
transport efficiencies of these particles to remote regions, suggesting that the Arctic is a particularly

AMAP Litter and Microplastics Monitoring Guidelines
18
sensitive receptor region because of the light-absorbing properties of TWPs and BWPs, which cause
accelerated warming and melting of the cryosphere (Albedo effect; Evangeliou et al., 2020).
Chemicals transported by microplastics in air
Microplastics, volatile siloxanes, and organophosphate esters share the same hotspot regions in the
Canadian Arctic, indicating similar sources, possibly undergoing the same transport processes caused
by their shared origin from plastics (Panagopoulos Abrahamsson et al., 2020; Sühring et al., 2020;
Adams et al., 2021).
2.1.4 Benefits and limitations
Benefits
Conducting research in the Arctic for atmospheric MP is crucial for the evaluation of their
distribution, sources and fate, contribution of local and remote sources, and how they will affect the
Arctic. Further, we need to understand how atmospheric MP are contributing to marine MP loads
because of their differing types, sizes, and chemical loads due to their different emission sources,
transformation processes, and fate history.
Further, the improved understanding of local and long-range transport sources will assist in the
formulation of legislation and remediation measures. Microplastic concentrations in indoor air are
both important for the estimation of human exposure as well as for elucidating sources to MP in
outdoor air. This is especially important for people living in the Arctic, who, due to harsh
environmental conditions, stay indoors for long periods of time and have very well insulated homes
with little air exchange.
The determination of chemicals added and sorbed to atmospheric MP would improve the knowledge
base on their role as a vector for chemicals into the Arctic environment.
As climate change impacts the Arctic, melting ice and changes in atmospheric circulation patterns,
primary and secondary emissions of MP, and, especially relevant to air, microfibers need to be
investigated to determine the current transportation trends to, within, and out of the Arctic so changes
and impacts can be estimated. Also, more extreme weather conditions will cause more physical
damage to MP, as well as mixing between water and airmasses, further adding to the MP load in the
atmosphere.
Limitations
Aside from the unavailability of a consensus on the applied methodology, the monitoring of
atmospheric MP in the Arctic is highly limited by the remoteness of sampling locations and the
challenges of the infrastructure. This is especially true for Arctic regions in Russia and North
America, where the population is sparse and travel to and within is limited, difficult, and expensive. It
is important to sample year-round to assess the seasonal changes in atmospheric circulation and
transport of MP to the Arctic from different regions of the world. A representative sample size as well
as the number of required replicates is a prerequisite for a valid method to collect a sufficient amount
and a sufficient number of subsamples to adequately represent the sampled location.
Another limitation is the unavailability of highly trained and skilled operators, which are needed to
effectively collect samples to reduce the risk of contamination and ensure a rigorous sampling regime.

AMAP Litter and Microplastics Monitoring Guidelines
19
Although all sampling, analyses, and polymer determination are very time consuming, requiring
trained personnel and expensive instrumentation, the very small size of atmospheric MP make it even
more prone to contamination during processing and analysis, thus requiring lab facilities with particle-
controlled environments as a prerequisite for atmospheric sample analyses.
Other specific limitations include access to electricity for active air, and wet and dry only deposition
sampling because the quantitative nature of active air sampling results in more reliable data than
passive sampling in a shorter time frame. Limitations can be overcome by co-deploying active air, wet
only, and bulk samplers at a few stations to assess their comparability. For example, in Canada, the
Alert monitoring station, and in Svalbard, the Zeppelin station would be good candidates to assess
this.
Wet only and bulk deposition sampling limitations in the Arctic include strong winds, e.g., blowing
the particles out of the sampler, and the varying amounts of snow fall across the Arctic, e.g., some
regions with large amounts of snow may bury the sampler whereas in other regions, desert-like
conditions exist with very little snowfall in a season.
For all types of samplers left in the field, there is the potential for wind, snow, and animal damage to
the equipment. Due to extreme weather conditions in the Arctic, the lack of consistent access to
sampling equipment may also be a limitation.
2.1.5 Sampling strategy and methodology
Sampling strategy: There are limited options to collect air samples in the Arctic for MP because of the
remoteness of sites, harsh conditions, and limited access to power. Typical sampling includes active
air samplers, bulk deposition samplers, and wet deposition samplers. Active air samples will provide a
quantitative number of particles per meter cube of air; however, active air samplers for air monitoring
networks are expensive, require power, require an operator to change filters, and give data over a very
short time snapshot of the air. Passive samplers, advantageously, can be installed at existing
atmospheric monitoring sites in the Arctic, reducing the need for manpower and infrastructure. Bulk
deposition samples give a total of wet and dry deposition without the need for power, can be
integrated over a longer period of time (e.g., typically one week or one month); whereas, wet only and
dry only samples give more detailed information but require power and a specialized sampler. To
their disadvantage, bulk deposition and dry deposition samples overestimate the size of atmospheric
particles because larger particles settle out more quickly, and smaller fibers stay suspended in the air
for a longer time. If smaller particles do settle out, they may become re-suspended in the air more
easily than larger particles (Rezaei et al., 2019). Wet deposition samples probably provide a better
representation of the atmospheric load of MP because precipitation washes the air column of particles,
however in all cases of bulk deposition analyses, a quantitative evaluation of airborne particles is
challenging. Outdoor passive air samplers are being developed and tested but results have yet to be
released.
For both alternatives, the co-location at existing monitoring sites is highly beneficial because it
enables the simultaneous delivery of supplemental data on other atmospheric measurements, also
enabling back-trajectory analysis of possible sources, event-analyses, and input in databases and
modeling actions. These types of sampling networks are sparingly distributed in the Arctic, but at key
locations.

AMAP Litter and Microplastics Monitoring Guidelines
20
Independent of the sampling method chosen, sampling for atmospheric MP should be continuous
throughout the year, covering shorter periods of time, to give insights into seasonal changes of wind
patterns and any short-term transport events.
Replicates: It is difficult to collect replicate active air, wet only, and dry only samples because of the
power and duplicate samplers’ requirements but replicate bulk deposition samples are encouraged.
Nipher gauges are a well-established method of collecting snowfall in higher wind environments. A
type of bulk air deposition sampler that buffers the wind and limits resuspension of particles from the
sample is encouraged.
Not recommended:
1) Air sampling, including deposition sampling, from ship-board platforms is not recommended.
Ships are a source of contamination to the surrounding air because they vent substantial
amounts of air from their systems including engine, HVAC, and laundering exhausts, which
contain MP that would contaminate air samples. However, a wind-sectoring system can collect
the air inflowing from the head of the ship and can exclude the collection of air inflowing from
the other sides of the ship. This system can be used to prevent ship-based contamination.
2) Grab snow sampling, especially one-time opportunistic sampling, is not recommended. Snow
sampling gives a snapshot of the MP in snow, but it is impossible to determine the age and
history of the snow if no additional parameters are measured, or if fresh snowfall is collected.
As an alternative, bulk deposition samplers are recommended. Ice/snow cores from overland
are encouraged especially if paired with other chemical analyses that provide ancillary data
when interpreting the MP data. Ice cores from over water are discussed in Section 2.2.
3) Opportunistic sampling is not recommended except when rigorous QA/QC are maintained.
4) Subsampling is not recommended because MP are not homogenously distributed within the
sample.
Sample treatment
It is recommended to process the samples as little as possible to avoid contamination, together with
storing the samples in plastic-free, precleaned containers. Digestion steps can fragment the particles
and fibers, biasing the number and size distribution of the MP, and are generally not needed for
atmospheric-related sampling, although there are exceptions.
More processing steps expose the samples to more sources of contamination, which are critical to
avoid because of the small particle sizes in air. As with other MP sampling, all water used for rinsing
must be HPLC grade or Milli-Q water and DIW that have undergone additional filtration using the
same filter types as with sampling to remove plastics from the water filtering system. Specific to bulk,
dry, and wet deposition, sample collectors must be rinsed thoroughly to remove MP from the walls of
the sampler and subsequently filtered with filters applicable to the research question and measuring
technique (pore size, diameter, material). For active air samples, direct transfer of the filter to the
analytical instrumentation with no processing is recommended. If not possible, due to high particle
loads, e.g., no monolayers can be ensured, particles need to be re-suspended by ultrasonification in
water, subsampled, if necessary for higher load samples and filtered. Although ultrasonification may
cause particles to fragment, so it should be minimized.

AMAP Litter and Microplastics Monitoring Guidelines
21
Sample analyses
It is imperative that particle specification methods are included, for example, polymer type, shape,
length, and diameter. Sample analyses should include microscopy and fluorescence microscopy, if
using Nile Red, paired with Raman spectroscopy and/or µFTIR to screen suspected MP. As an
inexpensive, fast screening method, staining with lipophilic Nile Red can be chosen for identification
of larger MP > 20 µm (for rapid screening under a fluorescence microscope; Maes et al., 2017). That
being said, Nile Red cannot determine polymer type and disagreement within the MP community
about the usefulness of Nile Red treatment does exist.
Samples should only be subsampled when there are substantial particle loads, preventing a monolayer
of particles on the filter, disabling the identification of the particle composition. No homogeneity of
particle distribution can be assumed in the sampler and/or filter. Also, high particle load is not typical
in atmospheric related samples in remote Arctic regions.
Because the availability of analytical methodology for particles < 20 µm is limited, it is important to
subset and archive samples when possible in a contamination-free, dark, and cool environment (< 15 oC). However, the low levels of atmospheric MP in the Arctic may limit subsampling and the limited
access to samples may limit the ability to sample archive.
2.1.6 Quality assurance/quality control (QA/QC) and reporting/data management
Here we discuss QA/QC as it pertains to atmospheric related sampling (see also Brander et al., 2020
for a wider discussion of MP QA/QC protocols).
Harmonized terminology: To mitigate inconsistent terminology and to enable translation of the data to
atmospheric particle research in general, terminology defined in atmospheric science should be used.
Sampling: Opportunistic sampling should be avoided except for research purposes, and to ensure a
wide data comparability, systemic sampling and handling should be maintained. Replicated samples
are highly recommended and should be considered when possible. Clothing worn during sample
media preparation, collection, and recovery must be documented.
Contamination: The sizes of particles in air are, in general, smaller than other matrices, therefore, it is
very important to follow stringent QA/QC procedures. Field, travel, and laboratory blanks are crucial
steps to track and eliminate contamination. For field blanks (the sample collection containers are
opened during sample collection), it is recommended that a representative number of field blanks and
procedural blanks are taken (one blank per field sample or per sampling period). For travel blanks
(sample collection containers are not opened in the field), it is recommended to take 1 blank per 10
samples. For laboratory blanks, three lab processing blanks per processing day should also be done.
These blanks form the basis for the limit of detection, method detection limit, and limit of
quantification so an evaluation can be made to ensure reported values in samples are statistically
greater than the blanks. These values must be defined by the group reporting the data.
Strict routines for choice and preparation of sampling equipment (plastic free, fired at 450 oC for > 4
hours) need to be followed, and the handling of samples under particle-controlled conditions (laminar
flow fume hood with filtered air/clean room) is essential. A consensus needs to be developed on how
field blanks are included and how blank subtractions are performed.

AMAP Litter and Microplastics Monitoring Guidelines
22
Recoveries: Spike recovery tests are highly recommended and are performed by adding a known
number of particles (of several sizes) to blank filters and these are then processed as actual samples.
These samples can also be used as blanks for other particles not intentionally added. As standard
reference materials are developed, it is recommended that laboratories assess method efficiency by
using them. Participation in intercalibration studies or round robin exercises is also strongly
encouraged.
Reporting: Standardized methods for instrumental analysis and reporting (number, weight, size,
length, and diameter) need to be developed. When reporting data, especially on microfibers, the
length but also the diameter is important because both these dimensions have impacts on the transport,
fate, and inhalation rate. Using more than one analytical technique to assess the presence and identity
of plastic particles is important because microscopy, Nile Red, Raman spectroscopy, and FTIR
methods used on their own, yield different types of information. Using these methods simultaneously
can yield better interpretation of results but will increase the time spent on each sample dramatically.
As sample scanning instrumentation becomes more widely available and used, the sample processing
time will decrease. In general, facing a particle size range of nm to µm, dedicated requirements for the
inclusion of MP data into existing databases for atmospheric pollution should be considered. The
advantages of combining atmospheric MP data with already collected data on many other atmospheric
pollutants and descriptors are considerable (e.g., EMEP, EBAS). This also includes the translation of
particle abundance, reported in particle counts, into weights.
2.1.7 Existing monitoring for populations/contaminants in the Arctic
Currently, there are no standardized and/or harmonized monitoring methods for air available with
only very limited reports of atmospheric MP, and no reports in the Arctic. Current active air sampling,
passive sampling, bulk deposition, wet deposition, and dry deposition methodology need to be
adapted to Arctic conditions and requirements for robust and reliable data.
2.1.8 Suggestion for future activities/knowledge gaps
The area of atmospheric MP is still in its infancy with many data gaps and a less than robust database,
hampering any conclusions on the role of the atmosphere in Arctic MP pollution.
However, experiences and lessons learned from the well-developed research on marine MP can be
used and adapted especially with respect to sample handling, QA/QC, quantification, and
identification of MP.
The recent report published by PAME, 2019 identified the following gap: “Atmospheric Transport -
There is a big research gap with no current studies being able to quantify plastics from long-range
winds, and other air-based vectors.” Although this report also recommends sampling ice floes to
improve estimates of atmospheric transport of litter, we do not recommend this because ice floes have
atmospheric sources but also incorporate plastics from water and sea spray (Allen et al., 2020), so
assuming the MP in ice floes are only from atmospheric deposition would lead to an overestimate of
atmospheric deposition.
Field measurements of known emission sources have yet to be undertaken. Primary and secondary
emissions redistribute MP back into the air from seawater as waves break (Allen et al., 2020) and/or
they may be suspended from terrestrial surfaces by wind (Rezaei et al., 2019). Melting sea ice and
AMAP Litter and Microplastics Monitoring Guidelines
23
glaciers can also lead to a redistribution of atmospheric MP. Studying the depositional fluxes at the
air-water interface is essential for investigating MP behavior in dynamic systems (Galgani and
Loiselle, 2019) and to estimate the loadings of atmospheric-related particles to land and sea surfaces.
Particles undergo deposition onto water and land surfaces, however, the behavior and fate of MP on
water surfaces will differ from deposition on land.
Trajectory models should be applied to determine the trends of long-range transport vs. local transport
and to evaluate event-based transport. Trajectory models and other atmospheric transport models
could lead to insights on the emission sources of airborne MP. Field measurements need to be carried
out complementarily, to both validate the transport models and to identify relevant sampling locations
and periods, saving time and effort. This work needs to be coupled with experimental determination
of aerodynamic features of MP and microfibers to feed correct variables into the model describing
their atmospheric transport using existing global distribution models.
The presence of other anthropogenic microfibers, e.g., cellulose fibers that are associated with
anthropogenic dyes and/or chemicals in atmospheric-related samples, is also worth documenting
when undertaking MP analysis. Cellulose fibers such as cotton, rayon, linen, and hemp are highly
processed and contain up to 30% added chemicals, which may enhance their persistency in the
environment; e.g., cellulose fibers from blue jeans are found in deep Arctic ocean sediments (Athey et
al., 2020).
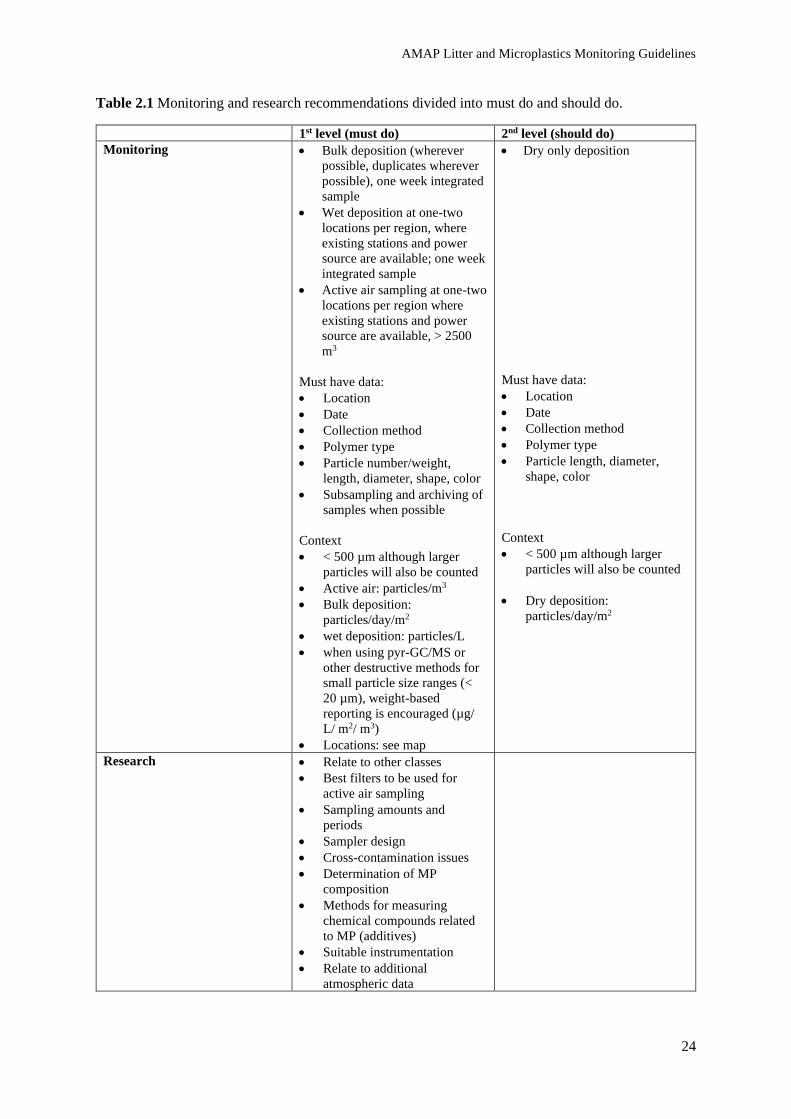
AMAP Litter and Microplastics Monitoring Guidelines
24
Table 2.1 Monitoring and research recommendations divided into must do and should do.
1st level (must do) 2nd level (should do)
Monitoring • Bulk deposition (wherever
possible, duplicates wherever
possible), one week integrated
sample
• Wet deposition at one-two
locations per region, where
existing stations and power
source are available; one week
integrated sample
• Active air sampling at one-two
locations per region where
existing stations and power
source are available, > 2500
m3
Must have data:
• Location
• Date
• Collection method
• Polymer type
• Particle number/weight,
length, diameter, shape, color
• Subsampling and archiving of
samples when possible
Context
• < 500 µm although larger
particles will also be counted
• Active air: particles/m3
• Bulk deposition:
particles/day/m2
• wet deposition: particles/L
• when using pyr-GC/MS or
other destructive methods for
small particle size ranges (<
20 µm), weight-based
reporting is encouraged (µg/
L/ m2/ m3)
• Locations: see map
• Dry only deposition
Must have data:
• Location
• Date
• Collection method
• Polymer type
• Particle length, diameter,
shape, color
Context
• < 500 µm although larger
particles will also be counted
• Dry deposition:
particles/day/m2
Research • Relate to other classes
• Best filters to be used for
active air sampling
• Sampling amounts and
periods
• Sampler design
• Cross-contamination issues
• Determination of MP
composition
• Methods for measuring
chemical compounds related
to MP (additives)
• Suitable instrumentation
• Relate to additional
atmospheric data
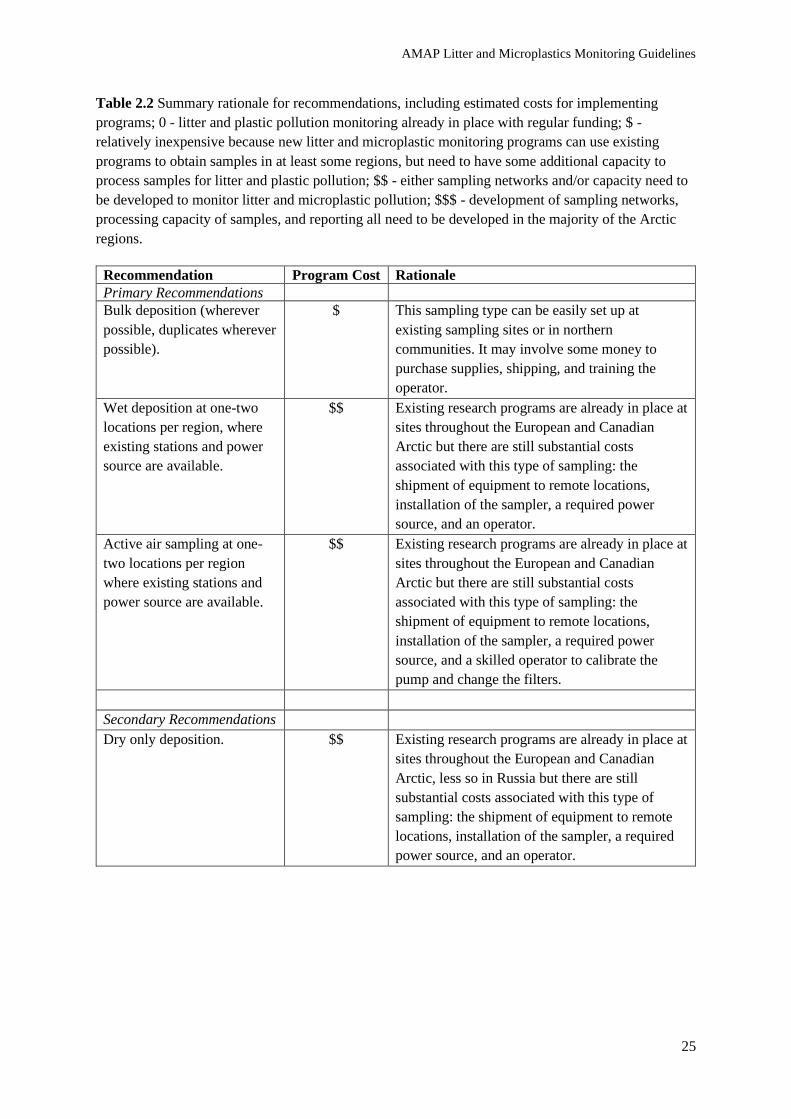
AMAP Litter and Microplastics Monitoring Guidelines
25
Table 2.2 Summary rationale for recommendations, including estimated costs for implementing
programs; 0 - litter and plastic pollution monitoring already in place with regular funding; $ -
relatively inexpensive because new litter and microplastic monitoring programs can use existing
programs to obtain samples in at least some regions, but need to have some additional capacity to
process samples for litter and plastic pollution; $$ - either sampling networks and/or capacity need to
be developed to monitor litter and microplastic pollution; $$$ - development of sampling networks,
processing capacity of samples, and reporting all need to be developed in the majority of the Arctic
regions.
Recommendation Program Cost Rationale
Primary Recommendations
Bulk deposition (wherever
possible, duplicates wherever
possible).
$
This sampling type can be easily set up at
existing sampling sites or in northern
communities. It may involve some money to
purchase supplies, shipping, and training the
operator.
Wet deposition at one-two
locations per region, where
existing stations and power
source are available.
$$ Existing research programs are already in place at
sites throughout the European and Canadian
Arctic but there are still substantial costs
associated with this type of sampling: the
shipment of equipment to remote locations,
installation of the sampler, a required power
source, and an operator.
Active air sampling at one-
two locations per region
where existing stations and
power source are available.
$$ Existing research programs are already in place at
sites throughout the European and Canadian
Arctic but there are still substantial costs
associated with this type of sampling: the
shipment of equipment to remote locations,
installation of the sampler, a required power
source, and a skilled operator to calibrate the
pump and change the filters.
Secondary Recommendations
Dry only deposition.
$$ Existing research programs are already in place at
sites throughout the European and Canadian
Arctic, less so in Russia but there are still
substantial costs associated with this type of
sampling: the shipment of equipment to remote
locations, installation of the sampler, a required
power source, and an operator.

AMAP Litter and Microplastics Monitoring Guidelines
26
References
Abbasi, S., B. Keshavarzi, F. Moore, A. Turner, F.J. Kelly, A. Oliete Dominguez and A. Jaafarzadeh,
2019. Distribution and potential health impacts of microplastics and microrubbers in air and street
dusts from Asaluyeh County, Iran. Environmental Pollution, 244:153-164.
https://doi.org/10.1016/j.envpol.2018.10.039
Adams, J.K., L.M. Jantunen, M.L. Diamond, S.A. Finkelstein, C.M. Rochman, S. Bernstein and G.
Stern, 2021. Emerging contaminants of concern for the Canadian Arctic Archipelago: evaluating the
presence of microplastics in deep-sea arctic marine sediments. Science of the Total Environment, in
press.
Allen, S., D. Allen, K. Moss, G. Le Roux, V.R. Phoenix and J.E. Sonke, 2020. Examination of the
ocean as a source for atmospheric microplastics. PLoS ONE, 15(5): e0232746.
https://doi.org/10.1371/journal.pone.0232746
Allen, S., D. Allen, V.R. Phoenix, G. Le Roux, P. Durántez Jiménez, A. Simonneau, S. Binet and D.
Galop, 2019. Atmospheric transport and deposition of microplastics in a remote mountain catchment.
Nature Geoscience, 12:339-344. https://doi.org/10.1038/s41561-019-0335-5
Ambrosini, R., R.S. Azzoni, F. Pittino, G. Diolaiuti, A. Franzetti and M. Parolini, 2019. First evidence
of microplastic contamination in the supraglacial debris of an alpine glacier. Environmental Pollution,
253:297-301. https://doi.org/10.1016/j.envpol.2019.07.005
Athey, S.N., J.K. Adams, L.M. Erdle, L.M. Jantunen, P.A. Helm, S.A. Finkelstein and M.L. Diamond,
2020. The widespread environmental footprint of indigo denim microfibers from blue jeans.
Environmental Science and Technology Letters, 7:840-847.
https://doi.org/10.1021/acs.estlett.0c00498
Bergmann, M., S. Mützel, S. Primpke, M.B. Tekman, J. Trachsel and G. Gerdts, 2019. White and
wonderful? Microplastics prevail in snow from the Alps to the Arctic. Science Advances 5:eaax1157.
https://doi.org/10.1126/sciadv.aax1157
Biber, N.F.A., A. Foggo and R.C. Thompson, 2019. Characterising the deterioration of different
plastics in air and seawater. Marine Pollution Bulletin 141:595-602.
https://doi.org/10.1016/j.marpolbul.2019.02.068
Brander, S.M., V.C. Renick, M.M. Foley, C. Steele, M. Woo, A. Lusher, S. Carr, P. Helm, C. Box, S.
Cherniak, R.C. Andrews and C.M. Rochman, 2020. Sampling and quality assurance and quality
control: a guide for scientists investigating the occurrence of microplastics across matrices. Applied
Spectroscopy, 74:1099-1125. https://doi.org/10.1177/0003702820945713
Cai, L., J. Wang, J. Peng, Z. Tan, Z. Zhan, X. Tan and Q. Chen, 2017. Characteristic of microplastics
in the atmospheric fallout from Dongguan city, China: preliminary research and first evidence.
Environmental Science and Pollution Research 24:24928-24935. https://doi.org/10.1007/s11356-017-
0116-x
Catarino, A.I., V. Macchia, W.G. Sanderson, R.C. Thompson and T.B. Henry, 2018. Low levels of
microplastics (MP) in wild mussels indicate that MP ingestion by humans is minimal compared to

AMAP Litter and Microplastics Monitoring Guidelines
27
exposure via household fibers fallout during a meal. Environmental Pollution 237:675-684.
https://doi.org/10.1016/j.envpol.2018.02.069
Dehghani, S., F. Moore and R. Akhbarizadeh, 2017. Microplastic pollution in deposited urban dust,
Tehran metropolis, Iran. Environmental Science and Pollution Research, 24:20360-20371.
https://doi.org/10.1007/s11356-017-9674-1
Dris, R., J. Gasperi, C. Mirande, C. Mandin, M. Guerrouache, V. Langlois and B. Tassin, 2017. A
first overview of textile fibers, including microplastics, in indoor and outdoor environments.
Environmental Pollution 221:453-458. https://doi.org/10.1016/j.envpol.2016.12.013
Dris, R., J. Gasperi, V. Rocher, M. Saad, N. Renault and B. Tassin, 2015. Microplastic contamination
in an urban area: a case study in Greater Paris. Environmental Chemistry, 12:592-599.
https://doi.org/10.1071/en14167
Dris, R., J. Gasperi, M. Saad, C. Mirande and B. Tassin, 2016. Synthetic fibers in atmospheric fallout:
a source of microplastics in the environment? Marine Pollution Bulletin, 104:290-293.
https://doi.org/10.1016/j.marpolbul.2016.01.006
Enyoh, C.E., A.W. Verla, E.N. Verla, F.C. Ibe and C.E. Amaobi, 2019. Airborne microplastics: a
review study on method for analysis, occurrence, movement and risks. Environmental Monitoring and
Assessment, 191:668. https://doi.org/10.1007/s10661-019-7842-0
Evangeliou, N., H. Grythe, Z. Klimont, C. Heyes, S. Eckhardt, S. Lopez-Aparicio and A. Stohl, 2020.
Atmospheric transport is a major pathway of microplastics to remote regions. Nature
Communications, 11:3381. https://doi.org/10.1038/s41467-020-17201-9
Galgani, L. and S.A. Loiselle, 2019. Plastic accumulation in the sea surface microlayer: an
experiment-based perspective for future studies. Geosciences, 9:66.
https://doi.org/10.3390/geosciences9020066
Geilfusa, N.-X., K.M. Munson, J. Sousa, Y. Germanov, S. Bhugaloo, D. Babb and F. Wang, 2019.
Distribution and impacts of microplastic incorporation within sea ice. Marine Pollution Bulletin,
145:463-473. https://doi.org/10.1016/j.marpolbul.2019.06.029
Gewert, B., M.M. Plassmann and M. MacLeod, 2015. Pathways for degradation of plastic polymers
floating in the marine environment. Environmental Science: Proceses and Impacts, 17(9):1513-1521.
https://doi.org/10.1039/c5em00207a
Kaya, A.T., M. Yurtsever and S.Ç. Bayraktar, 2018. Ubiquitous exposure to microfiber pollution in
the air. European Physical Journal Plus, 133:488. https://doi.org/10.1140/epjp/i2018-12372-7
Klein, M. and E.K. Fischer, 2019. Microplastic abundance in atmospheric deposition within the
Metropolitan area of Hamburg, Germany. Science of the Total Environment, 685:96-103.
https://doi.org/10.1016/j.scitotenv.2019.05.405
Liu, K., X. Wang, T. Fang, P. Xu, L. Zhu and D. Li, 2019a. Source and potential risk assessment of
suspended atmospheric microplastics in Shanghai. Science of the Total Environment, 675:462-471.
https://doi.org/10.1016/j.scitotenv.2019.04.110
AMAP Litter and Microplastics Monitoring Guidelines
28
Liu, K., T. Wu, X. Wang, Z. Song, C. Zong, N. Wei and D. Li, 2019b. Consistent transport of
terrestrial microplastics to the ocean through atmosphere. Environmental Science and Technology,
53:10612-10619. https://doi.org/10.1021/acs.est.9b03427
Maes, T., R. Jessop, N. Wellner, K. Haupt and A.G. Mayes, 2017. A rapid-screening approach to
detect and quantify microplastics based on fluorescent tagging with Nile Red. Scientific Reports,
7:44501. https://doi.org/10.1038/srep44501
Materić, D., A. Kasper-Giebl, D. Kau, M. Anten, M. Greilinger, E. Ludewig, E. van Sebille, T.
Röckmann and R. Holzinger, 2020. Micro- and nanoplastics in alpine snow: a new method for
chemical identification and (semi)quantification in the Nanogram Range. Environmental Science and
Technology, 54(4):2353-2359. https://doi.org/10.1021/acs.est.9b07540
Panagopoulos Abrahamsson, D., N.A. Warner, L. Jantunen, A. Jahnke, F. Wong and M. MacLeod,
2020. Investigating the presence and persistence of volatile methylsiloxanes in Arctic sediments.
Environmental Science: Processes and Impacts, 22:908-917. https://doi.org/10.1039/c9em00455f
Protection of the Arctic Marine Environment (PAME), 2019. Desktop Study on Marine Litter
Including Microplastics in the Arctic. 11th Arctic Council Ministerial Meeting, Rovaniemi, Finland, 7
May 2019. PAME, Akureyri, Iceland. 114pp. [online] URL:
https://www.pame.is/images/03_Projects/Arctic_Marine_Pollution/Litter/Desktop_study/Desktop_Stu
dy_on_marine_litter.pdf
Rezaei, M., M.J.P.M. Riksen, E. Sirjani, A. Sameni and V. Geissen, 2019. Wind erosion as a driver
for transport of light density microplastics. Science of the Total Environment, 669:273-281.
https://doi.org/10.1016/j.scitotenv.2019.02.382
Rummel, C.D., B.I. Escher, O. Sandblom, M.M. Plassmann, H.P.H. Arp, M. MacLeod and A. Jahnke,
2019. Effects of leachates from UV-weathered microplastic in cell-based bioassays. Environmental
Science and Technology, 53:9214-9223. https://doi.org/10.1021/acs.est.9b02400
Sühring, R., M.L. Diamond, S. Bernstein, J. Adams, J. Schuster, K. Fernie, K. Elliot, G. Stern and
L.M. Jantunen, 2020. Organophosphate esters in the Canadian Arctic Ocean. Environmental Science
and Techology, in press. https://doi.org/10.1021/acs.est.0c04422
Stohl, A., 2006. Characteristics of atmospheric transport into the Arctic troposphere. Journal of
Geophysical Research: Atmospheres, 111(D11). https://doi.org/10.1029/2005JD006888
Vianello, A., R. Lund Jensen, L. Liu and J. Vollertsen, 2019. Simulating human exposure to indoor
airborne microplastics using a Breathing Thermal Manikin. Scientific Reports, 9:8670.
https://doi.org/10.1038/s41598-019-45054-w
Zhang, Y., T. Gao, S. Kang and M. Sillanpää, 2019. Importance of atmospheric transport for
microplastics deposited in remote areas. Environmental Pollution, 254:112953.
https://doi.org/10.1016/j.envpol.2019.07.121
Zhang, Y., S. Kang, S. Allen, D. Allen, T. Gao and M. Sillanpää, 2020. Atmospheric microplastics: a
review on current status and perspectives. Earth-Science Reviews, 203:103118.
https://doi.org/10.1016/j.earscirev.2020.103118

AMAP Litter and Microplastics Monitoring Guidelines
29
Zhou, Q., C. Tian and Y. Luo, 2017. Various forms and deposition fluxes of microplastics identified
in the coastal urban atmosphere. Chinese Science Bulletin, 62(33): 3902-3909.
https://doi.org/10.1360/n972017-00956

AMAP Litter and Microplastics Monitoring Guidelines
30
2.2 Water AUTHORS: AMY L. LUSHER, INGEBORG HALLANGER, BJØRN EINAR GRØSVIK, AND ALESSIO GOMIERO
2.2.1 Introduction
The first assessments of plastic in the global oceans were based upon items floating on the ocean
surface or immediately below. The ocean surface accounts for most studies conducted on plastic
pollution to date. This is likely in part because roughly half of all plastic produced is less dense than
seawater and expected to float at sea (Geyer et al., 2017) and partly because water is one of the easiest
and cheapest domains to study. We are now fully aware that plastics of various sizes are everywhere,
and all water bodies, either freshwater or marine, can be sampled to study the presence of plastics
from surface waters or within the water column.
The broad distribution of plastics is assumed to be related to their longevity in the environment; they
degrade very slowly, mainly through mechanical abrasion and exposure to UV radiation. Water
surfaces and the upper water column (especially in the sea) are very dynamic and provide a
connection between coastal, inland waters, and offshore areas facilitated by water movement and
transport patterns and processes. The relatively high buoyancy of many plastics facilitates transport
from source areas, which may involve long-distance or even global-scale transport. Floating plastics
can also be transported vertically. Many processes are involved in vertical displacement including
density, buoyancy, size, degradation, biofouling, and other biological interactions. As a result, we are
now aware that plastics move between water compartments because of their physical, mechanical, and
biological properties (Choy et al., 2019; van Sebille et al., 2020).
The inclusion of plastics in water monitoring programs must consider this complex scenario and focus
on useful and affordable actions to collect time series, which are the primary tool to verify whether
remediation actions are effective.
Sampling strategies for monitoring must relate to the specific goals of the monitoring program. For
example, does one want to investigate accumulation areas, input related to point sources (e.g.,
effluents from wastewater treatment plants or industries), input from freshwater water ways (rivers,
creeks, etc.), or long-range transport? The sampling methods available for each program may be
different depending on which compartment and which size of plastic is being monitored. Further, the
selection of sampling location may be constrained by the facilities and infrastructure available to
specific nations. Other important aspects that might need to be considered are the inherent properties
of the chosen environment as well as the sampling season. For example, surface sampling nets are
impractical in open waters when there is high biomass, adverse weather conditions, and sea ice.
Critical analysis of methods and many general considerations about monitoring have been highlighted
by many working groups at a global scale, some of them are reported in subsection 2.2.3, but they
were not specific to the Arctic. We therefore focus on the specific issues that are relevant for the
Arctic to implement global, general-use recommendations for local application.
2.2.2 Status of global science
In polar regions, records of plastic pollution in the Arctic date back to the 1960s, with some
observations of plastic debris and relative consequences for marine life from Alaska (Threlfall, 1968).
Large floating plastic items have been observed at sea dating back to the 1970s, and included plastic

AMAP Litter and Microplastics Monitoring Guidelines
31
bottles, ropes, balloons, and rubber shoes (Venrick et al., 1973). Similarly, researchers began
sampling small plastics from oceanic surface waters around the same time (Carpenter and Smith,
1972). Long-term data sets have emerged from the Pacific (Law et al., 2014) and Atlantic (Law et al.,
2010), as have numerous global ocean models (Mountford and Morales Maqueda, 2019; van Sebille
et al., 2020). Freshwater water bodies are comparatively less studied (Mendoza and Balcer, 2019).
In terms of the Arctic, large plastic items are routinely reported floating in the surface waters of the
Barents Sea and Fram Strait (Bergmann et al., 2016; Grøsvik et al., 2018). Norway and Russia have a
long-term collaboration of monitoring fish resources in the Barents Sea used for determining fisheries
quotas, and from 2004, this monitoring was extended to include ecosystem-based monitoring. From
2010, the monitoring also included recording floating marine debris and litter as bycatch in trawls.
The ecosystem survey in the Barents Sea covers a station net of approximately 300 stations and is
performed between August-October each year (Eriksen et al., 2017). Similarly, in the Canadian
Arctic, at-sea surveys of seabirds have been expanded to include floating marine debris (Mallory et
al., 2021).
Specific investigations targeting microplastics (MP) in the Arctic began by using vessels of
opportunity to collect data from offshore seawater (Lusher et al., 2015; Kanhai et al., 2018, 2020), as
well as surface sampling using, e.g., manta nets (Cózar et al., 2017). There are historical records of
small plastic items captured in surface sampling nets dating back to the 1970/1980s in the Bering Sea
and the Gulf of Alaska (e.g., Shaw, 1977; Day and Shaw, 1987; Day et al., 1990). Research vessels
often have an underway seawater pump, positioned in the subsurface waters to collect information
such as temperature, salinity, and conductivity. Lusher et al., 2015 used this to collect back-to-back
samples while a research vessel was on a transect from northern Norway (Tromsø, 69.65° N, 18.95°
E) to the south west of Svalbard (78.1° N, 18.8° W). They also collected manta net samples (> 330
µm) along the same route intermittently. The average number of particles collected using the pump
was 2.68 ± 2.95 particles per m3 (range 0.00-11.5 particles per m3), whereas the manta net results
yielded lower values, 0.34 ± 0.31 particles per m3 (range 0.00-1.31 particles per m3). Similarly, Cózar
et al. (2017) demonstrated how manta nets could be used to collect information on plastics floating in
the surface waters during a circumpolar expedition. Out of the 42 samples collected, plastic debris (>
500 µm) were generally scarce, however the investigation did point to higher concentrations in the
Barents Sea and Greenland areas compared to the other regions of the Arctic. Additional manta net
investigations have been carried out in the Bering Sea (0.091 ± 0.094 particles per m3), Northern
Pacific (0.030 ± 0.017 particles per m3), and Chukchi Sea (0.23 ± 0.07 particles per m3; Mu et al.,
2019). To date, the most northerly manta net sample has been carried out close to the edge of the
North Pole ice shelf at 82°07’ N (Aliani et al., 2020).
Nets are selective for some size classes of MP and miss relevant parts of the mass of floating
megaplastic size class. They also fail to sample many particles smaller than the lower mesh size,
which typically is dominated by smaller MP fragments and microfibers. This is evidenced by a recent
study carried out in Nuup Kangerlua, a fjord in West Greenland (Rist et al., 2020). Pump sampling (5
metre depth, 10 µm lower limit) and bongo nets (surface, 300 µm lower limit) produced values with
two orders of magnitude difference. Therefore, integration with pump and bucket sampling is
envisaged to cover as many size classes as possible (Ryan et al., 2019) and is becoming more and
more common in oceanographic expeditions.
Pump sampling was also used by Morgana et al., 2018 and Jiang et al., 2020 who reported values
similar to those found by Lusher et al., 2015, confirming the ubiquitous presence of MP in the
AMAP Litter and Microplastics Monitoring Guidelines
32
Greenland Sea. Higher levels of MP were reported in surface waters underlying ice floes, 0-18
particles per m3 (Kanhai et al., 2020). On the contrary, during an investigation of different water
masses in the Arctic Basin, Kanhai et al. (2018), reported a lower average value, 0.7 particles per m3
(range 0-7.5 particles per m3). Water samples (218-561 litres) have also been taken in the water
column of HAUSGARTEN (near surface, ~300 m, ~1000 m, and above the seafloor) with reported
values ranging from 0-1,287 particles per m3 (Tekman et al., 2020). The highest reported values were
seen in subsurface waters. Although in many cases, subsamples were processed for data analysis (5-
100%). Some of the highest values of MP have been reported in coastal water bodies near Ny-
Ålesund, Svalbard (61.2 particles per m3; Granberg et al., 2019).
Surface waters in the eastern Canadian Arctic waters of Nunavut were investigated for MP using
bucket samples, reporting an average concentration of 0.22 ± 0.23 particles per L (Huntington et al.,
2020). The concentrations were not related to the human populations suggesting that MP
contamination in the Canadian Arctic is primarily driven by long-range transport.
Although scarce, data collected throughout the water column can be used to provide an insight into
the three-dimensional distribution of MP in the Arctic (Amélineau et al., 2016; Kanhai et al., 2018;
Tekman et al., 2020; von Friesen et al., 2020). Data collected in offshore waters and within the water
column of the Arctic support the hypothesis that the water column constitutes a major reservoir for
MP in the Arctic (Cózar et al., 2017). During an investigation of two oceanographically different
fjords, Kongsfjord and Rijpfjorden, von Friesen et al., 2020 observed variable microliter
concentrations along the two bathymetric gradients. Highest concentrations were identified in the
subsurface samples from Kongsfjord (48 particles per L).
Studies of MP concentrations (> 100 µm, volume of 1-3 m3) in the water column in Monterey Bay,
California demonstrated the highest levels in water samples collected from depths just below the
mixed layer (15 particles per m3 at 200 m), at a deep site located 25 km from the nearest land.
Microplastics concentrations near the sea surface (5 m) were among the lowest measured (median 2.9
particles per L) and were roughly equivalent to those of the deepest waters sampled (1000 m, median
2.9 particles per L). Concentrations were highest at intermediate depths into the mesopelagic zone
(Choy et al., 2019). It must be noted that the density of polymers along with biotic and abiotic factors
can alter a particle’s buoyancy and this will influence the position location of plastics within the water
column. There is evidence of items made of low-density polymers in the deep sea as well as high-
density polymers floating on the ocean surface. In general, density is not a relevant property to
explain vertical position or displacement of plastic. This is especially true for macrodebris. The
presence of air bubbles or of certain shapes do not allow sinking. Polymer density may be relevant for
MP or nanoplastics, but at these scales turbulence and surface tension may also be important.
Sources of plastics to the Arctic may include long-range transport from distant sources, or input from
local sources such as urban centres (Rist et al., 2020), fishing, wastewater treatment facilities
(Granberg et al., 2019; von Friesen et al., 2020), and melting of sea ice (i.e., released during; von
Friesen et al., 2020).
At the time of writing, there has only been a single investigation of a small freshwater lake. Sediments
adhered to rocks from a shallow lake (0.75m) near Ny-Ålesund and were investigated for
anthropogenic particles. Microplastics were estimated to equate to 90 particles per m2 (González-
Pleiter et al., 2020).

AMAP Litter and Microplastics Monitoring Guidelines
33
No other investigations of freshwater bodies or rivers in the Arctic have been published. Although
they are of interest due to the high volumes of riverine discharge into the Arctic regions from Russian
and Canadian rivers.
2.2.3 Trends to date
Unfortunately, the investigations to date in the Arctic are difficult to compare because they use
different methods, different reporting criteria, and different measurement values. Thus, there is
currently no available data on the scientific trends.
Monitoring ideally should focus on identifying trends in sources to ensure that mitigation strategies
and remediation efforts can be introduced close to source or accumulation areas, respectively. For
trends to be monitored effectively in the Arctic, the differences between summer and winter seasons
need to be considered as does the repeatability of sampling. For example, sampling in the Arctic can
be costly and needs to be planned carefully (especially those efforts that require research vessels).
Further, the winter season enforces its own limitations, ice-covered water cannot be sampled to
produce informative or representative data. Without careful consideration, this may lead to gaps in
information. The methods used should be harmonized throughout the AMAP regions.
Table 2.3 Summary of available data in the Arctic.
Freshwater Marine
Sources Limited data Limited data
Inshore Limited data Limited data
Offshore - Data available
2.2.4 Benefits of using water samples
In terms of macroplastics, visual observations of floating macroplastics can be conducted in parallel to
bird and mammal surveys at no extra cost. Data gathered can help provide information on sources and
potential interactions with biota. Microplastic sampling can be conducted using surface sampling nets
or pumps, which are already used and recommended around the world, thus enabling the development
of comparable datasets. Pump sampling can be conducted through seawater intakes on research
vessels where a large amount of metadata is usually collected for characterizing the water column,
allowing metadata to be directly compared to sampled MP. This can be important when sampling in
areas where water stratification changes. Furthermore, many research vessels are already involved in
long-term dataset collections, such as nutrients, therefore MP could be added to these routine
sampling regimes using pump methods or towing a Ferrybox so as not to disrupt ongoing programs.
The water column can be monitored to infer the vertical distribution of plastics. However,
differentiating between those sinking or returning to the ocean surface is not possible at present.
Limitations of water sampling
Meteorological conditions are often a limiting factor for water sampling or monitoring efforts. Surface
water monitoring is reliant on calm weather conditions. Visual surveys require good visibility. Surface
sampling nets require stable surface conditions and can be severely hampered by large plankton

AMAP Litter and Microplastics Monitoring Guidelines
34
blooms. Microplastic sampling using nets can also introduce sources of error from self-contamination,
including sampler’s clothing (microfibers) and sampling platform (i.e., but also from the research
vessel, small boat, or other). All sampling of offshore waters requires access to research vessels,
whereas coastal water and inland water sampling can probably rely on smaller, more easily accessible
sampling platforms, although then, the equipment used needs to be similar. Coastal sampling can be
hampered by changes in tidal directions.
2.2.5 Methods
Sample collection
Surface waters:
Surface water samples can be collected using different gear including nets and pumps to investigate
MP. Several standards and recommended protocols have recently emerged for sampling MP. Table
2.4 summarizes the recommended protocols for each sample type. For example, a manta net can be
deployed from a research vessel for a period of 10-30 minutes, with a speed of between 1 to 3 knots.
After each tow, nets must be washed and rinsed onboard with properly filtered water from the outside
using the deck hose, and the cod-end sampler should be removed and rinsed in contamination-
controlled conditions. Samples are washed using filtered seawater and a series of clean metal sieves
(e.g., 5 mm and 200 µm) to fractionate samples before subsequent analysis. Manta nets have limited
use in rough seas; waves affect manta results and differences between GPS and flow meter data can
occur as has been seen in the Arctic (Lusher et al., 2015) and through dedicated comparative studies
(Michida et al., 2019). Wind speed may also affect the vertical displacement of particles in the upper
layers of the water column (Kukulka et al., 2012) and wind stress and particle concentration were
negatively correlated, with high densities being found at relatively low wind speeds. When correcting
the abundance of particles > 700 μm for the effect of wind-induced mixing, Suaria et al., 2016 found a
correction coefficient of 2.06 (max 8.97), resulting in an increased average concentration of
particles/m2 after correction. CTD rosettes can be deployed at the surface, and, providing all bottles
are fired together, they can collect a volume of water that may be comparable to net samples. CTD
bottles used in parallel with bucket sampling may provide a useful tool to sample microfibers in the
surface and subsurface waters (Ryan et al., 2019).
Different count protocols for quantification of floating macrolitter have been proposed by Aliani et
al., 2003; Ryan, 2013 modified in Ryan, 2014; Suaria and Aliani, 2014; and Strafella et al., 2019. The
EU Joint Research Centre in Ispra organized a workshop in Barcelona in 2016 to define a standard for
the sighting of microdebris. The identified methods were subsequently used in parallel during a
common expedition in the Southern Ocean (Suaria et al., 2020a). The resulting recommendations
were as follows: all floating debris items should be counted and recorded with a time assignment
during daylight hours. Position data should be obtained through the vessel log. Metadata surrounding
the items to be recorded include: size (estimated to the nearest 1 cm), perpendicular distance from the
ship (m), buoyancy (at, above, or below the water surface), type of material (plastic, metal, glass,
worked wood, paper-card, etc.), function (fishing gear, packaging, etc.), and color. Items can be
further assigned to size categories (A. 2.5-5 cm, B. 5-10 cm, C.10-20 cm, D. 20-30 cm, E. 30-50 cm,
F. > 50 cm) and to one of two major type categories: anthropogenic marine litter (AML) and natural
marine litter (NML; Campanale et al., 2019; Suaria and Aliani, 2014). Data collection by this method
is relatively simple and can be carried out from ships of opportunity as well as volunteers and in
citizen science projects, following training. Training is a very critical step toward data quality when
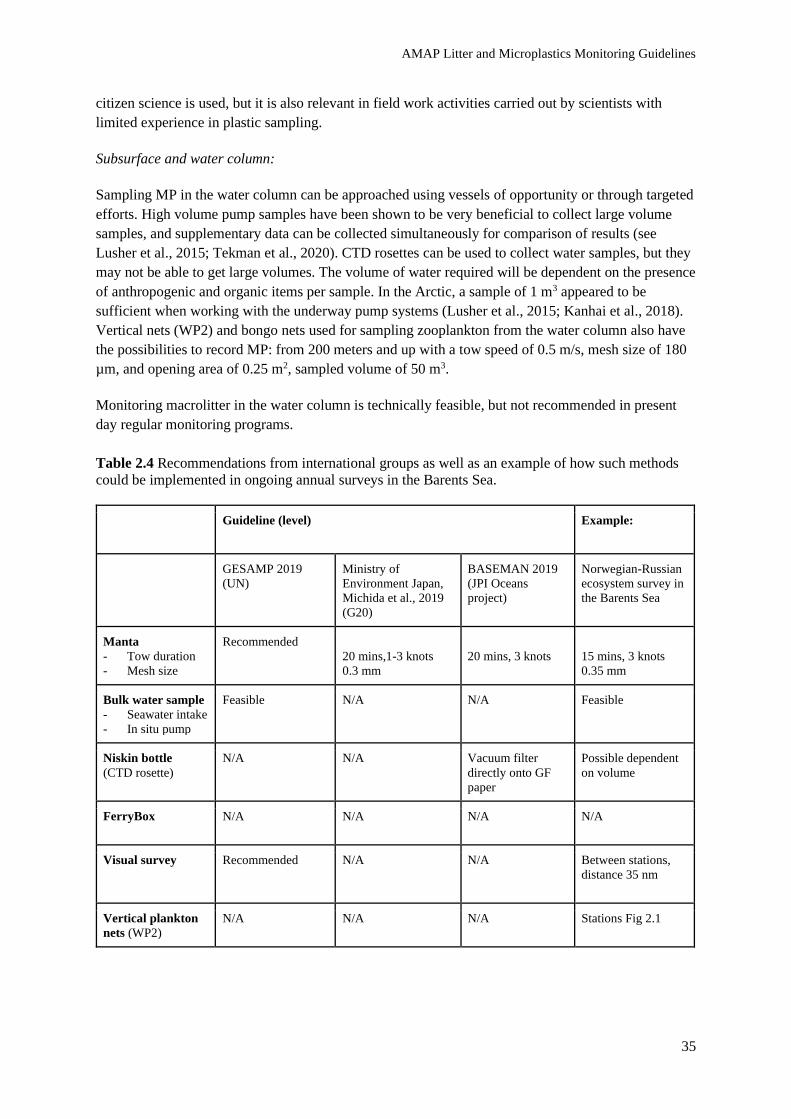
AMAP Litter and Microplastics Monitoring Guidelines
35
citizen science is used, but it is also relevant in field work activities carried out by scientists with
limited experience in plastic sampling.
Subsurface and water column:
Sampling MP in the water column can be approached using vessels of opportunity or through targeted
efforts. High volume pump samples have been shown to be very beneficial to collect large volume
samples, and supplementary data can be collected simultaneously for comparison of results (see
Lusher et al., 2015; Tekman et al., 2020). CTD rosettes can be used to collect water samples, but they
may not be able to get large volumes. The volume of water required will be dependent on the presence
of anthropogenic and organic items per sample. In the Arctic, a sample of 1 m3 appeared to be
sufficient when working with the underway pump systems (Lusher et al., 2015; Kanhai et al., 2018).
Vertical nets (WP2) and bongo nets used for sampling zooplankton from the water column also have
the possibilities to record MP: from 200 meters and up with a tow speed of 0.5 m/s, mesh size of 180
µm, and opening area of 0.25 m2, sampled volume of 50 m3.
Monitoring macrolitter in the water column is technically feasible, but not recommended in present
day regular monitoring programs.
Table 2.4 Recommendations from international groups as well as an example of how such methods
could be implemented in ongoing annual surveys in the Barents Sea.
Guideline (level) Example:
GESAMP 2019
(UN)
Ministry of
Environment Japan,
Michida et al., 2019
(G20)
BASEMAN 2019
(JPI Oceans
project)
Norwegian-Russian
ecosystem survey in
the Barents Sea
Manta
- Tow duration
- Mesh size
Recommended
20 mins,1-3 knots
0.3 mm
20 mins, 3 knots
15 mins, 3 knots
0.35 mm
Bulk water sample
- Seawater intake
- In situ pump
Feasible N/A N/A Feasible
Niskin bottle
(CTD rosette)
N/A
N/A Vacuum filter
directly onto GF
paper
Possible dependent
on volume
FerryBox N/A N/A N/A N/A
Visual survey Recommended N/A N/A Between stations,
distance 35 nm
Vertical plankton
nets (WP2)
N/A
N/A
N/A
Stations Fig 2.1

AMAP Litter and Microplastics Monitoring Guidelines
36
Sample processing
For methods related to sample processing, please refer to GESAMP, 2019 and Michida et al., 2019 for
recommendations. Samples containing high levels of organic matter will need further processing
before they can be analyzed for MP. Methods include digestion using bases or enzymes (acids are not
recommended) and density separation. High temperatures and strong reagents are discouraged
because they can affect plastic particles (Hurley et al., 2018; Lusher et al., 2020). Method choice is
usually laboratory dependent. Any method used should be validated before use on samples to test
spiked samples. Limitations of the methods must be reported to allow researchers to see the deviations
from methods clearly.
Specific to the Arctic
There are currently no specific protocols available for the Arctic, although the relevant monitoring
protocols for manta nets and pump samples are published in Lusher et al., 2015; Cózar et al., 2017;
and Kanhai et al., 2018.
2.2.6 Quality assessment/quality control (QA/QC) specific to the compartment/matrix
For all investigations of MP in water samples, all sampling devices must be thoroughly cleaned before
sampling, i.e., flushing with high volumes of filtered or ultra-pure water. Potential sources of
contamination must be collected to act as a reference, including the clothing worn by samplers and
any plastics used in the vicinity on the vessels, as well as vessel paint. Importantly, field blanks must
always be collected. A field blank can include a filtered water rinse of a net (Michida et al., 2019) or
an open moist (filtered water) sample container/petri dish for the same duration as handling of sample.
Participation in workshops and ring tests to assure quality assurance/quality control (QA/QC), for
example, through QUASIMEME is encouraged.
It must be noted that there is a great need to implement chemical characterization of fibers identified
in surface waters. In a recent investigation of a global dataset of seawater samples, the majority of
fibers were cellulosic (79.5%) or of natural origin (12.3%) whereas only 8.2% were synthetic (Suaria
et al., 2020b).
An overview of QA/QC measures of MP sampling has been presented in Brander et al. (2020).
2.2.7 Existing monitoring for populations/contaminants in the Arctic
There are no current existing monitoring programs in the Arctic relevant to plastics in water samples.
However, there have been several sporadic scientific investigations. The joint Norwegian-Russian
ecosystem survey in the Barents Sea performed annually in August-October includes sampling of
several fish species, shrimp, and sediments for the monitoring of contaminants. Floating debris and
macrolitter as bycatch in trawls are recorded. Microplastics are collected from manta trawls from
some of the stations (Figure 2.1).
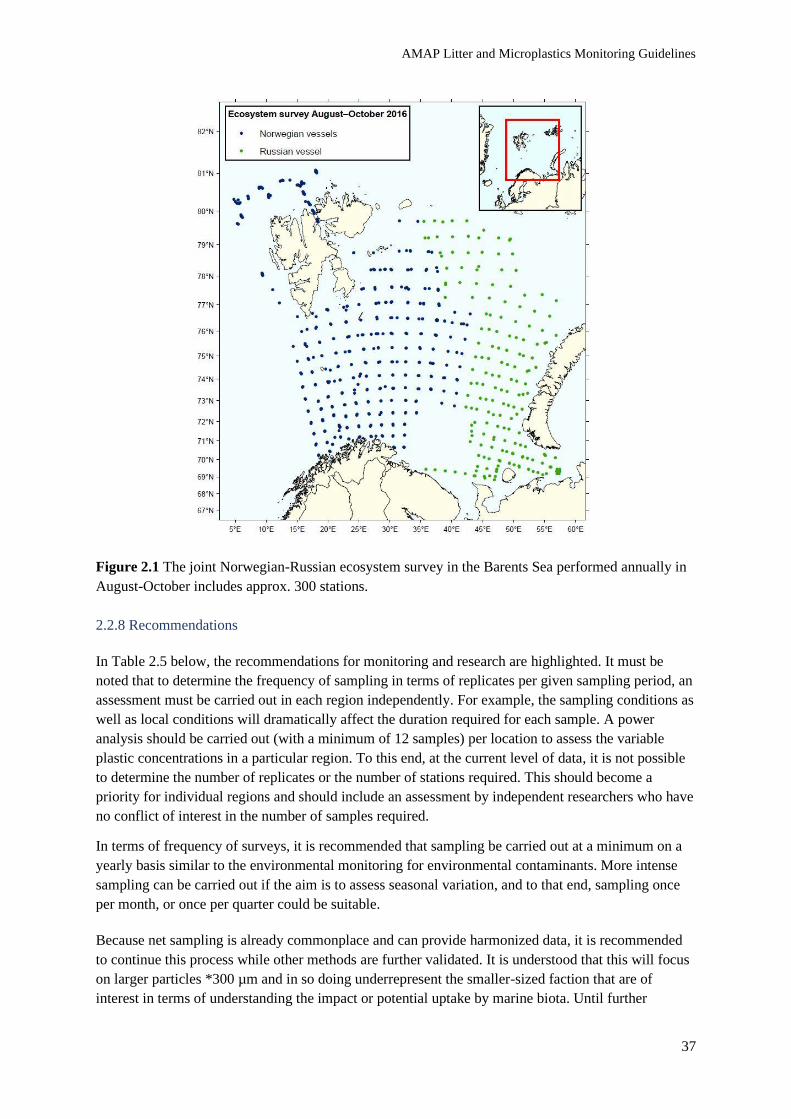
AMAP Litter and Microplastics Monitoring Guidelines
37
Figure 2.1 The joint Norwegian-Russian ecosystem survey in the Barents Sea performed annually in
August-October includes approx. 300 stations.
2.2.8 Recommendations
In Table 2.5 below, the recommendations for monitoring and research are highlighted. It must be
noted that to determine the frequency of sampling in terms of replicates per given sampling period, an
assessment must be carried out in each region independently. For example, the sampling conditions as
well as local conditions will dramatically affect the duration required for each sample. A power
analysis should be carried out (with a minimum of 12 samples) per location to assess the variable
plastic concentrations in a particular region. To this end, at the current level of data, it is not possible
to determine the number of replicates or the number of stations required. This should become a
priority for individual regions and should include an assessment by independent researchers who have
no conflict of interest in the number of samples required.
In terms of frequency of surveys, it is recommended that sampling be carried out at a minimum on a
yearly basis similar to the environmental monitoring for environmental contaminants. More intense
sampling can be carried out if the aim is to assess seasonal variation, and to that end, sampling once
per month, or once per quarter could be suitable.
Because net sampling is already commonplace and can provide harmonized data, it is recommended
to continue this process while other methods are further validated. It is understood that this will focus
on larger particles *300 µm and in so doing underrepresent the smaller-sized faction that are of
interest in terms of understanding the impact or potential uptake by marine biota. Until further

AMAP Litter and Microplastics Monitoring Guidelines
38
methods are explored, this is the method with the highest technological readiness level and it is
already operational.
The volume of samples taken per sample will be heavily dependent on the sampling conditions during
a particular survey; to account for this, the reporting of metadata is of upmost importance. Sampling
can then be normalized for wave and windspeed. Thus, providing countries follow the same reporting
system, data can be comparable.
Status of understanding for a representative sample:
Number of samples: requires further testing of statistical power.
Number of replicates: requires further testing of statistical power.
Number of field blanks: should be carried out in parallel to samples; ideally one field blank should be
carried out in parallel to each collected sample. One method for field blanks is presented in Michida et
al., 2019: here the net is cleaned thoroughly from the outside before the start of the sampling run to
ensure no particles remain. The rinse water can be observed for particles. A second method is the
exposure of dampened filter paper to the air while sampling is performed. This should give an
indication of the number of airborne particles.
Table 2.5 Summary of monitoring and research recommendations for water samples.
1st level (must do) 2nd level (should do)
Monitoring Net samples (water surface of coastal,
freshwater, and fjord; 300 µm mesh)
(Volume will be variable and
dependent on sampling conditions)
Large pump - selected offshore
locations (sequential filtration, e.g., 1
mm, 300 µm, 100µm) collected
subsurface – 1-7 meters, 1 m³ per
sample
Large volume pump samples volume
(sequential filtration, e.g., 1 mm, 300
µm, 100 µm)
Subsurface – 1-7 meters, 1 m³ per
sample
Research Offshore net samples
Visual surveys
Large pump - inshore, 1 m³ per sample
from surface waters
Visual surveys supported by
communities including opportunistic
observations from marine mammal
observers, fisheries observers, and
fishers
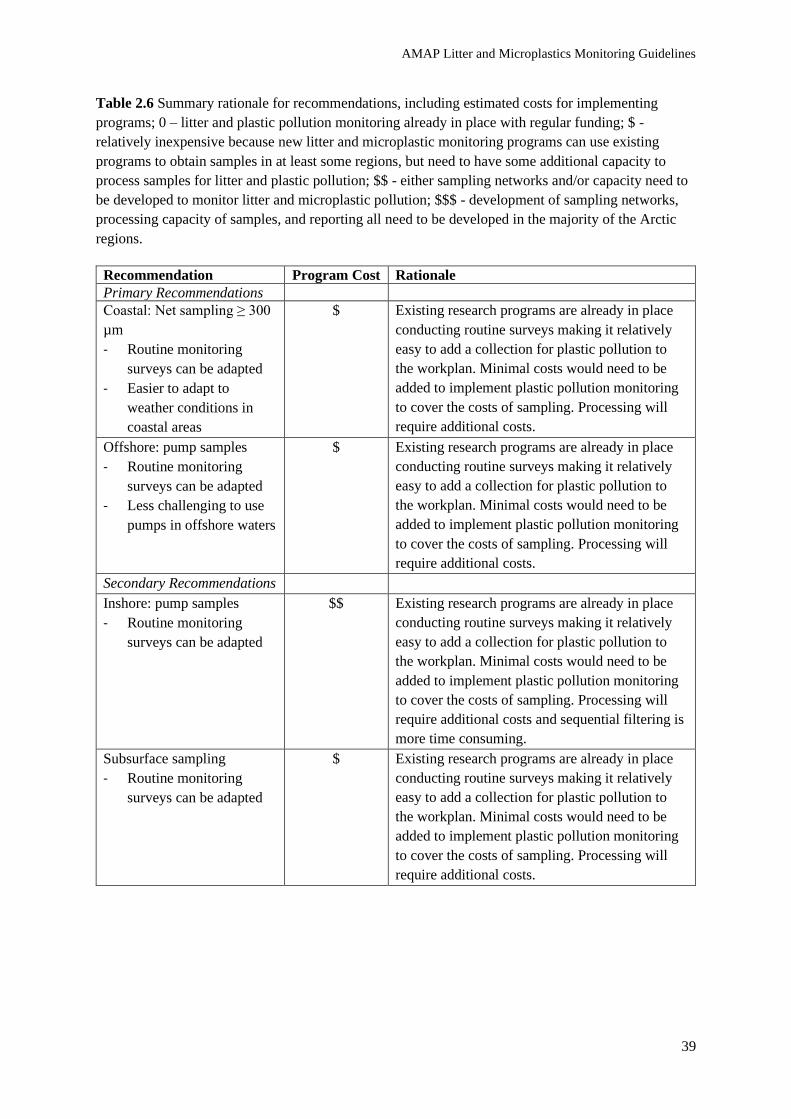
AMAP Litter and Microplastics Monitoring Guidelines
39
Table 2.6 Summary rationale for recommendations, including estimated costs for implementing
programs; 0 – litter and plastic pollution monitoring already in place with regular funding; $ -
relatively inexpensive because new litter and microplastic monitoring programs can use existing
programs to obtain samples in at least some regions, but need to have some additional capacity to
process samples for litter and plastic pollution; $$ - either sampling networks and/or capacity need to
be developed to monitor litter and microplastic pollution; $$$ - development of sampling networks,
processing capacity of samples, and reporting all need to be developed in the majority of the Arctic
regions.
Recommendation Program Cost Rationale
Primary Recommendations
Coastal: Net sampling ≥ 300
µm
- Routine monitoring
surveys can be adapted
- Easier to adapt to
weather conditions in
coastal areas
$
Existing research programs are already in place
conducting routine surveys making it relatively
easy to add a collection for plastic pollution to
the workplan. Minimal costs would need to be
added to implement plastic pollution monitoring
to cover the costs of sampling. Processing will
require additional costs.
Offshore: pump samples
- Routine monitoring
surveys can be adapted
- Less challenging to use
pumps in offshore waters
$ Existing research programs are already in place
conducting routine surveys making it relatively
easy to add a collection for plastic pollution to
the workplan. Minimal costs would need to be
added to implement plastic pollution monitoring
to cover the costs of sampling. Processing will
require additional costs.
Secondary Recommendations
Inshore: pump samples
- Routine monitoring
surveys can be adapted
$$ Existing research programs are already in place
conducting routine surveys making it relatively
easy to add a collection for plastic pollution to
the workplan. Minimal costs would need to be
added to implement plastic pollution monitoring
to cover the costs of sampling. Processing will
require additional costs and sequential filtering is
more time consuming.
Subsurface sampling
- Routine monitoring
surveys can be adapted
$ Existing research programs are already in place
conducting routine surveys making it relatively
easy to add a collection for plastic pollution to
the workplan. Minimal costs would need to be
added to implement plastic pollution monitoring
to cover the costs of sampling. Processing will
require additional costs.

AMAP Litter and Microplastics Monitoring Guidelines
40
2.2.9 Knowledge gaps and research priorities
Box A: data needs/expectation
Must have data
• Location
• Date
• Collection method
• Depth
• Volume of sample (including original volume and subsampled
volume
• and any analysis on variance between subsamples)
• Number of particles
• Auxiliary environmental data
• Polymer type (mandatory for at least a subsample > 300 µm)
Nice to have for all data
• Color
• Size category (> 1 mm, 1 mm-300 µm, 300-100 µm, < 100 µm)
• Morphological information (shape)
• Polymer type
Auxiliary data
• Wind speed and
direction
• Sea state
• Depth in case of
seawater from
rosette
• Proximity to
coastal, river
streams and/or
estuaries
• Proximity to
wastewater
treatment plants

AMAP Litter and Microplastics Monitoring Guidelines
41
References
Aliani, S., A. Griffa and A. Molcard, 2003. Floating debris in the Ligurian Sea, north-western
Mediterranean. Marine Pollution Bulletin, 46(9):1142-1149.
https://doi.org/10.1016/S0025-326X(03)00192-9
Aliani, S., G. Casagrande, P. Catapano and V. Catapano, 2020. Polarquest 2018 expedition: plastic
debris at 82°07’ North. In: Streit-Bianchi, M., M. Cimadevila and W. Trettnak (Eds.), Mare Plasticum
– The Plastic Sea. Springer, Berlin, Germany. https://doi.org/10.1007/978-3-030-38945-1_5
Amélineau, F., D. Bonnet, O. Heitz, V. Mortreux, A.M.A. Harding, N. Karnovsky, W. Walkusz, J.
Fort and D. Grémillet, 2016. Microplastic pollution in the Greenland Sea: background levels and
selective contamination of planktivorous diving seabirds. Environmental Pollution, 219:1131-1139.
https://doi.org/10.1016/j.envpol.2016.09.017
Bergmann, M., N. Sandhop, I. Schewe and D. D’Hert, 2016. Observations of floating anthropogenic
litter in the Barents Sea and Fram Strait, Arctic. Polar Biology, 39(3):553-560.
https://doi.org/10.1007/s00300-015-1795-8
Brander, S.M., V.C. Renick, M.M. Foley, C. Steele, M. Woo, A. Lusher, S. Carr, P. Helm, C. Box, S.
Cherniak, R.C. Andrews and C.M. Rochman, 2020. Sampling and quality assurance and quality
control: a guide for scientists investigating the occurrence of microplastics across matrices. Applied
Spectroscopy, 74:1099-1125. https://doi.org/10.1177/0003702820945713
Campanale, C., G. Suaria, G. Bagnuolo, M. Baini, M. Galli, E. de Rysky, M. Ballini, S. Aliani, M.C.
Fossi and V.F. Uricchio, 2019. Visual observations of floating macro litter around Italy
(Mediterranean Sea). Mediterranean Marine Science, 20(2):271-281.
https://doi.org/10.12681/mms.19054
Carpenter, E.J. and K.L. Smith, Jr., 1972. Plastics on the Sargasso Sea surface. Science,
175(4027):1240-1241. https://doi.org/10.1126/science.175.4027.1240
Choy, C.A., B.H. Robison, T.O. Gagne, B. Erwin, E. Firl, R.U. Halden, J.A. Hamilton, K. Katija, S.E.
Lisin, C. Rolsky and K.S. Van Houtan, 2019 The vertical distribution and biological transport of
marine microplastics across the epipelagic and mesopelagic water column. Scientific Reports, 9:7843.
https://doi.org/10.1038/s41598-019-44117-2
Cózar, A., E. Martí, C.M. Duarte, J. García-de-Lomas, E. van Sebille, T.J. Ballatore, V.M. Eguíluz,
J.I. González-Gordillo, M.L. Pedrotti, F. Echevarría and R. Troublè, 2017. The Arctic Ocean as a
dead end for floating plastics in the North Atlantic branch of the Thermohaline Circulation. Science
Advances, 3(4):e1600582. https://doi.org/10.1126/sciadv.1600582
Day, R.H. and D.G. Shaw, 1987. Patterns in the abundance of pelagic plastic and tar in the North
Pacific Ocean, 1976-1985. Marine Pollution Bulletin, 18(6):311-316. https://doi.org/10.1016/s0025-
326x(87)80017-6
Day, R.H., D.G. Shaw and S.E. Ingnell, 1990. The quantitative distribution and characteristics of
neuston plastic in the North Pacific Ocean, 1985-1988. In: Shomura, R.S., et al. (Eds.). Proceedings of
AMAP Litter and Microplastics Monitoring Guidelines
42
the Second International Conference on Marine Debris, 2-7 April 1989, Honolulu, Hawaii, pp. 247-
266.
Eriksen, E., H.R. Skjoldal, H. Gjøsæterand and R. Primicerio, 2017. Spatial and temporal changes in
the Barents Sea pelagic compartment during the recent warming. Progress in Oceanography, 151:206-
226. https://doi.org/10.1016/j.pocean.2016.12.009
Geyer, R., J.R. Jambeck and K.L. Law, 2017. Production, use, and fate of all plastics ever made.
Science Advances, 3(7):e1700782. https://doi.org/10.1126/sciadv.1700782
González-Pleiter, M., D. Velázquez, C. Edo, O. Carretero, J. Gago, Á. Barón-Sola, L.E. Hernández, I.
Yousef, A. Quesada, F. Leganés, R. Rosal and F. Fernández-Piñas, 2020. Fibers spreading worldwide:
microplastics and other anthropogenic litter in an Arctic freshwater lake. Science of the Total
Environment, 722:137904. https://doi.org/10.1016/j.scitotenv.2020.137904
Granberg, M.E., L.W. von Friesen, L. Bach, F. Collard, J. Strand and G. W. Gabrielsen, 2019.
Anthropogenic microlitter in wastewater and marine samples from Ny-Ålesund, Barentsburg and
Signehamna, Svalbard. No. C 373. IVL Swedish Environmental Research Institute, Stockholm,
Sweden. [online] URL: https://pure.au.dk/portal/files/152355861/C373march.pdf
Grøsvik, B.E., T. Prokhorova, E. Eriksen, P. Krivosheya, P.A. Horneland and D. Prozorkevich, 2018.
Assessment of marine litter in the Barents Sea, part of the Joint Norwegian – Russian Ecosystem
Survey. Frontiers in Marine Science, 5:72. https://doi.org/10.3389/fmars.2018.00072
Group of Experts on Scientific Aspects of Marine Environmental Protection (GESAMP), 2019.
Guidelines for the Monitoring and Assessment of Plastic Litter and Microplastics in the Ocean.
GESAMP, London, UK, 130pp. [online] URL:
http://www.gesamp.org/publications/guidelines-for-the-monitoring-and-assessment-of-plastic-litter-
in-the-ocean
Huntington, A., P.L. Corcoran, L. Jantunen, C. Thaysen, S. Bernstein, G.A. Stern and C.M. Rochman,
2020. A first assessment of microplastics and other anthropogenic particles in Hudson Bay and the
surrounding eastern Canadian Arctic waters of Nunavut. FACETS, 5(1):432-454.
https://doi.org/10.1139/facets-2019-0042
Hurley, R.R., A.L. Lusher, M. Olsen and L. Nizzetto, 2018. Validation of a method for extracting
microplastics from complex, organic-rich, environmental matrices. Environmental Science and
Technology, 52(13):7409-7417. https://doi.org/10.1021/acs.est.8b01517
Jiang, Y., F. Yang, Y. Zhao and J. Wang, 2020. Greenland Sea Gyre increases microplastic pollution
in the surface waters of the Nordic Seas. Science of the Total Environment, 712:136484.
https://doi.org/10.1016/j.scitotenv.2019.136484
Kanhai, L.D.K., K. Gardfeldt, T. Krumpen, R.C. Thompson and I. O’Connor, 2020. Microplastics in
sea ice and seawater beneath ice floes from the Arctic ocean. Scientific Reports, 10:5004.
https://doi.org/10.1038/s41598-020-61948-6
AMAP Litter and Microplastics Monitoring Guidelines
43
Kanhai, L.D.K., K. Gårdfeldt, O. Lyashevska, M. Hassellöv, R.C. Thompson and I. O'Connor, 2018.
Microplastics in sub-surface waters of the Arctic Central Basin. Marine Pollution Bulletin, 130:8-18.
https://doi.org/10.1016/j.marpolbul.2018.03.011
Kukulka, T., G. Proskurowski, S. Morét‐Ferguson, D.W. Meyer and K.L. Law, 2012. The effect of
wind mixing on the vertical distribution of buoyant plastic debris, Geophysical Research Letters,
39(7):L07601. https://doi.org/10.1029/2012GL051116
Law, K. L., S.E. Moret-Ferguson, D.S. Goodwin, E.R. Zettler, E. DeForce, T. Kukulka and G.
Proskurowski, 2014. Distribution of surface plastic debris in the eastern Pacific Ocean from an 11-
year data set. Environmental Science and Technology, 48(9):4732-4738.
https://doi.org/10.1021/es4053076
Law, K.L., S. Morét-Ferguson, N.A. Maximenko, G. Proskurowski, E.E. Peacock, J. Hafner and C.M.
Reddy, 2010. Plastic accumulation in the North Atlantic subtropical gyre. Science, 329(5996):1185-
1188. https://doi.org/10.1126/science.1192321
Lusher, A.L., K. Munno, L. Hermabessiere and S. Carr, 2020. Isolation and extraction of
microplastics from environmental samples: an evaluation of practical approaches and
recommendations for further harmonization. Applied Spectroscopy, 74(9):049-1065.
https://doi.org/10.1177/0003702820938993
Lusher, A.L., V. Tirelli, I. O’Connor and R. Officer, 2015. Microplastics in Arctic polar waters: the
first reported values of particles in surface and sub-surface samples. Scientific Reports, 5:14947.
https://doi.org/10.1038/srep14947
Mallory, M.L., J. Baak, C. Gjerdrum, O.E. Mallory, B. Manley, C. Swan and J.F. Provencher, 2021.
Anthropogenic litter in marine waters and coastlines of Arctic Canada and West Greenland.
Science of the Total Environment, 783:146971. https://doi.org/10.1016/j.scitotenv.2021.146971
Mendoza, L.M.R. and M. Balcer, 2019. Microplastics in freshwater environments: a review of
quantification assessment. TrAC Trends in Analytical Chemistry, 113:402-408.
https://doi.org/10.1016/j.trac.2018.10.020
Michida, Y., S. Chavanich, A. Cózar Cabañas, P. Hagmann, H. Hinata, A. Isobe, P. Kershaw, N.
Kozlovskii, D. Li, A.L. Lusher, E. Martí, S.A. Mason, J. Mu, H. Saito, W.J. Shim, A.D. Syakti, H.
Takada, R. Thompson, T. Tokai, K. Uchida, K. Vasilenko and J. Wang, 2019. Guidelines for
Harmonizing Ocean Surface Microplastic Monitoring Methods. Version 1.0. Ministry of the
Environment, Japan. 71pp. [online] URL:
https://www.env.go.jp/en/water/marine_litter/guidelines/guidelines.pdf
Mountford, A.S. and M.A. Morales Maqueda, 2019. Eulerian modeling of the three‐dimensional
distribution of seven popular microplastic types in the global ocean. Journal of Geophysical Research:
Oceans, 124(12). https://doi.org/10.1029/2019jc015050
Morgana, S., L. Ghigliotti, N. Estévez-Calvar, R. Stifanese, A. Wieckzorek, T. Doyle, J.S.
Christiansen M. Faimali and F. Garaventa, 2018. Microplastics in the Arctic: a case study with sub-
surface water and fish samples off Northeast Greenland. Environmental Pollution, 242:1078-1086.
https://doi.org/10.1016/j.envpol.2018.08.001

AMAP Litter and Microplastics Monitoring Guidelines
44
Mu, J., S. Zhang, L. Qu, F. Jin, C. Fang, X. Ma, W. Zhang and J. Wang, 2019. Microplastics abundance
and characteristics in surface waters from the Northwest Pacific, the Bering Sea, and the Chukchi Sea.
Marine Pollution Bulletin, 143:58-65. https://doi.org/10.1016/j.marpolbul.2019.04.023
Rist, S., A. Vianello, M.H.S. Winding, T.G. Nielsen, R. Almeda, R.R. Torres and J. Vollertsen, 2020.
Quantification of plankton-sized microplastics in a productive coastal arctic marine ecosystem.
Environmental Pollution, 266:115248. https://doi.org/10.1016/j.envpol.2020.115248
Ryan, P.G., 2013. A simple technique for counting marine debris at sea reveals steep litter gradients
between the Straits of Malacca and the Bay of Bengal. Marine Pollution Bulletin, 69(1-2):128-136.
https://doi.org/10.1016/j.marpolbul.2013.01.016
Ryan, P.G., 2014. Litter survey detects the South Atlantic ‘garbage patch.’ Marine Pollution Bulletin,
79(1-2):220-224. https://doi.org/10.1016/j.marpolbul.2013.12.010
Ryan, P.G., G. Suaria, V. Perold, A. Pierucci, T.G. Bornman and S. Aliani, 2019. Sampling
microfibres at the sea surface: the effects of mesh size, filtered volume and water depth,
Environmental Pollution 258:113413. https://doi.org/10.1016/j.envpol.2019.113413
Shaw, D.G., 1977. Pelagic tar and plastic in the Gulf of Alaska and Bering Sea: 1975. Science of the
Total Environment, 8(1):13-20. https://doi.org/10.1016/0048-9697(77)90058-4
Strafella, P., G. Fabi, M. Despalatovic, I. Cvitković, T. Fortibuoni, A. Gomiero, S. Guicciardi, B.
Marceta, S. Raicevich, A.N. Tassetti, A. Spagnolo and G. Scarcella, 2019. Assessment of seabed litter
in the Northern and Central Adriatic Sea (Mediterranean) over six years. Marine Pollution Bulletin,
141:24-35. https://doi.org/10.1016/j.marpolbul.2018.12.054
Suaria, G., A. Achtypi, V. Perold, J.R. Lee, A. Pierucci, T.G. Bornman, S. Aliani and P.G. Ryan,
2020b. Microfibers in oceanic surface waters: a global characterization. Science Advances,
6(23):eaay8493. https://doi.org/10.1126/sciadv.aay8493
Suaria, G. and S. Aliani, 2014. Floating debris in the Mediterranean Sea. Marine Pollution Bulletin,
86(1-2):494-504. https://doi.org/10.1016/j.marpolbul.2014.06.025
Suaria, G., C.G. Avio, A. Mineo, G.L. Lattin, M.G. Magaldi, G. Belmonte, C.J. Moore, F. Regoli, and
S. Aliani, 2016. The Mediterranean Plastic Soup: synthetic polymers in Mediterranean surface waters.
Scientific Reports, 6:37551. https://doi.org/10.1038/srep37551
Suaria, G., V. Perold, J.R. Lee, F. Lebouard, S. Aliani and P.G. Ryan, 2020a. Floating macro-and
microplastics around the Southern Ocean: results from the Antarctic Circumnavigation Expedition.
Environment International, 136:105494. https://doi.org/10.1016/j.envint.2020.105494
Tekman, M.B., C. Wekerle, C. Lorenz, S. Primpke, C. Hasemann, G. Gerdts and M. Bergmann, 2020.
Tying up loose ends of microplastic pollution in the Arctic: distribution from the sea surface, through
the water column to deep-sea sediments at the HAUSGARTEN observatory. Environmental Science
and Technology, 54:4079-4090. https://doi.org/10.1021/acs.est.9b06981
Threlfall, W., 1968. The food of three species of gulls in Newfoundland. Canadian Field-Naturalist,
82:176-180.

AMAP Litter and Microplastics Monitoring Guidelines
45
van Sebille, E., S. Aliani, K.L. Law, N. Maximenko, J.M. Alsina, A. Bagaev, M. Bergmann, B.
Chapron, I. Chubarenko, A. Cózar, P. Delandmeter, M. Egger, B. Fox-Kemper, S.P. Garaba, L.
Goddijn-Murphy, B.D. Hardesty, M. J. Hoffman, A. Isobe, C.E. Jongedijk, M.L.A. Kaandorp, L.
Khatmullina, A.A. Koelmans, T. Kukulka, C. Laufkötter, L. Lebreton, D. Lobelle, C. Maes, V.
Martinez-Vicente, M.A.M. Maqueda, M. Poulain-Zarcos, E. Rodríguez, P.G. Ryan, A.L. Shanks, W.J.
Shim, G. Suaria, M. Thiel, T.S. van den Bremer and D. Wichmann, 2020. The physical oceanography
of the transport of floating marine debris. Environmental Research Letters, 15(2):023003.
https://doi.org/10.1088/1748-9326/ab6d7d
Venrick, E.L., T.W. Backman, W.C. Bartram, C.J. Platt, M.S. Thornhill and R.E. Yates, 1973. Man-
made objects on the surface of the central North Pacific Ocean. Nature, 241(5387):271.
https://doi.org/10.1038/241271a0
von Friesen, L.W., M.E. Granberg, O. Pavlova, K. Magnusson, M. Hassellöv and G.W. Gabrielsen,
2020. Summer sea ice melt and wastewater are important local sources of microlitter to Svalbard
waters. Environment International, 139:105511. https://doi.org/10.1016/j.envint.2020.105511
Water sampling.
Photo: Ingrid Gabrielsen

AMAP Litter and Microplastics Monitoring Guidelines
46
2.3 Monitoring of microlitter in aquatic and shoreline sediments AUTHORS: MARIA E. GRANBERG, KERSTIN MAGNUSSON, AMY L. LUSHER, BJØRN EINAR GRØSVIK, AND JESSE
VERMAIRE
2.3.1 Introduction
Sediments, both freshwater and marine, act as sinks for microplastics (MP) whether due to rapid
sinking of high-density plastic particles (Woodall et al., 2014; Kowalski et al., 2016; Erni-Cassola et
al., 2019), settling caused by biofouling (Kaiser et al., 2017; Rummel et al., 2017), or incorporation in
sinking organic aggregates, e.g., marine snow (Porter et al., 2018; Zhao et al., 2018). Settled MP
particles may subsequently be resuspended and further transported with water currents to settle in
calmer areas with finer sediments far away from their source (Enders et al., 2019). Because sediments
in calm areas accumulate and sequester deposited MP, they provide a temporal record of MP input to
the aquatic environments and thus also constitute a relevant matrix for monitoring. Experimental
studies show weak upward transport of already buried MP (≥ 100 µm) in marine environments (Näkki
et al., 2019), which further stresses the importance of sediments as a sink for MP.
Particles (fragments and fibers) can have low or high densities; those with low density (buoyant) can
be transported from point sources such as wastewater outlets to shallower areas and settle in shoreline
sediments and beach sand (Lots et al., 2017; Bosker et al., 2018; Piñon-Colin et al., 2018). Shorelines
constitute the interface between land and sea, and function as dynamic repositories for MP originating
both from the sea and from weathered and fragmented stranded macrolitter. Aided by wind, wave, and
tidal action, MP on beaches will be incorporated in deep sand layers (Turra et al., 2014) and be
transported higher up on the back shores (Zhang, 2017). The high energy environment creates
patchiness (Fisner et al., 2017) and the temporal record of beach sand and shoreline sediments is more
difficult to interpret because of the dynamic nature of these environments.
2.3.2. Status of global science
The scientific literature on MP in sediments shows great variation in the use of methods for sampling,
extraction, and detection, as well as the lowest particle size limit used for detection. These differences
obscure direct comparisons between investigations. Studies also report on great differences in MP
concentrations between sites in populated areas such as the North East Atlantic. For example, in
studies carried out in Byfjorden outside Bergen, Norway and at locations in the southern North Sea,
the same methods and the same size limit (>11 µm) were applied. In the Norwegian fjord,
concentrations were found to vary between 12,000 and 200,000 particles kg-1 dry weight (dw)
sediment, whereas concentrations varied between 3 and 1,189 particles kg-1 dw in southern North Sea
sediments (Haave et al., 2019; Lorenz et al., 2019). The highest levels of MP detected in Arctic
sediments are reported from Canada where concentrations of particles in the size range 53-2000 µm
were found to vary between 0 and 16,000 particles kg-1 dw at 20 locations (Huntington et al., 2020).
Most other Arctic studies report considerably lower concentrations.
Literature on freshwater sediments is limited, however, recent modeling (Besseling et al., 2017) and
field studies (Hurley et al., 2018a) show that freshwater sediments may hold a substantial fraction of
the world’s MP pollution. Mjøsa Lake in Norway was recently investigated for the presence of MP in
sediment cores, assessing the influence of sources and deposition. The highest MP values were
reported near urban areas (7,310 MP particles kg-1 dw) and main roads (3,890 MP particles kg-1 dw;
Lusher et al., 2019).

AMAP Litter and Microplastics Monitoring Guidelines
47
2.3.3 Current levels in the Arctic
Microplastics detected in the Arctic may derive from distant sources, having been transported there
with sea currents (Lusher et al., 2015; Cózar et al., 2017; Tekman et al., 2020) or by air (Bergmann et
al., 2019). Arctic MP pollution may also originate from local sources including: (1) wastewater and
land-based waste storage (Granberg et al., 2019; von Friesen et al., 2020), (2) intentional littering, (3)
dumping of sewage or garbage from ships, and (4) lost fishing gear (Tekman et al., 2017). In addition,
sea ice can be considered as a secondary MP source (Obbard et al., 2014; Peeken et al., 2018; von
Friesen et al. 2020). The relative importance of local and distant sources is poorly investigated and
because wastewater treatment and waste management are poor in the Arctic, local sources or
pathways may be underestimated.
Microplastics have been detected in all parts of the Arctic, even in sediments from the Arctic Central
Basin (Kanhai et al., 2019). It is important to recognize that any comparisons between studies will be
tainted by the fact that the methodology used varies greatly, which in turn will affect numbers, sizes,
shapes, and polymeric composition of the MP particles reported. With this in mind, the highest
reported concentrations in the Arctic, ca. 10,000–16,000 (size 53-2000 µm) MP particles kg-1 dw,
were found at two locations in Eastern Canadian waters (Huntington et al., 2020). These two sites
seem to be extreme hotspots because the concentrations at 17 of the 20 locations included in this study
were between 0 and 2,000 particles kg-1 dw. Tekman et al., 2020 also detected high concentrations of
MP (size ≥ 11 µm) ranging between 239 and 13,331 particles kg-1 dw in sediment samples collected at
five stations of the HAUSGARTEN observatory in the Fram Strait. However, sediments collected at
the same sites a year before by Bergmann et al. (2017) showed considerably lower concentrations,
ranging between 42–6,595 particles (≥ 11 µm) kg-1 dw, with concentrations exceeding 4,000 MP kg-1
dw at 8 out of 9 sampling stations. The MP concentrations were found to correlate both with higher
concentrations of macrolitter and with chlorophyll a (Bergmann et al., 2017), which indicates that this
area is an accumulation site for both large plastics and fresh organic matter from the pelagic photic
zone or the sea-ice edge. In the deep sea, all bottom types (accumulation and transport bottoms) occur
as they do in shallower areas, and MP concentrations are thus expected to vary accordingly.
Arp et al., 2018 detected between 0 and 3,189 MP particles (≥ 45 µm) kg-1 dw in sediments from the
Barents Sea. Mu et al., 2019 also detected MP in sediments collected in the Bering and Chukchi Seas
and found that 6 out of 7 investigated sites were polluted with MP (size unspecified) varying from 0
to 69 particles kg-1 dw. It is likely that MP concentrations in Arctic sediments are low in general with
hotspots related to specific sources or hydrodynamic conditions. The deep-sea area around the
HAUSGARTEN observatory is special in that it receives particulates released from the melting Arctic
sea-ice front (Bergmann et al., 2017; Tekman et al., 2020). One of the areas in the Canadian Arctic
with very high MP concentrations was also located by a glacier (Huntington et al., 2020). Sea ice is
known to contain high amounts of MP released during summer melting (Obbard et al., 2014; Peeken
et al., 2018; von Friesen et al., 2020), and glacier ice and snow have been shown to contain plastic
particles, likely originating from atmospheric deposition (Ambrosini et al., 2019; Bergmann et al.,
2019; Evangeliou et al., 2020). Very little is yet known about relative contributions from sources for
MP in coastal Arctic marine sediments. Granberg et al., 2020 measured MP near and far from local
pollution sources in coastal marine sediments around Sisimiut, Greenland and in Kongsfjorden-
Krossfjorden, Adventfjorden, and Grønnfjorden, Svalbard. Microplastics were found at all sites, with
higher concentrations close to pollution sources. However, high concentrations were also found at
single sites classified as pristine in Greenland. Here, MP particles were identified as originating from
fishing gear.

AMAP Litter and Microplastics Monitoring Guidelines
48
Information regarding plastic pollution in Arctic freshwater sediments is vastly lacking. One study
was conducted in Ny-Ålesund, Svalbard reporting a dominance of fibers (González-Pleiter et al.,
2020). Luoto et al., 2019 also reported on an increasing abundance of MP in Lake Revvatnet,
Hornsund, Svalbard. The increase of MP was hypothesized to result from climate change, both
through an increase in meltwater inflow into the lake and a higher prevalence of nesting seabirds, little
Auks or Dovekies (Alle alle), collecting MP at sea and depositing them in the lake with their guano.
2.3.4 Benefits of using sediments as a plastic monitoring matrix
Sediments are highly suitable for MP monitoring because they constitute a time-integrated sink for all
types of particles and aggregates including plastics (Soutar et al., 1977; Erni-Cassola et al., 2019).
This is analogous to more established monitoring protocols for organic contaminants and metals in the
marine environment. Shoreline sediments and beaches offer easy access and cost-effective options for
MP assessment and monitoring.
2.3.5 Limitations to using sediments as a plastic monitoring matrix
Whether the objective of a monitoring program is to follow time trends or to target specific sources of
MP pollution in marine sediments, it is essential that sampling be carried out at locations where MP
settle and accumulate rather than in areas with sediment erosion or transportation. Our knowledge
regarding MP fate processes is still limited, which makes it difficult to pinpoint locations of MP
accumulation. Some studies show correlations between MP and sediment grain size and/or organic
matter content (Strand et al., 2013; Vianello et al., 2013; Enders et al., 2019; Haave et al., 2019),
whereas other studies find no such correlation (Alomar et al., 2016; Peng et al., 2017). In a large-
scale, meta-analysis, Erni-Cassola et al., 2019 showed a high general accumulation of MP in intertidal
sediments. Deep-sea sediments have also been suggested as a sink for MP and (accordingly) the
highest concentrations ever recorded in marine sediments were found in deep-sea sediments from the
Fram Strait (Bergmann et al., 2017). In general, particles of various kinds, i.e., phytoplankton cells,
zooplankton faecal pellets, detritus, and fine-grained mineral particles, settle in calm areas and form
soft sediment accumulation bottoms. This is where organic matter and sediment associated
contaminants accumulate and are generally monitored. Considering the characteristics of many MP
particles, settling in this type of area is a likely fate.
Microplastics may be incorporated in marine aggregates formed mainly by algae and detritus (Zhao et
al., 2018). These aggregates (often referred to as marine snow) have high sinking velocities and are
presumed to be important vehicles for the transportation of small particles from the surface to the
bottom. Furthermore, intertidal sediments are generally high in organic matter, and Bergmann et al.,
2017 found correlations between MP and chlorophyll a concentrations (indicative of settling
phytoplankton) at their deep-sea site. Finding the right spot for MP monitoring will thus require
knowledge of and/or initial screening of the area, and preferably hydrodynamic modeling to target
calmer areas where particles are likely to settle.
Marine sediments are highly heterogenous when it comes to composition and abundance of benthic
fauna and flora, resulting in a high degree of spatial and temporal patchiness. Patchiness is a factor to
consider in relation to field sampling of MP both under water and along shorelines (Fisner et al.,
2017; GESAMP, 2019; Korez et al., 2019). Both patchiness and temporal variations in MP occurrence
become serious complicating factors due to changing environmental conditions and strong forces
acting on beaches (Fisner et al., 2017). These factors are likely accentuated in the harsh Arctic

AMAP Litter and Microplastics Monitoring Guidelines
49
environment. The level of patchiness will determine the number of replicates necessary to collect to
obtain sufficient statistical power.
2.3.6 Methods
There are at present no standardized protocols for monitoring MP in submerged sediments. There is,
however, extensive, existing, and transferable knowledge from other sediment monitoring approaches.
Two approaches are relevant when monitoring time trends for MP pollution in sediments: (1)
recurrent sampling of the recently accumulated surface sediment layer, and (2) retrieving cores from
varved undisturbed sediment and subsequent slicing of the cores into geologically dated sections.
Geological dating can be achieved using radionuclide techniques. Number one is the most common
approach for other sedimentary parameters and will be the focus here.
Concerning shoreline and intertidal sediments, GESAMP, 2019 developed guidelines for MP
monitoring, and we recommend applying these to monitoring MP on shorelines and beaches in the
Arctic. These guidelines also address obstacles arising when sampling MP on, e.g., rocky shores and
shores of varying geology. The methodological difference between assessing MP content in
underwater and shoreline sediments mainly concerns sample collection. The subsequent steps are
applicable for both matrices. Key points regarding sample collection of shoreline sediments will be
addressed here. For details, the reader is kindly referred to the GESAMP, 2019 report.
Sample collection: aquatic sediments
Submerged sediment can be sampled using any type of box or cylinder corer designed to collect
sediment samples while keeping an intact, undisturbed sediment surface. The number of grabs or core
samples required to achieve a sound statistical dataset will depend on the level of contamination and
the patchiness or heterogeneity of the sediment. Low levels of contamination and high patchiness will
lead to great variation in numbers of plastic particles retrieved kg-1 dw sediment. If the number of MP
is low, the sample size must be larger, i.e., more sediment must be sampled. Individual samples from
different cores or grabs collected within the same area can be pooled to obtain a large enough
sediment sample. Pooling will also reduce the influence of sediment heterogeneity or patchiness.
Furthermore, the number of particles in a given sample volume decreases with the increasing particle
size. There will thus be more 10 µm particles than 300 µm particles in a sediment sample. This means
that the sediment sample must be larger when aiming for large-sized particles. Sediment samples
between 30 and 500 g wet weight (ww) have been suggested. For larger particles (> 300 µm),
sediment samples larger than 500 g ww might be needed. The number of particles in the blank
samples define the detection limit for each collected sample and MP concentrations below that of the
blanks should hence be considered as being below the detection limit. The level of contamination
must thus be monitored at all steps of sampling and sample treatment. The most informative and
sustainable way to design a sediment monitoring program with sound statistics is to gain insight into
the variation between samples collected in the area of interest. A power study is useful when aiming
to optimize the sampling statistics.
Only the recently accumulated sediment layer (usually 1-2 cm in coastal areas) should be retrieved
from each core or grab sample. Surface sediment should be collected using a metal device rinsed in
filtered MQ water (see QA/QC section) and transferred to pre-rinsed and aluminium foil covered,
lidded, and marked glass jars (see QA/QC section). Samples should be stored cold or frozen (-20 °C)
and dark until extraction and analysis. How deep the recently accumulated sediment layer extends

AMAP Litter and Microplastics Monitoring Guidelines
50
depends on both physical and biological conditions of the sampling area. The deposition rate of MP
and the mixing depth of the particles into the sediment is affected by natural factors like currents and
bioturbation (burying and excavation of sediment associated fauna) but also by anthropogenic
activities, e.g., trawling, dredging, and other physical disturbances resulting in resuspension events. In
areas with low sedimentation rates, e.g., in offshore regions or in lakes, the mixing depth of MP may
be even less than one cm (Martin et al., 2017; Lusher et al., 2019). It is thus essential to be highly
familiar with conditions at the sampling site. In areas with high sedimentation (e.g., near glacier
fronts) and/or deep bioturbated layers, sampling can be performed using only a grab sampler, as long
as the sediment surface is clearly distinguishable.
Sample collection: shoreline sediments
The geology of shorelines varies from wide mud flats to steep rocky shores. Methods developed for
monitoring MP on sandy beaches or mudflats are not applicable to broken coastlines with mixed
substrates (McWilliams et al., 2018; GESAMP, 2019). McWilliams et al., 2018 found that the
presence of rocks has a great impact on the distribution of MP in Arctic beach sand and sediments
calling for a nuanced sampling strategy. Shoreline and beach sediments are commonly sampled along
a transect perpendicular to the waterfront. Along this transect, with discrete distance increments from
the waterline, replicate samples are collected by throwing a one m2 quadrat and then retrieving the
uppermost five cm of the sediment for MP analysis (GESAMP, 2019; MSFD, 2020). McWilliams et
al., 2018 found that MP were buried further into the sediment around rocks on Arctic beaches, and
Turra et al., 2014 found microlitter buried down to at least two meters in sandy beaches. Based on this
knowledge, it may be useful to perform stratified sampling in which samples are collected every five
cm down to a specific depth. It is, however, unclear how depth distributions of MP on beaches should
be interpreted. Because microlitter is patchily distributed on and in shoreline and beach sediments,
replication is important. MSFD, 2020 recommends collecting five replicate samples. However, as
previously described for submerged sediments, the most informative and sustainable way to design a
shoreline sediment monitoring program with sound statistics is to first gain insight into the variation
between samples. For this, a pilot study needs to be designed with the aim of optimizing statistical
power and only then the accurate number of replicates can be determined. Other concerns related to
sediments regarding sample size, particle numbers, procedural blanks, and control samples presented
above are applicable to shoreline and beach sediments as well.
Sample treatment
Microplastic particles must be separated from the sediment matrix prior to analysis. For this purpose,
several methods are applied and a number of reviews have assessed the pros and cons of different
methods (Hidalgo-Ruz et al., 2012; Rocha-Santos and Duarte, 2015; Van Cauwenberghe et al., 2015;
Miller et al., 2017; Mai et al., 2018; Stock et al., 2019) but there is still no consensus or a standardized
protocol. Instead, quality criteria for the applied method have been put forward (e.g., Setälä et al.,
2019) including procedural steps to be fulfilled. The quality criteria imply proving that the method
chosen: (1) does not harm the plastic polymers, the environment, or humans; (2) that the recovery rate
of MP particles likely to be found in a field sample, i.e., particles of different polymers, different
shapes, etc., should be tested, verified, and reported; and (3) that contamination is minimized,
controlled, and reported. Suggestions for generalized protocols include sieving, density separation,
and digestion of the organic matrix.
Sieving sediment samples initially is useful to remove large stones and debris or to collect larger
plastic fragments. When sieving is carried out in situ there is limited contamination control. This

AMAP Litter and Microplastics Monitoring Guidelines
51
approach is not adequate for small MP (< 1 mm) and isolation steps must be performed under
laboratory conditions. Care should also be taken not to further fragment brittle particles. Procedural
controls should be introduced (see QA/QC).
Dissociation and digestion of the organic matrix can be performed using established methods
including pre-treatment with detergent and/or degradation using enzymatic, oxidizing, and/or alkaline
treatments. Sodium dodecyl sulphate (SDS) or sodium lauryl sulphate (SLS) are detergents and
protein denaturants used as a primary step to release plastic particles from the organic matrix in
sediments. Organic matter degradation can be achieved using enzymes, either alone (Setälä et al.,
2019; von Friesen et al., 2019) or in combination with oxidizing agents (Löder et al., 2017).
Degradation using natural pancreatic enzymes (amylase, protease, and lipase) has been shown to be a
simple and efficient method that is mild and non-destructive to plastic polymers (Piarulli et al., 2019;
Setälä et al., 2019; von Friesen et al., 2019). Other protocols use sequential enzymatic treatments,
which can be just as efficient but may require change of pH and extensive amounts of time (e.g.,
Löder et al., 2017). Oxidizing agents such as H2O2 as a stand-alone digestion method require cooling
and a reduced concentration. Using H2O2 with an iron catalyst, i.e., Fenton’s reagent, will speed up
the oxidization process and is therefore effective in digesting samples rich in organic matter (e.g.,
sewage laden sediments) that may be challenging to digest. This procedure should be performed with
the understanding that sample loss and discoloration of MP may occur because the reaction is highly
exothermic and even volatile, quickly reaching temperatures above 100 °C (Hurley et al., 2018b;
Munno et al., 2018). To ensure that temperatures do not reach above 40 degrees and plastics start
melting, ice baths have been routinely used (e.g., Hurley et al., 2018b). Alkaline solutions, often
KOH, can be used either alone or alternatively in combination with the oxidizing agent NaOCl
(Strand and Tairova, 2016) because this seems to have only little impact, if any, on most common
plastic materials (Enders et al., 2017). Acid digestion is sometimes proposed as a digestion method
but has been found to damage and destroy certain polymers. The Group of Experts on the Scientific
Aspects of Marine Environmental Protection (GESAMP), an advisory body for the United Nations
system on the scientific aspects of marine environmental protection, has explicitly recommended that
acids should not be used for this purpose (GESAMP, 2019).
Density separation is used to separate heavy mineral particles from lighter plastics once the organic
matrix is degraded. Commonly used saline solutions for density separation from sediment are zinc
(ZnCl2) and sodium iodide (NaI) both with saturated solution densities above 1.85 g cm-3, sodium
polytungstate (Na6H2W12O40, saturated density: 3.1 g cm-3), and sodium chloride (NaCl, saturated
density: 1.2 g cm-3; see for e.g., Ng and Obbard, 2006; Claessens et al., 2013; Bergmann et al., 2017).
A less common alternative to density separation is to extract the MP with oil-water separation
(Crichton et al., 2017; Mani et al., 2019). The technique is based on the oleophilic nature of plastics,
i.e., plastics have a strong affinity for oils. A number of different devices have been designed to aid in
density separation including elutriation towers (Claessens et al., 2013), pressurized fluid extraction
systems (Fuller and Gautam, 2016), density separation towers (Imhof et al., 2012), and traditional
separation funnels. After separation, the top layer is decanted/retrieved and plastic particles collected
on filters with a desired mesh or pore size. These filters may be subjected to further chemical or
enzymatic treatment to remove remaining organic matter. A saline solution with a density > 1.5 g cm-3
is required to capture the majority of MP polymers, e.g., polyurethane (PU, 1.3 g cm-3), polyvinyl
chloride (PVC, 1.4 g cm-3), and polyethylene terephthalate (PET, 1.4 g cm-3).
Dry weight of sediment is estimated according to general US EPA and NOAA practices. The sediment
is thoroughly homogenized and three aliquots of approximately 1 to 2 g are collected, weighed, and
AMAP Litter and Microplastics Monitoring Guidelines
52
then dried at 105 °C to a constant weight. The weight of the dried aliquot is the dry weight of the
sample. Percent moisture is determined by calculating the amount of weight lost during the drying
procedure.
2.3.7 Quality assurance/quality control (QA/QC) specific to the compartment/matrix
All methods should use appropriate monitoring of procedural and airborne contamination. Quality
assurance/quality control (QA/QC) should be followed from sample collection to data reporting and
analysis. During sampling collection, efforts to prevent contamination should be enforced and all
steps taken to facilitate this should be clearly reported. Blanks should be carried out in the field and in
the laboratory.
Particle recovery/recovery efficiency should be tested for all methods alongside sampling. These can
include standard reference materials, matrix spikes, and positive and negative controls (Brander et al.,
2020). It is also important to minimize the number of steps and the open exposure of the sample to
avoid contamination risks.
Data from field samples should be adjusted to procedural blanks. Unless MP particles in the blank
samples are obviously different to any particles found in the field, sample corrections should be
carried out either using blank correction or the degree to which sample values exceed the limits of
detection (3 x standard deviation, SD, of mean concentration detected in procedural blanks) or limit of
quantification (10 x SD). If the blank samples contain MP particles that clearly and without any doubt
differ from any particles detected in the field samples, these particles may be ignored. Furthermore,
the percentage of particles confirmed as plastic/synthetic/anthropogenic should be clearly reported, as
should the levels of uncertainty in data output.
Box A: Data needs/expectations.
Must have data for reporting microplastics in sediments
• Location, including latitude and longitude
• Date, including day, month, and year
• Sampling method (type of box corer, cylinder corer, grab)
• Sampling depth (sea depth, m)
• Sample size (kg, g wet weight)
• Wet weight/dry weight relationship
• Total number of (sub)samples per site (i.e., n) and if individual samples were pooled
• Storage after sampling
• Method for organic matter dissociation and digestion with documented impact on plastic polymers
• Method for separation with documented recovery rate of relevant polymers and size classes
• Filter type and pore/mesh size used
• Average (with standard deviation) number of MP particles as determined by visual analysis reported in
size categories 5- ≥1 mm and 1000- ≥ 300 µm
• For each particle, category (i.e., fragment, pellet, fiber/line, film, foam, or other), size, shape, and color
(reported in eight broad color groups) must be recorded in accordance with GESAMP (2019)
• Polymer ID must be determined and documented for at least a subset of relevant/representative particles
within the visually identified size category 1000- ≥ 300 µm
Beneficial to have for all data
• Mass of MP (determined by, e.g., pyrolysis–gas chromatography–mass spectrometry, Pyr-GC/MS, or
estimated from surface area of particles)
• Granulometry, e.g., grain-size fractions < 2 mm and < 63 µm
• Sediment organic matter content (total carbon (TC)/total organic carbon (TOC))
• Vicinity to potential sources
AMAP Litter and Microplastics Monitoring Guidelines
53
2.3.8 Existing monitoring for sediments/contaminants in the Arctic
Linking MP sampling to already existing monitoring programs is advantageous because other
ancillary parameters relevant for MP monitoring will be measured at the same time, e.g., sediment
granulometry, organic matter content, etc. The Norwegian monitoring program, Mareano, could be
suitable for linked MP monitoring of marine sediments. It covers the northern Norwegian coastal and
offshore areas including the Barents Sea (Figure 2.2) and is coordinated by the Institute of Marine
Research in collaboration with the Geological Survey of Norway and the Norwegian Hydrographic
Service. Further, the Norwegian Environment Agency facilitates a number of monitoring programs
focusing on environmental contaminants in sediments, has (2021-) requested the inclusion of MP, and
it is currently out to tender. The German Alfred Wegner Institute (AWI) regularly visits the deep-sea
observatory HAUSGARTEN in the Fram Strait. Here sediments are sampled for various scientific
purposes including MP pollution. Whether there are any other ongoing Arctic monitoring programs
that continuously sample sediment is unclear.
2.3.9 Recommendations
• Sediment should be collected where particles are likely to settle, i.e., on accumulation
bottoms and not on transport or erosion bottoms.
• Do not apply temperatures above 40 °C to the samples at any time of preparation. Above this
temperature, polymers like rayon lose their tenacity and the structure is modified.
• Test all methods for extraction efficiencies and harmfulness to plastic polymers in
laboratories before use.
• All digestive agents must be prepared and filtered through filters with a smaller pore size than
the lowest desired particle detection limit of the sample to remove impurities and to prevent
the introduction of contamination into samples.
• Salt solutions for density separation must be prepared and filtered through filters with a
smaller pore size than the lowest desired particle detection limit of the sample to remove
impurities and to prevent the introduction of contamination into samples.
• A solution with a density of 1.6 g cm-3 is recommended for separation to enable comparison
between studies. NaI is identified as the most suitable density separation solution in terms of
hazards, extraction efficiency, and recyclability. Other extraction solutions can be used as
long as they reach a density of 1.6 g cm-1 and are similar or better regarding the selected
quality criteria.
• Repeated extraction is recommended, and samples should be thoroughly mixed following the
addition of salt solutions (Hurley et al., 2018b). The number of repeats is sufficient when
particle numbers retrieved are no higher than background levels.
• Flotation as a method for particle separation should not be performed on small size fractions
where bubbles may interfere with the flotation process; however, flotation may be suitable for
large size fractions (Nguyen et al., 2019).
• It is advisable to use a laminar air flow bench or similar when samples are exposed to air.
• Procedural controls are extremely important for all steps of the sample preparation procedure,
i.e., sampling, transport, digestion, extraction, and filtration (Brander et al., 2020).

AMAP Litter and Microplastics Monitoring Guidelines
54
2.3.10 Research gaps
There is still a lack of data and information regarding MP fate and patchiness in sediments, which
makes it difficult to provide solid advice on the number of replicates required to support robust
statistical analyses. When setting up a monitoring program, it will therefore be important to first
investigate the hydrodynamics of the area and identify accumulation zones and patchiness of sediment
associated MP.
Due to the lack of established methodology, it is not possible to advise on the monitoring of MP
particles smaller than 300 µm. This lower size limit is thus not based on ecological or
ecotoxicological relevance. There is a great desire to be able to routinely sample much smaller MP
and even nanoplastic fractions.
Table 2.6 Summary of monitoring and research recommendations for litter and microplastics
monitoring in Arctic sediments.
1st level (must do) 2nd level (should do/develop)
Monitoring - Visual analysis of microlitter
content including categories for
shapes and color in surface
sediments from accumulation
bottoms. All microlitter should
be monitored and reported in
size categories 300 µm – 1 mm
and 1-5 mm.
- Analysis on polymer ID of a
selection of relevant microlitter
particles ≥ 300 µm.
Point source studies.
- Visual analysis and polymer
ID of microlitter particles ≥
100 µm.
Research - Automated analysis on polymer
ID of microlitter < 100 µm.
- Determination of deposition
areas and MP fate processes.
- Mass-based units for MP
contents.
- Strategies for sampling
shoreline and beach sediments
for MP analysis.
Table 2.7 Summary rationale for recommendations, including estimated costs for implementing
programs: 0 - already in place; $ - relatively inexpensive because of synergy with other projects but
needs to have some additional capacity; $$ - either networks and capacity will need to be developed;
$$$ - development of sampling networks, processing capacity, and reporting all need to be developed.
Recommendation Program
Cost Rationale
Surface sediments analyzed for all
microlitter particles ≥ 300 µm.
- Useful for monitoring, in
alignment with OSPAR, MSFD.
- Accumulation bottoms are
temporal records of plastic
pollution.
$$ Monitoring programs are already in place for
sediments regarding pollutants, trophic status, and
biota, making it easy to include sampling for MP. The
main cost involves processing and analysis of samples,
which can be quite costly.

AMAP Litter and Microplastics Monitoring Guidelines
55
Figure 2.2 Map of existing and proposed sampling sites for MP in marine sediments within the
AMAP region. Existing sampling sites refer to sites where there are data on MP concentrations in
sediments. The HAUSGARTEN underwater observatory regularly visited by German Alfred Wegner
Institute cruises is not marked on the map.
AMAP Litter and Microplastics Monitoring Guidelines
56
References
Alomar, C., F. Estarellas and S. Deudero, 2016. Microplastics in the Mediterranean Sea: deposition in
coastal shallow sediments, spatial variation and preferential grain size. Marine Environmental
Research, 115:1-10. https://doi.org/10.1016/j.marenvres.2016.01.005
Ambrosini, R., R.S. Azzoni, F. Pittino, G. Diolaiuti, A. Franzetti and M. Parolini, 2019. First evidence
of microplastic contamination in the supraglacial debris of an alpine glacier. Environmental Pollution,
253:297-301. https://doi.org/10.1016/j.marenvres.2016.01.005
Arp, H.P., H. Knutsen, A. Pettersen, T. Moskeland and J. Huse, 2018. Microplastics in sediments on
the Norwegian continental shelf II: identification through FT-IR analysis. Milijørektoratet,
Trondheim, Norway. [online] URL:
https://www.miljodirektoratet.no/globalassets/publikasjoner/M1231/M1231.pdf
Bergmann, M., S. Mützel, S. Primpke, M.B. Tekman, J. Trachsel and G. Gerdts, 2019. White and
wonderful? Microplastics prevail in snow from the Alps to the Arctic. Science Advances, 5:eaax1157.
https://doi.org/10.1126/sciadv.aax1157
Bergmann, M., V. Wirzberger, T. Krumpen, C. Lorenz, S. Primpke, M.B. Tekman and G. Gerdts,
2017. High quantities of microplastic in Arctic deep-sea sediments from the HAUSGARTEN
observatory. Environmental Science and Technology, 51:11000-11010.
https://doi.org/10.1021/acs.est.7b03331
Besseling, E., J.T.K. Quik, M. Sun and A.A. Koelmans, 2017. Fate of nano- and microplastic in
freshwater systems: a modeling study. Environmental Pollution, 220:540-548.
https://doi.org/10.1016/j.envpol.2016.10.001
Brander, S.M., V.C. Renick, M.M. Foley, C. Steele, M. Woo, A. Lusher, S. Carr, P. Helm, C. Box, S.
Cherniak, R.C. Andrews and C.M. Rochman, 2020. Sampling and quality assurance and quality
control: a guide for scientists investigating the occurrence of microplastics across matrices. Applied
Spectroscopy, 74:1099-1125. https://doi.org/10.1177/0003702820945713
Bosker, T., L. Guaita and P. Behrens, 2018. Microplastic pollution on Caribbean beaches in the
Lesser Antilles. Marine Pollution Bulletin, 133:442-447.
https://doi.org/10.1016/j.marpolbul.2018.05.060
Claessens, M., L. Van Cauwenberghe, M.B. Vandegehuchte and C.R. Janssen, 2013. New techniques
for the detection of microplastics in sediments and field collected organisms. Marine Pollution
Bulletin, 70:227-233. https://doi.org/10.1016/j.marpolbul.2013.03.009
Cózar, A., E. Martí, C.M. Duarte, J. García-de-Lomas, E. van Sebille, T.J. Ballatore, V.M. Eguíluz,
J.I. González-Gordillo, M.L. Pedrotti, F. Echevarría, R. Troublè and X. Irigoien, 2017. The Arctic
Ocean as a dead end for floating plastics in the North Atlantic branch of the Thermohaline
Circulation. Science Advances, 3:e1600582. https://doi.org/10.1126/sciadv.1600582
Crichton, E.M., M. Noël, E.A. Gies and P.S. Ross, 2017. A novel, density-independent and FTIR-
compatible approach for the rapid extraction of microplastics from aquatic sediments. Analytical
Methods, 9:1419-1428. https://doi.org/10.1039/c6ay02733d

AMAP Litter and Microplastics Monitoring Guidelines
57
Enders, K., A. Käppler, O. Biniasch, P. Feldens, N. Stollberg, X. Lange, D. Fischer, K.-J. Eichhorn, F.
Pollehne, S. Oberbeckmann and M. Labrenz, 2019. Tracing microplastics in aquatic environments
based on sediment analogies. Scientific Reports, 9:18839. https://doi.org/10.1038/s41598-019-54997-
z
Enders, K., R. Lenz, S. Beer and C.A. Stedmon, 2017. Extraction of microplastic from biota:
recommended acidic digestion destroys common plastic polymers. Ices Journal of Marine Science,
74:326-331. https://doi.org/10.1093/icesjms/fsw173
Erni-Cassola, G., V. Zadjelovic, M. I. Gibson and J. A. Christie-Oleza, 2019. Distribution of plastic
polymer types in the marine environment; a meta-analysis. Journal of Hazardous Materials, 369:691-
698. https://doi.org/10.1016/j.jhazmat.2019.02.067
Evangeliou, N., H. Grythe, Z. Klimont, C. Heyes, S. Eckhardt, S. Lopez-Aparicio and A. Stohl, 2020.
Atmospheric transport is a major pathway of microplastics to remote regions. Nature
Communications, 11:3381. https://doi.org/10.1038/s41467-020-17201-9
Fisner, M., A.P. Majer, D. Balthazar-Silva, D. Gorman and A. Turra, 2017. Quantifying microplastic
pollution on sandy beaches: the conundrum of large sample variability and spatial heterogeneity.
Environmental Science and Pollution Research, 24:13732-13740. https://doi.org/10.1007/s11356-017-
8883-y
Fuller, S. and A. Gautam, 2016. A procedure for measuring microplastics using pressurized fluid
extraction. Environmental Science and Technology, 50:5774-5780.
https://doi.org/10.1021/acs.est.6b00816
González-Pleiter, M., D. Velázquez, C. Edo, O. Carretero, J. Gago, Á. Barón-Sola, L.E. Hernández, I.
Yousef, A. Quesada, F. Leganés, R. Rosal and F. Fernández-Piñas, 2020. Fibers spreading worldwide:
microplastics and other anthropogenic litter in an Arctic freshwater lake. Science of the Total
Environment, 722:137904. https://doi.org/10.1016/j.scitotenv.2020.137904
Granberg, M.E., L.W. von Friesen, A. Ask, F. Collard, K. Magnusson, A-K. Eriksson Wiklund, F.
Murphy, J. Strand, G.W. Gabrielsen and L. Bach, 2020. Microlitter in Arctic marine benthic food
chains and potential effects on sediment dwelling fauna. TemaNord, 528. Nordic Council of
Ministers, Copenhagen, Denmark. https://doi.org/10.6027/temanord2020-528
Granberg, M.E., L.W. von Friesen, L. Bach, F. Collard, J. Strand and G. W. Gabrielsen, 2019.
Anthropogenic microlitter in wastewater and marine samples from Ny-Ålesund, Barentsburg and
Signehamna, Svalbard. No. C 373. IVL Swedish Environmental Research Institute, Stockholm,
Sweden. [online] URL: https://pure.au.dk/portal/files/152355861/C373march.pdf
Group of Experts on Scientific Aspects of Marine Environmental Protection (GESAMP), 2019.
Guidelines for the Monitoring and Assessment of Plastic Litter and Microplastics in the Ocean.
GESAMP, London, UK, 130pp. [online] URL: http://www.gesamp.org/publications/guidelines-for-
the-monitoring-and-assessment-of-plastic-litter-in-the-ocean
Haave, M., C. Lorenz, S. Primpke and G. Gerdts. 2019. Different stories told by small and large
microplastics in sediment - first report of microplastic concentrations in an urban recipient in Norway.
Marine Pollution Bulletin, 141:501-513. https://doi.org/10.1016/j.marpolbul.2019.02.015

AMAP Litter and Microplastics Monitoring Guidelines
58
Hidalgo-Ruz, V., L. Gutow, R.C. Thompson and M. Thiel, 2012. Microplastics in the marine
environment: a review of the methods used for identification and quantification. Environmental
Science and Technology, 46:3060-3075. https://doi.org/10.1021/es2031505
Huntington, A., P.L. Corcoran, L. Jantunen, C. Thaysen, S. Bernstein, G.A. Stern and C.M. Rochman,
2020. A first assessment of microplastics and other anthropogenic particles in Hudson Bay and the
surrounding eastern Canadian Arctic waters of Nunavut. FACETS, 5:432-454.
https://doi.org/10.1139/facets-2019-0042
Hurley, R.R., A.L. Lusher, M. Olsen and L. Nizzetto, 2018b. Validation of a method for extracting
microplastics from complex, organic-rich, environmental matrices. Environmental Science and
Technology, 52:7409-7417. https://doi.org/10.1021/acs.est.8b01517
Hurley, R., J. Woodward and J.J. Rothwell, 2018a. Microplastic contamination of river beds
significantly reduced by catchment-wide flooding. Nature Geoscience, 11:251-257.
https://doi.org/10.1038/s41561-018-0080-1
Imhof, H.K., J. Schmid, R. Niessner, N.P. Ivleva and C. Laforsch, 2012. A novel, highly efficient
method for the separation and quantification of plastic particles in sediments of aquatic environments.
Limnology and Oceanography: Methods, 10:524-537. https://doi.org/10.4319/lom.2012.10.524
Kaiser, D., N. Kowalski and J.J. Waniek, 2017. Effects of biofouling on the sinking behavior of
microplastics. Environmental Research Letters, 12:124003. https://doi.org/10.1088/1748-9326/aa8e8b
Kanhai, L.K., C. Johansson, J.P.G.L. Frias, K. Gardfeldt, R.C. Thompson and I. O'Connor, 2019.
Deep sea sediments of the Arctic Central Basin: a potential sink for microplastics. Deep-Sea Research
Part I-Oceanographic Research Papers 145:137-142. https://doi.org/10.1016/j.dsr.2019.03.003
Korez, Š., L. Gutow and R. Saborowski, 2019. Microplastics at the strandlines of Slovenian beaches.
Marine Pollution Bulletin, 145:334-342. https://doi.org/10.1016/j.marpolbul.2019.05.054
Kowalski, N., A.M. Reichardt and J.J. Waniek, 2016. Sinking rates of microplastics and potential
implications of their alteration by physical, biological, and chemical factors. Marine Pollution
Bulletin, 109:310-319. https://doi.org/10.1016/j.marpolbul.2016.05.064
Löder, M.G.J., H.K. Imhof, M. Ladehoff, L.A. Löschel, C. Lorenz, S. Mintenig, S. Piehl, S. Primpke,
I. Schrank, C. Laforsch and G. Gerdts, 2017. Enzymatic purification of microplastics in
environmental samples. Environmental Science and Technology, 51:14283-14292.
https://doi.org/10.1021/acs.est.7b03055
Lorenz, C., L. Roscher, M.S. Meyer, L. Hildebrandt, J. Prume, M.G.J. Löder, S. Primpke and G.
Gerdts, 2019. Spatial distribution of microplastics in sediments and surface waters of the southern
North Sea. Environmental Pollution, 252B:1719-1729. https://doi.org/10.1016/j.envpol.2019.06.093
Lots, F.A.E., P. Behrens, M.G. Vijver, A.A. Horton and T. Bosker, 2017. A large-scale investigation
of microplastic contamination: abundance and characteristics of microplastics in European beach
sediment. Marine Pollution Bulletin, 123:219-226. https://doi.org/10.1016/j.marpolbul.2017.08.057
AMAP Litter and Microplastics Monitoring Guidelines
59
Luoto, T.P., M.V. Rantala, E.H. Kivilä, L. Nevalainen and A.E.K. Ojala, 2019. Biogeochemical
cycling and ecological thresholds in a High Arctic lake (Svalbard). Aquatic Sciences, 81:34.
https://doi.org/10.1007/s00027-019-0630-7
Lusher, A., N.T. Buenaventura, D.P. Eidsvoll, J.-E. Thrane, A. Økelsrud and M. Jartun, 2019.
Freshwater microplastics in Norway: a first look at sediment, biota and historical plankton samples
from Lake Mjøsa and Lake Femunden. Milijørektoratet, Trondheim, Norway. [online] URL:
https://www.miljodirektoratet.no/globalassets/publikasjoner/m1212/m1212.pdf
Lusher, A. L., V. Tirelli, I. O'Connor and R. Officer, 2015. Microplastics in Arctic polar waters: the
first reported values of particles in surface and sub-surface samples. Scientific Reports, 5:14947.
https://doi.org/10.1038/srep14947
Mai, L., L.-J. Bao, L. Shi, C.S. Wong and E.Y. Zeng, 2018. A review of methods for measuring
microplastics in aquatic environments. Environmental Science and Pollution Research, 25:11319-
11332. https://doi.org/10.1007/s11356-018-1692-0
Mani, T., S. Frehland, A. Kalberer and P. Burkhardt-Holm, 2019. Using castor oil to separate
microplastics from four different environmental matrices. Analytical Methods, 11:1788-1794.
https://doi.org/10.1039/c8ay02559b
Marine Strategy Framework Directive (MSFD), Technical Subgroup on Marine litter, 2020. Guidance
on Monitoring of Marine Litter in European Seas: a guidance document within the Common
Implementation Strategy for the Marine Strategy Framework Directive. JRC Scientific and Policy
reports. European Union, Luxembourg. [online] URL:
https://mcc.jrc.ec.europa.eu/documents/201702074014.pdf
Martin, J., A. Lusher, R.C. Thompson and A. Morley, 2017. The Deposition and accumulation of
microplastics in marine sediments and bottom water from the Irish Continental Shelf. Scientific
Reports, 7:10772. https://doi.org/10.1038/s41598-017-11079-2
McWilliams, M., M. Liboiron and Y. Wiersma, 2018. Rocky shoreline protocols miss microplastics in
marine debris surveys (Fogo Island, Newfoundland and Labrador). Marine Pollution Bulletin,
129:480-486. https://doi.org/10.1016/j.marpolbul.2017.10.018
Miller, M.E., F.J. Kroon and C.A. Motti, 2017. Recovering microplastics from marine samples: a
review of current practices. Marine Pollution Bulletin, 123:6-18.
https://doi.org/10.1016/j.marpolbul.2017.08.058
Mu, J., L. Qu, F. Jin, S. Zhang, C. Fang, X. Ma, W. Zhang, C. Huo, Y. Cong and J. Wang, 2019.
Abundance and distribution of microplastics in the surface sediments from the northern Bering and
Chukchi Seas. Environmental Pollution, 245:122-130. https://doi.org/10.1016/j.envpol.2018.10.097
Munno, K., P.A. Helm, D.A. Jackson, C. Rochman and A. Sims, 2018. Impacts of temperature and
selected chemical digestion methods on microplastic particles. Environmental Toxicology and
Chemistry, 37:91-98. https://doi.org/10.1002/etc.3935
AMAP Litter and Microplastics Monitoring Guidelines
60
Näkki, P., O. Setälä and M. Lehtiniemi, 2019. Seafloor sediments as microplastic sinks in the northern
Baltic Sea - negligible upward transport of buried microplastics by bioturbation. Environmental
Pollution, 249:74-81. https://doi.org/10.1016/j.envpol.2019.02.099
Ng, K.L. and J.P. Obbard, 2006. Prevalence of microplastics in Singapore’s coastal marine
environment. Marine Pollution Bulletin, 52:761-767. https://doi.org/10.1016/j.marpolbul.2005.11.017
Nguyen, B., D. Claveau-Mallet, L.M. Herandez, E.G. Xu, J.M. Farner,and N. Tufenkji, 2019.
Separation and analysis of microplastics and nanoplastics in complex environmental samples.
Accounts of Chemical Research, 52:858-866. https://doi.org/10.1021/acs.accounts.8b00602
Obbard, R.W., S. Sadri, Y.Q. Wong, A.A. Khitun, I. Baker and R.C. Thompson, 2014. Global
warming releases microplastic legacy frozen in Arctic sea ice. Earth's Future, 2:315-320.
https://doi.org/10.1002/2014ef000240
Peeken, I., S. Primpke, B. Beyer, J. Gütermann, C. Katlein, T. Krumpen, M. Bergmann, L. Hehemann
and G. Gerdts, 2018. Arctic sea ice is an important temporal sink and means of transport for
microplastic. Nature Communications, 9:1505. https://doi.org/10.1038/s41467-018-03825-5
Peng, G., B. Zhu, D. Yang, L. Su, H. Shi and D. Li, 2017. Microplastics in sediments of the
Changjiang Estuary, China. Environmental Pollution, 225:283-290.
https://doi.org/10.1016/j.envpol.2016.12.064
Piarulli, S., S. Scapinello, P. Comandini, K. Magnusson, M. Granberg, J.X.W. Wong, G. Sciutto, S.
Prati, R. Mazzeo, A.M. Booth and L. Airoldi, 2019. Microplastic in wild populations of the
omnivorous crab Carcinus aestuarii: a review and a regional-scale test of extraction methods,
including microfibres. Environmental Pollution, 251:117-127.
https://doi.org/10.1016/j.envpol.2019.04.092
Piñon-Colin, T.D., R. Rodriguez-Jimenez, M.A. Pastrana-Corral, E. Rogel-Hernandez and F.T.
Wakida, 2018. Microplastics on sandy beaches of the Baja California Peninsula, Mexico. Marine
Pollution Bulletin, 131:63-71. https://doi.org/10.1016/j.marpolbul.2018.03.055
Porter, A., B.P. Lyons, T.S. Galloway and C. Lewis, 2018. Role of marine snows in microplastic fate
and bioavailability. Environmental Science and Technology, 52:7111-7119.
https://doi.org/10.1021/acs.est.8b01000
Rocha-Santos, T. and A.C. Duarte, 2015. A critical overview of the analytical approaches to the
occurrence, the fate and the behavior of microplastics in the environment. TrAC Trends in Analytical
Chemistry, 65:47-53. https://doi.org/10.1016/j.trac.2014.10.011
Rummel, C.D., A. Jahnke, E. Gorokhova, D. Kühnel and M. Schmitt-Jansen, 2017. Impacts of biofilm
formation on the fate and potential effects of microplastic in the aquatic environment. Environmental
Science and Technology Letters, 4:258-267. https://doi.org/10.1021/acs.estlett.7b00164
Setälä, O., M.E. Granberg, M. Hassellöv, T.M. Karlsson, M. Lehtiniemi, K. Mattsson, J. Strand, J.
Talvitie and K. Magnusson, 2019. Monitoring of Microplastics in the Marine Environment; Changing
Directions Towards Quality Controlled Tailored Solutions. Nordic Council of Ministers, Copenhagen,
Denmark. https://doi.org/10.6027/no2019-053

AMAP Litter and Microplastics Monitoring Guidelines
61
Soutar, A., S.A. Kling, P.A. Crill, E. Duffrin and K.W. Bruland, 1977. Monitoring marine
environment through sedimentation. Nature, 266:136-139. https://doi.org/10.1038/266136a0
Stock, F., C. Kochleus, B. Bänsch-Baltruschat, N. Brennholt and G. Reifferscheid, 2019. Sampling
techniques and preparation methods for microplastic analyses in the aquatic environment - a review.
TrAC Trends in Analytical Chemistry, 113:84-92. https://doi.org/10.1016/j.trac.2019.01.014
Strand, J., P. Lassen, Y. Shashoua, and J.H. Andersen, 2013. Microplastic Particles in Sediments from
Danish Waters. ICES annual science conference, Reykjavik, Iceland. [online] URL:
https://pure.au.dk/portal/en/publications/microplastic-particles-in-sediments-from-danish-
waters(542ecae3-2979-4ccf-9dd0-13ccf03dc60e).html
Strand, J. and Z. Tairova, 2016. Microplastic particles in North Sea sediments 2015. Scientific report
from DCE – Danish Centre for Environment and Energy, No. 178. DCE, Roskilde, Denmark. [online]
URL: https://dce2.au.dk/pub/SR178.pdf
Tekman, M.B., T. Krumpen and M. Bergmann, 2017. Marine litter on deep Arctic seafloor continues
to increase and spreads to the North at the HAUSGARTEN observatory. Deep-Sea Research Part I:
Oceanographic Research Papers, 120:88-99. https://doi.org/10.1016/j.dsr.2016.12.011
Tekman, M.B., C. Wekerle, C. Lorenz, S. Primpke, C. Hasemann, G. Gerdts and M. Bergmann, 2020.
Tying up loose ends of microplastic pollution in the Arctic: distribution from the sea surface through
the water column to deep-sea sediments at the HAUSGARTEN observatory. Environmental Science
and Technology, 54:4079-4090. https://doi.org/10.1021/acs.est.9b06981
Turra, A., A.B. Manzano, R.J.S. Dias, M. M. Mahiques, L. Barbosa, D. Balthazar-Silva and F.T.
Moreira, 2014. Three-dimensional distribution of plastic pellets in sandy beaches: shifting paradigms.
Scientific Reports, 4:4435. https://doi.org/10.1038/srep04435
Van Cauwenberghe, L., L. Devriese, F. Galgani, J. Robbens and C.R. Janssen, 2015. Microplastics in
sediments: a review of techniques, occurrence and effects. Marine Environmental Research, 111:5-17.
https://doi.org/10.1016/j.marenvres.2015.06.007
Vianello, A., A. Boldrin, P. Guerriero, V. Moschino, R. Rella, A. Sturaro and L. Da Ros, 2013.
Microplastic particles in sediments of Lagoon of Venice, Italy: first observations on occurrence,
spatial patterns and identification. Estuarine, Coastal and Shelf Science 130:54-61.
https://doi.org/10.1016/j.ecss.2013.03.022
von Friesen, L.W., M.E. Granberg, M. Hassellöv, G.W. Gabrielsen and K. Magnusson, 2019. An
efficient and gentle enzymatic digestion protocol for the extraction of microplastics from bivalve
tissue. Marine Pollution Bulletin, 142:129-134. https://doi.org/10.1016/j.marpolbul.2019.03.016
von Friesen, L.W., M.E. Granberg, O. Pavlova, K. Magnusson, M. Hassellöv and G.W. Gabrielsen,
2020. Sea ice and a wastewater outlet identified as hotspots for anthropogenic microlitter in Svalbard
waters. Environment International, 139:105511. https://doi.org/10.1016/j.envint.2020.105511
Woodall, L.C., A. Sanchez-Vidal, M. Canals, G.L.J. Paterson, R. Coppock, V. Sleight, A. Calafat,
A.D. Rogers, B.E. Narayanaswamy and R.C. Thompson, 2014. The deep sea is a major sink for
microplastic debris. Royal Society Open Science, 1:140317. https://doi.org/10.1098/rsos.140317

AMAP Litter and Microplastics Monitoring Guidelines
62
Zhang, H., 2017. Transport of microplastics in coastal seas. Estuarine Coastal and Shelf Science,
199:74-86. https://doi.org/10.1016/j.ecss.2017.09.032
Zhao, S., J.E. Ward, M. Danley and T.J. Mincer, 2018. Field-based evidence for microplastic in
marine aggregates and mussels: implications for trophic transfer. Environmental Science and
Technology, 52:11038-11048. https://doi.org/10.1021/acs.est.8b03467
Plastic sediment sampling in Iqaluit, Nunavut, Canada.
Photo: Jennifer Provencher

AMAP Litter and Microplastics Monitoring Guidelines
63
2.4 Terrestrial soils AUTHORS: JESSE VERMAIRE AND AMY L. LUSHER
2.4.1 Introduction
Plastic pollution is present in terrestrial soils but in comparison to other abiotic and biotic
compartments, relatively little research has been carried out on microplastics (MP) pollution in soils
(reviewed by Bläsing and Amelung, 2018; Wang et al., 2020; Zhang et al., 2020). This lack of
research is particularly true for the Arctic where, at the time of writing, no peer-reviewed studies
existed for MP pollution in terrestrial soils in Arctic environments. Therefore, much of this section
focuses on the findings of plastic pollution research in terrestrial soils in other environments.
However, MP pollution in soils, as a whole, remains highly understudied compared to other abiotic
and biotic compartments (Wang et al., 2020).
Microplastic pollution in terrestrial soils may occur through a variety of pathways including sewage
sludge applications (Corradini et al., 2019), biotic vectors (Provencher et al., 2018), the breakdown of
plastics used in agriculture (Piehl et al., 2018), and (long-range) atmospheric deposition (Allen et al.,
2019), among other pathways. However, no data on MP in terrestrial Arctic soils exist. The mobility
of MP in soils, both vertically along a soil depth profile and horizontally along the soil surface, is still
an area that requires further research (Wang et al., 2020), however, it has been estimated that upwards
of 99% of MP applied to agricultural fields from sewage sludge likely enter aquatic environments
through erosion and surface runoff (Crossman et al., 2020). This mobility of MP in terrestrial soils has
not been studied in Arctic environments and may be very different than what has been reported in
temperate agricultural systems for numerous reasons including the presence of permafrost, differing
vegetation cover, and land management practices. Therefore, there is a great need to understand the
presence, concentration, composition, and fate of MP in Arctic soils to obtain a clearer overview of
MP compartments and plastic cycling in the Arctic. Furthermore, we know little of the potential
degradation of MP in soils and how terrestrial soils potentially link the atmospheric and aquatic pools
of MP.
There is limited data on the potential impact MP have on terrestrial environments and no research in
Arctic environments where soil conditions and fauna can differ greatly from more southern regions.
Recent studies in more southern environments have shown some impacts of MP (reviewed by Guo et
al., 2020) in soils on biota including earthworms (Zhu et al., 2018; Wang et al., 2019), snails (Song et
al., 2019), and crops (Qi et al., 2018; de Souza Machado et al., 2019). Microplastics in soils have also
been noted to change soil enzymes (de Souza Machado et al., 2019) and microbial biomass (Awet et
al., 2018). Further research is required, however, to understand what impacts, if any, MP pollution is
having on soil ecosystems (Guo et al., 2020; Wang et al., 2020), particularly in Arctic environments
where no data yet exist.
Monitoring MP in terrestrial soils in the Arctic would provide information on the current abundance
and spatial distribution of MP pollution in soils and over time provide data on long-term trends in
plastic pollution in the Arctic. These data would be useful in teasing apart long-range versus local
sources of plastic pollution to the Arctic and provide information on a key compartment and potential
cycling of plastic pollution in Arctic environments.

AMAP Litter and Microplastics Monitoring Guidelines
64
2.4.2 Existing monitoring frameworks for microplastics in terrestrial soils
At present there are no standardized protocols for the monitoring of MP in terrestrial soils (Qi et al.,
2020; Wang et al., 2020; Xu et al., 2020). Because of the paucity of research on plastic pollution in
terrestrial soils, little information is available on best practices for monitoring plastic pollution in
soils, including in Arctic environments (Bläsing and Amelung, 2018; Wang et al., 2020).
Methodology for sampling MP in soils is driven largely by the research question at hand including the
depth of sampling and the quantity of soil sampled (Möller et al., 2020; Zhou et al., 2020). General
recommendations typically suggest following similar procedures to aquatic sediments, however, more
research is required to ensure that the optimal protocols are put in place for monitoring plastic
pollution in terrestrial soils in the Arctic. It is anticipated that more formal protocols for monitoring
MP in soils will be developed over the coming years as research grows in this area. Below we provide
some basic guidance for monitoring MP in soils based on the available literature.
2.4.3 Sampling
Although standardized sampling methods have yet to be developed for monitoring MP in soils, it is
still important that reliable information on sample collection, processing, and plastic identification
methodologies are provided to allow for comparison between sampling sites and to build the
knowledge required to develop methodologies for monitoring programs. Box A outlines both the must
have data for reporting MP concentrations in soils and the beneficial to have data.
Box A: Information needs for reporting microplastics in soils.
Must have data for reporting microplastics in soils
• Sampling location, including latitude and longitude
• Date including day, month, and year
• Description of ground cover including estimates of percent vegetation cover and vegetation
type
• Description of soil type preferably using a formal soil classification system
• Sampling method (e.g., soil corer, shovel)
• Surface area sampled
• Depth of soil sampled
• Wet weight of sample
• Dry weight of sample
• Storage of sample (sample container) and conditions after sampling (e.g., stored in fridge)
• Method of organic matter removal
• Sieve size used for coarse and fine sieving
• Method of density separation
• Average number of MP particles (with standard deviation) determined through visual analysis
reported in size categories 5 - ≥ 1 mm and 1000 - ≥ 300 μm
• For each plastic particle identify the category (e.g., fiber, film, foam, fragment), size class,
shape, and color (reported in eight broad color groups)
Beneficial to have data for reporting microplastics in soils
• Soil organic matter content (determined though loss-on-ignition or similar)
• Particle size distribution of soils
• Polymer identification
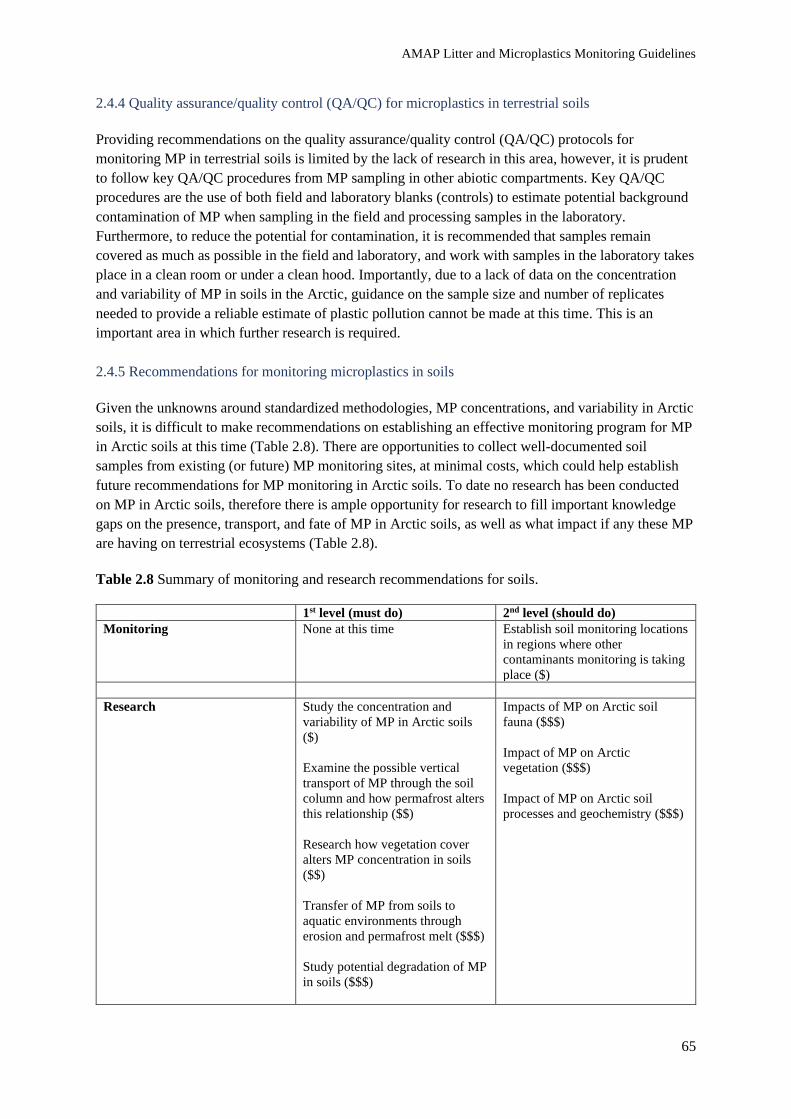
AMAP Litter and Microplastics Monitoring Guidelines
65
2.4.4 Quality assurance/quality control (QA/QC) for microplastics in terrestrial soils
Providing recommendations on the quality assurance/quality control (QA/QC) protocols for
monitoring MP in terrestrial soils is limited by the lack of research in this area, however, it is prudent
to follow key QA/QC procedures from MP sampling in other abiotic compartments. Key QA/QC
procedures are the use of both field and laboratory blanks (controls) to estimate potential background
contamination of MP when sampling in the field and processing samples in the laboratory.
Furthermore, to reduce the potential for contamination, it is recommended that samples remain
covered as much as possible in the field and laboratory, and work with samples in the laboratory takes
place in a clean room or under a clean hood. Importantly, due to a lack of data on the concentration
and variability of MP in soils in the Arctic, guidance on the sample size and number of replicates
needed to provide a reliable estimate of plastic pollution cannot be made at this time. This is an
important area in which further research is required.
2.4.5 Recommendations for monitoring microplastics in soils
Given the unknowns around standardized methodologies, MP concentrations, and variability in Arctic
soils, it is difficult to make recommendations on establishing an effective monitoring program for MP
in Arctic soils at this time (Table 2.8). There are opportunities to collect well-documented soil
samples from existing (or future) MP monitoring sites, at minimal costs, which could help establish
future recommendations for MP monitoring in Arctic soils. To date no research has been conducted
on MP in Arctic soils, therefore there is ample opportunity for research to fill important knowledge
gaps on the presence, transport, and fate of MP in Arctic soils, as well as what impact if any these MP
are having on terrestrial ecosystems (Table 2.8).
Table 2.8 Summary of monitoring and research recommendations for soils.
1st level (must do) 2nd level (should do)
Monitoring None at this time Establish soil monitoring locations
in regions where other
contaminants monitoring is taking
place ($)
Research Study the concentration and
variability of MP in Arctic soils
($)
Examine the possible vertical
transport of MP through the soil
column and how permafrost alters
this relationship ($$)
Research how vegetation cover
alters MP concentration in soils
($$)
Transfer of MP from soils to
aquatic environments through
erosion and permafrost melt ($$$)
Study potential degradation of MP
in soils ($$$)
Impacts of MP on Arctic soil
fauna ($$$)
Impact of MP on Arctic
vegetation ($$$)
Impact of MP on Arctic soil
processes and geochemistry ($$$)

AMAP Litter and Microplastics Monitoring Guidelines
66
2.4.6 Conclusions
Microplastics in soils is an under-researched area, particularly in the Arctic where no research yet
exists. Nevertheless, soils are a critical component of Arctic ecosystems and one that is rapidly
changing in the face of climate change. Furthermore, soils are a large abiotic compartment in the
Arctic and if we want to understand the cycling of plastic contamination in the north, it is important to
monitor this component. Research in this area is developing rapidly and it is likely that sufficient
evidence will be available shortly to make more robust recommendations on potential monitoring
programs.
AMAP Litter and Microplastics Monitoring Guidelines
67
References
Allen, S., D. Allen, V.R. Phoenix, G. Le Roux, P.D. Jiménez, A. Simonneau, S. Binet and D. Galop,
2019. Atmospheric transport and deposition of microplastics in a remote mountain catchment. Nature
Geoscience, 12:339-344. https://doi.org/10.1038/s41561-019-0335-5
Awet, T.T., Y. Kohl, F. Meier, S. Straskraba, A.-L. Grün, T. Ruf, C. Jost, R. Drexel, E. Tunc, and C.
Emmerling, 2018. Effects of polystyrene nanoparticles on the microbiota and functional diversity of
enzymes in soil. Environmental Sciences Europe, 30:11. https://doi.org/10.1186/s12302-018-0140-6
Bläsing, M. and W. Amelung, 2018. Plastics in soil: analytical methods and possible sources. Science
of the Total Environment, 612:422-435. https://doi.org/10.1016/j.scitotenv.2017.08.086
Corradini, F., P. Meza, R. Eguiluz, F. Casado, E. Huerta-Lwanga and V. Geissen, 2019. Evidence of
microplastic accumulation in agricultural soils from sewage sludge disposal. Science of the Total
Environment, 671:411-420. https://doi.org/10.1016/j.scitotenv.2019.03.368
Crossman, J., R.R. Hurley, M. Futter and L. Nizzetto, 2020. Transfer and transport of microplastics
from biosolids to agricultural soils and the wider environment. Science of the Total Environment,
724:138334. https://doi.org/10.1016/j.scitotenv.2020.138334
de Souza Machado, A.A., C.W. Lau, W. Kloas, J. Bergmann, J.B. Bachelier, E. Faltin, R. Becker,
A.S. Görlich and M.C. Rillig, 2019. Microplastics can change soil properties and affect plant
performance. Environmental Science and Technology, 53:6044-6052.
https://doi.org/10.1021/acs.est.9b01339
Guo J.-J., X.-P. Huang, L. Xiang, Y.-Z. Wang, Y.-W. Li, H. Li, Q.-Y. Cai, C.-H. Mo and M.-H.
Wong, 2020. Source, migration and toxicology of microplastics in soil. Environment International,
137:105263. https://doi.org/10.1016/j.envint.2019.105263
Möller, J.N., M.G.J. Löder and C. Laforsch, 2020. Finding microplastics in soils: a review of
analytical methods. Environmental Science and Technology, 54 (4):2078-2090.
https://doi.org/10.1021/acs.est.9b04618
Piehl, S., A. Leibner, M.G.J. Löder, R. Dris, C. Bogner and C. Laforsch, 2018. Identification and
quantification of macro-and microplastics on an agricultural farmland. Scientific Reports, 8(1):17950.
https://doi.org/10.1038/s41598-018-36172-y
Provencher, J.F., J.C. Vermaire, S. Avery-Gomm, B.M. Braune and M.L. Mallory, 2018. Garbage in
guano? Microplastic debris found in faecal precursors of seabirds known to ingest plastics. Science of
the Total Environment, 644:1477-1484. https://doi.org/10.1016/j.scitotenv.2018.07.101
Qi, R., D.L. Jones, Z. Li, Q. Liu and C. Yan, 2020. Behavior of microplastics and plastic film residues
in the soil environment: a critical review. Science of the Total Environment, 703:134722.
https://doi.org/10.1016/j.scitotenv.2019.134722
Qi, Y., X. Yang, A.M. Pelaez, E.H. Lwanga, N. Beriot, H. Gertsen, P. Garbeva and V. Geissen, 2018.
Macro- and micro- plastics in soil-plant system: effects of plastic mulch film residues on wheat

AMAP Litter and Microplastics Monitoring Guidelines
68
(Triticum aestivum) growth. Science of the Total Environment, 645:1048-1056.
https://doi.org/10.1016/j.scitotenv.2018.07.229
Song, Y., C. Cao, R. Qiu, J. Hu, M. Liu, S. Lu, H. Shi, K.M. Raley-Susman and D. He, 2019. Uptake
and adverse effects of polyethylene terephthalate microplastics fibers on terrestrial snails (Achatina
fulica) after soil exposure. Environmental Pollution, 250:447-455.
https://doi.org/10.1016/j.envpol.2019.04.066
Wang, J., S. Coffin, C. Sun, D. Schlenk and J. Gan, 2019. Negligible effects of microplastics on
animal fitness and HOC bioaccumulation in earthworm Eisenia fetida in soil. Environmental
Pollution, 249:776-784. https://doi.org/10.1016/j.envpol.2019.03.102
Wang, W., J. Ge, X. Yu and H. Li, 2020. Environmental fate and impacts of microplastics in soil
ecosystems: progress and perspective. Science of the Total Environment, 708:134841.
https://doi.org/10.1016/j.scitotenv.2019.134841
Xu, B., F. Liu, Z. Cryder, D. Huang, Z. Lu, Y. He, H. Wang, Z. Lu, P.C. Brookes, C. Tang, J. Gan
and J. Xu, 2020. Microplastics in the soil environment: occurrence, risks, interactions and fate – a
review. Critical Reviews in Environmental Science and Technology, 50:2175-2222.
https://doi.org/10.1080/10643389.2019.1694822
Zhang, B., X. Yang, L. Chen, J. Chao, J. Teng and Q. Wang, 2020. Microplastics in soils: a review of
possible sources, analytical methods and ecological impacts. Journal of Chemical Technology and
Biotechnology, 95:2052-2068. https://doi.org/10.1002/jctb.6334
Zhou, Y., J. Wang, M. Zou, Z. Jia, S. Zhou and Y. Li, 2020, Microplastics in soils: a review of
methods, occurrence, fate, transport, ecological and environmental risks. Science of the Total
Environment, 748:141368. https://doi.org/10.1016/j.scitotenv.2020.141368
Zhu, B.-K., Y.-M. Fang, D. Zhu, P. Christie, X. Ke and Y.-G. Zhu, 2018. Exposure to nanoplastics
disturbs the gut microbiome in the soil oligochaete Enchytra euscrypticus. Environmental Pollution,
239:408-415. https://doi.org/10.1016/j.envpol.2018.04.017

AMAP Litter and Microplastics Monitoring Guidelines
69
2.5 Ice and snow (from lakes and rivers, glacier cores, sea ice) AUTHORS: ILKA PEEKEN, MARIA E. GRANBERG, ALESSIO GOMIERO, INGEBORG HALLANGER, AND KERSTIN
MAGNUSSON
2.5.1 Introduction
Both sea ice and snow in the Arctic are highly polluted with microplastics (MP; Obbard et al., 2014;
Peeken et al., 2018a; Bergmann et al., 2019; Kanhai et al., 2020; von Friesen et al., 2020). Sea ice
sequesters MP from the atmosphere (Bergmann et al., 2019; Allen et al., 2020) and from the
underlying seawater and acts as a temporary sink and transport vehicle of MP pollution (Peeken et al.,
2018a, Kanhai et al., 2020). Given the marked reduction in age, thickness, and extent of the Arctic
sea-ice cover in recent decades (Polyakov et al., 2012; Stroeve et al., 2012), it is likely that this
sequestered MP will be increasingly released into the pelagic Arctic and sub-Arctic systems.
2.5.2 Status of global science
Although MP have reached both polar regions (Isobe et al., 2017; Waller et al., 2017; Peeken et al.,
2018b; PAME, 2019), so far, detailed studies of MP have mainly been reported for Arctic sea ice and
snow (Obbard et al., 2014; Peeken et al., 2018a; Bergmann et al., 2019; Kanhai et al., 2020; von
Friesen et al., 2020). Currently nothing is known about the plastic pollution of other components of
the cryosphere, for example, Arctic lakes or glaciers (PAME, 2019). However, it is known that MP
deposited in alpine glaciers have concentrations comparable to those found in European marine and
coastal sediments (Ambrosini et al., 2019) and thus it can be anticipated they might also be found in
Arctic glaciers. A high atmospheric input for Arctic sea ice was also claimed by Geilfus et al. (2019),
who did find, near their university campus, through an open sea-ice tank experiment, high
concentrations of MP in the top layer of the ice. However, in situ sea-ice cores taken from the Baltic
Sea using the same method did not corroborate these results. This is in line with observations of
Arctic sea-ice cores lacking high concentrations of MP at the surface (Peeken et al., 2018a; Kanhai et
al., 2020). However, Bergmann et al. (2019) did find comparable high concentrations of MP in Arctic
snow, but with a very patchy distribution. In general, it seems to be difficult to assess the role of snow
in the deposition of plastic on sea ice because the history of the lain snow is difficult to identify.
Another source for MP accumulation on sea ice might be sea spray, which has recently been reported
to have high concentrations of MP (Allen et al., 2020) and might be a not yet accounted for source of
MP in sea ice.
A recent study by von Friesen et al., 2020 further showed higher concentrations of anthropogenic
microparticles close to wastewater outlets and in the marginal sea-ice zone. Currently, over four
million people live in the Arctic (Heleniak and Bogoyavlensky, 2014) and most have no proper waste
management or wastewater treatment. Thus, plastic debris from openly exposed waste disposal sites
and MP from treated and untreated wastewater enter the marine environment continuously
(Magnusson et al., 2016; Gomiero, 2019; Granberg et al., 2019) and could be a local source for sea-
ice contamination. Other local MP pollution sources in the Arctic are related to shipping, fisheries,
and tourism, particularly cruise ships (PAME, 2019). Typical polymers from activities like
varnishing, e.g., polyamide and polyethylene, were traced as very small MP in Arctic sea ice (Peeken
et al., 2018a).
In the Arctic, particular riverine input of MP might be an important source, but has so far not been
investigated (PAME, 2019). Large fractions of Arctic sea ice grow on the shallow shelves, where

AMAP Litter and Microplastics Monitoring Guidelines
70
riverine tracers are incorporated into the sea ice (e.g., Laukert et al., 2017), and potential MP with
riverine origin can easily be transported far from their sources even in the Fram Strait (Peeken et al.,
2018a; Teckmann et al., 2020). Given 11 % of the global riverine discharge enters the Arctic Ocean
(Fichot et al., 2013), Russian and Canadian rivers are likely to constitute important local pathways for
sources of MP to the Arctic Ocean and the sea ice.
Microplastics are also transported to the Arctic by air and ocean currents from distant sources (Lusher
et al., 2015; Bergmann et al., 2019). Peeken et al., 2018a showed that various ocean currents have a
unique MP composition imprint and the drifting sea ice thus is a local temporal sink and a
redistributor of MP in the Central Arctic. Once they enter the major outflow gateways of the Arctic,
MP are likely released in the marginal ice zone (MIZ; Obbard et al., 2014; Peeken et al., 2018a; von
Friesen et al., 2020). Deposition of MP from the MIZ into deep-sea sediments was proposed by
Bergmann et al., 2017 at the northern HAUSGARTEN site in the Fram Strait, which was further
corroborated by a study from Teckmann et al., 2020 modeling the pathways of MP in the water
column found in the Fram Strait. However, the ultimate fate of MP released from sea ice at the MIZ
has not been investigated.
2.5.3 Trends to date
Microplastics compete with sea-ice algae when colonizing the sea ice (Hoffmann et al., 2020). Thus,
it is important to understand the role of MP in sea ice; however, more studies are needed to describe
trends in MP pollution. The four previous studies on Arctic sea ice show differences regarding the
contamination concentrations (Obbard et al., 2014; Peeken et al., 2018a; Kanhai et al., 2020; von
Friesen et al., 2020), however they are not comparable because of the different methods used and
sizes reported. Methodology also differs between the investigations, which affects the final data
obtained. When focusing only on numbers of particles, the concentration of MP would have increased
dramatically between cores taken around 2005 (Obbard et al., 2014) and 10 years later (Peeken et al.,
2018a). However, a new study focusing again on visible particles showed similarly low numbers,
more comparable to the first study (Obbard et al., 2014; Kanhai et al., 2020). Most particles found in
the Peeken et al., 2018a study, using µFTIR, were particles below 50 µm, which are overlooked with
the visible observations, and explains the main differences between the studies (for detailed method
comparison see Section 4.3).
To date, there are no pan-Arctic observations of MP in sea ice that would allow researchers to
distinguish between the Atlantic and the Pacific inflow into the Arctic. Most sea ice of the European
Arctic margin is influenced by drift ice formed on the Siberian shelves via the Transpolar Drift
(Serreze et al., 1989), which is due to the offshore winds producing large polynyas, considered the
main ice factory in the Arctic (Reimnitz et al., 1994). During its growth, the ice incorporates particles
from the underlying water. However, currently there are no real studies on multiyear sea ice, which
might have gone through several thawing/freezing life cycles. The interpretation of MP entrapment
during these different life stages might get difficult and would require more research.

AMAP Litter and Microplastics Monitoring Guidelines
71
2.5.4 Benefits
The main benefit to studying first and second year sea ice is that it could easily be incorporated into
ongoing sea-ice research programs, which would only require that more ice cores be drilled for the
MP analysis. Because the particles are trapped in the sea-ice matrix, all precautions to avoid any
contamination can be done in a specially equipped laboratory prior to analyzing the samples. Thus, no
special training for people working in the field is needed. The study of sea ice provides important
advantages in assessing global warming and Arctic ecological sustainability associated with MP
because it will shed some light on pollutants associated with the MP (e.g., chemical additives) that
might accumulate on the surface of the Arctic Ocean. It would further allow the study of feedback
mechanisms, e.g., due to enhanced melting caused by the increase of black tire-originating MPs and
could help to understand the role of MP in biogeochemical cycles of the Arctic Ocean.
Another benefit to studying sea ice would be the accumulation of MP particles in the sea ice
compared to oceanic water samples. By applying the backtracking approach of the sampled sea ice,
the general origin and drift path of the sea ice can be retraced (Krumpen et al., 2016), thus allowing
the distinction of various sources for the contamination. Even ice-core samples that were taken
proximal to each other can have a different sea-ice origin. By combining the backtracking with 1-D
sea-ice growth models, it is possible to elucidate the source region of the sampled ice and also the
location at which different types of polymers were imbedded into the sea ice (Pfirman et al., 2004;
Peeken et al., 2018a).
2.5.5 Limitations
It is currently unknown how representative the sampling of individual cores is for an entire floe or
region. Particularly in regions where the ice is quite dynamic, it can be extremely difficult to achieve a
proper sampling site. Because pack ice is a moving target, year-to-year changes might be an effect of
various sea-ice origins rather than changes in MP pollution. In addition, the season of sampled ice has
a large influence on the sampling because in the summer, the ice floes are subject to deformation that
is more dynamic across a given sampling area, whereas a denser ice cover in the spring reduces this
impact (Renner et al., 2014). Thus, land-fast ice might be a more reliable environment to monitor MP
accumulation. However, given the backtracking approach, by regularly monitoring pack ice we could
gather data to distinguish the impact of release of MP at outflow gateways of the Arctic from other
sources, and thus elucidate general pathways of MP entry and release in the Arctic (Peeken et al.,
2018a).
So far, only four studies on Arctic sea-ice research have been carried out and thus, we are still lacking
the measures on how to properly treat samples in the field and in the laboratory.
Unlike ice, snow cannot be tracked back to an individual ice floe and thus any MP contamination of
snow should be studied with wet deposition samplers at locations where all other variables for
atmospheric input are also monitored. Deformed snow in its compressed form, which is found on
glaciers, would not be an ideal monitoring subject, but could be used for the assessment of the
temporal impact of MP on various remote areas and could further improve the estimates of
atmospheric input. However, glacier sampling would also involve another set of methods to
accurately estimate accumulation rates of the snow, which can vary a lot from year to year (Hodgkins
et al., 2005).

AMAP Litter and Microplastics Monitoring Guidelines
72
Through their often-massive watersheds and the variation in their annual release to marine waters,
rivers play a crucial role in the overall freshwater budget of the Arctic. For parts of the year, the rivers
are frozen, which would allow for some regular sampling during the winter period. However, it is yet
to be determined whether large volume pump samples or frozen samples would produce the best
samples to monitor this environment.
In summary, little information is available for the Arctic cryosphere and thus current
recommendations will change as the field progresses.
2.5.6 Methods
Sampling of Arctic sea-ice cores
Sampling is preferably carried out annually in the spring in the sub-Arctic and lower Arctic regions
and in the summer in the higher Arctic, when remote areas are more accessible. Sampling should be
performed using traditional coring techniques, such as Kovacs 9 cm diameter corer (Kovacs,
Enterprise, Roseburg, USA) used by, e.g., Obbard et al., 2014 and Peeken et al., 2018a. The snow
should be removed before drilling the sea-ice cores. To prevent contamination with fibers from
gloves, it is recommended to use colored Nitrile gloves during drilling. To make the process feasible
for non- MP experts, one way to store the samples is in plastic bags (e.g., polyethylene tube films
(LDPE) by Rische and Herfurth). Metal containers are also appropriate; and all cores should be stored
at -20 °C prior to analysis. If possible, replicates should be taken, and monitoring programs
particularly interested in mass (weight)-based budget of MPs in sea ice might want to collect a large
number of ice cores to account for the more randomly distributed large particles. Additional ice cores
from the same ice sheet should be collected to determine the biogeochemistry and history of the
sampled sea ice.
Microplastics sample preparation
To prevent contamination of samples, handling and processing the sea-ice cores should be conducted
under a clean bench or in a clean room. To exclude sample contamination from field sampling,
transport, and storage, the surface of the ice core’s outer layer should be removed prior to sectioning
the core. Depending on the monitoring purpose, entire cores or individual sections should be melted in
glass jars prior to filtration. The sectioning of the cores prior to melting is dependent on the results
provided by the auxiliary parameters. Usually, the bottom section could be 5 cm and other sectioning
should not go below 20 cm when using a standard Kovacs 9 cm diameter corer. The melted sea ice
should be filtered and subjected to MP investigations. Currently, no standard methods are agreed upon
and further details for visual inspection followed by FTIR can be found in Kanhai et al., 2020,
whereas the details for µFTIR analyses, including very small particles (< 50 µm), are given in Peeken
et al., 2018a. Given the high concentrations of very small particles in sea ice, studies of very small
MP particles or even nanoplastic particles are highly recommended to study plastic contamination in
this biome.
Blank test
So far, no standard applications for MP measurements in sea-ice cores have been established,
therefore, best practices of other matrices should be applied. This involves a blank in the field (e.g.,
by placing open Petri dishes with wet tissues in the area of the coring site), blank samples during

AMAP Litter and Microplastics Monitoring Guidelines
73
sample preparation in the laboratory, and blank samples of the storage bags. Once the community has
agreed upon standards, this document can be updated.
2.5.7 Plastic identification
Given the high number of small particles in sea ice, observations with µFTIR microscopes (imaging
FTIR) should be the preferred identification method of MP in sea ice. Other identification methods
involve Raman microscope (imaging Raman) or thermal degradation methods (pyr-GC/MS). Details
about the quantification and identification within each method are given in Section 4.3.
2.5.8 Existing monitoring for populations/contaminants in the Arctic
As of today, there are no official monitoring sites of sea ice (PAME, 2019). Monitoring could be
implemented at the various pan-Arctic research stations (Figure 2.3) by collecting extra cores for MP.
Current regular sea-ice sampling occurs in the Hudson Bay, near Cambridge Bay, and in Northern
Baffin Bay. Another targeted area could be NE Greenland in the outflow of sea ice from the Arctic
Ocean. At Young Sound (Daneborg/Zackenberg stations 74º N), it is possible to collect drifting sea
ice during the summer months. The ice outside the fjord represents a mixture of ice exported from the
Arctic Ocean. In addition, regular sampling campaigns like the ones occurring in Fram Strait (FRAM
pollution observatory) could monitor the outflow of Arctic sea ice. Also, selected fjords on Svalbard
or reoccurring Central Arctic cruises done by several nations could include additional sea-ice core
sampling for MP.
Figure 2.3 Map of potential monitoring sites for sea-ice coring at existing research stations or
recurring research campaigns.

AMAP Litter and Microplastics Monitoring Guidelines
74
2.5.9 Suggestions for future activities/knowledge gaps
Microplastic pollution of sea-ice cores is still in the exploration phase and therefore it is
recommended that regular sea-ice sampling be accompanied by additional MP sampling. This should
involve sea-ice cores with several replicates per station at the main inflow and outflow gateways of
the Arctic as well as on major drift paths, such as the Transpolar Drift or the Beaufort Gyre. In
addition, land-fast ice areas, e.g., Alert or sites in Greenland, could be target areas to increase future
monitoring sites. Land-fast ice will be of particular value to monitor local contamination sources.
Given that only four studies for MP in Arctic sea ice exist, it can be anticipated that the one-year
sampling of sea ice, under ice water, and sea-ice fauna during the international one-year drift study,
MOSAIC, will improve our understanding of plastic pollution in sea ice and the adjacent habitats.
This unique data set might also give new insights about the value of monitoring sea ice in the Arctic.

AMAP Litter and Microplastics Monitoring Guidelines
75
Table 2.9 Summary of monitoring and research recommendations for sea-ice cores.
1st level (must do) 2nd level (should do)
Monitoring - Use opportunistic sites to collect sea-ice
cores for MP
Must have data
- Location
- Date
- Collection method
- Temperature and salinity of cores
- Ancillary biological data, such as
biomass
- Sea-ice type and section along the ice
core
- Polymer types and concentrations,
sizes, and shapes
Nice to have for all data
- Backtracking of sea-ice cores
- Polymer weight
- Particle color
- 1-D model of polymer types
Research Study under ice water
together with sea-ice
cores
Perform experiments to
understand entrainment of
MP particles into sea ice
Study impact on sea-ice
biota
Improve the understanding of sea ice as a
sink and transport vehicle for MP pollution
in the Arctic
Table 2.10 Summary rationale for recommendations, including estimated costs for implementing
programs: 0 - already in place, $ - relatively inexpensive because of synergy with other projects but
needs to have some additional capacity; $$ - either networks and capacity will need to be developed;
$$$ - development of sampling networks, processing capacity, and reporting all need to be developed.
Recommendation Program
Cost Rationale
Sea ice analyzed for MP particles
mainly < 300 µm
- Useful for monitoring, in
alignment with atmospheric
input
- Understand the role of
sources and sinks
$$ Monitoring programs currently not in place for
sea-ice cores, but regular sampling of sea ice
could include sampling for MP. The main cost
involves processing and analyses of samples,
which can be quite costly thus two-dollar signs

AMAP Litter and Microplastics Monitoring Guidelines
76
References
Allen, S., D. Allen, K. Moss, G. Le Roux, V.R. Phoenix and J.E. Sonke, 2020. Examination of the
ocean as a source for atmospheric microplastics. PloS one, 15: e0232746.
https://doi.org/10.1371/journal.pone.0232746
Ambrosini, R., R.S. Azzoni, F. Pittino, G. Diolaiuti, A. Franzetti and M. Parolini, 2019. First evidence
of microplastic contamination in the supraglacial debris of an alpine glacier. Environmental Pollution,
253:297-301. https://doi.org/10.1016/j.envpol.2019.07.005
Bergmann, M., S. Mützel, S. Primpke, M.B. Tekman, J. Trachsel and G. Gerdts, 2019. White and
wonderful? Microplastics prevail in snow from the Alps to the Arctic. Science Advances, 5:eaax1157.
https://doi.org/10.1126/sciadv.aax1157
Bergmann, M., V. Wirzberger, T. Krumpen, C. Lorenz, S. Primpke, M.B. Tekman and G. Gerdts,
2017. High quantities of microplastic in Arctic deep-sea sediments from the HAUSGARTEN
Observatory. Environmental Science and Technology, 51:11000-11010.
https://doi.org/10.1021/acs.est.7b03331
Fichot, C.G., K. Kaiser, S.B. Hooker, R.M.W. Amon, M. Babin, S. Bélanger, S.A. Walker and R.
Benner, 2013. Pan-Arctic distributions of continental runoff in the Arctic Ocean. Scientific Reports,
3:1053. https://doi.org/10.1038/srep01053
Geilfus, N.-X., K.M. Munson, J. Sousa, Y. Germanov, S. Bhugaloo, D. Babb and F. Wang, 2019.
Distribution and impacts of microplastic incorporation within sea ice. Marine Pollution Bulletin,
145:463-473. https://doi.org/10.1016/j.marpolbul.2019.06.029
Gomiero, A. 2019. Plastics in the Environment. Intechopen, London, UK.
https://doi.org/10.5772/intechopen.75849
Granberg, M.E., L.W. von Friesen, L. Bach, F. Collard, J. Strand and G. W. Gabrielsen, 2019.
Anthropogenic Microlitter in Wastewater and Marine Samples from Ny-Ålesund, Barentsburg and
Signehamna, Svalbard. C 373, IVL Swedish Environmental Research Institute, Stockholm, Sweden.
[online] URL: https://pure.au.dk/portal/files/152355861/C373march.pdf
Heleniak, T. and D. Bogoyavlensky, 2014. Arctic populations and migration. In: J.N. Larsen and G.
Fondahl (Eds.). Arctic Human Development Report: Regional Processes and Global Linkages, pp. 53-
104. Nordic Council of Ministers, Copenhagen, Denmark. [online] URL: http://norden.diva-
portal.org/smash/get/diva2:788965/FULLTEXT03.pdf
Hodgkins, R., R. Cooper, J. Wadham and M. Tranter, 2005. Interannual variability in the spatial
distribution of winter accumulation at a high-Arctic glacier (Finsterwalderbreen, Svalbard), and its
relationship with topography. Annals of Glaciology, 42:243-248.
https://doi.org/10.3189/172756405781812718
Hoffmann, L., S.L. Eggers, E. Allhusen, C. Katlein and I. Peeken, 2020. Interactions between the ice
algae Fragillariopsis cylindrus and microplastics in sea ice. Environment International, 139:105697.
https://doi.org/10.1016/j.envint.2020.105697
AMAP Litter and Microplastics Monitoring Guidelines
77
Isobe, A., K. Uchiyama-Matsumoto, K. Uchida and T. Tokai, 2017. Microplastics in the Southern
Ocean. Marine Pollution Bulletin, 114:623-626. https://doi.org/10.1016/j.marpolbul.2016.09.037
Kanhai La Daana, K., K. Gardfeldt, T. Krumpen, R.C. Thompson and I. O’Connor, 2020.
Microplastics in sea ice and seawater beneath ice floes from the Arctic Ocean. Scientific Reports,
(Nature Publisher Group) 10. https://doi.org/10.1038/s41598-020-61948-6
Laukert, G., M. Frank, E.C. Hathorne, T. Krumpen, B. Rabe, D. Bauch, K. Werner, I. Peeken and H.
Kassens, 2017. Pathways of Siberian freshwater and sea ice in the Arctic Ocean traced with
radiogenic neodymium isotopes and rare earth elements. Polarforschung 87:3-13.
https://doi.org/10.2312/polarforschung.87.1.3
Lusher, A.L., V. Tirelli, I. O'Connor and R. Officer, 2015. Microplastics in Arctic polar waters: the
first reported values of particles in surface and sub-surface samples. Scientific Reports, 5:14947.
https://doi.org/10.1038/srep14947
Krumpen, T., R. Gerdes, C. Haas, S. Hendricks, A. Herber, L. Selyuzhenok, L. Smedsrud and G.
Spreen, 2016. Recent summer sea ice thickness surveys in Fram Strait and associated ice volume
fluxes. Cryosphere, 10:523-534. https://doi.org/10.5194/tc-10-523-2016
Magnusson, K., K. Eliasson, A. Fråne, K. Haikonen, J. Hultén, M. Olshammar, J. Stadmark and A.
Voisin, 2016. Swedish Sources and Pathways for Microplastics to the Marine Environment. A review
of existing data. C 183. IVL Swedish Environmental Research Institute, Stockholm, Sweden. [online]
URL:
https://www.ccb.se/documents/ML_background/SE_Study_MP_sources.pdf
Obbard, R.W., S. Sadri, Y.Q. Wong, A.A. Khitun, I. Baker and R.C. Thompson, 2014. Global
warming releases microplastic legacy frozen in Arctic Sea ice. Earth's Future, 2:315-320.
https://doi.org/10.1002/2014ef000240
Peeken, I., M. Bergmann, G. Gerdts, C. Katlein, T. Krumpen, S. Primpke and M.B. Tekman, 2018b.
Microplastics in the Marine Realms of the Arctic with Special Emphasis on Sea Ice. Arctic Report
Card 2018. National Oceanic and Atmospheric Administration, Washington, D.C., USA.
Peeken, I., S. Primpke, B. Beyer, J. Gütermann, C. Katlein, T. Krumpen, M. Bergmann, L. Hehemann
and G. Gerdts, 2018a. Arctic sea ice is an important temporal sink and means of transport for
microplastic. Nature Communications, 9:1505. https://doi.org/10.1038/s41467-018-03825-5
Pfirman, S., W. Haxby, H. Eicken, M. Jeffries and D. Bauch, 2004. Drifting Arctic sea ice archives
changes in ocean surface conditions. Geophysical Research Letters, 31(9).
https://doi.org/10.1029/2004gl020666
Polyakov, I.V., J.E. Walsh and R. Kwok, 2012. Recent changes of Arctic multiyear sea ice coverage
and the likely causes. Bulletin of the American Meteorological Society, 93:145-151.
https://doi.org/10.1175/bams-d-11-00070.1
Protection of the Arctic Marine Environment (PAME), 2019. Desktop Study on Marine Litter
Including Microplastics in the Arctic. Pame, Akureyri, Iceland. 114pp. [online] URL:

AMAP Litter and Microplastics Monitoring Guidelines
78
https://www.pame.is/images/03_Projects/Arctic_Marine_Pollution/Litter/Desktop_study/Desktop_Stu
dy_on_marine_litter.pdf
Reimnitz, E., D. Dethleff and D. Nürnberg, 1994. Contrasts in Arctic shelf sea-ice regimes and some
implications: Beaufort Sea versus Laptev Sea. Marine Geology, 119:215-225.
https://doi.org/10.1016/0025-3227(94)90182-1
Renner, A.H.H., S. Gerland, C. Haas, G. Spreen, J.F. Beckers, E. Hansen, M. Nicolaus and H.
Goodwin, 2014. Evidence of Arctic sea ice thinning from direct observations. Geophysical Research
Letters, 41:5029-5036. https://doi.org/10.1002/2014gl060369
Serreze, M.C., A.S. Mclaren and R.G. Barry, 1989. Seasonal variations of sea ice motion in the
transpolar drift stream. Geophysical Research Letters, 16:811-814.
https://doi.org/10.1029/gl016i008p00811
Stroeve, J.C., V. Kattsov, A. Barrett, M. Serreze, T. Pavlova, M. Holland and W.N. Meier, 2012.
Trends in Arctic sea ice extent from CMIP5, CMIP3 and observations. Geophysical Research Letters,
39(16). https://doi.org/10.1029/2012gl052676
Tekman, M.B., C. Wekerle, C. Lorenz, S. Primpke, C. Hasemann, G. Gerdts and M. Bergmann, 2020.
Tying up loose ends of microplastic pollution in the Arctic: distribution from the sea surface through
the water column to deep-sea sediments at the HAUSGARTEN Observatory. Environmental Science
and Technology, 54:4079-4090. https://doi.org/10.1021/acs.est.9b06981
von Friesen, L.W., M.E. Granberg, O. Pavlova, K. Magnusson, M. Hassellov and G.W. Gabrielsen,
2020. Summer sea ice melt and wastewater are important local sources of microlitter to Svalbard
waters. Environment International, 139:105511. https://doi.org/10.1016/j.envint.2020.105511
Waller, C.L., H.J. Griffiths, C.M. Waluda, S.E. Thorpe, I. Loaiza, B. Moreno, C.O. Pacherres and
K.A. Hughes, 2017. Microplastics in the Antarctic marine system: an emerging area of research.
Science of the Total Environment, 598:220-227. https://doi.org/10.1016/j.scitotenv.2017.03.283
Glacier face Croker Bay, Nunavut, Canada
AMAP Litter and Microplastics Monitoring Guidelines
79
2.6 Litter on Arctic and sub-Arctic shorelines AUTHORS: JAKOB STRAND, LOUISE FELD, PETER MURPHY, MAX LIBOIRON, AND BJØRN EINAR GRØSVIK
2.6.1 Introduction
Monitoring of marine macrolitter, often also called marine debris, on shorelines is a widely used
environmental indicator. It provides data for spatial and temporal assessments, such as amounts,
composition, and pathways. Potentially, monitoring can also provide data on the risk of harmful
effects of litter mainly in marine environments, and likely it could also be applied to larger freshwater
systems. This information can also be used to identify important litter sources and thereby relevant
actions for effective mitigating measures and to evaluate the effectiveness of existing legislation and
regulations.
Litter is defined as any persistent, manufactured, or processed solid material directly or indirectly,
intentionally or unintentionally, discarded, disposed of, abandoned, or lost in the marine and coastal
environments. This also includes marine litter entering the marine environment via rivers, sewage
outlets, storm-water outlets, or winds (OSPAR, 2010; Opfer et al., 2012). Macrolitter surveys on
shorelines are looking for items larger than 2.5 cm. However, some types of smaller mesoplastic
particles within the size range of 5-25 mm, such as industrial pellets, different specific small items, as
well as fragments, can in some cases also be registered during surveys, although not always in the
same quantitative manner. Microplastics (MP) can also be monitored on shorelines but see Section 2.3
for a more detailed description of those methods.
The shoreline is the interface between land and sea and is an important compartment for monitoring
(GESAMP, 2019), because it is:
(i) where marine litter is often present in larger quantities;
(ii) often closer to land-based sources; and,
(iii) most accessible.
As a result, shorelines are typically the first environmental compartment considered for quantifying
marine litter.
2.6.2 Status of global science
Many countries across different continents have implemented monitoring programs for marine litter
on shorelines. Coordination of these programs occurs at different organizational levels through
frameworks such as the European Marine Strategy Framework Directive, the US NOAA Marine
Debris Program, and by regional sea conventions. The Group of Experts on Scientific Aspects of
Marine Environmental Protection has also published suggested guidelines for the monitoring and
assessment of plastic litter and MP in the ocean (GESAMP, 2019). In addition, efforts are ongoing to
harmonize surveys and obtain data on marine litter pollution that are comparable at larger scales. This
implies that the larger frameworks for monitoring marine litter on shorelines are relatively
standardized, but that some national and regional variation in protocols exist. These shoreline
monitoring activities, relevant at both spatial and temporal scales, are necessary to assess if there are
changes in conditions that need to be addressed through management or policy. This could, for
instance, involve implementation or adjustments to local, national, or regional action plans to reduce
plastic pollution.
AMAP Litter and Microplastics Monitoring Guidelines
80
In different parts of the Arctic, some knowledge of amounts, distribution, composition, and sources of
marine litter on shorelines already exists, but this knowledge is relatively fragmented and to a large
extent based on non-coordinated efforts. The information gathered comes from surveys carried out by
researchers, environmental institutions, or dedicated citizen science communities according to various
standardized monitoring protocols, from assessments of litter items collected by volunteers, or from
coastal clean-up campaigns. Using existing monitoring frameworks will be advantageous for time
series consistency and data comparability, however, these same existing frameworks can also be
challenging to further harmonization and more detailed comparisons because of data generated with
different monitoring methods.
2.6.3 Trends to date
The experience and results collected from Arctic activities on marine litter assessments are reviewed
in the recent desktop study by PAME, 2019. The study concludes that the availability of data still
represents an insufficiency in numbers, timeline, geographical coverage, and comparability of surveys
to determine trends in amounts, distribution, and composition of shoreline litter in Arctic areas. Being
able to assess trends for marine litter on Arctic shorelines requires the establishment of a more
coordinated monitoring effort, which should comprise more comparable standardized surveys carried
out throughout the Arctic as performed within other Regional Seas Conventions, e.g., OSPAR and
HELCOM.
2.6.4 Pros and cons of monitoring
Benefits
Litter on shorelines can give a good indication of sources, origins, and pathways of plastics and other
types of litter in the environment because identification of (macro) litter items larger than 2.5 cm is
relatively easy compared to, e.g., analyzing micro- and mesolitter particles. However, some
identifiable items with sizes below 2.5 cm like cigarette butts and small lids can still be recorded
according to protocols. In addition, shorelines are present in all geographic areas, and data can be
collected with relatively both time-efficient and cost-effective efforts. Hence, surveys do not require
expensive laboratory equipment and can also be performed by non-academic personnel following
basic instructions and quality assessment/quality control (QA/QC) procedures.
Limitations
Arctic shorelines are often located in remote areas that are difficult to access because of infrastructure
and the rugged nature of the landscape. In some regions, beach-like shorelines do not exist, but
instead the shorelines are comprised of rocks and pebbles. Morphology of shorelines can therefore
vary and affect surveys. Moreover, the shorelines can be covered by ice and snow during long periods
of the year, thus preventing survey activities.
Different monitoring protocols are currently applied (e.g., OSPAR and NOAA MDMAP protocol),
which can be challenging or can require additional effort when combining data for circumpolar
assessments. In addition, not all Arctic relevant litter items may currently be included in the existing
items lists.

AMAP Litter and Microplastics Monitoring Guidelines
81
2.6.5 Methods
Monitoring strategy
The Arctic area is characterized by a low population density, a less developed infrastructure, and
harsh climatic conditions. These special conditions call for particular attention in the design and
establishment of shoreline marine litter monitoring programs for the Arctic. Some shoreline litter
surveys have been conducted in different Arctic regions using the internationally recommended
OSPAR (OSPAR, 2010) or NOAA (Opfer et al., 2012) protocols, although often with some
modifications. In the NOAA guidelines, only data generated for the “accumulation studies,” in which
all litter items on the full shoreline segment are removed, generate data similar to data generated using
the OSPAR guidelines. The “standing-stock studies” in the NOAA guidelines provide data for marine
litter left on the shoreline and not collected. This type of survey poses challenges for a wider pan-
Arctic survey strategy because it would complicate data comparisons. These different monitoring
strategies are also outlined in GESAMP, 2019.
Advantages and limitations for the adaptation of predetermined criteria in the OSPAR and NOAA
monitoring guidelines, along with other relevant criteria, are considered with regard to
implementation in an Arctic monitoring strategy (Table 2.11). These include:
• the shoreline typography and location of the shoreline (e.g., urban/populated vs.
reference/remote),
• survey frequencies and the importance of continuity in monitoring surveys on selected
shorelines,
• the expertise of the monitoring personnel,
• categories used for the registration of the different predefined litter items,
• units for reporting data, and
• the quality assurance of the surveys.
These criteria can be important for data comparison in wider regional assessments of shoreline litter in
the Arctic.
In addition, it is important that a full survey unit of the shoreline, preferably 100 m, is surveyed, i.e.,
from the water’s edge to the back of the beach, as defined by physical structures such as a transition
zone to dunes, vegetation, rocks, etc., so that litter accumulated during more extreme weather events
are recorded. For continuous monitoring efforts, GPS reference points must be used to ensure that
exactly the same survey site is monitored during each survey.

AMAP Litter and Microplastics Monitoring Guidelines
82
Table 2.11 Summary of monitoring strategy with regard to recommended criteria for selection and
conduction of marine litter surveys on Arctic shorelines.
Coastal morphology Beach-like shoreline with sand, gravel, pebbles, or stones of different
sizes, but not shorelines with cliffs. Preferably with clear depositional
wash-up lines from both normal tidal conditions as well as more
extreme weather conditions.
Length of survey segment 100 m defined by start and end GPS positions, but shorter segments as
low as 50 m can be accepted, if limited by rocky shores.
Type of shorelines Reference shorelines located in remote areas, preferably at an outer
coastline (not inner fjords) and pointing toward the open sea.
Locally impacted shorelines, e.g., from urban activities.
Definition of survey area From the waterline to the back of the beach including the zone
deposited during high-water levels caused by stormier conditions.
Slippery areas due to settlement of, e.g., bladderwrack on stones
below the normal waterline in the tidal zone can be excluded because
of unsafe conditions for litter collection. A consistent and well-
defined survey area of the shoreline should be identified for temporal
monitoring.
Accessibility and survey
frequency
The coastline should be accessible from land or by a boat.
At least 1-2 seasonal surveys can be performed per year per location,
i.e., summer (May-July) and/or autumn (August-October).
Collection and registration
of litter items
All man-made litter items sized > 2.5 cm should be collected and
identified according to types of litter described in either the NOAA or
OSPAR guidelines.
Removal of litter items Should be accessible for ease of marine litter removal. Larger litter
items might be moved inland away from the shoreline, if team is not
able to transport these items to an appropriate waste disposal site, so
the items are not registered again during the next survey. Items too
large to move should be marked on site in a way that they won’t be
registered again.
Selection of survey locations
The first criterium for the selection of a survey location is the coastal morphology. Beach-like
shorelines, to a large extent, receive marine litter and other debris washed ashore from the sea and are
easier and safer to thoroughly examine than rocky shores. However, in many parts of the Arctic, the
shorelines will be dominated by rocks and cliffs, and beach-like coastal segments dominated by
pebbles or different-sized stones will only occur in smaller, bay-like environments. The occurrence of
sandy beaches, which are often preferred for international beach litter monitoring programs, are
scarcer in the Arctic, although in some areas they do occur, e.g., in Alaska. In addition, these beach-
like segments are often limited by rocky shores and therefore not always a full 100 m in length.
Therefore, shorter shoreline segments should be accepted for Arctic monitoring even though a 100 m
segment is the recommend length in the OSPAR and NOAA guidelines. Data then have to be
normalized to 100 m before data generated for different shoreline lengths can be compared.
The second criterium is the selection of a survey location based on the expected relative impact from
different litter sources. The location can be chosen because the shoreline predominantly receives litter

AMAP Litter and Microplastics Monitoring Guidelines
83
washed ashore from the open sea (reference shoreline), or because the shoreline is impacted by
contributions from local sources. Hence, the amounts and composition of marine litter can depend on
both the geographical location relative to marine and land-based activities occurring in close
proximity and the dominant hydrological conditions and wind regimes that will transport litter from
the sea. This implies that the selection of the survey locations can be determinative for the marine
litter data that are collected. In the design of a monitoring program for shoreline marine litter, the type
of information preferred or required from the effort should therefore be considered.
An appropriate reference shoreline is ideally located in a remote area with no visible human activity
nearby, preferably on an outer coastline (not inner fjords), and pointing toward the open sea, thereby
mainly reflecting the pressures from long-range transport, sea-based-activities, and a more diffuse
distribution of litter from land-based local sources. These characteristics allow for a reference value of
litter deposition that does not receive an over-representative amount of litter from local or distance
sources.
In contrast to this, the selection of so-called urban beaches located in the vicinity of towns and smaller
settlements, including harbors, sewage effluents, and open dump sites, will reflect the impact of local
litter sources. The ability and precision in the identification of either local or regional/international
sources of litter to the marine environment can thus be influenced from the types and locations of
beaches included in the monitoring program. Identification of litter sources is a prerequisite for
implementation of targeted actions toward the reduction of these. Determination of the efficiency of
the actions also requires measures of the amounts of litter released from the source or trends of the
amounts and composition observed in the marine environment.
The third criterium is that the shoreline be accessible from land or by a boat, so it can be revisited for
future surveys on a yearly basis.
Definition of survey area
A clear definition of the survey area and the units used for registration of the shoreline litter are
essential to make the data comparable. The survey area preferably should be 100 m sections parallel
to the waterline (see monitoring type, below), but an adaption to Arctic conditions should include
lengths of less than 100 m based on accessibility. The width of the monitoring area is from the water’s
edge to the back of the beach/shoreline, characterized by the first presence of dunes, rocks, or a
vegetation line. For Arctic beaches, a clear shift in the primary substrate or the presence of a barrier is
often less visible. Therefore, the width could be the part of the beach directly affected by marine water
fluctuations including the zone deposited under high-water levels and high winds. Slippery areas can
be excluded because of unsafe conditions for litter collection.
Frequency of monitoring surveys
In the Arctic, climatic conditions shorten the feasible period for beach litter monitoring. Hence, during
winter and spring, access to the beaches, particularly the reference beaches, can be very difficult or
even impossible. Furthermore, ice and snow cover can disable monitoring. These challenges may
limit the annual monitoring frequency.
The feasible number of surveys under Arctic conditions may only be one to two surveys per beach per
year. This is lower than in the OSPAR guidelines, in which four monitoring surveys per beach are
recommended (winter, spring, summer, and autumn) or the NOAA protocol in which monthly surveys

AMAP Litter and Microplastics Monitoring Guidelines
84
are recommended. Allowing fewer monitoring surveys per year will affect the confidence in deriving
baseline levels and assessing trends for the Arctic. For instance, it has recently been recommended for
EU Marine Strategy Framework Directive (MSFD)-oriented assessments that national and
subregional baseline levels be based on median-values of data from a minimum of 40 monitoring
surveys within a 6-year monitoring period because this constitutes an optimum point for achieving a
reasonable confidence interval width (van Loon et al., 2020). The median assessment value is robust
against extreme values, which frequently occur in shoreline litter monitoring. Further analyses are
therefore needed to assess the implications of fewer available AMAP-relevant survey data on the
statistical power of trend analyses. This should be considered when designing monitoring strategies
for litter on shorelines in Arctic and sub-Arctic regions.
Litter registration
For shoreline litter surveys in the Arctic, recording of litter items has predominantly been performed
according to the OSPAR guidelines (e.g., data from Norway, Greenland, and Iceland) and the NOAA
guidelines (e.g., data from Alaska and Canada). These two guidelines provide different litter item
lists. The NOAA guidelines include descriptions of 44 different litter types divided into 6 material
categories, whereas the OSPAR list from 2010 includes descriptions of 111 different litter types
divided into 12 material categories. In addition, since 2018, OSPAR has started to extend the item list,
which will be integrated into the Joint List of Litter Categories for Marine Macrolitter Monitoring
prepared for shoreline litter monitoring under the MSFD in Europe (Fleet et al., 2021).
Subsequently, the description of litter items in the OSPAR and NOAA guidelines do not match and
used separately, the two guidelines will generate different information on the composition of different
types of litter items including, e.g., generation of top 10 list of the most often registered litter items.
Therefore, if wider Arctic assessments want to include and compare marine litter data generated with
both guidelines, some level of aggregation of litter types is needed to generate a more comparable
dataset. Table 2.12 shows a proposal for how such an aggregation of litter items could be done.

AMAP Litter and Microplastics Monitoring Guidelines
85
Table 2.12 Proposal for aggregation of litter types described in the NOAA and OSPAR guidelines to prepare a more comparable dataset. Aggregated name for litter types
NOAA litter types OSPAR litter types NOAA + OSPAR codes OSPAR material category
NOAA material category
plastic/polystyrene pieces (> 2.5 cm)
N1a, 1b, 1c – plastic fragments (hard, foamed, film)
45 - foam sponge 46 - plastic/polystyrene pieces 2.5-50 cm 47 - plastic/polystyrene > 50 cm
N1a, N1b, N1c, 45, 46, 47 plastic plastic
drinks (bottles, containers, and drums)
N3 – beverage bottles 4 - drinks (bottles, containers, and drums) N3, 4 plastic plastic
food package and assorted jugs and containers
N2 - food wrappers, N4 - other jugs or containers
5 - cleaner (bottles, containers, and drums) 6 - food containers incl. fast food containers 8 - engine oil containers and drums < 50 cm 9 - engine oil containers and drums > 50 cm 10 - jerry cans (square plastic container with handle) 11 - injection gun containers 12 - other bottles, containers, and drums 13 - crates 34 - fish boxes 38 – buckets 19 - crisps/sweet packets and lolly sticks
N2, N4, 5, 6, 8, 9, 10. 11, 12, 13, 19, 34, 38, 27
plastic plastic
27 - octopus pots ? plastic plastic
caps/lids N5 - bottle or container caps 15 - caps/lids N5, 15 plastic plastic
cigarettes and buds N7 - cigarettes 64 - cigarette buds N7, 64 paper/cardboard plastic
cigarette lighters N8 - disposable cigarette lighters
16 - cigarette lighters N8, 16 plastic plastic
4/6 pack yokes N9 - 6-pack rings 1 - 4/6-pack yokes N9, 1 plastic plastic
bags N10 – bags 2 - bags (e.g., shopping) 3 - small plastic bags, e.g., freezer bags 112 - plastic bag ends 121 - bagged dog feces 23 - fertilizer/animal feed bags
N10, 2, 3, 112, (23) plastic plastic
rope, string, small nets (incl. pieces)
N11 - plastic rope/small net pieces
31 - rope (diameter > 1 cm) 32 - string and cord (diameter < 1 cm) 115 - nets and pieces of net < 50 cm 116 - nets and pieces of net > 50 cm 33 - tangles nets/cord/rope and string 28 - oyster nets or mussel bags incl. plastic stoppers
N11, 31, 32, 115, 116, 33, 28 plastic plastic
floats/buoys N12 - buoys and floats 37 - floats/buoys N12, 37 plastic plastic
fishing lures and lines N13 - fishing lures and lines 35 - fishing lines (angling) N13, 35 plastic plastic
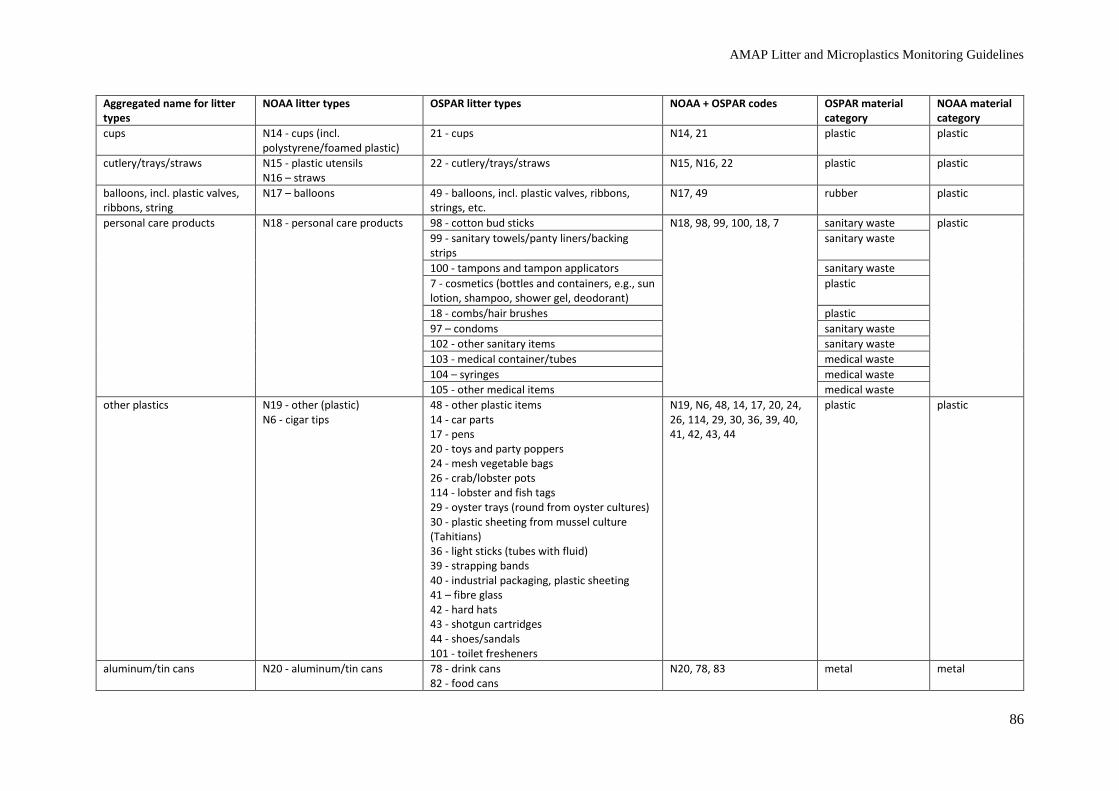
AMAP Litter and Microplastics Monitoring Guidelines
86
Aggregated name for litter types
NOAA litter types OSPAR litter types NOAA + OSPAR codes OSPAR material category
NOAA material category
cups N14 - cups (incl. polystyrene/foamed plastic)
21 - cups N14, 21 plastic plastic
cutlery/trays/straws N15 - plastic utensils N16 – straws
22 - cutlery/trays/straws N15, N16, 22 plastic plastic
balloons, incl. plastic valves, ribbons, string
N17 – balloons 49 - balloons, incl. plastic valves, ribbons, strings, etc.
N17, 49 rubber plastic
personal care products N18 - personal care products 98 - cotton bud sticks N18, 98, 99, 100, 18, 7 sanitary waste plastic
99 - sanitary towels/panty liners/backing strips
sanitary waste
100 - tampons and tampon applicators sanitary waste
7 - cosmetics (bottles and containers, e.g., sun lotion, shampoo, shower gel, deodorant)
plastic
18 - combs/hair brushes plastic
97 – condoms sanitary waste
102 - other sanitary items sanitary waste
103 - medical container/tubes medical waste
104 – syringes medical waste
105 - other medical items medical waste
other plastics N19 - other (plastic) N6 - cigar tips
48 - other plastic items 14 - car parts 17 - pens 20 - toys and party poppers 24 - mesh vegetable bags 26 - crab/lobster pots 114 - lobster and fish tags 29 - oyster trays (round from oyster cultures) 30 - plastic sheeting from mussel culture (Tahitians) 36 - light sticks (tubes with fluid) 39 - strapping bands 40 - industrial packaging, plastic sheeting 41 – fibre glass 42 - hard hats 43 - shotgun cartridges 44 - shoes/sandals 101 - toilet fresheners
N19, N6, 48, 14, 17, 20, 24, 26, 114, 29, 30, 36, 39, 40, 41, 42, 43, 44
plastic plastic
aluminum/tin cans N20 - aluminum/tin cans 78 - drink cans 82 - food cans
N20, 78, 83 metal metal

AMAP Litter and Microplastics Monitoring Guidelines
87
Aggregated name for litter types
NOAA litter types OSPAR litter types NOAA + OSPAR codes OSPAR material category
NOAA material category
aerosol/spray cans N21 - aerosol cans 76 - aerosol/spray cans N21, 76 metal metal
other metal N22 - metal fragments N23 - other (metal)
89 - other metal pieces > 50 cm 90 - other metal pieces < 50 cm 77 - bottle caps 120 - disposable BBQs 79 - electric appliances 80 - fishing weights 81 - foil wrappers 83 - industrial scrap 84 - oil drums 86 - paint tins 87 - lobster/crab pots and tops 88 - wire, wire mesh, barbed wire
N22, N23, 77, 120, 79, 80, 81, 83, 84, 86, 87, 88, 89, 90
metal metal
N24 - beverage bottles 91 – bottles glass glass
other glass N25 - jars N25, N26, N27, 93, 92 glass
N26 - glass fragments
N27 - other (glass) 93 - other glass items glass
92 - light bulbs/tubes glass
gloves N29 - gloves (rubber) 25 - gloves (typical washing up gloves) 113 - gloves (industrial/professional gloves)
N29, 25, 113 plastic rubber
tires and belts N30 - tires 52 - tyres and belts N30, 52 rubber rubber
other rubber N28 - flip flops (rubber) N28, N31, N32, 53, 50 rubber rubber
N31 - rubber fragments
N32 - other (rubber) 53 - other rubber pieces
50 - boots
cardboard cartons N33 - cardboard cartons 118 - cartons, e.g., tetrapak (milk) 62 - cartons, e.g., tetrapak (other) 63 - cigarette packets
N33, 118. 62 paper/cardboard processed lumber
other paper and cardboard N34 - paper and cardboard 61 - cardboard 66 - newspapers and magazines 67 - other paper items 65 - cups
N34, 61, 66, 67, 65 paper/cardboard processed lumber
paper bags N35 - paper bags 60 - bags N35, 60 paper/cardboard processed lumber
processed wood N36 - lumber/building materials N37 - other (wood)
69 - pallets 74 - other wood < 50 cm 75 - other wood > 50 cm 68 - corks
N36, N37, 68, 70, 71, 119, 72, 73, 69, 74, 75
wood (machined) processed lumber
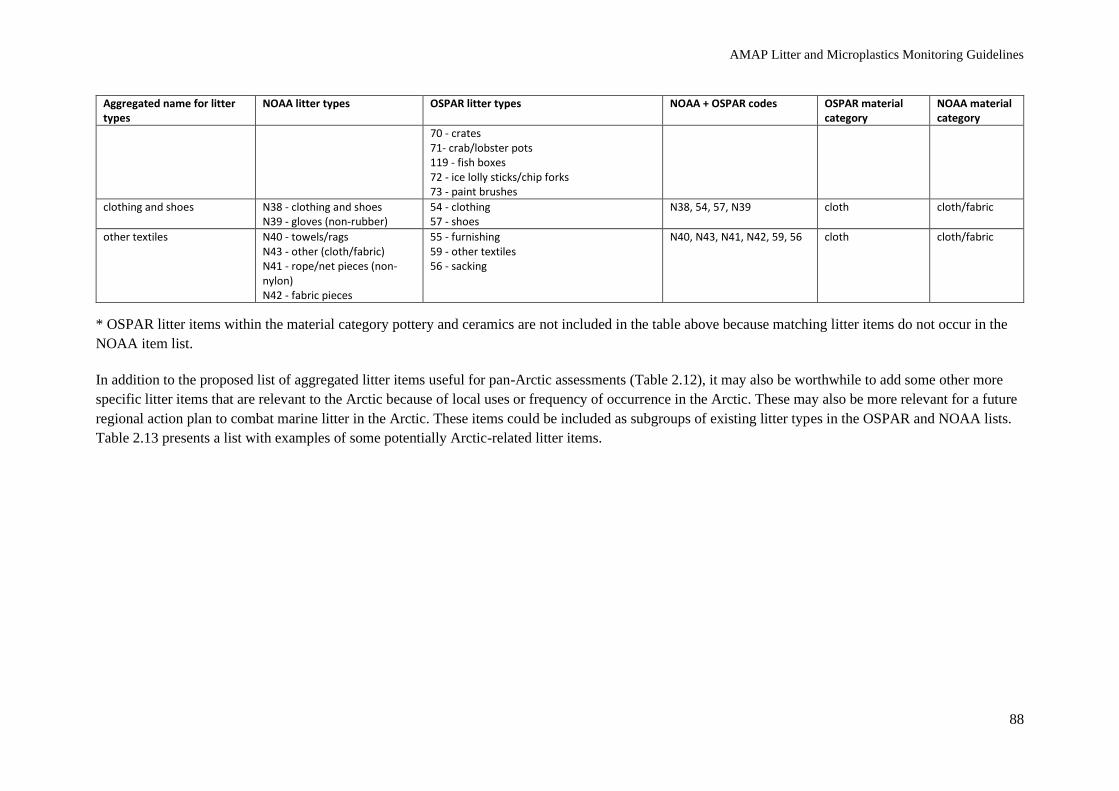
AMAP Litter and Microplastics Monitoring Guidelines
88
Aggregated name for litter types
NOAA litter types OSPAR litter types NOAA + OSPAR codes OSPAR material category
NOAA material category
70 - crates 71- crab/lobster pots 119 - fish boxes 72 - ice lolly sticks/chip forks 73 - paint brushes
clothing and shoes N38 - clothing and shoes N39 - gloves (non-rubber)
54 - clothing 57 - shoes
N38, 54, 57, N39 cloth cloth/fabric
other textiles N40 - towels/rags N43 - other (cloth/fabric) N41 - rope/net pieces (non-nylon) N42 - fabric pieces
55 - furnishing 59 - other textiles 56 - sacking
N40, N43, N41, N42, 59, 56 cloth cloth/fabric
* OSPAR litter items within the material category pottery and ceramics are not included in the table above because matching litter items do not occur in the
NOAA item list.
In addition to the proposed list of aggregated litter items useful for pan-Arctic assessments (Table 2.12), it may also be worthwhile to add some other more
specific litter items that are relevant to the Arctic because of local uses or frequency of occurrence in the Arctic. These may also be more relevant for a future
regional action plan to combat marine litter in the Arctic. These items could be included as subgroups of existing litter types in the OSPAR and NOAA lists.
Table 2.13 presents a list with examples of some potentially Arctic-related litter items.

AMAP Litter and Microplastics Monitoring Guidelines
89
Table 2.13 Some examples of marine litter items with higher Arctic relevance because of local uses
and sources. If included, separate reporting codes need to be defined. The list can be modified or
expanded over time based on inputs, e.g., from the process of developing the Arctic Regional Action
Plan (RAP).
Description NOAA code
or subgroup
of this
OSPAR
code or
subgroup of
this
Material
category
Melted plastic pieces, e.g., from outdoor incinerations N1a 46, 47, 117 Plastic
Detonating cords for explosives, incl. fragmented
pieces
N1a 46 Plastic
Aquaculture and animal feed bags N10 23 Plastic
Plastic sanitary bags N10 102 Plastic
Trawl net incl. pieces N11 115, 116 Plastic
Gill nets incl. pieces N11 115, 116 Plastic
Shotgun cartridges N19 43 Plastic
Riffle cartridges for holding bullets N19 (43) Plastic
With regard to source characterizations, in addition to grouping the items according to the material
categories, the litter types can potentially also be grouped according to their sources and uses. For
instance, OSPAR, 2010 has proposed a division of the litter items into the following source
categories:
• Fishery and aquaculture,
• Galley waste,
• Shipping and operational waste,
• Sanitary waste,
• Public littering (e.g., tourism),
• Not source characterized.
The assignment of shoreline litter items to different source categories can also be refined with detailed
knowledge of local source patterns and pathways, e.g., by a Matrix Scoring Technique based on the
likelihood that the litter items recorded originated from specific types of characterized sources (Tudor
and Williams, 2004; Schäfer et al., 2019).
Further developments in methods to perform source characterizations from shoreline litter data are
currently being assessed in different national and international frameworks. For instance, for the
European MSFD, a new framework with a Joint List of Litter Categories for Marine Macrolitter
Monitoring has recently been developed (Fleet et al., 2021), which provides a more detailed
identification of litter items and subsequently is better to address most of the relevant litter items
targeted in, e.g., the OSPAR regional action plan for marine litter, the European single-use plastic
directive, or the US state and regional action plans for marine litter.
Unit for litter registration
The general unit for reporting data should be the number of litter items recorded per survey, ideally in
a 100 m survey unit. For further comparison of data between different survey locations, data should
be normalized to the number of items per 100 m shoreline segments.
AMAP Litter and Microplastics Monitoring Guidelines
90
As a supplement, the weight of each material category and the total weight of all collected items per
100 m can be recorded.
Monitoring personnel
Preferably, trained personnel should conduct surveys at specifically selected shorelines, revisited with
regular frequency. This setup ensures high-quality monitoring data and more easily enables the
comparison of surveys and trend analyses. However, because access and surveying are difficult for
Arctic reference shorelines, the establishment of cross-linking networks with personnel involved in
other field activities in these remote areas may be valuable. The regularity of other field activities in
specific remote areas may vary. This may therefore imply a trade-off between the total number of
shoreline surveys and the consistency in the selected shorelines and monitoring personnel. Hence,
should an Arctic monitoring program be based on trained personnel dedicated solely to this specific
task? Or can the monitoring program also take advantage of potentially less experienced personnel
enabling surveys to be performed at otherwise non-included shorelines?
Safety
It is advised that monitoring starts one hour after high tide to prevent surveyors being cut off by
incoming tide. It is recommended that a minimum of two people work on remote shorelines.
Dangerous or suspicious looking items, such as ammunition, chemicals, and medicine should not be
removed. Instead, police or responsible authorities should be informed.
Additional survey types
As a supplement to basic NOAA and OSPAR adjusted monitoring described above, other survey
types can be relevant for studying amounts and composition of litter on shorelines, and these can
provide additional information on sources and trends. These survey types are, at the moment, either
only applied on smaller geographical scales, need further research and development, or are too
expensive to be implemented for monitoring on a wider scale.
Standing-stock monitoring
Standing-stock studies, as described in the NOAA Marine Debris Shoreline Survey Field Guide
(Opfer et al., 2012), can be executed on shorelines. This type of survey provides information on the
long-term balance between continuous inputs and removal of marine litter on the shorelines, which is
important for understanding its overall impact. Litter must be registered within discrete transects at
the shoreline site and not removed during standing-stock surveys. The surveys need to be repeated
several times, e.g., once per week or month. This can support assessments of the total load of litter
and can be used to determine the density (number of items per unit area) of debris present.
Data generation by citizen science and large-scale clean-ups
Citizen science activities, e.g., in relation to clean-ups, have a strong component of public engagement
in the scientific and policy-making process and can act as an important removal action for combatting
plastic pollution in the environment. Citizen science driven clean-up projects can also potentially
generate bulk estimates of litter amounts or identify the most frequently found items, especially if the
generated data are reported in a systematic way to a database, e.g., using mobile phone applications
that can improve the output because they provide harmonized approaches and ready data frameworks.
Thereby some citizen science projects can more easily produce quantitative data on litter (e.g., total
AMAP Litter and Microplastics Monitoring Guidelines
91
litter items per unit area (m-2) or per unit length (m-1) of a shoreline transect). In these projects,
professional scientists typically accompany the volunteer participants to ensure data quality and
comparability (GESAMP, 2019), although it can be challenging to establish continuous monitoring
efforts and quality assured data within such frameworks.
There are several examples of citizen science and clean-up activities in the Arctic that generate data
for assessing amounts and composition of litter items on shorelines, e.g., in Norway (Bergman et al.,
2017; Falk-Andersson et al., 2019), Canada (e.g., https://civiclaboratory.nl/2015/07/25/beach-clean-
ups/), Alaska (Polasek et al., 2017), and Greenland (Syberg et al., 2021), and even in some cases
temporal trends (Haarr et al., 2020). Potentially, this can also involve tourists from cruise ships
visiting more remote areas in the Arctic.
For instance, the citizen science data collected in Norway, which also include many AMAP relevant
locations, are of sufficient quality to identify the main sources of marine litter in Norway on a broad
scale but do have some limitations (Falk-Andersson et al., 2019). Comparable assessments on the
usefulness of citizen science generated data have also been performed in Europe by the European
Environmental Agency, which hosts the database for the European Marine Litter Watch
(https://www.eea.europa.eu/publications/marine-litter-watch). In Norway, the NGO Keep Norway
Beautiful (https://holdnorgerent.no/ryddeportalen/) is currently coordinating and mapping clean-up
activities in cooperation with other groups and a newly established center for Oil Spill Preparedness
and Marine Environment (https://www.marintmiljo.no/en/marin-forsopling/). Keep Norway Beautiful
is working on improved mapping of areas where beach clean-ups have been performed. The wide
range of protocols and structures within citizen science efforts create uncertainty in how to integrate
them with assessments based on monitoring. Can these types of citizen science generated data be
regarded only as supplementary data, or can they be assessed to have the quality necessary to be used
for wider circumpolar assessments? If citizen science efforts generate data that can be used in a
comparative way with data from more systematic and continuous monitoring efforts for marine litter
on shorelines (e.g., for identifying sources and/or wider spatial and temporal trend assessments in the
Arctic), they could be of significant value.
An alternative survey based on more detailed, in-depth analyses (in some studies called deep dives)
has been developed for analyzing large amounts of litter collected from, e.g., large-scale clean-ups.
This method can be a way to more efficiently provide detailed insights on sources and origin of
marine litter at local or even (sub)regional scales, because this type of study includes a more detailed
focus on the origin of different types of litter, e.g., fishery-related items. In addition, the framework
for this type of survey can act as a useful tool when communicating with specific groups of
stakeholders by involving them more directly. Such in-depth studies of marine litter on shorelines
have been performed in different areas of Northern Norway and Svalbard (Falk-Andersson et al.,
2018; Falk-Andersson and Strietman, 2019) and have recently been expanded to Greenland and
Iceland (W.J. Strietman, personal communication). However, these studies will require both the
collection of significantly larger amounts of litter and a more detailed registration of several of the
litter items during the monitoring surveys than currently described in the NOAA and OSPAR
monitoring guidelines.
Large-scale aerial surveys
Aerial surveys using drones or small manned aircrafts can be very helpful for carrying out rapid
assessments of the distribution of litter over larger geographical scales by relying on the analyses of
AMAP Litter and Microplastics Monitoring Guidelines
92
photo images, e.g., following major natural events, such as storms and tsunamis, or following
accidents at sea (GESAMP, 2019). Aerial surveys also have the potential to identify coastlines that are
sensitive as accumulation zones with high densities of accumulated plastic and other litter on the
shorelines. This information can be used to optimize the efforts of clean-up actions (Deidun et al.,
2019). Furthermore, aerial surveys can be particularly valuable for assessing marine litter in remote
areas and could potentially be applied in monitoring programs. However, recognition of specific sizes
of groups and types of marine litter will depend on image resolution, development of artificial
machine learning algorithms for recognizing litter items, and amounts and types of other natural
material on the shorelines that can interfere with identification (Deidun et al., 2019).
Modeling transport and identification of vulnerable coastlines
Hydrodynamic modeling can provide information on the importance of long-range transport with the
North Atlantic or Pacific Ocean currents and can identify coastlines that are vulnerable to receiving
larger amounts of litter from the open sea, both on larger and more local geographical scales. For
instance, in Norway, oceanographic models for transport of floating litter and increased probability of
stranding along the coast have been developed along the entire coastline (Huserbråten et al.,
unpublished data). The model will be validated with clean-up data from the NGO Hold Norge Rent
(https://holdnorgerent.no/). Another Norwegian study has tested a GIS-based predictive model to
identify marine litter hotspots in northern Norway that could predict a more effective site selection for
maximizing removal of litter during organized coastal clean-up actions (Haarr et al., 2019).
2.6.6 Quality assurance/quality control (QA/QC)
Quality assurance
Hands-on training for fieldworkers is generally recommended for conducting reliable monitoring
surveys on the shorelines, registration of the specific litter items according to the specifications in
monitoring guidelines, and reporting the data to relevant databases. Trained and experienced
surveyors can be researchers or long-term, community-led programs that perform coordinated
monitoring continuously, or volunteers/citizen science doing single clean-ups. Detailed photo
documentation of all collected litter for each survey can be useful for later confirmation. In many
cases, photo documentation of every item may not be possible, in which case items that are difficult to
categorize or specifically notable for low or high frequency should be the priority.
For the NOAA guidelines, there is an efficient setup for training surveyors with an online monitoring
toolbox that includes tutorials, protocol quizzes, database user guides, etc.
(https://marinedebris.noaa.gov/research/monitoring-toolbox).
Data management and reporting formats for databases
To perform thorough spatial and temporal trend analyses of the amount and composition of marine
litter on Arctic shorelines, the availability of quality-assured monitoring data stored and secured in
long-term databases is necessary. These databases are most useful when they are easily accessed, and
the data they contain can be easily queried or exported in readily usable formats.
The OSPAR beach litter database (https://beachlitter.ospar.org) stores and secures marine litter data
generated according to OSPAR beach-litter guidelines and collected at reference beaches in the
Northeast Atlantic region, which includes some parts of the Arctic Sea. The reported data need to be

AMAP Litter and Microplastics Monitoring Guidelines
93
normalized to 100 m beach segments. Currently, the database contains some AMAP relevant data
from Arctic and sub-Arctic parts of Norway, Iceland, Faroe Islands, East Greenland, and West
Greenland. However, OSPAR has recently indicated that they will consider not hosting data from
locations outside the OSPAR maritime area, even though they are generated using comparable data
formats. This may affect the long-term storage of the monitoring data from, e.g., West Greenland.
Subsequently, the use of another database must be considered, even though a wider OSPAR database
would be a better platform for the standardization and harmonization of monitoring efforts and data
assessments in these neighboring regional seas.
Monitoring data generated according to the NOAA guidelines can be reported to NOAA’s database
under the Marine Debris Monitoring and Assessment Project (MDMAP):
https://marinedebris.noaa.gov, which covers data from both maritime areas and greater lakes in the
USA. An initial search shows data from 23 shoreline locations in Alaska, although only 2 of these are
in the Arctic, for a total of 10 surveys in the Arctic.
The ICES DOME database can potentially also host these types of beach litter data based on EU TG-
ML codes from JRC (2013) for specific types of litter.
In addition, for citizen science, including various types of clean-up events, data can be sent to and
retrieved from a public dataset at the Marine Debris Tracker website
(https://marinedebris.engr.uga.edu) or the Marine Litter Watch developed by the European
Environmental Agency (https://www.eea.europa.eu/themes/water/europes-seas-and-
coasts/assessments/marine-litterwatch#tab-news-and-articles). These listed platforms or apps are
examples, and it is recognized that additional apps or platforms will be developed over time, although
the specific connectivity challenges of the Arctic may continue to make them difficult to use there.
New apps or platforms should be evaluated for potential utility as part of monitoring efforts on a case-
by-case basis.
2.6.7. Existing monitoring for marine litter on Arctic shorelines
For some years now, several Arctic countries have initiated monitoring activities for marine litter on
shorelines according to the recommended monitoring protocols. Table 2.14 lists the current
availability of such monitoring data in the OSPAR and NOAA databases relevant for Arctic
assessments.
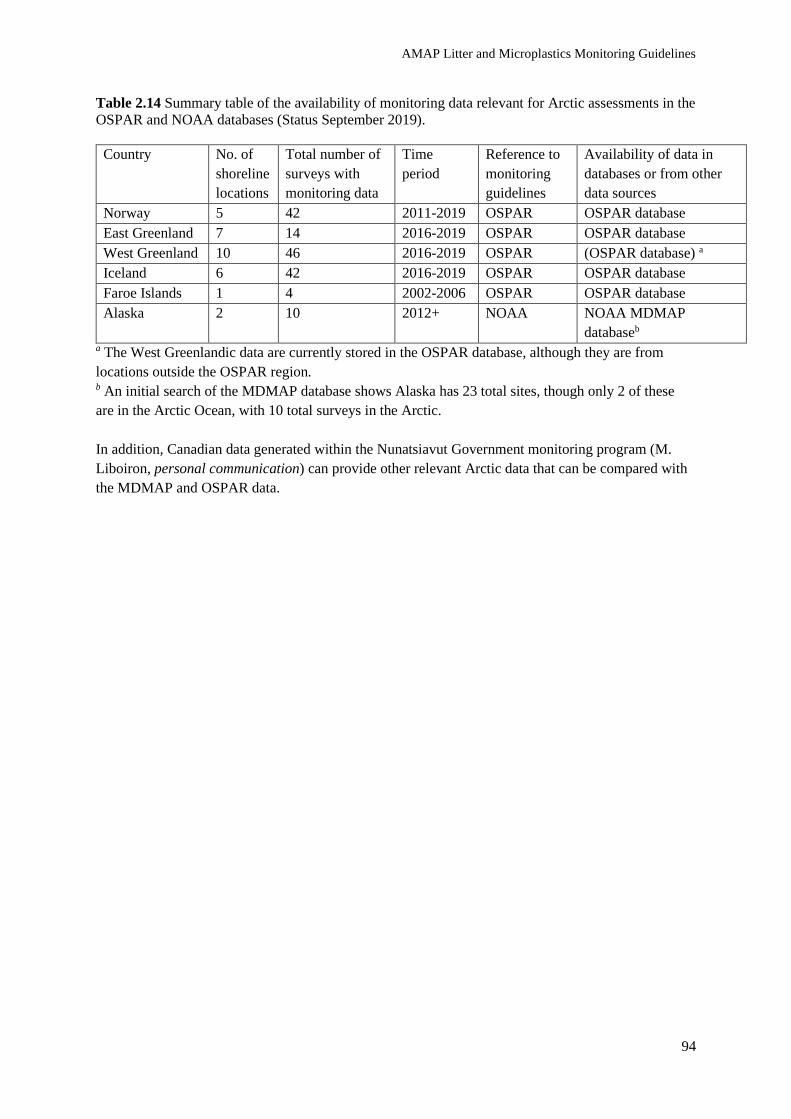
AMAP Litter and Microplastics Monitoring Guidelines
94
Table 2.14 Summary table of the availability of monitoring data relevant for Arctic assessments in the
OSPAR and NOAA databases (Status September 2019).
Country No. of
shoreline
locations
Total number of
surveys with
monitoring data
Time
period
Reference to
monitoring
guidelines
Availability of data in
databases or from other
data sources
Norway 5 42 2011-2019 OSPAR OSPAR database
East Greenland 7 14 2016-2019 OSPAR OSPAR database
West Greenland 10 46 2016-2019 OSPAR (OSPAR database) a
Iceland 6 42 2016-2019 OSPAR OSPAR database
Faroe Islands 1 4 2002-2006 OSPAR OSPAR database
Alaska 2 10 2012+ NOAA NOAA MDMAP
databaseb a The West Greenlandic data are currently stored in the OSPAR database, although they are from
locations outside the OSPAR region. b An initial search of the MDMAP database shows Alaska has 23 total sites, though only 2 of these
are in the Arctic Ocean, with 10 total surveys in the Arctic.
In addition, Canadian data generated within the Nunatsiavut Government monitoring program (M.
Liboiron, personal communication) can provide other relevant Arctic data that can be compared with
the MDMAP and OSPAR data.

AMAP Litter and Microplastics Monitoring Guidelines
95
Figure 2.4 Map of locations for existing monitoring activities on marine litter on shorelines in the
Arctic and sub-Arctic regions. In addition, Alaska has also indicated three sites as potential new
monitoring sites. Overlapping points were offset to show all sampling locations.

AMAP Litter and Microplastics Monitoring Guidelines
96
2.6.8 Recommendations
Table 2.15 Summary of monitoring and research recommendations for macrolitter on Arctic
shorelines.
1st level (must do) 2nd level (should do)
Monitoring Accumulation surveys of
macrolitter at reference sites of 100
m segments on shorelines following
OSPAR or NOAA guidelines.
Accumulation surveys of
macrolitter at point source (e.g.,
urban) impacted shorelines for
assessing inputs from local Arctic
sources.
Implementation of specific Arctic
relevant litter items in an
extended monitoring
identification list.
Standing-stock surveys according
to NOAA protocols.
Research In-depth analyses (deep dives) with
more detailed source
characterization of litter items.
Use of aerial surveys in
monitoring programs for
macrolitter.
Fate of macrolitter on shorelines
due to weathering
processes and their potential as
sources for MP.
Hydrographic modeling, e.g.,
identification of coastal areas
vulnerable for high accumulation
of litter.

AMAP Litter and Microplastics Monitoring Guidelines
97
Table 2.16 Summary rationale for recommendations, including estimated costs for implementing
programs: 0 - already in place; $ - relatively inexpensive because of synergy with other projects but
needs to have some additional capacity; $$ - either networks and/or capacity will need to be
developed; $$$ - development of sampling networks, processing capacity, and reporting all need to be
developed.
Recommendation Program
Cost Rationale
Accumulation surveys at 100 m
segments on shorelines.
Useful for monitoring in
alignment with MDMAP,
OSPAR, and EU MSFD, although
would benefit from some minor
adaptations to Arctic conditions.
0 - $ Existing monitoring programs are already in
place in most OSPAR member states as well as in
Alaska as part of MDMAP, although the number
of monitoring stations could be increased. Other
countries could also start up similar monitoring
activities relatively easily.
It will generally be low cost to implement such
low-tech shoreline monitoring, i.e., conducting
field surveys, characterizing litter items, and
reporting the data, although ship-assisted
transport will be needed for surveys in more
remote areas.
In-depth analyses (deep dive) for
more detailed source
characterizations.
$-$$ Collection of large representative amounts of
litter from shorelines will depend on local
network and capacities.
Registration of the many litter items can be quite
time-consuming, although it can also be
performed with local stakeholders and
representatives from the civil society.
Box A: Data needs/expectations.
Must have data
• Station ID
• Location (defined by start and end GPS positions)
• Type of shoreline (reference shorelines in remote area, or locally impacted shorelines, e.g.,
from urban activities)
• Length of survey segment (m)
• Survey date
• Monitoring survey or a clean-up activity
• Protocol applied for identification and registration of litter items
• Counts for each type of registered litter item according to recommended protocols
• Responsible data rapporteur
Nice to have for all data
• Average width of shoreline segment
• Number of persons involved in surveys
• Shoreline topography and features (% sand, % pebbles, % rocks)
• Distance to nearest inhabited town/settlements and number of inhabitants
• Distance to nearest harbor
• Distance to nearest river mouth
• Reference to QA/QC procedures
• Total weight of sampled litter
AMAP Litter and Microplastics Monitoring Guidelines
98
References
Bergmann, M., B. Lutz, M.B. Tekman and L. Gutow, 2017. Citizen scientists reveal: marine litter
pollutes Arctic beaches and affects wild life. Marine Pollution Bulletin, 125:535-540.
https://doi.org/10.1016/j.marpolbul.2017.09.055
Deidun, A., A. Gauci, S. Lagorio and F. Galgani, 2018. Optimising beached litter monitoring
protocols through aerial imagery. Marine Pollution Bulletin, 131(A):212-217.
https://doi.org/10.1016/j.marpolbul.2018.04.033
European Union (EU), 2021. MSFD Technical Group on Marine Litter. Current Work Items of the
TG Litter. European Union, Brussels, Belgium. [online] URL:
https://mcc.jrc.ec.europa.eu/main/dev.py?N=41&O=434&titre_chap=TG%2520Marine%2520Litter
Falk-Andersson, J., B.W. Berkhout and T.G. Abate, 2019. Citizen science for better management:
lessons learned from three Norwegian beach litter data sets. Marine Pollution Bulletin, 138:364-375.
https://doi.org/10.1016/j.marpolbul.2018.11.021
Falk-Andersson, J., E.D. Olaussen and C. Macintyre, 2018. Strandsøppel dypdykk for forebygging av
marin forsøpling [Beach litter deep dive for prevention of marine littering]. SALT Report, No. 1024.
SALT, Lofoten, Norway. 53pp. [online] URL: https://salt.nu/wp-content/uploads/2019/04/1024-
Dypdykk-sluttrapport.pdf
Falk-Andersson, J. and W.J. Strietman, 2019. Svalbard Beach Litter Deep Dive. SALT Report, No.
1033. SALT, Lofoten, Norway. 57pp. [online] URL: https://salt.nu/wp-
content/uploads/2019/04/1033-Svalbard-Beach-litter-deep-dive.comp_.pdf
Fleet, D., T. Vlachogianni and G. Hanke, 2021. A Joint List of Litter Categories for Marine
Macrolitter Monitoring. EUR 30348 EN. European Union, Luxembourg.
https://doi.org/10.2760/127473
Group of Experts on Scientific Aspects of Marine Environmental Protection (GESAMP), 2019.
Guidelines for the Monitoring and Assessment of Plastic Litter and Microplastics in the Ocean.
GESAMP, London, UK. 130pp. [online] URL: http://www.gesamp.org/publications/guidelines-for-
the-monitoring-and-assessment-of-plastic-litter-in-the-ocean
Haarr, M.L., I. Westerveld, J. Fabres, K.R. Iversen and K.E.T. Busch, 2019. A novel GIS-based tool
for predicting coastal litter accumulation and optimising coastal cleanup actions. Marine Pollution
Bulletin, 139:117-126. https://doi.org/10.1016/j.marpolbul.2018.12.025
Haarr, M.L., M. Pantalos, M.K. Hartviksen and M. Gressetvold, 2020. Citizen science data indicate a
reduction in beach litter in the Lofoten archipelago in the Norwegian Sea. Marine Pollution Bulletin,
153:111000. https://doi.org/10.1016/j.marpolbul.2020.111000
Joint Research Centre (JRC), 2013. Guidance on Monitoring of Marine Litter in European Seas: a
guidance document within the common implementation strategy for the marine strategy framework
directive MSFD technical subgroup on marine litter. JRC scientific and policy reports. Joint Research
Centre (JRC) report EUR 26113 EN. [online] URL:
https://mcc.jrc.ec.europa.eu/documents/201702074014.pdf

AMAP Litter and Microplastics Monitoring Guidelines
99
Opfer, S., C. Arthur and S. Lippiatt, 2012. NOAA Marine Debris Shoreline Survey Field Guide,
National Oceanic and Atmospheric Administration (NOAA), Marine Debris Program. 19pp. [online]
URL: https://marinedebris.noaa.gov/sites/default/files/ShorelineFieldGuide2012.pdf
OSPAR, 2010. Guideline for Monitoring Marine Litter on the Beaches in the OSPAR Maritime Area,
OSPAR, London, UK. 84pp.[online] URL: https://www.ospar.org/ospar-data/10-
02e_beachlitter%20guideline_english%20only.pdf
Polasek, L., J. Bering, H. Kim, P. Neitlich, B. Pister, M. Terwilliger, K. Nicolato, C. Turner and T.
Jones, 2017. Marine debris in five national parks in Alaska. Marine Pollution Bulletin, 117:371-379.
https://doi.org/10.1016/j.marpolbul.2017.01.085
Protection of the Arctic Marine Environment (PAME), 2019. Desktop Study on Marine Litter
Including Microplastics in the Arctic. 11th Arctic Council Ministerial Meeting, Rovaniemi, Finland, 7
May 2019. PAME, Akureyri, Iceland. 114pp. [online] URL:
https://www.pame.is/images/03_Projects/Arctic_Marine_Pollution/Litter/Desktop_study/Desktop_Stu
dy_on_marine_litter.pdf
Schäfer, E., U. Scheele and M. Papenjohann, 2019. Identifying Sources of Marine Litter: Application
of the Matrix Scoring Technique to the German North Sea Region. Report of behalf of Lower Saxony
Water Management, Coastal Defence and Nature Conservation Agency (NLWKN) and Schleswig-
Holstein Agency for Coastal Defence, National Park and Marine Conservation (LKN.SH).
https://doi.org/10.13140/RG.2.2.34106.85441
Syberg, K., A. Palmqvist, F.R. Khan, J. Strand, J. Vollertsen, L.P. Westergaard Clausen, L. Feld, N.B.
Hartmann, N. Oturai, S. Møller, T.G. Nielsen, Y. Shashoua and S.F. Hansen, 2020. A nationwide
assessment of plastic pollution in the Danish realm using citizen science. Scientific Reports 10:17773.
https://doi.org/10.1038/s41598-020-74768-5
Tudor, D.T. and A.T. Williams, 2004. Development of a ‘Matrix Scoring Technique’ to determine
litter sources at a Bristol Channel beach. Journal of Coastal Conservation, 9:119-127.
https://doi.org/10.1007/bf02818948
van Loon, W., G. Hanke, D. Fleet, S. Werner, J. Barry, J. Strand, J. Eriksson, F. Galgani, D. Gräwe,
M. Schulz, T. Vlachogianni, M. Press, E. Blidberg and D. Walvoort, 2020. A European Threshold
Value and Assessment Method for Macro Litter on Coastlines. EUR 30347 EN. European Union,
Luxembourg. https://doi.org/10.2760/54369
Photo: Ingrid Gabrielsen
AMAP Litter and Microplastics Monitoring Guidelines
100
2.7 Seabed AUTHORS: BJØRN EINAR GRØSVIK, LENE BUHL-MORTENSEN, MELANIE BERGMANN, ANDY M. BOOTH, AND FRANCOIS
GALGANI
2.7.1 Introduction
The seabed accounts for 70% of the Earth's surface and is an important carbon sink. It has also been
argued that the seabed acts as a final sink for marine litter, including microplastics (MP; Woodall et
al., 2014). This section concerns macrolitter on the seabed. For recommendations regarding
microlitter in sediments, please refer to Section 2.3. Plastic accounts for 62% of litter recorded on
the seabed (https://litterbase.awi.de), which does not come as a surprise given that 50% of plastic
from municipal waste has a density higher than seawater and sinks directly to the seabed (Engler,
2012). Over time, though, even lighter plastic sinks to the seabed due to biofouling and ballasting
processes (Porter et al., 2018). Despite the importance of the seabed as a sink for litter, technical
constraints have resulted in the seabed remaining one of the least explored habitats on Earth. As a
consequence, little is also known about the scale and distribution of its pollution, especially in the
Arctic region.
Although the deep seabed has long been pictured as a sparsely inhabited moonscape, research over
the past decades has unveiled a biodiversity akin to that of tropical rainforests or coral reefs
(Herring, 2002). However, little is known about the effects of plastic debris on these rich
communities or biota. It has been suggested that items such as plastic bags smother and damage
organisms from hard and soft substrata (Parker, 1990). Litter on the seabed can cause anoxia to the
underlying sediment, which may alter biogeochemistry and benthic community structure (Green et
al., 2015). Furthermore, litter may serve as substrate for the attachment of sessile biota in
sedimentary environments and alter community structure and biodiversity (Schulz et al., 2010;
Mordecai et al., 2011). In addition, litter could become entangled in emergent epifauna, leading to
injury, breakage, mortality, and disease (Yoshikawa and Asoh, 2004; Chiappone et al., 2005).
Debris from fisheries may continue to attract mobile biota leading to ghost fishing and increased
mortality (Matsuoka et al., 2005). Plastic debris may also be ingested by benthic organisms,
including demersal fish. To date, records of impacts on benthic life remain largely anecdotal.
2.7.2 Status of global science
Plastic on the seabed was first recorded in McMurdo Sound, Antarctica (Dayton and Robilliard, 1971)
and Skagerrak in 1972 (Holmström, 1975), followed by the Mediterranean (e.g., Galil et al., 1995;
Galgani et al., 1995a, 1996; Stefatos et al., 1999; Katsanevakis and Katsarou, 2004), other European
coasts (Galgani et al., 1995a, b, 2000), the US (June, 1990; Moore and Allen, 2000; Keller et al.,
2010; Morét-Ferguson et al., 2010; Watters et al., 2010; Schlining et al., 2013; Law et al., 2020), and
other areas (Lee et al., 2006; Fischer et al., 2015; Shimanaga and Yanagi, 2016; Chiba et al., 2018).
Litter was also recorded in the Arctic including Alaska and the Bering Sea (Jewett, 1976; Feder et al.,
1978; June, 1990; Hess et al., 1999) and the deep seabed (Galgani and Lecornu, 2004; Pace et al.,
2007; Keller et al., 2010; Mordecai et al., 2011; Wei et al., 2012; Pham et al., 2013; Ramirez-Llodra
et al., 2013; Amon et al., 2020), including hadal trenches such as the Mariana Trench, the deepest part
of our ocean (Peng et al., 2018). Litter densities on the seabed range between 30-6,610 items km-2
(Keller et al., 2010; Pham et al., 2014) and are strongly influenced by the distance to the coastline,

AMAP Litter and Microplastics Monitoring Guidelines
101
regional population densities, proximity to shipping routes, rivers, depth, marine landscapes, sampling
and analysis approaches, water currents, and circulations (Jambeck et al., 2015).
Marine litter is defined as any persistent, manufactured, or processed solid material discarded,
disposed of, or abandoned in the marine environment (UNEP, 2009). Material densities, fouling
processes, size, and shape are important for transport distance and sedimentation rate. Outside of the
coastal regions, the highest densities of marine litter have been found in submarine canyons, whereas
continental shelves and ocean ridges have the lowest densities (Galgani et al., 2000; Ramirez-Llodra
et al., 2011; Pham et al., 2014; Woodall et al, 2015; Buhl-Mortensen and Buhl-Mortensen, 2017).
This suggests there are transport mechanisms for seabed litter to the lowest points in the world’s
oceans. In the Mediterranean, densities of marine litter collected by trawling from deep waters (mean
depth 1,400 to 3,000 m) ranged from 400 kg km-2 at the continental slope south of Palma de Mallorca
to densities between 70-180 kg km-2 at the other sites (Galgani et al., 2000; Pham et al., 2014).
Densities of litter in the Ryukyu Trench and in the basin of Okinawa in the Northwest Pacific ranged
from 8-121 kg km-2, whereas shallower continental slopes or abyssal plains ranged from 0.03-9 kg
km-2 (Shimanaga and Yanagi, 2016). In the European part of the Atlantic Ocean, densities of 43-74 kg
km-2 have been recorded in the Bay of Biscay (Lopez-Lopez et al., 2017), while a mean of 123 kg km-
2 has been estimated for the Norwegian shelf and the slope of the Norwegian Sea, and a mean of 154
kg km-2 has been recorded offshore in the Barents Sea (Buhl-Mortensen and Buhl-Mortensen, 2017).
Higher levels were recorded from coastal areas: a mean of 2,510 kg km-2 was observed along the
Norwegian coast from Ålesund to Lofoten and 227 kg km-2 from Lofoten to the Russian border (Buhl-
Mortensen and Buhl-Mortensen, 2017). Fishery-related litter dominated. This consists of a
combination of wire, nets, and ropes. By weight, metal (wires) dominated, whereas plastic (nets and
ropes) often dominated by volume. This agrees with findings from other areas with high fishing
activities, such as on oceanic ridges and seamounts (Pham et al., 2014; Woodall et al., 2015). The
62% global contribution of plastic to marine total litter includes 11% from fisheries.
2.7.3 Seabed mapping in the Arctic
Marine debris was reported from trawls conducted in sub-Arctic regions as early as 1975/1976 in the
Bering Sea (Jewett, 1976; Feder et al., 1978). In June (1990), marine debris was also recorded,
including plastic in trawls from this area. No data have been published to date on seabed litter from
the central Arctic, Chukchi Sea, or Amerasian Arctic.
The ongoing Norwegian seabed mapping program Mareano (www.mareano.no) has conducted >
2,000 (~700 m long) video transects. Litter was recorded for all transects and > 1,200 have been
conducted in the Barents Sea (Figure 2.5). Items larger than 5 cm are observed by video recordings.
This dataset provides an overview of the distribution, density, and composition of litter in a wide area,
covering depths from 50 to 2,700 m and includes a variety of marine landscapes (Buhl-Mortensen and
Buhl-Mortensen 2017, 2018). The density of litter decreases toward the north and with distance from
the coast. In the Barents Sea, the mean density near the coast and offshore is between 268 and 194
items km-2, respectively. Litter is unevenly distributed in marine landscapes and the density of litter
on the deep-sea plain, continental slope, and shelf is mainly below 200 items (160 kg)/km-2. Fjords
and canyons exhibit higher densities, indicating an accumulation effect in these areas. Mapping

AMAP Litter and Microplastics Monitoring Guidelines
102
information from Mareano provides vital background information for a designated seabed litter
monitoring plan.
Iceland is currently recording all bycatches of litter made as part of bottom trawl surveys. Seabed
mapping using video has been conducted in several localities and observed litter items have been
recorded since 2015. More than 1,000 annual stations of stock-assessment surveys are used to register
and classify marine litter (Figure 2.6; Hafrannsóknastofnun/Marine and Freshwater Research Institute,
Iceland, unpublished data).
In the Faroe Islands, litter is also recorded as part of an ongoing ground fish survey using bottom
trawls. In 2017, seabed mapping using video was started as part of the NOVASARC project
(https://novasarc.hafogvatn.is/) and 60 localities were targeted (Figure 2.7). In total, only 13 litter
items were recorded, all of which were fishing lines (P. Steingrund, Faroe Marine Research Institute,
personal communication).
2.7.4 Trends to date
Data from bottom trawls conducted as part of the Russian-Norwegian Ecosystem Survey between
2010-2016 showed widespread pollution in the Barents Sea region, with litter found in 34% of the
samples, yielding on average 26 kg km-2 of marine litter. Plastic accounted for 11% of the debris by
weight. The highest quantities were found in areas west, southeast, and northeast off Svalbard
(Grøsvik et al., 2018). The number of litter recordings from both bottom stations increased in the
period these recordings were conducted (2010-2018). Plastics dominated all types of litter in bottom
trawl stations both during the 2010-2013 and 2014-2018 periods (ICES, 2019). For bottom trawls,
81.0% of litter recorded was plastic during the 2010-2013 period, whereas 88.7% of litter recorded
contained plastic during 2014-2018. Litter from fisheries—ropes, strings, and cords, pieces of nets,
floats/buoys, etc.—dominated recordings of plastic litter (ICES, 2019).
Plastic litter has also been sporadically recorded off the East Greenland slope (Schulz et al., 2010) and
at the HAUSGARTEN observatory in the eastern Fram Strait, providing rare time-series data for
litter, especially for litter on the seabed. Analyses of still imagery from repeated towed camera
transects, conducted at three different stations located along a latitudinal gradient, indicate an increase
in litter on the seabed from 2002-2017, with an initial strong increase in 2011, followed by elevated
levels above 6,000 items km-2 from 2014 onward (Figure 2.7; Martínez et al., 2020). The
northernmost station, which is situated close to the marginal ice zone, exhibited the highest amount of
litter and experienced the strongest increase from 346-7,374 items km-2 between 2004 and 2017 (peak
of 10,358 items km-2 in 2016), respectively. Interestingly, glass was the predominant material type at
this location. This is important; it points to local ship-based disposal because glass sinks directly to
the seabed due to the material’s high specific density. However, the quantities of plastic also increased
over time with highest levels at the central HAUSGARTEN station (~5,000 items km-2). If all three
stations and years are combined, plastic accounted for 41 % of the litter. The use of imagery also
allowed a rare assessment of marine litter impacts on benthic biota. Most frequently litter was
entangled in sponges (54%), followed by colonization of items by sea anemones (22%). There was an
increase of litter entangled in sponges over time at the northern station, which affected 10% of the
sponge population in 2015. At the northern station, up to 28% of the sponge Cladorhiza gelida was
affected whereas at the southernmost station up to 31% of the species Caulophacus arcticus was
entangled.

AMAP Litter and Microplastics Monitoring Guidelines
103
2.7.5 Benefits of monitoring
• Temporal and spatial changes
• Litter quantity and composition changes
• Basis for monitoring the impacts of introduced mitigation measures to reduce litter
Time-series observations on the seabed lend themselves particularly well to monitoring purposes
because the seabed represents a sink that integrates changes over long time scales. In contrast,
estimates from the sea surface can be considered snapshots in time, being much more affected by
weather, windage, and mesoscale phenomena (van Sebille et al., 2020).
2.7.6 Limitations
As in other environmental studies, seabed litter assessment can be reported in a variety of dimensions,
e.g., size, weight, numbers, categories, area. Bycatch litter from trawl surveys is often provided as
weight, and the litter sampled by the trawl allows for further analysis. Visual seabed mapping, on the
other hand, typically reports on number per area of different litter categories, and weight can only be
estimated. Visual mapping, however, allows for observations of litter in vulnerable ecosystems, e.g.,
coral reefs, and provides detailed information on litter position in the marine landscape. Both methods
come with their advantages and disadvantages, and data cannot be compared directly because of
sampling efficiency and habitats covered. For monitoring purposes, it is recommended that seabed
litter be documented both through sampling and visual recording, and data should be presented in as
many dimensions as possible using standardized methods to allow for a broad international
comparison of seabed litter densities and composition.
2.7.7 Methods
Methods for monitoring litter on seabed have recently been reviewed (Canals et al., 2021). For
recording litter from seabed, we refer to the Guidance on Monitoring of Marine Litter in European
Seas (MSFD Technical Subgroup on Marine Litter, 2013) and the updated list of litter categories as
described by Fleet et al., 2021 and the online Photo Catalogue of the Joint List of Litter Categories.
Recordings in the HAUSGARTEN study were performed by using a camera platform (OFOS, Ocean
Floor Observation System), which was towed at a target altitude of 1.5 m for 4 hours. Items of 1-2 cm
can be recorded with this approach and smaller items are disregarded. In recent years, the system
provides both video and still imagery, but only still images are used for image analyses giving rise to
the HAUSGARTEN time series. The advantage of this system is that it does not damage the
ecosystem under investigation, unlike trawls, which cause more harm killing all organisms inhabiting
this sensitive region. In addition, much larger areas can be covered. In this area, trawls deployed for
30 minutes come up with large amounts of animals and mud, which takes hours to sort as previous
biological work, focusing on benthic biota, has shown (Bergmann et al., 2009). Another important
advantage of using cameras is that it shows litter items in situ such that interaction with biota can be
analyzed. For example, with this approach, we were able to show that up to 28% of the sponge species
Cladorhiza gelida suffered from entanglement at station N3 and up to 31% of the sponge
Caulophacus arcticus sustained entanglement at station S3 in certain years (Martínez et al., 2020).
In addition, previous research has shown that deposition rates in this area are quite low (Müller et al.,
2012), so that items only become buried into strata as deep as half a meter over centenary time scales.

AMAP Litter and Microplastics Monitoring Guidelines
104
Still, they can be covered in a thin veneer of sediment, obscuring their detection. Nevertheless, we
consider this drawback minor compared to the benefits of covering a large area and obtaining in-situ
glimpses of litter. In addition, it ties in with an ongoing biological long-term observation program, so
no additional ship time is needed, regular access is granted, and additional biological data are
available (e.g., species densities, which allows assessment of vulnerability, e.g., to litter
entanglement).
2.7.8 Litter estimates based on imagery
Litter is recorded on an annual basis in the Fram Strait at five seabed stations at the HAUSGARTEN
observatory using a towed camera system (OFOS) operated by the Alfred Wegener Institute (AWI)
Helmholtz Centre for Polar and Marine Research (Figure 2.8). All stations are characterized by soft
sediments, with occasional dropstones and depths ranging from 1,200-2,500 m (Meyer et al., 2013;
Taylor et al., 2016). Additional transects are done occasionally in the Molloy Deep (5,500 m depth),
the deepest known depression in the Arctic Ocean. The camera is towed along the same camera tracks
at ~1.5 m altitude taking video and a still images every 30 seconds. All still images are uploaded and
analyzed manually using the online image database and annotation tool BIIGLE (Martínez et al.,
2020). The benefit of this work is that it is embedded in an ongoing time-series program and therefore
requires no additional efforts in terms of logistics and ship time. It was this research that initially
raised concerns about plastic pollution in the Arctic (Bergmann and Klages, 2012).
Working class ROVs have also been used for in-situ experiments and image transects at
HAUSGARTEN. However, this has been done on an irregular basis only because ROV charters are
costly and logistics are more challenging compared with towed camera platforms. Their usage may
increase with the new RV Polarstern, which will come equipped with robotic capabilities. Other
platforms for image acquisition are autonomously operated vehicles (AUV) equipped with a camera
payload, as recently developed by the AWI. The advantage of using imagery is that it does not cause
harm to the environment, shows litter in situ (such that interactions with benthic life can be observed),
and it enables both large- and small-scale assessment distribution patterns. The disadvantage is that it
does not produce physical samples that can be investigated in further detail regarding material type,
age, or origin. Imagery also fails to show items buried in the upper sediment surface layers, and white
objects can be challenging to discern (from shells) due to reflectance.
Trawls must be considered semi-quantitative (Eleftheriou and Moore, 2005) because they may not be
in constant contact with the seabed and the retained catch depends on the catch composition and mesh
size used. In addition, trawls disturb the ecosystem and cover smaller areas. However, trawl surveys
generate physical samples for close inspection, e.g., according to OSPAR protocol and can be
conducted with low logistic effort and cost if implemented as part of regular fisheries stock
assessments.
2.7.9 Fishing for litter - abandoned, lost, or otherwise discarded fishing gear (ALDFG)
A pilot Fishing for Litter (FFL) action ran in the Faroe Islands during the spring of 2008. The scheme
has recently been restarted with four trawlers participating. The portion of plastic/polystyrene
constituted 95 % of the litter collected (https://fishingforlitter.org/faroe-islands/).
The Norwegian Environment Agency established a national FFL test scheme in 2016-2017, which
began initially with three participating ports (http://fishingforlitter.org/norway/). This was quickly

AMAP Litter and Microplastics Monitoring Guidelines
105
extended with an additional five ports during 2017. The FFL scheme was continued in 2018 and
extended with one more port. By 2019, the FFL scheme comprised a total of nine participating ports
along the Norwegian coast. The FFL scheme is administered by SALT Lofoten AS in collaboration
with Nofir, the local ports, and waste management companies.
2.7.10 Quality assurance/quality control (QA/QC)
Data recording and management should be an online, national database system controlled by local
managers. Regional/country coordinators would then review and approve uploaded data. This would
ensure consistency within each region and create a hierarchy of quality assurance on data acquisition.
For International Bottom Trawl Surveys (IBTS), sampling data are collected in the DATRAS
database and participate in data quality checking for hydrographical and environmental conditions.
This process may also support quality assurance for data on litter.
The online portal LITTERBASE (https://litterbase.awi.de) contains peer-reviewed data on marine
litter from different ecosystem compartments. It could be beneficial to allow data connections
between this and the new portal.
Box A: Data needs/expectation.
Must have data for reporting plastic
• Location, including latitude and longitude, depth
• Date, including day, month, and year
• Sample method (trawl type, mesh size, opening size, ROV, video, still camera, SCUBA diving
surveys), speed, distance, altitude, sampled area, minimal size limit
• Hydrographical (CTD)
• If multiple counts (transects/observers) are run at any given site (replicates)
• Primarily number and if possible weight (volume) per km-2
• Category, material, source
Beneficial to have
• Color reported in eight broad color groups as reported in Galgani et al. (2017)
• Polymer type and method used (all sizes?)
• Size of plastics reported by size classes (mega/macro/meso)
• Interactions with biota (by material type, size, species, type of interaction)
2.7.11 Existing monitoring for contaminants in the Arctic
The joint Norwegian-Russian Ecosystem Survey in the Barents Sea is performed annually in August-
October and includes sampling of several fish species, shrimp, and sediments for contaminants
monitoring. Floating debris and litter as bycatch in trawls are also recorded and reported.
Microplastics are collected from manta trawls (mesh size 335 µm) from some of the stations (Figure
2.9). In addition to time series of litter on the seabed, the HAUSGARTEN observatory work also
includes annual sampling of deep-sea sediments for MP analyses (Bergmann et al., 2017a; Tekman et
al., 2020), as well as occasional surveys in the water column, sea ice, snow, (Bergmann et al., 2019;
Tekman et al., 2020), and zooplankton, and macrolitter surveys at the sea surface and on the beaches
of Svalbard (Bergmann et al., 2016, 2017b).

AMAP Litter and Microplastics Monitoring Guidelines
106
2.7.12 Recommendations
Research gaps
Although the European Arctic seems to be covered reasonably well, very little is known about
macroplastic pollution in the Central Arctic Ocean and the North American Arctic in terms of seabed
litter. Limited historical data on marine litter presence and composition exist, primarily from Bering
Sea bottom trawl surveys. Image footage from previous AWI expeditions to the central Arctic in 2013
and 2016 (Boetius et al., 2013; Boetius and Purser, 2017) exists, but has not been analyzed in terms of
litter quantities. The same applies to footage from the Canada Basin (Bluhm et al., 2005; MacDonald
et al., 2010). Footage may also be available from previous dives of the Russian ROV Mir. Analysis of
historic footage could be a good starting point to diminish our knowledge gaps regarding plastic
pollution in remote Arctic regions, but such work likely requires additional financial support.
Table 2.17 Summary of monitoring and research recommendations for litter on the seabed.
1st level (must do) 2nd level (should do/develop)
Monitoring - Develop a monitoring plan for
seabed litter (> 2 cm*) by
selecting representative sites for
visual inspection that will cover
different depths and substratum
in marine landscapes.
- Record litter (> 2 cm*)
collected or observed in all
sampling of seabed habitats
(bycatch from bottom surveys,
diver observations, camera
surveys, etc.).
- Perform studies that give
information on within gear
uncertainty and between gear
uncertainty.
- Develop more automated and
autonomous ways to record
litter on the seabed.
Research - Improved optics/image
recognition for litter
observations.
* Size ranges between < 2 cm are not properly covered by these methods.
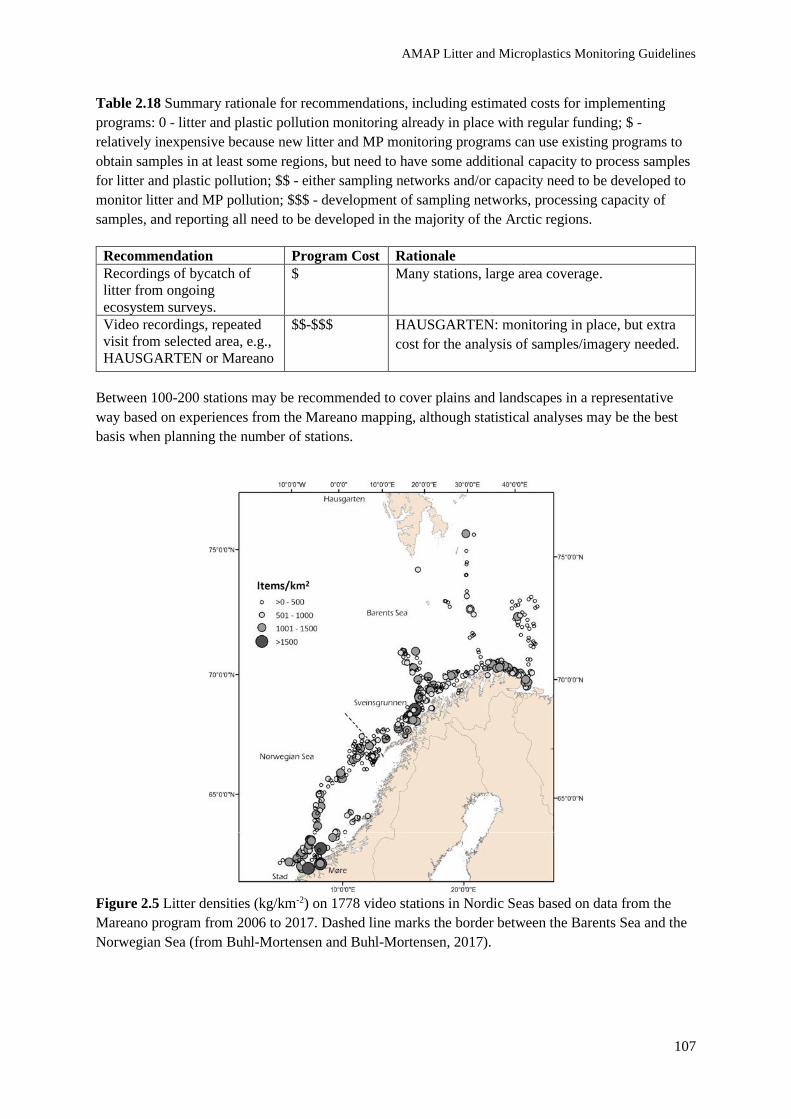
AMAP Litter and Microplastics Monitoring Guidelines
107
Table 2.18 Summary rationale for recommendations, including estimated costs for implementing
programs: 0 - litter and plastic pollution monitoring already in place with regular funding; $ -
relatively inexpensive because new litter and MP monitoring programs can use existing programs to
obtain samples in at least some regions, but need to have some additional capacity to process samples
for litter and plastic pollution; $$ - either sampling networks and/or capacity need to be developed to
monitor litter and MP pollution; $$$ - development of sampling networks, processing capacity of
samples, and reporting all need to be developed in the majority of the Arctic regions.
Recommendation Program Cost Rationale
Recordings of bycatch of
litter from ongoing
ecosystem surveys.
$
Many stations, large area coverage.
Video recordings, repeated
visit from selected area, e.g.,
HAUSGARTEN or Mareano
$$-$$$ HAUSGARTEN: monitoring in place, but extra
cost for the analysis of samples/imagery needed.
Between 100-200 stations may be recommended to cover plains and landscapes in a representative
way based on experiences from the Mareano mapping, although statistical analyses may be the best
basis when planning the number of stations.
Figure 2.5 Litter densities (kg/km-2) on 1778 video stations in Nordic Seas based on data from the
Mareano program from 2006 to 2017. Dashed line marks the border between the Barents Sea and the
Norwegian Sea (from Buhl-Mortensen and Buhl-Mortensen, 2017).
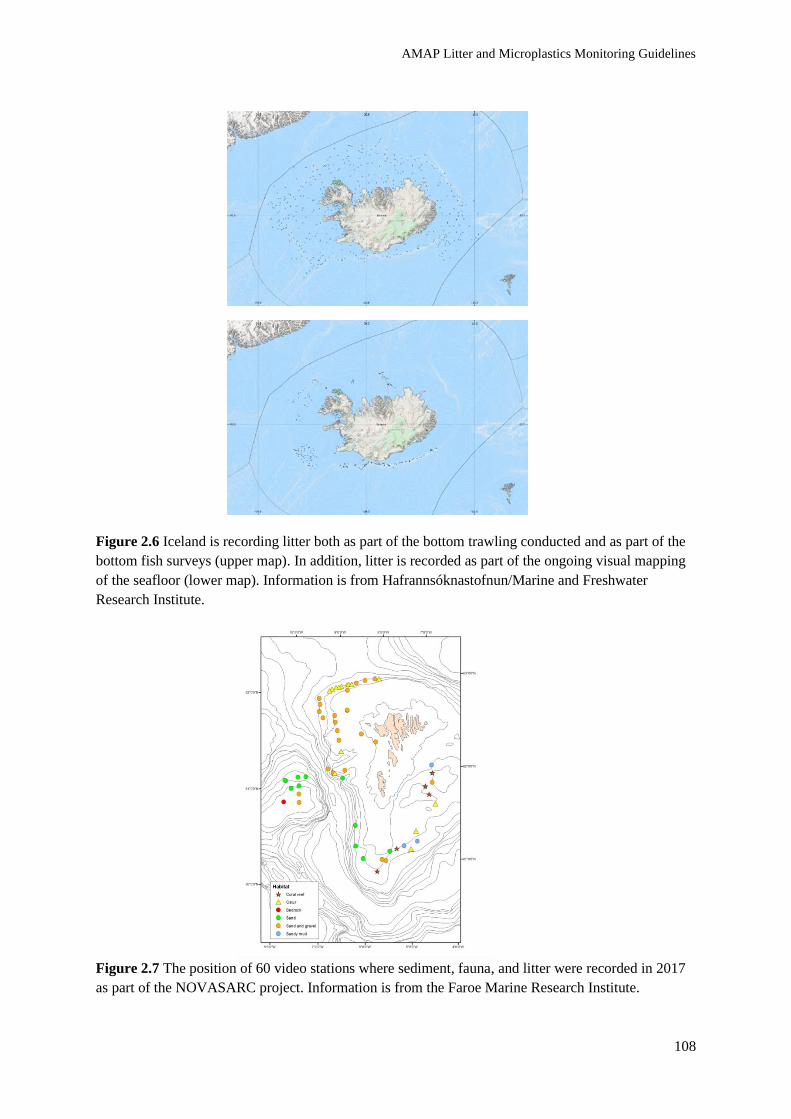
AMAP Litter and Microplastics Monitoring Guidelines
108
Figure 2.6 Iceland is recording litter both as part of the bottom trawling conducted and as part of the
bottom fish surveys (upper map). In addition, litter is recorded as part of the ongoing visual mapping
of the seafloor (lower map). Information is from Hafrannsóknastofnun/Marine and Freshwater
Research Institute.
Figure 2.7 The position of 60 video stations where sediment, fauna, and litter were recorded in 2017
as part of the NOVASARC project. Information is from the Faroe Marine Research Institute.

AMAP Litter and Microplastics Monitoring Guidelines
109
Figure 2.8 (Left) Location of sampling stations of HAUSGARTEN observatory run by AWI since
1999 in Fram Strait (red circles point to stations with camera surveys, ©T. Soltwedel). (Right) Litter
densities recorded between 2002 and 2017 during camera transects undertaken at HAUSGARTEN,
blue circles reflect measurements from the northern station (based on data from Martínez et al., 2020).
Figure 2.9 The joint Norwegian-Russian ecosystem survey in the Barents Sea performed annually in
August-October include approx. 300 stations.
r2 = 0.6

AMAP Litter and Microplastics Monitoring Guidelines
110
References
Amon, D.J., B.R.C. Kennedy, K. Cantwell, K. Suhre, D. Glickson, T.M. Shank and R.D. Rotjan,
2020. Deep-sea debris in the central and western Pacific Ocean. Frontiers in Marine Science, 7:369.
https://doi.org/10.3389/fmars.2020.00369
Bergmann, M., J. Dannheim, E. Bauerfeind and M. Klages, 2009. Trophic relationships along a
bathymetric gradient at the deep-sea observatory HAUSGARTEN. Deep-Sea Research Part I:
Oceanographic Research Papers, 56:408-424. https://doi.org/10.1016/j.dsr.2008.10.004
Bergmann, M. and M. Klages, 2012. Increase of litter at the Arctic deep-sea observatory
HAUSGARTEN. Marine Pollution Bulletin, 64:2734-2741.
https://doi.org/10.1016/j.marpolbul.2012.09.018
Bergmann, M., B. Lutz, M.B. Tekman and L. Gutow, 2017b. Citizen scientists reveal: marine litter
pollutes Arctic beaches and affects wild life. Marine Pollution Bulletin, 125(1-2):535-540.
https://doi.org/10.1016/j.marpolbul.2017.09.055
Bergmann, M., S. Mützel, S. Primpke, M.B. Tekman, J. Trachsel and G. Gerdts, 2019. White and
wonderful? Microplastics prevail in snow from the Alps to the Arctic. Science Advances,
5(8):eaax1157. https://doi.org/10.1126/sciadv.aax1157
Bergmann, M., N. Sandhop, I. Schewe and D. D’Hert, 2016. Observations of floating anthropogenic
litter in the Barents Sea and Fram Strait, Arctic. Polar Biology, 39(3):553-560.
https://doi.org/10.1007/s00300-015-1795-8
Bergmann, M., V. Wirzberger, T. Krumpen, C. Lorenz, S. Primpke, M.B. Tekman and G. Gerdts,
2017a. High quantities of microplastic in Arctic deep-sea sediments from the HAUSGARTEN
Observatory. Environmental Science and Technology, 51(19):11000-11010.
https://doi.org/10.1021/acs.est.7b03331
Bluhm, B.A., I.R. MacDonald, C. Debenham and K. Iken, 2005. Macro- and megabenthic
communities in the high Arctic Canada Basin: initial findings. Polar Biology, 28(3):218-231.
https://doi.org/10.1007/s00300-004-0675-4
Boetius, A and A. Purser, 2017. The Expedition PS101 of the Research Vessel POLARSTERN to the
Arctic Ocean in 2016. Alfred Wegener Institute for Polar and Marine Research, Bremerhaven,
Germany. http://doi.org/10.2312/BzPM_0706_2017
Boetius, A., S. Albrecht, K. Bakker, C. Bienhold, J. Felden, M. Fernández-Méndez, S. Hendricks, C.
Katlein, C. Lalande, T. Krumpen, M. Nicolaus, I. Peeken, B. Rabe, A. Rogacheva, E. Rybakova, R.
Somavilla, F. Wenzhöfer and RV Polarstern ARK27-3-Shipboard Science Party, 2013. Export of
algal biomass from the melting Arctic sea ice. Science, 339(6126):1430-1432.
https://doi.org/10.1126/science.1231346
Buhl-Mortensen, L. and P. Buhl-Mortensen, 2017. Marine litter in the Nordic Seas: distribution
composition and abundance. Marine Pollution Bulletin, 125:260-270.
https://doi.org/10.1016/j.marpolbul.2017.08.048
Buhl-Mortensen, P. and L. Buhl-Mortensen, 2018. Impacts of bottom trawling and litter on the seabed
in Norwegian waters. Frontiers in Marine Science 5:42. https://doi.org/10.3389/fmars.2018.00042
Canals, M., C.K. Pham, M. Bergmann, L. Gutow, G. Hanke, E. van Sebille, B. Angiolillo, L. Buhl-
Mortensen, A. Cau, C. Ioakeimidis, U. Kammann, L. Lundsten, G. Papatheodorou, A. Purser, A.
AMAP Litter and Microplastics Monitoring Guidelines
111
Sanchez-Vidal, M. Schulz, M. Vinci, S. Chiba, F. Galgani, D. Langenkämper, T. Möller, T.W.
Nattkemper, M. Ruiz, S. Suikkanen, L. Woodall, E. Fakiris, M.E.M. Jack and A. Giorgetti, 2021. The
quest for seafloor macrolitter: a critical review of background knowledge, current methods and future
prospects. Environmental Research Letters, 16:023001. https://doi.org/10.1088/1748-9326/abc6d4
Chiappone, M., H. Dienes, D.W. Swanson and S.L. Miller, 2005. Impacts of lost fishing gear on coral
reef sessile invertebrates in the Florida Keys National Marine Sanctuary. Biological Conservation
121(2):221-230. https://doi.org/10.1016/j.biocon.2004.04.023
Chiba, S., H. Saito, R. Fletcher, T. Yogi, M. Kayo, S. Miyagi, M. Ogido and K. Fujikura, 2018.
Human footprint in the abyss: 30 year records of deep-sea plastic debris. Marine Policy, 96:201-212.
https://doi.org/10.1016/j.marpol.2018.03.022
Dayton, P.K. and G.A. Robilliard, 1971. Implications of pollution to the McMurdo Sound benthos.
Antarctic Journal, :53-56.
Eleftheriou, A. and D.C. Moore, 2005. Macrofauna techniques. In: Methods for the Study of Marine
Benthos. A. Eleftheriou and A. McIntyre. Oxford, Blackwell Science, pp. 160-228.
https://doi.org/10.1002/9781118542392.ch5
Engler, R.E., 2012. The complex interaction between marine debris and toxic chemicals in the ocean.
Environmental Science and Technology, 46(22):12302-12315. https://doi.org/10.1021/es3027105
Feder, H.M., S.C. Jewett and J.R. Hilsinger, 1978. Man-made debris on the Bering Sea floor. Marine
Pollution Bulletin, 9(2):52-53. https://doi.org/10.1016/0025-326x(78)90534-9
Fischer, V., N.O. Elsner, N. Brenke, E. Schwabe and A. Brandt, 2015. Plastic pollution of the Kuril-
Kamchatka-trench area (NW Pacific). Deep Sea Research Part II: Topical Studies in Oceanography,
111:399-405. https://doi.org/10.1016/j.dsr2.2014.08.012
Fleet, D., T. Vlachogianni and G. Hanke, 2021. A Joint List of Litter Categories for Marine Macro-
litter Monitoring: manual for the application of the classification system. EUR 30348 EN.
Publications Office of the European Union, Luxembourg. https://doi.org/10.2760/127473
Galgani, F., T. Burgeot, G. Bocquéné, F. Vincent, J.P. Leauté, J. Labastie, A. Forest and R. Guichet,
1995b. Distribution and abundance of debris on the continental shelf of the Bay of Biscay and in
Seine Bay. Marine Pollution Bulletin, 30(1):58-62. https://doi.org/10.1016/0025-326x(94)00101-e
Galgani, F., A. Giorgetti, M. Vinci, M. Le Moigne, G. Moncoiffe, A. Brosich, E. Molina, M. Lipizer,
N. Holdsworth, R. Schlitzer, G. Hanke and D. Schaap, 2017. Proposal for Gathering and Managing
Data Sets on Marine Micro-litter on a European Scale, EMODnet Thematic Lot n°4 - Chemistry.
Project Documents. EMODnet, Oostende, Belgium. 35 pp. https://10.6092/8ce4e8b7-f42c-4683-9ece-
c32559606dbd
Galgani, F., S. Jaunet, A. Campillo, X. Guenegen and E. His, 1995a. Distribution and abundance of
debris on the continental shelf of the north-western Mediterranean Sea. Marine Pollution Bulletin
30(11):713-717. https://doi.org/10.1016/0025-326x(95)00055-r
Galgani, F., J.P. Leauté, P. Moguedet, A. Souplet, Y. Verin, A. Carpentier, H. Goraguer, D. Latrouite,
B. Andral, Y. Cadiou, J.C. Mahe, J.C. Poulard and P. Nerisson, 2000. Litter on the sea floor along
European coasts. Marine Pollution Bulletin, 40(6):516-527. https://doi.org/10.1016/s0025-
326x(99)00234-9
Galgani, F. and F. Lecornu, 2004. Debris on the seafloor at “Hausgarten”. In: M. Klages, J. Thiede
and J.-P. Foucher (editors). The Expedition ARK XIX/3 of the Research Vessel POLARSTERN in

AMAP Litter and Microplastics Monitoring Guidelines
112
2003: Reports of Legs 3a, 3b and 3c. Reports on Polar and Marine Research, 488. Pages 260–262.
Alfred Wegener Institute for Polar and Marine Research, Bremerhaven, Germany.
https://doi.org/10.2312/BzPM_0488_2004
Galgani, F., A. Souplet and Y. Cadiou, 1996. Accumulation of debris on the deep sea floor off the
French Mediterranean coast. Marine Ecology Progress Series, 142(1-3):225-234.
https://doi.org/10.3354/meps142225
Galil, B.S., A. Golik and M. Türkay, 1995. Litter at the bottom of the sea: a sea bed survey in the
Eastern Mediterranean. Marine Pollution Bulletin, 30(1):22-24. https://doi.org/10.1016/0025-
326x(94)00103-g
Green, D.S., B. Boots, D.J. Blockley, C. Rocha and R. Thompson, 2015. Impacts of discarded plastic
bags on marine assemblages and ecosystem functioning. Environmental Science and Technology,
49:5380-5389. https://doi.org/10.1021/acs.est.5b00277
Grøsvik, B.E., T. Prokhorova, E. Eriksen, P. Krivosheya, P.A. Horneland and D. Prozorkevich, 2018.
Assessment of marine litter in the Barents Sea, a part of the joint Norwegian-Russian ecosystem
survey. Frontiers in Marine Science, 5:72. https://doi.org/10.3389/fmars.2018.00072
Herring, P., 2002. The Biology of the Deep Ocean (Biology of Habitats). Oxford University Press,
Oxford, UK.
Hess, N.A., C.A. Ribic and I. Vining, 1999. Benthic marine debris, with an emphasis on fishery-
related items, surrounding Kodiak Island, Alaska, 1994-1996. Marine Pollution Bulletin, 38(10):885-
890. https://doi.org/10.1016/s0025-326x(99)00087-9
Holmström, A., 1975. Plastic films on the bottom of the Skagerack. Nature, 255:622-623.
https://doi.org/10.1038/255622a0
International Council for the Exploration of the Sea (ICES), 2019. The Working Group on the
Integrated Assessments of the Barents Sea (WGIBAR). ICES Scientific Reports. 1:42. 157pp.
http://doi.org/10.17895/ices.pub.5536
Jambeck, J.R., R. Geyer, C. Wilcox, T.R. Siegler, M. Perryman, A. Andrady, R. Narayan and K.L.
Law, 2015. Plastic waste inputs from land into the ocean. Science, 347(6223):768-771.
https://doi.org/10.1126/science.1260352
Jewett, S.C., 1976. Pollutants of the northeast Gulf of Alaska. Marine Pollution Bulletin, 7(9):169.
https://doi.org/10.1016/0025-326x(76)90213-7
June, J.A., 1990. Type, source, and abundance of trawl-caught debris off Oregon, in the Eastern
Bering Sea, and in Norton Sound in 1988. In: R.S. Shomurs and H.L. Codfrey (editors). Proceedings
of the Second International Conference on Marine Debris, 2-7 April 1989, Honolulu, Hawaii, USA.
Katsanevakis, S. and A. Katsarou, 2004. Influences on the distribution of marine debris on the
seafloor of shallow coastal areas in Greece (Eastern Mediterranean). Water, Air, and Soil Pollution,
159:325-337. https://doi.org/10.1023/b:wate.0000049183.17150.df
Keller, A.A., E.L. Fruh, M.M. Johnson, V. Simon and C. McGourty, 2010. Distribution and
abundance of anthropogenic marine debris along the shelf and slope of the US West Coast. Marine
Pollution Bulletin, 60(5):692-700. https://doi.org/10.1016/j.marpolbul.2009.12.006
AMAP Litter and Microplastics Monitoring Guidelines
113
Lee, D.-I., H.-S. Cho and S.-B. Jeong, 2006. Distribution characteristics of marine litter on the sea bed
of the East China Sea and the South Sea of Korea. Estuarine, Coastal and Shelf Science, 70(1-2):187-
194. https://doi.org/10.1016/j.ecss.2006.06.003
Lopez-Lopez, L., J.M. González-Irusta, A. Punzón and A. Serrano, 2017. Benthic litter distribution
and deep sea bottoms of the southern Bay of Biscay: analysis of potential drivers. Continental Shelf
Research, 144:112-119. https://doi.org/10.1016/j.csr.2017.07.003
MacDonald, I.R., B.A. Bluhm, K. Iken, S. Gagaev and S. Strong, 2010. Benthic macrofauna and
megafauna assemblages in the Arctic deep-sea Canada Basin. Deep Sea Research Part II: Topical
Studies in Oceanography, 57(1-2):136-152. https://doi.org/10.1016/j.dsr2.2009.08.012
MSFD Technical Subgroup on Marine Litter, 2013. Guidance on Monitoring of Marine Litter in
European Seas. European Union, Luxembourg. 128 pp. [online] URL:
http://www.ramoge.org/documents/MSFD%20Guidance%20on%20Monitoring%20Marine%20Litter
_2013_online.pdf
Martínez, K.B.P., M.B. Tekman and M. Bergmann, 2020. Temporal trends in marine litter at three
stations of the HAUSGARTEN Observatory in the Arctic Deep Sea. Frontiers in Marine Science,
7:321. https://doi.org/10.3389/fmars.2020.00321
Matsuoka, T., T. Nakashima and N. Nagasawa, 2005. A review of ghost fishing: scientific approaches
to evaluation and solutions. Fisheries Science 71(4):691. https://doi.org/10.1111/j.1444-
2906.2005.01019.x
Meyer, K S., M. Bergmann and T. Soltwedel, 2013. Interannual variation in the epibenthic megafauna
at the shallowest station of the HAUSGARTEN observatory (79° N, 6° E). Biogeosciences,
10(6):3479-3492. https://doi.org/10.5194/bg-10-3479-2013
Moore, S.L. and M.J. Allen, 2000. Distribution of anthropogenic and natural debris on the mainland
shelf of the Southern California Bight. Marine Pollution Bulletin, 40(1):83-88.
https://doi.org/10.1016/S0025-326X(99)00175-7
Mordecai, G., P.A. Tyler, D.G. Masson and V.A.I. Huvenne, 2011. Litter in submarine canyons off
the west coast of Portugal. Deep Sea Research Part II: Topical Studies in Oceanography, 58(23-
24):2489-2496. https://doi.org/10.1016/j.dsr2.2011.08.009
Morét-Ferguson, S., K.L. Law, G. Proskurowski, E.K. Murphy, E.E. Peacock and C.M. Reddy, 2010.
The size, mass, and composition of plastic debris in the western North Atlantic Ocean. Marine
Pollution Bulletin, 60(10):1873-1878. https://doi.org/10.1016/j.marpolbul.2010.07.020
Müller, J., K. Werner, R. Stein, K. Fahl, M. Moros and E. Jansen, 2012. Holocene cooling culminates
in sea ice oscillations in Fram Strait. Quaternary Science Reviews, 47:1-14.
https://doi.org/10.1016/j.quascirev.2012.04.024
Pace, R., M. Dimech, M. Camilleri and P.J. Schembri, 2007. Litter as a Source of Habitat Islands on
Deepwater Muddy Bottoms. Commission Internationale Pour L'Exploration Scientifique De La Mer
Mediterranée, Monaco.
Parker, P.A., 1990. Cleaning the oceans of the plastics threat. Sea Front, 36:18-27.
Peeken, I., S. Primpke, B. Beyer, J. Gütermann, C. Katlein, T. Krumpen, M. Bergmann, L. Hehemann
and G. Gerdts, 2018. Arctic sea ice is an important temporal sink and means of transport for
microplastic. Nature Communications, 9(1):1505. https://doi.org/10.1038/s41467-018-03825-5

AMAP Litter and Microplastics Monitoring Guidelines
114
Peng, X., M. Chen, S. Chen, S. Dasgupta, H. Xu, K. Ta, M. Du, J. Li, Z. Guo and S. Bai, 2018.
Microplastics contaminate the deepest part of the world’s ocean. Geochemical Perspectives Letters,
9:1-5. https://doi.org/10.7185/geochemlet.1829
Pham, C.K., J.N. Gomes-Pereira, E.J. Isidro, R.S. Santos and T. Morato, 2013. Abundance of litter in
the Condor Seamount (Azores, Portugal, Northeast Atlantic). Deep Sea Research Part II: Topical
Studies in Oceanography, 98:204-208. https://doi.org/10.1016/j.dsr2.2013.01.011
Pham, C.K., E. Ramirez-Llodra, C.H.S. Alt, T. Amaro, M. Bergmann, M. Canals, J.B. Company, J.
Davies, G. Duineveld, F. Galgani, K.L. Howell, V.A.I. Huvenne, E. Isidro, D.O.B. Jones, G. Lastras,
T. Morato, J. N. Gomes-Pereira, A. Purser, H. Stewart, I. Tojeira, X. Tubau, D. Van Rooij and P.A.
Tyler, 2014. Marine litter distribution and density in European Seas, from the shelves to deep basins.
PLoS ONE 9(4): e95839. https://doi.org/10.1371/journal.pone.0095839
Porter, A., B P. Lyons, T.S. Galloway and C. Lewis, 2018. The role of marine snows in microplastic
fate and bioavailability. Environmental Science and Technology, 52:7111-7119.
https://doi.org/10.1021/acs.est.8b01000
Ramirez-Llodra, E., B. De Mol, J.B. Company, M. Coll and F. Sardà, 2013. Effects of natural and
anthropogenic processes in the distribution of marine litter in the deep Mediterranean Sea. Progress in
Oceanography, 118:273-287. https://doi.org/10.1016/j.pocean.2013.07.027
Ramirez-Llodra, E., P.A. Tyler, M.C. Baker, O.A. Bergstad, M.R. Clark, E. Escobar, L.A. Levin, L.
Menot, A.A. Rowden, C.R. Smith and C.L. Van Dover, 2011. Man and the last great wilderness:
human impact on the Deep Sea. PLoS One, 6 (8):e22588.
https://doi.org/10.1371/journal.pone.0022588
Schlining, K., S. von Thun, L. Kuhnz, B. Schlining, L. Lundsten, N. Jacobsen Stout, L. Chaney and J.
Connor, 2013. Debris in the deep: using a 22-year video annotation database to survey marine litter in
Monterey Canyon, central California, USA. Deep Sea Research Part I: Oceanographic Research
Papers, 79:96-105. https://doi.org/10.1016/j.dsr.2013.05.006
Schulz, M., M. Bergmann, K. von Juterzenka and T. Soltwedel, 2010. Colonisation of hard substrata
along a channel system in the deep Greenland Sea. Polar Biology, 33(10):1359-1369.
https://doi.org/10.1007/s00300-010-0825-9
Shimanaga, M. and K. Yanagi, 2016. The Ryukyu Trench may function as a “depocenter” for
anthropogenic marine litter. Journal of Oceanography, 72(6) 895-903. https://doi.org/10.1007/s10872-
016-0388-7
Stefatos, A., M. Charalampakis, G. Papatheodorou and G. Ferentinos, 1999. Marine debris on the
seafloor of the Mediterranean Sea: examples from two enclosed gulfs in Western Greece. Marine
Pollution Bulletin, 38(5):389-393. https://doi.org/10.1016/s0025-326x(98)00141-6
Taylor, J., T. Krumpen, T. Soltwedel, J. Gutt and M. Bergmann, 2016. Regional- and local-scale
variations in benthic megafaunal composition at the Arctic deep-sea observatory HAUSGARTEN.
Deep-Sea Research I: Oceanographic Research Papers, 108:58-72.
https://doi.org/10.1016/j.dsr.2015.12.009
Tekman, M B., C. Wekerle, C. Lorenz, S. Primpke, C. Hasemann, G. Gerdts and M. Bergmann, 2020.
Tying up loose ends of microplastic pollution in the Arctic: distribution from the sea surface, through
the water column to deep-sea sediments at the HAUSGARTEN observatory. Environmental Science
and Technology, 54(7):4079-4090. https://doi.org/10.1021/acs.est.9b06981

AMAP Litter and Microplastics Monitoring Guidelines
115
United Nations Environment Programme (UNEP), 2009. Marine Litter: a global challenge. UNEP,
Nairobi, Kenya. [online] URL: https://www.unenvironment.org/resources/report/marine-litter-global-
challenge-0
van Sebille, E., S. Aliani, K.L. Law, N. Maximenko, J.M. Alsina, A. Bagaev, M. Bergmann, B.
Chapron, I. Chubarenko, A. Cózar, P. Delandmeter, M. Egger, B. Fox-Kemper, S.P. Garaba, L.
Goddijn-Murphy, B.D. Hardesty, M.J. Hoffman, A. Isobe, C.E. Jongedijk, M.L.A. Kaandorp, L.
Khatmullina, A.A. Koelmans, T. Kukulka, C. Laufkötter, L. Lebreton, D. Lobelle, C. Maes, V.
Martinez-Vicente, M.A. Morales Maqueda, M. Poulain-Zarcos, E. Rodríguez, P.G. Ryan, A.L.
Shanks, W.J. Shim, G. Suaria, M. Thiel, T.S. van den Bremer and D. Wichmann, 2020. The physical
oceanography of the transport of floating marine debris. Environmental Research Letters,
15(2):023003. https://doi.org/10.1088/1748-9326/ab6d7d
Watters, D.L., M.M. Yoklavich, M.S. Love and D.M. Schroeder, 2010. Assessing marine debris in
deep seafloor habitats off California. Marine Pollution Bulletin, 60(1):131-138.
https://doi.org/10.1016/j.marpolbul.2009.08.019
Wei, C.-L., G.T. Rowe, C.C. Nunnally and M.K. Wicksten, 2012. Anthropogenic “litter” and
macrophyte detritus in the deep Northern Gulf of Mexico. Marine Pollution Bulletin, 64(5):966-973.
https://doi.org/10.1016/j.marpolbul.2012.02.015
Woodall, L.C., A. Sanchez-Vidal, M. Canals, G.L.J. Paterson, R. Coppock, V. Sleight, A. Calafat,
A.D. Rogers, B.E. Narayanaswamy and R.C. Thompson, 2014. The deep sea is a major sink for
microplastic debris. Royal Society Open Science, 1(4):140317. https://doi.org/10.1098/rsos.140317
Woodall, L.C., L.F. Robinson, A.D. Rogers, B.E. Narayanaswamy and G.L.J. Paterson, 2015.
Deep sea litter: a comparison of seamounts, banks and a ridge in the Atlantic and
Indian oceans reveals both environmental and anthropogenic factors impact accumulation
and composition. Frontiers in Marine Science, 2:3. https://doi.org/10.3389/fmars.2015.00003
Yoshikawa, T. and K. Asoh, 2004. Entanglement of monofilament fishing lines and coral death.
Biological Conservation, 117(5):557-560. https://doi.org/10.1016/j.biocon.2003.09.025

AMAP Litter and Microplastics Monitoring Guidelines
116
3.0 Guidance for Monitoring Biotic Environmental Compartments
3.1 Invertebrates (benthic and pelagic) AUTHORS: BJØRN EINAR GRØSVIK, MARIA E. GRANBERG, TANJA KÖGEL, AMY L. LUSHER, ALESSIO GOMIERO,
HALLDOR P. HALLDORSSON, HERMANN DREKI GULS, CHELSEA M. ROCHMAN, AND KERSTIN MAGNUSSON
3.1.1 Introduction
Monitoring levels of microplastics (MP) particles in the sub-Arctic and Arctic marine food web can
give us information on occurrences and abundances of MP pollution, as well as provide indications of
ecosystem health. It is, however, important to recognize that invertebrate samples may not provide
time trends or reflect environmental concentrations as clearly as some abiotic compartments due to
biotic selection processes. There is also often great variation in MP counts between species and
among individuals within the same site, something that hampers interpretation (Setälä et al., 2016;
Gomiero et al., 2019; Piarulli et al., 2019; Bråte et al., 2020). Marine invertebrates, both pelagic and
benthic, encounter a multitude of particles daily, provoking the development of strategies to reject
particles of low nutritional value from actual food items. There is limited evidence that ingested MP
are translocated through respiratory and intestinal epithelia and accumulated in tissues (Browne et al.,
2008; von Moos et al., 2012; Avio et al., 2015; Brennecke et al., 2015; Welden and Cowie, 2016; Cui
et al., 2017; Abbasi et al., 2018; Abidli et al., 2019; Mohsen et al., 2019). Many size ranges or types
of particles are most likely ingested and egested. Exceptions exist related to, for example, the gut
physiology of Norway lobsters (Nephrops norvegicus) where ingested fibers accumulate in the gut
between molts (Welden and Cowie, 2016). An interesting effect was described in Antarctic krill
(Euphausia superba) and Norway lobster showing that the gastric mill can break down MP to smaller
sizes and translocate them to different anatomical compartments (Dawson, 2018; Cau et al., 2020;
Martinelli et al., 2021).
Coupled with information on how different polymer types, shapes, and concentrations may affect
selected species and life stages in controlled laboratory experiments, environmental concentrations
may be used for risk assessments (Kögel et al., 2020). Many laboratory studies, however, use
unrealistically high exposures (e.g., Cole et al., 2013, 2016; Setälä et al., 2014). This may reflect
environmental MP concentrations when comparing extremes in MP exposure such as city harbors but
not with remote offshore sites (e.g., Bråte et al., 2020). Furthermore, most studies expose with round
plastic beads, not with fragments and fibers, which are prevalent in the environment. These studies
function as “proof of concept” but have their limitations when deducing the fate and effects of MP in
nature (Phuong et al., 2016). More information is therefore needed on which sizes, forms, and
polymer types can pose problems for invertebrates under realistic exposure situations. Size matters
more than shape (Lehtiniemi et al., 2018), and MP of larger size fractions will probably only provide
a snapshot of MP ingestion at the time of sampling.
Updated ecotoxicological information will be key for accurate assessments of good environmental
status and for informed advice to management on possible impacts and mitigation efforts.
Recognizing these shortcomings, it is useful to establish indicator species for different parts of the
food web, both from the water column and the benthic fauna, and species representative of Arctic
ecosystems.

AMAP Litter and Microplastics Monitoring Guidelines
117
3.1.2 Summary of information to date
There have till now only been a handful of studies quantifying and characterizing ingestion of plastic
pollution in marine invertebrates from the Arctic.
Pelagic invertebrates
Several studies have shown uptake of MP in zooplankton under natural conditions, for example in the
Northwest Pacific and the coastal waters of Southeast Alaska and British Columbia (Desforges et al.,
2015) and in salps from the North Pacific Subtropical Gyre, California Current (Brandon et al., 2019).
Huntington et al., 2020 reported the presence of MP in various species of zooplankton from the
Eastern Canadian Arctic. In the Huntington et al., 2020 study, MP were found in about 90% of
zooplankton samples, and at a mean abundance of 0.7 ± 0.9 pieces per gram of zooplankton.
The ability of zooplankton to ingest MP has been demonstrated in several laboratory experiments
(reviewed in Galloway et al., 2017 and Villarrubia-Gómez et al., 2018). Microplastic ingestion by
zooplankton may have negative effects, as demonstrated in laboratory conditions when polystyrene
particles in the size range 1.7-30.6 µm induced gut-blockage and increased gut-retention times leading
to reduced feeding function (Cole et al., 2013), as well as reduced fecundity linked to the physical
disturbance caused by the presence of plastic in the digestive tract (polystyrene particles, 20 µm; Cole
et al., 2015). It should however be pointed out that the particle concentrations in these two studies
were extremely high compared to what is normally found in the environment, 4x10⁶ MP L-1 and
75,000 MP L-1, respectively. Water concentrations of MP > 11 µm in the area around the
HAUSGARTEN observatory in the Arctic were found to range between 0 and 1.3 MP L-1 (Tekman et
al., 2020).
The degree of transfer and bioaccumulation of plastic-associated toxic substances, such as persistent
organic pollutants (POPs), to zooplankton and fishes is an active area of research, but evidence is
currently limited (Lohmann, 2017). The amount of natural organic material to which POPs can adsorb
outnumbers the amount of plastics and MP by many orders of magnitude. In a study from the South
Atlantic Ocean by Rochman et al., 2014, several hydrophobic organic contaminants were analyzed in
plastic debris and in mesopelagic lantern fishes, and the only correlation that might indicate an uptake
in the animals from the plastic was found for polybrominated diphenyl ethers (PBDEs), used as flame
retardants.
The melting zone of Arctic sea ice is an important part of the Arctic ecosystem with high productivity
and biodiversity. Because the Arctic sea ice has been reported to contain high levels of MP particles
(Obbard et al., 2014; Peeken et al., 2018; von Friesen et al., 2020), levels of MP particles taken up by
ice-associated zooplankton would be interesting to monitor by sampling zooplankton living close to
the melting zone, although sampling approaches may be challenging.
Benthic invertebrates
Microplastics sink to the seafloor due to the polymer having a density greater than seawater (Woodall
et al., 2014; Kowalski et al., 2016; Erni-Cassola et al., 2019), by being weighed down by biofouling
(Kaiser et al., 2017; Rummel et al., 2017), orby being incorporated into marine snow (Porter et al.,
2018; Zhao et al., 2018). Because of this, benthic fauna feeding on settling particles or sediments
constitutes a relevant matrix for monitoring MP pollution (GESAMP, 2019). Fang et al., 2018
reported MP in 11 species of benthic invertebrates (including starfish, shrimp, crab, whelk, and
AMAP Litter and Microplastics Monitoring Guidelines
118
bivalves) sampled from the Bering and Chukchi Seas. They found averages of 0.02-0.46 pieces per
gram wet weight or 0.04-1.67 pieces per individual. The greatest concentration appeared at the
northernmost site in the Chukchi Sea, implying that the sea ice and the cold current represent possible
transport media for MP ingested by benthic fauna and pointing to transfer mechanisms similar to
those implied by the research carried out in the Fram Strait by Peeken et al., 2018. In many of these
studies, microfibers were the most common MP form found.
Bivalves
Filter-feeding species like bivalves have been suggested as candidate organisms for monitoring the
uptake and effects of MP particles in seawater and sediments (GESAMP, 2019). Bivalves are reported
to be selective with regard to the uptake of MP and they egest particles as feces and pseudofeces, and
therefore their suitability as an indicator species has been questioned (Ward et al., 2019).
Bråte et al., 2018 reported an overall average abundance of 1.5 MP per individual blue mussel
(Mytilus edulis) sampled from Norwegian waters (n = 29 sites, 545 individuals). This study was
extended to test the applicability of other benthic bivalves in Nordic waters. Interestingly, it was
relatively hard to obtain high numbers of individuals in many of the site locations requiring the study
of more than one closely related species. Five bivalve species, including mussels, from 100 sites were
selected: 32 of the hard-bottom species Mytilus spp., 14 of the 3 soft-bottom species Limecola
balthica, 31 Abra nitida, 20 Thyasira spp., and 3 of the hard-bottom Arctic Hiatella artica. Four of
the five species were found to contain MP: Mytilus spp., L. balthica, A. nitida, and Thyasira spp. At
11 Mytilus sites, 2.77 or more MP per individual were found, with the inner Oslofjord mussels
containing the highest concentration of MP (> 61 MP per individual), both in 2017 and 2018. Areas of
Skagerrak, Kattegat, the Baltic Sea, and the North Sea close to urban areas were also found to have
high levels of MP compared to other sites. Black rubbery particles were dominant in Mytilus spp., A.
nitida, and L. balthica. These rubbery particles could stem from road runoff or other sources of rubber
such as tires used in harbors. Microplastics between 63 and 1,000 µm were present in A. nitida and L.
balthica, however, no MP larger than 63 µm were detected in Thyasira spp. This study shows that
urbanized areas in the Nordic marine environment are receiving high levels of MP, and that bivalves
could be used to monitor small MP. It also highlights that bivalves from the Nordic environment are
exposed to rubber, and the sources of rubber should be further investigated.
Blue mussels collected in Iceland contained on average 1.3 MP particles per individual (Halldórsson
and Guls, 2018). Blue mussels collected at different sites near Sisimiut in Greenland contained on
average 6 ± 5 MP items per individual with greater concentrations closer to wastewater outlets and
dumping sites (Granberg et al., 2020). Microplastic content was also analyzed in samples of the
suspension feeding bivalve, Greenland smoothcockle (Serripes groenlandicus), collected in
Kongsfjorden and Rijpfjorden, Svalbard. Of the individuals collected, 69% contained one or more MP
with an average of 1.2 ± 1.1 particles per individual (von Friesen, 2018). These low counts obscured
any differences between collection sites, which stresses the need for research regarding appropriate
Arctic monitoring species.
Crustaceans
Approximately 20% of snow crabs (Chionoecetes opilio) in the Barents Sea contained MP in their
stomachs (Sundet, 2014). Amphipods (Gammarus setosus) collected in the Kongsfjorden-
Krossfjorden system, Svalbard, Norway, contained very few anthropogenic microparticles (2 ± 2) and

AMAP Litter and Microplastics Monitoring Guidelines
119
no difference was detected among sampling sites, regardless of proximity to possible sources
(Granberg et al., 2020).
Echinoderms
Deep-sea starfish (Hymenaster pellucidus) from Rockall, Great Britain, contained 1.6 MP per g ww
(Courtene-Jones et al., 2017). Of the litter items observed on the seafloor of the HAUSGARTEN
observatory, 67% were in some way interacting with epibenthic megafauna (Bergmann and Klages,
2012). We suggest future work focuses on these organisms to inform expected contamination in local
food webs and to help us understand the fate of MP in Arctic food webs (e.g., trophic transfer,
bioaccumulation, biomagnification, trophic dilution; Provencher et al., 2019).
3.1.3 Sampling
Sampling invertebrates in the environment should consider local conditions. For example, sampling
mussels from suspended ropes/lines in the aquatic environment may result in higher levels of ingested
MP based on the substrate. Therefore, the habitat of any benthic invertebrates should be considered.
Often, 30 individuals are collected for monitoring surveys, but the number of individuals sampled
should be planned according to requirements for statistical analyses. Directly after collection,
invertebrates should be rinsed with seawater to remove debris, with filtered (0.2 µm) MQ water, and
subsequently stored individually in aluminium foil covered and lidded pre-rinsed (three times with 0.2
µm filtered MQ water) glass jars. All samples should be stored frozen (-20 °C) and dark until MP
extraction and analysis. Swift handling of individuals after collection prevents sample loss through
organisms expelling material from their guts or ingesting plastics in another environment than their
own. Open containers to control for air dust during sampling should be provided.
3.1.4. Extraction
Size and weight measurements and preparation of biota for extraction should take place in a clean air
laminar flow cabinet to avoid airborne MP contamination. There are several tissue digestion protocols
used for invertebrates, for example, a gentle and effective digestion protocol uses pancreatic enzymes
from swine (von Friesen et al., 2019). Potassium hydroxide (KOH) is mostly used for bivalves (Bråte
et al., 2018, 2020; Gomiero et al., 2019). General recommendation of protocols should await a process
of international standardization and harmonization. The most important factor when selecting a
digestion method is to control for and keep at a minimum MP degradation and loss, while removing
enough of the tissue and other particles to enable analysis.

AMAP Litter and Microplastics Monitoring Guidelines
120
Box A: Data needs/expectations for reporting MP in invertebrates.
Must have
• Name of researcher
• Species
• Location, including latitude and longitude
• Date: day, month, year, time
• Sampling method (e.g., vertical plankton trawl 180 µm mesh size, diving, benthic trawl,
cages/pots)
• Sampling depth (m)
• Size, weight
• Physiological status: relevant support data for the different species, e.g, season, sex, spawning
status, molting stage, condition index
• Tissue(s) sampled
• Total number of samples/individuals per site (i.e., n)
• Filter type and pore size used
• Total and relative abundance of MP particles (with lower size limit)
• Particle category (e.g., fragment/foam/sheet/fiber/other), size, color reported in eight broad
color groups, or mass per tissue weight and particle size group, as mean, with standard
deviation and number of samples, median, and range for particles > 300 µm
• Collection, extraction, analysis method including equipment, quality assurance/quality control
(QA/QC), limit of detection of MP size and/or mass, and measurement uncertainty
Beneficial to have for all data
• Polymer type (according to Figure 3 in Primpke et al., 2017)
• Either MP mass or number per tissue weight and particle size group, as mean, with standard
• deviation and number of samples, median, and range for particles < 300 µm
3.1.5 Quality assurance and quality control
In general, systems for QA/QCs need to be developed. Overall, QA/QC for any invertebrate studies
should have sampling blanks and laboratory blanks to account for background contamination,
especially of microfibers. See Section 2.2 for a more detailed description of laboratory blanks.
3.1.6 Recommendations
Given the lack of harmonized protocols for monitoring in many species and the wider diversity of
species found across the pan-Arctic, the primary recommendation is to focus on suspension feeding
species (e.g., mussels) that can contribute to the monitoring of MP in the environment, and in future
studies, to examine the effects in relation to ecosystems and human health (Table 3.1).
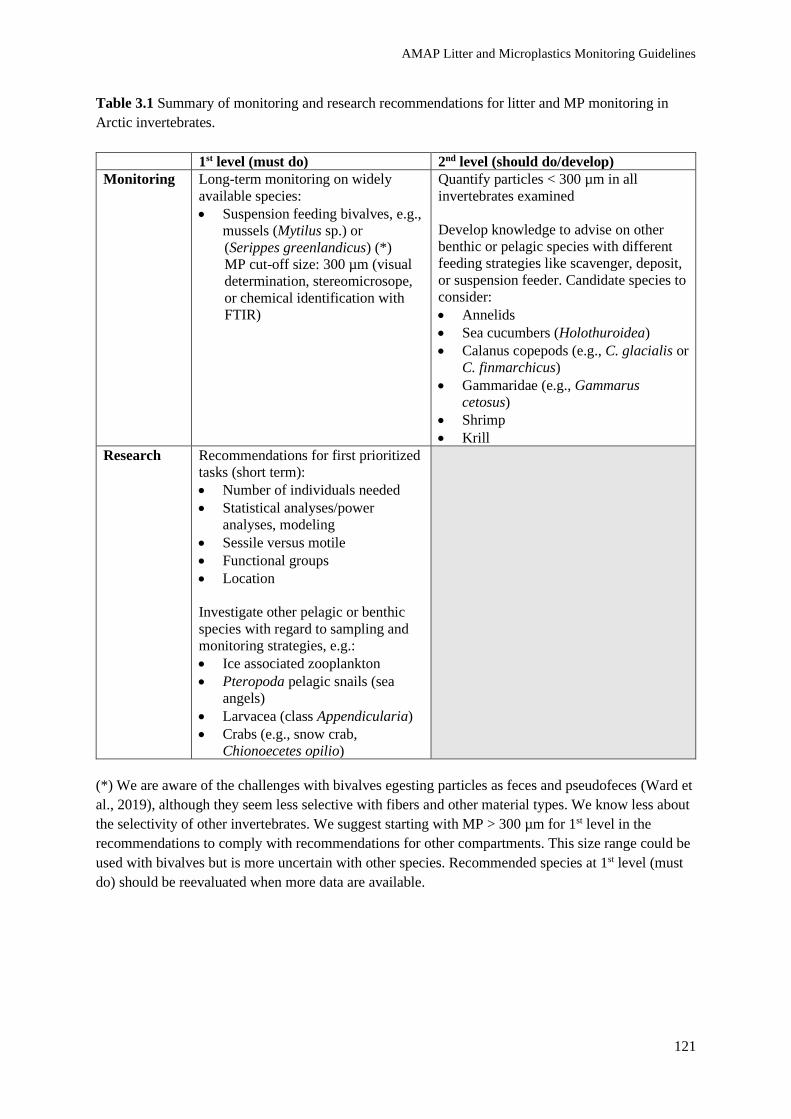
AMAP Litter and Microplastics Monitoring Guidelines
121
Table 3.1 Summary of monitoring and research recommendations for litter and MP monitoring in
Arctic invertebrates.
1st level (must do) 2nd level (should do/develop)
Monitoring Long-term monitoring on widely
available species:
• Suspension feeding bivalves, e.g.,
mussels (Mytilus sp.) or
(Serippes greenlandicus) (*)
MP cut-off size: 300 µm (visual
determination, stereomicrosope,
or chemical identification with
FTIR)
Quantify particles < 300 µm in all
invertebrates examined
Develop knowledge to advise on other
benthic or pelagic species with different
feeding strategies like scavenger, deposit,
or suspension feeder. Candidate species to
consider:
• Annelids
• Sea cucumbers (Holothuroidea)
• Calanus copepods (e.g., C. glacialis or
C. finmarchicus)
• Gammaridae (e.g., Gammarus
cetosus)
• Shrimp
• Krill
Research Recommendations for first prioritized
tasks (short term):
• Number of individuals needed
• Statistical analyses/power
analyses, modeling
• Sessile versus motile
• Functional groups
• Location
Investigate other pelagic or benthic
species with regard to sampling and
monitoring strategies, e.g.:
• Ice associated zooplankton
• Pteropoda pelagic snails (sea
angels)
• Larvacea (class Appendicularia)
• Crabs (e.g., snow crab,
Chionoecetes opilio)
(*) We are aware of the challenges with bivalves egesting particles as feces and pseudofeces (Ward et
al., 2019), although they seem less selective with fibers and other material types. We know less about
the selectivity of other invertebrates. We suggest starting with MP > 300 µm for 1st level in the
recommendations to comply with recommendations for other compartments. This size range could be
used with bivalves but is more uncertain with other species. Recommended species at 1st level (must
do) should be reevaluated when more data are available.

AMAP Litter and Microplastics Monitoring Guidelines
122
Table 3.2 Summary rationale for recommendations, including estimated costs for implementing
programs: 0 - already in place; $ - relatively inexpensive because of synergy with other projects but
needs to have some additional capacity; $$ - either networks and capacity will need to be developed;
$$$ - development of sampling networks, processing capacity, and reporting all need to be developed.
Recommendation Program
Cost Rationale
Community-based
monitoring and
collection of
bivalves that are
commonly
consumed.
$
Many communities in the Arctic harvest bivalves regularly
(e.g., mussels, clams). Community-based monitoring sampling
programs should be developed to collect bivalves of interest
for monitoring levels of ingested MP. This would also provide
samples for effects from plastic contaminants for future
studies.
Use existing Arctic
cruises to obtain
pelagic invertebrate
samples.
$$ Existing monitoring programs are already in place for
sediments regarding pollutants, trophic status, and biota
making it easy to include sampling for MP. The main cost
involves processing and analysis of samples, which can be
quite costly, thus two dollar signs.
3.1.7 Existing monitoring for invertebrates/contaminants in the Arctic
The joint Norwegian-Russian ecosystem survey in the Barents Sea performed annually in August-
October includes sampling of several fish species, shrimp, and sediments for contaminant monitoring.
Floating debris and macrolitter as bycatch in trawls are recorded. Microplastics are collected from
manta trawls from some of the stations. Organisms for MP monitoring can be provided upon request
(Figure 3.1).

AMAP Litter and Microplastics Monitoring Guidelines
123
Figure 3.1 The joint Norwegian-Russian ecosystem survey in the Barents Sea performed annually in
August-October includes approx. 300 stations.

AMAP Litter and Microplastics Monitoring Guidelines
124
Figure 3.2 Locations of existing sampling for MP in invertebrates in the AMAP region.

AMAP Litter and Microplastics Monitoring Guidelines
125
References
Abbasi, S., N. Soltani, B. Keshavarzi, F. Moore, A. Turner, and M. Hassanaghaei, 2018.
Microplastics in different tissues of fish and prawn from the Musa Estuary, Persian Gulf.
Chemosphere, 205:80-87. https://doi.org/10.1016/j.chemosphere.2018.04.076
Abidli, S., Y. Lahbib, and N.T. El Menif, 2019. Microplastics in commercial mollusks from the
lagoon of Bizerte (Northern Tunisia). Marine Pollution Bulletin, 142:243-252.
https://doi.org/10.1016/j.marpolbul.2019.03.048
Avio, C.G., S. Gorbi, M. Milan, M. Benedetti, D. Fattorini, G. d'Errico, M. Pauletto, L. Bargelloni,
and F. Regoli, 2015. Pollutants bioavailability and toxicological risk from microplastics to marine
mussels. Environmental Pollution, 198:211-222. https://doi.org/10.1016/j.envpol.2014.12.021
Bergmann, M. and M. Klages, 2012. Increase of litter at the Arctic deep-sea observatory
HAUSGARTEN. Marine Pollution Bulletin, 64(12):2734-2741.
https://doi.org/10.1016/j.marpolbul.2012.09.018
Brandon, J.A., A. Freibott, and L.M. Sala, 2019. Patterns of suspended and salp-ingested
microplastics debris in the North Pacific investigated with epifluorescence microscopy. Limnology
and Oceanography Letters, 5(1). https://doi.org/10.1002/lol2.10127
Bråte, I.L.N., R. Hurley, K. Iversen, J. Beyer, K.V. Thomas, C.C. Steindal, N.W. Green, M. Olsen and
A. Lusher, 2018. Mytilus spp. as sentinels for monitoring microplastics pollution in Norwegian coastal
waters: a qualitative and quantitative study. Environmental Pollution, 243:383-393.
https://doi.org/10.1016/j.envpol.2018.08.077
Bråte, I.L.N., R. Hurley, A. Lusher, N. Buenaventura, M. Hultman, C. Halsband, and N. Green, 2020.
Microplastics in marine bivalves from the Nordic environment. Nordisk Ministerråd, Copenhagen,
Denmark. https://doi.org/10.6027/temanord2020-504
Brennecke, D., E.C. Ferreira, T.M.M. Costa, D. Appel, B.A.P. da Gama and M. Lenz, 2015. Ingested
microplastics (>100 𝜇m) are translocated to organs of the tropical fiddler crab Uca rapax. Marine
Pollution Bulletin, 96(1-2):491-495. https://doi.org/10.1016/j.marpolbul.2015.05.001
Browne, M.A., A. Dissanayake, T.S. Galloway, D.M. Lowe, and R.C. Thompson, 2008. Ingested
microscopic plastic translocates to the circulatory system of the mussel Mytilus edulis (L.).
Environmental Science and Technology, 42:5026-5031. https://doi.org/10.1021/es800249a
Cau, A., C.G. Avio, C. Dessì, D. Moccia, A. Pusceddu, F. Regoli, R. Cannas and M.C. Follesa, 2020.
Benthic crustacean digestion can modulate the environmental fate of microplastics in the deep
sea. Environmental Science and Technology, 54(8):4886-4892.
https://doi.org/10.1021/acs.est.9b07705
Cole, M., P.K. Lindeque, E. Fileman, J. Clark, C. Lewis, C. Halsband and T.S. Galloway, 2016.
Microplastics alter the properties and sinking rates of zooplankton faecal pellets. Environmental
Science and Technology, 50:3239-3246. https://doi.org/10.1021/acs.est.5b05905

AMAP Litter and Microplastics Monitoring Guidelines
126
Cole, M., P. Lindeque, E. Fileman, C. Halsband and T. S. Galloway, 2015. The impact of polystyrene
microplastics on feeding, function and fecundity in the marine copepod Calanus helgolandicus.
Environmental Science and Technology, 49(2):1130-1137. https://doi.org/10.1021/es504525u
Cole, M., P. Lindeque, E. Fileman, C. Halsband, R. Goodhead, J. Moger and T.S. Galloway, 2013.
Microplastics ingestion by zooplankton. Environmental Science and Technology, 47(12):6646-6655.
ttps://doi.org/10.1021/es400663f
Courtene-Jones, W., B. Quinn, S.F. Gary, A.O.M. Mogg and B.E. Narayanaswamy, 2017.
Microplastic pollution identified in deep-sea water and ingested by benthic invertebrates in the
Rockall Trough, North Atlantic Ocean. Environmental Pollution, 231:271-280.
https://doi.org/10.1016/j.envpol.2017.08.026
Cui, R., S.W. Kim and Y.-N. An, 2017. Polystyrene nanoplastics inhibit reproduction and induce
abnormal embryonic development in the freshwater crustacean Daphnia galeata. Scientific Reports,
7:12095. https://doi.org/10.1038/s41598-017-12299-2
Dawson, A.L., S. Kawaguchi, C.K. King, K.A. Townsend, R. King, W.M. Huston and S.M.B. Nash,
2018. Turning microplastics into nanoplastics through digestive fragmentation by Antarctic krill.
Nature Communications, 9:1001. https://doi.org/10.1038/s41467-018-03465-9
Desforges, J.-P.W., M. Galbraith and P.S. Ross, 2015. Ingestion of microplastics by zooplankton in
the Northeast Pacific Ocean. Archives of Environmental Contamination and Toxicology, 69:320-330.
https://doi.org/10.1007/s00244-015-0172-5
Erni-Cassola, G., V. Zadjelovic, M.I. Gibson and J.A. Christie-Oleza, 2019. Distribution of plastic
polymer types in the marine environment: a meta-analysis. Journal of Hazardous Materials, 369:691-
698. https://doi.org/10.1016/j.jhazmat.2019.02.067
Fang, C., R. Zheng, Y. Zhang, F. Hong, J. Mu, M. Chen, P. Song, L. Lin, H. Lin, F. Le and J. Bo,
2018. Microplastics contamination in benthic organisms from the Arctic and sub-Arctic regions.
Chemosphere, 209:298-306. https://doi.org/10.1016/j.chemosphere.2018.06.101
Galloway, T.S., M. Cole and C. Lewis, 2017. Interactions of MP debris throughout the marine
ecosystem. Nature Ecology and Evolution, 1:116. https://doi.org/10.1038/s41559-017-0116
Gomiero, A., P. Strafella, K.B. Øysæd and G. Fabi, 2019. First occurrence and composition
assessment of microplastics in native mussels collected from coastal and offshore areas of the
northern and central Adriatic Sea. Environmental Science and Pollution Research, 26(24):24407-
24416. https://doi.org/10.1007/s11356-019-05693-y
Granberg, M.E., L.W. von Friesen, A. Ask, F. Collard, K. Magnusson, A-K. Eriksson Wiklund, F.
Murphy, J. Strand, G.W. Gabrielsen and L. Bach, 2020. Microlitter in Arctic marine benthic food
chains and potential effects on sediment dwelling fauna. TemaNord, 528. Nordic Council of
Ministers, Copenhagen, Denmark. https://doi.org/10.6027/temanord2020-528
Group of Experts on Scientific Aspects of Marine Environmental Protection (GESAMP), 2019.
Guidelines for the Monitoring and Assessment of Plastic Litter and Microplastics in the Ocean.

AMAP Litter and Microplastics Monitoring Guidelines
127
GESAMP, London, UK, 130pp. [online] URL: http://www.gesamp.org/publications/guidelines-for-
the-monitoring-and-assessment-of-plastic-litter-in-the-ocean
Halldórsson, H.P. and H.D. Guls, 2018. Könnun á örplastmengun í kræklingi (Mytilus edulis) við
Ísland [Microplastics in blue mussels (Mytilus edulis) in Iceland 2018]. Report for the Environment
Agency of Iceland, Reykjavík, Iceland. [online] URL: https://www.ust.is/library/sida/haf-og-
vatn/Orplast_kraeklingur_2018_skyrsla_UST_HI_Sudurnes_Leidrett_2019.pdf
Huntington, A., P.L. Corcoran, L. Jantunen, C. Thaysen, S. Bernstein, G.A. Stern and C.M. Rochman,
2020. A first assessment of microplastics and other anthropogenic particles in Hudson Bay and the
surrounding eastern Canadian Arctic waters of Nunavut. FACETS, 5:432-454.
https://doi.org/10.1139/facets-2019-0042
Kaiser, D., N. Kowalski and J.J. Waniek, 2017. Effects of biofouling on the sinking behavior of
microplastics. Environmental Research Letters, 12:124003. https://doi.org/10.1088/1748-9326/aa8e8b
Kögel, T., Ø. Bjorøy, B. Toto, A.M. Bienfait and M. Sanden, 2020. Micro-and nanoplastic toxicity on
aquatic life: determining factors. Science of the Total Environment, 709:136050.
https://doi.org/10.1016/j.scitotenv.2019.136050
Kowalski, N., A.M. Reichardt, J.J. Waniek, 2016. Sinking rates of microplastics and potential
implications of their alteration by physical, biological, and chemical factors. Marine Pollution
Bulletin, 109:310-319. https://doi.org/10.1016/j.marpolbul.2016.05.064
Lehtiniemi, M., S. Hartikainen, P. Näkki, J. Engström-Öst, A. Koistinen and O. Setälä, 2018. Size
matters more than shape: ingestion of primary and secondary microplastics by small predators. Food
Webs, 17:e00097. https://doi.org/10.1016/j.fooweb.2018.e00097
Lohmann, R. 2017. Microplastics are not important for the cycling and bioaccumulation of organic
pollutants in the oceans-but should microplastics be considered POPs themselves? Integrated
Environmental Assessment and Management, 13(3):460-465. http://dx.doi.org/10.1002/ieam.1914
Martinelli, M., A. Gomiero, S. Guicciardi, E. Frapiccini, P. Strafella, S. Angelini, F. Domenichetti, A.
Belardinelli and S. Colella, 2021. Preliminary results on the occurrence and anatomical distribution in
wild populations of Nephrops norvegicus from the Adriatic Sea. Environmental Pollution,
278:116872. https://doi.org/10.1016/j.envpol.2021.116872
Mohsen, M., Q. Wang, L. Zhang, L. Sun, C. Lin and H. Yang, 2019. Microplastics ingestion by the
farmed sea cucumber Apostichopus japonicus in China. Environmental Pollution, 245:1071-1078.
https://doi.org/10.1016/j.envpol.2018.11.083
Obbard, R.W., S. Sadri, Y.Q. Wong, A.A. Khitun, I. Baker and R.C. Thompson, 2014. Global
warming releases microplastics legacy frozen in Arctic Sea ice. Earth’s Future, 2:315-320.
https://doi.org/10.1002/2014ef000240
Peeken, I., S. Primpke, B. Beyer, J. Gütermann, C. Katlein, T. Krumpen, M. Bergmann, L. Hehemann
and G. Gerdts, 2018. Arctic sea ice is an important temporal sink and means of transport for
microplastics. Nature Communications, 9:1505. https://doi.org/10.1038/s41467-018-03825-5

AMAP Litter and Microplastics Monitoring Guidelines
128
Phuong, N.N., A. Zalouk-Vergnoux, L. Poirier, A. Kamari, A. Châtel, C. Mouneyrac and F. Lagarde,
2016. Is there any consistency between the microplastics found in the field and those used in
laboratory experiments? Environmental Pollution, 211:111-123.
https://doi.org/10.1016/j.envpol.2015.12.035
Piarulli, S., S. Scapinello, P. Comandini, K. Magnusson, M. Granberg, J.X.W. Wong, G. Sciutto, S.
Prati, R. Mazzeo, A.M. Booth and L. Airoldi, 2019. Microplastics in wild populations of the
omnivorous crab Carcinus aestuarii: a review and a regional-scale test of extraction methods,
including microfibres. Environmental Pollution, 251:117-127.
https://doi.org/10.1016/j.envpol.2019.04.092
Porter, A., B.P. Lyons, T.S. Galloway and C. Lewis, 2018. Role of marine snows in microplastic fate
and bioavailability. Environmental Science and Technology, 52(12):7111-7119.
https://doi.org/10.1021/acs.est.8b01000
Primpke, S., C. Lorenz, R. Rascher-Friesenhausen and G. Gerdts, 2017. An automated approach for
microplastics analysis using focal plane array (FPA) FTIR microscopy and image analysis. Analytical
Methods, 9:1499. https://doi.org/10.1039/c6ay02476a
Provencher, J.F., J. Ammendolia, C.M. Rochman and M.L. Mallory, 2019. Assessing plastic debris in
aquatic food webs: what we know and don’t know about uptake and trophic transfer. Environmental
Reviews, 27:304-317. https://doi.org/10.1139/er-2018-0079
Rochman, C.M., R.L. Lewison, M. Eriksen, H. Allen, A.-M. Cook and S.J. Teh, 2014.
Polybrominated diphenyl ethers (PBDEs) in fish tissue may be an indicator of plastic contamination
in marine habitats. Science of the Total Environment, 476:622-633.
https://doi.org/10.1016/j.scitotenv.2014.01.058
Rummel, C.D., A. Jahnke, E. Gorokhova, D. Kuhnel and M. Schmitt-Jansen, 2017. Impacts of biofilm
formation on the fate and potential effects of microplastics in the aquatic environment. Environmental
Science and Technology Letters, 4:258-267. https://doi.org/10.1021/acs.estlett.7b00164
Setälä, O., V. Fleming-Lehtinen and M. Lehtiniemi, 2014. Ingestion and transfer of microplastics in
the planktonic food web. Environmental Pollution, 185:77-83.
https://doi.org/10.1016/j.envpol.2013.10.013
Setälä, O., J. Norkko and M. Lehtiniemi, 2016. Feeding type affects microplastics ingestion in a
coastal invertebrate community. Marine Pollution Bulletin, 102:95-101.
https://doi.org/10.1016/j.marpolbul.2015.11.053
Sundet, J., 2014. Status on the snow crab in the Barents Sea (No. Joint Russian-Norwegian report
series, no 18/2014), Presentation on the Norwegian-Russian workshop on king– and snow crabs in the
Barents Sea, Tromsø, March 11–12, 2014. [online] URL:
https://www.hi.no/resources/publikasjoner/rapport-fra-havforskningen/2014/hi-rapp_18-
2014_king_and_snow_til_web.pdf
Tekman, M.B., C. Wekerle, C. Lorenz, S. Primpke, C. Hasemann, G. Gerdts and M. Bergmann, 2020.
Tying up loose ends of microplastics pollution in the Arctic: distribution from the sea surface through

AMAP Litter and Microplastics Monitoring Guidelines
129
the water column to deep-sea sediments at the HAUSGARTEN observatory. Environmental Science
and Technology, 54:4079-4090. https://doi.org/10.1021/acs.est.9b06981
Villarrubia-Gómez, P., S.E. Cornell and J. Fabres, 2018. Marine plastic pollution as a planetary
boundary threat - the drifting piece in the sustainability puzzle. Marine Policy, 96:213-220.
https://doi.org/10.1016/j.marpol.2017.11.035
von Friesen, L. W., 2018. Anthropogenic Microlitter in Svalbard Waters- development of novel
extraction methods, determination of distribution and investigationof potential sources. University of
Gothenburg, Gothenburg, Sweden.
von Friesen, L. W., M. E. Granberg, M. Hassellöv, G. W. Gabrielsen and K. Magnusson, 2019. An
efficient and gentle enzymatic digestion protocol for the extraction of microplastics from bivalve
tissue. Marine Pollution Bulletin, 142:129-134. https://doi.org/10.1016/j.marpolbul.2019.03.016
von Friesen, L. W., M. E. Granberg, O. Pavlova, K. Magnusson, M. Hassellöv and G. W. Gabrielsen,
2020. Sea ice and a wastewater outlet identified as hotspots for anthropogenic microlitter in Svalbard
waters. Environment International, 139:105511. https://doi.org/10.1016/j.envint.2020.105511
von Moos, N., P. Burkhardt-Holm and A. Köhler, 2012. Uptake and effects of microplastics on cells
and tissue of the blue mussel Mytilus edulis L. after an experimental exposure. Environmental Science
and Technology, 46(20):11327-11335. https://doi.org/10.1021/es302332w
Ward, J.E., S. Zhao, B.A. Holohan, K.M. Mladinich, T.W. Griffin, J. Wozniak and S.E. Shumway,
2019. Selective ingestion and egestion of plastic particles by the blue mussel (Mytilus edulis) and
eastern oyster (Crassostrea virginica): implications for using bivalves as bioindicators of microplastic
pollution. Environmental Science and Technology, 53:8776−8784.
https://doi.org/10.1021/acs.est.9b02073
Welden, N.A.C. and P.R. Cowie, 2016. Environment and gut morphology influence microplastics
retention in langoustine, Nephrops norvegicus. Environmental Pollution, 214:859-865.
https://doi.org/10.1016/j.envpol.2016.03.067
Woodall, L.C., A. Sanchez-Vidal, M. Canals, G.L.J. Paterson, R. Coppock, V. Sleight, A. Calafat,
A.D. Rogers, B.E. Narayanaswamy and R.C. Thompson, 2014. The deep sea is a major sink for MP
debris. Royal Society Open Science 1(4):143017. https://doi.org/10.1098/rsos.140317
Zhao, S., J.E. Ward, M. Danley and T.J. Mincer, 2018. Field-based evidence for microplastics in
marine aggregates and mussels: implications for trophic transfer. Environmental Science and
Technology, 52(19):11038-11048. https://doi.org/10.1021/acs.est.8b03467

AMAP Litter and Microplastics Monitoring Guidelines
130
3.2 Fish AUTHORS: TANJA KÖGEL, CHELSEA M. ROCHMAN, KERSTIN MAGNUSSON, MARIA E. GRANBERG, MAX LIBOIRON,
ALESSIO GOMIERO, AMY L. LUSHER, AND JENNIFER PROVENCHER
3.2.1 Introduction to microplastics in Arctic fish
Plastic pollution of the ocean has led to ubiquitous but uneven exposure of organisms, including fish,
to microplastics (MP). Evidence of plastic pollution in the Arctic (Lusher et al., 2015; Buhl-
Mortensen and Buhl-Mortensen, 2018; Grøsvik et al., 2018; Kanhai et al., 2020) implies that Arctic
fish are no exception to such exposure. However, for Arctic fish species, few publications on
ingestion or accumulation of MP exist so far (Leclerc et al., 2012; Nielsen et al., 2014; Bråte et al.,
2016; Fischer and Scholz-Böttcher, 2017; Kühn et al., 2018; Morgana et al., 2018; de Vries et al.,
2020; Granberg et al., 2020). The results of those Arctic field studies, combined with evidence of
ingestion and accumulation of MP in fish from other areas (Gall and Thompson, 2015; Lusher et al.,
2017; Collard et al., 2019; Markic et al., 2020), including fish widely used for human consumption
(Neves et al., 2015; Rochman et al., 2015; Lusher et al., 2017; Bessa et al., 2018; Ory et al., 2018; Wu
et al., 2019; Barboza et al., 2020), and evidence of MP toxicity from exposure studies (Kögel et al.,
2019), highlight that Arctic fish species may be exposed to MP, and the consequences and risks to
both ecosystem and human health should be investigated.
3.2.2 Status of global science on microplastics in fish
General trends
To date, MP pollution in fish has mainly been analyzed in the contents of the gastrointestinal tract
(GIT). Some studies additionally included the gut walls in the analysis (Fischer and Scholz-Böttcher,
2017; Morgana et al., 2018; de Vries et al., 2020). Results have often been reported as the frequency
of occurrence in percent (FO %), i.e., an estimate of the number of contaminated individuals in a
population. Additionally, the number of MP in individual fish GITs were reported. In popular
scientific settings, they were sometimes presented as the number of MP per individual fish. It is
important to be aware of the contexts of these measurements, namely, (1) that it is only the number of
MP in the investigated part of the fish (the entire or partial GIT), (2) the size range and quality of MP
(such as polymer type, color, or shape) that the applied method was capable of detecting, and (3) its
measurement uncertainty.
Counts of MP in the GIT content of fish likely represent a snapshot in time, generally capturing what
enters the GIT before it exits through feces during one digestive cycle (Dos Santos and Jobling, 1991;
Grigorakis et al., 2017). Fish do not seem to accumulate MP in the GIT over time as seen in some
other species (i.e., some seabirds and crustaceans) that have different gut morphologies. Larger MP (2
mm and > 63 µm, respectively) were observed to be expelled with the feces within hours to days in
cod and goldfish, respectively (Dos Santos and Jobling, 1991; Grigorakis et al., 2017). The numbers
of visually identifiable MP per fish in the GIT were generally low, therefore requiring high sample
numbers to assess statistically significant differences. In general, monitoring larger MP in the GIT can
provide a rough estimate of MP ingestion rates and differences in such rates depending on factors
such as species or locations. However, published data on MP in GIT of fishes so far lack
harmonization to the extent that the detection of such factor-dependent differences is only possible in
a few cases and within, but not between studies. Mapping of MP distributions and the discovery of
which determining factors lead to accumulation and adverse effects will strengthen recommendations

AMAP Litter and Microplastics Monitoring Guidelines
131
for monitoring (e.g., sample numbers, frequency, and station distances for monitoring of MP in fish
GIT).
Additionally, small MP in other fish tissues need to be addressed for risk assessment. Importantly, the
required methods for analyzing small MP contamination in tissue need research and method
development. Once the methods and distribution mapping have been accomplished, then a monitoring
program can be set up in a meaningful way.
The importance of the size of microplastics – research areas under development
Studies have suggested that the size of plastics heavily influences the data generated. For example,
when studies mapping MP in water were reviewed, it was found that ~80% did not account for
plastics < 300 μm, which can be explained by the high prevalence of using the Manta trawl sampling
method, with a mesh size of ca. 300 µm (Conkle et al., 2018). This limitation is an issue because
smaller size fractions of MP consistently occur in higher particle numbers in environmental samples
(Bergmann et al., 2017; Mintenig et al., 2017; Peeken et al., 2018; Simon et al., 2018; Haave et al.,
2019; Mani et al., 2019; Brandon et al., 2020). The incidence of small MP cannot be extrapolated
from the incidence of larger MP in a straightforward way (Ter Halle et al., 2017; Haave et al., 2019).
Although not the focus of this report, it is important to note that MP were shown to have negative
impacts on fish in exposure studies in laboratory-based settings, and that there is more evidence for
negative effects of smaller MPs in the low µm ranges compared to larger ones (> 10 µm; Kögel et al.,
2019). This is related to the size-dependent uptake in biota and the translocation barriers within biota
between tissues and organs and into cells and subcellular organelles. In several studies, the numbers
of MP detected in different tissues in exposure experiments increased with decreasing MP size in fish
(Jeong et al., 2016; Critchell and Hoogenboom, 2018; Lehtiemi et al., 2018; Gomiero et al., 2020a)
and mammals (Jani et al., 1992).
Quantitative analyses of small MP and nanoplastic from fish tissues other than the GIT are likely to be
relevant for both seafood safety for human consumption because the GIT is often not the consumed
part of the fish, and for the health and population sizes and stability of the fish themselves. If smaller
MP and tissues other than GIT are disregarded when fish are analyzed, the obtained frequency of
occurrence and individual MP counts per fish will probably underestimate the real situation in fish as
a whole organism. However, 10 µm is the current methodological lower size-related threshold for
which semi-quantification is possible in larger environmental or biota samples. So far, no published
monitoring data are available on plastic pieces below 10 µm, but several field reports on fish show
MP occurrence outside the gut contents, in other fish tissues (Collard et al., 2017; Karami et al., 2017;
Gomiero et al., 2020a, b). The MP sizes reported in these publications reach hundreds of µm, and
Gomiero et al. reported that smaller MP (below 50 µm) were most frequent in salmonid livers and
fillets.
Microplastics in Arctic fish
Although fish are considered indicators of ecosystem health (European Parliament, 2000), there are
few studies that have investigated the ingestion of MP in Arctic fish (see AMAP definition of the
region used for this assessment in Figure 3.3). In bony fish, MP have been reported in polar cod
(Boreogadus saida; Kühn et al., 2018; Morgana et al., 2018), Atlantic cod (Gadus morhua; Bråte et
al., 2016; de Vries et al., 2020), Greenland cod (Gadus ogac; Granberg et al., 2020), sculpin (Triglops
nybelini; Morgana et al., 2018), and saithe or pollock (Pollachius virens; de Vries et al., 2020; Table

AMAP Litter and Microplastics Monitoring Guidelines
132
3.3). Although many of the most common fish species consumed by humans from the North Atlantic
and Arctic fishery area have been investigated, the applied methods are highly different,
compromising the comparabily. For example, either the GIT including content or the GIT content
only, were investigated. Because there may be MP entrapped in the gut wall, this might introduce
differences in the MP counts. Several of the studies did not target MP analysis, but were feeding
assessments in which litter/MP content was a side observation. Some studies relied on visual
identification, with or without a microscope, whereas others added chemical identification by FTIR
(Fourier-transform infrared spectroscopy). Measurement uncertainties are too high, not always
rigourously assessed, and the studies too different and too few to extract certain trends by comparing
studies. That being said, we do list some findings.
Occurrence rates of MP in Arctic fish usually ranged 0-3 MP per individual (Table 3.3). One of the
Arctic fish studies found higher counts of MP in Greenland cod GIT, in which 12 MP per individual
were observed on average (Granberg et al., 2020). This study had a lower detection-size limit (20 µm)
than most other studies, suggesting that the methodological differences in detection capacity may
yield different results rather than reflecting field or species conditions. Furthermore, Granberg et al.
caught their fish using fishing rods and dissected immediately after catching each fish. When usual
fish sampling approaches (with nets and bulk fishing) are used in which fish are quickly hauled from
deeper depths, fish discharge their gut contents, likely including MP, from their stomach. This would
be different for individual species and might be a crucial feature to consider and control for when
quantifying MP in the GIT. Additionally, in this study, cod containing the highest number of MP were
found closer to local pollution sources. Finally, Morgana et al. (2018) found higher ingestion rates in
demersal sculpin compared to pelagic polar cod. However, because of the scarcity of studies, no
general conclusions can be drawn yet. It is not clear if the variation is due to the species differences,
environmental factors, or the methods applied. Uncertainty and recovery analysis of the applied
methods are often lacking.
There are many possible pitfalls caused by a lack of harmonization in the Arctic studies. For example,
Kühn et al., 2018 described a low incidence of MP in polar cod compared to Morgana et al., 2018
despite a lower detection limit. It could be because they focused on the stomach content, whereas
Morgana et al., 2018 included the entire GIT. However, speculative reasons for this could also be that
the Kühn et al., 2018 study did not include microfibers in their analyses to avoid false positives
through airborne contamination, which they openly discussed. However, they might have introduced a
false-negative error thereby. Although controlling for false positives is important, the study may have
excluded real positive samples from their accounts. Therefore, it is important not only to subtract
contamination from results, but to keep contamination as low as possible. Real environmental
differences may also be the case because the polar cod in the two studies came from different
locations. Bråte et al., 2016 observed geographical differences within their study, in which no MP
were observed in Atlantic cod from northern Norway (the Varanger and Lofoten areas or in the
vicinity of the capital, Oslo), whereas Atlantic cod from the harbor of the second largest city of
Norway, Bergen, contained MP (Bråte et al., 2016). One highly speculative hypothesis could be that
Bergen, with its rough shoreline on the west coast of the European continent, might comb plastics out
of the Gulf Stream. This is an example of how fish may be used to explore larger patterns in MP in
relation to shorelines and major current systems.

AMAP Litter and Microplastics Monitoring Guidelines
133
Table 3.3 Overview of available analysis data of microplastics in Arctic fish.
Species Location Fish
[N]
FO
[%]
MP per
individual
[N]
Lower
detection
limit
Methodology Reference
Polar cod
(Boreogadus saida)
Eurasian Basin,
Svalbard
72 2.8 0-1 > 35 μm Stomach content, visual
inspection, suspected MP by
FTIR, fibers not included
Kühn et al. 2018
Polar cod
Sculpin
(Triglops nybelini)
North-eastern
Greenland
Northern
Greenland
85
71
18
34
0-1 > 700 µm GIT and content alkaline
digested, visual inspection,
> 700 µm by FTIR
Morgana et al., 2018
Atlantic cod
(Gadus morhua)
Varangerfjord and
Lofoten,
Northern Norway
58
56
0 n/a N/A
> 3.2 mm
reported
Stomach content, visual
inspection, suspected MP by
FTIR
Bråte et al., 2016
Atlantic cod
Saithe
(Pollachius virens)
Iceland 39
46
20.5
17.4
0.23
0.28
On average
> 80 µm GIT and content alkaline
digested, visual inspection,
FTIR
de Vries et al., 2020
Greenland cod
(Gadus ogac)
Western Greenland 12 ± 6 > 20 µm GIT, visual and FTIR on
selected particles
Granberg et al., 2020
Greenland shark
(Somniosus microcephalus)
East, West,
Southwest
Greenland
30 3.33 0-1 > 1 mm Stomach content, visual
examination
Nielsen et al., 2014
Greenland shark Svalbard, Norway 45 3 N/A > 1 mm
Stomach content, visual
examination
Leclerc et al., 2012

AMAP Litter and Microplastics Monitoring Guidelines
134
Because the available data are still scarce but in high demand, we list several other ongoing studies on
MP contamination in Arctic fish that we are aware of, for future reference:
• The Nordic Council of Ministers has funded a Nordic/Iceland/Faroes investigation of MP in fish,
addressing the viability of using ongoing fish stomach monitoring for MP plastic monitoring
(project leader Catherine P. Chambers) and method development for the extraction of MP from
cod stomach content.
• The Institute of Marine Research (Bergen, Norway) is currently analyzing haddock
(Melanogrammus aeglefinus) from the Barents Sea for MP using methods that account for
plastics above 10 µm, and experimentally below that, in fillets and liver, funded by the
Norwegian Ministry of Trade, Industries and Fisheries (project leader Tanja Kögel).
• Researchers in Canada from Environment and Climate Change Canada (ECCC), Department of
Fisheries and Oceans (DFO), and the University of Toronto are quantifying MP in Arctic char
(Salvelinus alpinus) from the Cambridge Bay region of Nunavut, and researchers from the
Nunatsiavut Government and Memorial University of Newfoundland are studying Arctic char
and turbot (Scophthalmus maximus) from Nunatsiavut in Labrador.
• FACTS, a consortium financed by JPI-Oceans, will be investigating the “Fluxes and Fate of
Microplastics in Northern European Waters,” including cusk (Brosme brosme) and Atlantic cod
from the Barents Sea (project leader Jes Vollertsen; fish work package leader Tanja Kögel).
Sources
We know very little about the sources of MP to fish in the Arctic. The current stage of this research
field is immature, and quantification and contamination characterization still need considerable
method development. However, there are some indications suggesting MP travel to the Arctic via
water currents (Cozár et al., 2014), precipitation (Bergmann et al., 2019), and as waste from boats and
ships, including tourism and fishing, i.e., fishery gear and products of daily living (Bergmann et al.,
2017; Nashoug, 2017; Falk-Andersson and Strietmann, 2019). The input from wastewater outlets,
both with and without treatment, has been investigated in the Arctic (Magnusson et al., 2016;
Granberg et al., 2019; von Friesen et al., 2020). Furthermore, loss of plastic litter from landfills might
play a role (Granberg et al., 2020). The relative importance of local and distant pollution sources for
microlitter needs further investigation. The great connectivity between the Arctic ocean and adjacent
seas, through the FRAM and Bering straits may play a role. Another possibility is transport by marine
organisms from more polluted areas (van Franeker, 2011; Provencher et al., 2018; Bourdages et al.,
2021). Considering the food web, MP in prey organisms, such as plankton, need to be quantified.
Conclusion and research gaps
In summary, information on MP pollution in Arctic fish is scarce, and studies show high variation,
both in the applied methods and the results. The studies do illustrate that all investigated species to
date in the Arctic ingest MP at some level. Little can be concluded yet about sources, geographical
distribution, and species dependency. Globally, small MP < ca. 500 µm in fish and MP in parts of the
fish other than the GIT were only analyzed in a few publications because of the expensive equipment
and expertise necessary and not available everywhere. Microplastics below 10 µm have not been
analyzed at all in wild fish because of methodological challenges, even though there is evidence from
exposure studies that such small MP might pose both environmental and human health risks. Because
of the scarcity of data, we conclude with a call for more research to fill in the gaps about the
distribution, composition, and extent of MP contamination of fish in Arctic ecosystems.

AMAP Litter and Microplastics Monitoring Guidelines
135
We identified the following major knowledge gaps, which we suggest working on in the coming
years:
• Geographical distribution of MP in fish as related to MP in water, sediment, and diet
• Measurement uncertainty/recovery testing of sample preparation and analysis methods
• Accumulation quantification of MP in different species and tissues, throughout the food
chain, including identification and principal component analysis of parameters influencing
MP ingestion
• Suitable indicator species and tissues applicable to the Arctic ecosystem
• Effects of environmentally relevant amounts and combinations of MP on key species
• Roles of fish for the fate of MP in the environment
• Vector function of MP for other contaminants
3.2.3. Rationale for monitoring microplastics in Arctic fish
Benefits
Fish form an important link between lower and higher marine trophic levels/food webs, including
Arctic ecosystems, and they are considered indicators of ecosystem health. Fish also constitute a
significant protein source for human nutrition and are an important cultural component for Arctic
peoples. Human health may be affected by MP exposure through air, water, and food, directly, as well
as indirectly, by the impacts on the ecosystem (Barboza et al., 2018). Adverse effects of any
contaminant that is affecting fish, have an impact on food safety, security, and sovereignty. Thus, MP
contamination is of concern to food safety authorities, environmental agencies, food security
stakeholders, such as UN organizations, and rightsholders, such as Arctic Indigenous peoples. Based
on the Marine Strategy Framework Directive (MSFD; European Parliament, 2008), the European
Commission produced a set of detailed criteria and methodological standards, which were revised in
2017 (European Commission, 2017) leading to the new Commission Decision on Good
Environmental Status (GES), including: “The amount of litter and micro-litter ingested by marine
animals is at a level that does not adversely affect the health of the species concerned.”
Limitations
Monitoring fish can be costly for several reasons. Targeted fishing is expensive. When using the GIT
content to study MP, scientists can easily team up with local and Indigenous fisheries to collect gut
contents. However, when looking for smaller plastic particles that are expected to accumulate in fish
tissues, the methods needed for quantifying small MP are time consuming, require high-end
instrumentation, clean laboratories, and specialized skills. To initiate this costly endeavor, reasons,
and purposes should be clear, planning thorough, and study species and tissues wisely chosen. Before
monitoring fish on a large scale, methods generally need to be harmonized, and the methods for
smaller MP, developed. Then, contamination levels need to be mapped in baseline studies. Table 3.4
suggests how different objectives could focus on different target matrices for quantitative MP
mapping. These recommendations are based on a small empiric amount of data and include feasibility
in their rationale. Thus, it is not our opinion that, for example, fillet contamination is irrelevant for
ecosystem mapping purposes, but rather that liver should be prioritized at this phase due to the high
cost of sample analysis and the established status of liver as an ecosystem indicator for other
contaminants.
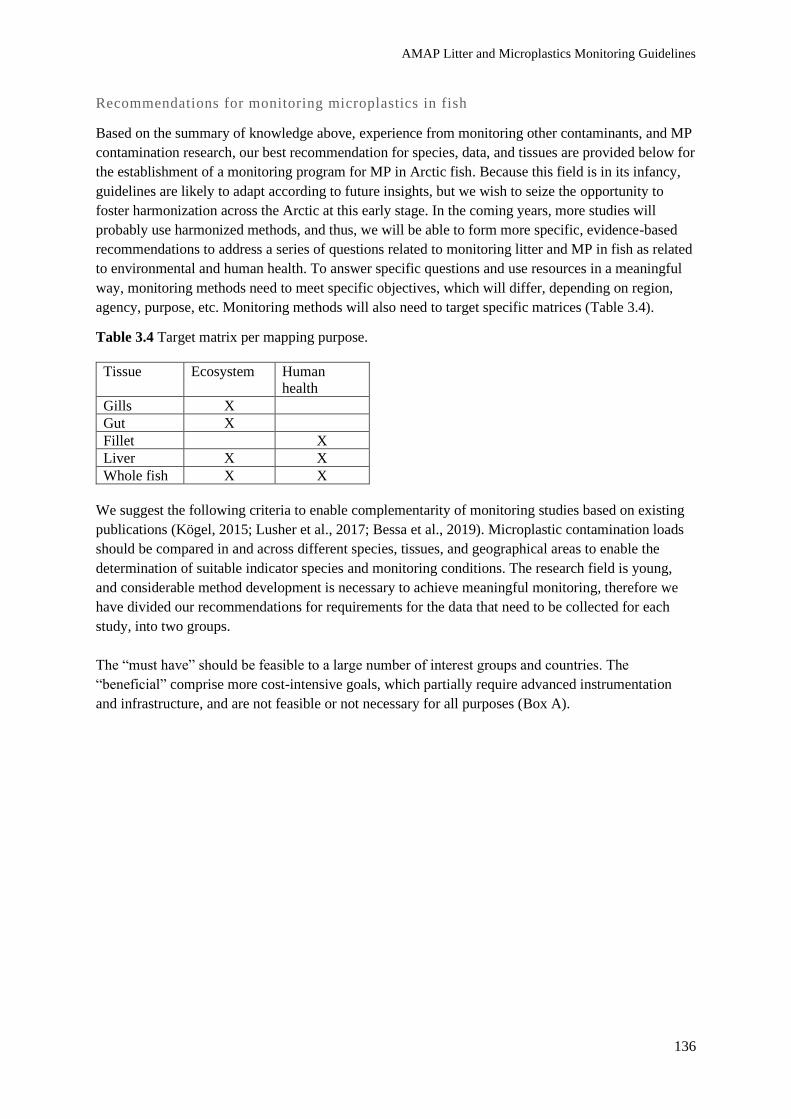
AMAP Litter and Microplastics Monitoring Guidelines
136
Recommendations for monitoring microplastics in fish
Based on the summary of knowledge above, experience from monitoring other contaminants, and MP
contamination research, our best recommendation for species, data, and tissues are provided below for
the establishment of a monitoring program for MP in Arctic fish. Because this field is in its infancy,
guidelines are likely to adapt according to future insights, but we wish to seize the opportunity to
foster harmonization across the Arctic at this early stage. In the coming years, more studies will
probably use harmonized methods, and thus, we will be able to form more specific, evidence-based
recommendations to address a series of questions related to monitoring litter and MP in fish as related
to environmental and human health. To answer specific questions and use resources in a meaningful
way, monitoring methods need to meet specific objectives, which will differ, depending on region,
agency, purpose, etc. Monitoring methods will also need to target specific matrices (Table 3.4).
Table 3.4 Target matrix per mapping purpose.
Tissue Ecosystem Human
health
Gills X
Gut X
Fillet X
Liver X X
Whole fish X X
We suggest the following criteria to enable complementarity of monitoring studies based on existing
publications (Kögel, 2015; Lusher et al., 2017; Bessa et al., 2019). Microplastic contamination loads
should be compared in and across different species, tissues, and geographical areas to enable the
determination of suitable indicator species and monitoring conditions. The research field is young,
and considerable method development is necessary to achieve meaningful monitoring, therefore we
have divided our recommendations for requirements for the data that need to be collected for each
study, into two groups.
The “must have” should be feasible to a large number of interest groups and countries. The
“beneficial” comprise more cost-intensive goals, which partially require advanced instrumentation
and infrastructure, and are not feasible or not necessary for all purposes (Box A).

AMAP Litter and Microplastics Monitoring Guidelines
137
Box A Required data for monitoring microplastics in Arctic fish
Must have
• Name of researcher
• Species
• Location, including longitude and latitude
• Date: day, month, year, time
• Wet weight and total length of fish
• Liver weight
• Tissue(s) sampled
• Frequency of occurrence of MP per individual/tissue
• For MP > ca. 500 µm: either MP mass or number per tissue weight and particle size group, as
mean, with standard deviation and number of samples, median, for individual or defined pooled
samples. When reporting for individual fish, include individuals without detected plastic
contamination
• Collection, extraction, analysis method applied, including equipment, quality assurance/quality
control, limit of detection as MP size and/or mass and measurement uncertainty
Beneficial to have
• Polymer type group (according to Primpke et al., 2017)
• Shape of the MP, as fiber, fragment, or bead
• Color identification of MP
• For particles < ca. 500 µm: either MP mass or number per tissue weight and MP size group, as
mean, with standard deviation and number of samples, median, for individual or defined pooled
samples. When reporting for individual fish, include individuals without detected plastic
contamination
• Sex
• Age of fish
• Depth of collection
• Weather conditions
• Name of fish harvester and boat
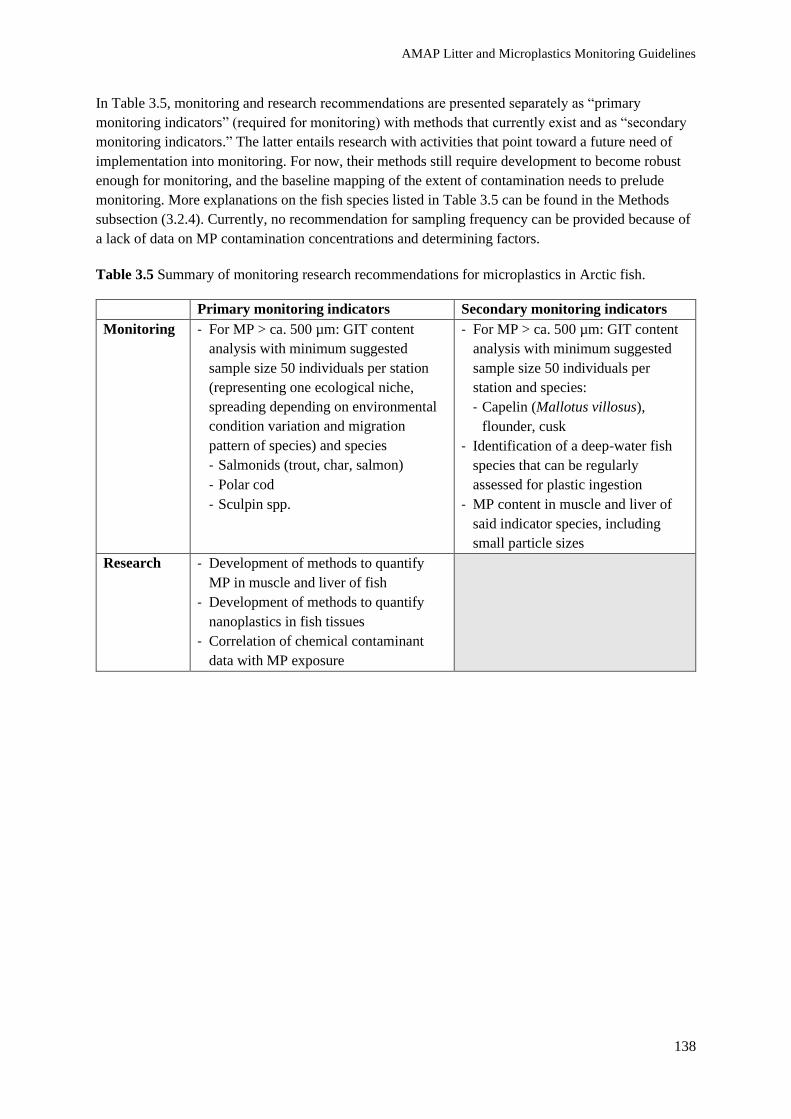
AMAP Litter and Microplastics Monitoring Guidelines
138
In Table 3.5, monitoring and research recommendations are presented separately as “primary
monitoring indicators” (required for monitoring) with methods that currently exist and as “secondary
monitoring indicators.” The latter entails research with activities that point toward a future need of
implementation into monitoring. For now, their methods still require development to become robust
enough for monitoring, and the baseline mapping of the extent of contamination needs to prelude
monitoring. More explanations on the fish species listed in Table 3.5 can be found in the Methods
subsection (3.2.4). Currently, no recommendation for sampling frequency can be provided because of
a lack of data on MP contamination concentrations and determining factors.
Table 3.5 Summary of monitoring research recommendations for microplastics in Arctic fish.
Primary monitoring indicators Secondary monitoring indicators
Monitoring - For MP > ca. 500 µm: GIT content
analysis with minimum suggested
sample size 50 individuals per station
(representing one ecological niche,
spreading depending on environmental
condition variation and migration
pattern of species) and species
- Salmonids (trout, char, salmon)
- Polar cod
- Sculpin spp.
- For MP > ca. 500 µm: GIT content
analysis with minimum suggested
sample size 50 individuals per
station and species:
- Capelin (Mallotus villosus),
flounder, cusk
- Identification of a deep-water fish
species that can be regularly
assessed for plastic ingestion
- MP content in muscle and liver of
said indicator species, including
small particle sizes
Research - Development of methods to quantify
MP in muscle and liver of fish
- Development of methods to quantify
nanoplastics in fish tissues
- Correlation of chemical contaminant
data with MP exposure

AMAP Litter and Microplastics Monitoring Guidelines
139
Table 3.6 Summary of the estimated costs combined with rationales for the recommended actions.
0 - already in place
$ - relatively inexpensive, synergy with ongoing projects
$$ - networks and capacity need to be developed
$$$ - sampling networks, processing capacity, reporting need to be developed
Recommendation Cost Rationale
Gastrointestinal
tract (GIT) MP
content analysis in
commercial fishes
(cod, salmonids)
for MP > ca. 500
µm
$ Existing research programs and collaborations should be established
with fishing fleets, such as those assessing population size and
chemical contamination, making it relatively easy to add sampling
for MP pollution to the workplan. Minimal costs would be added to
cover the costs of collection and processing the GIT content for
plastic pollution specifically.
Determination of
plastic ingestion in
small scale fisheries
$ Community-based sampling can be implemented to sample species
that are harvested by Northern and Indigenous communities.
Addition of minimal costs to implement plastic pollution monitoring
to cover collections and the processing the GIT content for plastic
pollution specifically. There are also several regular research cruises
that could be used to create synergy for monitoring. For example the
Institute of Marine Research, Norway, has been registering litter
with bottom trawl and trawl and estimating fish population sizes
during the scope of their “ecosystem cruise” in the Barents sea since
2010 (Grøsvik et al., 2018), and during their “winter cruise”
covering the ice free areas Southwest, East, and South of Svalbard in
February/March.
Establishment of
time trends in fish
MP
$ This is best initiated as a subset of the above-mentioned activities to
be repeated at the same station at regular intervals. This should be
established annually when possible until power analyses can be used
to examine sampling frequency questions.
MP content in fillet
and liver, method
development for
small MP
quantification
$$ Analyses of MP content in liver and fillets can begin immediately,
methodologically, but existing methods are expensive, and recovery
rates below 100 µm are unstable. Method development for small MP
is already in progress in many laboratories, and several peer-
reviewed articles have been published. However, these methods are
largely at a semi-quantitative stage. To enable proper risk
assessment, necessitating toxicological tests with realistic
environmental concentrations, the concentrations need to be
determined, including quality assurance with ring testing and
measurement uncertainty determination. That work has been started
by several initiatives, e.g., from QUASIMEME Laboratory
Performance Studies on MP, European Commission JRC/BAM
inter-laboratory comparison (proficiency testing) on MP, and the
H2020 Harmonisation Call (CE-SC5-29-2020).
Development of
methods for
nanoplastics
quantification
$$$ It has been shown that nanoplastics have negative effects in exposure
experiments. Method development for nanoplastics analysis is
ongoing but poses large challenges because the particles adhere to all
surfaces and are easily dissolved in the attempt to extract them from
biotic matrices. Detection in one biotic matrix has been published
(Correia and Loeschner, 2018).

AMAP Litter and Microplastics Monitoring Guidelines
140
3.2.4 Methods
Fish species
Previously recommended criteria (Bessa et al., 2019) for selecting appropriate species for MP analysis
were species that (1) occur naturally with high abundance and wide geographic distribution, (2) are
easy to sample and process in the laboratory, (3) are already used as bioindicator/for biomonitoring in
other studies related to marine pollution and monitoring international schemes, (4) have ecological
and socioeconomic relevance, and (5) cover several ecological/functional niche roles, feeding guilds.
In the light of this previous list, combined with specific Arctic needs and the status of the research
field, mapping programs at this stage should focus on species that are:
• widespread, to collect baseline data across regions to understand trends and sources over time
and space;
• stationary, to reflect regional/habitat differences;
• consumed by humans to address human-health risks with the following considerations (1)
most prevalently used wild fish by Arctic residents for sustenance, (2) most commercially
used wild fish because many people will be exposed, and trade restrictions might be
established;
• shown or likely to ingest greater amounts of MP, i.e., of high-trophic level because that
increases contaminant accumulation, or benthic feeders because more plastic contamination is
expected in the sediments compared to the water column or the surface; and
• key species of ecosystem importance.
Given the above considerations, we recommend polar/Arctic cod and sculpin for mapping of MP
pollution in fish because they have already been shown to ingest plastic and are incorporated into other
pollutant monitoring programs, combined with other salmonids. These species are also commonly
consumed by humans in both sustenance and commercial settings and occupy different habitats.
Salmonids and polar cod are regularly sampled by researchers, commercial fishing, and Indigenous and
local community members. Therefore, adequate sample sizes (> 50 individuals) can be obtained
relatively easily and would allow for rigorous statistical analysis across the Arctic. Salmonids live in
diverse ecosystems from freshwater land-locked lakes to sea-run coastal and offshore marine
environments. Polar cod additionally are ice-associated because they spawn below the ice edges and
feed on invertebrates on the underside of sea ice (Huserbråten et al., 2019). Polar cod also form a core
component of the Arctic food web and are relied on by many fish, mammals, and bird species in the
region.
Additionally, the Arctic sea ice has been reported to contain high levels of MP particles (Obbard et al.,
2014; Peeken et al., 2018; von Friesen et al., 2020). To better understand the effects of melting sea ice
on MP in biota, levels of MP taken up by polar cod should be monitored over time because this would
allow the study of MP pollution in the context of years of larger and smaller ice melting periods and
climate change. Stationary benthic species most appropriate according to these criteria will differ
regionally within the Arctic. For example, Arctic sculpin (Myoxocephalus scorpioides), haddock, and
cusk would be examples of fish that fit all the criteria in the Barents Sea, whereas Arctic char would be
appropriate in North America. Flounder species, such as plaice (Pleuronectes platessa), might be useful
for areas closer to the shorelines in some regions. Capelin is already part of regular monitoring for other
contaminants in the Arctic and a basis of the food web for larger predatory fish. Each species will
AMAP Litter and Microplastics Monitoring Guidelines
141
represent a different habitat and therefore different environmental impacts, MP sources, and transport
pathways.
Sample collection
Samples can be obtained by dedicated cruises, which is often the best way to get enough samples with
specific characteristics. However, for commercial species, commercial fishery vessels can be used as a
cheaper alternative with the additional benefit of being representative for the market. Also, existing
regular cruises, such as those undertaken for population estimations and legacy contaminant
surveillance should be used for synergy.
When samples are collected, detailed information regarding location (oceanic region, latitude,
longitude, distance to coast), date, time, sampling depth, sampling equipment (including description of
materials used, i.e., PP/PE nets, device dimensions, and deployment procedures), and weather
conditions should be obtained (Box A). Fisher’s names and vessel ID should be reported. For samples
collected by fishery, it has proven critical to prepare clear instructions on a preprinted sheet with boxes
to record necessary data on the boat and to attach to the samples. Fish can be delivered whole and
frozen to the laboratory, packed into single bags to avoid bulk freezing. Immediate bleeding through a
cut into one of the gill sets is common practice on commercial fishery vessels, and if this is not desired,
the presence of technical research staff might be necessary on the fishing boat. However, allowing
routines to be followed could increase collaboration.
The question on how many samples represent a species or an area can only be answered after assessing
what the individual variability of the MP contamination is, the context of the study and questions to be
addressed, followed by a statistical power analysis. As recommended by OSPAR and MFSD, 50
individuals collected per site/station for MP analysis is ideal (OSPAR, 2015) and most likely to yield
results with statistical power needed for comparisons. The OSPAR data are supported by recent reviews
(Hermsen et al., 2018; Dehaut et al., 2019). The number of stations necessary also depends on the
mobility of the species in question. The more stationary a species is, the more it will reflect local
conditions. Further factors are geological boundaries, size, and age. A variety of ages or sampling areas
will increase data variation and the number of samples necessary to achieve statistical power to detect
differences. The extent of data variability is an unsolved challenge in MP studies. Therefore, caution
should be used with respect to increasing data variability, otherwise the risk of producing
uninterpretable datasets increases. With this in mind, sampling numbers should be defined in the
context of the questions to be addressed. For example, if inter-lake or inter-fjord comparisons are of
interest in a highly mobile species, 50 individuals from each lake or fjord may suffice for this work. If
the research question is exploring variability in MP along a single fjord, 50 individuals of a less mobile
fish may be needed to address this question. If the spatial scales do not allow for separate sampling of
fish, or if the fish population may be highly impacted by taking 50 fish at each station along a single
fjord, then another environmental compartment should be considered for monitoring.
At the current state of method development, 50 individuals are an unrealistically high number for
contamination quantification of small MP using high-end methods, such as µ-FTIR or pyrolysis-gas
chromatography/mass spectrometry (py-GC/MS) because of very long analysis times per sample. Then
again, that number may be too low if only large MP in the GIT are quantified. Long-term spatial and
temporal monitoring may require a reduced sample size per sampling event because of the intensity of
laboratory processing required for monitoring programs (Bråte et al., 2018). Analysis of pooled samples
AMAP Litter and Microplastics Monitoring Guidelines
142
can reduce the total number of analyses but comes at the expense of valuable information, such as
individual variation and frequency of occurrence.
In general, the number of individuals per site required is still under discussion. Power analysis of
mapping data should determine the necessary number of individuals to be analyzed for each species for
monitoring. These calculations should consider the area and purpose of the monitoring, as well as
species, age, geography, season, time, and prey/trophic level because all of those may influence the
concentrations of MP.
Sample preparation and analysis
For mapping and monitoring, standardized sample preparation methods in the laboratory are of utmost
importance. This includes clear protocols to obtain all required information about fish samples but also
protocols to prevent/reduce contamination or monitor procedural contamination. Sample metrics: fish
should be measured and weighed (total length, weight, liver weight, condition index); sex and gonad
development stage should be determined (Box A). Age determination, often achieved by otolith ring
counting, is useful to assess if bioaccumulation occurs. If the age relation to size is well-known, age
determination might be dispensed of because it can be very time consuming.
Depending on the target tissue and aim of each study, different steps are required. There are several
prevalent methods for assessing MP in fish. In general, stomachs (and/or intestines) are dissected out
and rinsed externally. Then, the gut content is analyzed with or without including the gut lining. Direct
visual inspection or extraction by alkaline or enzymatic digestion can be performed. Studies focusing
on ingestion of larger items can use a visual sorting method, but limitations include a high detection
limit in terms of MP size and increased risks of procedural contamination from extended exposure.
For studies wishing to target smaller MP (< ca. 500 µm), digestion protocols are required. The protocol
used for digestion will be dependent on the matrix composition and the equipment of the laboratory
(Lusher et al., 2020). At the current stage of the technology, there is still much room for increasing the
quality and reducing the time and costs of these protocols. All digestive agents must be prepared and
filtered to remove impurities and to prevent contamination of the samples. Alkaline digestion (KOH /1-
2 M or 10%; Lusher et al., 2017) or enzymatic purification (von Friesen et al., 2019), combined with
oxidation (Löder et al., 2017) are the prevalent, most successful methods to degrade fish tissue without
degrading MP. Current method development sometimes combines several of these approaches.
Temperatures and molarity of bases or acids should be kept below 40 °C. Because some plastic types
have dissolved with acid digestion, it is now not recommended (Dehaut et al., 2016; GESAMP, 2019).
For complex samples with high fat content, method development is still needed and may require a step-
wise protocol (Lusher et al., 2020). Choosing a protocol requires that (1) quality criteria are fulfilled,
i.e., that the method digests the tissue without harming the plastics; (2) recovery percentages are
satisfactory; (3) samples do not become contaminated; and (4) agents used do not cause harm to the
environment or humans to the extent that a new environmental problem is generated.
Analysis methods
Visual sorting should only be used for particles > ca. 500 µm. To generate knowledge on whether or
not toxic amounts of small size classes of MP are present in fish, method development in this area
needs to be driven for the quantification of the smaller size classes, down into the nanometer range. The
most promising endpoint analysis methods for fish tissue to date are infrared-microscopy and py-
GC/MS (see Section 4.3, analytical methods).

AMAP Litter and Microplastics Monitoring Guidelines
143
Post-analysis data handling
Stating that a certain percentage of the fish had plastic in their stomachs (FO %), while the average
number of particles per individual was very low, might provide an unbalanced representation of the
contamination. Both numbers need to be presented. Therefore, the average particle number for all
individuals should be provided. Because plastic polymers have different physiological effects
depending on their composition (Avio et al., 2015; Booth et al., 2016; Green et al., 2016; Mattsson et
al., 2017; Rochman et al., 2017), polymer types should be reported when possible.
3.2.5. Quality assurance/quality control (QA/QC)
Contamination mitigation
For contamination control, the whole chain from sample preparation to analysis needs to be considered.
Method development is still in its infancy but first attempts to review and summarize important
measures have been published (Bessa et al., 2019; GESAMP, 2019; Brander et al., 2020; Cowger et al.,
2020). The following issues are important to consider:
• Ideally, fish should be delivered whole and rinsed with filtered water before cutting and
preparing tissue samples inside the clean lab.
• To avoid airborne contamination, ideally, air filtration, sluice, and overpressure should be
installed in a clean laboratory, with filter capacities according to the size-related detection
limit of the study. A laminar flow bench might be used to further reduce MP counts in the air.
Samples should be covered with material other than plastic (e.g., clean aluminum foil) as
much as possible.
• To avoid contamination from disintegrating inner organs to fillets, frozen fish should be
thawed lying on its side, and fillet samples taken from the upper side. When preparing
samples from muscle, rinse before extraction to remove fish scales because they contain
biopolymers, which are very similar to some plastic types and could therefore be mistakenly
identified as plastic.
• All reagents/fluids used in the sample preparation, blanks, and procedural blanks’ analyses
should be pre-filtered according to the size-related detection limit and covered to prevent
airborne contamination.
• All instruments must be cleaned between individual fish. A wet filter or an open water
container can be used next to the dissected organism to control for airborne contamination.
• Plastic gloves and tools should be avoided or controlled for in the sample results. All such
materials used during dissection should be analyzed to provide references for polymer
identification.
• Results of controls, accounting for fibers and other particles of all reported size ranges, and
correction calculations should be reported in detail.
Measurement uncertainties
To compare numeric values on plastic contamination between studies and to relate laboratory
exposure studies with quantitative field studies, the mesh size, material, and brand/type of all applied
filters need to be reported. Filtrations can be of varying quality, for example, caused by irregularities
in filter-pore sizes and clogging, which can lead to both larger and smaller particles in the filtrate
when compared with the mesh size. Therefore, the smallest particle and largest particle sizes
measured, mean and median sizes, and ideally, additional size distribution indicators need to be

AMAP Litter and Microplastics Monitoring Guidelines
144
provided. Extraction efficiencies, measurement uncertainties, and recovery percentages should be
established for each fish matrix and method applied, and procedural contamination needs to be
monitored. It is necessary to assess the efficiency of spiking, loss at filtration to equipment such as
beaker walls and filters, and digestion efficiency of the protocol in terms of tissue degraded versus
plastic degraded.
A new challenge to the field of monitoring MP, which does not exist for soluble contaminants such as
mercury or dioxins, is that the particle sizes need to be considered. Small particles especially can be
lost during the extraction process. The smallest detected particle size does not equal the limit of
quantification (LOQ) because usually not all particles of this size class will be detected, and this effect
increases with smaller-sized particles. Therefore, measurement uncertainties, and how they are
obtained, should be reported. Although a loss of 5 µm of the surface of an MP of several mm during
an extraction procedure will not lead to a change in counted numbers or size classes, the same loss of
surface will lead to loss of 18 µm particles when using a 10 µm sieve. Transfer of extracted MP to the
endpoint analysis, such as an anodic filter or pyrolysis cup, may contribute to further loss. Analysis
itself can contribute with both false positives and false negatives, in addition to the misidentifications
of chemical identities.
For good laboratory practice, recovery rates need to be published for particles of the same size range,
shape, relevant polymer type, and concentration range as the analytes. If this is not feasible, then the
lack of such recovery tests should at least be discussed. For legal purposes, parameters for methods
and accuracy, measurement uncertainty, and LOQ are measured and regularly tested by proficiency
tests. All of these are defined in accreditation protocols. For MP quantification, such accreditation
processes are still in their infancy, but have been initiated by Quasimeme
(https://science.vu.nl/en/research/environment-and-health/projects/microplastics-ws-and-
ils/index.aspx) and the EU commission/Joint Research center /BundesumweltAMt, Germany, for
water (https://ec.europa.eu/jrc/en/science-update/call-laboratories-participate-proficiency-tests-
microplastics-drinking-water-and-sediments).
3.2.6 Existing population or contaminants (not microplastics) monitoring in the Arctic
Data from many monitoring programs on legacy and other emerging contaminants and fish population
development have been collected for decades and are ongoing. Among others, the purposes are to
evaluate (1) the state of ecosystems, (2) the suitability of fish species in an area for human
consumption, and (3) the sustainability of fisheries. For example, the Institute of Marine Research in
Norway tracks and reports contaminants in seafood on a regular basis, including cod, haddock, saithe,
capelin, polar cod, and halibut. Similarly, in Canada, contaminants are monitored in Arctic char,
burbot (Lota lota), and lake trout (Salvelinus namaycush) regularly to inform human health questions
under the Northern Contaminants Program (NCP). Sweden conducts monitoring of pollutants in
Arctic char in Arctic lakes within the AMAP area. Such programs can and should be investigated and
exploited for synergy, such as combined use of resources and cruises (collection and sampling of
fishes). Data distribution tools, such as databases, should be explored for their potential to add MP,
and sampling stations should be harmonized for correlation studies between legacy and emerging
contaminants and MP.
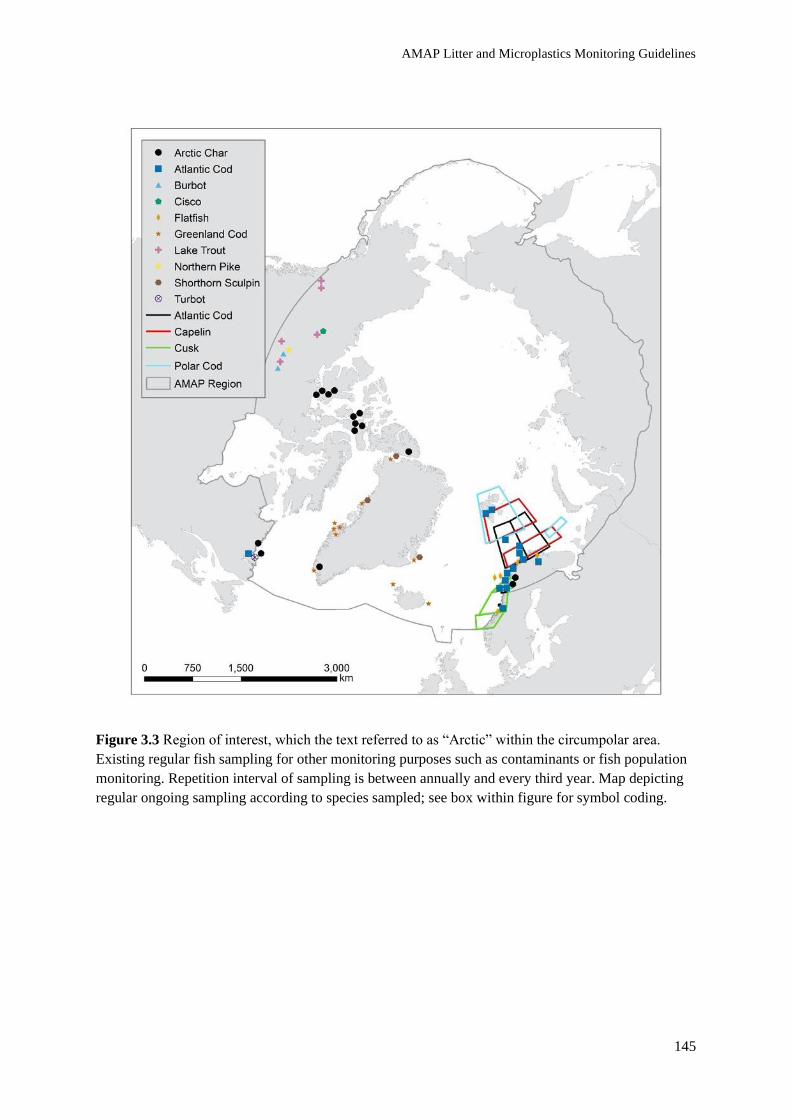
AMAP Litter and Microplastics Monitoring Guidelines
145
Figure 3.3 Region of interest, which the text referred to as “Arctic” within the circumpolar area.
Existing regular fish sampling for other monitoring purposes such as contaminants or fish population
monitoring. Repetition interval of sampling is between annually and every third year. Map depicting
regular ongoing sampling according to species sampled; see box within figure for symbol coding.

AMAP Litter and Microplastics Monitoring Guidelines
146
References
Avio, C.G., S. Gorbi, M. Milan, M. Benedetti, D. Fattorini, G. d'Errico, M. Pauletto, L. Bargelloni
and F. Regoli, 2015. Pollutants bioavailability and toxicological risk from microplastics to marine
mussels. Environmental Pollution, 198:211-222. https://doi.org/10.1016/j.envpol.2014.12.021
Barboza, L.G.A., C. Lopes, P. Oliveira, F. Bessa, V. Otero, B. Henriques, J. Raimundo, M. Caetano,
C. Vale and L. Guilhermino, 2020. Microplastics in wild fish from North East Atlantic Ocean and its
potential for causing neurotoxic effects, lipid oxidative damage, and human health risks associated
with ingestion exposure. Science of the Total Environment, 717:134625.
https://doi.org/10.1016/j.scitotenv.2019.134625
Barboza, L.G.A., L.R. Vieira and L. Guilhermino, 2018. Single and combined effects of microplastics
and mercury on juveniles of the European seabass (Dicentrarchus labrax): changes in behavioural
responses and reduction of swimming velocity and resistance time. Environmental Pollution,
236:1014-1019. https://doi.org/10.1016/j.envpol.2017.12.082
Bergmann, M., B. Lutz, M.B. Tekman and L. Gutow, 2017. Citizen scientists reveal: Marine litter
pollutes Arctic beaches and affects wild life. Marine Pollution Bulletin, 125(1-2):535-540.
https://doi.org/10.1016/j.marpolbul.2017.09.055
Bergmann, M., S. Mützel, S. Primpke, M.B. Tekman, J. Trachsel and G. Gerdts, 2019. White and
wonderful? Microplastics prevail in snow from the Alps to the Arctic. Science Advances,
5(8):eaax1157. https://doi.org/10.1126/sciadv.aax1157
Bergmann, M., V. Wirzberger, T. Krumpen, C. Lorenz, S. Primpke, M.B. Tekman and G. Gerdts,
2017. High quantities of microplastic in Arctic deep-sea sediments from the HAUSGARTEN
Observatory. Environmental Science and Technology, 51(19):11000-11010.
https://doi.org/10.1021/acs.est.7b03331
Bessa, F., P. Barría, J.M. Neto, J.P.G.L. Frias, V. Otero, P. Sobral and J.C. Marques, 2018.
Occurrence of microplastics in commercial fish from a natural estuarine environment. Marine
Pollution Bulletin, 128:575-584. https://doi.org/10.1016/j.marpolbul.2018.01.044
Bessa, F., J. Frias, T. Kögel, A. Lusher, J.M. Andrade, J. Antunes, P. Sobral, E. Pagter, R. Nash, I.
O'Connor, M.L. Pedrotti, M.E. Keros, V. León, V. Tirelli, G. Suaria, C. Lopes, J. Raimundo, M.
Caetano, J. Gago, L. Viñas, O. Carretero, K. Magnusson, M. Grandberg, R. Dris, M. Fischer, B.
Scholz-Böttcher, S. Muniategui, G. Grueiro, V. Fernández, L. Palazzo, A. de Lucia, A. Camedda,
C.G. Avio, S. Gorbi, L. Pittura, F. Regoli and G. Gerdts, 2019. Harmonized protocol for monitoring
microplastics in biota. JPI-Oceans BASEMAN project. http://dx.doi.org/10.25607/OBP-821
Booth, A.M., B.H. Hansen, M. Frenzel, H. Johnsen and D. Altin, 2016. Uptake and toxicity of
methylmethacrylate-based nanoplastic particles in aquatic organisms. Environmental Toxicology and
Chemistry, 35(7):1641-1649. http://doi.org/10.1002/etc.3076
Bourdages, M.P.T., J.F. Provencher, J.E. Baak, M.L. Mallory and J.C. Vermaire, 2021. Breeding
seabirds as vectors of microplastics from sea to land: evidence from colonies in Arctic Canada.
Science of the Total Environment, 764: 142808. https://doi.org/10.1016/j.scitotenv.2020.142808
Brander, S.M., V.C. Renick, M.M. Foley, C. Steele, M. Woo, A. Lusher, S. Carr, P. Helm, C. Box, S.
Cherniak, R.C. Andrews and C.M. Rochman, 2020. Sampling and quality assurance and quality

AMAP Litter and Microplastics Monitoring Guidelines
147
control: a guide for scientists investigating the occurrence of microplastics across matrices. Applied
Spectroscopy, 74(9):1099-1125. https://doi.org/10.1177/0003702820945713
Brandon, J.A., A. Freibott and L.M. Sala, 2020. Patterns of suspended and salp-ingested microplastic
debris in the North Pacific investigated with epifluorescence microscopy. Limnology and
Oceanography Letters, 5(1):46-53. https://doi.org/10.1002/lol2.10127
Bråte, I.L.N., D.P. Eidsvoll, C.C. Steindal and K.V. Thomas, 2016. Plastic ingestion by Atlantic cod
(Gadus morhua) from the Norwegian coast. Marine Pollution Bulletin, 112(1-2):105-110.
https://doi.org/10.1016/j.marpolbul.2016.08.034
Bråte, I.L.N., R. Hurley, K. Iversen, J. Beyer, K.V. Thomas, C.C. Steindal, N.W. Green, M. Olsen and
A. Lusher, 2018. Mytilus spp. as sentinels for monitoring microplastic pollution in Norwegian coastal
waters: a qualitative and quantitative study. Environmental Pollution, 243:383-393.
https://doi.org/10.1016/j.envpol.2018.08.077
Buhl-Mortensen, P. and L. Buhl-Mortensen, 2018. Impacts of bottom trawling and litter on the seabed
in Norwegian waters. Frontiers in Marine Science, 5:42. https://doi.org/10.3389/fmars.2018.00042
Collard, F., J. Gasperi, G.W. Gabrielsen and B. Tassin, 2019. Plastic particle ingestion by wild
freshwater fish: a critical review. Environmental Science and Technology, 53(22):12974-12988.
https://doi.org/10.1021/acs.est.9b03083
Collard, F., B. Gilbert, P. Compère, G. Eppe, K. Das, T. Jauniaux and E. Parmentier, 2017.
Microplastics in livers of European anchovies (Engraulis encrasicolus, L.). Environmental Pollution,
229:1000-1005. https://doi.org/10.1016/j.envpol.2017.07.089
Conkle, J.L., C.D.B. Del Valle and J.W. Turner, 2018. Are we underestimating microplastic
contamination in aquatic environments? Environmental Management, 61(1):1-8.
https://doi.org/10.1007/s00267-017-0947-8
Correia, M. and K. Loeschner, 2018. Detection of nanoplastics in food by asymmetric flow field-flow
fractionation coupled to multi-angle light scattering: possibilities, challenges and analytical
limitations. Analytical and Bioanalytical Chemistry, 410(22):5603-5615.
https://doi.org/10.1007/s00216-018-0919-8
Cowger, W., A. Gray, S.H. Christiansen, H. De Frond, A.D. Deshpande, L. Hermabessiere, E. Lee, L.
Mill, K. Munno, B. Ossmann, M. Pittroff, C. Rochman, G. Sarau, S. Tarby and S. Primpke, 2020.
Critical review of processing and classification techniques for images and spectra in microplastic
research. Applied Spectroscopy, 74:989-1010. https://doi.org/10.1177/0003702820929064
Cozár, A., F. Echevarría, J.I. González-Gordillo, X. Irigoien, B. Úbeda, S. Hernández-León, Á.T.
Palma, S. Navarro, J. García-de-Lomas, A. Ruiz, M.L. Fernández-de-Puelles and C.M. Duarte, 2014.
Plastic debris in the open ocean. Proceedings of the National Academy of Sciences, 111(28):10239-
10244. https://doi.org/10.1073/pnas.1314705111
Critchell, K. and M. O. Hoogenboom, 2018. Effects of microplastic exposure on the body condition
and behaviour of planktivorous reef fish (Acanthochromis polyacanthus). PloS ONE, 13(3):0193308.
https://doi.org/10.1371/journal.pone.0193308
de Vries, N.A., D. Govoni, S.H. Árnason and P. Carlsson, 2020. Microplastic ingestion by fish: Body
size, condition factor and gut fullness are not related to the amount of plastics consumed. Marine
Pollution Bulletin, 151:110827. https://doi.org/10.1016/j.marpolbul.2019.110827

AMAP Litter and Microplastics Monitoring Guidelines
148
Dehaut, A., A.-L. Cassone, L. Frère, L. Hermabessiere, C. Himber, E. Rinnert, G. Rivière, C.
Lambert, P. Soudant, A. Huvet, G. Duflos and I. Paul-Pont, 2016. Microplastics in seafood:
benchmark protocol for their extraction and characterization. Environmental Pollution, 215:223-233.
https://doi.org/10.1016/j.envpol.2016.05.018
Dehaut, A., L. Hermabessiere and G. Duflos, 2019. Current frontiers and recommendations for the
study of microplastics in seafood. Trends in Analytical Chemistry, 116:346-359.
https://doi.org/10.1016/j.trac.2018.11.011
European Commission, Directorate-General for Environment, 2017. Commission Decision (EU)
2017/848 of 17 May 2017 laying down criteria and methodological standards on good environmental
status of marine waters and specifications and standardised methods for monitoring and assessment,
and repealing Decision 2010/477/EU. European Commission, Brussels, Belgium. [online] URL:
http://data.europa.eu/eli/dec/2017/848/oj
European Parliament, Council of the European Union, 2000. Directive 2000/60/EC of the European
Parliament and of the Council of 23 October 2000 establishing a framework for Community action in
the field of water policy. European Parliament, Brussels, Belgium. [online] URL: https://eur-
lex.europa.eu/legal-content/EN/TXT/?uri=celex:32000L0060
European Parliament, Council of the European Union, 2008. Directive 2008/56/EC of the European
Parliament and of the Council of 17 June 2008 establishing a framework for community action in the
field of marine environmental policy (Marine Strategy Framework Directive). European Parliament,
Brussels, Belgium. [online] URL: http://data.europa.eu/eli/dir/2008/56/oj
Dos Santos, J. and M.H. Jobling, 1991. Gastric emptying in cod, Gadus morhua L.: emptying and
retention of indigestible solids. Journal of Fish Biology, 38:187-197. https://doi.org/10.1111/j.1095-
8649.1991.tb03105.x
Falk-Andersson, J. and W.J. Strietmann, 2019. Svalbard Beach Litter Deep Dive. SALT Report, No.
1033. SALT, Lofoten, Norway. 57pp. [online] URL: https://salt.nu/wp-
content/uploads/2019/04/1033-Svalbard-Beach-litter-deep-dive.comp_.pdf
Fischer, M. and B.M. Scholz-Böttcher, 2017. Simultaneous trace identification and quantification of
common types of microplastics in environmental samples by pyrolysis-gas chromatography-mass
spectrometry. Environmental Science and Technology, 51(9):5052-5060.
https://doi.org/10.1021/acs.est.6b06362
Gall, S.C. and R.C. Thompson, 2015. The impact of debris on marine life. Marine Pollution Bulletin,
92(1-2):170-179. https://doi.org/10.1016/j.marpolbul.2014.12.041
Gomiero, A., M. Haave, T. Kögel, Ø. Bjorøy, M. Gjessing, T.B. Lea, E. Horve, C. Martins and T.
Olafsen, 2020. TRACKing of PLASTtic emissions from aquaculture industry (TrackPlast). NORCE
Miljø, Bergen, Norway. [online] URL: https://hdl.handle.net/11250/2649891
Gomiero, A., M. Haave, Ø. Bjorøy, D. Herzke, T. Kögel, V. Nikiforov, and K.B. Øysæd, 2020a.
Quantification of microplastic in fillet and organs of farmed salmon - a comparison of methods for
detection and quantification. NORCE Miljø, Bergen, Norway. [online] URL:
https://hdl.handle.net/11250/2687619
Granberg, M.E., L.W. von Friesen, A. Ask, F. Collard, K. Magnusson, A-K. Eriksson Wiklund, F.
Murphy, J. Strand, G.W. Gabrielsen and L. Bach, 2020. Microlitter in Arctic marine benthic food

AMAP Litter and Microplastics Monitoring Guidelines
149
chains and potential effects on sediment dwelling fauna. TemaNord, 528. Nordic Council of
Ministers, Copenhagen, Denmark. https://doi.org/10.6027/temanord2020-528
Granberg, M.E., L.W. von Friesen, L. Bach, F. Collard, J. Strand and G.W. Gabrielsen, 2019.
Anthropogenic microlitter in wastewater and marine samples from Ny-Ålesund, Barentsburg and
Signehamna, Svalbard. No. C 373. IVL Swedish Environmental Research Institute, Stockholm,
Sweden. [online] URL: https://pure.au.dk/portal/files/152355861/C373march.pdf
Green, D.S., B. Boots, J. Sigwart, S. Jiang and C. Rocha, 2016. Effects of conventional and
biodegradable microplastics on a marine ecosystem engineer (Arenicola marina) and sediment
nutrient cycling. Environmental Pollution, 208:426-434. https://doi.org/10.1016/j.envpol.2015.10.010
Grigorakis, S., S.A. Mason and K.G. Drouillard, 2017. Determination of the gut retention of plastic
microbeads and microfibers in goldfish (Carassius auratus). Chemosphere, 169:233-238.
https://doi.org/10.1016/j.chemosphere.2016.11.055
Grøsvik, B.E., T. Prokhorova, E. Eriksen, P. Krivosheya, P.A. Homeland and D. Prozorkevich, 2018.
Assessment of marine litter in the Barents Sea, a part of the joint Norwegian Russian Ecosystem
Survey. Frontiers in Marine Science, 5:72. https://doi.org/10.3389/fmars.2018.00072
Group of Experts on Scientific Aspects of Marine Environmental Protection (GESAMP), 2019.
Guidelines for the Monitoring and Assessment of Plastic Litter and Microplastics in the Ocean.
GESAMP, London, UK, 130pp. [online] URL: http://www.gesamp.org/publications/guidelines-for-
the-monitoring-and-assessment-of-plastic-litter-in-the-ocean
Haave, M., C. Lorenz, S. Primpke and G. Gerdts, 2019. Different stories told by small and large
microplastics in sediment - first report of microplastic concentrations in an urban recipient in Norway.
Marine Pollution Bulletin, 141:501-513. https://doi.org/10.1016/j.marpolbul.2019.02.015
Hermsen, E., S.M. Mintenig, E. Besseling and A.A. Koelmans, 2018. Quality criteria for the analysis
or microplastic in biota samples: a critical review. Environmental Science and Technology, 52:10230-
10240. https://doi.org/10.1021/acs.est.8b01611
Huserbråten, M.B.O., E. Eriksen, H. Gjøsaeter and F. Vikebø, 2019. Polar cod in jeopardy under the
retreating Arctic sea ice. Communications Biology, 2:407. https://doi.org/10.1038/s42003-019-0649-2
Jani, P.U., D.E. Mccarthy and A.T. Florence, 1992. Nanosphere and microsphere uptake via Peyer's
patches - observation of the rate of uptake in the rat after a single oral dose. International Journal of
Pharmaceutics, 86(2-3):239-246. https://doi.org/10.1016/0378-5173(92)90202-d
Jeong, C.-B., E.-J. Won, H.-M. Kang, M.-C. Lee, D.-S. Hwang, U.-K. Hwang, B. Zhou, S. Souissi,
S.-J. Lee and J.-S. Lee, 2016. Microplastic size-dependent toxicity, oxidative stress induction, and p-
JNK and p-p38 activation in the monogonont rotifer (Brachionus koreanus). Environmental Science
and Technology, 50(16):8849-8857. https://doi.org/10.1021/acs.est.6b01441
Kanhai, L.K., K. Gardfeldt, T. Krumpen, R.C. Thompson and I. O'Connor, 2020. Microplastics in sea
ice and seawater beneath ice floes from the Arctic Ocean. Scientific Reports, 10(1):5004.
https://doi.org/10.1038/s41598-020-61948-6
Karami, A., A. Golieskardi, Y.B. Ho, V. Larat and B. Salamatinia, 2017. Microplastics in eviscerated
flesh and excised organs of dried fish. Scientific Reports, 7:5473. https://doi.org/10.1038/s41598-017-
05828-6
AMAP Litter and Microplastics Monitoring Guidelines
150
Kögel, T., Ø. Bjorøy, B. Toto, A.M. Bienfait and M. Sanden, 2019. Micro- and nanoplastic toxicity
on aquatic life: determining factors. Science of the Total Environment, 709:136050.
https://doi.org/10.1016/j.scitotenv.2019.136050
Kögel, T., S. Frantzen, H. Hove, A. Duinker, B. Nilsen, A.-K. Lundebye and A. Maage, 2015.
Rettleiar for prøvetaking av sjømat frå forureina område med formål advarsel. NIFES, Oslo, Norway.
Kühn, S., F.L. Schaafsma, B. van Werven, H. Flores, M. Bergmann, M. Egelkraut-Holtus, M.B.
Tekman and J.A. van Franeker, 2018. Plastic ingestion by juvenile polar cod (Boreogadus saida) in
the Arctic Ocean. Polar Biology, 41(6):1269-1278. https://doi.org/10.1007/s00300-018-2283-8
Leclerc, L.-M.E., C. Lydersen, T. Haug, L. Bachmann, A.T. Fisk and K.M. Kovacs, 2012. A missing
piece in the Arctic food web puzzle? Stomach contents of Greenland sharks sampled in Svalbard,
Norway. Polar Biology, 35(8):1197-1208. https://doi.org/10.1007/s00300-012-1166-7
Lehtiemi, M., S. Hartikainen, P. Näkki, J. Engström-Öst, A. Koistinen and O. Setälä, 2018. Size
matters more than shape: ingestion of primary and secondary microplastics by small predators. Food
Webs, 16:e00097. https://doi.org/10.1016/j.fooweb.2018.e00097
Löder, M.G.J., H K. Imhof, M. Ladehoff, L.A. Löschel, C. Lorenz, S. Mintenig, S. Piehl, S. Primpke,
I. Schrank, C. Laforsch and G. Gerdts, 2017. Enzymatic purification of microplastics in
environmental samples. Environmental Science and Technology, 51(24):14283-14292.
https://doi.org/10.1021/acs.est.7b03055
Lusher, A., P. Hollman and J. Mendoza-Hill, 2017. Microplastics in fisheries and aquaculture: status
of knowledge on their occurrence and implications for aquatic organisms and food safety. FAO
Fisheries and Aquaculture Technical Paper, 615. FAO, Rome, Italy. [online] URL:
http://www.fao.org/3/a-i7677e.pdf
Lusher, A.L., K. Munno, L. Hermabessiere and S. Carr, 2020. Isolation and extraction of
microplastics from environmental samples: an evaluation of practical approaches and
recommendations for further harmonization. Applied Spectroscopy, 74(9):1049-1065.
https://doi.org/10.1177/0003702820938993
Lusher, A. L., V. Tirelli, I. O'Connor and R. Officer, 2015. Microplastics in Arctic polar waters: the
first reported values of particles in surface and sub-surface samples. Scientific Reports. 5:14947.
https://doi.org/10.1038/srep14947
Lusher, A.L., N.A. Welden, P. Sobral and M. Cole, 2017. Sampling, isolating and identifying
microplastics ingested by fish and invertebrates. Analytical Methods, 9(9):1346-1360.
https://doi.org/10.1039/c6ay02415g
Magnusson, K., H. Jörundsdóttir, F. Norén, H. Lloyd, J. Talvitie and O. Setälä, 2016. Microlitter in
sewage treatment systems: a Nordic perspective on waste water treatment plants as pathways for
microscopic anthropogenic particles to marine systems. Nordic Council of Ministers, Copenhagen,
Denmark. https://doi.org/10.6027/TN2016-510
Mani, T., S. Primpke, C. Lorenz, G. Gerdts and P. Burkhardt-Holm, 2019. Microplastic pollution in
benthic mid-stream sediments of the Rhine River. Environmental Science and Technology, 53:6053-
6062. https://doi.org/10.1021/acs.est.9b01363

AMAP Litter and Microplastics Monitoring Guidelines
151
Markic, A., J.-C. Gaertner, N. Gaertner-Mazouni and A.A. Koelmans, 2020. Plastic ingestion by
marine fish in the wild. Critical Reviews in Environmental Science and Technology, 50(7):657-697.
https://doi.org/10.1080/10643389.2019.1631990
Mattsson, K., E.V. Johnson, A. Malmendal, S. Linse, L.-A. Hansson and T. Cedervall, 2017. Brain
damage and behavioural disorders in fish induced by plastic nanoparticles delivered through the food
chain. Scientific Reports, 7:11452. https://doi.org/10.1038/s41598-017-10813-0
Mintenig, S.M., I. Int-Veen, M.G.J. Löder, S. Primpke and G. Gerdts, 2017. Identification of
microplastic in effluents of waste water treatment plants using focal plane array-based micro-Fourier-
transform infrared imaging. Water Research, 108:365-372.
https://doi.org/10.1016/j.watres.2016.11.015
Morgana, S., L. Ghigliotti, N. Estévez-Calvar, R. Stifanese, A. Wieckzorek, T. Doyle, J.S.
Christiansen, M. Faimali and F. Garaventa, 2018. Microplastics in the Arctic: a case study with sub-
surface water and fish samples off Northeast Greenland. Environmental Pollution, 242:1078-1086.
https://doi.org/10.1016/j.envpol.2018.08.001
Nashoug, B.F., 2017. Sources of Marine Litter – Workshop Report, Svalbard 4th -6th September
2016. SALT, Lofoten, Norway. [online] URL: https://pame.is/document-library/desktop-study-on-
marine-litter-library/marine-litter-sources/577-nashoug-2017-sources-of-marine-litter-worksh/file
Neves, D., P. Sobral, . L. Ferreira and T. Pereira, 2015. Ingestion of microplastics by commercial fish
off the Portuguese coast. Marine Pollution Bulletin, 101(1):119-126.
https://doi.org/10.1016/j.marpolbul.2015.11.008
Nielsen, J., R.B. Hedeholm, M. Simon and J.F. Steffensen, 2014. Distribution and feeding ecology of
the Greenland shark (Somniosus microcephalus) in Greenland waters. Polar Biology, 37(1):37-46.
https://doi.org/10.1007/s00300-013-1408-3
Obbard, R.W., S. Sadri, Y.Q. Wong, A.A. Khitum, I. Baker and R.C. Thompson, 2014. Global
warming releases microplastic legacy frozen in Arctic Sea ice. Earth's Future, 2:315-320.
https://doi.org/10.1002/2014EF000240
Ory, N., C. Chagnon, F. Felix, C. Fernández, J.L. Ferreira, C. Gallardo, O.G. Ordónez, A. Henostroza,
E. Laaz, R. Mizraji, H. Mojica, V.M. Haro, L.O. Medina, M. Preciado, P. Sobral, M.A. Urbina and M.
Thiel, 2018. Low prevalence of microplastic contamination in planktivorous fish species from the
southeast Pacific Ocean. Marine Pollution Bulletin, 127:211-216.
https://doi.org/10.1016/j.marpolbul.2017.12.016
OSPAR, 2015. OSPAR request on development of a common monitoring protocol for plastic particles
in fish stomachs and selected shellfish on the basis of existing fish disease surveys. In: ICES Special
Request Advice Northeast Atlantic and Arctic Ocean. ICES, Copenhagen, Denmark. [online] URL:
http://www.ices.dk/sites/pub/Publication%20Reports/Advice/2015/Special_Requests/OSPAR_PLAS
T_advice.pdf
Peeken, I., S. Primpke, B. Beyer, J. Gütermann, C. Katlein, T. Krumpen, M. Bergmann, L. Hehemann
and G. Gerdts, 2018. Arctic sea ice is an important temporal sink and means of transport for
microplastic. Nature Communications, 9:1505. https://doi.org/10.1038/s41467-018-03825-5

AMAP Litter and Microplastics Monitoring Guidelines
152
Primpke, S., C. Lorenz, R. Rascher-Friesenhausen and G. Gerdts, 2017. An automated approach for
microplastics analysis using focal plane array (FPA) FTIR microscopy and image analysis. Analytical
Methods, 9(9):1499-1511. https://doi.org/10.1039/c6ay02476a
Provencher, J.F., J.C. Vermaire, S. Avery-Gomm, B.M. Braune and M.L. Mallory, 2018. Garbage in
guano? Microplastic debris found in faecal precursors of seabirds known to ingest plastics. Science of
the Total Environment, 644:1477-1484. https://doi.org/10.1016/j.scitotenv.2018.07.101
Rochman, C.M., J.M. Parnis, M.A. Browne, S. Serrato, E.J. Reiner, M. Robson, T. Young, M.L.
Diamond and S.J. Teh, 2017. Direct and indirect effects of different types of microplastics on
freshwater prey (Corbicula fluminea) and their predator (Acipenser transmontanus). PloS ONE,
12(11):0187664. https://doi.org/10.1371/journal.pone.0187664
Rochman, C.M., A. Tahir, S.L. Williams, D.V. Baxa, R. Lam, J.T. Miller, F.-C. Teh, S. Werorilangi
and S.J. Teh, 2015. Anthropogenic debris in seafood: plastic debris and fibers from textiles in fish and
bivalves sold for human consumption. Scientific Reports, 5:14340. https://doi.org/10.1038/srep14340
Simon, M., N. van Alst and J. Vollertsen, 2018. Quantification of microplastic mass and removal rates
at wastewater treatment plants applying Focal Plane Array (FPA)-based Fourier Transform Infrared
(FT-IR) imaging. Water Research, 142:1-9. https://doi.org/10.1016/j.watres.2018.05.019
Ter Halle, A., L. Jeanneau, M. Martignac, E. Jardé, B. Pedrono, L. Brach and J. Gigault, 2017.
Nanoplastic in the North Atlantic Subtropical Gyre. Environmental Science and Technology,
51(23):13689-13697. https://doi.org/10.1021/acs.est.7b03667
van Franeker, J.A., 2011. Reshape and relocate: seabirds as transformers and transporters of
microplastics. Fifth International Marine Debris Conference, Honolulu, Hawaii. pp. 313-315. [online]
URL:https://marinedebris.noaa.gov/technical-proceedings-fifth-international-marine-debris-
conference
von Friesen, L.W., M.E. Granberg, M. Hassellöv, G.W. Gabrielsen and K. Magnusson, 2019. An
efficient and gentle enzymatic digestion protocol for the extraction of microplastics from bivalve
tissue. Marine Pollution Bulletin, 142:129-134. https://doi.org/10.1016/j.marpolbul.2019.03.016
von Friesen, L.W., M.E. Granberg, O. Pavlova, K. Magnusson, M. Hassellov and G.W. Gabrielsen,
2020. Summer sea ice melt and wastewater are important local sources of microlitter to Svalbard
waters. Environment International, 139:105511. https://doi.org/10.1016/j.envint.2020.105511
Wu, X. J., J. Pan, M. Li, Y. Li, M. Bartlam and Y. Wang, 2019. Selective enrichment of bacterial
pathogens by microplastic biofilm. Water Research, 165:114979.
https://doi.org/10.1016/j.watres.2019.114979
Photo: Maria E. Granberg

AMAP Litter and Microplastics Monitoring Guidelines
153
3.3 Seabirds AUTHORS: JENNIFER PROVENCHER, GEIR WING GABRIELSEN, MARK MALLORY, JULIA BAAK, FLEMMING MERKEL,
JANNIE LINNEBJERG, AND SJÚRÐUR HAMMER
3.3.1 Introduction
Seabird exposure to litter and microplastics
Seabirds are vulnerable to litter and microplastics (MP) in two ways. First, seabirds can become
entangled in larger debris items such as fishing gear and plastic bags. This can lead to seabird deaths
via drowning if the birds cannot resurface to breathe (Battisti et al., 2019; Jagiello et al., 2019; Lively
and Good, 2019). Seabirds also collect plastic debris from the water and shorelines and use it for nest
building, which can lead to mortality on breeding colonies if birds are trapped in nesting material and
starve (Votier et al., 2011; Bond et al., 2012). Second, seabirds can ingest plastic particles and other
items, potentially leading to blockage or damage to the gastrointestinal tract (Brandão et al., 2011),
reduced body condition, or increased satiation (Connors and Smith, 1982; Dickerman and Goelet,
1987; Ryan, 1987; Sievert and Sileo, 1993; Talsness et al., 2009). Furthermore, plastic pollution
ingestion can potentially lead to an increase in exposure to contaminants associated with plastics, as
additives or via sorption processes (Teuten et al., 2009; Lavers and Bond, 2016).
Ingestion of non-plastic debris items by birds dates back to the 1800s, but plastic ingestion by seabirds
has been reported since the 1960s (Kühn et al., 2015; Provencher et al., 2019). To date, ingestion of
plastics or other debris has been reported in 180 of the world’s 409 seabird species (Kühn et al.,
2015). Of the 64 seabird species in the Arctic (Irons et al., 2015), 40 have been examined for ingested
plastics (Baak et al., 2020a), of which 58% have ingested plastic in the Arctic (using the AMAP
definition for the Arctic area; Figure 3.4). Although several studies suggest that seabirds experience
negative effects from ingested plastic pollution at the individual level, there is no evidence to date that
seabirds are negatively impacted at the population level, although limited studies have the capacity to
address this question to date.
Seabirds as indicators of plastic pollution – the Northern Fulmar in the OSPAR region
The Northern Fulmar (Fulmarus glacialis) is the biological indicator for plastic pollution over 1 mm
in the North Sea, where a mandated plastic pollution monitoring program has been in place under the
1992 Oslo and Paris Conventions for the protection of the marine environment of the northeast
Atlantic (OSPAR). Originally, the regional Ecological Quality Objective (EcoQO) was developed
based on data from Europe, but now also includes data from remote Canadian high-Arctic populations
for the 2003-2013 period (van Franeker et al., 2011; Provencher et al., 2017; van Franeker and Kühn,
2020). The current definition of OSPAR's marine plastics EcoQO is: “There should be fewer than
10% of Northern Fulmars having 0.1 g or more plastic in the stomach in samples of 50-100 beached
Fulmars from each of 5 different areas of the North Sea over a period of at least 5 years.” Northern
Fulmars breed along cliffs in the circum-Arctic region, and the protocols developed to track plastic
pollution in the North Sea have been applied to Arctic-breeding Northern Fulmars (e.g., Provencher et
al., 2009; Kühn and van Franeker, 2012; Trevail et al., 2015; Poon et al., 2017; Snæþórsson, 2018,
2019).

AMAP Litter and Microplastics Monitoring Guidelines
154
3.3.2 Trends to date, globally and in the Arctic
Based on the plastic monitoring in Northern Fulmars, spatial and temporal trends have been
described. Importantly, monitoring Northern Fulmars to date has focused on tracking trends, over
time and space, of different plastic pollution types. The mass of plastic pollution in seabirds declines
with an increase in latitude, i.e., individuals in the Arctic have less plastic pollution compared to sub-
Arctic and temperate locations (Kühn and van Franeker, 2012; Trevail et al., 2015; Provencher et al.,
2017). The OSPAR program, which has tracked plastic pollution in the North Sea since the 1980s, has
shown that generally the plastic pollution in fulmars increased until about the mid-2000s. Since that
time, the average mass of ingested plastic pollution in fulmars has levelled off (van Franeker et al.,
2011). It has also been observed in the North Sea and in the southern hemisphere that the levels of
industrial plastics in seabirds have generally declined since the 1980s when industry was engaged to
alter their practices to prevent the loss of pellets to the environment (Ryan, 2008; van Franeker et al.,
2011; OSPAR, 2017).
The foraging strategy of seabirds has been shown to influence the ingestion and accumulation levels
of litter and MP (Avery-Gomm et al., 2013; Provencher et al., 2014; Poon et al., 2017). Different
seabird species feeding in a similar region can have significantly different levels of litter and MP
accumulation. For example, Poon et al., 2017 found that accumulation rates differed among four
seabird species examined in a single colony in northern Canada. They were different between groups,
but similar within foraging strategies; surface feeders had higher levels of plastic accumulation
compared to species that fed primarily in the pelagic zone. These findings highlighted that monitoring
data cannot be compared between species, with foraging strategy as the main factor determining data
variation. Additionally, sampling in the Arctic region spans decades. With much of the data from
some regions collected before the year 2000 and focused on a handful of species that have been
collected opportunistically, rigorous comparisons are a challenge. (Figure 3.4).
3.3.3 Benefits of using seabirds as indicators
There are several benefits to using seabird samples to monitor litter and MP pollution in the
environment. Globally, seabirds are particularly good indicator species for marine litter and MP
because essentially, as they forage, they are integrating information over a relatively large
geographical area. Seabirds also breed in colonies that are relatively easy to access for study purposes
(Piatt et al., 2007) and can provide sufficient samples in a targeted sampling campaign at a single
location, in contrast to the efforts associated with sampling at sea. In some cases, seabirds are
harvested, and thus working with community hunters can provide samples for analysis. Finally,
seabirds are also found as beached birds in many regions, providing easily obtainable samples with
little collection effort (and with the possibility of engaging citizen science and local harvesters).
Specific to the Arctic, seabirds are also useful bioindicators for several reasons. First, there are
existing data on diet, reproduction, and contaminants in several seabird species in the Arctic dating
back to the 1970s (Barrett et al., 1985; Gaston et al., 2012a). For many species, long-term population
monitoring data are available, often along with other data types such as diet data (including stable
isotope data to establish trophic relationships) and studies of contaminants (Braune et al., 2006, 2014),
enabling co-assessments of several parameters. Second, Arctic-breeding seabird species are also
found outside of the Arctic, which thus provides the opportunity to compare levels within the Arctic
to regions beyond the Arctic (van Franeker et al., 2011; Provencher et al., 2017). Third, in many
locations, community-based researchers can carry out much of the work involved in assessing

AMAP Litter and Microplastics Monitoring Guidelines
155
seabirds for plastic pollution (Provencher, 2014). Fourth, contaminants monitoring in several regions,
including the Arctic, already uses seabirds for tracking patterns and trends in environmental
contaminants (Dietz et al., 2019), which can potentially provide a platform for new monitoring
parameters (Provencher et al., 2015; Poon et al., 2017).
3.3.4 Limitations of using seabirds as indicators
There are also several limitations for using seabirds in monitoring plastic pollution. First, most past
studies are limited to plastic and debris that are greater than 1 mm, therefore their current use to study
smaller MP is limited. There are some studies that have included smaller size fractions, but these
findings are more likely reflecting very local environmental levels more easily sampled via other
compartments such as sediments or invertebrates (e.g., Provencher et al., 2018; Reynolds and Ryan,
2018). The indicator species can only be reliably sampled in regions where they regularly breed, are
harvested, or carcasses wash ashore—another limitation of seabird studies. Lastly, seabirds can be
long-lived and migrate over long distances. Although this can be advantageous in many ways when
studying contaminants, it does mean that their route and rate of digestion of plastic pollution are
needed to understand the rates of accumulation and what/where their accumulated plastic pollution
reflects (Ryan, 2015; van Franeker and Law, 2015).
Seabirds are not evenly distributed along the Arctic coastlines, and therefore there will be
geographical gaps in monitoring programs that aim to examine environmental contaminants via
seabirds. For example, the western part of the Canadian Arctic Archipelago and the central Russian
Arctic have limited numbers of cliff-nesting seabirds, the main type of seabirds used for contaminants
monitoring in the Arctic (Figure 3.4). This limits their use in some regions.
3.3.5 Methods to assess litter and microplastics in seabirds
There are several methods for assessing ingested plastics in seabirds: necropsies, regurgitations, and
pellet collections being the most common (Provencher et al., 2019). There are benefits and limitations
to each of these methods, as discussed in Provencher et al., 2019. Importantly, many of these methods
to study plastic ingestion in seabirds can be integrated with diet studies.
All three methods have been applied to seabirds in the Arctic, with the most common method across
species and regions being the necropsy method (Baak et al., 2020a). Standard seabird processing
protocols exist that can be applied across species and regions (van Franeker et al., 2011; Provencher et
al., 2019), including standardized reporting guidelines to ensure that data formats are comparable
(Provencher et al., 2017; Box A). These should be applied to all Arctic seabird studies undertaken so
that these studies can contribute to the global understanding of plastic pollution trends and patterns in
seabirds.
Further steps in the quantitative determination and identification of plastic particles as well as data
formats in reporting are described in Provencher et al., 2017, 2019. This includes biological
parameters to be reported for each bird, and identification, characterizing, measuring, and reporting of
the different types of plastic particles. Further, identification of plastic particles found in the stomachs
of seabirds will be of great help to identify the source of the plastic.

AMAP Litter and Microplastics Monitoring Guidelines
156
3.3.6 Quality assessment/quality control (QA/QC) specific to the compartment/matrix
Most studies consider the gastrointestinal tracts of seabirds, and therefore collections of carcasses via
harvest, wreck events, incidental bycatch, etc. can be used as long as the abdomen section has not
been pierced or has not decomposed. The recommended QA/QC measures for identifying and
characterizing plastic particles applied to seabirds can be limited to general clean laboratory
procedures because most seabird studies do not consider plastic < 1 mm (Provencher et al., 2019).
When plastics < 1 mm are considered, standard QA/QC procedures for these size classes as well as
laboratory blanks are recommended to control for cross-contamination. Associated data corrections
should be considered (e.g., Provencher et al., 2018).
Box A: Recommended data collection for the determination of litter and microplastics in seabirds.
Based on Provencher et al., 2017, 2019.
Mandatory data for reporting plastic ingestion in seabirds (recommended data to be archived
at the individual level)
• Location, including latitude and longitude of sampling
• Date, including day, month, and year
• Sample method (necropsy, regurgitation, pellets)
• Carcass collection method (e.g., hunting, wrecked birds, bycatch, etc.)
• Species
• Tissue sampled (i.e., gastrointestinal tract, stomach)
• Age (including breeding stage)
• Sex
• Total number of user plastics and industrial plastic categories (see Provencher at al., 2017)
• Total mass of user plastics and industrial plastic categories (see Provencher at al., 2017)
Supporting data
• Cause of mortality (with necropsy, where possible)
• Body condition metrics: pectoral muscle size, body mass (when the bird is dry and clean), and
subcutaneous fat using the OSPAR protocols as a guide (van Franeker et al., 2011)
• Color of plastic debris, reported in eight broad color groups
• Polymer type proportions per birds and method used
• Total plastics reported by size classes (> 5 mm, 1 < 5 mm, 330 µm < 1 mm, 100 µm < 330 µm)
All of the collected mandatory data, and if possible also the supplementary data, should be reported to
an international database (e.g., ICES DOME), so data can be secured and made available in a
comparative data format for circumpolar assessments.
3.3.7 Existing monitoring for populations/contaminants in the Arctic
Seabirds are regularly monitored for contaminants in the Arctic, and data from seabirds are used in
AMAP assessments of persistent organic pollutants (POPs), chemicals of emerging Arctic concern
(CEAC), and Hg (e.g., Letcher et al., 2010; Dietz et al., 2019). In Svalbard, eggs and blood are
collected every year from Black-legged Kittiwakes (Rissa tridactyla), Glaucous Gulls (Larus
hyperboreus), and Common Eiders (Somateria mollissima) for contaminant monitoring. The
Greenland contaminant monitoring program includes a biannual collection of eggs of Black
Guillemots (Cepphus grylle) and livers of Glaucous Gulls in Central East Greenland (Rigét et al.,
2016). Some programs include Environmental Specimen Banks where the samples have been
archived for decades and are potentially available for retrospective studies in relation to contaminants

AMAP Litter and Microplastics Monitoring Guidelines
157
from plastic pollution. Depending on the region, seabird eggs or blood samples are the common
monitoring tissue, but in some areas (e.g., Canada) standardized collections of adult birds are also
undertaken (Mallory and Braune, 2012).
Most countries have standardized population monitoring of the main seabird species, undertaken at
varying intervals, from annually to once every 10 years (Irons et al., 2015). In the Arctic, seabird
population monitoring is coordinated by the Circumpolar Seabird Expert Group (CBird), under the
Conservation of Arctic Flora and Fauna (CAFF) working group (Irons et al., 2015), and thus these
programs can be used to implement an integrated monitoring strategy in the context of seabirds and
litter and MP.
3.3.8 Recommendations
Due to the variation in foraging ecology of Arctic seabird species, different species can be used to
address different monitoring objectives. Importantly, not all species have a circum-Arctic range or are
accessible in all regions of the Arctic. By using different species, seabirds can offer a complementary
approach that can be implemented throughout the Arctic (Tables 3.7, 3.8, 3.9). The rationale for the
following recommendations is based on a number of factors, including existing monitoring programs
in waters adjacent to the Arctic (Figure 3.5), sample accessibility, likelihood of positive results,
availability of complementary data, and interest for local communities.
Primary recommendations
Northern Fulmar stomachs — A key component for monitoring plastic pollution via Arctic breeding
seabirds is the implementation of coordinated collections and processing of Northern Fulmar
stomachs. This builds on previous data available in the Arctic and other regions, allows for
comparisons between Arctic sites as well as sub-Arctic and temperate locations (e.g., OSPAR), and
can be implemented relatively easily based on other research programs (Tables 3.8 and 3.9). A focus
on monitoring ingestion pollution by Northern Fulmars would provide trend monitoring in a large
proportion of the Arctic (Figure 3.5).
A minimum of 40 individuals should be collected at each site based on a power analysis of the data
available from the Canadian Arctic (Provencher et al., 2015). Sampling should be prioritized at sites
where historic sampling has been done (i.e., Lancaster Sound and eastern Baffin Island in Canada,
Svalbard, Iceland, Faroe Islands, Greenland, Alaska) as well as initiated where possible in other
regions with nesting fulmars (e.g., Russia). Sampling should take place later in the breeding season or
in the fall to most likely reflect plastic pollution collected in the Arctic around the breeding colonies
compared to burdens upon their arrival that may reflect mainly plastic pollution ingested during the
wintering period in non-Arctic regions. Specifically, sampling in the autumn should be done when the
fulmar chicks have left the nest. Given that historic sampling of Northern Fulmar stomachs has been
opportunistic to date, we recommend that coordinated sampling of Northern Fulmars be implemented
on an annual or biennial schedule for 8-10 years to establish levels and their variability. Using these
data, we can then assess the required future frequency of sampling to detect some percentage of
change in levels, as has been done for contaminants (Rigét et al., 2019). In areas of the Arctic in
which we do not find dead fulmars on beaches, as long-line fisheries bycatch, and Indigenous
harvesters do not collect Northern Fulmars, the method of stomach flushing could be developed as an
alternative monitoring method, although comparative studies on flushing efficiency of ingested
particles are still needed. Importantly, we recommend that all data collected on Northern Fulmars in

AMAP Litter and Microplastics Monitoring Guidelines
158
the Arctic be entered into an international database (e.g., ICES DOME), so data can be secured and
made available for future assessments.
Secondary recommendations
Uria spp. stomachs — Uria spp. have been assessed for plastic ingestion in the Arctic and sub-Arctic
(Provencher et al., 2010; Bond et al., 2013; Poon et al., 2017). Although litter and MP ingestion in
Thick-billed Murres (Uria lomvia) and Common Murres (Uria aalge) are low (mean ~0-3%; Baak et
al., 2020a), likely due to their pelagic foraging strategy, murres are widely hunted and thus can be
easily and efficiently sampled (Figure 3.6). Moreover, there are existing plastic ingestion data in
several Arctic regions (Canada, Alaska, Greenland, Svalbard, and Russia). Also, they are harvested
for subsistence and therefore are likely of interest to communities for tracking plastic pollution in
relation to human health. A minimum sample of 60 murres should be collected (Provencher et al.,
2015), with monitoring prioritized in regions where historic data exist and/or where hunting regularly
occurs and a plastic assessment could be relatively easily implemented.
Gull/skua boluses — There are reports on plastic ingestion in gulls or skuas from Canada, the USA
(Alaska), the Faroe Islands, Russia, and Svalbard. Considering the low numbers of gulls in colonies
(often a dozen or so pairs per colony), and their declining trends in some regions (e.g., North
America; Petersen et al., 2015), gulls are not an ideal candidate for monitoring plastic pollution in the
Arctic. However, there are several research questions that could be addressed by examining gull/skua
boluses. For example, the collection of gull/skua regurgitated pellets (i.e., non-lethal sampling) should
be explored and implemented in colonies where monitoring of populations is already occurring.
Examination of pellets will provide information about the potential trophic transfer of litter and MP in
Arctic food webs (Hammer et al., 2016). Additionally, to better understand point sources of pollution,
gull/skua boluses can be collected around urban centers where waste management actions may be put
into place (such as the Marine Litter Regional Action Plan that is currently being developed under
PAME). Gull/skua boluses often contain litter large enough to identify to product (Hammer et al.,
2016; Seif et al., 2018). Lastly, the use of existing programs that collect eggs from gulls and skuas
regularly could be expanded to include plastic-derived contaminants to study how seabirds may be
affected by contaminants from plastic pollution (i.e., in Canada and Norway).
Nest incorporation by Black-legged Kittiwakes — Nest incorporation tracks larger pieces of litter and
plastics in the marine environment (Votier et al., 2011; Bond et al., 2012). Black-legged Kittiwakes
are one of the few widespread and numerically abundant species that build nests in the Arctic (Figure
3.7). Although limited data on nest incorporation of plastics exist for Black-legged Kittiwakes in the
Arctic, there are existing data from other regions (Hartwig et al., 2007; O’Hanlon et al., 2017), and a
similar Arctic-based protocol could easily be developed and implemented via other existing colony-
based programs (i.e., colony monitoring in person or by video and other technologies). A minimum of
200 nests should be monitored at each site for plastics incorporation in nests (Provencher et al., 2015)
and could be done through a combination of focal areas observed and photographs via community-
based monitoring programs. A protocol should be developed that is harmonized with existing efforts
outside of the Arctic and implemented at all colonies where regular colony work is already in place.
Common Eider stomachs — Although Common Eiders are known to have low levels of plastic
ingestion (Provencher et al., 2014), eiders are benthic feeders and commonly found and harvested
throughout the circum-Arctic region. This species is recommended only in combination with
environmental samples and tissue samples for examining plastic-related contaminants. Examination of
plastic ingestion in this species down to 300 µm paired with sediment and water sampling in a region

AMAP Litter and Microplastics Monitoring Guidelines
159
would allow for examination of how MP in benthic organisms may be entering the food web.
Common Eiders are also commonly harvested for their meat, and studies focused on MP in
association with plastic-derived and plastic-associated contaminants are of interest to northern
communities. A minimum of 50 individuals per site, paired with locations in which water, sediment,
and benthic invertebrates are collected, is recommended based on the low prevalence in this species
(< 1%). Given the likely quick passage of MP via the eider, sampling could take place in any season,
but should be tied tightly to environmental samples. Additionally, tissues that also reflect local levels
should be examined. Any sampling of eiders should also consider preserving tissue samples that can
be used to determine concentrations of plastic additive contaminants in tissues most often consumed
by humans (i.e., muscle tissue and eggs).
Research gaps — There are currently several knowledge gaps in seabird studies in relation to
monitoring trends and patterns in litter and MP. Given the links between plastic ingestion and the
potential uptake of plastic-associated and plastic-derived contaminants by biota, the use of Northern
Fulmar and Common Eider eggs paired with ingestion studies would provide insights into how biota
may be exposed to contaminants from litter and MP. There is also a need for studies on plastic
ingestion that explore the links between the ingestion of plastic and the impact at the population level.
Few studies have examined the litter and MP ingestion and accumulation in the Black Guillemot, a
widespread, coastal feeding species. In Canada, Poon et al. (2017) found that Black Guillemots on
Prince Leopold Island had a 0% prevalence of plastic ingestion in Lancaster Sound, and similarly,
Baak et al. (2020b) found Black Guillemots from eastern Baffin Island to have 0% prevalence of
plastic ingestion. Plastics have not been found in guillemots in other Arctic regions (Mehlum and
Giertz, 1984; Gjertz et al., 1985; Lydersen et al., 1989; Weslawski et al., 1994). Given the need to
assess more local impacts in relation to the regional action plans, the development and
implementation of litter and MP monitoring in Black Guillemot studies would provide both a
monitoring tool that could be implemented in many locations given the dispersed nature of Black
Guillemot breeding colonies (they breed in colonies of 100s to 1000s, but can be located every few
kilometers along the coast; Gaston et al., 2012b). This species also breeds in the Arctic, sub-Arctic,
and temperate locations, therefore providing another tool for Arctic monitoring that can contribute to
large scale comparisons.
In the Arctic AMAP region, there are several studies examining litter and MP in Dovekies (Alle alle),
but most were conducted before 2000 (Baak et al. 2020a). Studies have found fragments, and,
notably, burned plastics in stomachs from the wintering regions in Newfoundland, Canada (Fife et al.,
2015), and fragments and microfibers in gular pouch sampling at a breeding colony in Greenland
(Amélineau et al., 2016). This species may be particularly useful in studying how plastic pollution
may be parentally transferred to chicks in the colonies, thus exposing young birds to higher levels of
plastic pollution in some regions (Amélineau et al., 2016). Although there are large colonies of
Dovekies in some regions, there are no large breeding colonies in North America, and therefore their
use as a circum-Arctic indicator species for plastic pollution monitoring is limited.
Although seabird meat is consumed across the Arctic by northern communities, the analytical
capacity to examine MP in soft tissues that have translocated outside of the gut are limited. To address
future research questions in connection with human health and small MP sizes (nanoplastics), more
work needs to be focused in this area.
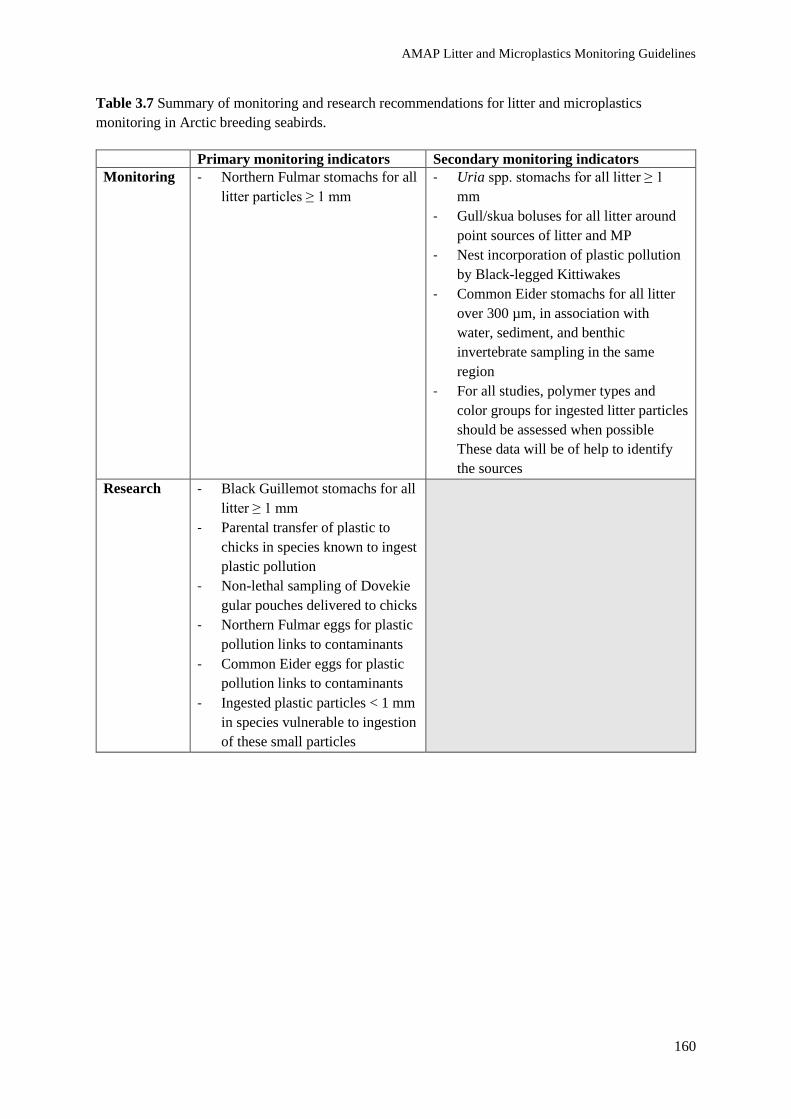
AMAP Litter and Microplastics Monitoring Guidelines
160
Table 3.7 Summary of monitoring and research recommendations for litter and microplastics
monitoring in Arctic breeding seabirds.
Primary monitoring indicators Secondary monitoring indicators
Monitoring - Northern Fulmar stomachs for all
litter particles ≥ 1 mm
- Uria spp. stomachs for all litter ≥ 1
mm
- Gull/skua boluses for all litter around
point sources of litter and MP
- Nest incorporation of plastic pollution
by Black-legged Kittiwakes
- Common Eider stomachs for all litter
over 300 µm, in association with
water, sediment, and benthic
invertebrate sampling in the same
region
- For all studies, polymer types and
color groups for ingested litter particles
should be assessed when possible
These data will be of help to identify
the sources
Research - Black Guillemot stomachs for all
litter ≥ 1 mm
- Parental transfer of plastic to
chicks in species known to ingest
plastic pollution
- Non-lethal sampling of Dovekie
gular pouches delivered to chicks
- Northern Fulmar eggs for plastic
pollution links to contaminants
- Common Eider eggs for plastic
pollution links to contaminants
- Ingested plastic particles < 1 mm
in species vulnerable to ingestion
of these small particles

AMAP Litter and Microplastics Monitoring Guidelines
161
Table 3.8 Characteristics of litter and microplastics monitoring that could be achieved by seabird
monitoring programs.
Species Type of litter and
microplastics
Type of monitoring Types of collection
methods
Northern Fulmar Ingested floating
plastics ≥ 1 mm
Trend monitoring for
both temporal and
spatial monitoring
Beached birds,
bycatch birds from
fisheries, harvested
birds from hunters
Uria spp. Ingested floating and
mid-water column
plastics ≥ 1 mm
Focus on effects
monitoring, including
links to human health
and trophic transfer of
MP and plastic
associated and
derived contaminants
Beached birds,
bycatch birds from
fisheries, harvested
birds from hunters
Black-legged
Kittiwake nest
incorporation
Litter collected
locally for nest
building
Source monitoring
around areas of
concern
Nest observations
Gull/skua boluses Litter and MP from
local areas via bolus
collection
Source monitoring
around areas of
concern
Bolus collection from
nest or club sites
Common Eiders Ingested benthic MP Focus on effects
monitoring, including
links to human health
and trophic transfer of
MP and plastic
associated and
derived contaminants
Beached birds,
bycatch birds from
fisheries, harvested
birds from hunters

AMAP Litter and Microplastics Monitoring Guidelines
162
Table 3.9 Summary rationale for recommendations, including estimated costs for implementing
programs: 0 - litter and plastic pollution monitoring already in place with regular funding; $ -
relatively inexpensive because new litter and microplastic monitoring programs can use existing
programs to obtain samples in at least some regions, but need to have some additional capacity to
process samples for litter and plastic pollution; $$ - either sampling networks and/or capacity need to
be developed to monitor litter and microplastic pollution; $$$ - development of sampling networks,
processing capacity of samples, and reporting all need to be developed in the majority of the Arctic
regions.
Recommendations Program cost Rationale
Primary Monitoring
Indicators
Northern Fulmar stomachs
for all litter ≥ 1 mm
- Useful as a monitor in
alignment with OSPAR
- Offshore surface feeder
$ Existing research programs are already in place
on Northern Fulmar colonies, making it relatively
easy to add a collection for plastic pollution to
the workplan. Minimal costs would need to be
added to implement plastic pollution monitoring
to cover the costs of collections and processing
the birds for plastic pollution specifically.
Secondary Monitoring
Indicators
Uria spp. stomachs for all
litter over 1 mm
- Widespread and common
in the Arctic and beyond
- Often hunted
- Pelagic feeder
$$ Existing research programs are already in place
on murre colonies, making it relatively easy to
add a collection for plastic pollution to the
workplan. Minimal costs would need to be added
to implement plastic pollution monitoring to
cover the costs of collections and processing the
birds for plastic pollution specifically.
Gull/skua boluses
- Useful to monitor around
point sources of litter and
MP
- All gull species
regurgitate boluses so
can be implemented
across several species
$ Gull boluses can be easily collected from around
specific areas where there is interest in
monitoring point sources of litter and MP. Litter
in pellets collected in the breeding season reflects
litter uptake during the breeding season if old
boluses are removed.
Nest incorporation of plastic
pollution by Black-legged
Kittiwakes
- Limited data available
for the Arctic to date
- Would contribute to
dataset that extends to
seas adjacent to the
Arctic
$ Existing research programs are already in place
on kittiwake colonies, making it relatively easy to
add an observation protocol for plastic pollution
in nests to the workplan. Minimal costs would
need to be added to implement plastic pollution
monitoring, but the protocols would need to be
developed and implemented. Monitoring of
kittiwake nests could be used around urban areas
where there is interest in assessing point sources
of pollution.
Common Eider stomachs for
all litter over 300 µm
- Useful monitor in
benthic coastal regions
- Low plastic ingestion to
date, but important
subsistence species
$$ Existing research programs are already in place
on eider colonies, making it relatively easy to add
a collection for plastic pollution to the workplan.
Minimal costs would need to be added to
implement plastic pollution monitoring to cover
the costs of collections and processing the birds
for plastic pollution specifically.

AMAP Litter and Microplastics Monitoring Guidelines
163
Figure 3.4 Distribution of reported plastic ingestion by seabirds in the Arctic between 1980-2019.
Each point represents a sampling location. Overlapping points (i.e., locations sampled more than
once) were offset to show all sampling events. Data source: Baak et al.,2020a.
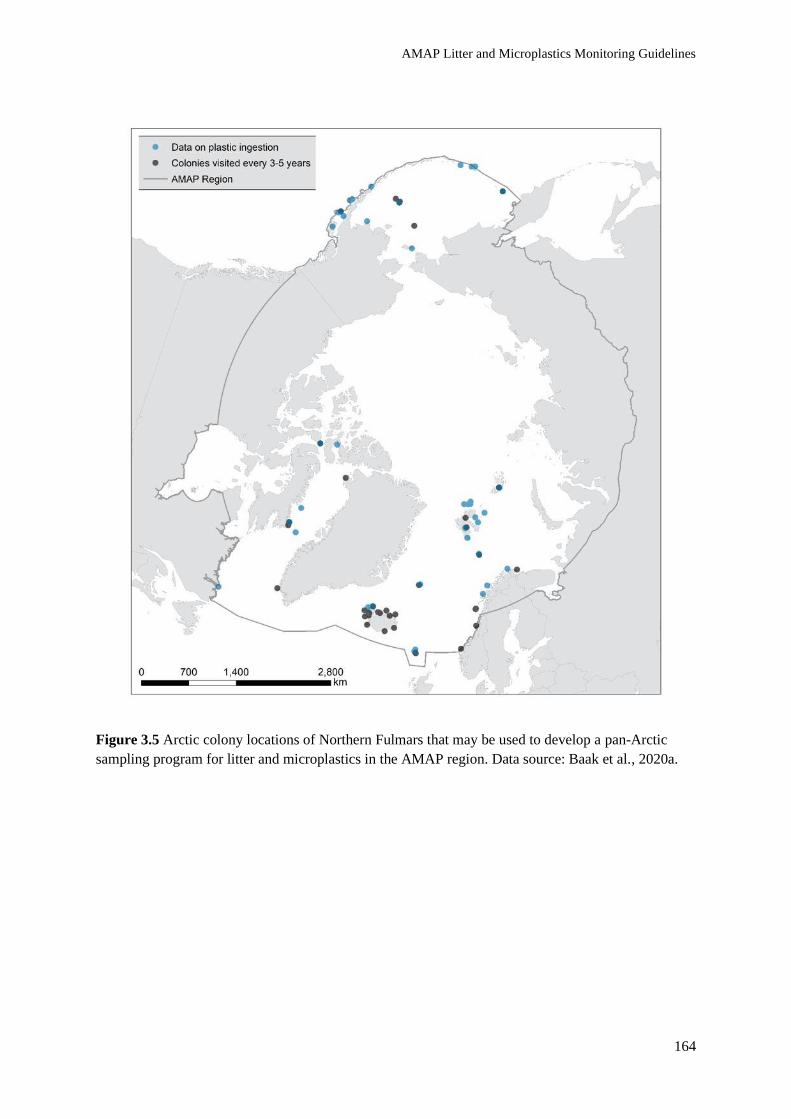
AMAP Litter and Microplastics Monitoring Guidelines
164
Figure 3.5 Arctic colony locations of Northern Fulmars that may be used to develop a pan-Arctic
sampling program for litter and microplastics in the AMAP region. Data source: Baak et al., 2020a.

AMAP Litter and Microplastics Monitoring Guidelines
165
Figure 3.6. Arctic colony locations of Thick-billed Murres that may be used to develop a pan-Arctic
sampling program for litter and microplastics in the AMAP region. Data source: Baak et al., 2020a.
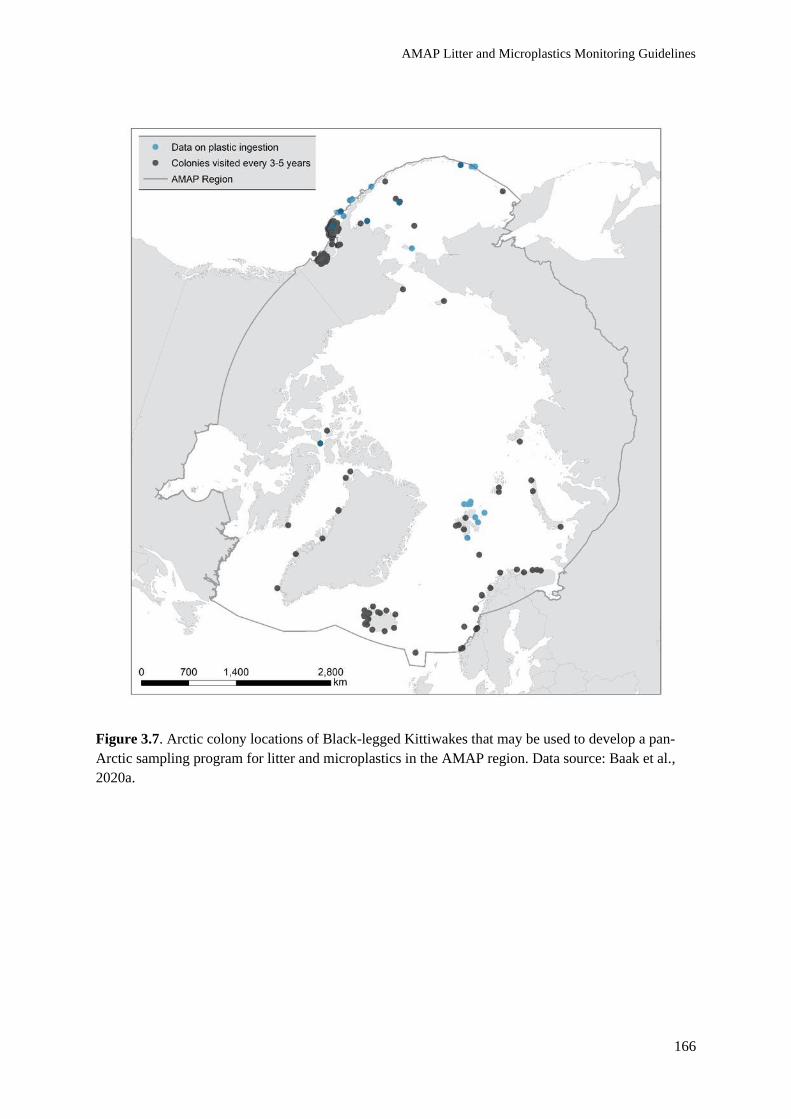
AMAP Litter and Microplastics Monitoring Guidelines
166
Figure 3.7. Arctic colony locations of Black-legged Kittiwakes that may be used to develop a pan-
Arctic sampling program for litter and microplastics in the AMAP region. Data source: Baak et al.,
2020a.

AMAP Litter and Microplastics Monitoring Guidelines
167
References
Amélineau, F., D. Bonnet, O. Heitz, V. Montreux, A.M.A. Harding, N. Karnovsky, W. Walkusz, J.
Fort and D. Grémillet, 2016. Microplastic pollution in the Greenland Sea: background levels and
selective contamination of planktivorous diving seabirds. Environmental Pollution, 219:1131-1139.
https://doi.org/10.1016/j.envpol.2016.09.017
Avery-Gomm, S., J.F. Provencher, K.H. Morgan and D.F. Bertram, 2013. Plastic ingestion in marine-
associated bird species from the eastern North Pacific. Marine Pollution Bulletin, 72:257-259.
https://doi.org/10.1016/j.marpolbul.2013.04.021
Baak, J.E., J. Linnebjerg, T. Barry, M.V. Gavrilo, M.L. Mallory, C. Price and J.F. Provencher, 2020a.
Plastic ingestion by seabirds in the circumpolar Arctic: a review. Environmental Reviews, 28:506-
516. https://doi.org/10.1139/er-2020-0029
Baak, J.E., J.F. Provencher and M.L. Mallory, 2020b. Plastic ingestion by four seabird species in the
Canadian Arctic: comparisons across species and time. Marine Pollution Bulletin, 158: 111386.
https://doi.org/10.1016/j.marpolbul.2020.111386
Barrett, R.T., J.U. Skaare, G. Norheim, W. Vader and A. Frøslie, 1985. Persistent organochlorines and
mercury in eggs of Norwegian seabirds 1983. Environmental Pollution Series A, Ecological and
Biological, 39:79=93. https://doi.org/10.1016/0143-1471(85)90064-9
Battisti, C., E. Staffieri, G. Poeta, A. Sorace, L. Luiselli and G. Amori, 2019. Interactions between
anthropogenic litter and birds: a global review with a ‘black-list’ of species. Marine Pollution
Bulletin, 138:93-114. https://doi.org/10.1016/j.marpolbul.2018.11.017
Bond, A.L., W.A. Montevecchi, N. Guse, P.M. Regular, S. Garthe and J.-F. Rail, 2012. Prevalence
and composition of fishing gear debris in the nests of Northern Gannets (Morus bassanus) are related
to fishing effort. Marine Pollution Bulletin, 64:907-911.
https://doi.org/10.1016/j.marpolbul.2012.03.011
Bond, A.L., J.F. Provencher, R.D. Elliot, P.C. Ryan, S. Rowe, I.L. Jones, G.J. Robertson and S.I.
Wilhelm, 2013. Ingestion of plastic marine debris by Common and Thick-billed Murres in the
northwestern Atlantic from 1985 to 2012. Marine Pollution Bulletin, 77:192-195.
https://doi.org/10.1016/j.marpolbul.2013.10.005
Brandão, M.L., K.M. Braga and J.L. Luque, 2011. Marine debris ingestion by Magellanic Penguins,
Spheniscus magellanicus (Aves: Sphenisciformes), from the Brazilian coastal zone. Marine Pollution
Bulletin, 62:2246-2249. https://doi.org/10.1016/j.marpolbul.2011.07.016
Braune, B.M., A.J. Gaston, K.A. Hobson, H.G. Gilchrist and M.L. Mallory, 2014. Changes in food
web structure alter trends of mercury uptake at two seabird colonies in the Canadian Arctic.
Environmental Science and Technology, 48:13246-13252. https://doi.org/10.1021/es5036249
Braune, B.M., M.L. Mallory and H.G. Gilchrist, 2006. Elevated mercury levels in a declining
population of Ivory Gulls in the Canadian Arctic. Marine Pollution Bulletin, 52:978-982.
https://doi.org/10.1016/j.marpolbul.2006.04.013
AMAP Litter and Microplastics Monitoring Guidelines
168
Connors, P.G. and K.G. Smith, 1982. Oceanic plastic particle pollution: suspected effect on fat
deposition in Red Phalaropes. Marine Pollution Bulletin, 13:18-20. https://doi.org/10.1016/0025-
326x(82)90490-8
Dickerman, R.W. and R.G. Goelet, 1987. Northern Gannet starvation after swallowing Styrofoam.
Marine Pollution Bulletin 18:293. https://doi.org/10.1016/0025-326x(87)90508-x
Dietz, R., R.J. Letcher, J.-P. Desforges, I. Eulaers, C. Sonne, S. Wilson, E. Andersen-Ranberg, N.
Basu, B.D. Barst, J.O. Bustnes, J. Bytingsvik, T.M. Ciesielski, P.E. Drevnick, G.W. Gabrielsen, A.
Haarr, K. Hylland, B.M. Jenssen, M. Levin, M.A. McKinney, R.D. Nørregaard, K.E. Pedersen, J.F.
Provencher, B. Styrishave, S. Tartu, J. Aars, J.T. Ackerman, A. Rosing-Asvid, R. Barrett, A. Bignert,
E.W. Born, M. Branigan, B. Braune, C.E. Bryan, M. Dam, C.A. Eagles-Smith, M. Evans, T.J. Evans,
A.T. Fisk, M. Gamberg, K. Gustavson, C.A. Hartman, B. Helander, M.P. Herzog, P.F. Hoekstra, M.
Houde, K. Hoydal, A.K. Jackson, J. Kucklick, E. Lie, L. Loseto, M.L. Mallory, C. Miljeteig, A.
Mosbech, D.C.G. Muir, S.T. Nielsen, E. Peacock, S. Pedro, S.H. Peterson, A. Polder, F.F. Rigét, P.
Roach, H. Saunes, M.-H.S. Sinding, J.U. Skaare, J. Søndergaard, G. Stenson, G. Stern, G.Treu, S.S.
Schuur and G. Víkingsson, 2019. Current state of knowledge on biological effects from contaminants
on Arctic wildlife and fish. Science of the total Environment, 696:133792.
https://doi.org/10.1016/j.scitotenv.2019.133792
Fife, D.T., G.J. Robertson, D. Shutler, B.M. Braune and M.L. Mallory, 2015. Trace elements and
ingested plastic debris in wintering Dovekies (Alle alle). Marine Pollution Bulletin, 91:368-371.
https://doi.org/10.1016/j.marpolbul.2014.11.029
Gaston, A.J., M.L. Mallory and H.G. Gilchrist, 2012b. Populations and trends of Canadian Arctic
seabirds. Polar Biology, 35:1221-1232. https://doi.org/10.1007/s00300-012-1168-5
Gaston, A.J., P.A. Smith and J.F. Provencher, 2012a. Discontinuous change in ice cover in Hudson
Bay in the 1990s and some consequences for marine birds and their prey. ICES Journal of Marine
Science, 69:1218-1225. https://doi.org/10.1093/icesjms/fss040
Gjertz, I., F. Mehlum and G.W. Gabrielsen, 1985. Food Sample Analysis of Seabirds Collected
During the ‘Lance’ - Cruise in Ice-filled Waters in Eastern Svalbard 1984. Report No. 23. Norsk
Polarinstitutt, Tromsø, Norway. [online] URL: https://brage.npolar.no/npolar-
xmlui/bitstream/handle/11250/173421/Rapport023.pdf?sequence=1&isAllowed=y
Hammer, S., R.G. Nager, P.C.D. Johnson, R.W. Furness and J.F. Provencher, 2016. Plastic debris in
Great Skua (Stercorarius skua) pellets corresponds to seabird prey species. Marine Pollution Bulletin,
103:206-210. https://doi.org/10.1016/j.marpolbul.2015.12.018
Hartwig, E., T. Clemens and M. Heckroth, 2007. Plastic debris as nesting material in a Kittiwake-
(Rissa tridactyla)-colony at the Jammerbugt, Northwest Denmark. Marine Pollution Bulletin, 54:595-
597. https://doi.org/10.1016/j.marpolbul.2007.01.027
Irons, D., T. Petersen, T. Anker-Nilssen, Y. Artukhin, R. Barrett, D. Boertmann, M.V. Gavrilo, H.G.
Gilchrist, E.S. Hansen, M. Hario, K. Kuletz, M.L. Mallory, F. Merkel, A. Mosbech, A.L. Labansen,
B. Olsen, J. Reid, G.J. Robertson, M. Rönkä and H. Strøm, 2015. Circumpolar Seabird Monitoring
Plan. CAFF Monitoring Report, No. 17. CAFF International Secretariat, Akureyri, Iceland. [online]
URL: https://oaarchive.arctic-council.org/handle/11374/1319
AMAP Litter and Microplastics Monitoring Guidelines
169
Jagiello, Z., Ł. Dylewski, M. Tobolka and J.I. Aguirre, 2019. Life in a polluted world: A global
review of anthropogenic materials in bird nests. Environmental Pollution, 251:717-722.
https://doi.org/10.1016/j.envpol.2019.05.028
Kühn, S., E.L. Bravo Rebolledo and J.A. van Franeker, 2015. Deleterious effects of litter on marine
life. In: Bergmann, M., L. Gutow and M. Klages (Eds.). Marine Anthropogenic Litter, pp. 75–116.
Springer International, Berlin, Germany. https://doi.org/10.1007/978-3-319-16510-3_4
Kühn, S. and J.A. van Franeker, 2012. Plastic ingestion by the Northern Fulmar (Fulmarus glacialis)
in Iceland. Marine Pollution Bulletin, 64:1252-1254. https://doi.org/10.1016/j.marpolbul.2012.02.027
Lavers, J.L. and A.L. Bond, 2016. Ingested plastic as a route for trace metals in Laysan Albatross
(Phoebastria immutabilis) and Bonin Petrel (Pterodroma hypoleuca) from Midway Atoll. Marine
Pollution Bulletin, 110:493-500. https://doi.org/10.1016/j.marpolbul.2016.06.001
Letcher, R.J., J.O. Bustnes, R. Dietz, B.M. Jenssen, E.H. Jørgensen, C. Sonne, J. Verreault, M.M.
Vijayan and G.W. Gabrielsen, 2010. Exposure and effects assessment of persistent organohalogen
contaminants in Arctic wildlife and fish. Science of the Total Environment, 408:2995-3043.
https://doi.org/10.1016/j.scitotenv.2009.10.038
Lively, J.A. and T.P. Good, 2019. Chapter 10 - Ghost fishing. In: Sheppard, C. (Ed.). World Seas: An
Environmental Evaluation, pp. 183-196. Second Edition. Academic Press, Cambridge, Massachusetts,
USA. https://doi.org/10.1016/b978-0-12-805052-1.00010-3
Lydersen, C., I. Gjertz and J.M. Weslawski, 1989. Stomach contents of autumn-feeding marine
vertebrates from Hornsund, Svalbard. Polar Record, 25:107-114.
https://doi.org/10.1017/S0032247400010408
Mallory, M.L. and B.M. Braune, 2012. Tracking contaminants in seabirds of Arctic Canada: temporal
and spatial insights. Marine Pollution Bulletin, 64:1475-1484.
https://doi.org/10.1016/j.marpolbul.2012.05.012
Mehlum, F. and I. Giertz, 1984. Feeding Ecology of Seabirds in the Svalbard Area - A Preliminary
Report. Report No. 16. Norsk Polarinstitutt, Tromsø, Norway. [online] URL:
https://brage.npolar.no/npolar-
xmlui/bitstream/handle/11250/173432/Rapport016_2.pdf?sequence=1&isAllowed=y
O’Hanlon, N.J., N.A. James, E.A. Masden and A.L. Bond, 2017. Seabirds and marine plastic debris in
the northeastern Atlantic: a synthesis and recommendations for monitoring and research.
Environmental Pollution, 231:1291-1301. https://doi.org/10.1016/j.envpol.2017.08.101
OSPAR, 2017. Plastic Particles in Fulmar Stomachs in the North Sea (OSPAR Intermediate
Assessment 2017). OSPAR, London, UK. [online] https://oap.ospar.org/en/ospar-
assessments/committee-assessments/eiha-thematic-assessments/marine-litter/plastic-particles-in-
fulmar-stomachs-north-sea/
Petersen, A., D.B. Irons, H.G. Gilchrist, G.J. Robertson, D. Boertmann, H. Strøm, M. Gavrilo, Y.
Artukhin, D.S. Clausen, K.J. Kuletz and M.L. Mallory, 2015. The status of Glaucous Gulls Larus
hyperboreus in the circumpolar Arctic. Arctic, 68:107-120. https://doi.org/10.14430/arctic4462

AMAP Litter and Microplastics Monitoring Guidelines
170
Piatt, J.F. W.J. Sydeman and F. Wiese, 2007. A modern role for seabirds as indicators. Marine
Ecology Progress Series, 352:199-204. https://doi.org/10.3354/meps07070
Poon, F.E., J.F. Provencher, M.L. Mallory, B.M. Braune and P.A. Smith, 2017. Levels of ingested
debris vary across species in Canadian Arctic seabirds. Marine Pollution Bulletin, 116:517–520.
https://doi.org/10.1016/j.marpolbul.2016.11.051
Provencher, J.F., 2014. How Arctic marine birds help researchers study a changing north. Arctic,
67:433-580. https://doi.org/10.14430/arctic4439
Provencher, J.F., A.L. Bond, S. Avery-Gomm, S.B. Borrelle, E.L. Bravo Rebolledo, S. Hammer, S.
Kühn, J.L. Lavers, M.L. Mallory, A. Trevail and J.A. van Franeker, 2017. Quantifying ingested debris
in marine megafauna: a review and recommendations for standardization. Analytical Methods,
9:1454-1469. https://doi.org/10.1039/c6ay02419j
Provencher, J.F., A.L. Bond, A. Hedd, W.A. Montevecchi, S.B. Muzaffar, S.J. Courchesne, H.G.
Gilchrist, S.E. Jamieson, F.R. Merkel, K. Falk, J. Durinck and M.L. Mallory, 2014. Prevalence of
marine debris in marine birds from the North Atlantic. Marine Pollution Bulletin, 84:411-417.
https://doi.org/10.1016/j.marpolbul.2014.04.044
Provencher, J.F., A.L. Bond and M.L. Mallory, 2015. Marine birds and plastic debris in Canada: a
national synthesis and a way forward. Environmental Reviews, 23:1-13. https://doi.org/10.1139/er-
2014-0039
Provencher, J.F., S.B. Borrelle, A.L. Bond, J.L. Lavers, J.A. van Franeker, S. Kühn, S. Hammer, S.
Avery-Gomm and M.L. Mallory, 2019. Recommended best practices for plastic and litter ingestion
studies in marine birds: collection, processing, and reporting. FACETS, 4:111-130.
https://doi.org/10.1139/facets-2018-0043
Provencher, J.F., A.J. Gaston and M.L. Mallory, 2009. Evidence for increased ingestion of plastics by
Northern Fulmars (Fulmarus glacialis) in the Canadian Arctic. Marine Pollution Bulletin, 58:1092-
1095. https://doi.org/10.1016/j.marpolbul.2009.04.002
Provencher, J.F., A.J. Gaston, M.L. Mallory, P.D. O’hara and H.G. Gilchrist, 2010. Ingested plastic in
a diving seabird, the Thick-billed Murre (Uria lomvia), in the eastern Canadian Arctic. Marine
Pollution Bulletin, 60:1406-1411. https://doi.org/10.1016/j.marpolbul.2010.05.017
Provencher, J.F., J.C. Vermaire, S. Avery-Gomm, B.M. Braune and M.L. Mallory, 2018. Garbage in
guano? Microplastic debris found in faecal precursors of seabirds known to ingest plastics. Science of
the Total Environment, 644:1477-1484. https://doi.org/10.1016/j.scitotenv.2018.07.101
Reynolds, C. and P.G. Ryan, 2018. Micro-plastic ingestion by waterbirds from contaminated wetlands
in South Africa. Marine Pollution Bulletin, 126:330-333.
https://doi.org/10.1016/j.marpolbul.2017.11.021
Rigét, F., A. Bignert, B. Braune, M. Dam, R. Dietz, M. Evans, N. Green, H. Gunnlaugsdóttir, K.S.
Hoydal, J. Kucklick, R. Letcher, D. Muir, S. Schuur, C. Sonne, G. Stern, G. Tomy, K. Vorkamp and
S. Wilson, 2019. Temporal trends of persistent organic pollutants in Arctic marine and freshwater
biota. Science of the Total Environment, 649:99-110. https://doi.org/10.1016/j.scitotenv.2018.08.268

AMAP Litter and Microplastics Monitoring Guidelines
171
Rigét, F., K. Vorkamp, R. Bossi, C. Sonne, R.L. Letcher and R. Dietz, 2016. Twenty years of
monitoring of persistent organic pollutants in Greenland biota. A review. Environmental Pollution,
217:114-123. https://doi.org/10.1016/j.envpol.2015.11.006
Ryan, P.G., 1987. The effects of ingested plastic on seabirds: correlations between plastic load and
body condition. Environmental Pollution, 46:119-125. https://doi.org/10.1016/0269-7491(87)90197-7
Ryan, P.G., 2008. Seabirds indicate changes in the composition of plastic litter in the Atlantic and
south-western Indian Oceans. Marine Pollution Bulletin, 56:1406-1409.
https://doi.org/10.1016/j.marpolbul.2008.05.004
Ryan, P.G., 2015. How quickly do albatrosses and petrels digest plastic particles? Environmental
Pollution, 207:438-440. https://doi.org/10.1016/j.envpol.2015.08.005
Seif, S., J.F. Provencher, S. Avery-Gomm, P.-Y. Daoust, M.L. Mallory and P.A. Smith, 2018. Plastic
and non-plastic debris ingestion in three gull species feeding in an urban landfill environment.
Archives of Environmental Contamination and Toxicology, 74(3):349-360.
https://doi.org/10.1007/s00244-017-0492-8
Sievert, P.R. and L. Sileo, 1993. The effects of ingested plastic on growth and survival of albatross
chicks. In: Vermeer, K., K.T. Briggs, K.H. Morgan, and D. Siegel-Causey (Eds.). The Status,
Ecology, and Conservation of Marine Birds of the North Pacific, pp. 212-217. Canadian Wildlife
Services Publications, Ottawa, Canada.
Snæþórsson, A., 2018. Plast í meltingarvegi fýla við Ísland árið 2018. NNA-1808. Náttúrustofa
Norðausturlands, Husavik, Iceland. [online] URL: https://ust.is/library/Skrar/Atvinnulif/Haf-og-
vatn/Plast í meltingarvegi fýla við Ísland árið 2018.pdf
Snæþórsson, A., 2019. Plast í meltingarvegi fýla við Ísland árið 2019. NNA-1904. Náttúrustofa
Norðausturlands, Husavik, Iceland. [online] URL: https://www.ust.is/library/Skrar/Atvinnulif/Haf-og-
vatn/Plast%20%C3%AD%20meltingarvegi%20f%C3%BDla%20vi%C3%B0%20%C3%8Dsland%20
%C3%A1ri%C3%B0%202019.pdf
Talsness, C.E., A.J.M. Andrade, S.N. Kuriyama, J.A. Taylor and F.S. vom Saal, 2009. Components of
plastic: experimental studies in animals and relevance for human health. Philosophical Transactions of
the Royal Society B, 364:2079-2096. https://doi.org/10.1098/rstb.2008.0281
Teuten, E.L., J.M. Saquing, D.R.U. Knappe, M.A. Barlaz, S. Jonsson, A. Björn, S.J. Rowland, R.C.
Thompson, T.S. Galloway, R. Yamashita, D. Ochi, Y. Watanuki, C. Moore, P.H. Viet, T.S. Tana, M.
Prudente, R. Boonyatumanond, M.P. Zakaria, K. Akkhavong, Y. Ogata, H. Hirai, S. Iwasa, K.
Mizukawa, Y. Hagino, A. Imamura, M. Saha and H. Takada, 2009. Transport and release of
chemicals from plastics to the environment and to wildlife. Philosophical Transactions of the Royal
Society B, 364:2027-2045. https://doi.org/10.1098/rstb.2008.0284
Trevail, A.M., G.W. Gabrielsen, S. Kühn and J.A. van Franeker, 2015. Elevated levels of ingested
plastic in a high Arctic seabird, the Northern Fulmar (Fulmarus glacialis). Polar Biology, 38:975-981.
https://doi.org/10.1007/s00300-015-1657-4

AMAP Litter and Microplastics Monitoring Guidelines
172
van Franeker, J.A., C. Blaize, J. Danielsen, K. Fairclough, J. Gollan, N. Guse, P.-L. Hansen, M.
Heubeck, J.-K. Jensen, G. Le Guillou, B. Olsen, K.-O. Olsen, J. Pedersen, E.W.M. Stienen and D.M.
Turner, 2011. Monitoring plastic ingestion by the Northern Fulmar Fulmarus glacialis in the North
Sea. Environmental Pollution, 159:2609-2615. https://doi.org/10.1016/j.envpol.2011.06.008
van Franeker, J.A. and S. Kühn, 2020. Fulmar Litter EcoQO Monitoring in the Netherlands - update
2019. Wageningen Marine Research Report C074/20 & RWS Centrale Informatievoorziening BM
20.16. Wageningen Marine Research, Den Helder, The Netherlands. https://doi.org/10.18174/529399
van Franeker, J.A. and K.L. Law, 2015. Seabirds, gyres and global trends in plastic pollution.
Environmental Pollution, 203:89-96. https://doi.org/10.1016/j.envpol.2015.02.034
Votier, S.C., K. Archibald, G. Morgan and L. Morgan, 2011. The use of plastic debris as nesting
material by a colonial seabird and associated entanglement mortality. Marine Pollution Bulletin,
62:168-172. https://doi.org/10.1016/j.marpolbul.2010.11.009
Weslawski, J.M., L. Stempniewicz and K. Galaktionov, 1994. Summer diet of seabirds from the Frans
Josef Land archipelago, Russian Arctic. Polar Research, 13:173-181.
Plastics ingested by Northern Fulmars in Canada (above) and Greenland (below).
Photo: Jakob Strand
Photo: Julia Baak

AMAP Litter and Microplastics Monitoring Guidelines
173
3.4 Mammals
AUTHORS: AMY L. LUSHER, MAX LIBOIRON, MADELAINE P. T. BOURDAGES, DIANE ORIHEL, AND JENNIFER
PROVENCHER
3.4.1 Introduction
Mammals are vulnerable to plastic pollution and other marine litter in two primary ways. First,
mammals can become entangled in large items of debris on land and in aquatic environments.
Entanglement in fishing gear is by far the most reported interaction for aquatic mammals, with
consequences ranging from lesions to death by drowning because mammals are unable to surface to
breathe (NOAA, 2014; Panti et al., 2019). Land mammals have also been observed entangled in fishing
gear assumed to have beached in areas where mammals feed (Bergmann et al., 2017). Second,
mammals can be affected by marine litter via ingestion. Ingestion of plastic and other litter items can
have a range of consequences on mammals including blockage or damage to the digestive tract, which
can lead to malnutrition and ultimately death (e.g., de Stephanis et al., 2013). Further, high levels of
plastic ingestion have been posited to lead to the transfer of contaminants (including plastic additives)
associated with ingested litter (e.g., Fossi et al. 2012). The impact of plastics on Arctic biota requires
further investigation to provide information that can be used for environmental risk assessment and to
address harm.
Most studies to date have focused on assessing the effects of litter and microplastics (MP) on mammals.
To the best of our knowledge, there are no existing monitoring programs that use mammals for either
trend monitoring or effect monitoring. Studies examining litter, MP, and mammals must first be
considered to establish environmental levels in mammals before efforts are taken further. Many
mammals play a significant role in Arctic communities as a food source. They are also apex organisms
on land and in the sea, thus they may be a relevant matrix for monitoring. These guidelines address both
marine and terrestrial mammals.
3.4.2 State of the global science
The International Whaling Commission (IWC) discussed marine litter during three workshops in 2013,
2014, and 2019 (IWC, 2020). Understanding the effects of marine litter on cetaceans globally, and how
to work with international partners to ensure collaborative efforts was the focus of these workshops.
Mammals are not commonly used for monitoring the presence of plastic in the environment, however
some species are monitored annually by the Northern Contaminants Program in northern Canada for
chemical contaminants and will be included in Descriptor 10 of the Marine Strategy Framework
Directive in Europe. Research to date has mostly focused on the consequences of mammal interactions
with plastics, i.e., entanglement and ingestion.
Evidence of marine litter impacts on mammals is available from a variety of published and unpublished
sources. Many studies date back to the early 1960s with plastic items and other macrolitter reported as
entanglement and ingestion hazards for marine mammals, including baleen whales, beaked whales,
dolphins, porpoise, and seals (Caldwell and Golley, 1965; Hofmeyr and Bester, 2002; Lusher et al.,
2018; Panti et al., 2019; etc.). As of 2018, 11 out of the 14 families of cetaceans (86 species) were
reported to be impacted by marine litter (e.g., Fossi et al., 2018; Kuhn and van Franeker, 2020). Of
marine mammal species, 39.8% have at least one documented occurrence of entanglement, and 56.1%
have a least one documented occurrence of ingestion (Baulch and Perry, 2014; Kühn et al., 2015; Kühn
and van Franeker, 2020). This includes species with different feeding techniques (Panti et al., 2019).
AMAP Litter and Microplastics Monitoring Guidelines
174
Plastics are reported in digestive tracts of marine mammals, and in some cases, have been attributed to
an individual's cause of death (reviewed in Kühn and van Franeker, 2020). There are high geographic,
intra- and inter-specific variations in ingestion rates (Baulch and Perry, 2014). Globally, there have
been several studies examining ingested marine litter in seals (McMahon et al., 1999; Bravo Rebolledo
et al., 2013; Denuncio et al., 2017; Unger et al., 2017; Nelms et al., 2019; Donohue et al., 2019).
Importantly, none of these studies were the results of monitoring activities, rather they were research
projects or reports produced by strandings’ networks.
The absence of macrolitter in some studies does not imply the absence of microlitter (Lusher et al.,
2018), although few studies have directly identified MP in the digestive tracts of stranded individuals.
Current investigations of MP in marine mammals include seven odontocetes species: Mesoplodon
mirus, Ziphius cavirostris, Delphinus delphis, Stenella coeruleaolba, Phocoena phocoena, Orcinus
orca, and Tursiops truncatus (Lusher et al., 2015, 2018; van Franeker et al., 2018). Only one study on
mysticetes, a stranded humpback whale (Megaptera novaeangliae), has recorded MP in the intestines,
including fragments and threads (Besseling et al., 2015). The study of MP ingestion by marine
mammals is a challenging task. It is difficult to obtain viable samples from large cetaceans during
necropsies due to large gut content volumes. Obtaining large enough sample sizes can also be a
challenge in areas where no harvest takes place. Alternative methods include the collection of scat from
pinnipeds; however, it may be difficult to discern plastic ingested by the seal versus atmospheric
deposition of MP, especially fibers, on the scat (Dris et al., 2016). Again, none of the investigations on
MP has been carried out with a view to monitoring or using mammals as indicators for MP pollution.
Terrestrial mammals are likely to be affected by litter and MP. Globally there are a few reports of
plastic ingestion in terrestrial mammals including Arctic foxes (Vulpes lagopus; Garrot et al., 1983;
Gabrielson, personal communication), reindeer (Rangifer tarandus), and polar bears (Ursus maritimus),
which we cover in more detail in the next section.
3.4.3 Information from the Arctic, and trends to date
An assessment of globally available data on cetaceans found an increase in the number of cases being
reported over the last five decades (Baulch and Perry, 2014). Although, because none of these studies
were carried out for the purpose of monitoring, we cannot discern trends.
Entanglement
Entanglement has been observed for several seal species, such as harbor seals (Phoca vitulina), bearded
seals (Erignathus barbatus), polar bears, and reindeer from Svalbard (reviewed in Øritsland, 1986;
Bergmann et al., 2017; Nashoug, 2017; Hallanger and Gabrielsen, 2018). It has been reported that
Svalbard reindeer die due to entanglement in derelict fishing gear and other marine litter on the beaches
of Svalbard, Norway (Øritsland, 1986; Nashoug, 2017). There is limited information for other Arctic
regions. No information is currently available on spatial or temporal trends of entanglement in Arctic
mammals.
Ingestion
Of the few reports examining ingested plastic marine litter in mammals in the Arctic, one study has
examined plastic ingestion in seals in the Canadian Arctic (Bourdages et al., 2020). The authors
examined 142 seal stomachs from the Hudson Bay and Hudson Strait region for ingested plastics above
425 µm. Stomachs of ringed seals (Phoca hispida; n = 135), bearded seals (Erignathus barbatus; n =

AMAP Litter and Microplastics Monitoring Guidelines
175
6), and one harbour seal (Phoca vitualina) were collected by Inuit harvesters between 2007 and 2019 in
collaboration with research programs focused on seal diet and health. The method used for plastic
detection was similar to those applied in seabird studies and focused on pieces of plastics > 1 mm
(Bourdages et al., 2020).
A different method was used when investigating the stomachs of beluga whales. Stomachs of beluga
whales from the Inuvialuit Settlement Region in Arctic Canada were collected by Inuvialuit harvesters
(Moore et al., 2020). On average, each whale had approximately 97 pieces of MP (20 µm-425 µm) in
their gastrointestinal tract (Moore et al., 2020).
Ingestion of litter and plastics has also been observed in polar bears (Provencher, unpublished data, and
https://www.hakaimagazine.com/news/polar-bears-plastic-diets-a-growing-problem). A newly
published review of polar bear ecotoxicology emphasizes how little knowledge exists on this subject
(Routti et al., 2019) and suggests that polar bears are unlikely to ingest considerable amounts of plastics
through their prey because they mainly feed on seal blubber. However, as the climate warms, the polar
bear diet may be changing, exposing them to more plastics through their diet. Polar bears primarily hunt
ringed seals and other marine mammals while on sea ice, but as sea ice begins to melt earlier in the
spring season, some polar bears have been recorded moving onshore and opportunistically feeding on a
variety of terrestrial prey, such as Snow Geese, Common Eider, and caribou (e.g., Iverson et al., 2014).
Indigenous harvesters in Nunavut and the Northwest Territories, Canada have reported that polar bears
are frequently observed feeding from landfills and near urban sites. Hunters in Nunavut also report
plastics and other debris items in polar bear stomachs and scat (J. Provencher, personal
communication). This includes towels found in a bear that was dissected by a hunter, and visible
plastics in polar bear scat found around community landfills. One-quarter of polar bear stomachs (n =
51) examined in a project conducted in Alaska contained plastics (Stimmelmayr et al., unpublished
data).
To date, scat collection from mammals has not been widely used in the Arctic to assess MP, although
currently a pilot program examining the scat of polar bears for MP is underway in northern Canada (J.
Provencher, personal communication).
Benefits
Marine mammals typically occupy the top of the food chain and thus are often used as indicators of
ecosystem health (Fossi and Panti, 2018; Routti et al., 2019). There are a number of advantages to
sampling Arctic mammals to study plastic pollution. First, mammals are food for human consumption,
including those captured from the wild. Thus, mammals can provide information on contaminant levels
that are likely to be consumed by humans, who also occupy a position at the top of the food chain.
Second, when mammals are harvested or found wrecked, digestive tracts and tissue samples can be
obtained from targeted individuals. This allows samples to be taken along with other metrics to assess
the health of the individual and thus address questions about the impacts. Lastly, mammals are
regularly harvested throughout the Arctic, and therefore samples from marine mammals can be
obtained cooperatively with communities and harvesters.
Although not all terrestrial mammals in the Arctic are top predators (i.e., caribou and reindeer), they are
an important food source for many communities. Therefore, monitoring terrestrial mammals can be
done in collaboration with communities and can inform human health assessments interested in the
effects of plastic pollution in biota. This is especially true for mammal entanglement in large litter in
both inland and coastal regions.

AMAP Litter and Microplastics Monitoring Guidelines
176
Limitations
Unfortunately, there are many limitations to using mammals for monitoring plastic pollution. One of
the biggest challenges is the sheer size of some of the individuals and thus the size of the organs to be
examined for litter and MP. These samples can be very difficult to obtain, manage, and work with, and
thus examining these samples thoroughly can be challenging. This is of particular concern if
microfibers are of interest because minimizing sample contamination is difficult with large samples.
Generally, the sample sizes are small in numbers, especially for whales because only a limited number
of individuals are stranded or harvested at a time. These small sample sizes are not particularly
conducive to rigorous monitoring programs that aim to track trends over time and space. Further,
stranded animals are not normally reliable for monitoring plastics because much of the time their
stranding is not related to plastic interaction.
Importantly, although there are regions where large number of mammals could be sampled for plastic
pollution through local harvests, there are large geographic gaps in which different species are
harvested. For example, in Greenland, Canada, and Alaska limited numbers of polar bears are regularly
harvested or sampled for contaminants (Figure 3.8), but in other Arctic regions, polar bear samples
would be extremely restricted. Similarly, in the Faroe Islands, the pilot whale harvest could be used to
access samples to study plastic ingestion, but these would not contribute to a pan-Arctic monitoring
plan because this species is not harvested in large numbers in other regions. Lastly, some marine and
terrestrial mammals also migrate annually over very long distances, and without a greater
understanding of the residence times of plastic pollution, examining long-distance traveling species
may not reflect plastic pollution levels in the Arctic.
3.4.6. Methods
Ingestion
Ingestion of plastics is generally reported as an aside of dietary investigations or during the reporting of
strandings. In recent years, a targeted approach to understanding the plastic problem has been initiated
by several research teams independently. Unfortunately, standardized approaches are not unanimously
accepted internationally.
Approaches to assess mammals for ingested macroplastics are few, but these include necropsies, scat
samples, and biopsies. Importantly, there may be sampling biases in these methods that are not well
understood (i.e., beached animals may contain higher levels of litter and MP than population levels).
Monitoring of MP requires different methods, and emerging research in the last few years has presented
parallel approaches to monitoring MP present in digestive tracts and scat. There are benefits and
limitations to each method, as discussed by Fossi et al., 2018, and a threefold approach will be
beneficial to build a holistic picture of plastic contamination.
• First, necropsies are used to understand the diet of mammals, and most methods can allow
researchers to target plastics > 2.5 cm. This is the most common approach for large stranded
or harvested cetaceans. This method aims to assess accumulated plastics within the
gastrointestinal tract. Using stranding networks can provide further information on marine
litter pollution and the exposure of these top predators to plastics. However, stranding
networks in the Arctic are limited by low human population density and often hard to access
coasts.

AMAP Litter and Microplastics Monitoring Guidelines
177
• Second, to achieve a more thorough understanding of the risk MP pose to marine mammals, a
simple and cost-effective, standardized protocol should be implemented to allow research
teams to collect and analyze samples for the presence of litter and MP in a comparable and
transparent way, with a particular focus on MP. Necropsies generally follow Kuiken and
García-Hartmann, 1991 and therefore could be recommended for MP. Currently, several
methods using similar approaches have emerged, such as the protocol presented in Lusher and
Hernandez-Milian, 2018 for scat and necropsies. Briefly, the location of marine debris can be
reported in three main compartments of the digestive tract to allow for ease of processing the
samples and to minimize cross-contaminants: oesophagus, stomach (including forestomach,
fundic stomach, pyloric chamber, and duodenal ampulla), and intestines. By dissecting each
stomach chamber individually and dividing the intestines into 20 equal sections, it is possible
to obtain comparative data between species and individuals (e.g., Lusher et al., 2018). Each
section is then analyzed separately and washed over metal sieves to separate plastic pieces
from the digestive material (Bourdages et al., 2020). Following digestion (either chemical or
enzymatic), the remaining solution can be rinsed and filtered under vacuum onto a filter paper
where it will be subsequently analyzed under a microscope. The number, size, color, and
morphology of all litter and plastics are then identified per individual using standard metrics
for all megafauna (Provencher et al., 2017). Where possible, a subsample of particles will
undergo further analysis to confirm polymer identity or plastic presence.
• Third, scat can be used to examine the excretion of plastic pollution by mammals and
quantify what litter and MP may be ingested and then pass through mammals. Scat samples
can be collected and then processed using digestive techniques aimed at examining MP (e.g.,
Lusher and Hernandez-Milian, 2018; Perez-Venegas et al., 2018).
Lastly, surveys integrating information from local hunters are useful for detecting litter in mammals.
Given that both terrestrial and marine mammals can be entangled in large pieces of litter, and that
ingested litter can be observed directly in the stomachs of some mammal species, local and Indigenous
knowledge can be used to track patterns. This can be done using standard interview and survey methods
with questions focused on what knowledge keepers have observed about litter in animals and on the
landscape. These methods have been employed in northern Canada in a study focusing on polar bear
health and have highlighted the types of litter bears are vulnerable to ingesting (J. Provencher, personal
communication).
Entanglement
Mammal entanglement in large items of plastic debris has been observed in the wild. Most instances of
entanglement are reported as observations and there is no standard method for observing and reporting
this information.
Monitoring the consequences of interaction would be more suitable than monitoring the presence and
frequency of macrolitter as a form of marine pollution. Further, it can be challenging, if not impossible
to differentiate between entanglement in active fishing gear or marine debris. Similarly, the number of
individuals observed entangled may only represent a small proportion. Many are likely to sink and thus
never wash ashore or float in areas where monitoring could be conducted. Monitoring of entanglement
will require a coordinated network. For example, communities could report observations of
entanglement through an app. Many of the existing community platforms could be considered for this.
Reporting could follow the OSPAR/NOAA categories.

AMAP Litter and Microplastics Monitoring Guidelines
178
3.4.7 Quality assurance/quality control (QA/QC) specific to the compartment/matrix
Most mammal studies do not consider plastics < 1 mm and are carried out in the field; therefore, the
QA/QC measures are minimal during field sampling. When MP are the target of investigations, a high
level of QA/QC must be implemented, and any opening/manipulation of samples should be carried out
in a clean or controlled laboratory (see Provencher et al., 2017 dissection techniques). Procedures
targeting plastics < 1 mm need laboratory blanks (and where possible field blanks) and should consider
data corrections. They should also consider the exclusion of fibers that may come from air
contamination (Lusher and Hernandez-Milian, 2018).
Box A: Recommended data collection for the determination of litter and microplastics in mammals.
Based on Lusher and Hernandez-Milian 2018 and Fossi et al., 2018.
Mandatory data for reporting plastic interaction with mammals
• Species
• Location, including latitude and longitude (of stranding or biopsy)
• Date, including day, month, and year (should also divide into date of stranding, date of sampling)
• Collection method (necropsy, scat, biopsy)
• Total sample size (i.e., n)
• Tissue sampled (i.e., gastrointestinal tract, stomach, blubber)
• Age (juvenile, adult)
• Sex
• Cause of mortality (with necropsy, and where possible)
• Mean, median, and range for counts and mass of all plastics reported in all sampled individuals by debris
category (i.e., foam, fragment, film, fibers, and other; Provencher et al., 2017)
• Size of plastics reported by size classes (Italics are categories from Fossi et al., 2018.)
o > 2.5 cm (Macro)
o 2.4 cm -1 mm (Meso)
o 1 mm - 300 µm (Micro)
o < 300 µm (Ultrafine)
• Polymer confirmation for at least a subset of particles < 1 mm.
Beneficial to have for all data:
• Individual data level
• Color reported in eight broad color groups
• Polymer type for all items
• Body condition
Only possible with large sample size
• Frequency of occurrence of ingested plastics
• Mean, median, and range of mass of ingested plastics/individual
3.4.8 Existing monitoring of mammals in the Arctic
There are a limited number of mammal monitoring programs in the Arctic. In Canada, caribou, polar
bear, ringed seals, and beluga are all monitored annually by the Northern Contaminants Program for
legacy chemical contaminants. Opportunistic co-sampling with these programs have resulted in two
recent studies examining plastic ingestion in seals (Bourdages et al., 2020) and beluga (Moore et al.,
2020) in northern Canada. The AMAP Core Programme in Greenland includes annual sampling of
polar bears and biannual sampling of ringed seals and reindeer (Rigét et al., 2016). Pilot whales are
sampled annually in the contaminant monitoring program of the Faroe Islands, which also included
sheep until 2017 (Andreasen et al., 2019). Polar bears and Arctic foxes are collected as part of the

AMAP Litter and Microplastics Monitoring Guidelines
179
legacy contaminant monitoring on Svalbard by the Norwegian Polar Institute, and work is underway to
assess plastic pollution ingestion in these species (I. G. Hallanger, personal communication).
3.4.9 Recommendations
Mammals are not recommended as a primary monitoring tool for the Arctic based on the current
limitations involved with mammal studies (Table 3.10). Given the current evidence, including the low
presence, if any, of plastics in digestive tracts, mammals are not a useful indicator of the physical
occurrence of plastics in the environment. In cases where the physical occurrence of plastics is
observed, future studies should employ harmonized data reporting (Provencher et al., 2017; Cowger et
al., 2020).
Polar bears
In several regions of the Arctic, polar bears are harvested in Northern and Indigenous communities.
Under the Northern Contaminants Program in Canada and the AMAP Core Programme of Greenland,
polar bear tissue sampling is done collaboratively with Indigenous harvesters (Rigét et al., 2016;
Letcher et al., 2018). In some regions of Canada, scat samples from bears are also collected to support
genomics and diet studies (http://bearwatch.ca). Additionally, Indigenous knowledge surveys in
northern Canada have illustrated that harvesters are observing litter in the stomachs of harvested polar
bears. Based on the existing efforts to collect polar bear samples with communities, and Indigenous
knowledge reports that have observed litter in polar bears, additional samples for examining plastic
pollution exposure in bears could easily be added to these existing community-based monitoring
programs. Importantly, this type of program could be planned in synergy with existing programs. Thus,
reporting to communities could be done by the current programs in a holistic manner concerning
contaminants in polar bears, including litter and plastic pollution. Sampling polar bears for litter and
MP can also be coupled with sample collection for contaminants. Future efforts to detect smaller size
classes of plastics in tissues of bears will be able to inform on effects and human health research and
monitoring questions.
Mammal entanglements
Both terrestrial and marine mammals experience deleterious effects because of entanglements in
macrolitter in the Arctic. Importantly, this can happen both at sea and on land because macroplastics
can accumulate in both environmental compartments. Currently there is no repository or system that
reports mammal entanglements in plastic pollution and litter. Given the focus of PAME’s Regional
Action Plans on discarded and lost fishing gear, an entanglement reporting tool would allow for the
monitoring of this phenomenon and track regional patterns over time and space with a view to
removing and preventing this type of litter in the environment. Such a reporting network could be
integrated or based on existing marine mammal stranding networks such as NOAA’s Marine Mammal
Health and Stranding Response Network (NOAA 2019).

AMAP Litter and Microplastics Monitoring Guidelines
180
3.4.10 Research gaps
Because of small sample sizes, many marine mammals can be expected to remain understudied across
the pan-Arctic, but efforts should continue to explore the fate and effects of marine litter and MP on
marine mammals. Studies that explore how mammals may ingest, accumulate, and excrete MP and
litter (and thus associated chemical contaminants) will be useful for understanding human exposure to
plastics and its compounds in the Arctic.
Mammals throughout the Arctic are harvested for human consumption, therefore mammals should be
further considered in monitoring and research of plastic additives and related contaminants, as well as
smaller size classes of plastics (i.e., nanoplastics) as analytical tools are developed. Therefore, any
sampling of mammals should also consider preserving tissue samples that can be used to determine
concentrations of plastic additive contaminants in tissues most often consumed by humans (i.e.,
blubber, muscle tissue, etc.).
Given the links between plastic ingestion and the potential uptake of plastic-associated and plastic-
derived contaminants by biota, investigations into the presence of plastics additives could give
indications of plastic uptake (Fossi et al., 2018). Baleen whales have shown promise as an indicator of
plastic additives, but this requires coordinated and dedicated research efforts, something that might be
hard to achieve in the Arctic.

AMAP Litter and Microplastics Monitoring Guidelines
181
Figure 3.8 Map of existing contaminant monitoring programs using mammals in the AMAP region.

AMAP Litter and Microplastics Monitoring Guidelines
182
Table 3.10 Summary of monitoring and research recommendations for litter and microplastic monitoring
in Arctic mammals.
1st level (must do) 2nd level (should do/develop)
Monitoring - Not recommended. - Polar bear scat/fecal/stomach
collections combined with
hunter-knowledge surveys for
tracking ingested litter and MP.
- Reporting network for mammal
entanglements.
Research - Necropsies of land mammals
(caribou, foxes, and rodents).
- Necropsies of marine mammals
(seals, walruses, whales, and polar
bears).
- Once techniques are available,
mammal tissues should be examined
for smaller size classes of plastics.
Table 3.11 Summary rationale for recommendations, including estimated costs for implementing
programs: 0 - marine litter and plastic pollution monitoring already in place with regular funding: $ -
relatively inexpensive because new litter and microplastic monitoring programs can use existing
programs to obtain samples in at least some regions, but need to have some additional capacity to process
samples for litter and plastic pollution; $$ - either sampling networks and/or capacity need to be
developed to monitor litter and microplastic pollution; $$$ - development of sampling networks,
processing capacity of samples, and reporting all need to be developed in the majority of the Arctic
regions.
Recommendation Program cost Rationale
Polar bear scat/fecal/stomach
samples and hunter-knowledge
surveys
$ Samples could be acquired through existing
research programs where polar bear samples are
collected in collaboration with northern and
Indigenous harvesters. Minimal costs would then
be needed for processing the samples because
collections and reporting to communities could be
done by the current programs. Hunter surveys of
Indigenous knowledge could also be designed and
implemented with communities.
Studies can also be paired with tissue collections,
which may contribute to future studies examining
MP and human health questions.
Mammal entanglement $$ A pan-Arctic tool for reporting mammal
entanglements could be established via an online
portal or app similar to existing pollution tracker
apps (i.e., Marine Debris Tracker) or Indigenous
knowledge platforms (i.e., SIKU). This would
collect traditional knowledge from northerners on
the landscape using pictures and reports.

AMAP Litter and Microplastics Monitoring Guidelines
183
References
Andreasen, B., K. Hoydal, R. Mortensen, S.V. Erenbjerg and M. Dam, 2019. AMAP Faroe Islands
2013 - 2016: Heavy Metals and POPs Core Programme. Umhvørvisstovan, Argir, Faroe Islands. x +
103pp. http://dx.doi.org/10.13140/RG.2.2.36147.37924
Baulch, S. and C. Perry, 2014. Evaluating the impacts of marine debris on cetaceans. Marine Pollution
Bulletin, 80(1-2):210-221. https://doi.org/10.1016/j.marpolbul.2013.12.050
Bergmann, M., B. Lutz, M.B. Tekman and L. Gutow, 2017. Citizen scientists reveal: marine litter
pollutes Arctic beaches and affects wild life. Marine Pollution Bulletin, 125(1-2):535-540.
https://doi.org/10.1016/j.marpolbul.2017.09.055
Besseling, E., E.M. Foekema, J.A. van Franeker, M.F. Leopold, S. Kühn, E.B. Rebolledo, E. Heße,
L.J.I.J. Mielke, J. IJzer, P. Kamminga and A.A. Koelmans, 2015. Microplastic in a macro filter feeder:
humpback whale Megaptera novaeangliae. Marine Pollution Bulletin, 95(1):248-252.
https://doi.org/10.1016/j.marpolbul.2015.04.007
Bourdages, M.P.T., J.F. Provencher, E. Sudlovenick, S.H. Ferguson, B.G. Young, N. Pelletier, M.J.
Murphy, A. D'Addario and J.C. Vermaire, 2020. No plastics detected in seal (Phocidae) stomachs
harvested in the eastern Canadian Arctic. Marine Pollution Bulletin, 150:110772.
https://doi.org/10.1016/j.marpolbul.2019.110772
Bravo Rebolledo, E.L., J.A. van Franeker, O.E. Jansen and S.M. Brasseur, 2013. Plastic ingestion by
harbour seals (Phoca vitulina) in The Netherlands. Marine Pollution Bulletin, 67(1-2):200-202.
https://doi.org/10.1016/j.marpolbul.2012.11.035
Caldwell, D.K. and F.B. Golley, 1965. Marine mammals from the coast of Georgia to Cape Hatteras.
Journal of the Elisha Mitchell Scientific Society, 81:24-32.
Cowger, W., A.M. Booth, B.M. Hamilton, C. Thaysen, S. Primpke, K. Munno, A.L. Lusher, A. Dehaut,
V.P. Vaz, M. Liboiron, L.I. Devriese, L. Hermabessiere, C. Rochman, S.N. Athey, J.M. Lynch, H. De
Frond, A. Gray, O.A.H. Jones, S. Brander, C. Steele, S. Moore, A. Sanchez and H. Nel, 2020.
Reporting guidelines to increase the reproducibility and comparability of research on microplastics.
Applied spectroscopy, 74(9):1066-1077. https://doi.org/10.1177/0003702820930292
de Stephanis, R., J. Giménez, E. Carpinelli, C. Gutierrez-Exposito and A. Cañadas, 2013. As main meal
for sperm whales: plastics debris. Marine Pollution Bulletin, 69:206-214.
https://doi.org/10.1016/j.marpolbul.2013.01.033
Denuncio, P., M.A. Mandiola, S.B.P. Salles, R. Machado, P.H. Ott, L.R. De Oliveira and D. Rodriguez,
2017. Marine debris ingestion by the South American fur seal from the Southwest Atlantic Ocean.
Marine Pollution Bulletin, 122(1-2):420-425. https://doi.org/10.1016/j.marpolbul.2017.07.013
Donohue, M.J., J. Masura, T. Gelatt, R. Ream, J.D. Baker, K. Faulhaber and D.T. Lerner, 2019.
Evaluating exposure of northern fur seals, Callorhinus ursinus, to microplastic pollution through fecal
analysis. Marine Pollution Bulletin, 138:213-221. https://doi.org/10.1016/j.marpolbul.2018.11.036

AMAP Litter and Microplastics Monitoring Guidelines
184
Dris, R., J. Gasperi, M. Saad, C. Mirande and B. Tassin, 2016. Synthetic fibers in atmospheric fallout: a
source of microplastics in the environment? Marine Pollution Bulletin, 104(1-2):290-293.
https://doi.org/10.1016/j.marpolbul.2016.01.006
Fossi, M.C., C. Panti, C. Guerranti, D. Coppola, M. Giannetti, L. Marsili and R. Minutoli, 2012. Are
baleen whales exposed to the threat of microplastics? A case study of the Mediterranean fin whale
(Balaenoptera physalus). Marine Pollution Bulletin, 64(11):2374-2379.
https://doi.org/10.1016/j.marpolbul.2012.08.013
Fossi, M.C., M. Baini, C. Panti and S. Baulch, 2018. Impacts of marine litter on cetaceans: a focus on
plastic pollution. In: M.C. Fossi and C. Panti (Eds). Marine Mammal Ecotoxicology: Impacts of
Multiple Stressors on Population Health, pp. 147-184. Academic Press, Cambridge, Massachusetts.
https://doi.org/10.1016/b978-0-12-812144-3.00006-1
Fossi, M.C. and C. Panti, eds., 2018. Marine Mammal Ecotoxicology: Impacts of Multiple Stressors on
Population Health. Academic Press, Cambridge, Massachusetts, 512pp.
Garrott, R. A., L.E. Eberhardt and W.C. Hanson,1983. Summer food habits of juvenile Arctic foxes in
northern Alaska. Journal of Wildlife Management, 47(2):540-545. https://doi.org/10.2307/3808533
Hallanger, I.G. and G.W. Gabrielsen, 2018. Plastic in the European Arctic. Norsk Polarinstitutt,
Tromsø, Norway. 23pp. [online] URL: https://brage.npolar.no/npolar-
xmlui/bitstream/handle/11250/2478285/Kortrapport45.pdf?sequence=1&isAllowed=y
Hofmeyr, G.J.G. and M.N. Bester, 2002. Entanglement of pinnipeds at Marion Island. South African
Journal of Marine Science, 24(1):383-386. https://doi.org/10.2989/025776102784528295
Iverson, S.A., H.G. Gilchrist, P.A. Smith, A.J. Gaston and M.R. Forbes, 2014. Longer ice-free seasons
increase the risk of nest depredation by polar bears for colonial breeding birds in the Canadian Arctic.
Proceedings of the Royal Society B: Biological Sciences, 281(1779):20133128.
https://doi.org/10.1098/rspb.2013.3128
International Whaling Commission (IWC), 2020. Report of the IWC Workshop on Marine Debris: The
Way Forward. 3-5 December 2019, La Garriga, Catalonia, Spain. [online] URL:
https://www.ascobans.org/sites/default/files/document/ascobans_mop9_inf6.2.3a_report-iwc-
workshop-marine-debris.pdf
Kühn, S., E.L. Bravo Rebolledo and J.A. van Franeker, 2015. Deleterious effects of litter on marine
life. In: Bergmann, M., L. Gutow and M. Klages (Eds.). Marine Anthropogenic Litter, pp. 75-116.
Springer, Berlin, Germany. https://doi.org/10.1007/978-3-319-16510-3_4
Kühn, S. and J.A. van Franeker, 2020. Quantitative overview of marine debris ingested by marine
megafauna. Marine Pollution Bulletin, 151:110858. https://doi.org/10.1016/j.marpolbul.2019.110858
Kuiken, T. and M. García-Hartmann, 1991. Cetacean pathology: dissection techniques and tissue
sampling. In: Kuiken, T. and M. García-Hartmann (Eds.). Proceedings of the European Cetacean
Society Workshop. 13-14 September 1991, Leiden, The Netherlands.

AMAP Litter and Microplastics Monitoring Guidelines
185
Letcher, R.J., A.D. Morris, M. Dyck, E. Sverko, E.J. Reiner, D.A.D. Blair, S.G. Chu and L. Shen, 2018.
Legacy and new halogenated persistent organic pollutants in polar bears from a contamination hotspot
in the Arctic, Hudson Bay Canada. Science of the Total Environment, 610-611:121-136.
https://doi.org/10.1016/j.scitotenv.2017.08.035
Lusher, A.L. and G. Hernandez-Milian, 2018. Microplastic extraction from marine vertebrate digestive
tracts, regurgitates and scats: a protocol for researchers from all experience levels. Bio-protocol, 8(22).
https://doi.org/10.21769/bioprotoc.3087
Lusher, A.L., G. Hernandez-Milian, S. Berrow, E. Rogan and I. O'Connor, 2018. Incidence of marine
debris in cetaceans stranded and bycaught in Ireland: recent findings and a review of historical
knowledge. Environmental Pollution, 232:467-476. https://doi.org/10.1016/j.envpol.2017.09.070
Lusher, A.L., G. Hernandez-Milian, J. O'Brien, S. Berrow, I. O'Connor and R. Officer, 2015.
Microplastic and macroplastic ingestion by a deep diving, oceanic cetacean: the True's beaked whale
Mesoplodon mirus. Environmental Pollution, 199:185-191.
https://doi.org/10.1016/j.envpol.2015.01.023
McMahon, C.R., D. Holley and S. Robinson, 1999. The diet of itinerant male Hooker's sea lions,
Phocarctos hookeri, at sub-Antarctic Macquarie Island. Wildlife Research, 26(6):839-846.
https://doi.org/10.1071/wr98079
Moore, R.C., L. Loseto, M. Noel, A. Etemadifar, J.D. Brewster, S. MacPhee, L. Bendell and P.S. Ross,
2020. Microplastics in beluga whales (Delphinapterus leucas) from the Eastern Beaufort Sea. Marine
Pollution Bulletin, 150:110723. https://doi.org/10.1016/j.marpolbul.2019.110723
Nashoug, B.F., 2017. Sources of Marine Litter – Workshop Report, Svalbard 4th-6th September 2016.
SALT report. 1017. SALT, Lofoten, Norway. 23pp. [online] URL: https://pame.is/document-
library/desktop-study-on-marine-litter-library/marine-litter-sources/577-nashoug-2017-sources-of-
marine-litter-worksh/file
National Oceanic and Atmospheric Administration (NOAA), 2014. Report on the Entanglement of
Marine Species in Marine Debris with an Emphasis on Species in the United States. NOAA Marine
Debris Program, Silver Spring, Maryland. 28pp. [online] URL:
https://marinedebris.noaa.gov/sites/default/files/mdp_entanglement.pdf
National Oceanic and Atmospheric Administration (NOAA), 2019. Marine Mammal Health and
Stranding Response Program. Accessed at https://www.fisheries.noaa.gov/national/marine-life-
distress/marine-mammal-health-and-stranding-response-program on 26 April 2020.
Nelms, S.E., J. Barnett, A. Brownlow, N.J. Davison, R. Deaville, T.S. Galloway, P.K. Lindeque, D.
Santillo and B.J. Godley, 2019. Microplastics in marine mammals stranded around the British coast:
ubiquitous but transitory? Scientific Reports, 9(1):1075. https://doi.org/10.1038/s41598-018-37428-3
Øritsland, N.A., 1986. Svalbardreinen og dens livsgrunnlag. Universitetsforlaget, Otta, Norway. 184pp.
Panti, C., M. Baini, A. Lusher, G. Hernandez-Milan, E.L. Bravo Rebolledo, B. Unger, K. Syberg, M.P.
Simmonds and M.C. Fossi, 2019. Marine litter: one of the major threats for marine mammals. outcomes

AMAP Litter and Microplastics Monitoring Guidelines
186
from the European Cetacean Society workshop. Environmental Pollution, 247:72-79.
https://doi.org/10.1016/j.envpol.2019.01.029
Perez-Venegas, D.J., M. Seguel, H. Pavés, J. Pulgar, M. Urbina, C. Ahrendt and C. Galbán-Malagón,
2018. First detection of plastic microfibers in a wild population of South American fur seals
(Arctocephalus australis) in the Chilean Northern Patagonia. Marine Pollution Bulletin, 136:50-54.
https://doi.org/10.1016/j.marpolbul.2018.08.065
Provencher, J.F., A.L. Bond, S. Avery-Gomm, S.B. Borrelle, E.L. Bravo Rebolledo, S. Hammer, S.
Kühn, J.L. Lavers, M.L. Mallory, A. Trevail and J.A. van Franeker, 2017. Quantifying ingested debris
in marine megafauna: a review and recommendations for standardization. Analytical Methods,
9(9):1454-1469. https://doi.org/10.1039/c6ay02419j
Rigét, F., K. Vorkamp, R. Bossi, C. Sonne, R.J. Letcher and R. Dietz, 2016. Twenty years of
monitoring of persistent organic pollutants in Greenland biota. A review. Environmental Pollution,
217:114-123. https://doi.org/10.1016/j.envpol.2015.11.006
Routti, H., T.C. Atwood, T. Bechshoft, A. Boltunov, T.M. Ciesielski, J.P. Desforges, R. Dietz, G.W.
Gabrielsen, B.M. Jenssen, R.J. Letcher, M.A. McKinney, A.D. Morris, F.F. Rigét, C. Sonne, B.
Styrishave and S. Tartu, 2019. State of knowledge on current exposure, fate and potential health effects
of contaminants in polar bears from the circumpolar Arctic. Science of the Total Environment,
664:1063-1083. https://doi.org/10.1016/j.scitotenv.2019.02.030
Unger, B., H. Herr, H. Benke, M. Böhmert, P. Burkhardt-Holm, M. Dähne, M. Hillmann, K. Wolff-
Schmidt, P. Wohlsein and U. Siebert, 2017. Marine debris in harbour porpoises and seals from German
waters. Marine Environmental Research, 130:77-84. https://doi.org/10.1016/j.marenvres.2017.07.009
van Franeker, J.A., E.L. Bravo Rebolledo, E. Hesse, L.L. IJsseldijk, S. Kühn, M. Leopold and L.
Mielke, 2018. Plastic ingestion by harbour porpoises Phocoena phocoena in the Netherlands:
establishing a standardised method. Ambio, 47(4):387-397. https://doi.org/10.1007/s13280-017-1002-y
Photo: Carolyn Mallory

AMAP Litter and Microplastics Monitoring Guidelines
187
4.0 Guidance for Analyses, Modeling, and Data Reporting
4.1 Types of litter and microplastics monitoring programs in the Arctic AUTHORS: MAX LIBOIRON, LIZ PIJOGGE, TANJA KÖGEL, JENNIFER PROVENCHER, ILKA PEEKEN, MARK MALLORY,
AND BONNIE HAMILTON
4.1.1 Introduction
Environmental monitoring of plastic pollution in the Arctic seeks to characterize changes in the
distribution, types, and trends of plastics in a range of ecosystems. Long-term assessment programs
often replace one-time projects. However, one-time projects sometimes occur where monitoring
efforts are ongoing, which can lead to a disconnect between datasets due to varying assessment
methods and an inability to compare data. Long-term monitoring efforts allow for harmonization of
methods across the region, familiarity with local conditions and communities, as well as an ability to
coordinate singular projects into a coherent set of metrics and goals. In efforts to harmonize
monitoring in the North, we argue: (1) long-term monitoring programs are better for establishing
environmental trends in the Arctic; and, (2) one-time projects should be linked up with the appropriate
monitoring program in the region.
This section introduces several types of monitoring programs with recent examples. The goal is to
articulate the breadth of programs, thereby providing governments, scientists, and communities with
the knowledge to choose the type of monitoring that best suits their needs. This will also identify
existing programs that relevant stakeholders may wish to join or extend. The examples outlined within
are not an exhaustive inventory but represent geographical diversity. The types of programs discussed
include nationally led, community-based, research stations and observatories, citizen science, species-
specific sampling, and opportunistic sampling. We discuss the characteristics of robust monitoring
programs versus individual projects to highlight what new, emerging, and developing Arctic plastic
pollution monitoring programs should consider in their design and functioning (Table 4.1).
4.1.2 Types of monitoring programs
Government-led
Government-led monitoring programs are carried out by order of ministries or other governmental
authorities, or they respond to national calls issued by research councils funded by governments, and
they are for monitoring within the governmental jurisdiction. They are often characterized by the
obligation to heed certain quality assurance parameters, such as using accredited methods according
to international standards, reporting measurement uncertainties, and articulating risk and best
practices. Study results are usually published (open access) as technical reports or white papers in the
national official language rather than in international peer-reviewed journals, though the latter does
occur. Government-led monitoring programs are often driven by the demand to follow or inform
national and international laws, such as maximum levels for contaminants in commercially sold food,
assessing environmental standards, or conducting population monitoring to ensure sustainable
fisheries. They can also inform national policies aimed at achieving the Sustainable Development
Goals set by the United Nations. There are several national monitoring programs on plastic pollution,
and currently, they tend to focus on macro- and mesoplastics. There are several published national or
regional-scale reports on plastics (e.g., MacLean et al., 2013; Reisser et al., 2013; Sundt et al., 2014;
Buhl-Mortensen and Buhl-Mortensen, 2017) outlining research happening within a nation’s borders.
AMAP Litter and Microplastics Monitoring Guidelines
188
Although these studies are crucial in understanding the pervasiveness of plastic pollution at a national
level, multinational collaborations are also important.
Mapping marine litter in the Norwegian and Russian Arctic seas (MALINOR) is a multinational
project funded by the Norwegian Research Council (NFR). Its expressed “main objective is to map
areas of marine litter and describe its characteristics in the Arctic in collaboration with Russian
institutions with a multi-disciplinary approach” (Salt, 2020). This new, coordinated program will
begin by conducting a literature review “from the scientific & grey literature on the distribution of
litter in the Norwegian Russian Arctic, identify ongoing activities on this topic both in Norway and
Russia, build up a joint Norwegian Russian database, perform mapping using multidisciplinary
approaches (robotics, digital solutions, GIS, satellite pictures), collect offshore data using research
cruises of opportunity, develop a predictive tool for litter distribution, and importantly, disseminate
the findings to the students, public and policy makers both nationally in Norway and Russia and also
internationally (e.g., UNEP, Arctic Council)” (SALT, 2020). For a project in development, see the
FRAM - High North Research Centre for Climate and the Environment’s scientific program 2018-
2023 for plastic in the Arctic (Halsband et al., 2018).
Community-based
Community-based monitoring includes projects that are created, led, and carried out by community
groups, as well as projects that are created and facilitated by outside principal investigators but led
and carried out by communities. The main benefit of these programs is that they concretely address
community concerns about plastics and tend to mitigate or eliminate scientific colonialism in the
North where the needs, methods, and goals of southern-based organizations and scientists are often
put before local needs. One of the core challenges with such programs is accessibility. Community-
based programs often do not possess the capacity and/or funding to maintain a presence in mainstream
science circles (e.g., lack of access to web services, conferences, funding, etc.). Furthermore, if there
is a desire to bring them in line with other global efforts (i.e., standardizing methods and data
regimes), additional resources and capacity-sharing may be required.
An example of a community-based project is Community Monitoring of Plastic Pollution in Wild
Food and Environments in Nunatsiavut. This is a project of the Inuit Nunatsiavut Government, led by
Max Liboiron (Metis, Memorial University) and Liz Pijogge (Inuk, Nunatsiavut Government) in
Nunatsiavut, Canada. Funded by the Northern Contaminants Program since 2018, the program
focuses on plastics in traditional food webs and culturally important ecosystems for Inuit hunters and
fishers, and local Inuit are employed to carry out the research on their own land. Data are owned by
the Nunatsiavut Government rather than the outside researcher. The end goal of the program is for the
research to be carried out by the North for the North, minimizing the need for outside researchers.
Research stations and observatories
Research stations and observatories in the Arctic are designed to be permanent or semi-permanent,
making them ideal for long-term monitoring projects. They tend to be maintained by governments
rather than universities or research groups, although they are often run in partnership with these
groups. There are over 100 research stations in the Arctic, most of them listed at the International
Network for Terrestrial Research and Monitoring in the Arctic (https://eu-interact.org). One core
challenge with these stations is their expense over time.
AMAP Litter and Microplastics Monitoring Guidelines
189
In 1999, the Alfred Wegener Institute in Germany established the LTER observatory HAUSGARTEN
(Soltwedel et al., 2016). Since 2002, the HAUSGARTEN observatory in the Arctic has conducted
marine plastic monitoring on the seafloor using towed seafloor photography. It is located in the
eastern Fram Strait and comprises 21 stations, which are sampled annually to assess temporal
variability in a range of environmental parameters. This regular monitoring has shown that plastic
accounted for the highest proportion of litter (47%), and that the proportion and total amount of small-
sized plastics increased between 2002 and 2014, indicating fragmentation of plastic litter (Tekman et
al., 2017).
Citizen science
Citizen science is the collection of scientific information and observations carried out by the general
public, often part of a collaborative project led by a team of researchers. These efforts are usually
opportunistic, although they can be more regular if groups return to the same places over time. Long-
term citizen science is more likely to occur with community groups or NGOs than with individual
scientists. The main benefit of citizen science is that it can minimize costs because citizen scientists
are often volunteers. However, two primary challenges arise with citizen science. First, comparing
citizen science studies with those following the scientific method can be a challenge because there is
often a difference in methodologies to meet their respective goals (Harris, 2019). Second, there are
some types of plastic work (e.g., micro- and nanoplastics) that require great care and protocols in
collection due to contamination issues, and they may not be appropriate for citizen science work.
The use of the Marine Debris Tracker App is a key example of citizen science being carried out in the
Arctic to monitor plastics. This is a free phone application that was created in 2010 through a
partnership with the NOAA Marine Debris Program and the Southeast Atlantic Marine Debris
Initiative (SEA-MDI) at the University of Georgia (Marine Debris Tracker, 2019). The app geotags
plastic debris and uploads the data to a centralized website for public use. Data have been collected in
the Arctic in Canada, Norway, Finland, and the US (Alaska) since 2014. The app continues to be
updated and maintained, making it more like a program made up of multiple projects. Citizen science
has also been used in short-term projects. In 2016, scientists worked with two tourist cruise operators
and their guests to conduct shoreline studies, resulting in a published study (Bergmann et al., 2017).
In 2019, a report was released that tested whether commercial ROVs could be used by citizen
scientists to map and quantify benthic marine litter, with negative results (Haarr and Havas, 2019).
Before the establishment of citizen science programs, we recommend this type of testing be carried
out to ensure methodological feasibility.
Species-specific monitoring
Some regional studies of plastic pollution hinge on one key environmental parameter. The decision to
use a sentinel species increases the likelihood of comparability of studies over time given the ability
to standardize methods suited to the species. This allows individual studies to begin to act as
programs, particularly if they are paired with national funding. Sentinel species are usually chosen for
their low variability of ingestion rates and non-selective ingestion of plastics, thereby ensuring that
temporal trends reflect trends of plastics in the environment. These species should be chosen with care
and considered in the context of their ecology. One disadvantage to this method is that it provides a
narrow view of environmental plastics generally because a particular species will ingest a particular
size of plastic in particular environments based on its body size, range, etc. Therefore, it is
recommended that several compartments for monitoring related to species-specific monitoring

AMAP Litter and Microplastics Monitoring Guidelines
190
programs are considered to ensure that collected data will give a more holistic perspective of litter and
microplastics (MP) in the environment.
The most developed, species-specific plastic monitoring project uses plastic debris from a seabird, the
Northern Fulmar (Fulmarus glacialis), and follows the OSPAR and EU-Marine Strategy Directive,
thereby employing Ecological Quality Objective (EcoQO) to determine changes in environmental
levels of plastics. In Denmark, these studies were conducted between 2002 and 2017. They have
shown that 54% of beached fulmars exceeded the EcoQO threshold, and that over the past 10 years,
Danish monitoring showed no statistical changes for marine plastic litter in fulmar stomachs (van
Franeker et al., 2017). From 2005 to 2014, the same types of studies have been conducted in the North
Sea and found that levels of plastic ingestion appear to have stabilized at around 60% of individuals
exceeding the 0.1 g level of plastic ingestion specified in the OSPAR long-term goal definition
(OSPAR, 2019; see also van Franeker et al., 2005). Other studies at other locations use similar metrics
to produce comparable results.
Opportunistic
Although most programs are characterized by advanced planning and stability, some programs are
opportunistic. These opportunistic programs tend to be snapshots of an environment at a given point
in time, without links or methodological comparability to long-term monitoring programs. Although
free research or the seizing of opportunities can provide vital new impulses, insights, and data
otherwise not accessed, the coordination of these opportunities and/or the standardization of methods
to those from established, long-term programs is key for making these opportunities comparable, and
consequently another valuable source of ongoing, low-cost data for long-term monitoring efforts.
Such harmonized approaches should be added to research efforts wherever possible.
One key area of opportunistic data is plastic bycatch. For example, between 2010 and 2016, a joint
Norwegian-Russian ecosystem monitoring survey saved and analyzed data on plastic bycatch from
pelagic and bottom trawling, as well as from visual observations of the surface of water, in the
Barents Sea (Grøsvik et al., 2018). This allowed a long-term study of plastics without a specific
plastic research design.
Another way to think of a coordinated yet opportunistic program is the way multiple studies can be
directly compared when they adopt standardized methods. Using OSPAR methods for shoreline
studies, for example, allows studies from diverse areas to be compared, even when they are not
otherwise coordinated. Although this does not constitute a program per se, new, emerging, and
developing programs might consider how they could opportunistically “adopt” previous studies and
data through standardized methods and measurements.
4.1.3 Characteristics of robust monitoring programs
As opposed to research projects, monitoring programs are coordinated, comprehensive, and long term,
which enables them to observe longitudinal trends over specific spatial regions. They are usually
oriented toward goals, and those goals are reflected in the methods and measures used, which are
standardized to allow internal and external comparisons of protocols, data, and results. Ideally, robust
monitoring programs should include, but are not limited to, the following: temporal coverage
spanning multiple seasons over many years; evaluations of multiple sample media (i.e., biotic
impacts, benthic, shoreline, surface water, etc.); specialization in a geographic region; and/or
specialization in a particular sample medium across a wide geographic range.

AMAP Litter and Microplastics Monitoring Guidelines
191
Given the sampling effort, a key consideration for robust monitoring programs is their ability to detect
change. Power analyses should be used for future and existing programs and data. Currently, for litter
and MP in many compartments, data allowing for power analysis are limited, and only a handful of
studies have been done.
Table 4.1 Chart of monitoring programs.
Type Strengths Challenges Example
Nationally Led • Scale of program matches
scale of jurisdiction for
action/policy
• Likely to have quality
assurance parameters
• Clear lines of funding and
accountability
• Can include large
geographic areas
• Requires coordination
of multiple
people/studies
• Expensive
Mapping marine litter in the
Norwegian and Russian Arctic seas
(MALINOR)
Community-based • Aligns with needs of
northern communities
• Better chance of
eliminating or mitigating
scientific colonialism
• Can be difficult for
policymakers and
scientists to identify
these programs
• Less likely to meet
science community
needs and processes,
including standardized
methods
Community Monitoring of Plastic
Pollution in Wild Food and
Environments in Nunatsiavut,
Nunatsiavut Government
Research Stations
and Observatories • Long-term/permanent so
capable of long-term
observation
• Funded by governments
• Excellent sites for
collaborative and
opportunistic efforts
• Expensive
HAUSGARTEN observatory
Citizen Science • Inexpensive for accredited
scientists
• Data can align with
community needs and
goals if done with local
groups
• Can include vast
geographical reach through
wide participation
• Data can be patchy in
geographical and
temporal terms
• Comparison between
studies can be difficult
• Often not long term if
led by outside scientists
Marine Debris Tracker App
Species-specific • Sentinel species reflect
environmental conditions
• Can be less expensive if
using beached animals
• Readily comparable across
studies
• Narrow view of one
type/size range of
plastic
Northern Fulmar and the
OSPAR and EU-Marine Strategy
Directive to use Ecological Quality
Objective (EcoQO)
Opportunistic • Inexpensive
• Novel sources of data
• Can be done via
standardization of methods
for a “program effect”
• Uncoordinated and
unplanned; requires
after-the-fact
coordination
• Snapshots of
environment
Norwegian-Russian ecosystem
monitoring survey of plastic bycatch
in trawling studies

AMAP Litter and Microplastics Monitoring Guidelines
192
References
Bergmann, M., B. Lutz, M.B. Tekman and L. Gutow, 2017. Citizen scientists reveal: marine litter
pollutes Arctic beaches and affects wild life. Marine Pollution Bulletin, 125(1-2):535-540.
https://doi.org/10.1016/j.marpolbul.2017.09.055
Buhl-Mortensen, L. and P. Buhl-Mortensen, 2017. Marine litter in the Nordic Seas: distribution
composition and abundance. Marine Pollution Bulletin, 125(1-2), 260-270.
https://doi.org/10.1016/j.marpolbul.2017.08.048
Grøsvik, B.E., T. Prokhorova, E. Eriksen, P. Krivosheya, P.A. Horneland and D. Prozorkevich, 2018.
Assessment of marine litter in the Barents Sea, a part of the joint Norwegian-Russian ecosystem
survey. Frontiers in Marine Science, 5:72. https://doi.org/10.3389/fmars.2018.00072
Haarr, M.L. and V. Havas, 2019. Pilot Project: Development of a Standard Operating Procedure for
Mapping Marine Litter on the Seafloor Using Commercial Underwater Drones. SALT Report, No.
1028. SALT, Lofoten, Norway. 11pp. [online] URL: https://salt.nu/wp-
content/uploads/2019/03/Report-1028-Commercial-underwater-drones-for-mapping-marine-litter-on-
the-seafloor.pdf
Halsband, C., G. Broström, Ø. Andersen, S. Bourgeon, P. Graczyk, B.E. Grøsvik, I. Hallanger, S.A.
Hanssen, D. Herzke, S. B. Holmgaard, T. Kögel, A.K. Normann, M. Olsen and T. Reiertsen, 2018.
Scientific programme 2018-2023 for plastic in the Arctic. FRAM–High North Research Centre for
Climate and the Environment, Tromsø, Norway. [online] URL:
https://framsenteret.no/nyheter/2018/11/05/scientific-programme-2018-2023-for-plastic-in-the-arctic/
Harris, L., 2019. Aligning citizen science and extended producer responsibility policy for marine
plastic reduction. Master’s Thesis. Memorial University, St. John’s, Newfoundland. [online] URL:
https://research.library.mun.ca/13975/1/thesis.pdf
MacLean, M., H. Breeze, J. Walmsley and J. Corkum (Eds.), 2013. State of the Scotian Shelf Report.
Canadian Technical Report of Fisheries and Aquatic Sciences 3074. Fisheries and Oceans Canada,
Dartmouth, Nova Scotia. 352pp. [online] URL: https://waves-vagues.dfo-
mpo.gc.ca/Library/352339.pdf
Marine Debris Tracker, 2019. Marine Debris Tracker. Accessed at https://marinedebris.engr.uga.edu/
on 28 September 2019.
OSPAR, 2019. Plastic Particles in Fulmar Stomachs in the North Sea. OSPAR, London, UK.
https://oap.ospar.org/en/ospar-assessments/intermediate-assessment-2017/pressures-human-
activities/marine-litter/plastic-particles-fulmar-stomachs-north-sea/
Reisser, J., J. Shaw, C. Wilcox, B.D. Hardesty, M. Proietti, M. Thums and C. Pattiaratchi, 2013.
Marine plastic pollution in waters around Australia: characteristics, concentrations, and pathways.
PloS ONE, 8(11):e80466. https://doi.org/10.1371/journal.pone.0080466
SALT, 2020. MALINOR - Mapping Marine Litter in the Norwegian and Russian Arctic Seas. SALT,
Lofoten, Norway. [online] URL:

AMAP Litter and Microplastics Monitoring Guidelines
193
https://salt.nu/en/?prosjekter=malinor-mapping-marine-litter-in-the-norwegian-and-russian-arctic-
seas.
Soltwedel, T., E. Bauerfeind, M. Bergmann, A. Bracher, N. Budaeva, K. Busch, A. Cherkasheva, K.
Fahl, K. Grzelak, C. Hasemann, M. Jacob, A. Kraft, C. Lalande, K. Metfies, E.-M. Nöthig, K. Meyer,
N.-V. Quéric, I. Schewe, M. Włodarska-Kowalczuk and M. Klages, 2016. Natural variability or
anthropogenically-induced variation? Insights from 15 years of multidisciplinary observations at the
arctic marine LTER site HAUSGARTEN. Ecological Indicators, 65:89-102.
https://doi.org/10.1016/j.ecolind.2015.10.001
Sundt, P., P.-E. Schulze and F. Syversen, 2014. Sources of microplastic-pollution to the marine
environment. Mepex. Miljødirektoaret, Trondheim, Norway. [online] URL:
https://www.miljodirektoratet.no/globalassets/publikasjoner/M321/M321.pdf
Tekman, M.B., T. Krumpen and Bergmann, 2017. Marine litter on deep Arctic seafloor continues to
increase and spreads to the North at the HAUSGARTEN observatory. Deep Sea Research Part I:
Oceanographic Research Papers, 120:88-99. https://doi.org/10.1016/j.dsr.2016.12.011
van Franeker, J.A., M. Heubeck, K. Fairclough, D.M. Turner, M. Grantham, E.W.M. Stienen, N.
Guse, J. Pedersen, K.O. Olsen, P.J. Andersson and B. Olsen, 2005. ‘Save the North Sea’ Fulmar
Study 2002-2004: a regional pilot project for the Fulmar-Litter-EcoQO in the OSPAR area. Alterra
Report, No. 1162. 70pp. [online] URL: https://edepot.wur.nl/35175
van Franeker, J., S. Kühn, J. Pedersen and P. Hansen, 2017. Fulmar Litter EcoQO monitoring in
Denmark 2002-2017. Wageningen Marine Research, Den Helder, The Netherlands. 52pp.
https://doi.org/10.18174/423968
Beach litter survey.
Photo: Peter Murphy

AMAP Litter and Microplastics Monitoring Guidelines
194
4.2 Data treatment AUTHORS: JAN RENE LARSEN, ANDY M. BOOTH, CHELSEA M. ROCHMAN, MAX LIBOIRON, PETER MURPHY, SEBASTIAN
PRIMPKE, AND STEFANO ALIANI
4.2.1 General recommendations on data reporting
One of the purposes of formulating standardized monitoring guidelines is to be able to compare
observations over time and space. To make observational data comparable, it is important to unify not
only the sampling and analysis methodology, but also the data reporting. The use of unified,
controlled vocabularies and the setting of standards on the level of data detail for all observers, is one
of the critical parts of this process. Although it might be time consuming to adopt a unified data
reporting process, it is necessary to establish a solid basis for future data analysis, modeling,
assessment, and use.
Data reporting is often seen as a middle step between the detailed raw data collected and stored in
individual institutes, and the final target product expected from the assessments.
Under this program:
• data on atmospheric deposition should be reported to EBAS Database3, operated by the
Norwegian Institute for Air Research (NILU)
• data on abiotic compartments (seawater, seabed, beaches, and sediments) should be reported to
the ICES Environmental Database (DOME)4
• data on biotic compartments (invertebrates, fish, birds, and mammals) should be reported to the
ICES Environmental Database (DOME)
Both NILU and ICES have developed standard procedures for the reporting of data to their databases
and these should be followed. These procedures define the minimum mandatory information that has
to be reported. In addition, the procedures support the reporting of optional information, depending on
the monitoring objectives. In these guidelines, each of the compartment sections (Sections 2.0 and
3.0) have defined what information is optional and mandatory under the objectives of each
compartment.
4.2.2 Data reporting to NILU/EBAS
The Norwegian Institute for Air Research (NILU) organizes the EBAS atmospheric database. It was
originally designed for the European Monitoring and Evaluation Programme (EMEP) and today it
archives data on atmospheric composition from ground stations around the globe, as well as aircraft
platforms. Co-operating frameworks and projects include:
• The Convention on Long-Range Transboundary Air Pollution (CLRTAP)
• The WMO Global Atmosphere Watch Programme (GAV)
• The Arctic Monitoring and Assessment Programme (AMAP)
• The EU-project Aerosols, Clouds, and Trace gases Research InfraStructure Network
(ACTRIS)
3 http://ebas.nilu.no/ 4 http://ecosystemdata.ices.dk/

AMAP Litter and Microplastics Monitoring Guidelines
195
Data submitted to EBAS are protected by a fair-use data policy, although some projects/programs
request a more restrictive data policy. The process for submitting data to EBAS is described in the
EBAS Data Submission Manual5, which also contains comprehensive Getting started documentation.
4.2.3 Data reporting to ICES/DOME
ICES databases and formats
Data on the abundance and geographical distribution of litter and microplastics (MP), as well as
relevant ancillary information, can be submitted to the ICES Environmental Database (DOME) in
either the Environmental Reporting Format 3.2 (ERF3.2) or the Simplified Format6.
Depending on the compartment, data should be reported through different mechanisms:
• Litter and MP information for seawater, seabed, and beaches can be submitted as litter datasets.
• Surveys in biota (birds, mammals, fish, invertebrates) or in sediment, where additional sample
parameters should be submitted, can be accommodated as part of the contaminants in biota and
sediment formats.
• Seafloor fisheries surveys that deliver data to ICES DATRAS DB in advance, can submit litter
data as additional information. Due to the present setup, it is recommended not to request adding
new surveys to DATRAS for the sole purpose of litter monitoring. Seabed litter can also be
reported through the ICES/DOME mechanism.
• Currently (April 2021), there is no mechanism for the reporting of data from terrestrial soils or
from ice/snow. In principle, the ICES/DOME mechanism can handle soil data as sediment data.
The structure of data reporting to ICES requires that a reporting institution within a country reports
their data through a single annual submission.
A generic example of the reporting of data to ICES/DOME is found in Appendix 4.1.
ICES litter and microplastics data-specific details: vocabularies, codes, and code types
One of the key tools for ensuring consistent data reporting is the use of controlled vocabularies. The
ICES vocabularies organize defined codes as separate code types. In the ICES Vocabulary7, all codes
used for data reporting are maintained, including those for litter and MP. New code types or codes can
be added to the ICES vocabularies as needed. The following describes certain key code types in
connection with litter and MP:
• LTREF8: for the classification of litter types, the Litter Reference List (LTREF) and respective
litter codes from the lists are used.
• MUNIT9 (with respective VALUE): ICES stores measured data as “number of items” (in the
given category), or their “weight per sample,” or normalized with sample weight or area.
5 https://ebas-submit.nilu.no/ 6 http://ices.dk/data/Documents/ENV/Environment_Formats.zip (see ERF3.2 and Simplified_Format_Litter) 7 https://vocab.ices.dk/ 8 https://vocab.ices.dk/?ref=1381 9 https://vocab.ices.dk/?ref=155
AMAP Litter and Microplastics Monitoring Guidelines
196
• Additional information about the litter is stored in separate fields, like LTSZC10 (litter size
category), LTPRP11 (shape and color mainly), TYPPL12 (type of polymer), LTSRC (litter source,
if known).
Data quality
Prior to uploading data files to ICES, these files must pass a quality verification assessment by a Data
Screening Utility (DATSU) that checks if the format and codes are correct.
References
Provencher, J.F., S.B. Borrelle, A.L. Bond, J.L. Lavers, J.A. van Franeker, S. Kühn, S. Hammer, S.
Avery-Gomm and M.L. Mallory, 2019. Recommended best practices for plastic and litter ingestion
studies in marine birds: collection, processing, and reporting. FACETS, 4:111-130.
https://doi.org/10.1139/facets-2018-0043
10 https://vocab.ices.dk/?ref=1380 11 https://vocab.ices.dk/?ref=1403 12 https://vocab.ices.dk/?ref=1385
Provencher, J.F., A.L. Bond, S. Avery-Gomm, S.B. Borrelle, E.L. Bravo Rebolledo, S. Hammer, S.
Kühn, J.L. Lavers, M.L. Mallory, A. Trevail and J.A. van Franeker, 2017. Quantifying ingested debris
in marine megafauna: a review and recommendations for standardization. Analytical Methods,
9:1454-1469. https://doi.org/10.1039/C6AY02419J
AMAP Litter and Microplastics Monitoring Guidelines
197
Appendix 4.1 Reporting of data to ICES DOME – Generic example
The following example is a generic description of the use of the ICES/DOME Simplified Format. It is
provided for illustrative purposes; for a specific submission, the ICES/DOME documentation should
be consulted.
The first page shows how data should be organized in spreadsheet table structure for submission. The
heading (first line) refers to fields, with more details and descriptions on these fields being presented
in subsequent pages.

AMAP Litter and Microplastics Monitoring Guidelines
198
Table A1.1 Data reporting using the ICES/DOME Simplified Format, generic example
(Line) RLABO MYEAR SHIPC CRUIS STNNO LATIT LONGI POSYS STATN DEPHU DEPHL
1 NIVA 2012 AA31 201210 R10 xx.xxxx yy.yyyy Fjørtoft R1070BC045 0.05
2 NIVA 2012 AA31 201210 R10 xx.xxxx yy.yyyy Fjørtoft R1070BC045 0.05
3 NIVA 2012 AA31 201210 R10 xx.xxxx yy.yyyy Fjørtoft R1070BC045 0.05
4 NIVA 2012 AA31 201210 R10 xx.xxxx yy.yyyy Fjørtoft R1070BC045 0.05
5 NIVA 2014 AA31 201404 R12 xx.xxxx yy.yyyy Finnmark R1298MC037A 0.05
6 NIVA 2014 AA31 201404 R12 xx.xxxx yy.yyyy Finnmark R1298MC037A 0.05
(Line) SDATE SMPNO SUBNO MATRX LTREF LTSZC PARAM MUNIT BASIS VALUE LTSRC
1 20121006 R10 1 SEDtot RECO-LT LT245 nr 291
2 20121006 R10 1 SEDtot RECO-LT LT245 % 87.6
3 20121006 R10 1 SEDtot WTMEA g W 500
4 20121006 R10 1 SEDtot Drywt% % W 20
5 20140415 R12 1 SEDtot RECO-LT LT245 nr/kg D 358.4
6 20140415 R12 1 SEDtot RECO-LT LT245 % 48.3
(Line) TYPPL LTPRP ALABO
REFSK METST
METFP METOA SLABO SMTYP WLTYP MSTAT PURPM MPROG
NIVA MIC-FL NIVA GE MO L AMAP
SHP4 NIVA MIC-FL NIVA GE MO
NIVA GRV NIVA GE MO
NIVA GRV NIVA GE MO
NIVA MIC-FL NIVA GE CF
SHP4 NIVA MIC-FL NIVA GE CF

AMAP Litter and Microplastics Monitoring Guidelines
199
Table A1.2 CES/DOME field descriptions, excerpt.
Column Column definition Options ICES Mandatory Mandatory for
assessments
Format
RLABO Reporting laboratory http://vocab.ices.dk/?ref=101
http://dome.ices.dk/datsu/rlabo_ls.a
spx
Yes
See options
MYEAR Monitoring year
Yes. Will be created from
SDATE if blank
Yes YYYY
SHIPC Ship or platform code http://vocab.ices.dk/?sortby=Descri
ption&ref=315
Yes (minimum requirement is
an "AA" code)
See options
CRUIS Cruise identifier (series of sampling
occasions)
Yes
Any character 0–9, A–Z etc.
STNNO Station identification/Sampling event ID
Yes
Any character 0–9, A–Z etc.
LATIT Latitude (degrees/minutes/decimal minutes
or as decimal degrees). Report as WGS84
Yes Yes -90 00.000 to +90 00.000
or
'-90.0000 to +90.0000
LONGI Longitude (degrees/minutes/decimal
minutes or as decimal degrees). Report as
WGS84
Yes Yes -180 00.000 to +180 00.000
or
'-180.0000 to +180.0000
POSYS Position system http://vocab.ices.dk/?ref=40 No
WGS84 is assumed if field is
blank and GPS is entered. See
options
STATN Station name Station dictionary - assessments for
cont. are based on station names
and polygons in the station
dictionary
No Yes Any character 0–9 or A–Z. No
";" or "," or double spaces or
parenthesis
WADEP Water depth (sounding in meters)
0–9
DEPHU Upper depth (m)
Yes for water chemicals Yes for water
chemicals 0–9
DEPHL Lower depth (m)
Yes for water chemicals Yes for water
chemicals 0–9
SDATE Sampling date Multiple years allowed but if blank,
the date will determine the
monitoring year for file creations
Yes Yes YYMMDD
EDATE Sampling end date
Yes for passive sampling only
YYMMDD
STIME Sampling time/start (UTC)
No
HHMM

AMAP Litter and Microplastics Monitoring Guidelines
200
ATIME Actual time of sampling (UTC)
No
HHMM
ETIME Sampling end time (UTC)
No
HHMM
SPECI Species of specimen (WoRMS) http://www.marinespecies.org/ Yes for biota data
Latin name or AphiaID
SMPNO Sample number/Sample identification for
haul or group of individuals/cores/bottles
collected at that time/place
Yes
Any character 0–9, A–Z etc.
NOAGG Number of aggregated samples (hauls,
sediment cores, or grabs) taken to
comprise sample
No
2–99
FINFL Factors potentially influencing guideline
compliance and interpretation of data
http://vocab.ices.dk/?ref=176 No
See options. Multiples allowed
when separated with “~” (ascii
126)
SUBNO Subsample number - individual organism,
sediment slice
Yes
Any character 0–9, A–Z etc.
NOINP Number of individuals in sample
Yes for biota data
0–9
ORGSP Origin of specimen http://vocab.ices.dk/?ref=153 No
See options
SEXCO Sex code http://vocab.ices.dk/?ref=45 No Yes for some
effects
parameters
See options
STAGE Stage of development http://vocab.ices.dk/?ref=52 No
See options
CONES Condition of specimen http://vocab.ices.dk/?ref=74 No
See options
ASTSA Animal state at time of sampling http://vocab.ices.dk/?ref=64 No
See options
NODIS Number of diseases looked for during a
fish disease survey
No
0–9
BULKID Bulk identification (for individuals only) Existing related SUBNO. If an
individual (or parts thereof) has
been analyzed in one or more bulks,
insert the SUBNO identification(s)
of the bulk(s). Note that BULKID
can only refer to a SUBNO within
the same sample. See field
descriptions for an example.
(separate multiple entries with “~”
(ascii 126))
No
0–9. Multiples allowed when
separated with “~” (ascii 126)
MATRX Matrix http://vocab.ices.dk/?ref=55 Yes
See options
PARAM Parameter http://vocab.ices.dk/?ref=37 Yes
See options
MUNIT Measurement unit http://vocab.ices.dk/?ref=155 Yes
See options

AMAP Litter and Microplastics Monitoring Guidelines
201
BASIS Basis of determination Enter NR if not relevant, otherwise
see http://vocab.ices.dk/?ref=65
Yes
NR or options in list
VFLAG Validity flag http://vocab.ices.dk/?ref=59 No
See options
QFLAG Qualifier flag http://vocab.ices.dk/?ref=180 No
See options
VALUE Value measured
Yes
0–9
PERCR Percentage recovery - to be applied (if
thought necessary by data submitter) to the
reported value (in VALUE field) at an
assessment to give a better approximation
of the real value
No
0–9
SIGND Significant digits reported in VALUE
No
0–9
UNCRT Uncertainty value
No Yes for
chemicals
0–9
METCU Method of calculating uncertainty http://vocab.ices.dk/?ref=213 Yes if UNCRT is reported Yes for
chemicals
See options
DETLI Detection limit
No
0–9
LMQNT Limit of quantification
No
0–9
PRFLG Pressure flag
No
0–9
ALABO Analytical laboratory http://vocab.ices.dk/?ref=101 Yes if methods or QA fields
are reported
Yes for most
parameters
See options
REFSK Reference source or key http://vocab.ices.dk/?ref=171 No Yes for some
effects
parameters
See options
METST Method of storage http://vocab.ices.dk/?ref=200 No
See options
METFP Method of chemical fixation/preservation http://vocab.ices.dk/?ref=34 No
See options
METPT Method of pre-treatment http://vocab.ices.dk/?ref=201 Yes for seawater data to show
filtered or non-filtered
See options. Multiples allowed
when separated with “~” (ascii
126)
METCX Method of chemical extraction http://vocab.ices.dk/?ref=202 No
See options. Multiples allowed
when separated with “~” (ascii
126)
METPS Method of purification/separation http://vocab.ices.dk/?ref=198 No
See options
METOA Method of analysis http://vocab.ices.dk/?ref=173 No Yes for most
parameters
See options
AGDET Age determination http://vocab.ices.dk/?ref=19 No
See options
SREFW Source of reference seawater http://vocab.ices.dk/?ref=154 No
See options

AMAP Litter and Microplastics Monitoring Guidelines
202
SPECI In vivo/In vitro test organism or cell line http://vocab.ices.dk/?ref=351 No Yes for some
effects
parameters
See options in list "VIVIT"
ORGSP Origin of test specimen http://vocab.ices.dk/?ref=153 No
See options
SIZRF Size class reference list http://vocab.ices.dk/?ref=303 No
See options
FORML Formula used in calculation http://vocab.ices.dk/?ref=296 No
See options
ACCRD Accredited laboratory for the linked
parameter
Y for Yes or N for No No
Y or N
ACORG Accrediting organization http://vocab.ices.dk/?ref=355 No
See options
SLABO Sampling laboratory http://vocab.ices.dk/?ref=101 Yes if SMTYP or other
sampling fields are reported
See options
SMTYP Sampler type http://vocab.ices.dk/?ref=152 No Yes for
passive
sampling
See options
NETOP Net opening width (m)
No
0–9
MESHS Mesh size of net or sieve (µm)
No
0–9
SAREA Sampler area (cm2)
For passive sampling, this is the exposed
area of the sampler (membrane). See
SMTYP PS-*
No Yes for
passive
sampling
0–9
LNSMB Length of sampler (core) barrel (cm)
No
0–9
SPEED Speed (e.g., trawls) (knots)
No
0–9
PDMET Plankton (or eutrophication) sampling
depth method
http://vocab.ices.dk/?ref=38 No
See options
SPLIT Sample splitting technique http://vocab.ices.dk/?ref=50 No
See options
OBSHT Observation height (from surface) (meter)
No
0–9
DURAT Duration of haul (minutes)
No
0–9
DUREX Duration of exposure in days
No Yes for
passive
sampling
0–9
ESTFR Estimated water sampling rate (flow) in
liters per day
No Yes for
passive
sampling
0–9
AMAP Litter and Microplastics Monitoring Guidelines
203
4.3 Analytical techniques for the identification of microplastics AUTHORS: SEBASTIAN PRIMPKE, ANDY M. BOOTH, GUNNAR GERDTS, ALESSIO GOMIERO, TANJA KÖGEL, CHELSEA M.
ROCHMANN, BARBARA SCHOLZ-BÖTTCHER, AND JAKOB STRAND
4.3.1 Background
The analysis of microplastics (MP) is currently performed using different techniques ranging from
visual identification of the particles to a comprehensive chemical identification of the polymer type,
including additives and adsorbed substances. Based on published reviews (Ivleva et al., 2017; Zarfl,
2019; Primpke et al., 2020a), recommendations (Frias et al., 2018; Gago et al., 2018; Bessa et al.,
2019), and existing monitoring guidelines (GESAMP, 2019), we provide an overview of the available
techniques for analyzing MP with respect to environmental monitoring.
4.3.2 Optical identification methods
Microscopy
Microscopy-enhanced optical identification of MP in the visual spectrum is one of the most
commonly used identification methods. Visual identification of MP has been applied to a wide range
of matrices including:
• natural waters;
• sediments;
• soils;
• air (including street dust);
• wastewater treatment plant influent, effluent, and sludge;
• aquatic and terrestrial organisms; and
• human foodstuffs (e.g. table salt, honey, and beer; Primpke et al., 2020a).
In general, guidelines for the visual identification of MP (Lusher et al., 2020; Primpke et al., 2020a)
are provided based on visual parameters such as color, color distribution, shape, surface properties
such as light reflection, as well as the widths, length, and features of fibers. The majority of studies
sort MP into six shape categories: fragments, beads, pellets, films, foams, and fibers (OSPAR, 2015).
Previously, visual identification was often used solo, but yielded high misidentification rates if not
combined with chemical analysis (Hidalgo-Ruz et al., 2012). Even though most studies reported
detection limits of 100 µm or larger, (Primpke et al., 2020a), GESAMP only recommended visual
identification in the monitoring of marine ecosystems for particles > 1 mm. However, GESAMP does
suggest combining optical microscopy analyses with spectroscopy analyses (see Table 10.10 in
GESAMP, 2019). A similar approach was also suggested by Löder et al., 2017, including a size
fractionation pre-treatment step into larger (e.g., > 500 µm) and smaller particles (e.g., < 500 µm)
prior to sample extraction. Although the smaller particles require sample extraction, the larger
particles can be picked manually, assisted by optical microscopy, and identified chemically afterward.
Notably, data of the different studies were presented in highly varying size categories. Part of the
underlying reason for this may be the technical lower-size limitations imposed by the applied
filtration units for the extraction process. For comparability, harmonization of reported/measured size
fractions is necessary.

AMAP Litter and Microplastics Monitoring Guidelines
204
Compared to more advanced techniques, optical identification is inexpensive because the instrumental
costs are low (Primpke et al., 2020a). Combining optical microscopy with digital cameras for image
analysis further reduces the personnel costs associated with particle counting. In contrast to some
advanced methods, which have specific and costly filter substrate requirements, samples for optical
microscopy can be collected on inexpensive filter materials such as glass fiber or polycarbonate (PC).
The overall processing time of a filter imaged for MP was found to depend on the applied guidelines,
the filter size used, the sample type (e.g., sediment, surface water), the targeted size classes, and the
general distribution of particles (Cowger et al., 2020a; Primpke et al., 2020a; Thaysen et al., 2020).
For this method, it is important to consider human difficulties in differentiating non-polymeric
particles and natural polymer-based particles (e.g., chitin or wool) from MP of interest (see Figure
4.1), which may introduce a bias (Hidalgo-Ruz et al., 2012; Zarfl, 2019; Primpke et al., 2020a). Such
bias is dependent on the experience level of the investigators and is significantly reduced for very
experienced labs. If a chemical analysis of the material is not available, the materials can be tested on
their physical behavior by testing the particles with microforceps or a dissecting needle (Lusher et al.,
2020). Further, the thermal behavior of the particle can be investigated with a hot needle because
plastics melt at elevated temperatures. All these tests yield enhanced results compared to the
unassisted use of microscopy.
Nevertheless, the need for experience in the analysis and testing of such small particles increases with
the decreasing size of the particles. Furthermore, some reported guidelines for optical microscopy
identification of MP exclude the selection of particles exhibiting properties that make identification
challenging. This includes particles that are black, brown, white, or clear in color (Wiggin and
Holland, 2019). In such cases, the generated data will represent an incomplete picture of the true
levels of MP contamination. For monitoring at the current stage, this is an acceptable solution. Still, it
is critical that any datasets produced using such methods highlight these issues so that other
researchers and end users of the data are aware of the limitations and can account for this when
translating monitoring data into practical measures and mitigation actions.
Figure 4.1 Particles sorted as potential microplastics by optical microscopy further identified via
attenuated total reflection Fourier-transform infrared (ATR-FTIR) spectroscopy (Haave et al., 2019).

AMAP Litter and Microplastics Monitoring Guidelines
205
Fluorescent staining of microplastics for microscopy and preselection of particles
The use of fluorescent dyes to stain MP particles is increasingly applied to achieve faster selection of
particles and reduce researcher bias (Zarfl, 2019). Staining is typically conducted after any sample
fractionation or extraction steps have been conducted to minimize staining of the non-plastic organic
material. One of the most applied dyes for MP staining is Nile Red (NR; Andrady, 2011), which is
inexpensive and easy to handle. Recently published literature has demonstrated its application for
staining MP in various types of water samples, sands, sediments, biota samples, and atmospheric
deposition samples (Primpke et al., 2020a) for particle sizes from ≥ 300 µm down to 20–3 µm, thus
expanding the range achievable by optical microscopy (Primpke et al., 2020a; Figure 4.2).
Figure 4.2 Filter showing fluorescent microplastic particles after dyeing with Nile Red (left). Zoomed
region showing automated image analysis of individual particles down to ~10 µm. Images produced
by SINTEF Ocean.
The major drawback of using NR is its lipophilic nature and therefore its propensity to stain all lipid
materials present in a sample (e.g., derived from biota; Cooksey et al., 1987). For this reason,
comprehensive sample extraction and cleanup are necessary to remove any biogenic materials and to
avoid the potential misidentification of natural materials, e.g., lipid droplets and microorganisms, as
MP (Erni-Cassola et al., 2017; Wiggin and Holland, 2019). Currently, a wide variety of sample
extraction protocols are in use, including the application of oxidizing agents or enzymes (Primpke et
al., 2020a). Another pitfall to consider is that NR can precipitate as agglomerated particles if applied
in certain concentrations and solvents, which can lead to confusion with stained MP (A. M. Bienfait,
personal communication). Additionally, method harmonization is not conclusive at present, especially
because there are large differences between recommended optimum concentrations, with literature
values ranging from 0.1–2 µg mL-1 (Erni-Cassola et al., 2017) up to 1–1000 µg mL-1 (Maes et al.,
2017).
Nile Red was found to be an effective stain for various polymers ranging from polyethylene (PE),
polypropylene (PP), polycarbonate (PC), high-density polyethylene (HDPE), low-density
polyethylene (LDPE), polyurethane (PUR), expanded polystyrene (EPS), polyethylene-vinyl acetate
(PEVA), to polyamide (PA; Zarfl, 2019; Primpke et al., 2020a). Although there is some indication
that different polymer types stain sufficiently differently to allow a tentative identification (Maes et
al., 2017), a robust characterization equivalent to direct chemical identification methods is not
possible. Furthermore, the additional parameters like particle size, shape, and solvents used may alter
the staining behavior. Different staining efficiency percentages between 100% and 0%, with
AMAP Litter and Microplastics Monitoring Guidelines
206
variations of co-staining of biological material were obtained, depending on the polymer/solvent
combination (Shim et al., 2016; Tamminga et al., 2017). Importantly, the technique has limitations
with certain subclasses of MP, including those which are black in color, fibers, and rubber-based MP.
Recent work suggests low error rates if the particles undergo FTIR or Raman spectroscopy
subsequent to NR staining (Sutton et al., 2016; Maes et al., 2017), but the analysis that followed was
often rather time consuming compared (up to one hour for a single Raman spectrum) to other rapid
direct chemical identification methods. Still, NR staining is a promising technique to highlight
potential particles and guide researchers (Klein and Fischer, 2019) or technical applications toward
particles of interest.
4.3.3 Chemical analysis techniques
Accurate and robust chemical identification of MP is crucial for studies such as ecotoxicological risk
assessment because the chemical nature of the particles influences the nature of the toxic effect on
organisms that have ingested them (Avio et al., 2015; Booth et al., 2016; Rochman et al., 2017; Kögel
et al., 2020). Several analytical techniques are available that use either spectroscopy or thermal
degradation coupled with gas chromatography-mass spectrometry-based methods for the
identification of MP. The main methods used for identifying MP in environmental samples are
described briefly below.
Fourier-transform infrared spectroscopy for microplastic analysis
Fourier-transform infrared spectroscopy (FTIR) produces a spectral pattern, called IR-spectrum,
representing a fingerprint of the polymer types. The obtained spectra are analyzed by comparison with
reference spectra for each polymer type. Those reference spectra are compiled in spectral libraries.
Recently, 161 publications applying FTIR for MP analysis from environmental samples were
summarized (Primpke et al., 2020a). These studies used a range of different FTIR technologies,
including analysis based on single particles, via handhelds, fiber optics, microscope supported
systems (µFTIR) or applied single particle, and µFTIR analysis on separate instruments. For 58% of
the studies, attenuated total reflection (ATR)-FTIR on single selected particles (see Figure 4.3) was
the method of choice. No sample preparation or mathematical correction are necessary by the operator
for this method (Primpke et al., 2020a). Particles are placed in contact with the instrument’s crystal,
which is relatively fast, and the analysis is performed without requiring advanced skills by the
operator. Spectral analysis is normally followed by library searches (Renner et al., 2019a) via spectral
correlation or approaches like machine learning (Renner et al., 2017, 2019b; Hufnagl et al., 2019;
Kedzierski et al., 2019).
FTIR microscopy (µFTIR)
In contrast to single particle FTIR, µFTIR combines microscopic imaging and particle-size
determination with FTIR. Individual particles down to sizes of ca. 10 µm can be detected. The term
µFTIR covers a small range of FTIR analysis techniques. Thus, microscopes are often coupled with
an attenuated total reflection (ATR) unit for the selective analysis of either small particles or areas on
larger particles. Independent from the ATR unit, reflection and transmission FTIR are applied to
particles using various types of FTIR spectrometers (Primpke et al., 2020a).

AMAP Litter and Microplastics Monitoring Guidelines
207
Figure 4.3 a) Particle identified via attenuated total reflection Fourier-transform infrared (ATR-FTIR)
spectroscopy using siMPle (Primpke, 2020b) from a sample from the Bergen Fjord (Haave et al.,
2019). b) Analysis of the < 500 µm fraction of the same sample from the Bergen Fjord investigated
via µFTIR imaging (Haave et al., 2019).

AMAP Litter and Microplastics Monitoring Guidelines
208
The following drawbacks need to be considered when deciding which method to apply.
• ATR-FTIR microscopy requires long total sample measurement times because individual
particles need to be placed into the system manually. There is also a high risk of sample
contamination and loss.
• µFTIR in transmission mode may be unable to detect particles because of total absorption of
the IR beam for thick particles.
• µFTIR in reflection mode is only suitable on surfaces with IR beam reflective properties,
which limits its applicability for smaller or dark-colored particles.
With decreasing particle size samples, handling becomes increasingly difficult. To avoid sample loss,
all particles of interest are concentrated onto membrane filters, reflective slides, or IR transparent
slides and windows. Various types of membrane filters like metal-covered PC filters (Cabernard et al.,
2018) and silicon membranes are used (Käppler et al., 2015, 2016), but aluminum oxide filters are the
most widely applied (Löder et al., 2015; Primpke et al., 2020a).
Despite the characterization power of FTIR spectroscopy approaches, some limitations remain.
Determining the location of potential particles on the filters/slides can be challenging, although
different methodologies are available, starting with the preselection of particles by visual
identification (Cincinelli et al., 2017; Phuong et al., 2018), selection and counting by particle finders
(Palatinus et al., 2019; Renner et al., 2019c; Brandt et al., 2020), or the complete spectroscopic
imaging of the filter area (Löder et al., 2015; Tagg et al., 2015). Furthermore, no particles on the
filter/slide should overlap to avoid sequestration and misidentification of particle sizes and numbers.
For these reasons, combined with the high number of particles in some samples, often only a fraction
of the total extracted sample can be investigated within one measurement (Cabernard et al., 2018).
Additionally, large numbers of particles increase measurement times. Staining methods for a pre-
screening are reasonable and seem not to influence the IR-based analysis.
µFTIR via hyperspectral imaging
To avoid staining or to achieve defined measurement times per sample in routines, chemical imaging
(µFTIR) is the method of choice. All particles are analyzed, even if they form particle clusters. In
principle, imaging can be performed by any FTIR microscope equipped with single element mercury
cadmium telluride (MCT) detectors, but measurement times increase significantly with imaged filter
area (Harrison et al., 2012; Vianello et al., 2013). These limitations are reduced by hyperspectral
imaging via focal plane array (FPA) detectors, which currently can collect up to 128 x 128
spectra/pixels within a single scan (Löder et al., 2015; Tagg et al., 2015). These systems currently
represent the state of the art in MP analysis because they allow fast, effective identification and
quantification of MP, as demonstrated for different ecosystems and waste management systems
(Primpke et al., 2020a). This type of analysis generates large numbers of spectra (e.g., 1.5 to 3
million), which can be analyzed with the help of false color images or semi-automated data analysis
(Primpke et al., 2020a). To overcome limitations by manufacturers and differing databases for library
searches, open source software tools are available, which have the additional advantage of
harmonizing MP analysis (Primpke et al., 2020a, b).
Raman spectroscopy for microplastic analysis
The analysis of MP via Raman spectroscopy allows measurement of particles down to 1 µm in size.
Although Raman spectroscopy is typically considered non-destructive, the method uses a focused

AMAP Litter and Microplastics Monitoring Guidelines
209
laser beam that may cause damage to the analyzed particles, which increases in severity with the
speed of analysis because more energy is focused on the same small area. Measurements are
performed on the particle surface due to inelastic laser light scattering; photons interact with
molecules, which either absorb or lose energy during this process. The obtained vibrational spectra
are complementary to FTIR because of different selection rules for this process. Similar to the
interpretation of the FTIR spectra, the chemical/polymer identification is performed by library
searches. Most Raman spectrometers are connected to microscopes, which increases the spatial
resolution and allows the determination of particle numbers, shape, size, and polymer type within a
single measurement (Cabernard et al., 2018).
Similar to FTIR, larger particles (> 500-300 µm) can be isolated prior to filtration and targeted as
single particles. The measurement of single particles is often performed on highly reflective surfaces
to avoid background signals from the support materials. Highly recommended for this application are
metal-coated mirrors, aluminum sheets, or coated slides (Oßmann et al., 2017). Similar approaches
can also be used for automated particle identification on filter membranes (Frère et al., 2016),
especially for smaller MP (< 20 µm). The filters are commonly metal-coated PC membranes
(Oßmann et al., 2017, 2018; Araujo et al., 2018; Cabernard et al., 2018; Schymanski et al., 2018) or
silicon membranes (Käppler et al., 2015, 2016). Raman spectroscopy is one of the few methods to
characterize particles successfully down to 1 µm (Oßmann et al., 2018) in simple matrices like
drinking water, while in more complex sample matrices identification of particles > 5 µm has been
demonstrated (Imhof et al., 2016; Käppler et al., 2016; Cabernard et al., 2018; Oßmann et al., 2018;
Schymanski et al., 2018). Furthermore, it has been proposed that the technique might be able to
measure particles in the nanoplastics size range (< 1 µm; Schwaferts et al., 2019). Raman
spectroscopy has the advantage that each particle will be documented by shape and size, which allows
for immediate calculation of particle numbers, as well as size and shape distributions. These processes
can be automatized using a particle-finder mechanism to determine particle shape, size, and polymer
type, which helps to reduce both researcher bias and measurement time (Frère et al., 2016; Cabernard
et al., 2018). Or, the entire filter area can be measured by the imaging system.
However, this approach still has long measurement times. Measurement times differ highly between
studies from just a few seconds to almost an hour for single particles (Primpke et al., 2020a). Sample
analysis times range from several days to weeks for small MP (< 10 µm) because they typically occur
in high particle numbers (> 1000 particles per filter; Primpke et al., 2020a). To circumvent such long
measurement times, sometimes only partial analysis of the filter membranes (0.1–30% of the area) is
performed (Cabernard et al., 2018; Oßmann et al., 2018; Schymanski et al., 2018). However, a
controlled method for ensuring representative analysis of sample subfractions is currently lacking.
Compared to targeted particle analyses assisted by particle finders, imaging the whole filter area
allows the identification and characterization of more particles in the same sample (Käppler et al.,
2016; Araujo et al., 2018), similar to FTIR imaging. However, the measurement times required for
Raman imaging are significantly longer than those required by FTIR imaging. For example, an area of
1 mm2 had a scanning time of 38 h for a measurement at 10 µm resolution (Käppler et al., 2016). This
is considerably longer than for FTIR, which is capable of comparable imaging within minutes. A
promising approach for faster measurements by stimulated Raman scattering (Zada et al., 2018)
decreases the time significantly but is limited to particles in 12 μm resolution and is only suitable for a
few polymer types. On the positive side, compared to FTIR, in Raman spectroscopy plenty of
parameters can be adjusted to improve the signal to noise ratio, including spectral range, excitation
wavelength, the applied objective, resolution, and the number of accumulations.
AMAP Litter and Microplastics Monitoring Guidelines
210
In conclusion, for routine bulk sample analysis, Raman is much slower than FTIR microscopy.
However, Raman has the capability to identify niche polymers and smaller size classes, if time plays a
subordinated role.
Thermoanalytical methods combined with gas chromatography and mass spectrometry
Thermal degradation methods of various modifications and combinations are versatile analytical
techniques that have a long tradition in the field of polymer producing and processing industry, as
well as polymer analysis (Wampler, 2006; Tsuge et al., 2011; Kusch, 2012, 2014; Kusch et al., 2013).
A comprehensive collection of pyrolytic data for polymers (more than 165) is given by Tsuge et al.
2011. Although thermal methods are destructive, they can be preceded by optical chemical
identification such as FTIR or Raman where required.
For these MP identification methods, polymers are broken down into polymer-specific degradation
products at elevated temperatures and under exclusion of oxygen. Volatile components are separated
on a gas chromatographic (GC) column, allowing for rough analysis. Additional coupling to a mass
spectrometer (MS) enables the specific identification of all generated compounds and the potential for
quantification.
The most established techniques for the systematic decomposition of polymers are online pyrolyzers
coupled with gas chromatography mass spectrometry (py-GC/MS) and thermogravimetric analyzers
(TGA) combined with evolved gas analysis (EGA). The latter can be performed with different types
of detection systems. There are three common types of pyrolyzers (Wampler, 2007), which differ in
terms of temperature generation and mode of operation, heat transfer, and available sample targets
crucial for sample capacity:
• Filament pyrolysis can operate isothermally or with a temperature program. It typically uses
open or semi-closed quartz tubes that are placed in a heated platinum coil (Fries et al., 2013;
Dekiff et al., 2014; Nuelle et al., 2014).
• (Micro)furnace pyrolysis can operate isothermally or with a temperature program. The
samples are transferred into stainless steel cups that are heated in a ceramic oven (ter Halle et
al., 2016; Hermabessiere et al., 2018; Käppler et al., 2018; Fischer and Scholz-Böttcher, 2019;
Gomiero et al., 2019).
• Curie point (CP) pyrolyzers perform exclusively isothermally. They use wires or semi-closed
ferromagnetic targets. Their alloy defines a discrete, exact pyrolytic temperature that is almost
instantaneously reached when placed in a high-frequency coil chamber. Alloys are available
for a broad temperature range (Fischer and Scholz-Böttcher, 2017).
The theoretical sample capacity of the targets ranges between 1.5 mg (CP) to 50 mg (micro furnace).
Realistic sample volumes are around 1 mg or less for optimal operating conditions. Filament systems
(temperature programmed heating) and micro furnace pyrolyzers (double shot option) enable a
stepwise analysis of samples in which low molecular organic additives, monomers, and accumulated
smaller organic contaminants can be desorbed from the sample in a first moderate heating program
(ideally combined with a cryo-focusing unit) before pyrolysis is performed under polymer
decomposition conditions. This type of sample processing makes valuable, additional information
accessible.
In TGA, a polymer decomposes during a controlled heating process, in which the weight of the
polymer changes in a characteristic way and can be recorded as a function of temperature. The

AMAP Litter and Microplastics Monitoring Guidelines
211
generated decomposition gases can be analyzed and used for polymer identification (Tsuge et al.,
2011; Seefeldt et al., 2013). A special form of TGA is the recently introduced TED (thermo extraction
desorption)-GC/MS (Dümichen et al., 2015, 2017, 2019). The decomposition gases are adsorbed and
concentrated on a solid phase absorber bar and subsequently desorbed and transferred into a GC/MS.
The sample capacity in TED-GC/MS is stated as 100 mg.
Thermal polymer identification combined with GC/MS coupling
For MP identification in complex environmental samples, the high compound resolution power of
GC/MS coupling offers higher analytical potential compared to pure EGA techniques. Irrespective of
the pyrolytic system, all thermal methods working with a GC/MS coupling rely on the same principle
of polymer identification. Polymeric compounds degrade under the exclusion of oxygen and defined
temperature conditions into several products, characteristic of different polymer types. The volatile
components undergo GC separation prior to identification by MS. The resulting characteristic
pyrogram acts as a fingerprint for identifying the polymer types (Figure 4.4). The MS analysis
provides a detailed chemical characterization of the respective products when this is required. To
generate a diagnostic pyrogram, a minimum of 1-10 µg polymers are typically necessary, although
individual particles with a mass of 0.3 µg isolated from a sediment sample have been successfully
identified (Käppler et al., 2018).
Figure 4.4 Example “fingerprint” pyrograms (total ion current chromatograms, py-GC/MS coupling)
of an isolated PE (52 µg) and PS (20 µg) particle, respectively. Source: Scholz-Böttcher, unpublished.

AMAP Litter and Microplastics Monitoring Guidelines
212
Specific pyrolysis products and combinations of pyrolysis products are characteristic for a given
polymer, meaning good chromatographic separation allows simultaneous detection and identification
of multiple polymers when present as a mixture. For this purpose, the retention time data of
characteristic polymer degradation products and characteristic indicator ion(s) from their respective
mass spectra are extracted in an ion chromatogram, representative for each polymer. Py-GC/MS has
been applied successfully for the simultaneous detection of up to 10 different polymers in various
complex matrices (Fischer and Scholz-Böttcher, 2017, 2019; Gomiero et al., 2020; Primpke et al.,
2020c). Equally, the application of TED-GC/MS has successfully identified synthetic polymers in
complex environmental samples (Dümichen et al., 2015, 2017; Eisentraut et al., 2018).
The limits of detection (LOD) range at the nanogram level are polymer- and indicator ion-dependent
and closely related to the sensitivity of the GC/MS system (Fischer and Scholz-Böttcher, 2019). To
avoid high background signals masking the target analyte signals and efficiently reducing sample
volume, the application of py-GC/MS to environmental samples requires an adequate pre-treatment to
remove and reduce accompanying inorganic and organic matrices (Fischer and Scholz-Böttcher, 2017,
2019; Gomiero et al., 2020). For application on environmental samples, MP extracts are concentrated
on glass fiber or ceramic (e.g., anodisc) filters (Fischer and Scholz-Böttcher, 2017, 2019; Gomiero et
al., 2019; Primpke et al., 2020c). The derivatization agent tetramethylammonium hydroxide (TMAH)
has been successfully used to increase the detection sensitivity of MP by py-GC/MS (Challinor, 2001;
Fischer and Scholz-Böttcher, 2017).
Thermal polymer quantification combined with GC/MS coupling
Using external calibration, integration of the selected indicator ion(s) leads to the corresponding mass
of the respective polymer in a given sample. This mass reflects the “bulk” concentration of the
respective polymer in the sample because py-GC/MS does not distinguish, e.g., between pure
polymer, co-polymer, or other admixtures (cf. Fischer and Scholz-Böttcher, 2017, 2019). The
resulting mass-related data are independent from any kind of particle properties such as shape, size,
density, texture, surface aberrations, color, brightness, opacity, or weathering. Microplastics
quantification requires an adequate digestion cleanup step to ensure subsequent chromatographic
performance and data quality, especially with an increasing content of non-plastic organic material
(OM) in a sample (Fischer and Scholz-Böttcher, 2019).
In TED-GC/MS, only the trapped gaseous products of the pyrolyzed sample (via TGA) are analyzed
via GC-MS after subsequent thermal desorption. Thermogravimetric analyzer sampling cups enable a
direct sample measurement for MP if its content exceeds 0.4% w/w (Dümichen et al., 2015, 2017;
Eisentraut et al., 2018). A high organic content in the sample matrix can perturb the analytical
performance. With TED-GC/MS, the opportunity to reduce OM a certain extent by sequential heating
and discarding products generated below specific temperatures is offered (e.g., 350 °C). Although this
can eliminate products that originate from more thermolabile natural OM, it also risks the loss of more
thermolabile polymers (e.g., PVC).
The limits of quantification (LOQ) have been identified as being below 1 µg (Fischer and Scholz-
Böttcher, 2019). However, LOQs are determined more by the GC/MS-system than by the pyrolysis
method employed. Usually, the MP content of environmental samples is in the ppm range and below
(Fischer and Scholz-Böttcher, 2019), making preconcentration of the extract prior to analysis
indispensable. Lower detection and quantification limits combined with higher substance selectivity
may be reached by using triple quadrupole GC/MS or by coupling of the py-GC system to a high-
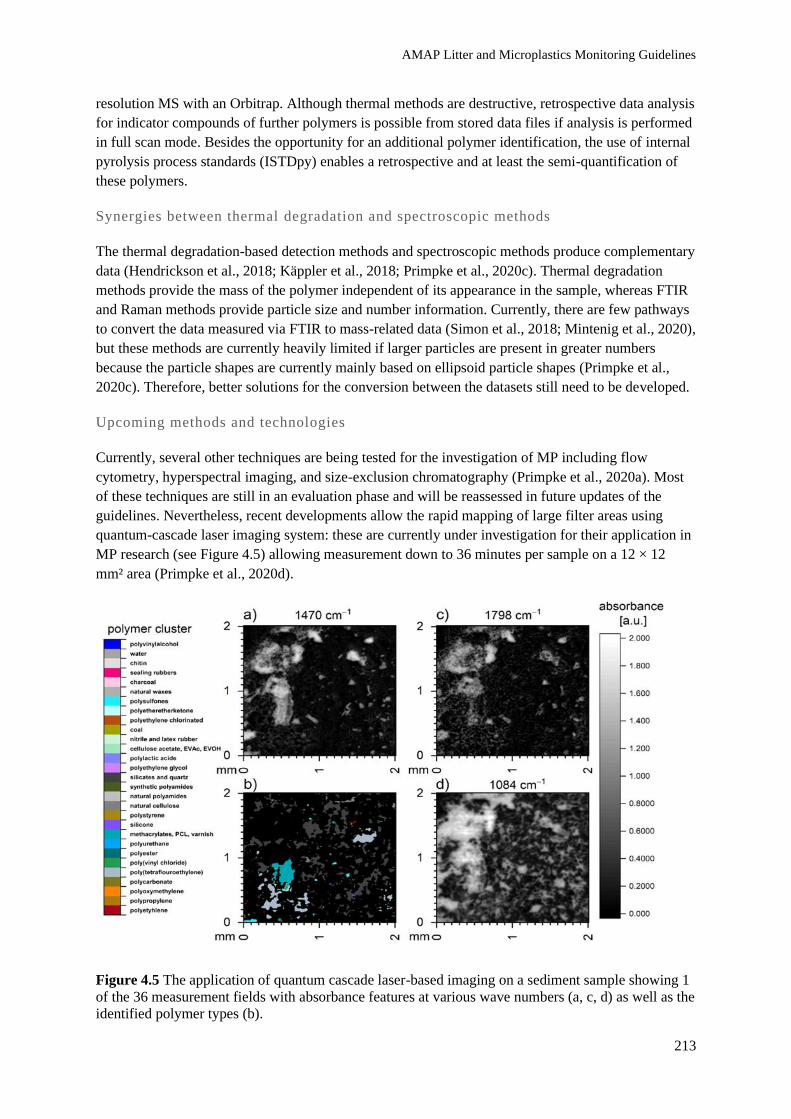
AMAP Litter and Microplastics Monitoring Guidelines
213
resolution MS with an Orbitrap. Although thermal methods are destructive, retrospective data analysis
for indicator compounds of further polymers is possible from stored data files if analysis is performed
in full scan mode. Besides the opportunity for an additional polymer identification, the use of internal
pyrolysis process standards (ISTDpy) enables a retrospective and at least the semi-quantification of
these polymers.
Synergies between thermal degradation and spectroscopic methods
The thermal degradation-based detection methods and spectroscopic methods produce complementary
data (Hendrickson et al., 2018; Käppler et al., 2018; Primpke et al., 2020c). Thermal degradation
methods provide the mass of the polymer independent of its appearance in the sample, whereas FTIR
and Raman methods provide particle size and number information. Currently, there are few pathways
to convert the data measured via FTIR to mass-related data (Simon et al., 2018; Mintenig et al., 2020),
but these methods are currently heavily limited if larger particles are present in greater numbers
because the particle shapes are currently mainly based on ellipsoid particle shapes (Primpke et al.,
2020c). Therefore, better solutions for the conversion between the datasets still need to be developed.
Upcoming methods and technologies
Currently, several other techniques are being tested for the investigation of MP including flow
cytometry, hyperspectral imaging, and size-exclusion chromatography (Primpke et al., 2020a). Most
of these techniques are still in an evaluation phase and will be reassessed in future updates of the
guidelines. Nevertheless, recent developments allow the rapid mapping of large filter areas using
quantum-cascade laser imaging system: these are currently under investigation for their application in
MP research (see Figure 4.5) allowing measurement down to 36 minutes per sample on a 12 × 12
mm² area (Primpke et al., 2020d).
Figure 4.5 The application of quantum cascade laser-based imaging on a sediment sample showing 1
of the 36 measurement fields with absorbance features at various wave numbers (a, c, d) as well as the
identified polymer types (b).
AMAP Litter and Microplastics Monitoring Guidelines
214
4.3.4 Outlook: promising methods for small plastic particle (< 10 µm) quantification
Many studies on physiological effects use pristine spherical, either heavily colored or fluorescent-
labeled MP. This allows for the traceability of such particles in the body, using microscopy down to
the micro- or nanoscale (Huffer et al., 2017). However, in the environment, MP are not pre-labeled.
Therefore, chemical identification is necessary. Chemical imaging methods for MP have lower
detection limits for single particles compared to fluorescent imaging, ranging between below 1 µm for
Raman technologies and up to 20 µm for some FTIR technologies (Huffer et al., 2017). The best
FTIR microscopes have a particle-size detection limit in the low µm range (2.5–5 µm). However,
practically applied and published limits so far seem to be around 10 µm for µFTIR imaging (Mintenig
et al., 2017, 2019; Primpke et al., 2017; Simon et al., 2018). Raman microscopy comes with the
drawback of being slow. Because of the energy applied to the particle, increasing speed destroys the
plastic. This problem can be circumvented by a flow-through technique, immersing each particle in a
focused stream of water (S. Gallager, Woods Hole Oceanographic Institute, MA, USA, personal
communication). Additionally, Raman output is often hampered by increased fluorescence (Elert et
al., 2017). However, promising approaches might overcome this problem by Time Domain Raman
Spectroscopy (S. Gallager, personal communication). With these techniques, a chemical identification
can be combined with an overview of the particle-size distribution down to the small µm size range.
The investigation of physiological effects associated with the smaller micro- and nanoplastic particles,
including reliable risk assessments, may be improved by the application of nuclear isotope techniques
to investigate consequences associated with plastic particles including their accumulation,
translocation, and trophic transfer (Lanctôt et al., 2018). Such methods might allow the tracing of
particles without prior tagging.
Conclusions
Most discussed methods necessitate a comprehensive extraction of MP from the sample. Procedures
are difficult and time consuming, and particles are lost in the procedure, increasingly so with
decreasing particle size. There are quantification approaches circumventing extraction, chemometric
approaches combined with mass spectrometry, and thermal extraction desorption gas chromatography
mass spectrometry (TED-GC/MS). These apply an array of gravimetry, passive sampling of the
evaporate, and chemical characterization, which may help with the identification in a complex
substance (Dümichen et al., 2017), but this analytical approach is not suitable for environmental
samples in which typically low concentrations of MP meet an excess of complex inorganic and
organic natural matrices. Here, high detection sensitivity and reliability are requested by the research
community/legislation bodies from the instrument and protocol developers, and any matrix
interferences should be excluded. In particular, regarding thermal methods, high-organic matrix loads
might lead to severe interferences. Overall, the accompanying matrix determines the extraction effort
before any specific MP analysis. The detection limits in terms of mass/sample mass are relatively
large, rendering the method unsuited for food safety approaches, but potentially valuable for samples
very low in accompanying organic material.
4.3.5 Guidelines for the identification of microplastics
Considerations regarding the costs of the analysis
The analysis of MP can be assumed to be expensive either because of instrument costs or personnel
demands. In a recent study, such factors were assigned to the different techniques (see Table 4.2).

AMAP Litter and Microplastics Monitoring Guidelines
215
Table 4.2 Cost estimation for the presented analytical techniques ranging from optical methods toward chemical analysis. Reproduced from Primpke et al., 2020a.
Methods Unit Naked
eye
Optical microscopy
Nile red
staining
FTIR qualitative
Particle
based
µFTIR
µFTIR
imaging
Raman qualitative
Particle
based
µRaman
Py-GC/MS qualitative
Quantitative Py-GC/MS
TED-GC/MS
LOD 1 mm 100 µm 3-20 µm > 300 µm 25 µm 10 µm > 300 µm 1 µm ~1 µg IP << 1 µg PD < 1 µg PD
Instrument
costsa
$k < 1 2-3 2-50 25-50 100-125 200-250 50-100 200-400 > 150 > 215 >250
Special
consumables
Dye and solvent
Liquid nitrogen
Liquid nitrogen
GC- Columns and filaments
GC- Columns and filaments
GC- Columns and filaments
Field
applicability
Good Good No Handheld No No Handheld No No No No
Limitations NoID NoID, NoM,
PA/SA
NoID, NoM,
PA/SA
TA, NoM TA, NoM PA/SA
NoM
NoN, NoS NoN, NoS
Automated
data
evaluation
No No No* No Yes Yes Yes** Yes No No*** No***
Measurement
timeb
min 1 60 35 1 360 240 2 2580 - >
10000
35-120 120 120
Data analysis
timeb
min NA 1 60 360 1 1 5-10 60**** 60****
Working timeb min 1 60 35 2 120 60 3 60 - 580 5 30 (qual.) 72
(quant.)****
30 (qual.) 72
(quant.)****
Typical
fractions per
sample
50 P 7 F 7 F 50 P 1 F 1 F 50 P 1 F 50 P 1-5 CQ 1- 5 CQ
Instrument
availability for
analysisc
d 261 261 261 250 250-261 250-261 250-261 250-261 250 250 250
Average
working time
per sample
min PND 420 245 PND 120 60 PND 60 PND 72-216 72-216
Field of
application
MD,
MO
MD, MO, R MD, MO, R MD, MO,
R, RA, RE
MD,
MO, R,
RA, RE
MD, MO,
R, RA, RE
MD, MO,
R, RA, RE,
MD, MO, R,
RA, RE
MD, MO, RE, MD, MO, R,
RE
MD, MO, R, RE
aRaw estimates may strongly vary, depending on the country. b Calculated for one filter/particle per analysis. cWorking days (normal work hours/days, maximal 261 if a 2-day weekend applies)
exclusive instrument maintenance time.
Note: CQ: pyrolysis cubs or quartz tubes; F: filters; IP: isolated particle; LOD: limits of detection; LID: limited chemical identification; MO: monitoring; MD: modeling; NoID: no chemical
identification; NoM: no mass determination; NoN: no particle number determination; NA: no information available; NoS: no particle sizes determination; R: routine; RA: risk assessment; RE:
research; PA/SA: partial analysis/subsampling analysis on filter; P: particle; PD: polymer dependent; PND: particle number dependent; REP: replicates; TA: total absorption.* image analysis
possible, ** for Raman microscopes, *** autosamplers are available, **** calculated based on a micro-furnace system with an average sequence size (6 standards, 10 samples).

AMAP Litter and Microplastics Monitoring Guidelines
216
Although optical microscopy is inexpensive from an instrumental point of view and can be easier to
use in the field or on a research vessel, the personnel demand is rather high because of the number of
potential samples to be analyzed. Futhermore, optical microscopy is prone to a human bias and
dependent on the application of strict and harmonized identification guidelines. Chemical
identification by microscopy-spectroscopy, on the other hand, is rather expensive from the
instrumental side, but the personnel costs are lower; the net analysis time is approximately 1-2 hours
per sample compared to 4-7 hours using optical microscopy (even supported by dye staining). In the
case of monitoring in the Arctic, a good compromise between chemical accuracy, field work
applicability, and costs needs to be defined. From the Monitoring Guidelines, the following individual
needs were derived (see Table 4.3).

AMAP Litter and Microplastics Monitoring Guidelines
217
Table 4.3 Summary of the demanded data accuracy for monitoring in the individual compartments for the different size classes. Matrix Number Mass Size Subsampling
recommended
Size and shape Color Chem-ID
Air Mandatory - < 300 µm No* Mandatory - Yes
Water Mandatory - 5000 - 300 µm For Chem-ID Nice to have Nice to have Yes (1 mm - 300 µm)
**
Water Mandatory - < 300 µm down to
LOD
Nice to have Nice to have Nice to have Nice to have
Sediments Mandatory Nice to have 5000 - 300 For Chem-ID Mandatory mandatory Yes (1 mm - 300 µm)
**
Sediments Nice to have Nice to have 300 - down to
LOD
For Chem-ID Mandatory mandatory Nice to have
Ice x Nice to have 5000 - 300 - Mandatory mandatory Yes (1 mm - 300 µm)
**
Ice Nice to have Nice to have 300 - down to
LOD
- Nice to have Nice to have Nice to have
Shorelines*** Mandatory > 25 mm Not defined Not defined Not defined Not defined
Soils Mandatory - 5000 - 300 µm Yes Yes Yes Nice to have
Biota Mandatory - > 100 µm For Chem-ID? Mandatory Nice to have Yes
Fish Mandatory Mandatory > 500 µm
For Chem-ID Size mandatory,
shape beneficial to
have
Nice to have Yes (1 mm - 500 µm)
**
Fish Beneficial Beneficial < 500 µm For Chem-ID Size beneficial to
have/to be
developed, shape
beneficial to have
Nice to have Yes (1 mm - 500 µm)
**
Bird Mandatory Mandatory 5000 - >300 µm For Chem-ID Nice to have Nice to have Yes (1 mm - 300 µm)
**
Mammal Mandatory Mandatory > 2.5 cm - 300 µm For Chem-ID Size mandatory,
shape Nice to have
Nice to have Yes (1 mm - 300 µm)
**
Mammal Nice to have Nice to have < 300 µm to LOD For Chem-ID Nice to have Nice to have Nice to have
*Subsampling should be avoided, ** Analysis of at least a subsample, *** No MP define.

AMAP Litter and Microplastics Monitoring Guidelines
218
Implications for reporting on microplastics
A diverse range of methods and non-standardized approaches have been developed and implemented
by researchers for reporting MP sample collection, extraction, and analysis, along with a range of data
reporting formats. These methods are often insufficiently described or exhibit key differences that
result in many studies being neither comparable nor reproducible. Each method has its strengths and
weaknesses, and there are continued efforts to optimize existing methods and develop new ones that
may improve throughput, detection limit, and reproducibility. Trying to find optimized approaches
has led to the rapid evolution of the methods applied in the last few years.
Unfortunately, one outcome has been the inability to answer larger-scale questions related to MP
pollution. As this new research field evolves, it is striving to establish a harmonized community
approach to developing, applying, and reporting methodologies. A recent publication has provided a
comprehensive set of recommendations and guidelines for the reporting of MP data that aims to
increase the reproducibility and comparability between studies (Cowger et al., 2020b). We
recommend that the same methodological approaches and data reporting criteria are recommended in
the AMAP Guidelines to help achieve harmonization across MP studies conducted by different
research groups around the world.
Key goals for MP monitoring in the Arctic:
• Identifying and addressing key reproducibility and comparability problems and solutions for
MP research;
• Identifying and prioritizing key methodological parameters;
• Implementing reporting guidelines for researchers to use when reporting, comparing, and
developing methods.
Figure 4.6 shows the Mind Map produced by Cowger et al., 2020b in which general method groups
flow from the primary term “Microplastics Reporting Guidelines.” These general groups are further
refined by subgroups of method types and instrument groups in which the terminal node of every
branch leads to essential methodology elements (italicized) that should be reported. Each reporting
guideline is described by an explanation, reasons to report, and/or examples from published MP
literature. The interactive Mind Map is available as an Open Science Framework project (OSF) in
which users (including users of these AMAP Guidelines) can access more details.

AMAP Litter and Microplastics Monitoring Guidelines
219
Figure 4.6 Mind Map showing the components and flow of reporting guidelines for microplastic
studies. The first nodes, branching off “Microplastic Reporting Guidelines,” are the general groups of
the guidelines, subgroups follow in bold until the second to last nodes are the reporting guidelines (in
italics), and the terminal node is the description of the guideline. Reproduced from Cowger et al.
(2020b).
Tables 4.4 to 4.8 summarize the information and data reporting recommendations presented in the
Cowger et al. (2020b) publication.
Table 4.4 Components to report in all procedures.
Parameter Reporting requirements
Materials ● All manufacturers of materials and instruments and their calibration
● All software used and their calibration
Quality
assurance/quality
control
● Error propagation (how instrumental, methodological, and/or statistical error were
propagated)
● Replicates (number of replicates; how replicates were nested within samples)
● Limit of detection (quantitative detection threshold; plastic morphology, size, color, and
polymer limitations of method; method of accounting for non-detects)
● Procedural: blank controls (number of controls; characteristics of plastics found in blanks
with the same rigor as samples; potential sources of contamination; point of entry and exit
to method)
● Positive controls/recovery tests, ideally with the same particle quality as the analytes
(morphology, size, color, and polymer type of positive controls; positive control correction
procedure; point of entry and exit to method)
● Contamination mitigation (clothing policies; purification technique for reagents; glassware
cleaning techniques; containment used (e.g., laminar flow cabinet/hoods, glove bags)
Data reporting ● Share raw data and analysis code as often as possible

AMAP Litter and Microplastics Monitoring Guidelines
220
Table 4.5 Field sampling procedures.
Parameter Reporting requirements
Field sampling
● Where (e.g., region) and when (e.g., date, time) the sample was collected
● Size (e.g., m3, kg) and composition (e.g., sediment, water, biota) of the sample
● Location at the site that sample was collected (e.g., 3 cm depth of surface
sediment)
● Sample device dimensions and deployment procedures
● Environmental or infrastructure factors that may affect the interpretation of
results
● How samples are stored and transported
Table 4.6 Sample preparation.
Parameter Reporting requirements
Homogenization ● Homogenization technique
Splitting/subsetting ● Sample splitting/subsetting technique
Drying ● Sample drying temperature and time
Synthesized plastic
● Synthesized plastic polymer, molecular characteristics, size, color, texture, and
shape
● Synthesized plastic synthesis technique
Fluorescent dye ● Dye type, concentration, and solvent used
● Dye application technique
Sieving strategy ● Sieve mesh size
● If the sample was wet or dry sieved
Density separation
● Concentration, density, and composition (e.g., CaCl2, ZnCl) of solution
● Time of separation
● Device used
Digestion
● Duration and temperature of digestion
● Digestion solution composition
● Ratio of digestion fluid to sample
Filtration ● Filter composition, porosity, diameter

AMAP Litter and Microplastics Monitoring Guidelines
221
Table 4.7 Microplastic identification
Parameter Reporting requirements
Visual identification –
imaging settings
● Imaging settings (e.g., contrast, gain, saturation, light intensity)
● Magnification (e.g., scale bar, 50X objective)
Visual identification –
light microscopy
● Magnification used during identification
● Shapes, colors, textures, and reflectance used to differentiate plastic
Visual identification –
fluorescence
microscopy
● Magnification used during identification
● Fluorescence light wavelength, intensity, and exposure time to light source
● Threshold intensity used to identify plastic
Visual identification –
scanning electron
microscopy (SEM)
● Coating used (e.g., metal type, water vapor)
● Magnification used during identification
● Textures used to differentiate plastic
Chemical
identification -
pyrolysis gas
chromatography mass
spectrometry (py-
GC/MS)
● Pyrolysis gas, temperature, duration
● additional techniques (if performed), e.g., online thermochemolysis/pyrolytic
derivatization
● GC oven, program, temperature, carrier gas, and column characteristics
● MS ionization voltage, mass range, scanning frequency, and source/analyzer temperature
● Referred polymer specific indicator products, py-GC/MS matching criteria (i.e., match
threshold, linear retention indices (LRI), and Kovats indices)
● Py-GC/MS quantification techniques
Chemical
identification - Raman
spectroscopy
● Acquisition parameters (i.e., laser wavelength, hole diameter, spectral resolution, laser
intensity, number of accumulations, time of spectral acquisition)
● Pre-processing parameters (i.e., spike filter, smoothing, baseline correction, data
transformation)
● Spectral matching parameters (i.e., spectral library source, range of spectral wavelengths
used to match, match threshold, matching procedure
Chemical
identification -
Fourier-transform
infrared spectroscopy
(FTIR)
● Acquisition parameters (i.e., mode of spectra collection, accessories, crystal type,
background recording, spectral range, spectral resolution, number of scans)
● Pre-processing parameters (i.e., Fourier-transformation (FT) parameters, smoothing,
baseline correction, data transformation)
● Matching parameters (i.e., FTIR spectral library source, match threshold, matching
procedure, range of spectra used to match)
● Differential scanning calorimetry (DSC)
● Acquisition parameters (i.e., temperature, time, number of cycles)
● Matching parameters (i.e., parameters assessed, reference library source, comparison
technique)
Table 4.8 Categorization and quantification.
Parameter Reporting requirements
Categorization ● Shape, size, texture, color, and polymer category definitions
Quantification
● Units (e.g., kg, count, mm)
● Size dimensions (e.g., Feret minimum or maximum)
● Quantification techniques
The generated data in the number of MP or mass of polymer/s should be stored with as much detailed
information as possible for an individual research/monitoring campaign. This data should include all
parameters of interest on a particle-based level, if applicable, and made available upon request for
modeling and risk assessment studies.

AMAP Litter and Microplastics Monitoring Guidelines
222
Identification guidelines for monitoring microplastics in the Arctic
Because of the high variability across different analytical methods and tools, variations in field-work
capabilities, and different targets for monitoring of individual biotic and abiotic compartments (see
Table 4.3 and the related sections), we recommend the following procedure:
In the scope of the AMAP monitoring program, the data need to be harmonized for polymer types,
size classes, colors, and shapes. For MP determination using optical microscopy and visual
identification, it should be mandatory to follow the categorization scheme published by Lusher et al.
2020 (see Figure 4.7) to achieve a harmonized result on shapes.

AMAP Litter and Microplastics Monitoring Guidelines
223
Figure 4.7 Proposed flow chart for the visual identification of microplastics. Reproduced from Lusher et al., 2020.
Organic and
inorganic
alternatives
include: pearl,
fish eye, sediment,
phytoplankton,
shells,
foraminifera,
algae, sediment
This could be algae,
see Section 4
Fibrous
Organic and
inorganic
alternatives
include: algae,
natural fibers,
regenerated fibers

AMAP Litter and Microplastics Monitoring Guidelines
224
In addition, the following eight colors should be reported along with these shapes in accordance with the
EMODnet database (https://www.emodnet-bathymetry.eu/):
• BLACK/GRAY
• BLUE/GREEN
• BROWN/TAN
• WHITE/CREAM
• YELLOW
• ORANGE/PINK/RED
• TRANSPARENT
• MULTICOLOR
For polymer analysis using spectroscopy, it is recommended to subsample at least 50 particles per sample
or 66% of the filter, as reported by Mintenig et al., 2020. With MP particle sizes between 1 mm to 300
µm, this analysis is considered mandatory for most compartments when monitoring in the Arctic. To
achieve an optimal harmonization between the results, we recommend that if using FTIR or Raman for
spectral analysis by library searches, that open access databases be used for spectral matching (see, e.g.,
Cabernard et al., 2018; Primpke et al., 2018, 2020b; Munno et al., 2020). We also recommend open
access software, like siMPle or Open Specy (e.g., Cowger et al., 2020c; Primpke et al., 2020b) to allow
for the best comparability of data. In addition to synthetic polymers, these databases contain natural
materials to avoid confusion, e.g., between protein based natural polyamides and synthetic polyamide.
Nevertheless, other chemometric methods can be applied as well (e.g., Renner et al., 2017, 2019b;
Hufnagl et al., 2019; Kedzierski et al., 2019; da Silva et al., 2020), however, a library search should be
considered a standard method because it commonly provides the software running the instruments for all
manufacturers. Independent from the method used to identify the spectra, a quality assurance/quality
control of the method should be performed and reported using positive controls, negative controls, and for
harmonizing the analysis of existing reference data sets. The methods should also be checked for known
interferences with materials of natural origin regularly (at least every three months) to avoid an
overestimation of MP.
Using thermoanalytical methods, the prepared sample is usually pyrolyzed as a whole. Any aliquotation
should be avoided unless the results of aliquots are added together in the end. The expected polymer
concentrations of an environmental sample should ideally fall within the linear quantification range of the
polymer. This range varies within instrumentation. For micro furnace py-GC/MS, calibrations typically
range between 0.5 and 100 µg but might vary between different types of polymers. Well-considered
adjustments of sample volume or mass are highly recommended before any preconcentration procedure.
Because mass-related data for polymers are still rare, relevant publications and experts should be
consulted. As a first general appraisal from already existing data, total MP mass concentrations of ocean
water range on a ppt to ppb level (Fischer and Scholz-Böttcher, 2019; Dibke et al., 2020; Primpke et al.,
2020c), marine sediments range on a ppb level (Fischer and Scholz-Böttcher, 2019; Gomiero et al., 2019;
Primpke et al., 2020c), and biota range in the ppb to ppm levels (Fischer and Scholz-Böttcher, 2017;
Gomiero et al., 2020).
The derived sizes shall be reported in the size classes: > 1 mm, 1 mm – 300 µm, < 300 µm – LOD for
several polymer types (see Figure 4.7) where the analysis is mandatory. The LOD of the data should be

AMAP Litter and Microplastics Monitoring Guidelines
225
reported separately. If a certain polymer type was not measured, a not applicable (N/A) notice instead of a
0 is mandatory.
Table 4.9 Polymer types for data reporting
Polymer type name Examples of materials included (detailed level)
Polyethylene based HDPE, LDPE, and copolymers with a major PE fraction
Polypropylene based PP copolymers with a major PP fraction
Polystyrene based PS copolymers with a major PS fraction
Polyamide based All types of PA like the various nylons
Polyurethane based All types of PUR
Polymeth (ester)acrylate based All types of PM(ester)A
Polyester PET, all other types of polyesters
ABS ABS
Polycarbonate PC
Rubbers, sealing Other rubbers, like EPDM
Rubbers, automotive TWP
Paint/varnish particles If separate from PM(R)A
Ethylene-vinyl acetate
Cellulose acetate and similar
Nitrile rubbers
Natural rubber derivatives
PAN
Polyfluorinated polymers e.g., PTFE
Polychlorinated polymers e.g., PVC, chlorinated PE, various chlorinated polymers
Silicone rubbers and coatings
Other plastics e.g., PEEK
Other rubbers
Other microlitter materials

AMAP Litter and Microplastics Monitoring Guidelines
226
References
Andrady, A.L., 2011. Microplastics in the marine environment. Maritime Pollution Bulletin, 62:1596-
1605. https://doi.org/10.1016/j.marpolbul.2011.05.030
Araujo, C.F., M.M. Nolasco, A.M.P. Ribeiro and P.J.A. Ribeiro-Claro, 2018. Identification of
microplastics using Raman spectroscopy: latest developments and future prospects. Water Research,
142:426-440. https://doi.org/10.1016/j.watres.2018.05.060
Avio, C.G., S. Gorbi, M. Milan, M. Benedetti, D. Fattorini, G. d'Errico, M. Pauletto, L. Bargelloni and F.
Regoli, 2015. Pollutants bioavailability and toxicological risk from microplastics to marine mussels.
Environmental Pollution 198:211-222. https://doi.org/10.1016/j.envpol.2014.12.021
Bessa, F., J. Frias, T. Kögel, A. Lusher, J.M. Andrade, J. Antunes, P. Sobral, E. Pagter, R. Nash, I.
O'Connor, M.L. Pedrotti, M.E. Keros, V. León, V. Tirelli, G. Suaria, C. Lopes, J. Raimundo, M. Caetano,
J. Gago, L. Viñas, O. Carretero, K. Magnusson, M. Grandberg, R. Dris, M. Fischer, B. Scholz-Böttcher,
S. Muniategui, G. Grueiro, V. Fernández, L. Palazzo, A. de Lucia, A. Camedda, C.G. Avio, S. Gorbi, L.
Pittura, F. Regoli and G. Gerdts, 2019. Harmonized protocol for monitoring microplastics in biota. JPI-
Oceans BASEMAN project. http://dx.doi.org/10.25607/OBP-821
Booth, A.M., B.H. Hansen, M. Frenzel, H. Johnsen and D. Altin, 2016. Uptake and toxicity of
methylmethacrylate-based nanoplastic particles in aquatic organisms. Environmental Toxicology and
Chemistry, 35:1641-1649. https://doi.org/10.1002/etc.3076
Brandt, J., L. Bittrich, F. Fischer, E. Kanaki, A. Tagg, R. Lenz, M. Labrenz, E. Brandes, D. Fischer and
K.-J. Eichhorn, 2020. High-throughput analyses of microplastic samples using Fourier Transform infrared
and Raman spectrometry. Applied Spectroscopy, 0003702820932926.
https://doi.org/10.1177/0003702820932926
Cabernard, L., L. Roscher, C. Lorenz, G. Gerdts and S. Primpke, 2018. Comparison of Raman and
Fourier transform infrared spectroscopy for the quantification of microplastics in the aquatic environment.
Environmental Science and Technology 52:13279-13288. https://doi.org/10.1021/acs.est.8b03438
Challinor, J.M., 2001. Review: the development and applications of thermally assisted hydrolysis and
methylation reactions. Journal Analalytical and Applied Pyrolysis 61:3-34. https://doi.org/10.1016/s0165-
2370(01)00146-2
Cincinelli, A., C. Scopetani, D. Chelazzi, E. Lombardini, T. Martellini, A. Katsoyiannis, M.C. Fossi and
S. Corsolini, 2017. Microplastic in the surface waters of the Ross Sea (Antarctica): occurrence,
distribution and characterization by FTIR. Chemosphere, 175:391-400.
https://doi.org/10.1016/j.chemosphere.2017.02.024
Cooksey, K.E., J.B. Guckert, S.A. Williams and P.R. Callis, 1987. Fluorometric determination of the
neutral lipid content of microalgal cells using Nile Red. Journal of Microbiological Methods, 6:333-345.
https://doi.org/10.1016/0167-7012(87)90019-4
Cowger, W., A.M. Booth, B.M. Hamilton, C. Thaysen, S. Primpke, K. Munno, A.L. Lusher, A. Dehaut,
V.P. Vaz, M. Liboiron, L.I. Devriese, L. Hermabessiere, C. Rochman, S.N. Athey, J.M. Lynch, H. De
Frond, A. Gray, O.A.H. Jones, S. Brander, C. Steele, S. Moore, A. Sanchez and H. Nel, 2020b. Reporting

AMAP Litter and Microplastics Monitoring Guidelines
227
guidelines to increase the reproducibility and comparability of research on microplastics. Applied
Spectroscopy, 74:1066-1077. https://doi.org/10.1177/0003702820930292
Cowger, W., A. Gray, S.H. Christiansen, H. DeFrond, A.D. Deshpande, L. Hemabessiere, E. Lee, L. Mill,
K. Munno, B.E. Ossmann, M. Pittroff, C. Rochman, G. Sarau, S. Tarby and Primpke, 2020a. Critical
review of processing and classification techniques for images and spectra in microplastic research.
Applied Spectroscopy, 74:989-1010. https://doi.org/10.1177/0003702820929064
Cowger, W., A.D. Gray, H. Hapich, C. Rochman, J. Lynch, S. Primpke, H. De Frond and O. Herodotou,
2020c. Open Specy. [online] URL: https://wincowger.shinyapps.io/OpenSpecy/
da Silva, V.H., F. Murphy, J.M. Amigo, C. Stedmon and J. Strand, 2020. Classification and quantification
of microplastics (<100 μm) using a focal plane array–Fourier transform infrared imaging system and
machine learning. Analytical Chemistry, 92:3724-13733. https://doi.org/10.1021/acs.analchem.0c01324
Dekiff, J.H., D. Remy, J. Klasmeier and E. Fries, 2014. Occurrence and spatial distribution of
microplastics in sediments from Norderney. Environmental Pollution, 186:248-256.
https://doi.org/10.1016/j.envpol.2013.11.019
Dibke, C., M. Fischer and B.M. Scholz-Böttcher, 2021. Microplastics mass concentrations and
distribution in German Bight waters by Pyrolis-Gas Chromatography-Mass
Spectrometry/Thermochemolysis reveal potential impact of marine coatings: do ships leave skid marks?
Environmental Science andTechnology, 55(4):2285-2295. https://doi.org/10.1021/acs.est.0c04522
Dümichen, E., A.-K. Barthel, U. Braun, C.G. Bannick, K. Brand, M. Jekel and R. Senz, 2015. Analysis of
polyethylene microplastics in environmental samples, using a thermal decomposition method. Water
Research, 85:451-457. https://doi.org/10.1016/j.watres.2015.09.002
Dümichen, E., P. Eisentraut, C.G. Bannick, A.-K. Barthel, R. Senz and U. Braun, 2017. Fast
identification of microplastics in complex environmental samples by a thermal degradation method.
Chemosphere, 174:572-584. https://doi.org/10.1016/j.chemosphere.2017.02.010
Dümichen, E., P. Eisentraut, M. Celina and U. Braun, 2019. Automated thermal extraction-desorption gas
chromatography mass spectrometry: a multifunctional tool for comprehensive characterization of
polymers and their degradation products. Journal of Chromatography A, 1592:133-142.
https://doi.org/10.1016/j.chroma.2019.01.033
Eisentraut, P., E. Dümichen, A.S. Ruhl, M. Jekel, M. Albrecht, M. Gehde and U. Braun, 2018. Two birds
with one stone - fast and simultaneous analysis of microplastics: microparticles derived from
thermoplastics and tire wear. Environmental Science and Technology Letters, 5:608-613.
https://doi.org/10.1021/acs.estlett.8b00446
Elert, A.M., R. Becker, E. Dümichen, P. Eisentraut, J. Falkenhagen, H. Sturm and U. Braun, 2017.
Comparison of different methods for MP detection: what can we learn from them, and why asking the
right question before measurements matters? Environmental Pollution, 231:1256-1264.
https://doi.org/10.1016/j.envpol.2017.08.074
Erni-Cassola, G., M.I. Gibson, R.C. Thompson and J.A. Christie-Oleza, 2017. Lost, but found with Nile
Red: a novel method for detecting and quantifying small microplastics (1 mm to 20 μm) in environmental
samples. Environmental Science and Technology, 51:13641-13648.
https://doi.org/10.1021/acs.est.7b04512

AMAP Litter and Microplastics Monitoring Guidelines
228
European Marine Observation and Data Network (EMODnet), 2020. Bathymetry: understanding the
topography of the European seas. European Union, Brussels, Belgium. [online] URL:
https://www.emodnet-bathymetry.eu/
Fischer, M. and B.M. Scholz-Böttcher, 2017. Simultaneous trace identification and quantification of
common types of microplastics in environmental samples by pyrolysis-gas chromatography-mass
spectrometry. Environmental Science and Technology, 51:5052-5060.
https://doi.org/10.1021/acs.est.6b06362
Fischer, M. and B.M. Scholz-Böttcher, 2019. Microplastics analysis in environmental samples - recent
pyrolysis-gas chromatography-mass spectrometry method improvements to increase the reliability of
mass-related data. Analalytical Methods, 11:2489-2497. https://doi.org/10.1039/c9ay00600a
Frère, L., I. Paul-Pont, J. Moreau, P. Soudant, C. Lambert, A. Huvet and E. Rinnert, 2016. A semi-
automated Raman micro-spectroscopy method for morphological and chemical characterizations of
microplastic litter. Marine Pollution Bulletin, 113:461-468.
https://doi.org/10.1016/j.marpolbul.2016.10.051
Frias, J., E. Pagter, R. Nash, I. O'Connor, O. Carretero, A.Filgueiras, L. Viñas, J. Gago, J. Antunes, F.
Bessa, P. Sobral, A. Goruppi, V. Tirelli, M.L. Pedrotti, G. Suaria, S. Aliani, C. Lopes, J. Raimundo, M.
Caetano, L. Palazzo, G.A. de Lucia, A. Camedda, S. Muniategui, G. Grueiro, V. Fernandez, J. Andrade,
R. Dris, C. Laforsch, B.M. Scholz-Böttcher and G. Gerdts, 2018. Standardised protocol for monitoring
microplastics in sediments. JPI-Oceans BASEMAN project. 23pp.
https://doi.org/10.13140/RG.2.2.36256.89601/1
Fries, E., J.H. Dekiff, J. Willmeyer, M.-T. Nuelle, M. Ebert and D. Remy, 2013. Identification of polymer
types and additives in marine microplastic particles using pyrolysis-GC/MS and scanning electron
microscopy. Environmental Science: Processes and Impacts, 15:1949-1956.
https://doi.org/10.1039/c3em00214d
Gago, J., A. Filguerias, M.L. Pedrotti, G. Suaria, V. Terelli, J. Andrade, J. Frias, R. Nash, I. O'Connor, C.
Lopes, M. Caetano, J. Raimundo, O. Carretero, L. Viñas, J. Antunes, F. Bessa, P. Sobral, A. Goruppi, S.
Aliani, L. Palazzo, G. A. de Lucia, A. Camedda, S. Muniategui, G. Grueiro, V. Fernandez and G. Gerdts,
2018. Standardised protocol for monitoring microplastics in seawater. Deliverable 4.1. JPI-Oceans
BASEMAN Project. 33pp. http://dx.doi.org/10.25607/OBP-605
Gomiero, A., M. Haave, Ø. Bjorøy, D. Herzke, T. Kögel, V. Nikiforov and K.B. Øysæd, 2020.
Quantification of Microplastic in Fillet and Organs of Farmed and Wild Salmonids - a comparison of
methods for detection and quantification SALMODETECT. NORCE report 8-2020. NORCE, Bergen,
Norway. 43pp. [online] URL: https://www.hi.no/resources/Salmodetect-report-final.pdf
Gomiero, A., K.B. Øysæd, T. Agustsson, N. van Hoytema, T. van Thiel and F. Grati, 2019. First record of
characterization, concentration and distribution of microplastics in coastal sediments of an urban fjord in
south west Norway using a thermal degradation method. Chemosphere, 227:705-714.
https://doi.org/10.1016/j.chemosphere.2019.04.096
Group of Experts on Scientific Aspects of Marine Environmental Protection (GESAMP), 2019.
Guidelines for the Monitoring and Assessment of Plastic Litter and Microplastics in the Ocean.
GESAMP, London, UK, 130pp. [online] URL: http://www.gesamp.org/publications/guidelines-for-the-
monitoring-and-assessment-of-plastic-litter-in-the-ocean

AMAP Litter and Microplastics Monitoring Guidelines
229
Haave, M., C. Lorenz, S. Primpke and G. Gerdts, 2019. Different stories told by small and large
microplastics in sediment - first report of microplastic concentrations in an urban recipient in Norway.
Maritime Pollution Bulletin, 141:501-513. https://doi.org/10.1016/j.marpolbul.2019.02.015
Harrison, J.P., J.J. Ojeda and M.E. Romero-González, 2012. The applicability of reflectance micro-
Fourier-transform infrared spectroscopy for the detection of synthetic microplastics in marine sediments.
Science of the Total Environment, 416, 455-463. https://doi.org/10.1016/j.scitotenv.2011.11.078
Hendrickson, E., E.C. Minor and K. Schreiner, 2018. Microplastic abundance and composition in
Western Lake Superior as determined via microscopy, Pyr-GC/MS, and FTIR. Environmental Science
and Technology, 52:1787-1796. https://doi.org/10.1021/acs.est.7b05829
Hermabessiere, L., C. Himber, B. Boricaud, M. Kazour, R. Amara, A.-L. Cassone, M. Laurentie, I. Paul-
Pont, P. Soudant, A. Dehaut and G. Duflos, 2018. Optimization, performance, and application of a
pyrolysis-GC/MS method for the identification of microplastics. Analytical and Bioanalytial Chemistry,
410:6663-6676. https://doi.org/10.1007/s00216-018-1279-0
Hidalgo-Ruz, V., L. Gutow, R.C. Thompson and M. Thiel, 2012. Microplastics in the marine
environment: a review of the methods used for identification and quantification. Environmental Science
and Technology, 46:3060-3075. https://doi.org/10.1021/es2031505
Huffer, T., A. Praetorius, S. Wagner, F. von der Kammer and T. Hofmann, 2017. Microplastic exposure
assessment in aquatic environments: learning from similarities and differences to engineered
nanoparticles. Environmental Science and Technology, 51:2499-2507.
https://doi.org/10.1021/acs.est.6b04054
Hufnagl, B., D. Steiner, E. Renner, M.G.J. Löder, C. Laforsch and H. Lohninger, 2019. A methodology
for the fast identification and monitoring of microplastics in environmental samples using random
decision forest classifiers. Analytical Methods, 11:2277-2285. https://doi.org/10.1039/c9ay00252a
Imhof, H.K., C. Laforsch, A.C. Wiesheu, J. Schmid, P.M. Anger, R. Niessner and N.P. Ivleva, 2016.
Pigments and plastic in limnetic ecosystems: a qualitative and quantitative study on microparticles of
different size classes. Water Research, 98:64-74. https://doi.org/10.1016/j.watres.2016.03.015
Ivleva, N.P., A.C. Wiesheu and R. Niessner, 2017. Microplastic in aquatic ecosystems. Angewandte
Chemie International Edition, 56:1720-1739. https://doi.org/10.1002/anie.201606957
Käppler, A., D. Fischer, S. Oberbeckmann, G. Schernewski, M. Labrenz, K.-J. Eichhorn and B. Voit,
2016. Analysis of environmental microplastics by vibrational microspectroscopy: FTIR, Raman or both?
Analytical and Bioanalytical Chemistry, 408:8377-8391. https://doi.org/10.1007/s00216-016-9956-3
Käppler, A., M. Fischer, B.M. Scholz-Böttcher, S. Oberbeckmann, M. Labrenz, D. Fischer, K.-J.
Eichhorn and B. Voit, 2018. Comparison of μ-ATR-FTIR spectroscopy and py-GCMS as identification
tools for microplastic particles and fibers isolated from river sediments. Analytical and Bioanalytical
Chemistry, 410:5313-5327. https://doi.org/10.1007/s00216-018-1185-5
Käppler, A., F. Windrich, M.G.J. Löder, M. Malanin, D. Fischer, M. Labrenz, K.-J. Eichhorn and B. Voit,
2015. Identification of microplastics by FTIR and Raman microscopy: a novel silicon filter substrate
opens the important spectral range below 1300 cm(-1) for FTIR transmission measurements. Analytical
and Bioanalytical Chemistry, 407:6791-6801. https://doi.org/10.1007/s00216-015-8850-8

AMAP Litter and Microplastics Monitoring Guidelines
230
Kedzierski, M., M. Falcou-Préfol, M.E. Kerros, M. Henry, M.L. Pedrotti and S. Bruzaud, 2019. A
machine learning algorithm for high throughput identification of FTIR spectra: application on
microplastics collected in the Mediterranean Sea. Chemosphere, 234:242-251.
https://doi.org/10.1016/j.chemosphere.2019.05.113
Klein, M. and E.K. Fischer, 2019. Microplastic abundance in atmospheric deposition within the
Metropolitan area of Hamburg, Germany. Science of the Total Environment, 685:96-103.
https://doi.org/10.1016/j.scitotenv.2019.05.405
Kögel, T., Ø. Bjorøy, B. Toto, A.M. Bienfait and M. Sanden, 2020. Micro- and nanoplastic toxicity on
aquatic life: determining factors. Science of the Total Environment, 709:136050.
https://doi.org/10.1016/j.scitotenv.2019.136050
Kusch, P., 2012. Pyrolysis-gas chromatography/mass spectrometry of polymeric materials. In: Mohd,
M.A. (Ed.). Advanced Gas Chromatography - Progress in Agricultural, Biomedical and Industrial
Applications. IntechOpen, London, UK. https://doi.org/10.5772/32323
Kusch, P., 2014. Identification of synthetic polymers and copolymers by analytical pyrolysis-gas
chromatography/mass spectrometry. Journal of Chemical Education, 91:1725-1728.
https://doi.org/10.1021/ed5002027
Kusch, P., V. Obst, D. Schroeder-Obst, W. Fink, G. Knupp and J. Steinhaus, 2013. Application of
pyrolysis-gas chromatography/mass spectrometry for the identification of polymeric materials in failure
analysis in the automotive industry. Engineering Failure Analysis, 35:114-124.
https://doi.org/10.1016/j.engfailanal.2012.12.005
Lanctôt, C.M., M. Al-Sid-Cheikh, A.I. Catarino, T. Cresswell, B. Danis, H.K. Karapanagioti, T. Mincer,
F. Oberhänsli, P. Swarzenski, I. Tolosa and M. Metian, 2018. Application of nuclear techniques to
environmental plastics research. Journal of Environmental Radioactivity, 192:368-375.
https://doi.org/10.1016/j.jenvrad.2018.07.019
Löder, M.G.J., H.K. Imhof, M. Ladehoff, L.A. Loschel, C. Lorenz, S. Mintenig, S. Piehl, S. Primpke, I.
Schrank, C. Laforsch and G. Gerdts, 2017. Enzymatic purification of microplastics in environmental
samples. Environmental Science and Technology, 51:14283-14292.
https://doi.org/10.1021/acs.est.7b03055
Löder, M.G.J., M. Kuczera, S. Mintenig, C. Lorenz and G. Gerdts, 2015. Focal plane array detector-based
micro-Fourier-transform infrared imaging for the analysis of microplastics in environmental samples.
Environmental Chemistry, 12:563-581. https://doi.org/10.1071/en14205
Lusher, A.L., I.L.M. Bråte, K. Munno, R.R. Hurley and N.A. Welden, 2020. Is It or isn't it: the
importance of visual classification in microplastic characterization. Applied Spectroscopy, 74:1139-1153.
https://doi.org/10.1177/0003702820930733
Maes, T., R. Jessop, N. Wellner, K. Haupt and A.G. Mayes, 2017. A rapid-screening approach to detect
and quantify microplastics based on fluorescent tagging with Nile Red. Scientific Reports, 7:44501.
https://doi.org/10.1038/srep44501
Mintenig, S.M., I. Int-Veen, M.G.J. Löder, S. Primpke and G. Gerdts, 2017. Identification of microplastic
in effluents of waste water treatment plants using focal plane array-based micro-Fourier-transform
infrared imaging. Water Research, 108:365-372. https://doi.org/10.1016/j.watres.2016.11.015

AMAP Litter and Microplastics Monitoring Guidelines
231
Mintenig, S.M., M. Kooi, M.W. Erich, S. Primpke, P.E. Redondo-Hasselerharm, S.C. Dekker, A.A.
Koelmans and A.P. van Wezel, 2020. A systems approach to understand microplastic occurrence and
variability in Dutch riverine surface waters. Water Research, 176:115723.
https://doi.org/10.1016/j.watres.2020.115723
Mintenig, S.M., M.G.J. Löder, S. Primpke and G. Gerdts, 2019. Low numbers of microplastics detected
in drinking water from ground water sources. Science of the Total Environment, 648:631-635.
https://doi.org/10.1016/j.scitotenv.2018.08.178
Munno, K., H. De Frond, B. O’Donnell and C.M. Rochman, 2020. Increasing the accessibility for
characterizing microplastics: introducing new application-based and spectral libraries of plastic particles
(SLoPP and SLoPP-E). Analytical Chemistry, 92:2443-2451.
https://doi.org/10.1021/acs.analchem.9b03626
Nuelle, M.-T., J.H. Dekiff, D. Remy and E. Fries, 2014. A new analytical approach for monitoring
microplastics in marine sediments. Environmental Pollution, 184:161-169.
https://doi.org/10.1016/j.envpol.2013.07.027
OSPAR, 2015. Guidelines for Monitoring of Plastic Particles in Stomachs of Fulmars in the North Sea
Area. OSPAR Commission Agreement 2015-03. OSPAR, London, UK. 26pp.
Oßmann, B.E., G. Sarau, H. Holtmannspötter, M. Pischetsrieder, S.H. Christiansen and W. Dicke, 2018.
Small-sized microplastics and pigmented particles in bottled mineral water. Water Research, 141:307-
316. https://doi.org/10.1016/j.watres.2018.05.027
Oßmann, B.E., G. Sarau, S.W. Schmitt, H. Holtmannspotter, S.H. Christiansen and W. Dicke, 2017.
Development of an optimal filter substrate for the identification of small microplastic particles in food by
micro-Raman spectroscopy. Analytical and Bioanalytical Chemistry, 409:4099-4109.
https://doi.org/10.1007/s00216-017-0358-y
Palatinus, A., M.K. Viršek, U. Robič, M. Grego, O. Bajt, J. Šiljić, G. Suaria, S. Liubartseva, G. Coppini
and M. Peterlin, 2019. Marine litter in the Croatian part of the middle Adriatic Sea: simultaneous
assessment of floating and seabed macro and micro litter abundance and composition. Marine Pollution
Bulletin, 139:427-439. https://doi.org/10.1016/j.marpolbul.2018.12.038
Phuong, N.N., L. Poirier, F. Lagarde, A. Kamari and A. Zalouk-Vergnoux, 2018. Microplastic abundance
and characteristics in French Atlantic coastal sediments using a new extraction method. Environmental
Pollution, 243:228-237. https://doi.org/10.1016/j.envpol.2018.08.032
Primpke, S., S.H. Christiansen, W. Cowger, H. De Frond, A. Deshpande, M. Fischer, E.B. Holland, M.
Meyns, B.A. O'Donnell, B.E. Oßmann, M. Pittroff, G. Sarau, B.M. Scholz-Bottcher, K.J. Wiggin, 2020a.
Critical assessment of analytical methods for the harmonized and cost-efficient analysis of nicroplastics.
Applied Spectroscopy, 74:1012-1047. https://doi.org/10.1177/0003702820921465
Primpke, S., R.K. Cross, S.M. Mintenig, M. Simon, A. Vianello, G. Gerdts and J. Vollertsen, 2020b.
Toward the systematic identification of microplastics in the environment: evaluation of a new
independent software tool (siMPle) for spectroscopic analysis. Applied Spectroscopy, 74:1127-1138.
https://doi.org/10.1177/0003702820917760
Primpke, S., M. Fischer, C. Lorenz, G. Gerdts and B.M. Scholz-Böttcher, 2020c. Comparison of pyrolysis
gas chromatography/mass spectrometry and hyperspectral FTIR imaging spectroscopy for the analysis of

AMAP Litter and Microplastics Monitoring Guidelines
232
microplastics. Analytical and Bioanalytical Chemistry, 412:8283-8298. https://doi.org/10.1007/s00216-
020-02979-w
Primpke, S., M. Godejohann and G. Gerdts, 2020d. Rapid identification and quantification of
microplastics in the environment by quantum cascade laser-based hyperspectral infrared chemical
imaging. Environmental Science and Technology, 54:15893-15903.
https://doi.org/10.1021/acs.est.0c05722
Primpke, S., C. Lorenz, R. Rascher-Friesenhausen and G. Gerdts, 2017. An automated approach for
microplastics analysis using focal plane array (FPA) FTIR microscopy and image analysis. Analytical
Methods, 9:1499-1511. https://doi.org/10.1039/c6ay02476a
Primpke, S., M. Wirth, C. Lorenz and G. Gerdts, 2018. Reference database design for the automated
analysis of microplastic samples based on Fourier transform infrared (FTIR) spectroscopy. Analytical and
Bioanalytical Chemistry, 410:5131-5141. https://doi.org/10.1007/s00216-018-1156-x
Renner, G., A. Nellessen, A. Schwiers, M. Wenzel, T.C. Schmidt and J. Schram, 2019a. Data
preprocessing and evaluation used in the microplastics identification process: a critical review and
practical guide. TrAC Trends in Analalytical Chemistry, 111:229-238.
https://doi.org/10.1016/j.trac.2018.12.004
Renner, G., P. Sauerbier, T.C. Schmidt and J. Schram, 2019b. Robust automatic identification of
microplastics in environmental samples using FTIR microscopy. Analytical Chemistry, 91:9656-9664.
https://doi.org/10.1021/acs.analchem.9b01095
Renner, G., T. Schmidt and J. Schram, 2019c. Automated rapid and intelligent microplastics mapping by
FTIR microscopy: a Python-based workflow. MethodsX, 7:100742.
https://doi.org/10.1016/j.mex.2019.11.015
Renner, G., T.C. Schmidt and J. Schram, 2017. A new chemometric approach for automatic identification
of microplastics from environmental compartments based on FT-IR spectroscopy. Analytical Chemistry,
89:12045-12053. https://doi.org/10.1021/acs.analchem.7b02472
Rochman, C.M., F. Regan and R.C. Thompson, 2017. On the harmonization of methods for measuring
the occurrence, fate and effects of microplastics. Analytical Methods, 9:1324-1325.
https://doi.org/10.1039/c7ay90014g
Schwaferts, C., R. Niessner, M. Elsner and N.P. Ivleva, 2019. Methods for the analysis of submicrometer-
and nanoplastic particles in the environment. TrAC Trends in Analytical Chemistry, 112:52-65.
https://doi.org/10.1016/j.trac.2018.12.014
Schymanski, D., C. Goldbeck, H.-U. Humpf and P. Fürst, 2018. Analysis of microplastics in water by
micro-Raman spectroscopy: release of plastic particles from different packaging into mineral water.
Water Research, 129:154-162. https://doi.org/10.1016/j.watres.2017.11.011
Seefeldt, H., E. Dümichen and U. Braun, 2013. Flame retardancy of glass fiber reinforced high
temperature polyamide by use of aluminum diethylphosphinate: thermal and thermo-oxidative effects.
Polymer International, 62:1608-1616. https://doi.org/10.1002/pi.4497
AMAP Litter and Microplastics Monitoring Guidelines
233
Shim, W.J., Y.K. Song, S.H. Hong and M. Jang, 2016. Identification and quantification of microplastics
using Nile Red staining. Marine Pollution Bulletin, 113:469-476.
https://doi.org/10.1016/j.marpolbul.2016.10.049
Simon, M., N. van Alst and J. Vollertsen, 2018. Quantification of microplastic mass and removal rates at
wastewater treatment plants applying Focal Plane Array (FPA)-based Fourier Transform Infrared (FT-IR)
imaging. Water Research, 142:1-9. https://doi.org/10.1016/j.watres.2018.05.019
Sutton, R., S.A. Mason, S.K. Stanek, E. Willis-Norton, I.F. Wren and C. Box, 2016. Microplastic
contamination in the San Francisco Bay, California, USA. Marine Pollution Bulletin, 109:230-235.
https://doi.org/10.1016/j.marpolbul.2016.05.077
Tagg, A.S., M. Sapp, J.P. Harrison and J.J. Ojeda, 2015. Identification and quantification of microplastics
in wastewater using Focal Plane Array-Based reflectance micro-FT-IR imaging. Analytical Chemistry,
87:6032-6040. https://doi.org/10.1021/acs.analchem.5b00495
Tamminga, M., E. Hengstmann and E.K. Fischer, 2017. Nile Red Staining as a subsidiary method for
microplastic quantification: a comparison of three solvents and factors influencing application reliability.
Journal of Earth Sciences and Environmental Studies, 2:165-172. https://doi.org/10.25177/jeses.2.2.1
ter Halle, A., L. Ladirat, X. Gendre, D. Goudouneche, C. Pusineri, C. Routaboul, C. Tenailleau, B.
Duployer and E. Perez, 2016. Understanding the fragmentation pattern of marine plastic debris.
Environmental Science and Technology, 50:5668-5675. https://doi.org/10.1021/acs.est.6b00594
Thaysen, C., K. Munno, L. Hermabessiere and C.M. Rochman, 2020. Towards Raman automation for
microplastics: developing strategies for particle adhesion and filter subsampling. Applied Spectroscopy,
74:976-988. https://doi.org/10.1177/0003702820922900
Tsuge, S., H. Ohtani and C. Watanabe, 2011. Pyrolysis-GC/MS Data Book of Synthetic Polymers:
Pyrograms, Thermograms and MS of Pyrolyzates. Elsevier, Amsterdam, The Netherlands. 420pp.
Vianello, A., A. Boldrin, P. Guerriero, V. Moschino, R. Rella, A. Sturaro and L. Da Ros, 2013.
Microplastic particles in sediments of Lagoon of Venice, Italy: first observations on occurrence, spatial
patterns and identification. Estuarine, Coastal and Shelf Science, 130:54-61.
https://doi.org/10.1016/j.ecss.2013.03.022
Wampler, T.P., 2006. Pyrolysis techniques in the analysis of polymers and rubbers. In: Encyclopedia of
Analytical Chemistry. John Wiley and Sons, Hoboken, New Jersey.
https://doi.org/10.1002/9780470027318.a2028
Wampler, T.P., 2007. Applied Pyrolysis Handbook, 2nd ed. CRC-Press, Boca Raton, Florida, USA.
300pp.
Wiggin, K.J. and E.B. Holland, 2019. Validation and application of cost and time effective methods for
the detection of 3–500 μm sized microplastics in the urban marine and estuarine environments
surrounding Long Beach, California. Marine Pollution Bulletin, 143:152-162.
https://doi.org/10.1016/j.marpolbul.2019.03.060
Zada, L., H.A. Leslie, A.D. Vethaak, G.H. Tinnevelt, J.J. Jansen, J.F. de Boer and F. Ariese, 2018. Fast
microplastics identification with stimulated Raman scattering microscopy. Journal of Raman
Spectroscopy, 49:1136-1144. https://doi.org/10.1002/jrs.5367
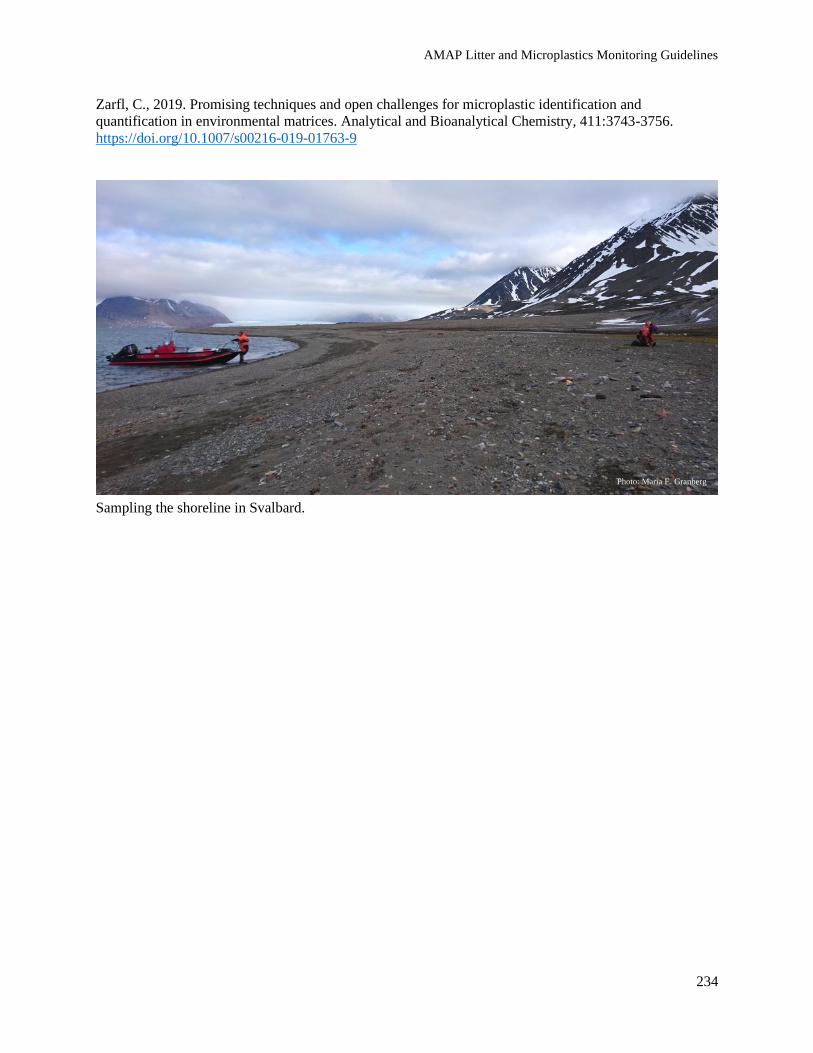
AMAP Litter and Microplastics Monitoring Guidelines
234
Zarfl, C., 2019. Promising techniques and open challenges for microplastic identification and
quantification in environmental matrices. Analytical and Bioanalytical Chemistry, 411:3743-3756.
https://doi.org/10.1007/s00216-019-01763-9
Sampling the shoreline in Svalbard.
Photo: Maria E. Granberg

AMAP Litter and Microplastics Monitoring Guidelines
235
4.4 Modeling AUTHORS: PETER MURPHY, ILKA PEEKEN, STEFANO ALIANI, AND MATS HUSERBRÅTEN
4.4.1 Introduction
The redistribution and accumulation of marine litter and microplastics (MP) in the environment including
in the Arctic, are affected by the general atmospheric and oceanic circulation patterns. Modeling the
movement and fate of marine litter can help us to better understand, and eventually address, its presence
and impacts. Modeling the flow of marine litter into the Arctic has the potential to help identify and
quantify sources, whereas modeling the movement and fate of marine litter within the Arctic can help
identify geographic areas and marine litter types. That being said, modeling litter and MP in the Arctic
comes with specific challenges.
Ocean general circulation models (OGCMs) solve equations to model ocean movement in horizontal and
vertical dimensions and provide the surface currents layer that is used as the basic framework to simulate
debris transport.
The models work best when initialized with actual data on starting conditions for debris quantity,
concentration, and behavior. Observed data on litter and MP are negligible if compared to the immensity
of the ocean, but even more scant if we consider oceanographic data from remote and harsh environments
like the Arctic. Given the sparsity of observations, numerical simulations can be used to both fill in the
gaps between these observations and to test hypotheses about how plastic particles behave in the ocean
(van Sebille et al., 2020), especially when improved by satellite-tracked drifters (Maximenko et al., 2012)
or with data assimilation techniques (Anderson et. al, 1996). Circulation models exist for the Arctic
although generally at lower resolution, and there is continued effort to develop higher resolution
circulation models in the region, such as those developed for the European Arctic by the EU project
FixO3 with Frontiers in Arctic Marine Monitoring (FRAM; http://www.fixo3.eu/observatory/fram/).
One notable challenge for modeling marine litter in the Arctic is the presence of sea ice, which might act
both as a barrier for larger plastic items (Cozar et al., 2017), but also as a transport vehicle of MP
(Obbard, 2018; Peeken, 2018; Tekmann, 2020). Modeling for these processes began several decades ago,
particularly to study the redistribution of various pollutants and contaminants in polar regions (Pfirman et
al., 1997; Rigor and Colony, 1997; Korsnes et al., 2002). However, plastic litter is a different contaminant
because it has so many different properties in terms of size, shapes, and buoyancy, and thus it is much
more difficult to use previous applications (van Sebille et al., 2020).
Given the large nature of plastic litter, the emphasis to date has been on oceanic modeling of plastic
pollution. More recently, studies have shown that airborne plastic pollution can occur. This airborne
deposition has mostly been studied in cities to date, including cities in Iran (Abbasi et al., 2019), Europe
(Allen et al., 2019; Dris et al., 2015, 2016, 2017; Catarino et al., 2018; Klein and Fischer, 2019; Vianello
et al., 2019), China (Cai et al., 2017; Liu et al., 2019), and over the Pacific Ocean (Liu et al., 2019b).
Recent studies in remote regions, including the Arctic, suggest that atmospheric deposition of MP,
especially fibers, can occur outside of major urban centers, with MP likely from remote sources
(Ambrosini et al., 2019; Bergmann et al., 2019; Geilfus et al., 2019; Evangeliou et al., 2020). Integration
AMAP Litter and Microplastics Monitoring Guidelines
236
of modeling for airborne input of MP is an area of future development because there are technical
challenges in coupling air and ocean models, as well as data limitations in the quantification of MP input
spatially and temporally.
4.4.2 Efforts to date
The majority of modeling work on marine litter movement and pathways has been done outside the
Arctic. Recently, the various processes that govern the movement of plastic litter in the global ocean were
summarized in a review by van Sebille et al., 2020. Advection of plastic litter into the Arctic Ocean by the
pathway of the thermohaline circulation was modeled by Cózar et al., 2017. In the sub-Arctic and Arctic
Regions, modeling to date involves the backtracking of litter from OSPAR beaches (Röhrs et al., 2020).
Two- and three-dimensional simulations of particle transport trajectories have been used to identify
different pathways for various polymer types (Tekmann et al., 2020). By applying a 1-D thermodynamic
model with the backtracking of the sea-ice floes, it was possible to elucidate the incorporation of various
polymer types during the sea-ice growth (Peeken et al., 2018). Although efforts using Lagrangian
techniques to model the accumulation zones in sea ice and the ocean suggest no real accumulation of
plastic litter in the high Arctic (Vries, 2019), by applying the Nucleus for European Modelling of the
Ocean (NEMO), Mountford and Morales Maqueda, 2021 did show a projected increasing accumulation
over time on the scale of several decades. In addition, they were able to show that, in regions of winter
convection, floating plastic can be drawn down significantly through mixing and downwelling processes.
For any sea-ice monitoring, basic model approaches such as sea-ice backtracking (Krumpen et al., 2016)
are essential to determine the sea-ice origin and thus find the source of the plastic pollution.
Emerging broad-area modeling efforts, such as those through Tracking of Plastics in Our Seas (TOPIOS;
http://topios.org/) would allow for improved investigation and assessment of marine litter into the Arctic
via the marine environment. However, currently this is not the primary focus of this initiative.
Additionally, there are no large-scale modeling efforts for atmospheric deposition of MP; in part because
there are very limited data on how MP act within the atmosphere, and on how those would couple with
modeling for oceanic transport of MP.
4.4.3 Difficulties or challenges
Oceanic modeling
Currently, the coupling between air and water is generally well understood, however, when adding ice to
the modeling efforts several new scenarios arise. It is likely that proposed modeling approaches for
marine litter in the Arctic would focus first on modeling the particular environmental conditions for the
Arctic Ocean (e.g., large freshwater input) without sea ice, and later adapt them to the Arctic including
the added complexity of sea ice. Additional modeling of sea-ice movement could assume debris
entrapped or entrained within the ice. Modeling the debris/litter interactions during freeze-up will likely
be very challenging. The complex rheology of ice (which behaves as a viscous liquid under one condition
and as a rigid body under other conditions) makes this task even more difficult. Thus, one of the key
challenges identified is the ability to include the influence of sea ice in the modeling of marine litter. As
mentioned, this challenge exists at multiple levels: litter can become frozen into the sea ice and be
transported, but it can also remain un-entrained and be degraded mechanically by sea ice and sea-ice biota
AMAP Litter and Microplastics Monitoring Guidelines
237
(Dawson et al., 2018). Entrainment processes are quite complex and demand very small-scale processes,
which need to be interlinked with large-scale processes such as main oceanic currents and atmospheric
forcing. Additionally, debris movement or transport may be influenced by sea-ice impact on ocean
conditions, by freshening of the ocean surface layer, and by producing strong density gradients. This is in
combination with the influence of large riverine inputs that already produce a fresher surface ocean
compared to the world ocean.
Freshwater modeling
There is also a lack of modeling for freshwater inputs of litter and MP into the Arctic region. Freshwater
inputs of litter and MP to the Arctic remain unknown, and pathways for litter and MP from oceanic and
freshwater sources are needed to ensure mitigation efforts can be focused and effective. River systems
have been identified as one of the key conduits of plastics from terrestrial environments to the world’s
oceans, transporting between 1.15 and 2.41 million tons of plastic annually to marine ecosystems
(Lebreton et al., 2017), but similarly to the oceanic case, these modeling efforts are limited to lower
latitudes. Although rivers are undoubtedly one of the major pathways in moving plastic from terrestrial to
marine environments, little data are available on MP concentrations in northern rivers (or in freshwater
ecosystems in general), and on how these systems may be acting as conduits for MP pollution to northern
marine environments. Therefore, to add to our understanding of freshwater sources, sinks, and circulation
of litter and MP, projects that focus on monitoring within watersheds and water bodies that flow into the
Arctic should be prioritized.
Atmospheric modeling
As the study of MP in the atmosphere expands, there will be increased efforts to model MP movement
and behavior in this environmental compartment. This will be an important component of understanding
the flux of MP potentially into and out of the Arctic. Importantly, many chemical contaminants travel to
the Arctic and become trapped there because of the “grasshopper effect.” This phenomenon may, or may
not, apply to MP, or apply differentially depending on polymer, size, and shape of the MP. Given the
diverse nature of MP, more work is needed to understand the basic behavior of MP in air currents before
large-scale modeling can take place.
4.4.4 Data needed and data gaps
Different approaches, and consequently different source data, are needed to model the general circulation
and associated transport of litter and MP in the ocean and air. Because modeling techniques make use of a
wide range of supporting elements, we recall here some major data sources used for modeling: drifters,
satellite data, and oceanographic time series from fixed platforms.
Drifters
Drifter data are assimilated in ocean models to test them against real data, improve accuracy of models, or
to force models. The early source of information about surface currents were pre-paid stamped drifting
cards released at sea and mailed back to scientists upon retrieval in some parts of the ocean. After the
1970s, it became possible to track drifting buoys, or “drifters,” via satellite tracking, and thus, the surface
currents of all oceans have been measured. A wide program of drifters release has been running in the

AMAP Litter and Microplastics Monitoring Guidelines
238
Arctic for some time, and position and velocity data have been analyzed from ocean drifters in many
areas (Mensa et al., 2018; Proshutinsky et al., 2019).
At present, drifter data are commonly available online and are a part of the general databases of ocean
data about the Arctic (Bayankina et al., 2017; Zweng et al., 2018). A repository collecting ocean data is
available from the Arctic Data Committee (https://arcticdc.org/), and the International Arctic Buoy
Programme (IABP) also contains data from a network of buoys, with an average of 25 buoys in service at
any time. In addition, the IABP maintains a network of drifting buoys to provide meteorological and
oceanographic data for real-time operational requirements and research purposes including support to the
World Climate Research Programme (WCRP) and the World Weather Watch (WWW) Programme.
These data are permanently archived with the NSF Arctic Data Center and are also available through the
IABP website. NOAA@NSIDC maintains these pages in cooperation with IABP to promote the use of
these data and provide descriptive information that may be difficult to find elsewhere.
Satellite
Satellites provide real time, global, high space, and time resolution observations of key oceanographic
variables that are essential to constrain ocean models through data assimilation (Le Traon et al., 2015).
Oceanographic relevant data, e.g., altimetry and sea surface temperature (SST), can be assimilated in
models, but a peculiar feature in the Arctic is sea ice, whose presence is relevant for debris transport and
accumulation. Satellite derived data can provide key information about ice cover, formation, and
properties. A set of repositories are available from NASA (www.nasa.gov) or from the Copernicus
program (https://www.copernicus.eu/en).
Time series
Many oceanographic arrays have been deployed in the Arctic, especially after the most recent
International Polar Year (2007-2009). Starting from the seminal work by Aagard and Greisman, 1975,
many papers described the exchange of mass between the northern part of the oceans and the Arctic.
Many studies are related to climate change but information about water masses exchange is relevant for
marine litter studies as well. A summary of the current state of information on fluxes between oceans and
Arctic can be found through the ASOF international working group (https://asof.awi.de/).
Data ecosystem map
In the future, finding tools and structures to combine and interlay data has the potential to improve
modeling efforts and outputs. The Arctic Data Committee (ADC) has produced a map of the Arctic data
management “ecosystem” or “universe,” a combined effort of the International Arctic Science Committee
(IASC) and the Sustaining Arctic Observing Networks program (SAON). It is a concept map, indicating
projects, services, and relationships, as well as a geographic map indicating locations.
The map effort was started during the first meeting of the ADC in Potsdam, Germany, November 2014
and is an ongoing activity. A prototype database and visualization tool has been developed and is
scheduled for release soon (https://arcticdc.org/products/data-ecosystem-map). Many data useful for
modeling litter in the Arctic can be downloaded from this site.

AMAP Litter and Microplastics Monitoring Guidelines
239
In addition to these existing data sources, modeling subject matter experts identified further data that
would be necessary or helpful to improve the modeling of marine-litter movement within and into the
Arctic, including:
• Ocean currents – additional and higher resolution data on ocean currents within and into the
Arctic, particularly at the inflow and outflow gateways, as well as data on behavior in relation
to freshwater inflow.
• Sea-ice characteristics – general behavior, formation and melt, changes from multi-year to
seasonal ice, etc. with special focus on their interactions with marine litter and marine
plastics.
• Ocean surface winds and waves – additional and higher resolution data on ocean surface
conditions, as well as potential changes in the climate system that may affect the frequency,
severity, and behavior of storms.
Additional data on the general behavior of marine litter also would be important, including plastic
degradation and density changes over time due to biofouling, especially in Arctic conditions.
Additionally, specific information on the interaction between marine litter and sea ice, including how and
under what conditions litter is entrained and thus transported within sea ice. Some limited work on
general behaviors has been done, but primarily outside of the Arctic, and no specific studies on plastic
behavior in sea ice were identified. Specific litter fragmentation rates as a function of ice formation rates
would also be essential.
4.4.5 Long-term benefits
Although existing modeling capabilities in the Arctic are limited, in the long term, a more developed
modeling approach could provide valuable insights into debris pathways within and into the Arctic,
behavior of debris within the Arctic, and the relative influx and impact of local vs. long-range sources.
A more developed modeling approach could also help to identify and prioritize particular monitoring sites
or an overall monitoring site-selection strategy by giving a clearer picture of likely areas of deposition for
different types of marine litter. These monitoring sites, in combination with modeling data, could help
elucidate the relative contribution and role of local debris introduction versus long-range debris sources
because these differentiations are often challenging based on the commonality of many items and the
degradation of material over time. Those long-range sources could also include atmospheric inputs of MP
(Bergmann et al., 2019), which could be better understood in terms of their relative contribution to marine
litter and MP loads in the Arctic through modeling.
As previously identified, there is relatively little data or understanding of the relative influence or
contribution of riverine litter input to the Arctic, though it is known to be a significant driver in other
areas. Improved modeling would help address this gap and inform prioritization of monitoring sites, and
also mitigation actions.
Prognostic modeling at multiple timescales could also be very valuable in particular with the increasing
use of Arctic resources for hydrocarbons, fishing, tourism, and other uses, by showing the potential litter
distribution patterns under different future scenarios both in terms of litter inputs as well as forcing
dynamics.

AMAP Litter and Microplastics Monitoring Guidelines
240
References
Aaagard, K., and P. Greisman, 1975. Toward new mass and heat budgets for the Arctic Ocean. Journal of
Geophysical Research, 80:3821-3827. https://doi.org/10.1029/jc080i027p03821
Abbasi, S., B. Keshavarzi, F. Moore, A. Turner, F.J. Kelly, A.O. Dominguez and N. Jaafarzadeh, 2019.
Distribution and potential health impacts of microplastics and microrubbers in air and street dusts from
Asaluyeh County, Iran. Environmental Pollution, 244 (2019):153-164.
https://doi.org/10.1016/j.envpol.2018.10.039
Allen, S., D. Allen, V.R. Phoenix, G. Le Roux, P.D. Jiménez, A. Simonneau, S. Binet and D. Galop,
2019. Atmospheric transport and deposition of microplastics in a remote mountain catchment. Nature
Geoscience, 12:339-344. https://doi.org/10.1038/s41561-019-0335-5
Anderson, D.L.T., J. Sheinbaum and K. Haines, 1996. Data assimilation in ocean models. Reports on
Progress in Physics, 59:1209. https://doi.org/10.1088/0034-4885/59/10/001
Ambrosini, R., R.S. Azzoni, F. Pittino, G. Diolaiuti, A. Franzetti and M. Parolini, 2019. First evidence of
microplastic contamination in the supraglacial debris of an alpine glacier. Environmental Pollution,
253:297-301. https://doi.org/10.1016/j.envpol.2019.07.005
Bayankina, T.M., S.R. Litvinenko, M.V. Kryl’ and N.Yu. Yurkevich, 2017. Database of the Operational
Drifter observations in the Arctic Region. Physical Oceanography, 2:65-74.
https://doi.org/10.22449/1573-160x-2017-2-65-74
Bergmann, M., S. Mützel, S. Primpke, M.B. Tekman, J. Trachsel and G. Gerdts, 2019. White and
wonderful? Microplastics prevail in snow from the Alps to the Arctic. Science Advances, 5:eaax1157.
https://doi.org/10.1126/sciadv.aax1157
Cai, L., J. Wang, J. Peng, Z. Tan, Z. Zhan, X. Tan and Q. Chen, 2017. Characteristic of microplastics in
the atmospheric fallout from Dongguan city, China: preliminary research and first evidence.
Environmental Science and Pollution Research, 24(32):24928-24935. https://doi.org/10.1007/s11356-
017-0116-x
Catarino, A.I., V. Macchia, W.G. Sanderson, R.C. Thompson and T.B. Henry, 2018. Low levels of
microplastics (MP) in wild mussels indicate that MP ingestion by humans is minimal compared to
exposure via household fibres fallout during a meal. Environmental Pollution, 237:675-684.
https://doi.org/10.1016/j.envpol.2018.02.069
Cózar, A., E. Martí, C.M. Duarte, J. García-De-Lomas, E. van Sebille, T.J. Ballatore, V.M. Eguíluz, J.I.
González-Gordillo, M.L. Pedrotti, F. Echevarría, R. Troublè and X. Irigoien, 2017. The Arctic Ocean as a
dead end for floating plastics in the North Atlantic branch of the Thermohaline Circulation. Science
Advances, 3:e1600582. https://doi.org/10.1126/sciadv.1600582

AMAP Litter and Microplastics Monitoring Guidelines
241
Dawson, A.L., S. Kawaguchi, C.K. King, K.A. Townsend, R. King, W.M. Huston S.M.B. and Nash,
2018. Turning microplastics into nanoplastics through digestive fragmentation by Antarctic krill. Nature
Communications, 9:1001. https://doi.org/10.1038/s41467-018-03465-9
Dris, R., J. Gasperi, C. Mirande, C. Mandin, M. Guerrouache, V. Langlois and B. Tassin, 2017. A first
overview of textile fibers, including microplastics, in indoor and outdoor environments. Environmental
Pollution, 221:453-458. https://doi.org/10.1016/j.envpol.2016.12.013
Dris, R., J. Gasperi, V. Rocher, M. Saad, N. Renault and B. Tassin, 2015. Microplastic contamination in
an urban area: a case study in Greater Paris. Environmental Chemistry, 12(5):592-599.
https://doi.org/10.1071/en14167
Dris, R., J. Gasperi, M. Saad, C. Mirande and B. Tassin, 2016. Synthetic fibers in atmospheric fallout: a
source of microplastics in the environment? Marine Pollution Bulletin, 104(1–2):290-293.
https://doi.org/10.1016/j.marpolbul.2016.01.006
Evangeliou N., H. Grythe, Z. Klimont, C. Heyes, S. Eckhardt, S. Lopez-Aparicio and A. Stohl, 2020.
Atmospheric transport is a major pathway of microplastics to remote regions. Nature Communications,
11:3381. https://doi.org/10.1038/s41467-020-17201-9
Geilfus, N.-X., K.M. Munson, J. Sousa, Y. Germanov, S. Bhugaloo, D. Babb and F. Wang, 2019.
Distribution and impacts of microplastic incorporation within sea ice. Marine Pollution Bulletin, 145:463-
473. https://doi.org/10.1016/j.marpolbul.2019.06.029
Klein, M. and E.K. Fischer, 2019. Microplastic abundance in atmospheric deposition withinthe
Metropolitan area of Hamburg, Germany. Science of the Total Environment, 685:96-103.
https://doi.org/10.1016/j.scitotenv.2019.05.405
Korsnes, R., O. Pavlova and F. Godtliebsen, 2002.Assessment of potential transport of pollutants into the
Barents Sea via sea ice—an observational approach. Marine Pollution Bulletin, 44:861-869.
https://doi.org/10.1016/s0025-326x(02)00087-5
Krumpen, T., R. Gerdes, C. Haas, S. Hendricks, A. Herber, L. Selyuzhenok, L. Smedsrud and G. Spreen,
2016. Recent summer sea ice thickness surveys in Fram Strait and associated ice volume fluxes.
Cryosphere, 10:523-534. https://doi.org/10.5194/tc-10-523-2016
Lebreton, L.C.M., J. van der Zwet, J.-W. Damsteeg, B. Slat, A. Andrady and J. Reisser, 2017. River
plastic emissions to the world’s oceans. Nature Communications, 8:15611.
https://doi.org/10.1038/ncomms15611
Le Traon, P.-Y., D. Antoine, A. Bentamy, H. Bonekamp, L.A. Breivik, B. Chapron, G. Corlett, G.
Dibarboure, P. DiGiacomo, C. Donlon, Y. Faugère, J. Font, F. Girard-Ardhuin, F. Gohin, J.A.
Johannessen, M. Kamachi, G. Lagerloef, J. Lambin, G. Larnicol, P. Le Borgne, E. Leuliette, E.
Lindstrom, M.J. Martin, E. Maturi, L. Miller, L. Mingsen, R. Morrow, N. Reul, M.H. Rio, H. Roquet, R.
Santoleri and J. Wilkin, 2015. Use of satellite observations for operational oceanography: recent

AMAP Litter and Microplastics Monitoring Guidelines
242
achievements and future prospects, Journal of Operational Oceanography, 8:s12-s27.
https://doi.org/10.1080/1755876X.2015.1022050
Liu, K., X. Wang, T. Fang, P. Xu, L. Zhu and D. Li, 2019a. Source and potential risk assessment of
suspended atmospheric microplastics in Shanghai. Science of the Total Environment, 675:462-471.
https://doi.org/10.1016/j.scitotenv.2019.04.110
Liu, K., T. Wu, X. Wang, Z. Song, C. Zong, N. Wei and D. Li, 2019b. Consistent transport of terrestrial
microplastics to the ocean through atmosphere. Environmental Science and Technology, 53:10612-10619.
https://doi.org/10.1021/acs.est.9b03427
Maximenko, N., J. Hafner and P. Niiler, 2012. Pathways of marine debris derived from trajectories of
Lagrangian drifters. Marine Pollution Bulletin, 65:51-62. https://doi.org/10.1016/j.marpolbul.2011.04.016
Mensa, J.A., M.-L. Timmermans, I.E. Kozlov, W.J. Williams and T.M. Özgökmen, 2018. Surface drifter
observations from the Arctic Ocean's Beaufort Sea: evidence for submesoscale dynamics. Journal of
Geophysical Research: Oceans, 123:2635‐2645. https://doi.org/10.1002/2017jc013728
Mountford, A.S. and M.A. Morales Maqueda, 2021. Modeling the accumulation and transport of
microplastics by sea ice. Journal of Geophysical Research: Oceans,
126:e2020JC016826. https://doi.org/10.1029/2020JC016826
Obbard, R.W., 2018. Microplastics in polar regions: the role of long range transport. Current Opinion in
Environmental Science and Health, 1:24-29. https://doi.org/10.1016/j.coesh.2017.10.004
Peeken, I., S. Primpke, B. Beyer, J. Gütermann, C. Katlein, T. Krumpen, M. Bergmann, L. Hehemann
and G. Gerdts, 2018. Arctic sea ice is an important temporal sink and means of transport for microplastic.
Nature Communications, 9:1505. https://doi.org/10.1038/s41467-018-03825-5
Pfirman, S.L., J.W. Kogeler and I. Rigor, 1997. Potential for rapid transport of contaminants from the
Kara Sea. Science of the Total Environment, 202:111-122. https://doi.org/10.1016/s0048-9697(97)00108-
3
Proshutinsky, A., R. Krishfield, J.M. Toole, M.-L. Timmermans, W. Williams, S. Zimmermann, M.
Yamamoto-Kawai, T. Armitage, D. Dukhovskoy, E. Golubeva, E., G.E. Manucharyan, G. Platov, E.
Watanabe, T. Kikuchi, S. Nishino, M. Itoh, S.-H. Kang, K.-H. Cho, K. Tateyama and J. Zhao, 2019.
Analysis of the Beaufort Gyre Freshwater Content in 2003-2018. Journal of Geophysical Research:
Oceans, 124(12):9658-9689. https://doi.org/10.1029/2019jc015281
Rigor, I. and R. Colony, 1997. Sea-ice production and transport of pollutants in the Laptev Sea, 1979-
1993. Science of the Total Environment, 202:89-110. https://doi.org/10.1016/s0048-9697(97)00107-1
Röhrs. J., K.-F. Dagestad, C. Mauritzen, K.O. Strand, B.E. Grøsvik and L.A. Nogueira, 2020. Backtracing
of marine litter and microplastic from OSPAR beaches in the North Atlantic. EGU General Assembly
2020. https://doi.org/10.5194/egusphere-egu2020-5977
AMAP Litter and Microplastics Monitoring Guidelines
243
Tekman, M.B., C. Wekerle, C. Lorenz, S. Primpke, C. Hasemann, G. Gerdts and M. Bergmann, 2020.
Tying up loose ends of microplastic pollution in the Arctic: distribution from the sea surface through the
water column to deep-sea sediments at the HAUSGARTEN Observatory. Environmental Science and
Technology, 54:4079-4090. https://doi.org/10.1021/acs.est.9b06981
van Sebille, E., S. Aliani, K.L. Law, N. Maximenko, J.M. Alsina, A. Bagaev, M. Bergmann, B. Chapron,
I. Chubarenko, A. Cózar, P. Delandmeter, M. Egger, B. Fox-Kemper, S.P. Garaba, L. Goddijn-Murphy,
B.D. Hardesty, M.J. Hoffman, A. Isobe, C.E. Jongedijk, M.L.A. Kaandorp, L. Khatmullina, A.A.
Koelmans, T. Kukulka, C. Laufkötter, L. Lebreton, D. Lobelle, C. Maes, V. Martinez-Vicente, M.A.M.
Maqueda, M. Poulain-Zarcos, E. Rodríguez, P.Gé Ryan, A.L. Shanks, W.J. Shim, G. Suaria, M. Thiel,
T.S. van den Bremer and D. Wichmann, 2020. The physical oceanography of the transport of floating
marine debris. Environmental Research Letters, 15:023003. https://doi.org/10.1088/1748-9326/ab6d7d
Vianello, A., R.L. Jensen, L. Liu and J. Vollertsen, 2019. Simulating human exposure to indoor airborne
microplastics using a Breathing Thermal Manikin. Scientific Reports, 9:8670.
https://doi.org/10.1038/s41598-019-45054-w
Vries, A.L., 2019. On the origin of Arctic plastic: interconnectivity between the Pacific and Atlantic
Ocean and implications for plastic accumulation and transport in the Arctic. Master’s. Thesis. Faculty of
Science, Utrecht University, Utrecht. [online] URL: https://dspace.library.uu.nl/handle/1874/383106
Zweng, M.M., T.P. Boyer, O.K. Baranova, J.R. Reagan, D. Seidov and I.V. Smolyar, 2018. An inventory
of Arctic Ocean data in the World Ocean Database. Earth System Science Data, 10:677-687.
https://doi.org/10.5194/essd-10-677-2018
AMAP Litter and Microplastics Monitoring Guidelines
244
4.5 Synergies with other research and monitoring programs AUTHORS: JENNIFER PROVENCHER, TANJA KÖGEL, AND KATRIN VORKAMP
A wide range of monitoring and research programs are taking place throughout the Arctic. Most Arctic
countries have established national contaminant monitoring programs with a focus on organic
contaminants and/or metals in biota and air that feed into the circumpolar AMAP assessments (e.g.,
AMAP, 2017; Rigét et al., 2019). Additional monitoring efforts taking place in the Arctic, but not specific
to the Arctic, address seafood safety with a focus on maximum limits set by the EU and report the levels
of legacy contaminants to food safety authorities (Jushamn et al., 2011, 2013a, b; Maage et al. 2017). As
well, several Arctic species are monitored for population (e.g., Irons et al., 2015), and water is monitored
for pH, temperature, salinity, CO2, nitrogen, algae growth, and radioactivity (Skjerdal et al., 2017). Sound
contamination is also monitored in some regions (Tyack et al., 2021). To minimize extra costs for litter
and microplastics (MP) monitoring, synergies with existing programs and infrastructure may be sought.
There are advantages and limitations to implementing new monitoring programs on existing frameworks.
Given that work in the Arctic is logistically challenging and expensive (Mallory et al., 2018), there is a
need to maximize the usefulness of sample collections. By collecting samples for litter and MP
monitoring alongside other programs, supporting data and information (i.e., environmental and biological
parameters) could be used for several purposes. The availability of additional information may also allow
a broader set of questions to be addressed in relation to the fate and effects of litter and MP. Furthermore,
the existing monitoring programs (for contaminants or populations) are based on considerations of the
statistical power needed in terms of sample sizes to describe trends in the data (Rigét et al., 2019). Thus,
experiences gained from contaminant monitoring regarding the natural variation in the Arctic
environment can be a relevant starting point for similar evaluations in the context of litter and MP
monitoring although transport and accumulation processes are likely to differ.
Limitations in using existing frameworks for implementing new monitoring objectives may result from
the fact that litter and MP pollution can differ from the pollution with chemical contaminants in terms of
sources, transport pathways, degradation, and/or environmental accumulation (Rochman, 2015). Thus,
specifically optimized strategies and designs may be needed for litter and MP sampling and monitoring to
account for these differences in environmental fate.
Additionally, litter and MP monitoring should ideally have a complementary citizen-science component
because there are several ways in which citizen scientists can contribute to monitoring litter, and to date,
these citizen scientists have not played a large role in existing monitoring programs in most regions in the
Arctic.
4.5.1 Including litter and microplastics monitoring in ongoing contaminant monitoring programs
Some of the existing contaminant monitoring programs in the Arctic are briefly presented in the sections
covering abiotic and biotic matrices. They include a suite of initiatives that collect samples, determine
contaminants in the environment, and contribute to the circumpolar AMAP assessments, such as those on
persistent organic pollutants (Dietz et al., 2013; Rigét et al., 2019). In several existing programs on biotic
and abiotic compartments, there is potential for including litter and MP monitoring, as the following
AMAP Litter and Microplastics Monitoring Guidelines
245
example illustrates: in the Canadian Arctic, seabirds have been collected under the Northern
Contaminants Program for contaminants monitoring since the 1970s. Seabird eggs and individuals are
collected with local Inuit community members and are then used to track trends in concentrations of
legacy and emerging contaminants over time (Letcher et al., 2010; Braune and Letcher, 2013; Braune et
al., 2014a, b). Since 2008, seabirds collected under this program have also been used to monitor plastic
pollution (Poon et al., 2017; Provencher et al., 2018; Lu et al., 2019). For seabirds, sampling for litter and
MP was particularly easy to add to the existing program because carcasses were already being collected to
study the livers, the typical tissues examined for contaminants. During the dissections in communities, it
was easy to remove and sample the entire gastrointestinal tract (GIT) specifically for litter and MP
analysis (Provencher et al., 2013). The removal of the intact GIT is aligned with the recommended
protocols for seabird monitoring (Provencher et al., 2019) and thus provides standardized metrics for
global comparisons (Provencher et al., 2017).
4.5.2 Including litter and microplastics monitoring in other types of programs
In addition to the contaminant-focused monitoring programs, there are a variety of other opportunities for
collecting samples that can provide information on litter and MP in the region. For example, fishery
management-based programs are being used in Canada and Norway to collect fish samples for litter and
MP assessments. In the Canadian Arctic, fisheries monitoring programs have collected samples of Arctic
char (Salvelinus alpinus) for litter and MP assessments (B. Hamilton, personal communication).
Additionally, some research programs can collect non-target species, e.g., bycatch in fisheries, for litter
and MP monitoring. This has been applied in Arctic Canada where seabirds accidentally caught by
fisheries (Northern Fulmars, Fulmarus glacialis; Anderson et al., 2018) have been examined for plastics
(Mallory et al., 2006). In Norway, ecosystem cruises, which contribute to the population monitoring of
seafood fish species for sustainable catch, now house manta trawling equipment for plastic in water and
plankton, and they also record macroplastic observations (Grøsvik et al., 2018)
Ships of opportunity can also be used to survey litter on the surface of the water via cruises. Mallory et
al., 2021 reported floating litter throughout the Canadian Arctic as part of at-sea bird surveys aboard ice-
breaking vessels. Based on at-sea surveys covering 263,543 km of marine survey transects, anthropogenic
debris was observed floating in marine waters from the southeastern coast of North America into the
Canadian Arctic, north to ~78° N. Over this region, 1,266 pieces of floating debris were observed, of
which 74% were plastics (Mallory et al., 2021). Such data collection may help fill in knowledge gaps in
regions where only a few vessels transit each year.
Community-based monitoring can contribute to monitoring litter and MP in the Arctic region. For
example, Norwegian northern minke whale (Balaenoptera acutorostrata) hunters report their plastic litter
observations to researchers. In Canada, Indigenous hunters are collaborating with research teams to
contribute samples from subsistence harvests for litter and MP work, including ringed seals (Pusa
hispida; Bourdages et al., 2020), beluga, (Delphinapterus leucas; Moore et al., 2020), and walrus
(Odobenus rosmarus; underway in Nunavut; J. Provencher, personal communication). Indigenous
knowledge platforms like the SIKU program in northern Canada (https://sikuatlas.ca/index.html) and
other community-based programs could be expanded to include litter observations.

AMAP Litter and Microplastics Monitoring Guidelines
246
There may also be opportunities for industry and tourism operators to contribute to litter and MP
monitoring. For example, Mallory et al., 2021 used a rapid shoreline survey technique aboard a tourism
cruise ship to survey shoreline litter. This study sought to implement a variety of methods used to study
plastic debris in the marine environment of Arctic Canada and west Greenland, where there are limited
data currently. In this study, coastal debris was dominated by plastic pieces (73%), but also metal (8%),
glass (8%), processed wood (7%), cardboard (2%), and cloth (< 1%), thereby helping to understand what
litter is found in the region (Mallory et al., 2021). These numbers reflect other Arctic observations in
which plastic dominated marine litter observations in the upper 60 m depth (86.4 ± 16.5% by weight)
over a seven-year study period (Grøsvik et al., 2018). These types of rapid assessments should be
considered to gain knowledge about litter and MP in regions where data are minimal.
4.5.3 Ongoing monitoring programs
Given that litter and MP are ubiquitous and have been found in nearly all environmental compartments in
the Arctic (e.g., snow, ice, water, sediments, beaches, the sea floor, zooplankton, fish, birds, and
mammals), it would be advisable to engage with ongoing monitoring programs to ensure efficient use of
samples and resources. Additionally, benefits accrue in learning from past experiences and exploring
multi-purpose uses of supporting data.
Future sampling can be carried out in collaboration with existing programs that are already in place
(Figure 4.8) and sampling (i.e., collection method or species) can be implemented across most of the
Arctic without additional need for infrastructure or technology development.
Possibilities for synergies will be further explored in the AMAP Litter and Microplastics Monitoring
Plan, which will accompany the monitoring guidelines.

AMAP Litter and Microplastics Monitoring Guidelines
247
Figure 4.8 Locations of current chemical contaminants (atmosphere deposition, ice and snow,
invertebrates, fish, sediments, and water), litter (via beaches), and population (seabirds, fish, and
mammals) monitoring programs in the environmental compartments examined in the AMAP Litter and
Microplastics Monitoring Guidelines in which current monitoring could be augmented to include
additional metrics to collect information on litter and MP alongside existing contaminant monitoring
programs. Points are jittered to prevent overlap and make the symbols visible to demonstrate the spread of
the data.

AMAP Litter and Microplastics Monitoring Guidelines
248
References
Arctic Monitoring and Assessment Program (AMAP), 2017. Chemicals of Emerging Arctic Concern:
Summary for Policy-makers. Arctic Monitoring and Assessment Program, Oslo, Norway. [online] URL:
https://www.amap.no/documents/doc/chemicals-of-emerging-arctic-concern.-summary-for-policy-
makers/1533
Anderson, C.M., S.A. Iverson, A. Black, M.L. Mallory, A. Hedd, F. Merkel and J.F. Provencher, 2018.
Modelling demographic impacts of a growing Arctic fishery on a seabird population in Canada and
Greenland. Marine Environmental Research, 142:80-90. https://doi.org/10.1016/j.marenvres.2018.09.021
Bourdages, M.P.T., J.F. Provencher, E. Sudlovenick, S.H. Ferguson, B.G. Young, N. Pelletier, M.J.J.
Murphy, A. D’Addario and J.C. Vermaire, 2020. No plastics detected in seal (Phocidae) stomachs
harvested in the eastern Canadian Arctic. Marine Pollution Bulletin, 150:110772.
https://doi.org/10.1016/j.marpolbul.2019.110772
Braune, B.M., A.J. Gaston, K.H. Elliott, J.F. Provencher, K.J. Woo, M. Chambellant, S.H. Ferguson and
R.J. Letcher, 2014a. Organohalogen contaminants and total mercury in forage fish preyed upon by thick-
billed murres in northern Hudson Bay. Marine Pollution Bulletin, 78:258-266.
https://doi.org/10.1016/j.marpolbul.2013.11.003
Braune, B.M., A.J. Gaston, K.A. Hobson, H.G. Gilchrist and M.L. Mallory, 2014b. Changes in food web
structure alter trends of mercury uptake at two seabird colonies in the Canadian Arctic. Environmental
Science and Technology, 48:13246-13252. https://doi.org/10.1021/es5036249
Braune, B.M. and R.J. Letcher, 2013. Perfluorinated sulfonate and carboxylate compounds in eggs of
seabirds breeding in the Canadian Arctic: temporal trends (1975–2011) and interspecies comparison.
Environmental Science and Technology, 47:616-624. https://doi.org/10.1021/es303733d
Dietz, R., C. Sonne, N. Basu, B. Braune, T. O’Hara, R.J. Letcher, T. Scheuhammer, M. Andersen, C.
Andreasen, D. Andriashek, G. Asmund, A. Aubail, H. Baagøe, E.W. Born, H.M. Chan, A.E. Derocher, P.
Grandjean, K. Knott, M. Kirkegaard, A. Krey, N. Lunn, F. Messier, M. Obbard, M.T. Olsen, S. Ostertag,
E. Peacock, A. Renzoni, F.F. Rigét, J.U. Skaare, G. Stern, I. Stirling, M. Taylor, Ø. Wiig, S. Wilson and
J. Aars, 2013. What are the toxicological effects of mercury in Arctic biota? Science of the Total
Environment, 443:775-790. https://doi.org/10.1016/j.scitotenv.2012.11.046
Grøsvik, B.E., T. Prokhorova, E. Eriksen, P. Krivosheya, P.A. Horneland and D. Prozorkevich, 2018.
Litter in the Barents Sea, a part of the joint Norwegian-Russian ecosystem survey. Frontiers in Marine
Science, 5:72. https://doi.org/10.3389/fmars.2018.00072
Irons, D., A. Petersen, T. Anker-Nilssen, Y. Artukhin, R. Barrett, D. Boertmann, M.V. Gavrilo, H.G.
Gilchrist, E.S. Hansen, M. Hario, K. Kuletz, M.L. Mallory, F.R. Merkel, A. Mosbech, A.L. Labansen, B.
Olsen, H. Österblom, J. Reid, G. Robertson, M. Rönkä and H. Strøm, 2015. Circumpolar Seabird
Monitoring Plan. CAFF Monitoring Report No. 17. CAFF International Secretariat, Akureyri, Iceland.
[online] URL: https://www.caff.is/monitoring-series/320-circumpolar-seabird-monitoring-plan
Julshamn, K., A. Duinker, M. Berntssen, B.M. Nilsen, S. Frantzen, K. Nedreaas and A. Maage, 2013a. A
baseline study on levels of polychlorinated dibenzo-p-dioxins, polychlorinated dibenzofurans, non-ortho
and mono-ortho PCBs, non-dioxin-like PCBs and polybrominated diphenyl ethers in Northeast Arctic cod

AMAP Litter and Microplastics Monitoring Guidelines
249
(Gadus morhua) from different parts of the Barents Sea By. Marine Pollution Bulletin, 75:250-258.
https://doi.org/10.1016/j.marpolbul.2013.07.017
Julshamn, K., A. Duinker, B.M. Nilsen, S. Frantzen, A. Maage, S. Valdersnes and K. Nedreaas, 2013b. A
baseline study of levels of mercury, arsenic, cadmium and lead in Northeast Arctic cod (Gadus morhua)
from different parts of the Barents Sea By. Marine Pollution Bulletin, 67:187-195.
https://doi.org/10.1016/j.marpolbul.2012.11.038
Julshamn, K., S. Frantzen, S. Valdersnes, B. Nilsen, A. Maage and K. Nedreaas, 2011. Concentrations of
mercury, arsenic, cadmium and lead in Greenland halibut (Reinhardtius hippoglossoides) caught off the
coast of northern Norway. Marine Biology Research, 7:733-745.
https://doi.org/10.1080/17451000.2011.594893
Letcher, R.J., J.O. Bustnes, R. Dietz, B.M. Jenssen, E.H. Jørgensen, C. Sonne, J. Verreault, M.M. Vijayan
and G.W. Gabrielsen, 2010. Exposure and effects assessment of persistent organohalogen contaminants in
Arctic wildlife and fish. Science of the Total Environment, 408:2995-3043.
https://doi.org/10.1016/j.scitotenv.2009.10.038
Lu, Z., A.O. De Silva, J.F. Provencher, M.L. Mallory, J.L. Kirk, M. Houde, C. Stewart, B.M. Braune, S.
Avery-Gomm and D.C.G. Muir, 2019. Occurrence of substituted diphenylamine antioxidants and
benzotriazole UV stabilizers in Arctic seabirds and seals. Science of the Total Environment, 663:950-957.
https://doi.org/10.1016/j.scitotenv.2019.01.354
Maage, A., B.M. Nilsen, K. Julshamn, L. Frøyland and S. Valdersnes, 2017. Total mercury,
methylmercury, inorganic arsenic and other elements in meat from minke whale (Balaenoptera
acutorostrata) from the North East Atlantic Ocean. Bulletin of Environmental Contamination and
Toxicology, 99:161-166. https://doi.org/10.1007/s00128-017-2106-6
Mallory, M.L., J. Baak, C. Gjerdrum, O.E. Mallory, B. Manley, C. Swan and J.F. Provencher, 2021.
Anthropogenic litter in marine waters and coastlines of Arctic Canada and West Greenland. Science of
the Total Environment, 783:146971. https://doi.org/10.1016/j.scitotenv.2021.146971
Mallory, M.L., H.G. Gilchrist, M. Janssen, H.L. Major, F. Merkel, J.F. Provencher and H. Strøm, 2018.
Financial costs of conducting science in the Arctic: examples from seabird research. Arctic Science,
4:624-633. https://doi.org/10.1139/as-2017-0019
Mallory, M., G.J. Robertson and A. Moenting, 2006. Marine plastic debris in northern fulmars from
Davis Strait, Nunavut, Canada. Marine Pollution Bulletin, 52:813-815.
https://doi.org/10.1016/j.marpolbul.2006.04.005
Moore, R.C., L. Loseto, M. Noel, A. Etemadifar, J.D. Brewster, S. MacPhee, L. Bendell and P.S. Ross,
2020. Microplastics in beluga whales (Delphinapterus leucas) from the Eastern Beaufort Sea. Marine
Pollution Bulletin, 150:110723. https://doi.org/10.1016/j.marpolbul.2019.110723
Poon, F.E., J.F. Provencher, M.L. Mallory, B.M. Braune and P.A. Smith, 2017. Levels of ingested debris
vary across species in Canadian Arctic seabirds. Marine Pollution Bulletin, 116:517-520.
https://doi.org/10.1016/j.marpolbul.2016.11.051
Provencher, J.F., S. Avery-Gomm, Max Liboiron, B.M. Braune, J.B. Macaulay, M.L. Mallory and R.J.
Letcher, 2018. Are ingested plastics a vector of PCB contamination in northern fulmars from coastal
AMAP Litter and Microplastics Monitoring Guidelines
250
Newfoundland and Labrador? Environmental Research, 167:184-190.
https://doi.org/10.1016/j.envres.2018.07.025
Provencher, J.F., A.L. Bond, S. Avery-Gomm, S.B. Borrelle, E.L. Bravo Rebolledo, S. Hammer, S. Kühn,
J.L. Lavers, M.L. Mallory, A. Trevail and J.A. van Franeker, 2017. Quantifying ingested debris in marine
megafauna: a review and recommendations for standardization. Analytical Methods, 9:1454-1469.
https://doi.org/10.1039/c6ay02419j
Provencher, J.F., S.B. Borrelle, A.L. Bond, J.L. Lavers, J.A. van Franeker, S. Kühn, S. Hammer, S.
Avery-Gomm and M.L. Mallory, 2019. Recommended best practices for plastic and litter ingestion
studies in marine birds: collection, processing, and reporting. FACETS, 4:111-130.
https://doi.org/10.1139/facets-2018-0043
Provencher, J.F., M. McEwan, M.L. Mallory, B.M. Braune, J. Carpenter, N.J. Harms, G. Savard and H.G.
Gilchrist, 2013. How wildlife research can be used to promote wider community participation in the
North. Arctic, 66:237-243. https://doi.org/10.14430/arctic4302
Rigét, F., A. Bignert, B. Braune, M. Dam, R. Dietz, M. Evans, N. Green, H. Gunnlaugsdóttir, K.S.
Hoydal, J. Kucklick, R. Letcher, D. Muir, S. Schuur, C. Sonne, G. Stern, G. Tomy, K. Vorkamp and S.
Wilson, 2019. Temporal trends of persistent organic pollutants in Arctic marine and freshwater biota.
Science of the Total Environment, 649:99-110. https://doi.org/10.1016/j.scitotenv.2018.08.268
Rochman, C.M., 2015. The complex mixture, fate and toxicity of chemicals associated with plastic debris
in the marine environment. In: Bergmann, M., L. Gutow and M. Klages (Eds.). Marine Anthropogenic
Litter, pp. 117-140. Springer International. https://doi.org/10.1007/978-3-319-16510-3_5
Skjerdal, H., H.E. Heldal, J. Gwynn, E. Strålberg, B. Møller, P.L. Liebig, I. Sværen, A. Rand, T. Gäfvert
and H. Haanes, 2017. Radioactivity in the marine environment 2012, 2013 and 2014. Results from the
Norwegian National Monitoring Programme (RAME). StrålevernRapport 2017:13. Norwegian Radiation
Protection Authority, Østerås, Norway. [online] URL: https://www2.dsa.no/publication/nrpa-report-2017-
13-radioactivity-in-the-marine-environment-2012-2013-and-2014.pdf
Tyack, P.L., J. Miksis-Olds, J. Ausubel and E.R. Urban, Jr., 2021. Measuring ambient ocean sound during
the COVID-19 pandemic. Eos, 102. https://doi.org/10.1029/2021EO155447

AMAP Litter and Microplastics Monitoring Guidelines
251
5.0 Future Work for AMAP
The current Monitoring Plan is envisaged as part of a phased approach to work on litter and microplastics
(MP). The Monitoring Plan has been based on the best available knowledge at the time of writing, and it
is recognized that future work should focus on other aspects of litter and MP in the environment (i.e.,
contaminants and biological effects), and should revisit technical guidance and monitoring plan
recommendations on a regular cycle to maintain up-to-date, evidence-based decision making. Reviewing
and updating are important because this topic is under considerable development, therefore the documents
must be reviewed at regular intervals.
2019-2021 – Technical guidance and monitoring plan development for litter and
microplastics
This first phase focuses solely on the monitoring of litter and MP in the Arctic, to create a framework that
countries can use to implement harmonized litter and MP monitoring to ensure that spatial and temporal
trends may be assessed in the future. The Monitoring Plan is part of this first phase, which also includes
detailed monitoring guidelines.
Future work – Gap analysis and review of the effects from litter and microplastics with a
focus on chemical contaminants from plastic pollution
Following the monitoring framework in phase 1 (2019-2021), a review and gap analysis have been
proposed on the state of knowledge of known effects of litter and MP, including entanglement of biota
and ingestion of plastic. This phase will also address plastic as a vector for chemical contaminants and its
biological effects. Although the first phase will have focused strictly on monitoring the physical presence
of plastic pollution, this next phase of the work will focus on the chemical contaminants of litter and MP
and their effects. Litter and MP are both particulate and chemical contaminants, thus this effects project
will include both the chemical contaminant effects and the potential negative effects on ecosystems due to
the particulate nature of plastics (i.e., vectors for introduced species, inflammations, clogging of digestive
tracts, effects on metabolism).
Future work – Updating the AMAP Litter and Microplastics Monitoring Guidelines and the
Monitoring Plan
It is recognized that there is a great deal of work underway to develop methods in relation to assessing
plastic pollution in the environment, specifically for MP and nanoplastics. For example, although MP and
nanoplastics in consumed wild species’ tissues is of great interest, there are currently no standardized
methods available that detect nanoplastics in wild tissue samples. Research and method development are
underway, and new advances are expected in the next two to five years given the large range of projects
being carried out. Therefore, it is recommended that the AMAP Litter and Microplastics Monitoring
Guidelines and Monitoring Plan be revisited and revised on a two-five year cycle to update
recommendations and align them with emerging research findings.
Future work – Trend monitoring assessment
The third phase of AMAP’s work in this field will be to examine and synthesize all available material on
the spatial and temporal scales similar to other long-term trend assessments under AMAP. Ideally, this
work will be done once monitoring programs have been put in place for several years using the
framework developed in phase 1. This third phase will hopefully conduct an initial trends assessment and
also identify gaps in monitoring programs that should be prioritized to achieve a better understanding of
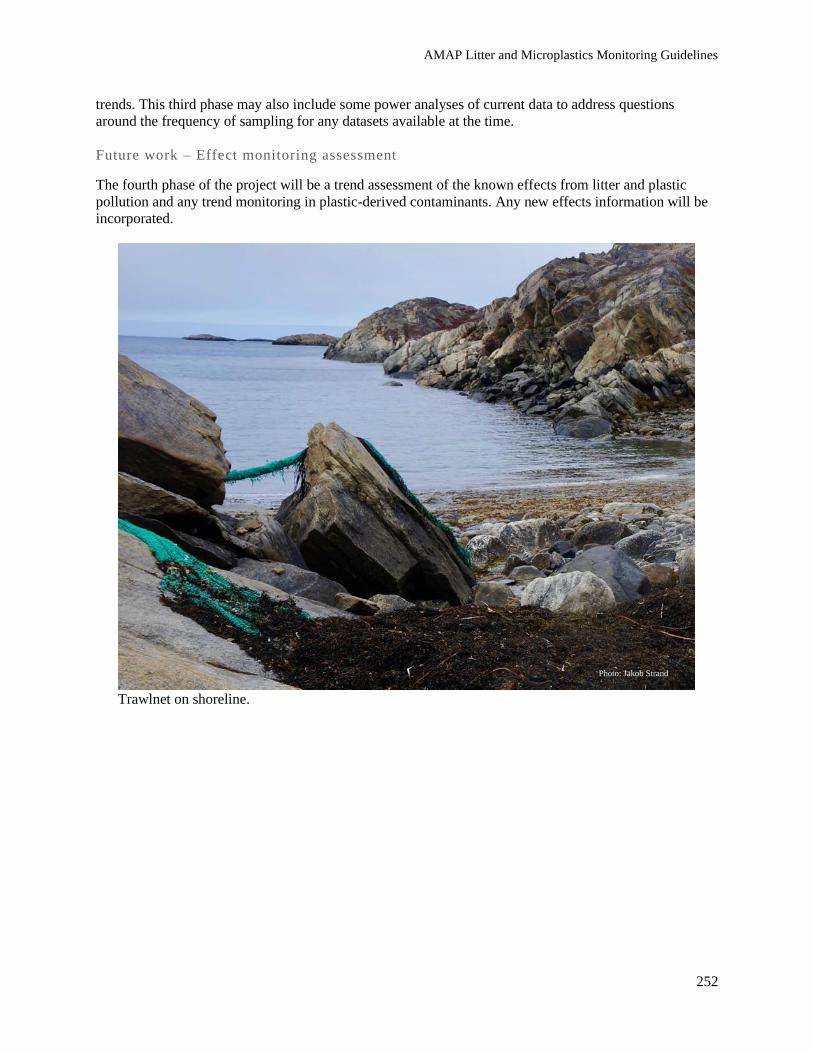
AMAP Litter and Microplastics Monitoring Guidelines
252
trends. This third phase may also include some power analyses of current data to address questions
around the frequency of sampling for any datasets available at the time.
Future work – Effect monitoring assessment
The fourth phase of the project will be a trend assessment of the known effects from litter and plastic
pollution and any trend monitoring in plastic-derived contaminants. Any new effects information will be
incorporated.
Trawlnet on shoreline.
Photo: Jakob Strand
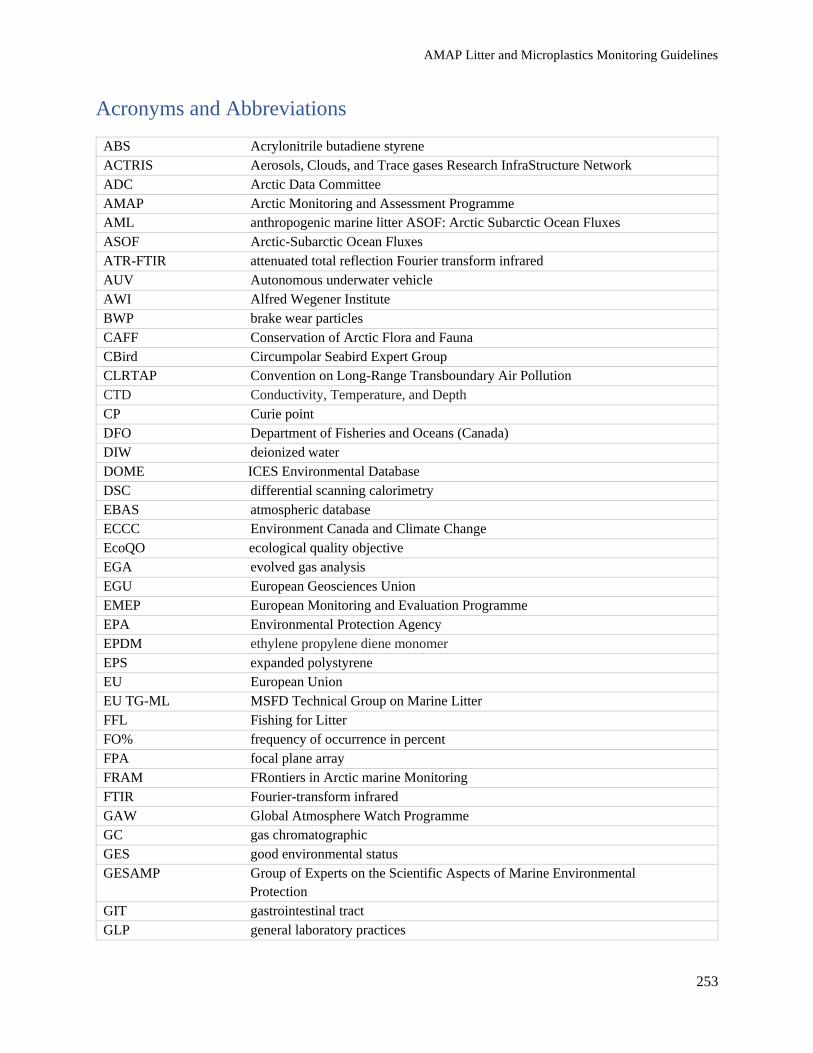
AMAP Litter and Microplastics Monitoring Guidelines
253
Acronyms and Abbreviations
ABS Acrylonitrile butadiene styrene
ACTRIS Aerosols, Clouds, and Trace gases Research InfraStructure Network
ADC Arctic Data Committee
AMAP Arctic Monitoring and Assessment Programme
AML anthropogenic marine litter ASOF: Arctic Subarctic Ocean Fluxes
ASOF Arctic-Subarctic Ocean Fluxes
ATR-FTIR attenuated total reflection Fourier transform infrared
AUV Autonomous underwater vehicle
AWI Alfred Wegener Institute
BWP brake wear particles
CAFF Conservation of Arctic Flora and Fauna
CBird Circumpolar Seabird Expert Group
CLRTAP Convention on Long-Range Transboundary Air Pollution
CTD Conductivity, Temperature, and Depth
CP Curie point
DFO Department of Fisheries and Oceans (Canada)
DIW deionized water
DOME ICES Environmental Database
DSC differential scanning calorimetry
EBAS atmospheric database
ECCC Environment Canada and Climate Change
EcoQO ecological quality objective
EGA evolved gas analysis
EGU European Geosciences Union
EMEP European Monitoring and Evaluation Programme
EPA Environmental Protection Agency
EPDM ethylene propylene diene monomer
EPS expanded polystyrene
EU European Union
EU TG-ML MSFD Technical Group on Marine Litter
FFL Fishing for Litter
FO% frequency of occurrence in percent
FPA focal plane array
FRAM FRontiers in Arctic marine Monitoring
FTIR Fourier-transform infrared
GAW Global Atmosphere Watch Programme
GC gas chromatographic
GES good environmental status
GESAMP Group of Experts on the Scientific Aspects of Marine Environmental
Protection
GIT gastrointestinal tract
GLP general laboratory practices

AMAP Litter and Microplastics Monitoring Guidelines
254
H2O2 hydrogen peroxide
HAUSGARTEN Long-Term Ecological Research Station observatory in the Fram Strait
HDPE high-density polyethylene
HELCOM Helsinki Commission
HPLC high-performance liquid chromatography
HVAC heating, ventilation, and air conditioning
IABP International Arctic Buoy Programme
IASC International Arctic Science Committee
IBTS International Bottom Trawl Surveys
ICES International Council for the Exploration of the Sea
ISO Organization for Standardization
ISTDpy internal pyrolysis process standards
IWC International Whaling Commission
KOH potassium hydroxide
LDPE low-density polyethylene
LMEG Litter and Microplastics Expert Group
LOD limit of quantification
LOQ lowest concentration
LTER long term ecological research
MALINOR Mapping marine litter in the Norwegian and Russian Arctic seas
MARPOL International Convention for the Prevention of Pollution from Ships
MCT mercury cadmium telluride
µFTIR micro-Fourier transform infrared
ML-RAP Marine Litter Regional Action Plan
MP microplastics
Milli-Q/MQ water water that has been purified using resin filters and deionized to a high
degree by a water purification system manufactured by Millipore
Corporation
MIZ marginal ice zone
MSFD Marine Strategy Framework Directive
NaI sodium iodide
NaOCl sodium hypochlorite
NASA National Aeronautics and Space Administration
NCP Northern Contaminants Program (Canada)
NEMO Nucleus for European Modelling of the Ocean
NFR Norwegian Research Council
NGO Non-governmental organization
NILU Norwegian Institute for Air Research
NML natural marine litter
NOAA National Oceanic and Atmospheric Administration (United States)
NR Nile Red
NSF National Science Foundation
NSIDC National Snow and Ice Data Center
OECD Organisation for Economic Co-operation and Development
OFOS Ocean Floor Observation System
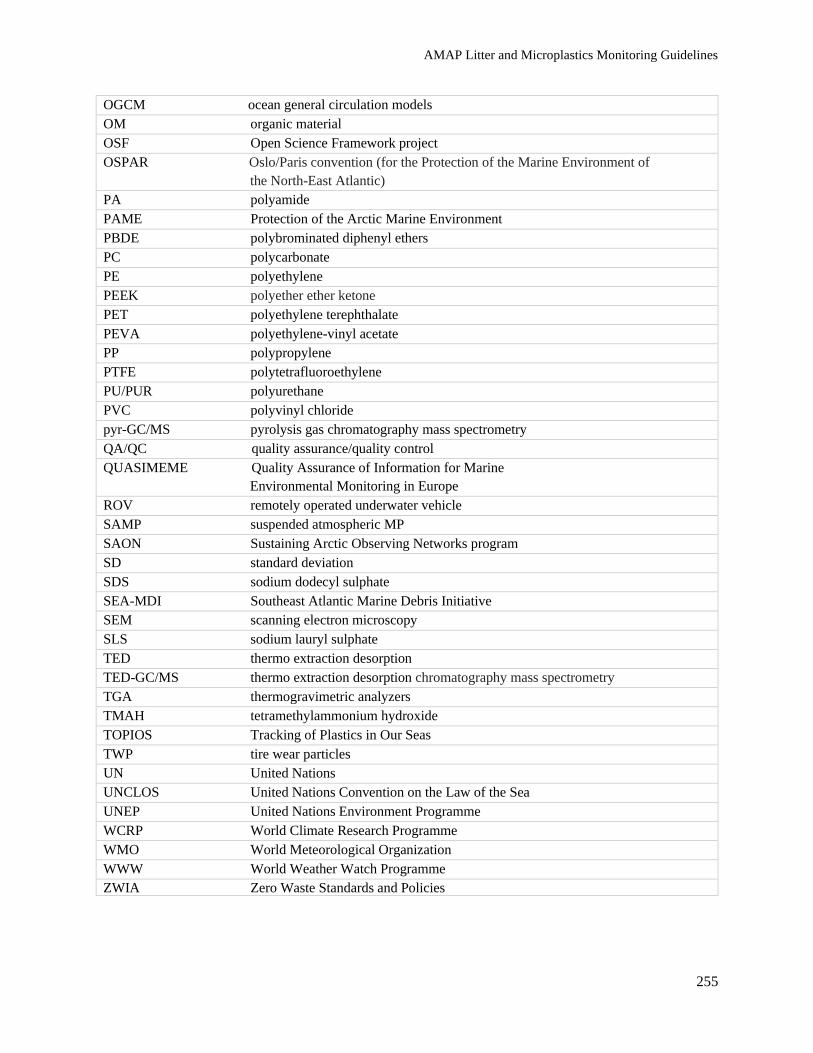
AMAP Litter and Microplastics Monitoring Guidelines
255
OGCM ocean general circulation models
OM organic material
OSF Open Science Framework project
OSPAR Oslo/Paris convention (for the Protection of the Marine Environment of
the North-East Atlantic)
PA polyamide
PAME Protection of the Arctic Marine Environment
PBDE polybrominated diphenyl ethers
PC polycarbonate
PE polyethylene
PEEK polyether ether ketone
PET polyethylene terephthalate
PEVA polyethylene-vinyl acetate
PP polypropylene
PTFE polytetrafluoroethylene
PU/PUR polyurethane
PVC polyvinyl chloride
pyr-GC/MS pyrolysis gas chromatography mass spectrometry
QA/QC quality assurance/quality control
QUASIMEME Quality Assurance of Information for Marine
Environmental Monitoring in Europe
ROV remotely operated underwater vehicle
SAMP suspended atmospheric MP
SAON Sustaining Arctic Observing Networks program
SD standard deviation
SDS sodium dodecyl sulphate
SEA-MDI Southeast Atlantic Marine Debris Initiative
SEM scanning electron microscopy
SLS sodium lauryl sulphate
TED thermo extraction desorption
TED-GC/MS thermo extraction desorption chromatography mass spectrometry
TGA thermogravimetric analyzers
TMAH tetramethylammonium hydroxide
TOPIOS Tracking of Plastics in Our Seas
TWP tire wear particles
UN United Nations
UNCLOS United Nations Convention on the Law of the Sea
UNEP United Nations Environment Programme
WCRP World Climate Research Programme
WMO World Meteorological Organization
WWW World Weather Watch Programme
ZWIA Zero Waste Standards and Policies

AMAP Litter and Microplastics Monitoring Guidelines
256
Authors and Affiliations
Name Affiliation
Lead
Eivind Farmen Norwegian Environment Agency. Section for Environmental Monitoring,
Norway
Jenn Provencher
Environment and Climate Change Canada | Government of Canada.
Ecotoxicology and Wildlife Health Division, Science and Technology
Branch, Canada
Canada
Julia Baak Acadia University
Madelaine P.T.
Bourdages
Aquatic Ecosystems & Environmental Change (AEEC) Laboratory
Department of Geography and Environmental Studies
Carleton University
Bonnie Hamilton University of Toronto
Liisa Jantunen Air Quality Processes Research Section, Environment and Climate Change
Canada,
Max Liboiron Memorial University of Newfoundland and Labrador
Mark Mallory Acadia University
Diane Orihel Queen’s University
Liz Pijogge Nunatsiavut Government
Chelsea M. Rochman University of Toronto
Jesse C. Vermaire Institutes of Environmental Science and Integrated Science
Denmark
Louise Feld Aarhus University
Jannie Fries
Linnebjerg
Department of Bioscience - Arctic Ecosystem Ecology, Aarhus University
Flemming Ravn
Merkel
Department of Bioscience - Arctic Ecosystem Ecology, Aarhus University
Jakob Strand Aarhus University
Katrin Vorkamp Aarhus University
Faroe Islands
Sjúrður Hammer Faroe Marine Research Institute (FAMRI)
France
Francois Galgani IFREMER
Germany
Melanie Bergmann Alfred Wegener Institute
Gunnar Gerdts Alfred Wegener Institute
Ilka Peeken Alfred Wegener Institute, Helmholtz Centre for Polar and Marine Research
Sebastian Primpke Alfred Wegener Institute, Helmholtz Centre for Polar and Marine Research
B. Scholz-Boettcher Institute for Chemistry and Biology of the Marine Environment (ICBM),
University of Oldenburg
Iceland
Hermann Dreki Guls University of Iceland's Research Centre
Halldór Pálmar
Halldórsson
University of Iceland's Research Centre in Sudernes
Italy
Stefano Aliani Institute of Marine Science of CNR
Norway
Andy M. Booth SINTEF Ocean

AMAP Litter and Microplastics Monitoring Guidelines
257
Lene Buhl-Mortensen Institute of Marine Research (IMR)
Geir Wing Gabrielsen Norwegian Polar Institute
Alessio Gomiero Norwegian Research Centre (NORCE)
Bjørn Einar Grøsvik Institute of Marine Research (IMR)
Ingeborg G. Hallanger Norwegian Polar Institute
Dorte Herzke Norwegian Institute for Air Research (NILU)
Mats Huserbråten Institute of Marine Research (IMR)
Tanja Kögel Institute of Marine Research (IMR)
Amy L. Lusher NIVA
Sweden
Maria E. Granberg IVL Swedish Environmental Research Institute
Kerstin Magnusson IVL Swedish Environmental Research Institute
USA
Peter Murphy NOAA Marine Debris Program (MDP), Alaska
AMAP Secretariat
Jan Rene Larsen Arctic Monitoring and Assessment Programme (AMAP) Secretariat,
Norway

AMAP Litter and Microplastics Monitoring Guidelines
258
Version history
Version Description
1.0 This version

AMAP Secretariat
The Fram Centre,
Box 6606 Langnes,
9296 Tromsø, Norway
T +47 21 08 04 80
F +47 21 08 04 85
www.amap.no