little north fork noyo fishery study, 1992 coast cascade ... · little north fork noyo fishery...
TRANSCRIPT
Little North Fork Noyo Fishery Study, 1992
Bradley E. Valentine (Biologist)and Marc Jameson (Forester)
California Department of Forestry and Fire ProtectionCoast Cascade Region
PO Box 670Santa Rosa, CA. 95401
February 1994
ABSTRACT
Burns (1970, 1971, 1972) studied the impacts of logging onsalmonid fishes of California's North Coast before, during, andafter logging in several watersheds during the late 1960%. Sincethen, logging has continued under regulations that have becomeincreasingly more protective of aquatic habitat. Despite thisadditional protection, salmonid populations continued to decline tothe point where a number of stocks are considered at-risk (Nehlsenet al. 1991).
During the summer and autumn of 1992, we replicated portionsof Burns' work on the Little North Fork of the Noyo River inMendocino County. At five lOO+ m study sites, we estimated aquaticvertebrate populations and measured habitat features: area andvolume of water, habitat types, residual pool depth, large woodydebris, sediment size distribution, and shade. Further, wedocument subsequent logging and stream clearing in the drainage.
Newts were captured at one site, but not in numbers sufficientto estimate population size. Yellow-legged frogs were captured insubstantial numbers, but only at the downstream-most site. Sculpinwere captured at 4 of 5 sites. Pacific giant salamanders, cohosalmon, and steelhead rainbow trout were captured at each site. Ofthe three species captured at each station, dominance as measuredeither by populations or by biomass differed among sites. Whilethe total salmonid biomass was similar among 1992 and the 1966-69period, the species composition inverted from primarily coho salmonto primarily steelhead trout.
During the logging activities of Burn's studies, the stream'swidth increased and depth decreased. By 1992, our data suggeststhat stream depth had recovered, if not increased, while streamwidth was intermediate between Burn's pre- and post-logging period.Protection from solar insolation (" shade canopy) had recovered andwas near maximum. Large woody debris was limited and showedevidence of removal. It was often oriented parallel to channelflow and thus had limited channel structuring functions. Inaddition, the supply of large woody debris appeared likely to
Little North Fork Noyo Fishery Study, 1992 Page 2
remain restricted into the near future as there was little evidencefor recruitment of large material with great longevity. Sedimentquality, when measured as percent fines < 0.85 mm, was intermediateto Burns' pre- and post-logging data. When expressed by the Fredleindex, the 1992 substrate samples estimate 30% and 50% survival-to-emergence for coho and steelhead, respectively. However, the truesurvival-to-emergence value of the streambed is greater than thesevalues because we did not apply correction factors for wet-sievingor the winnowing of fines caused by the fish's spawning actions.
The only habitat variables that appeared related to salmonidpopulations were those of the substrate. Plots suggest thatsteelhead populations followed a negative curvilinear relationshipwith percent fines. Coho salmon biomass suggests a positivecurvilinear relationship with the substrate's geometric meandiameter. Of the factors we evaluated, none clearly could belinked with the inversion of salmonid species. However, Burns didnot report on the woody debris dynamics during his period of study,thus we can not make determinations on this parameter of habitatquality.
Whether the inversion in salmonid species composition is areflection of current habitat conditions within the Little NorthFork of the Noyo or due to off-site factors, or simply chance, cannot be ascertained from our empirical information. The extended,severe drought seems likely to be an important contributor.
INTRODUCTION
Burns (1970, 1971, 1972) evaluated logging impacts on salmonidhabitat and populations in northern California streams during thelate 1960's. He investigated watersheds that had been loggedincluding Bummer Lake Creek, South Fork Yager Creek, South ForkCaspar Creek, and Little North Fork Noyo River. His results showedthat extensive use of bulldozers on steep slopes or in streamchannels can cause excessive erosion which may be detrimental tosalmonids. Also he suggested that warming of waters through canopyopening may be a problem. As a result of his studies, Burnsrecommended a number of measures which might ameliorate impactsincluding 1) retaining buffer strips to control water temperatureeffects and sediment input, 2) building roads away from streams,and 3) minimizing the amount of slash that enters a stream. Healso suggested that sustained logging and associated roadconstruction over a period of years may not allow a stream or itsfishery to recover from logging impacts.
In assessing the impacts of logging to fishery resources,Burns evaluated water quality, water temperature, spawning bedsedimentation (particle size distribution), juvenile salmonidabundance, and insect (fish food) abundance. Each stream wasevaluated for three summers; one before, one during, and one afterlogging.
Little North Fork Noyo Fishery Study, 1992 Page 3
Since the time of Burns' studies, the Z'berg Negedly ForestPractices Act of 1973 was passed. The resultant California ForestPractices Rules have continued to evolve to protect environmentalresources. Many of the Forest Practices Rules' major focus is theprotection of aquatic resources and address the three itemsrecommended by Burns.
The California Department of Forestry (JamesonValentine 1992a) proposed a pilot investigation to:
1989a,
1. Repeat aspects of Burns' earlier studies to determine if thereare discernable trends in the parameters he measured, andrelate those to timber harvest activities in the drainagesince his studies,
2. Develop a database which could be used in the future tocontinue documenting trends,
3. Collect additional coldwater habitat information beyond thatof Burns.
MATERIALS AND METHODS
Study Sites
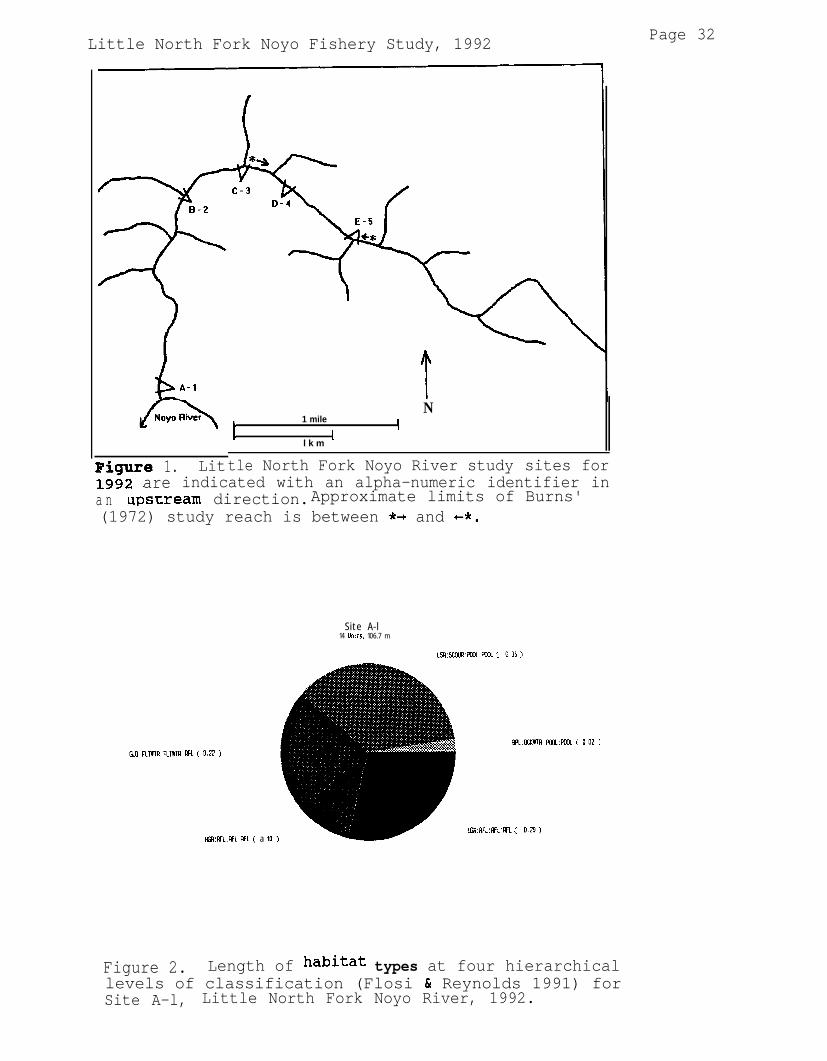
During 1992, the project was initiated on the Little NorthFork Noyo River in Mendocino County, east of Fort Bragg (Fig. 1).The Little North Fork Noyo River drains a 989 ha watershedunderlain by Hugo soils and is 16.0 km from the ocean (Burns 1972).Its watershed is dominated by second growth redwood Douglas-firforests.
In 1992, after field reviewing the entire second and thirdorder "blue-line" extent of the watercourse, we concentratedstudies into five = 100 m study reaches (Fig. 1) distributedsystematically along the watercourse to capture the range ofvariability. For the purposes of this report, the study sites areidentified by a code starting from the downstream-most site andincreasing in an upstream direction; site A-l is near the LittleNorth Fork Noyo River and Noyo confluence, while E-5 is the mostupstream site (study reaches may be referenced by number orletter). Site 5-E was at the junction between second and thirdorder sections, and the other sites were in third order portions ofthe stream. Thewere marked withwoody vegetation.
downstream and upstream end of each study siteflagging and an aluminum tag affixed to nearby
The criteriawere:0 Gross slope
we used in establishing all intensive study sites
(calculated from the USGS Noyo Hill quad) is lessthan 3% to ensure that sediment storage reaches are the focusof the analysis.
0 Three or more consecutive stream sequences (pools and riffles)or 100 m long, whichever is longer. Our intent in sizingsections in this manner was to encompass most of the stream's

Little North Fork Noyo Fishery Study, 1992 Page 4
inherent variability in salmonid habitat.
Further considerations which assisted in final siting withinthe above parameters were:0 Three located (Sites B-l,C-3,5-E; Fig. 1) such that
approximately Y3 and l/s will be downstream and upstream,respectively, of the watershed's largest tributaries' inflows.This location promised insight into land management impactspartitioned between the mainstem and the tributaries asaffected by area-discharge relationships,
0 One (Site A-l, Fig. 1) is located near the mouth of the LittleNorth Fork Noyo River where there are no delineatedtributaries on the quad. It was immediately upstream ofobvious backwater effects from the Noyo River, as evidenced bysediment accumulations. This location should consolidate theimpacts of many of the up-drainage activities,
0 One site (Site D-4, Fig. 1) located where the gross slope isthe least. This reach was sited to avoid direct tributaryinfluences. It may be prone to sedimentation.
Burns studied a 1,530 m reach of the Little North Fork of theNoyo River in its mid-section (Fig. 1). Along that, he collectedhis sediment samples systematically. Vertebrate sampling wasconcentrated into four approximately 100 m reaches, the endpointsof which were permanently established with metal stakes. Thereaches' length varied each year due to channel changes resultingfrom upslope and instream logging practices and hydrology(J.W.Burns, California Coastal Commission, San Francisco, pers.commun.). The exact locations of Burns' four study reaches areunknown, only that they are within the larger reach. Of the studysites sampled in 1992, C-3, D-4, and E-5 are within Burns' studyreach, B-2 is marginal, and A-l is well downstream.
Human Modification of the Stream Channel
Logging History.-- Detailed historical records do not existfor logging which occurred prior to 1964. The historicalinformation referenced included Georgia-Pacific Corporationrecords, aerial photographs, timber inventory plot data, andinterviews with current and retired Georgia Pacific employees.
For logging subsequent to 1964, we obtained the annual timberdepletion maps maintained by Georgia-Pacific Corporation andtranscribed it to the U.S.G.S. 7.5 minute quadrangle maps (NoyoHill). The harvest areas by year of cut were planimetered and anacreage computed. Silvicultural system and yarding method forharvests prior to 1973 were ascertained from company depletionrecords and interviews with current and retired Georgia Pacificemployees. Silvicultural system and yarding methods for harvestafter 1973 were obtained from California Department of Forestry andFire Protection's timber harvest record files in Santa Rosa andGeorgia-Pacific harvest records.

Little North Fork Noyo Fishery Study, 1992 Page 5
Mapping the Channel. --We sketched each study section along itsentire length moving in an upstream direction. The resultant mapsare not to scale and only approximate the characteristics andrelative dimensions of the channel and near-channel features.Mapping focused on woody debris associated with the channel, thechannel banks, near-channel trees, stumps and snags, existing andabandoned roads, skid trails, landings and railroad grades. Thehabitat typing was conducted separate from the channelillustration, and the types indicated were applied to theillustrations after comparing the illustrations with the typingdata.
Unless noted otherwise, objects depicted within andimmediately adjacent to the wetted channel are woody debris.Unless noted otherwise, skid trails, roads, and the railroad gradeare all abandoned, pre-1973 facilities.
Debris (logjam) Removal .--Debris jam removal, the other majorwatershed activity which affects channel character, was evaluatedusing the Department of Fish and Game's project records andevidence mapped during the field studies.
Habitat
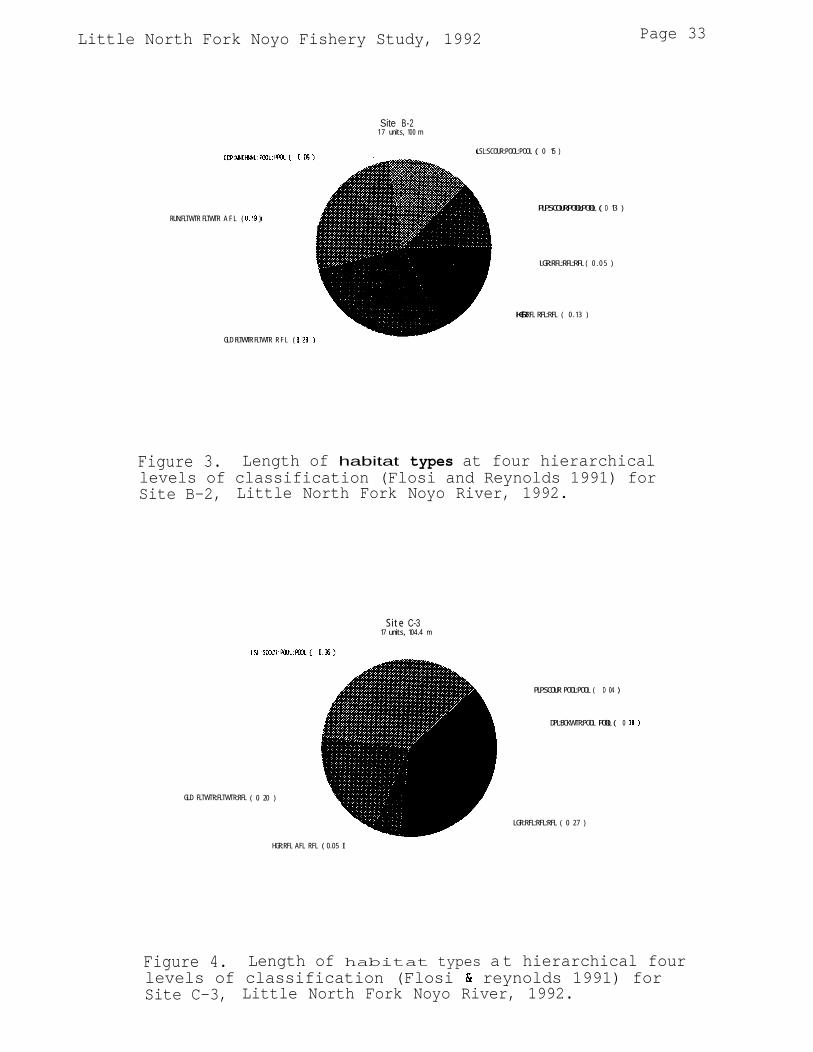
Typing. --The study reaches were typed by recording thelongitudinal length along the thalweg of habitat types as definedby Flossi and Reynolds (1991). Typing was to Level IV relative towater conditions (low-flow levels) at the time of sampling; i.e.,we did not attempt estimate conditions at bankfull or flood-plainflows. Only units greater than the average wetted-width for theentire reach were considered distinct types (Flossi and Reynolds1991). Habitat is portrayed in pie charts which exhibit thepercentage of each site by type at each level. Ratios werecalculated using the unit's lengths, not areas.
Quantification. --We measured the dimensions of each habitattype to quantify available habitat. Depth for each unit was thearithmetic average of 5-8 (number depending on length of the unit)random depths along the thalweg. Width for each unit was measuredat the location which we visually estimated to be the "average" or"median" width. The values acquired for each unit were then usedto calculate surface area andfor the entire study section.
volume of water available as habitat
The concept of "residual pool" depth (Lisle 1987) is a recentmetric of pool depth which is intended to eliminate the effects ofstage from depth measurements. "Residual pool"" depth is calculatedby subtracting the depth of the deepest water as it passes over thepool/riffle crest from the pool's deepest point (to surface of anysediment) found in the pool. Because salmonids are a primary focusof this evaluation and deep pools are relatively more valuable forcoho (McMahon 1983), we quantified only residual pools > 30 cm
Little North Fork Noyo Fishery Study, 1992 Page 6
deep. In addition to recording the depth of residual pools, thedistance between their deepest points was measured.
Pool quality was rated using the somewhat subjective coverdescriptions of Platts et al. (1987: 176). Pool-cover 'wasconsidered:
"abundant" and ranked 1 if instream cover was excellent and most ofthe perimeter had fish cover;
"intermediate" and ranked 2 if instream cover was moderate and # $of the pool perimeter has fish cover; and
"exposed" and ranked 3 if the there is poor instream cover and < %of the perimeter has fish cover.
We measured percent solar radiation blocked (= shade canopy)within each reach at 20 m intervals from the stream's center usingthe July solar arc grid of a Solar Pathfinder. At each point, thepercentage of the sun arc blocked by vegetation was determined.The portion of the shade comprised of conifer or deciduousvegetation was estimated.
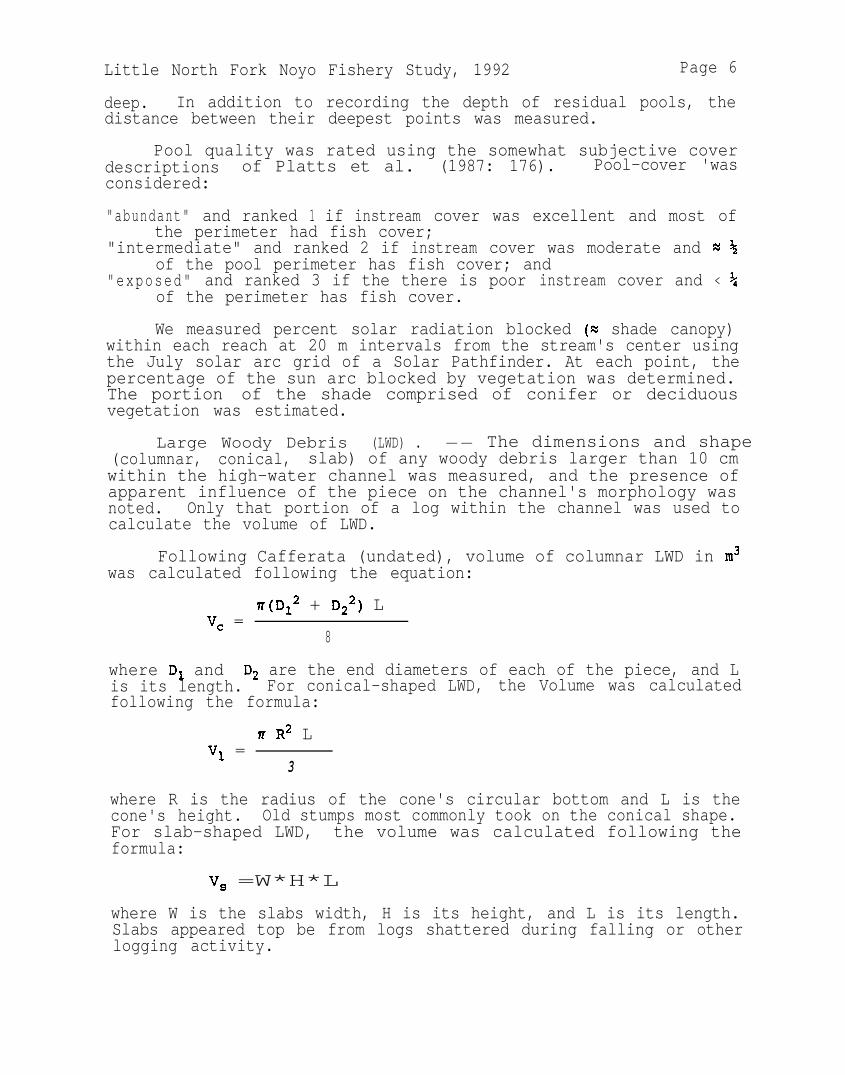
Large Woody Debris (LWD) . -- The dimensions and shape(columnar, conical, slab) of any woody debris larger than 10 cmwithin the high-water channel was measured, and the presence ofapparent influence of the piece on the channel's morphology wasnoted. Only that portion of a log within the channel was used tocalculate the volume of LWD.
Following Cafferata (undated), volume of columnar LWD in m3was calculated following the equation:
n(D12 + D22) LV, =
8
where D, and D2 are the end diameters of each of the piece, and Lis its length. For conical-shaped LWD, the Volume was calculatedfollowing the formula:
n R2 Lv1 =
3
where R is the radius of the cone's circular bottom and L is thecone's height. Old stumps most commonly took on the conical shape.For slab-shaped LWD, the volume was calculated following theformula:
%I =W*H*L
where W is the slabs width, H is its height, and L is its length.Slabs appeared top be from logs shattered during falling or otherlogging activity.
Little North Fork Noyo Fishery Study, 1992 Page 7
Substrate.-- We determined particle size distributionfollowing Valentine (1993). To summarize, bulk samples werecollected from the thalweg where the water's surface velocitynoticeably increased (breaks) as it passed from the tail of a poolinto a riffle. A single sample was collected from five pool /riffle breaks in each study reach. Where this sampling locationwas clearly not suitable for spawning as determined from thesubstrate's surface conditions, a sample was not taken. Only twosamples were moved to the next upstream pool / riffle break forthis reason.
Samples were collected using two McNeil samplers (McNeil andAhnell 1960) with core dimensions of 14.4 cm ID x 13.4 cm and 15.2ID cm x 15.2 cm,2780 cm3,
resulting in nominal sample volumes of 2183 andrespectively. Samples were wet-sieved (Armour et al.
1983: 31) in the field following Valentine (1993), including a 10minute settling time for fines (co.85 mm). Substrate metricscalculated from the samples include percent of the samples passingthe 0.85 mm sieve ("fines"), the percent passing the 3.3 mm sieve,the geometric mean, and the Fredle index (Armor et al. 1983). Thevalue passing the 3.3 mm sieve was calculated mathematically usinga logarithmic conversion of particle sizes because naturalsediments frequently exhibit lognormaldistributions (Platts et al.1979).
Aquatic Vertebrates
Each study reach was sampled with a Smith-Root Model 12backpack electrofisher. Sites were fished for two (Site C-3 andSite D-4) or three (all others) passes, depending on the magnitudeof decline in captures between the first and second pass (Price andAdams 1982). A subsample of individuals collected were weighedusing Pesola spring scales. The size of all individuals wasmeasured using fork length for fishes and snout-vent length forsalamanders. Populations of each vertebrate taxa -- with theexception of yellow-legged frogs -- with adequate numbers ofrepresentatives captured were estimated in each study reachfollowing the removal depletion strategy and calculated using thesoftware (MicroFish 3.0) of Van Deventer and Platts (1989).Population estimates and biomass were then converted to "density"estimates by dividing them by surface area volume.
Fish/Habitat Relationships
Fish variables were plotted against habitat variables topermit a visual inspection of potential habitat relationships.Because of the small sample size (five stations and one year), wedo not apply statistics of association.
RESULTS

Little North Fork Noyo Fishery Study, 1992 Page 8
In order to evaluate population conditions as near to theirin-stream bottleneck as possible, the studies proceeded from firstperforming habitat analysis followed several weeks later bypopulation analysis. Electrofishing was postponed as late in theseason as possible. As a result, the four upstream stations weresampled at the extreme low-flow period. Station A-1 was sampledafter an early fall storm, and the stage of the water hadnoticeably increased (x 5 cm).
Human Modification of the Stream Channel
Logging History. --Georgia-Pacific Corporation records includerailroad planning documents for the Little North Fork dated 3 1890;the earliest recorded evidence we found of logging related activityin the Little North Fork drainage. Increment cores taken in 1981from second-growth redwood trees indicate that some of the oldestsecond-growth stands about 90 years of age in 1992 (Georgia-PacificCorp. timber inventory plots). Company records indicate that theentire watershed was logged prior to 1920. Most of this earlylogging approximated clearcutting, but left scattered residual old-growth trees.
Between the early logging and the initial harvest of thesecond-growth is a long period absent of available logging records.Georgia-Pacific's depletion maps showed that harvest of the second-growth within the drainage was initiated in 1964. This harvest,and all which occurred prior to 1981, employed selectionsilviculture and was yarded with tractors (Robert Grundman,[Retired] Chief Forester for Union Lumber Company, Fort Bragg, CA,pers. commun.).
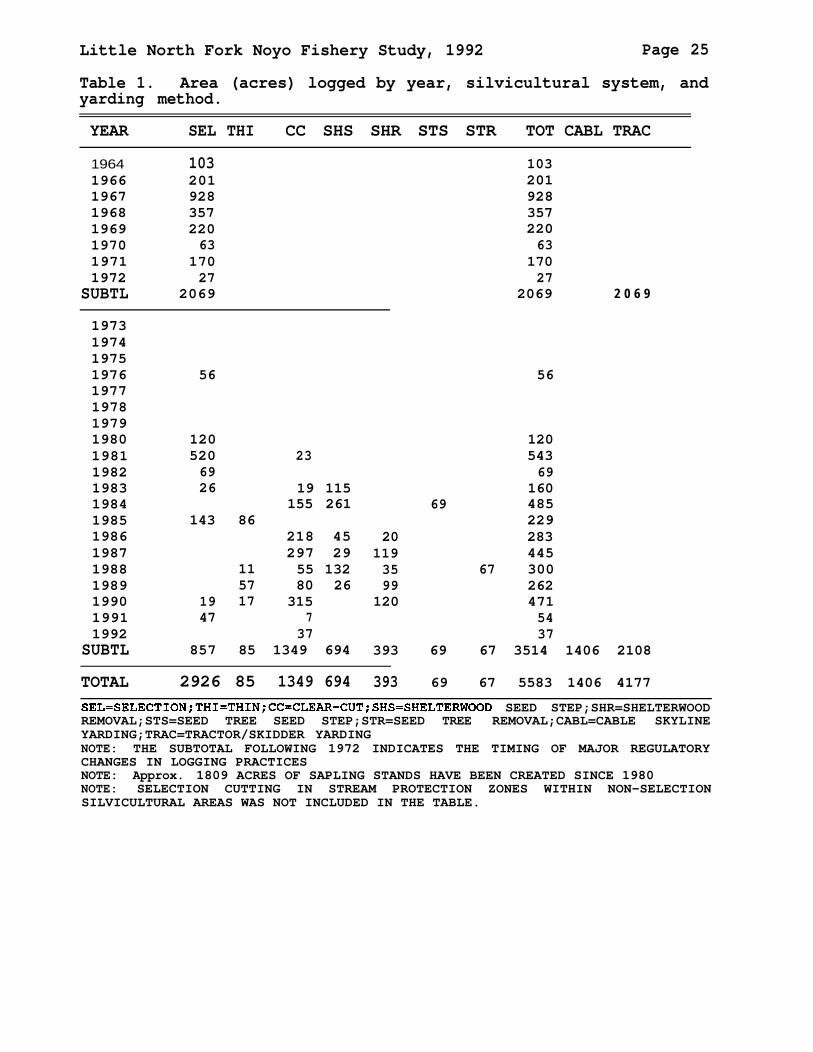
Over eighty-five percent of the drainage was logged between 1964 and 1972 (Table 1). Georgia-Pacific% 1975 aerial photographsshow this era's logging used a road system located primarilyadjacent to the stream system. The channel diagrams (Appendix A)depict those abandoned railroads, truck roads, and skid trails inproximity to the channel. Erosion control facilities are notevident on the abandoned roads and trails immediately adjacent tothe channel.
Many of the selectively cut stands within the drainage werelogged again, beginning in 1980. Between 1980 and the present,1809 acres of sapling-sized stands in the Little North Forkdrainage have been created and 3514 total acres have been harvestedsubsequent to the passage of the Z'berg Negedly Forest PracticesAct of 1973 (Table 1). Department of Forestry & Fire Protectionrecords show that clearcut areas were usually broadcast-burned tofacilitate planting. Subsequent to the original logging of theold-growth, the earliest clearcut was in 1981.
Mapping the Channel. --Abandoned railroad grades of the earlyera of logging follow immediately adjacent the Little North Forkmain channel along most of its length (Appendix A). Truck roads

Little North Fork Noyo Fishery Study, 1992 Page 9
and skid trails from the 1964-72 era are still evident near thechannel (Appendix A).
The channel of the Little North Fork is generally " U " shaped.The high-water banks are nearly vertical and typically under twometers tall. In many places, the stream appears to have erodedthrough fill material deposited prior to 1973. Logs with sawn endsprotrude from the banks in many areas, indicating that fill wasplaced upon them during the excavation of railroad grades, truckroads, and skid trails. The fill material has been subsequentlytemporarily stabilized by vegetation. Immediately adjacent to thebanks is a narrow flat which lies at the base of steep, timberedslopes. The abandoned logging facilities are vegetated by conifersaplings, riparian hardwoods, grasses and forbs. The slopes arevegetated, except for the currently maintained truck road. Theroad has a rocked surface and is drained towards an inside ditchwith relief culverts.
The timber adjacent to the channel and upon the slopes withinthe watercourse and lake protection zone (Title 14 CCR Section916.5, 1991) consists primarily of second-growth redwood, Douglas-fir, and tanoak. Windfalls in the channel area are primarilyDouglas-fir, which decomposes rapidly when compared to the wood ofold-growth redwood. Most of the woody debris within the channel isold-growth redwood, apparently deposited at least 70 years ago.
Debris (logjam) Removal.--In addition to the loggingactivities subsequent to 1973, Department of Fish and Game records(Anon. 1984, 1986) show that woody debris was removed from 50 log
jams in the channel of the Little North Fork Noyo River over a fouryear period between 1983 and 1986. The effects of this practiceare difficult to determine, because the before and afterevaluations were not documented. Jameson (1989b) estimated thatlog jam removal released approximately 1000 cubic yards of storedsediment within a 10,000 foot reach of the Little North Fork NoyoRiver. The purpose of the jam removal was to improve salmonidhabitat conditions through improved access and enhanced spawninggravels. During removal, logs keyed into the substrate weretypically retained, and notches were occasionally cut in keyed logsto facilitate upstream migration over obstructions. During ourfield work, we observed three notched logs. In two of the threecases, the stream now flows beneath the keyed, notched log.
Habitat
Typing. --When categorized at the most coarse level (Level I),the sample sites ranged from 35 to 56 % pool, and conversely 44 to65 % riffle (Figs. 2 thru 6). Four of the sites were > 50 %riffle.
At the next more complex level of typing (Level II), 20 to 46%of the sites were comprised of "flatwater" types (Figs. 2 thru 6),a subcategories of riffles. The make-up of each site at the two

Little North Fork Noyo Fishery Study, 1992 Page 10
more complex levels (III and IV) of habitat typing furthersubdivide the habitat types. Finally, the"all units" graph (Figs.2 thru 6) displays the habitat types at Level IV without summingunits within the same type -- these graphs portray the complexityof the channels as measured by total number of habitat types withinthe study reach. A trend towards fewer, longer habitat units perstudy reach is apparent in a downstream direction.
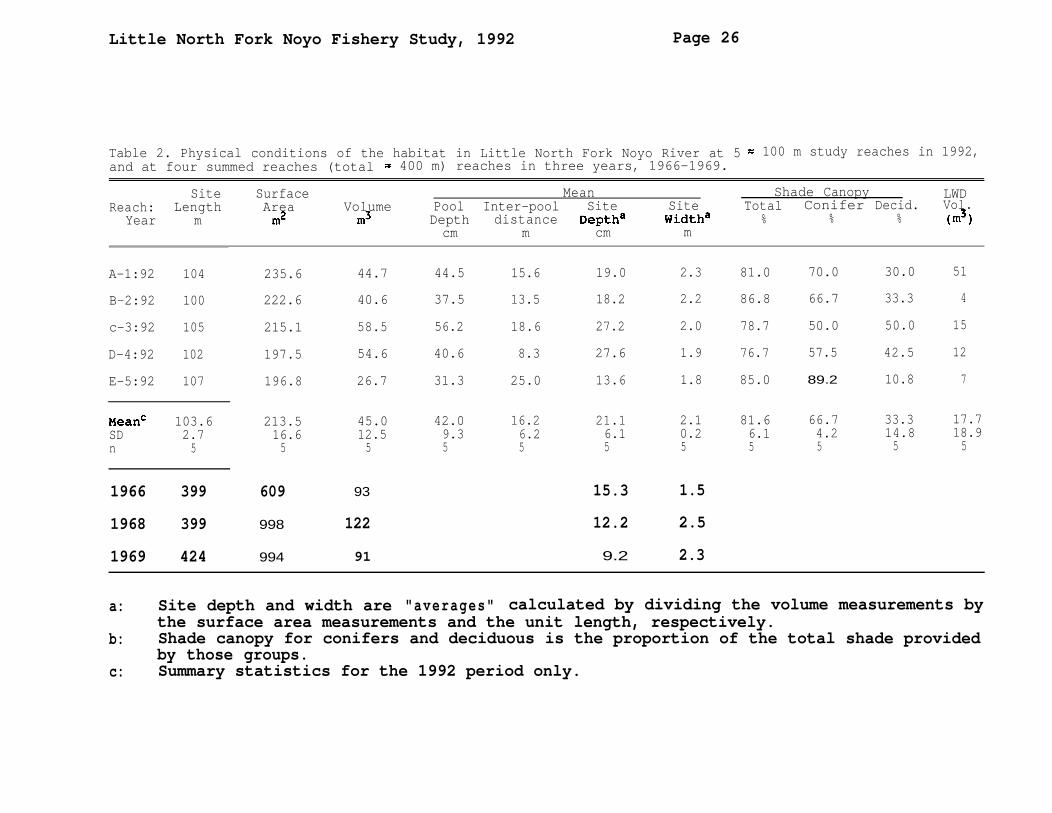
Quantification.-- In order to delimit the 1992 study sites athabitat type junctions, the length of the units differed from 100m (Site B-2) to 107 m (Site E-5) (Table 2). Surface area of thefive 1992 sites increased in a downstream direction, and rangedfrom 196.8 to 235.6 m2 (Table 2), with an average width of between1.8 and 2.3 m. From 1966 through 1969, the surface area for thesummed study reaches ranged from 600 to 998 m2 (Table 2, and Table6l of Burns 1972), with an average width of between 1.5 to 2.5 m.
Water volume for the five 1992 sites ranged from 26.7 to 58.5m3 and did not follow any observable trend along the watercourse(Table 2). By dividing the volume by the surface area, an averagedepth for the site is calculated. For the five 1992 sites, sitedepths averaged from 13.6 to 27.6 cm with no apparent trend alongthe stream. During 1992, mean residual pool (>30 cm) depth rangedfrom 31.3 to 56.2 cm and the average distance between thesubsequent residual pools greater than 30 cm ranged form 8.3 to25.0 m for the five 1992 sites.
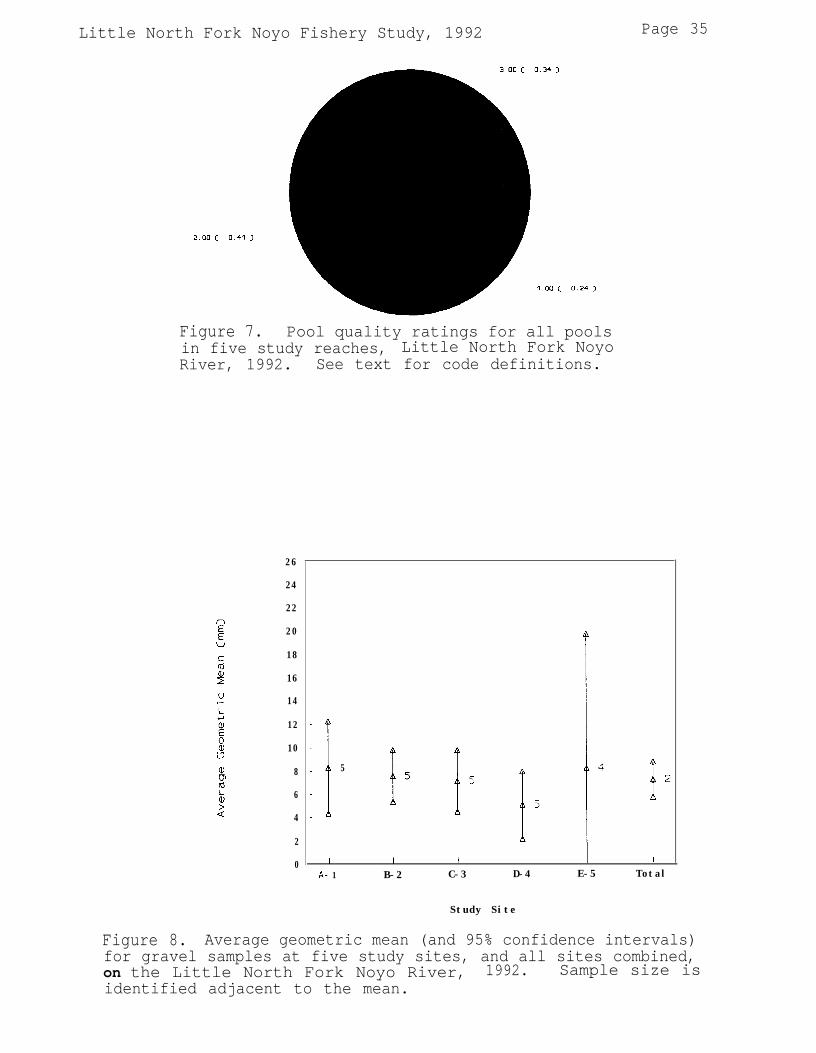
Pool-cover quality was classified dominantly as "moderate",with a lesser proportion of pools classified as having " p o o r "cover, and the fewest pools were classified as having "abundant"cover (Fig. 7).
Timing of the shade measurements was late enough such thatdeciduous vegetation (willows and alders) had initiated leaf drop;however, the amount retained was still substantial. Thus, shadecanopy measures are probably somewhat conservative. Percent solarradiation of the July sun arc blocked ranged from 76.7 to 86.8 %(Table 2). Of the vegetation shading the stream during July,coniferous vegetation dominated; although at study site C deciduousforms provided an equal amount of the shade (Table 2).
LWD. -- Large woody debris ranged from 4 to 51 m3, andaveraged 17.7 m3 (Table 2). While not recorded, the speciescomposition appeared important. Redwood, which probably originatedprior to or during the logging activities studied by Burnsdominated the in-bed, channel structuring elements and remainedsound. Fir and hardwoods were generally small diameter, very weak,and disintegrating. Orientation of LWD relative to the stream'saxis was not recorded either. However, much of the instream,
1 The area measurements of Table 6 in Burns' (1972) are oneorder of magnitude too high (Burns, pers. commun.).

Little North Fork Noyo Fishery Study, 1992 Page 11
channel forming elements were oriented parallel to the stream flow.The few elements which were perpendicular to the stream flow wereassociated with more complex channels (deeper, wider pools) thanwhere materials were parallel to stream flow. Extensive log-jamremoval was evidenced by wood chunks thrown above the annual highwater channel and by recent-past sediment deposits.
Substrate. --Data tables are provided in Appendix B. Characterof the substrate particles varied in a downstream direction. Atthe upstream study sites, gravels were noticeably more angular andlayered than they were in the downstream reaches.
Geometric mean particle size for the five study sites rangedfrom 5.0 to 8.3 mm (Table 3, Fig. 8). For all sites combined, thegeometric mean averaged 7.2 mm. There was no obvious trend alongthe watercourse (Fig. 8). Variance was extreme at Site 5 (Table 3,Fig. 8), due to a sample (Sample C, Appendix B) being collectedfrom a location with very clean gravels and another (Sample D,Appendix B) which hit clay pockets. Site 5 was immediatelydownstream of an abandoned truck road crossing which wasconstructed in 1969. There was no obvious relationship betweensites' average geometric mean and their variance (Table 3).
The Fredle Index for the five study sites ranged from 1.3 to2.4 (Table 3). For all sites combined, the Fredle Index averaged2.lmm. There was no obvious relationship between a sites' averageFredle Index and its variance (Table 3).
Substrate particles finer than 0.85 mm for the five studysites ranged from 20.8 to 31.2 percent of the samples (Table 3,Fig. 9). For all sites combined, the portion of samples less than0.85 mm averaged 25.4 percent. The percent of particles less than0.85 mm appears to be positively related with the variance. Theaverage percentage of substrate made of particles less than 0.85 mmmay show a positive trend in an upstream direction.
Wide variation in substrate content is apparent in both thegraphical representations of the particle size distributions (Figs.10 thru 14) and the standard deviations of the means for Dg, theFredle Index, and the percent fines (Table 3). While the threesubstrate quality measures are intended to describe thedistribution of the substrate, they obviously do so differently astheir rank sequence differ, although they are similar. Using siteaverages, the percent fines plotted against geometric means (Fig.15) suggests a negative relationship, but with substantial scatter.
Aquatic Vertebrates
Eight species were captured during the electrofishingoperations: Pacific giant salamander (Dicamptodon tenebrosus,formerly D. ensatus [Good 1989]), rough-skinned newt (Tarichagranulosa), yellow-legged frogs (Rana boylei), coho salmon(Oncorhynchus kisutch), steelhead trout (Oncorhynchus mykiss),
Little North Fork Noyo Fishery Study, 1992 Page 12
prickly and coastrange sculpin (Cottus asper and C. aleuticus), andthree-spine stickleback (Gasterosteus aculeatus).
Vertebrate species were not uniformly distributed. Newts werelocated on only one study site, and population estimates were notpossible. Numerous stickleback (population estimate 47 [Table 4])populated study site A-l, but no other site. Yellow-legged Frogswere captured during electrofishing only from station A-l, althoughfew (<15) were observed early in the season along the reach duringproject reconnaissance level-work. Frog population was notestimated at A-l because they readily escaped the holding tankduring passes, violating assumptions of the depletion method.
Because of the low total number of captures, the sculpinspecies were grouped and population estimates for sculpin apply tothe genus. Sculpin were present in 4 of 5 stations at populationsbetween 1 and 11 individuals, being absent only form station C-2(Table 4).
Pacific giant salamanders were common at all sites, and at twosites (D-4 and E-5) were the most numerous vertebrate taxa.Population estimates ranged from 28 to 151 per study site (Table4).
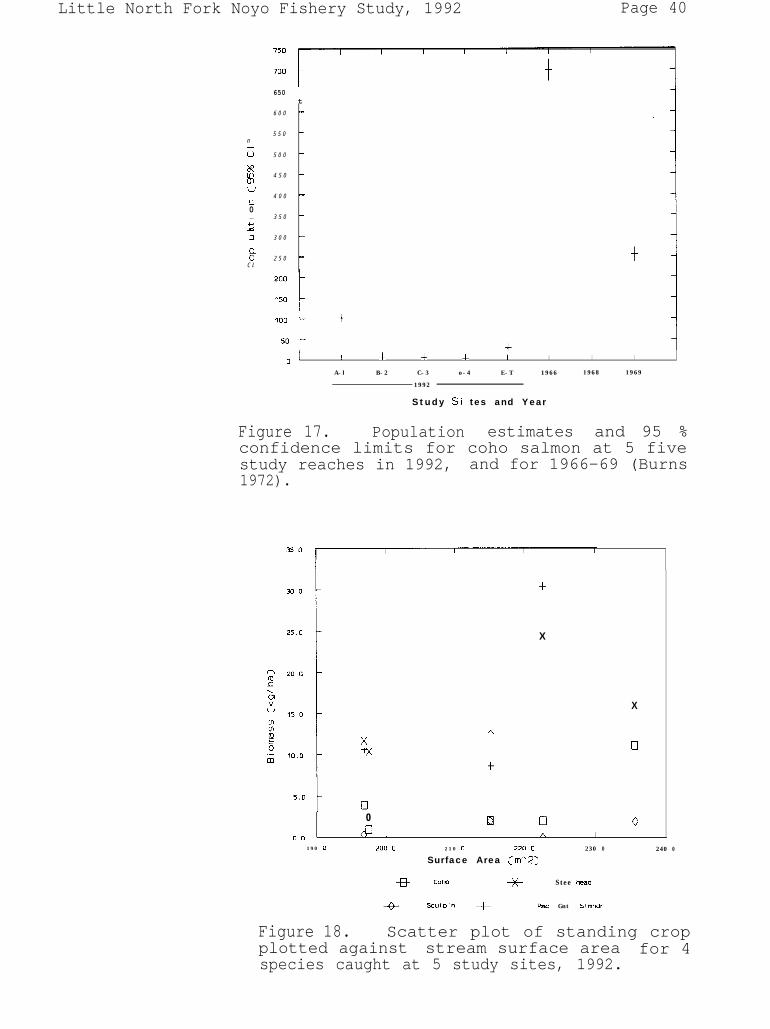
Study site populations for the four lOO+ m study sites wereestimated (Table 4) in 1992 between 29 to 91 for steelhead trout(Fig. 16) and from 3 to 102 for coho salmon (Fig. 17). In order tomake our estimates more comparable to those of Burns (1972), twomeasures of abundance were calculated.(number of fish per m2
When measured in densityof water surface area), the 1992 samples
averaged 0.13 coho salmon / m2 (range 0.3/ m2
- 0.8) and 0.28 steelhead(range 0.15 - 0.41) (Table 5). As biomass, coho salmon
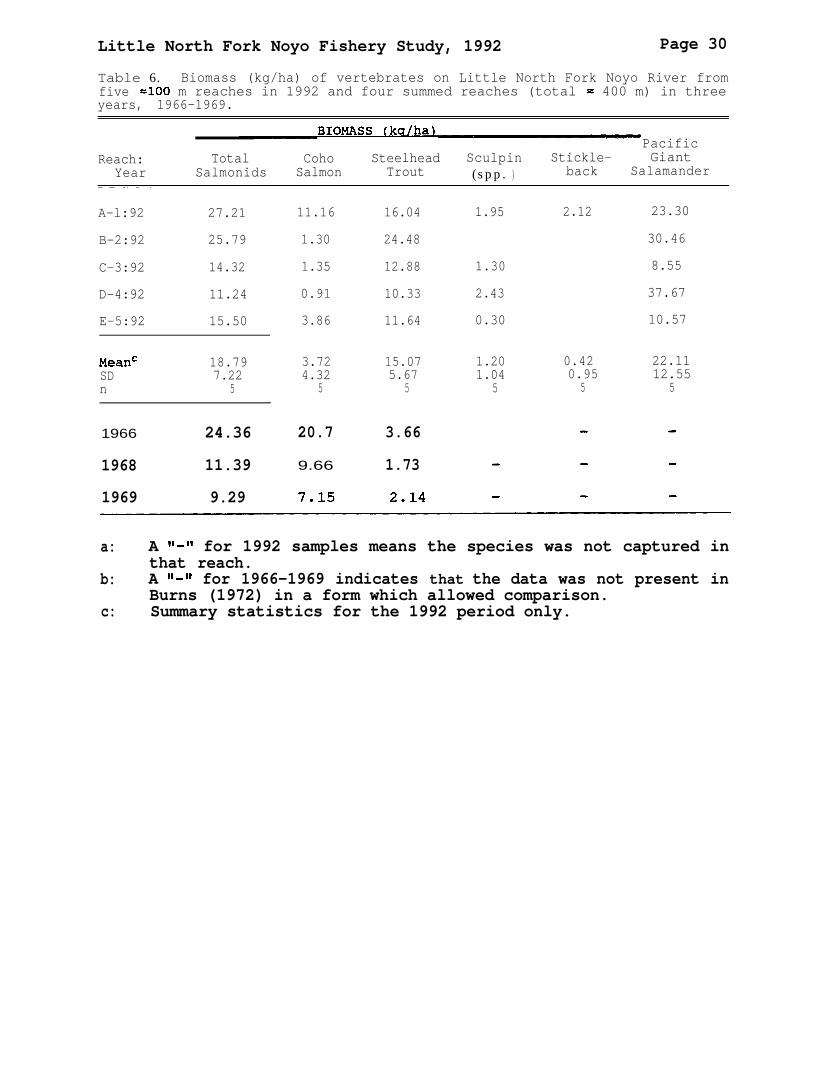
averaged 3.72 kg/ha (range 0.91 - 11.16) and steelhead averaged15.07 kg/ha (range 10.33-24.48) (Table 6).
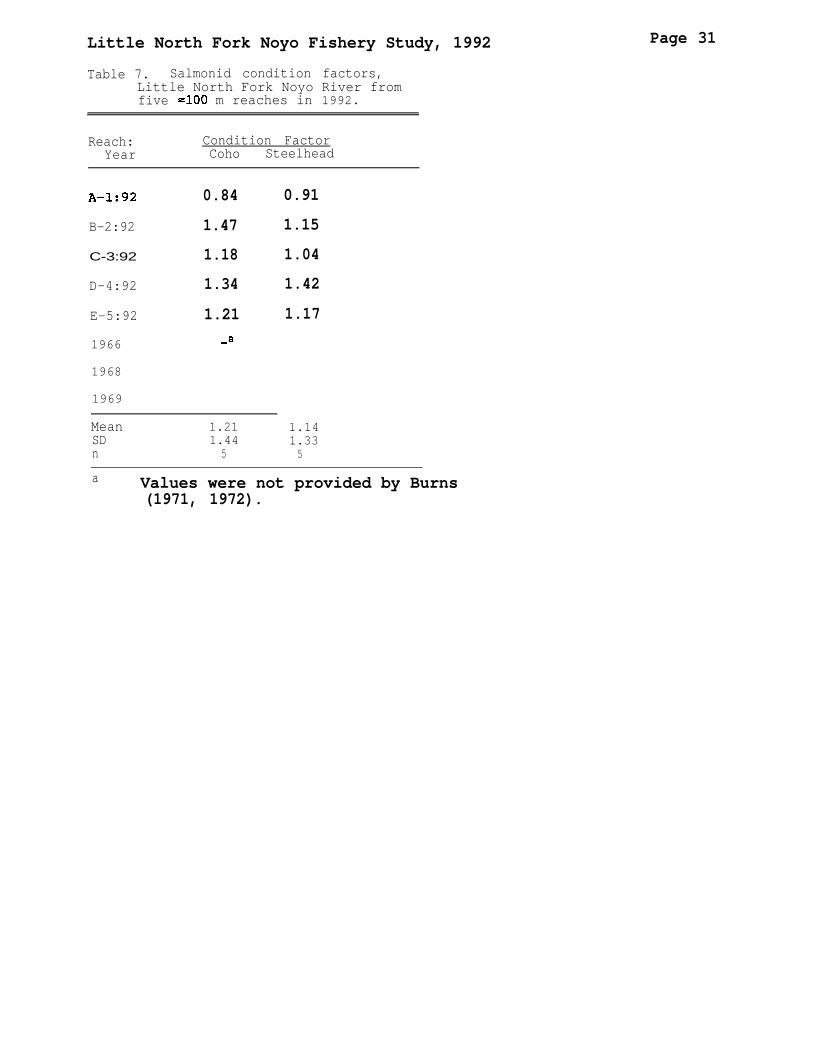
Condition factors ranged from 0.84 to 1.47 for coho salmon and0.91 to 1.42 for steelhead (Table 7). Site A-l was the lowest forboth species, while the point estimates for all other sites weregreater than 1.0.
Fish / Habitat Relationships
Scatter-plots of different measures of salmonid abundanceagainst most measures of habitat quality produced no figures withobvious trends. Visual inspections of site mean values for biomassdid not suggest relationships with water surface area (Fig. 18),water volume (Fig. 19), mean residual pool depth (Fig. 20), meansite depth (Fig.. 21), large woody debris (Fig. 22) for eithersalmonid species. Two measures of substrate condition, thegeometric mean and the percent fines did not suggest any trends inthe biomass of sculpin nor the Pacific giant salamander (Fig. 23and 24).
Little North Fork Noyo Fishery Study, 1992 Page 13
Scatter-plots of substrate characteristics suggested possiblerelationships with salmonid abundance. While the biomass of cohosalmon showed extensive scatter when plotted against the stations'percent fines, that for steelhead suggested a negative curvilinearrelationship (Fig. 25). A similar, but looser, relationship issuggested between the percent of fines and steelhead density (Fig.26). The results differ when the substrate condition is expressedby its geometric mean (Fig. 27 and 28). Steelhead biomass anddensity show substantial scatter while those for coho suggests apositive curvilinear relationship. Both biomass and density forcoho salmon begin to increase at a geometric mean diameter about7.5 mm.
Scatter-plots of steelhead and coho condition factors did notsuggest a relationship with the percent of fines (Fig. 29) nor withthe geometric mean particle size (Fig. 30).
DISCUSSION
The early logging along the north coast of California (priorto = 1920) yarded logs to a railroad line with bull teams and steamyarders (Jackson 1975, Caranco and Labbe 1979). This type ofyarding, probably representative of the Little North Fork of theNoyo River, typically deposited large quantities of soils and woodydebris into watercourses. Subsequent to that period, the commonlogging practice was to skid logs and construct both roads andlandings within or immediately adjacent to stream channels. Thispractice was that used in the Little North Fork of the Noyo River(Burns 1972). Further, Burns (1972) describes the practice ofbull-dozing of slash from the stream channel following the logging.
The regulation of forest practices in California has undergonecontinuous change since 1973, and to ascertain the provisions ofregulation which applied to each logging operation in the Noyowatershed would be difficult. Major provisions of California'sforest practice regulation in place since 1974 regulate streamprotection, equipment use, erosion control, road construction andmaintenance.
Unlike the logging of the period between 1964 and 1972, morerecent operations included some new road construction at or abovethe mid-slope to facilitate cable-skyline yarding of slopes over 55percent and to shorten skidding distances. Based upon a comparisonof timber harvest plan records and 1975 aerial photos, many milesof pre-1973 skid trails and truck roads in the Little North ForkNoyo watershed have been abandoned. Our field examination foundmost of these abandoned facilities were vegetated and erosion fromthem was relatively uncommon, except at old instream roads andlandings. The fills beneath these in-stream facilities continue toerode as channel alignment and gradient approach new equilibria.
Our five study sites covered a broad range of logging-relateddisturbance. One site included a reach where the stream had cut
Little North Fork Noyo Fishery Study, 1992 Page 14
down through an instream landing constructed in 1969, one site wasdownstream of a landslide that was probably activated by upsloperoading of the early 1970's, and all sites exhibited old roadbedsor crossings. The channel diagrams (Appendix A) depict thoseabandoned railroads, truck roads, and skid trails in proximity tothe channel.
In addition to the impacts of timber harvest, evidence ofrecent (+ 10 years old) log jam removal was common. Some of theimpacts of timber harvesting (excessive sediment inputs) and logjam removal (remobilized instream sediment) are similar, and thisstudy can not segregate these impacts.
During Burns'(1972) studies, the total (summed) length of fourw 100 m study areas differed from 399 mto 424 m. The starting andend points were fixed; the difference in length was the result ofintervening meander (Burns, pers. commun.). Average widths duringBurns' study increased, presumable due to the logging activities.However, from 1966 to 1969, the average depth ranged from 15.2 to9.1 cm, with a trend toward becoming more shallow after timberharvest (Table 2).
During 1992, habitat typing revealed that the pool / riffleratio was approximately even, tending slightly toward riffles.Conventional interpretation is that a ratio of 1 to 1 is optimum,although studies comparing fish abundance among streams have shownthe measure to have low precision; i.e., within studies, highestsalmonid abundance is sometimes in study sections more divergentfrom this value than in other study sections (Platts et al.1983:l0). "Ideal"" conditions are difficult to define and arelikely to vary in response to a number of parameters (MacDonald etal. 1991). A preponderance of riffles may imply an excessiveincrease of coarse sediment or a reduction in large woody debris,although there is little information on the response of habitattypes to management activities (MacDonald et al. 1991). The bestuse of pool riffle abundance may be to monitor stream's response tohabitat alteration over a longer time frame.
Our methods for quantifying habitat types differed from thoseused by Burns (1971). Opposed to recording length, width, anddepth of each habitat type as we did, others have taken measures(width, depth) along systematically, or otherwise placed transectsperpendicular to stream flow. Burns (1971) placed "...from 30transects in stream sections less than 1 km long...," so we assumethat 30 transects were used to measure his 0.399 to 0.424 km longstudy sites, and the design of their placement (systematic, random,etc.) is not reported. Therefore, while Burns' and our studiesmeasure the same characteristics of the streams, they do so indifferent ways and comparison of the results must recognize thosedifferences. For example, we calculated average depth for eachunit from several readings along the thalweg (the deepest portionof the longitudinal profile) while perpendicular transects normallyrecord depths at pre-set distances across the channels' wetted-
Little North Fork Noyo Fishery Study, 1992 Page 15
width. Therefore, our methods may tend to compute a greater"average depth " than those of Burns. On the other hand, because wemeasured each habitat unit of greater length than the averagewetted width while transects placed either systematically,randomly, or selectively may miss habitat types or over sample-others, our average depth may tend to be slightly less or more thanif calculated by transect methods.
Prior to logging activities in 1966, the average depth wasnearly 15 cm; in 1968, 24 months after initial road constructionand 12 months after gully logging the average depth dropped to 12cm; and in fall of 1969, immediately after second roadconstruction, the average depth was 9 cm. Burns (1972) tables notethe decline in average depth even though the measured flow for eachstudy year increased (first it doubled from 1966 to 1968, then the1969 value was more than triple the 1966 flow). Concomitantly withshallowing, the channels widened (Table 2). The average depth inthe 1992 study sites was 21.1 cm (Table 2), and the range of depthsfalls entirely above Burns' pre-logging value. Thus, the changes(becoming more shallow) in the physical condition of the streamobserved by Burns appear to have recovered by 1992. The initialshallowing may have been due to the gully logging and other streamoperations by bulldozers. Even in 1992, the high-water channelalong much of the watercourse appears to be the width of a bull-dozer blade, and the low flow-channel meanders weakly within. Thesalmonid population response from pre- to post-logging (Burns 1972)may have been due to these changes in physical habitat (becomingmore shallow), increased discharge and thus probably averagevelocity, or an interaction between these variables, as well assuch factors as gravel quality (Burns 1970).
We found that pools greater than 30 cm residual depth werenearly always associated with large woody debris, either in theform of logs or in-place stumps. The few other residual poolsresulted from tributary inflows, standing trees, or in one casesoil apparently well anchored by the roots of herbaceous andshrubby vegetation. Pool cover quality was generally moderate tolow as many pools were the result of a single root-wad or fewpieces of LWD. Burns (1972) did not quantify woody debris nor pooldepths, so comparisons are speculative. However, Burns did notethat bulldozers were used to remove logging debris in the streamshe studied. This action probably removed large woody debris otherthan that generated by the logging.
As for habitat typing, the average distance between thedeepest points of 5 successive residual pools may provide anindicator of the status of sediment dynamics in the stream system.Its use is limited to time trend analysis.
Although not providing data, Burns (1972) noted that"" . . . selective removal of timber along the stream opened the forestcanopy and undoubtedly increased stream temperatures." We did notrecord stream temperature; however, "shading" during the critical
Little North Fork Noyo Fishery Study, 1992 Page 16
summer months was nearly 100%. The "solar-pathfinder" does notmeasure "canopy"" in the traditional sense. That is, it does notmeasure vegetative obstruction to vertical projections, the commonapplication for wildlife and forestry (Hays et al. 1981, Husch etal. 1972). Rather, it measures solar insolation along the sun'sarc which may substantially differ from vertical and approachhorizontal at the horizons. In addition, it does not measurepercent of the sky shaded, but measures the percent solar radiationblocked during a user-defined time period. "Canopy closure" and"solar radiation blocked" differ in that the percent of solarradiation (a measure of heating ability) is greater for a givenangle of the sun's arc during mid-day than it is for the same angleduring other portions of the day. In streams where increased watertemperature is the focus of concern, the solar pathfinder should besuperior to other common tools (e.g., densiometers). However,where other parameters of fish habitat are provided by near-streamvegetation -- invertebrate foods or inputs of vegetative matter --the solar pathfinder may be inferior to other tools. Nevertheless,the dense canopy we measured in 1992 showed that thermal heating inthe late summer period was probably inconsequential and that,within the limits of Burns statement, had recovered in theintervening 23 years.
In 1992, large woody debris was limited to a few isolated,small log jams. Recent (+ 10 year-old) log jam removal wasevident. LWD was most commonly oriented such that it did notcollect and meter the sediments' movement downstream, developplunge or scour pools, nor sort sediments across the channelbottom. The tree species mix of recent additions was biased towardsmall trees and species with rapid deterioration rates, suggestingthey would do little in the short-term to restore the apparentshortage. A few recent large redwoods had fallen and spanned thewatercourse; however, their incorporation into the channel willtake some time and thus they risk being yarded during future timberharvest.
We selected the substrate composition sampling scheme becauseit repeated the functional locations sampled by Burns. Also, itsamples locations preferred for redd construction by spawningsalmonids (Bjornn and Reiser 1991).
Like Burns, we did not apply two corrections to the sedimentsamples. One correction sometimes applied accounts for thedifferential water retention among the different particle sizefractions. This factor becomes significant at particles sizes lessthan 4 mm. A second correction sometimes applied adjusts for thewinnowing of fines from the substrate when salmonids construct aredd, a factor which Chapman (1988) describes as "substantial."Thus the proportion of substrate which is fine sediments differsbetween the general channel bottom and that of a redd. We chosenot to apply corrections to our samples because 1) Burns (1970,pers. commun.) did not, 2) correction values for water retention

Little North Fork Noyo Fishery Study, 1992 Page 17
are substrate-type specific, and 3) the cleansing that results fromspawning is widely variable (Kondolf 1988).
Burns (1972) found that the percent of substrate comprised ofparticles less than 0.85 mm averaged 20.0 prior to timber harvestactivities and jumped to greater than 30 % after harvest (Table 3[taken from Table 7 of Burns 1972], Fig. 9). While Burns (1972)showed a statistically significant increase in fines from pre- topost-logging years, our 1992 average (n = 24) falls between Burn'spre-logging and post-logging values. The 1992 average did notdiffer significantly from any of Burns' samples (Fig. 9). Thissuggests some recovery of fines in the substrate at the pool rifflecrests.
We have collected other sediment information from the LittleNorth Fork Noyo River. In 1991, three stations on Little NorthFork Noyo River averaged fines of 18, 10.5, and 26% (n = 4 each),for a reach average of 21.5% (n = 12) (Valentine 1992b). After thewet winter of 1992-93, we sampled station 3-C during July. Theaverage (n = 4) percent passing the 0.85 mm sieve averaged 15.8 (sd= 5.0), Dg averaged 8.9 (SD = 1.9), and the Fredle index averaged3.6 (SD = 1.4) (Valentine unpubl. data).
The fact that the level of fines was as low as it was despiteand extended, multi-year drought and ongoing timber harvest issurprising. The slightly lower percent fines for 1991 [Valentine(1992b)] relative to 1992 (this study) may be the result of randomerror associated with the location of the sampling stations, widevariability common in sediment sampling, and / or drought-inducedaccumulation of fines in the stream bed. We noted fine roots inmany of the 1992 sediment samples, indicating that recent winterstream flows had been insufficient to move the gravels. The rootnetwork may help trap and hold fine sediments in the substrate.The improved sediment condition observed from limited 1993 samplingsuggests that the effects of sediment buildup during the droughtwere reversed by the wet winter. In fact, the 1993 samplesexhibited lower concentrations of fines than did Burns' (1970) pre-logging values.
When plotted on the survival to emergence graph (Fig. 31) ofLotspeich and Everest (1981), the Fredle index for the 1992 studyaverage predicts x 31% survival for coho eggs while that forsteelhead is predicted at = 50%. The Fredle index of individualsamples ranged from a low of 0.2 to 7.3, translating into virtually0 % survival to emergence for both coho salmon and steelhead to >80 % and 90%, respectively. This analysis suggests that thesurvival-to-emergence quality of spawning habitat may have beenlimiting. However, the values we derived must be considered theminimum because 1) we did not apply a correction factor in theanalysis for differential adherence of water to particles betweensizes, 2) we did not correct for the winnowing of fines from thesubstrate which occurs when fish construct redds, and 3) thesamples were collected in summer (and during a drought), well after

Little North Fork Noyo Fishery Study, 1992 Page 18
spawning and during which time sediments could accumulate. Inaddition, we did not collect our samples from redds, but fromlocations where the literature suggest salmonids prefer to spawn.
Site A-l was the only station where we captured yellow-leggedfrogs and stickleback. It differed from the other sites in atleast three respects: the base level of the channel was wider,there was more grassy vegetation within the base-level of thechannel, and the canopy directly above it was more open. These, orsome other factors, may have enabled stickleback and yellow-leggedfrogs to inhabit this study reach but not the others.
Burns (1972) reported population sizes estimates for hisapproximately 400 m study sections at between 698 coho salmonbefore timber harvest and 255 after operations, whereas steelheadnumbers changed from 19 to 29 over the same period (Table 4, Figs16 and 17). When expressed in density, coho salmon declined from1.15 to 0.26 fish / m* from the pre- to the finalsample, and steelhead remained unchanged at 0.03 / m
Yost-logging(Table 5).
Standing crop changes were similar; coho salmon declined from 24.36kg/ha prior to logging to 7.15 kg/ha after harvest while steelheadbiomass dropped 3.66 kg/ha to 1.73 kg/ha (Table 6).
Total salmonid biomass was similar between Burns' and ourstudies (Fig. 32). Values of total salmonid biomass at Stations A-l and B-2, downstream of Burns' study sites, were similar to Burns'1966 pre-logging value. Sites C-3, D-4, and E-5 which were withinBurns' study area had values similar to those of Burns' post-logging samples. However, an obvious difference between the twosample periods is that the species composition is inverted; i.e.,steelhead made up 80% of the 1992 sample but only 17% of the 1966-1969 samples (averaged).
Most habitat measures did not show a clear relationship tosalmonid biomass or population. This may be due to our sites notspanning the range of a habitat feature across which salmonidpopulations respond. Examples may include pool depth or woodydebris loading. Alternately, salmonid populations may have beenbelow levels which caused these factors to be limiting. A thirdexplanation includes the possibility that some unmeasured factorwas controlling populations to a greater degree than those wemeasured.
The only habitat measures which appeared related to theabundance of salmonids were those connected to particle sizedistribution. If these findings are more than chance, clearly thegeometric mean and the percent fines measure different aspects ofthe substrate because coho and steelhead responded to themdifferently. These two measures differ primarily in that "percentfines" concentrates on a small portion of the sample, while thegeometric mean and the Fredle Index account for the sizedistribution of the entire sample. Due to the time lapse betweenfry emergence and our sampling, the relationships between salmonid
Little North Fork Noyo Fishery Study, 1992 Page 19
abundance and the measures of particle size are not likely due tofish association with nearby, past redds. If the relationship isbiologically real, it is likely related to (an)other factor(s):better cover provided for fry in the interstitial spaces; perhapsminor water quality variations; or most likely, greater foodproduction from cleaner gravels (Bjornn and Reiser 1991).
The inversion of the salmonid& species composition fromprimarily coho salmon to primarily steelhead between study periodshas several possible explanations. Our results shed little lightin regards to instream habitat character, with the possibleexception of large woody debris conditions. The logging activitiesobserved by Burns resulted in changes in the physical habitatcondition, exemplified by the decline in average depth andincreased fines in the substrate. Within the limits of ourstudies, these changes appear to have recovered. Debris removalmay have enhanced access to the watershed, but may have retardedrecover in terms of channel development.
The modifications of physical habitat may have caused changesin the salmonid populations mediated through narrow habitatpreferences. Bugert et al. (1991) found that coho salmon selectedrelatively deep areas of small streams, whereas steelhead were moreevenly spread regardless of water depth. They also found inlaboratory channels (Bugert and Bjornn 1991, in Bugert et al. 1991)that subyearling steelhead used riffles and slopes from riffle topool more than did coho salmon. Moyle et al. (1989) and Moyle andYoshiyama (1992) suggests that pools > 1 m deep are importanthabitat features of coho salmon streams. No pools matching thatdescription were present in the 1992 study sites, nor were anyobserved during the stream field-reconnaissance which covered > 50% of the study reach. The character of pools during Burns' studywas not disclosed, but his average depths did not suggest deeppools.
Alternatively, changes in the species composition may havebeen indirect through altering the predator-prey or competitiondynamics of the biological community (non-salmonid as well assalmonid). Bjornn and Reiser (1991) reported that channelcharacteristics caused population shifts between steelhead andother salmon species. Data from this study are too sparse toevaluate this possibility. Changes in community composition amongcoexisting salmonids after harvest has been reported from westernWashington (Bisson and Sedell 1984) and Oregon (Reeves et al 1993).Both studies suggest that the changes were the result ofsimplification of the habitat, largely related to changes in theabundance of large woody debris. Competition, either for food orspace may maintain the initial shift induced by logging-relatedhabitat changes despite a return to the intial habitat conditons.
Timber harvest remains one of the most visible uses ofwatersheds inhabited by California's north coast salmonids and isconsidered by some to be an important land-use activity limiting
Little North Fork Noyo Fishery Study, 1992 Page 20
anadromous salmonids. Many other factors other than timber harvestsuch as over-fishing, marine environment changes, hatchery impactson genetics and disease transmission, and other land uses may alsohave roles in limiting salmonid populations and species composition(Higgins et al. 1992, Kaczynski and Palmisano 1992).
A factor which seems very important in controlling salmonidpopulations is the continued and prolonged drought. This study wasinitiated after an extended drought (Fig. 33). The Palmer DroughtSeverity Index (PDSI) is often considered an index ofmeteorological drought. However, as Alley (1984) points out, itsderivation incorporates precipitation, evaporation, and soilmoisture -- all of which are determinants of hydrologic drought.Mean monthly values of the Palmer drought severity index hoveredbetween the "critical" level (-3) and the extreme level (-4) formonths prior to the initiation of this field work. Droughtconditions can influence the juvenile salmonid populations in thestreams in innumerable ways through both inland habitat conditions,
.access of spawners, smoltification, and offshore habitatrain, especially during the early-to-mid winter perioddifferentially affected spawning access to streamssuitability of the spawning and rearing environment.
Lack ofmay haveor the
Another explanation of the inversion is chance; that is,populations of the different salmonid species may naturallyfluctuate enough that the relative proportions of each species inBurns' and our studies fall within the range of natural variationshould we have information of adequate time spans.
Because at a coarse level, steelhead and coho have similarhabitat needs (cool, clear water; clean gravels; spawning access;rearing habitat), the fact that the salmonid biomass is similarbetween study periods suggests that at that at this level ofresolution, recent land-uses in the Little North Fork Noyo Riverappear not to have been destructive to the "cold-water fisheryhabitat? If this is true, then factors which affect the speciesdifferentially may be fruitful subjects of study when attempting toidentify those important in the decline of coho salmon (both marineand inland).
ACKNOWLEDGEMENTS
The initial project study plan was distributed torepresentatives of the California Department of Fish & Game (DFG-Region III and Sacramento Timber Harvest Review), the North CoastRegional Water Quality Control Board (NCRWQCB), Department ofForestry(CDF), California Department of Mines and Geology (CDMG),Georgia Pacific Corporation (GP), and the Redwood Sciences Lab ofthe US Forest Service (RSL). Written comments were received fromRobert Klamt (RWQCB), Pete Cafferata (CDF), and Tom Lisle (PSW).Wendy Jones and Rick Macedo (DFG) provided verbal comment.
Little North Fork Noyo Fishery Study, 1992 Page 21
Field work was assisted by a number of persons including NaomiOwen and Pete Cafferata (CDF); Robert Ballard, Darcy Mahoney, DanLaumann, and Greg Bettsworth (GP); and Wendy Jones and John Emig(DFG). Jim Spiro (CDF-Strategic Planning) provided the PalmerDrought Severity data.
A draft of this report was sent to Tom Lisle (RSL); RickMacedo, Wendy Jones, Ted Wooster, and Dick Moore (DFG), Jim Burns(Calif. Coastal Commission); Bob Klamt and Frank Reichmuth (RWQCB);Pete Cafferata, Marty Berbach, Norm Henry (CDF); Kevin Roberts(GP)? and Bill Trush (Humboldt State Univ.).
LITERATURE CITED
Alley, W.M. 1984. The Palmer Drought Severity Index: Limitationsand Assumptions. J. Climate and Applied Meteorology 23:1100-1109.
Anonymous. 1984. Fish Habitat Completion Form. Department ofFish & Game, Region 3. Yountville, CA.
1986. Fish Habitat Completion Form.Fish &I Game, Region 3.
Department ofYountville, CA.
Armour, C.L., K.P. Burnham, and W.S. Platts. 1983. Field Methodsand Statistical Analyses for Monitoring Small SalmonidStreams. U.S. Fish & Wildl. Serv. FWS/OBS-83/33. 200 pp.
Bisson, P.A., and J.R. Sedell. 1984. Salmonid Populations inStreams in Clearcut vs. Old-growth Forests of WesternWashington. PP 121-129 In W.R. Meehan, T.R. Merrell, Jr., andT.A. Hanley (Eds) Fish and Wildlife Relationships in Old-growth Forests. Amer. Inst. Fish. Res. Biologists.
Bjornn, T.C., and D.W. Reiser. 1991. Habitat Requirements ofSalmonids in Streams. Pages 83-138 In W.R. Meehan (Ed.),Influences of Forest and rangeland Management on SalmonidFishes and their Habitats. American Fisheries Society SpecialPublication 19.
Bugert, R.M., T.C. Bjornn, and W.R. Meehan. 1991. Summer HabitatUse by Young Salmonids and Their Responses to Cover andPredators in a Small Southeast Alaska Stream. Trans. Amer.Fish. Soc. 120:474-485.
Bugert, R.M., T.C. Bjornn. 1991. Habitat Use by Steelhead andcoho salmon and Their Responses to Predators and Cover inLaboratory Streams. Trans. Amer. Fish. Soc. 120:486-493.
Burns, J.W. 1970. Spawning bed sedimentation studies inNorthern California Streams. Calif. Fish & Game 56(4):253-270.
Little North Fork Noyo Fishery Study, 1992 Page 22
1971. The carrying capacity for juvenile salmonidsin some northern California streams. Calif. Fish 61 Game57(1):44-57.
1972. Some effects of logging and associated roadconstruction on Northern California Streams. Trans. Amer.Fish. Soc. 101(l): 1-17.
Cafferata, P. undated. Large Woody Debris Loading: Hare Creek.Unpubl. photocopy. California Department of Forestry.Sacramento, CA. 1 p p .
Caranco, l., and J.T. Labbe. 1979. Logging the Redwoods. TheClaxton Printers, Ltd. Caldwell, ID. 142 pp.
Chapman, D.W. 1988. Critical Review of Variables Used to DefineEffects of Fines in Redds of Large Salmonids. Trans Amer.Fish. Soc. 117:1-21.
Flossi, G. and F. L. Reynolds. 1991. California salmonid streamhabitat restoration manual. California Department of Fish &Game. Sacramento, CA. Various pagination + appendices.
Good, D.A. 1989. Hybridization and cryptic species in Dicamptodon(Caudata: Dicamptodontidae). Evolution 43(4):728-744.
Hayes, R.L., C. Summers, and W. Seitz. 1981. Estimating WildlifeHabitat Variables. USDI Fish & Wildlife Service. FWS/OBS-81/47. 111 pp.
Higgins, P., S. Dobush, and D. Fuller. 1992. Factors in NorthernCalifornia Threatening Stocks with Extinction. Unpubl.Photocopy. Humboldt Chapter, Amer. Fish. Soc. Arcata, CA.26pp.
Husch, B., C.I. Miller, and T.W. Beers. 1972. Forest Mensuration(Sec. Ed.). John Wiley & Sons. New York. 410 pp.
Jackson, F. 1975. Big River Was Dammed. Miller Print Company.Mendocino (?), CA. 138 pp.
Jameson, M. 1989a. Juvenile Salmonid Population, Sediment Restudy.Unpubl. Memo to Ted Wooster. Calif. Dept. Fish & Game, Region3. Yountville, CA. 2 pp.
Jameson, M. 1989b. Inspection of Little North Fork Noyo River (l-89-674 MEN). Unpub. Memorandum to Len Theiss. Calif. Dept.Forestry & Fire Prot. Santa Rosa, CA. 5pp l
Kaczynski, V.W., and J.F. Palmisano. 1992. A Review of Managementand Environmental Factors Responsible for the Decline and Lackof Recovery of Oregon's Wild Anadromous Salmonids: Summary andConclusions. Unpubl. Rept. prepared for Oregon Forest

Little North Fork Noyo Fishery Study, 1992 Page 23
Industries Council. Salem Oregon. 60 pp.
Kondolf, G.M. 1988. Salmonid Spawning Gravels: A GeomorphicPerspective on Their Size Distribution, Modification bySpawning Fish, and Criteria for Gravel Quality. P h DDissertation. Johns Hopkins Univ. Baltimore, MD 396 pp.
Lisle, T.E. 1987. Using "Residual Depths " to Monitor Pool DepthsIndependently of Discharge. USDA For. Serv. Res. Note PSW-394. 4 pp.
Lotspeich, F.B., and R.H. Everest. A New Method for Reporting andInterpreting Textural Composition of Spawning Gravels. USDAFor. Serv. Res. Note PNW-369. 11 pp.
MacDonald, L.H., A.W. Smart, and R.C. Wissmar. 1991. MonitoringGuidelines to Evaluate Effects of Forestry Activities onStreams in the Pacific Northwest and Alaska. US EPA 910.9-91-001. Seattle, WA. 166 pp.
McMahon, T.E. 1983. Habitat suitability index models: Cohosalmon. U.S. Dept. Int., Fish Wildl. Serv. FWS/OBS-82/10.49.
l
McNeil, W.J., and W.H. Ahnell. 1964. Success of pink salmonspawning relative to size or spawning bed materials. U.S.Fish & Wildl. Serv., Spec. Sci. Rpt. Fish. # 469. 15 pp.
Moyle, P.B., J.E. Williams, and E.D. Wikramanayake. 1989. FishSpecies of Special Concern of California. California Dept.Fish & Game. Inland Fisheries Division. Rancho Cordova, CA.222 pp.
and R.M. Yoshiyama.Management Areas,
1992. Fishes, Aquatic Diversityand Endangered Species: A Plan to Protect
California's Native Aquatic Biota. The California PolicySeminar. University of California. Berkeley, CA. 222 pp.
Nehlsen, N, J. E. Williams, and J.A. Lichatowich. 1991. PacificSalmon at the Crossroads: Stocks at Risk from California,Oregon, Idaho, and Washington. Fisheries 16(2): 4-21.
Platts, W.S., M. A. Shirazi, and D. H. Lewis. 1979. Sedimentparticle sizes used by salmon for spawning with methods forevaluation. EPA-600/3-79-043. US EPA, Environ. Res. Lab.,Corvallis OR. 33 p p .
Platts, W.S., W.F. Megahan, and G.W. Minshall. 1983. Methodsfor evaluating stream, riparian, and biotic conditions. USDAFor. Serv. Gen. Tech. Rep. INT-138. 70pp.
C. Amour, G.D. Booth, M. Bryant,Jensen, G.W. Lienkaemper,
J.L. Bufford, P. Cuplin, S.G.W. Minshall, S.B. Monsen, R.L.
Little North Fork Noyo Fishery Study, 1992 . Page 24
Nelson, J.R. Sedell, J.S. Tuhy. 1987. Methods for EvaluatingRiparian Habitats With Applications to Management. USDA For.Serv. Gen. Tech. Rep. INT-221. 177 pp.
Price, D.G. and J.R. Adams. 1982. A fishery resource samplingmethodology for small streams. Pacific Gas & Electric Co.,Dept. Eng. Res. Rep. 420-81.141. 49 pp.
Reeves, G.H., F.H. Everest, and J.R. Sedell. 1993. Diversity ofJuvenile Anadromous Salmonid Assemblages in Coastal OregonBasins with Different Levels of Timber Harvest. Trans. Amer.Fish. Soc.
Valentine, B.E.project.California10 pp.
1992b.River and
122:309-317.
1992a. Proposed fishery and habitat evaluationUnpubl. Memo to "Interested Parties." On file.Department of Forestry, Reg. 1. Santa Rosa, CA.
Sediment samples on Little North Fork of the NoyoPudding Creek; Reference THPs 1-91-441, 442, 443
MEN. Unpubl. memo to T. Osipowich. On File at CA Dept.Forest., Reg. 1. Santa Rosa, CA. 16 PP.
1993. Stream substrate quality for salmonids: guidelinesfor sampling, processing, and analysis. (Perpetual draft--October 13, 1993). California Dept. Forestry and FireProtection. Sanat Rosa, CA. 20 pp.
Van Deventer, J.S., and W.S. Platts. 1989. Microcomputer SoftwareSystem for Generating Population Statistics FromElectrofishing Data--User's Guide for MicroFish 3.0. USDAFor. Serv. Gen. Tech. Rep. INT-254. 29 PP-
Little North Fork Noyo Fishery Study, 1992 Page 25
Table 1. Area (acres) logged by year, silvicultural system, andyarding method.
YEAR SEL THI CC SHS SHR STS STR TOT CABL TRAC
1964 103 1031966 201 2011967 928 9281968 357 3571969 220 2201970 63 631971 170 1701972 27 27
SUBTL 2069 2069 2 0 6 9
19731974197519761977197819791980198119821983198419851986198719881989199019911992
SUBTL
56 56
1205206926
143
1947
857
23
19 115155 261
86218 45297 29
11 55 13257 80 2617 315
737
85 1349 694
12054369
16069 485
22920 283
119 44535 67 30099 262
120 4715437
393 69 67 3514 1406 2108
TOTAL 2926 85 1349 694 393 69 67 5583 1406 4177
SEL=SELECTION;THI=THIN;CC=CLEAR-CUT;SHS=D SEED STEP;SHR=SHELTERWOODREMOVAL;STS=SEED TREE SEED STEP;STR=SEED TREE REMOVAL;CABL=CABLE SKYLINEYARDING;TRAC=TRACTOR/SKIDDER YARDINGNOTE: THE SUBTOTAL FOLLOWING 1972 INDICATES THE TIMING OF MAJOR REGULATORYCHANGES IN LOGGING PRACTICESNOTE: Approx. 1809 ACRES OF SAPLING STANDS HAVE BEEN CREATED SINCE 1980NOTE: SELECTION CUTTING IN STREAM PROTECTION ZONES WITHIN NON-SELECTIONSILVICULTURAL AREAS WAS NOT INCLUDED IN THE TABLE.
Little North Fork Noyo Fishery Study, 1992 Page 26
Table 2. Physical conditions of the habitat in Little North Fork Noyo River at 5 = 100 m study reaches in 1992,and at four summed reaches (total = 400 m) reaches in three years, 1966-1969.
Site Surface Mean Shade Canopy LWDReach: Length Area Volume Pool Inter-pool Site Site Total Conifer Decid. Vol.
Year m m2 m3 Depth distance Deptha Widtha % % % (m3)cm m cm m
A-1:92 104
B-2:92 100
c-3:92 105
D-4:92 102
E-5:92 107
MeanC 103.6SD 2.7n 5
1966 399
1968 399
1969 424
235.6 44.7
222.6 40.6
215.1 58.5
197.5 54.6
196.8 26.7
213.516.65
609
998 122 12.2 2.5
994 91 9.2 2.3
45.0 42.0 16.2 21.1 2.112.5 9.3 6.2 6.1 0.25 5 5 5 5
93
44.5
37.5
56.2
40.6
31.3
15.6 19.0
13.5 18.2
18.6 27.2
8.3 27.6
25.0 13.6
15.3
2.3
2.2
2.0
1.9
1.8
1.5
81.0
86.8
78.7
76.7
85.0
81.66.15
70.0
66.7
50.0
57.5 42.5
89.2 10.8 7
66.7 33.3 17.74.2 14.8 18.95 5 5
30.0
33.3
50.0
51
4
15
12
a: Site depth and width are "averages" calculated by dividing the volume measurements bythe surface area measurements and the unit length, respectively.
b: Shade canopy for conifers and deciduous is the proportion of the total shade providedby those groups.
c: Summary statistics for the 1992 period only.

Little North Fork Noyo Fishery Study, 1992 Page 27
Table 3. Summary of particle size distribution of substratesamples from the Little North Fork Noyo River in 1992 and 1967-1969(Burns 1970).
Mean (sd)StudyReach Dg Fredle < 0.85 mm < 3.3 mma
(mm) Index (%) (%) n
A-l 8.3 (3.2) 2.4 (2.2) 22.5 (7.5) 33.3 (10.7) 5B-2 7.6 (1.6) 2.4 (1.3) 20.8 (4.6) 27.8 (6.5) 5c-3 7.1 (1.9) 2.3 (1.8) 24.4 (5.8) 29.2 (9.7) 5D-4 5.0 (2.1) 1.3 (0.9) 31.2 (14.8) 39.5 (15.4) 5E-5 8.2 (6.4) 2.2 (2.9) 29.1 (14.9) 40.3 (19.0) 41992 7.2 (3.5) 2.1 (1.9) 25.4 (10.9) 33.7 (12.7) 24Total
1966 -b 20.0 (5.8) - 271968 31.0 (8.9) 42.1 (10.5) 81969 33.3 (15.4) 44.4 (14.6) 16
a Values for the 1992 period calculated as described in text;
bvalues for 1966-1969 from Burns (1970)." - " indicates value not determined by Burns (1972).
a:sed tab1-

Little North Fork Noyo Fishery Study, 1992 Page 28
Table 4. Population Estimates for study site (95% confidence interval) ofvertebrates captured in Little North Fork Noyo River at 5 = 100 m study reachesin 1992, and at four summed reaches (total = 400 m) reaches in three years, 1966-1969.
Reach:Year
Population Size (95% Confidence Interval)Pacific
Total Coho Steelhead Sculpin Stickle- GiantSalmonid Salmon Trout (spp.) back Salamander
A-1:92 193
B-2:92 99
c-3:92 55
D-4:92 53
E-5:92 58
Mean ' 91.60 29.80SD 59.78 41.61n 5 5
1966
1968
1969
102 91(97-109) (86-99)
8 91(8-8) (86-98)
7 48(7-8) (46-53)
3 50(3-3) (50-51)
29 29(29-30) (29-30)
61.80 4.60 9.40 64.4027.89 4.39 21.02 50.91 53a
5 5 5 5
698(672-724)
19(11-27)
403(390-416)
29(23-35)
255(238-272)
25(24-26)
6 47(6-6) (41-58)
5(5-8)
11(11-13)
1(1-1)
68(63-76)
31(24-48)
28(19-57)
151(133-169)
44(36-61)
A;i A
11-*' for 1992 samples means the species was not captured in that reach." - " for 1966-1969 indicates that the data was not present in Burns
(1972) in a form which allowed comparison.c: Summary statistics for the 1992 period only.
A:TABLE_N

Little North Fork Noyo Fishery Study, 1992 Page 29
Table 5. Density (n/m2) of vertebrates captured in Little North Fork Noyo Riverat 5 = 100 m study reaches in 1992, and at four summed reaches (total = 400 m)reaches in three years, 1966-1969.
Reach:Year
Densitv (# / mZ)Pacific
Total Coho Steelhead Sculpin Stickle- Giant'Salmonid Salmon Trout (spp.) back Salamander
A-1:92 0.8 0.43 0.39 0.03 0.20 0.29
B-2:92 0.4 0.04 0.41 _a 0.14
c-3:92 0.3 0.03 0.22 0.02 0.13
D-4:92 0.3 0.02 0.25 0.06 0.76
E-5:92 0.3 0.15 0.15 0.01 0.22
Mean ' 0.42 0.13 0.28 0.02 0.04 0.31SD 0.24 0.18 0.11 0.02 0.09 0.26n 5 5 5 5 5 5
1966 1.18 1.15
1968 0.43 0.4
1969 0.29 0.26
0.03
0.03
0.03
_ b
a: A " -II for 1992 samples means the species was not captured inthat reach.
b: A vl-vv for 1966-1969 indicates that the data was not present inBurns (1972) in a form which allowed comparison.
c: Summary statistics for the 1992 period only.
A:tab_dnst
Little North Fork Noyo Fishery Study, 1992 Page 30
Table 6. Biomass (kg/ha) of vertebrates on Little North Fork Noyo River fromfive ~100 m reaches in 1992 and four summed reaches (total = 400 m) in threeyears, 1966-1969.
Reach:Year
=Pacific
Total Coho Steelhead Sculpin Stickle- GiantSalmonids Salmon Trout (spp. ) back Salamander
A-l:92 27.21
B-2:92 25.79
C-3:92 14.32
D-4:92 11.24
E-5:92 15.50
11.16
1.30
1.35
0.91
3.86
16.04
24.48
12.88
10.33
11.64
1.95
1.30
2.43
0.30
2.12 23.30
30.46
8.55
37.67
10.57
MeanC 18.79SD 7.22n 5
3.724.32
5
15.075.67
5
1966 24.36
1968 11.39
1969 9.29
20.7
9.66
3.66
1.73
1.201.04
5
0.42 22.110.95 12.55
5 5
a: A M-~I for 1992 samples means the species was not captured inthat reach.
b: A tl-vt for 1966-1969 indicates that the data was not present inBurns (1972) in a form which allowed comparison.
c: Summary statistics for the 1992 period only.
Little North Fork Noyo Fishery Study, 1992
Table 7. Salmonid condition factors,Little North Fork Noyo River fromfive ~100 m reaches in 1992.
Reach: Condition FactorYear Coho Steelhead
A-1:92 0.84 0.91
B-2:92 1.47 1.15
C-3:92 1.18 1.04
D-4:92 1.34 1.42
E-5:92 1.21 1.17
1966 _a
1968
1969
Mean 1.21 1.14SD 1.44 1.33n 5 5
Page 31
a Values were not provided by Burns(1971, 1972).
Little North Fork Noyo Fishery Study, 1992 Page 32
N
I1 mile
II
l k m
1. Little North Fork Noyo River study sites foraree indicated with an alpha-numeric identifier in
a n direction.Approximate limits of Burns'(1972) study reach is between *+ and +*.
S i te A - l14 hts, 106.7 m
UD FLMR FLTWK! RFL ( 0.22 1
FPL.ECKVlR pooL.p(xx ( Il.02 )
IUI:RFL:RFL~WL ( a 10 )
Figure 2. Length of habitat types at four hierarchicallevels of classification (Flosi & Reynolds 1991) forSite A-l, Little North Fork Noyo River, 1992.
Little North Fork Noyo Fishery Study, 1992
RUN:FLTWTR FLTWTR A F L ( Il.18 )
GLD FLTWTR FLTWTR R F L ( 0.28
Site B-21 7 units, 100 m
LSL:SCOUR:POOL:POOL ( 0 15 )
PLP:SCOUR:POOL:POOL ( D 13 )
LGR:RFL:RFL:RFL ( 0 . 0 5 )
HGR RFL RFL:RFL ( 0 . 1 3 )
Page 33
Figure 3. Length of habitat types at four hierarchicallevels of classification (Flosi and Reynolds 1991) forSite B-2, Little North Fork Noyo River, 1992.
S i t e C-317 units, 104.4 m
PLP:SCOUR POOL:POOL ( D 04 )
DPL:BCKWTR:POOL POOL ( 0 08 )
GLD FLTWTR:FLTWTR:RFLL ( 0 20 )
LGR:RFL:RFL:RFL ( 0 27 )
HGR:RFL AFL RFL ( 0 .05 I
Figure 4. Length of habitat types at hierarchical fourlevels of classification (Flosi 61 reynolds 1991) forSite C-3, Little North Fork Noyo River, 1992.

Little North Fork Noyo Fishery Study, 1992 Page 34
Site 4-O2 1 wits, 1 0 8 5 I
CRP’SCOUR~Fln’Pm ( 0 06 )
IxP’kwiH. Fm Kc& ( 0 0 2 )
P1P:saxu~Ka.m ( 0 . 0 7 )
CLO:FLMR.FLTWR:RFL ( 0.2!5 ) CacSCD RFL’ffL ( 0 0 1 )
Figure 5. Length of habitat types at four hierarchicallevels of classification (Flosi & Reynolds 1991) forSite D-4, Little North Fork Noyo River, 1992.
Site 5-E1 8 ulits, 1 0 8 . 3 n
MCP~UNCMK mL.Fm ( 0 . 1 3 )C R m FCIIL Rx)L ( 0 0 7 )
EDw FLTKI FLMR,RFL ( 0 0 1 )
P L P XUR.lWL.PWL ( 0 . 0 8 )
G!.O F L M R FLTWR R F L ( 0 29 )
OPC’BCKVlR’POOL’Fa)L ( 0 07 )
LUVRFL’RFL’RFL ( 0 0 2 )
bGR.RFL RFL RK ( 0 33 )
Figure 6. Length of habitat types at four hierarchicallevels of classification (Flosi & Renolds 1991) forSite E-5, Little North Fork Noyo River, 1992.
Little North Fork Noyo Fishery Study, 1992 Page 35
Figure 7. Pool quality ratings for all poolsin five study reaches, Little North Fork NoyoRiver, 1992. See text for code definitions.
26
24
22
20
18
16
14
12
10
8
6
4
2
0
:I 5
I I I I I
A- 1 B-2 C-3 D-4 E-5 Total
Study Site
Figure 8. Average geometric mean (and 95% confidence intervals)for gravel samples at five study sites, and all sites combined,on the Little North Fork Noyo River, 1992. Sample size isidentified adjacent to the mean.

Little North Fork Noyo Fishery Study, 1992 Page 36
60 0co
._IL 30 0
rR
20 0
?O 0
0.0
36
i 5I 4 24s i 5s f 11 i
$
27 ii:
6
I I I I I I I
A-l 9-2 c-3 o-4 E-s TO?_81 I%6 1 9 % 1909
1992
Sample Site / Year
Figure 9. Mean, 95% confidence interval,and sample size of percent of substrate lessthan 0.85 mm from 5 study sites for 1992,and for samples from 1966-69 (Burns 1970).
CWNoyo -- 1992 -- fbech A100.0
7s.o
L
ii!*_IL
0+ 50
iiVL
2
25.0
(
0 0
0.1
-
-
-
-
4-
0 *
Figure 10. Particle size distribution for studysite A-l, Little North Fork Noyo River, 1992.
P a r t i c l e Size Cmj
* 9 + c + D

Little North Fork Noyo Fishery Study, 1992 Page 37
LNFNoyo - - 1992 -- RMch B
100 0
75 0
tiis,-
u_
Qiii 50 0
0
i5a
2 5 0
0 0
% -
1f&/f/’,f/
/’
0.1
P a r t i c l e S i z e ( m m )
+ = + 0 u E
Figure 11. Particle size distribution for studysite B-2, Little North Fork Noyo River, 1992.
LNFNoyo - - 1 9 9 2 - - R e a c h C
100.0 -
75 0
10.0
P a r t i c l e S i z e ( m m )
Figure 12. Particle size distribution for studysite C-3, Little North Fork Noyo River, 1992.

Little North Fork Noyo Fishery Study, 1992 Page 38
LNFNoyo -- 1992 -- Reach 0
/
f
1 0 0 0 -
7 5 . 0 -
i
u_ 5 0 0 -
2
ti
ba
2 5 0 -
0 0
0 1
%- A
P a r t i c l e S i z e ( m m ]
+- c* B + 0 u E
Figure 13. Particle size distribution for studysite D-4, Little North Fork Noyo River, 1992.
‘OO.O ILNFNoyo - - 1992 -- Reach E
7 5 . 0
I
50.0
U E
P a r t i c l e S i z e ( m m )
-El- A * B + c
Figure 14. Particle size distribution for studysite E-5, Little North Fork Noyo River, 1992.

Little North Fork Noyo Fishery Study, 1992 Page 39
a:dg_pt8,pic32 I I I I I I I
31 - A
30 -
29 -
28 - A27 -
26 -
25 -
24 -
23 - A22 -
21 - A
20 I I I I I I I
45 50 7.5 8.0 8.5
Figure 15. Scatter diagram of percent of the substratefiner than 0.85 mm plotted against geometric mean.
110 00
1 0 0 00
90.00
n a0 00
0iT 70 00
0-lv
60 00
:I-tJ 50 00a
T:: 40 00
a
30 00
20.00
10 00
0 . 0 0
t t
c t
I I I I I I I I IA - l 8-2 C-3 D-4 E-S 1966 1967 1969
1992
Study Si tes and Year
Figure 16. Population estimates and 95% confidenceintervals for Steelhead Trout at five studyreaches, 1992, and for 1966-69 (Burns 1972).
Little North Fork Noyo Fishery Study, 1992 Page 40
650t
6 0 0 -
5 5 0 -n
0 5 0 0 -
E 4 5 0 -o-lu
4 0 0 -c0,- 3 5 0 -+-JaY 3 0 0 -
E 2 5 0 -C L
0 ’ I + + I I I I I
A-l B-2 C-3 o-4 E-T 1966 1968 1969
1992
Study Si tes and Year
Figure 17. Population estimates and 95 %confidence limits for coho salmon at 5 fivestudy reaches in 1992, and for 1966-69 (Burns1972).
+
X
X
0
0 gs 0 000
I I A I
190 0 200 0 2 1 0 0 220 0 230 0 240 0
Surface Area Cm”2]
cot-a
sculpln
*
+
Stee I head
Pat Gnt Slmndr
Figure 18. Scatter plot of standing cropplotted against stream surface area for 4species caught at 5 study sites, 1992.

Little North Fork Noyo Fishery Study, 1992 Page 41
30.0 +
2 5 . 0 Xt
n2 0 . 0
JJ
B XU 15.0
iFi X
f 10 0 >: Cl Xm +
5.0cl
Cl O 0a
0 0 A I I 1 925.0 30 0 35.0 40 0 4s 0 so 0 55.0 60.0
Vo I ume (mA3)
-El- cd-0 stee I hem
+ SCUlpln + Pat Gnt SIIWCI~
Figure 19. Scatter plot of standing crop offour species against volume of water at fivestudy sites, 1992.
3 5 0
3 0 0
2 5 0
n2 0 . 0
2
i?U 1s 0
z
g 10.0iii
5 . 0
0 0
I I I I l I
Xt
X
X
T X 0
2 s 0 3 0 . 0 3 s 0 4 0 0 4 s 0 5 0 . 0 5s 0 6 0 0
Mean Pool Depth (cm)
4 Sculpln + Pac. Gnt. Slmndr.
coho * Stee I head
Figure 20. Scatter plot of standing crop offour species against mean depth of residualpools for five study sites, 1992.

Little North Fork Noyo Fishery Study, 1992 Page 42
3 5 . 0
M O
2 5 . 0
nfg 2 0 . 0s\
y”u
cl
1 5 . 0
E
iii 1 0 . 0
5 0
0 0
I I I
t
Xt
X
X
T 0 Xt
El
0 I no I 0:1 0 . 0 1 5 0 2 0 0 2 s . o 3 0 . 0
M e a n S i t e D e p t h ( c m ]
43 coho * Stea I head
+ Sculpin + Pot G n t Slmndr
Figure 21. Scatter plot of the standing crop offour species against the mean site depth of fivestudy sites, 1992.
I , I I
X
a- COhO * Stee I head
-+
LWD Vo I ume ( mA3)
SCUlPlfl + k c Grit. Slrm6
Figure 22. Scatter plot of the standing crop of 4species against the volume of large woody debris infive study sites, 1992.

Little North Fork Noyo Fishery Study, 1992 Page 43
a:o-dg-mas.pic40 - I I I I I I I
t
3 5 -
3 0 -
2 5 - At
2 0 - A-
15 -
A
1 0 +-
+
5 -
62
0 I I I I I l-l I
4 . 5 5 . 0 5 . 5 7 . 5 8 . 5Aver
ag:'Geomet!: 8 . 0
cMeak'(
mm)- E l - Sculpin (x10) Pcfc Gnt Slnnb.
Figure 23. Scatter plot of the standing crop ofsculpin and Pacific Giant Salamander against thesubstrate's geometric mean particle size at five studysites, 1992.
a:o-pt8-ms.pic
m
4 0
3 5
3 0
2 5
T I I I I I I I I I I
t
t
t
2 0 2 1 2 2 2 3 2 4 2 5 2 6 2 7 2 8 2 9 3 0 3 1 3 2Percent Finer than 0.8 mm (%)
-a- Sculpin (x10) + Pcfc. Gnt. Slmnb.
Figure 24. Scatter plot of the standing crop ofsculpin and Pacific Giant Salamander against thepercent of fines for 5 study sites, 1992.

Little North Fork Noyo Fishery Study, 1992
25.00
20.00
15.00
5.00
0.00
a:pt8-bmas.pic
2 t' I I I I I I I I I I
1-t
3 - t
Cl15-k
4t
05
02 cl3 rl4
Page 44
20.0 21 .0 22.0 23.0 24.0 25.0 26.0 27.0 28.0 29.0 30.0 31 .0 32.0
Percent Finer than 0.8 mm (%)- E l - Coho + Stee I head
Figure 25. Scatter plot of the standing crop of Cohosalmon and Steelhead Trout against the percent fines atfive study sites, 1992.
A : DENS- PT8
N<E
.
cul.-LL
0 . 5
0.4
0 . 3
0 . 2
0 . 1
0.0
ElX
X
X
A ?II I I I I A
2 0 22 2 4
Percent :"O. 8 mm28 3 0 32
43 Coho Salmon Jt Stee I head Trout
Figure 26. Scatter plot of the density of Coho Salmonand Steelhead Trout against the percent of fines atfive study sites, 1992.

Little North Fork Noyo Fishery Study, 1992
25.00
20 00
15 00
m
5.00
0.00
a:d-g-bmas.pic
I I I 1 I 2' + I
1-k
3t!j+ 01
4-t
Page 45
4 . 5 5 . 0Ave:ige Geh-hr i c gan D i akker [krf]
8 . 0 8 . 5
8 C o h o + Steelhead
Figure 27. Scatter plot of the standing cropof Coho Salmon and Steelhead trout against thegeometric mean diameter of the substrate at five studysites, 1992.
c-u<E.rm.-LL
0 . 5
0 . 4
0 . 3
02
0.1
00
A : DENS- PT8
I I I I I I I
X
X
X
-I- I I I I I I
45 5 . 0 5 . 5 6 . 0 6 . 5 70 75 80 8 . 5Geometr i c Mean
-El- Coho Salmon + Steelhead Trout
Figure 28. Scatter plot of the density of Coho Salmonand Steelhead Trout against the geometric mean particlesize of the substrate at five study sites, 1992.
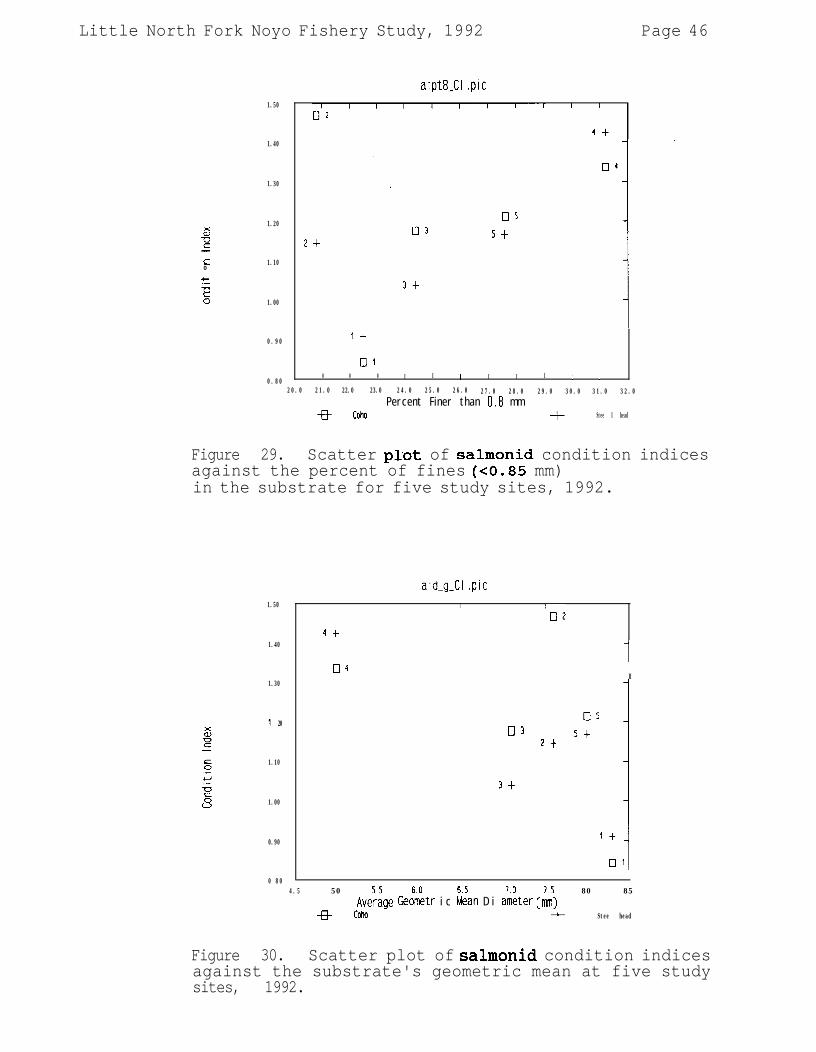
Little North Fork Noyo Fishery Study, 1992 Page 46
1.50
1.40
1.30
1.20zz-
c0
1.10
&';;E 1.00
0 . 9 0
0 . 8 0
a:pt8_CI .pic
2+
3-t
05
5+
It
01
I I I I I I I I I I I
2 0 . 0 2 1 . 0 22.0 23.0 2 4 . 0 2 5 . 0 2 6 . 0 2 7 . 0 2 8 . 0 2 9 . 0 3 0 . 0 3 1 . 0 3 2 . 0Percent F iner than 0 ,8 mm
%- cotlo + Stee I head
Figure 29. Scatter plot of salmonid condition indicesagainst the percent of fines (x0.85 mm)in the substrate for five study sites, 1992.
a:d-g-0 .pic
1.50
1.40
1.30
I. 20
1.10
1.00
0.90
0 8 0
4+
I Ilo2 '
104
I
03
3-k
2-k
4 . 5 50Ad-ige GebLr i c Ean D i a’L&er [AIT]
80 85
-E3- cotlo + Stee I head
Figure 30. Scatter plot of salmonid condition indicesagainst the substrate's geometric mean at five studysites, 1992.

Little North Fork Noyo Fishery Study, 1992 Page 47
100
90
80
70
6 0
50
4 0
30
2 0
10
0
1 //
///
//’
I I/
1’
1 2 3 4 5 6 7 e 9 10 11
F r e d l e I n d e x ( F i )
Coho Salmon Stee I head Trout
Figure 31. Percent survival to emergence forcoho and steelhead against the Fredle Index.Averages for 1992 plotted on the curves.Graph adapted from Lotspeich and Everest(1981).
30.0
25.0
20.0
n25 15.0
?I
!
E
10.0
m
5 . 0
0 . 0A - l e-2 c-3 o-4 E-5 1 9 6 6 1 9 6 7 1 9 6 9
Study S i te and Years
Figure 32. Standing crop (kg/ha) for fivestudy sites, 1992, and for 1966-69 (Burns1972). Darker zones represent coho, lighterzones represent steelhead.

Little North Fork Noyo Fishery Study, 1992 Page 48
- 6 -
- 71950 1955 1 9 6 0 1 9 6 5 1970 1975 1900 1 9 8 5 1 9 9 0 9 2
Year
Figure 33. Monthly Palmer Drought Severity Index forthe North Coast of California since 1950. Conditionsconsidered l%everell (2 -3) and wlextremewl (5 -4) droughtconditions are indicated by horizontal lines.