little skate, leucoraja erinacea, - nrc
TRANSCRIPT
a q14
of
NOAA Technical Memorandum NMFS-NE-175
Essential Fish Habitat Source Document:
Little Skate, Leucoraja erinacea,
Life History and Habitat Characteristics
U. S. DEPARTMENT OF COMMERCENational Oceanic and Atmospheric Administration
National Marine Fisheries ServiceNortheast Region
Northeast Fisheries Science CenterWoods Hole, Massachusetts
March 2003
Recent Issues in This Series:
155. Food ofNorthwest Atlantic Fishes and Two Common Species of Squid. By Ray E. Bowman, Charles E. StillweU, WilliamL. Michaels, and Marvin D. Grosslein. January2000. xiv+ 13 8 p., I fig., 7 tables, 2 app. NTIS Access. No. PB2000-106735.
156. ProceedingsoftheSummer Flounder Aging Workshop, 1-2 February 1999,Woods Hole, Massachusetts.ByGeorgeR. Bolz, James Patrick Monaghan, Jr., Kathy L. Lang, Randall W. Gregory, and Jay M. Burnett. May2000. v + l5p.,5 figs.,5 tables. NTIS Access. No. PB2000-107403.
157. Contaminant Levels in Muscle of Four Species of Recreational Fish from the New York Bight Apex. ByAshokD.Deshpande, Andrew F.J. Draxler, Vincent S. Zdanowicz, Mary E. Schrock, Anthony J. Paulson, Thomas W. Finneran, BethL. Sharack, Kathy Corbo, Linda Arlen, Elizabeth A. Leimburg, Bruce W. Dockum, Robert A. Pikanowski, Brian May, andLisa B. Rosman. June 2000. xxii + 99 p., 6 figs., 80 tables, 3 app., glossary. NTIS Access. No. PB2001-107346.
158. A Framework for Monitoring and Assessing Socioeconomics and Governance of Large Marine Ecosystems. ByJon G. Sutinen, editor, with contributors (listed alphabetically) Patricia Clay, Christopher L. Dyer, Steven F. Edwards, JohnGates, Tom A. Grigalunas, Timothy Hennessey, Lawrence Juda, Andrew W. Kitts, Philip N. Logan, John J. Poggie, Jr.,Barbara Pollard Rountree, Scott R. Steinback, Eric M. Thunberg, Harold F. Upton, and John B. Walden. August 2000. v+32p.,4figs., I table, glossary. NTIS Access.No. PB2001-106847.
159. An Overview and History ofthe Food Web Dynamics Program ofthe Northeast Fisheries Science Center, WoodsHole, Massachusetts. ByJasonS. Link and Frank P. Almeida. October2000. iv+60p.,20 figs., l8tables, I app. NTISAccess. No. PB2001-103996.
160. Measuring Technical Efficiency and Capacity in Fisheries by Data Envelopment Analysis Using the GeneralAlgebraic Modeling System (GAMS): A Workbook. By John B. Walden and James E. Kirkley. October 2000. iii + 15 p.,9 figs., 5 tables. NTIS Access. No. PB2001-106502.
161. Demersal Fish and American Lobster Diets in the Lower Hudson- Raritan Estuary. By Frank W. Steimle, RobertA. Pikanowski, DonaldG. McMillan, ChristineA. Zetlin, and Stuart J. Wilk. November2000. vii + 10 6 p., 2 4 figs., 51 tables.NTIS Access. No. PB2002-105456.
162. U.S. Atlantic and Gulf of Mexico Marine Mammal StockAssessments- 2000. Edited by Gordon T. Waring, JaneenM. Quintal, and Steven L. Swartz, with contributions from (listed alphabetically) Neilo B. Barros, Phillip J. Clapham, TimothyV.N. Cole, Carol P. Fairfield, Larry J. Hansen, Keith D. Mullin, Daniel K. Odell, Debra L. Palka, Marjorie C. Rossman, U.S.Fish and Wildlife Service, Randall S. Wells, and Cynthia Yeung. November2000. ix + 303 p., 4 3 figs., 55 tables, 3 app. NTISAccess. No. PB2001-10409 1.
163. Essential Fish Habitat Source Document: Red Deepsea Crab, Chaceon (Geryon) quinquedens, Life History andHabitat Characteristics. By Frank W. Steimle, Christine A. Zetlin, and Sukwoo Chang. January 2001. v + 27 p., 8 figs.,I table. NTIS Access. No. PB200 1-103542.
164. AnOverviewoftheSocialand EconomicSurveyAdministeredduringRound II oftheNortheastMultispecies FisheryDisaster Assistance Program. By Julia Olson and Patricia M. Clay. December 2001. v+ 69p.,3 figs., 18 tables, 2 app.NTIS Access. No. PB2002-105406.
165. A Baseline Socioeconomic Study of Massachusetts' Marine Recreational Fisheries. ByRonaldJ. Salz, DavidK.Loomis, Michael R. Ross, and Scott R. Steinback. December 2001. viii + 12 9 p., I fig., 81 tables,4 app. NTIS Access. No.PB2002-108348.
166. Report on the Third Northwest Atlantic HerringAcoustic Workshop, University ofMaine Darling Marine Center,Walpole, Maine, March 13-14,2001. By William L. Michaels, editor and coconvenor, and Philip Yund, coconvenor.December2001. iv+ 18p., 14 figs.,2app. NTIS Access. No. PB2003-101556.

0 . c~pf
1.
z
NOAA Technical Memorandum NMFS-NE-175This series represents a secondary level of scientific publishing. All issues employthorough internal scientific review; some issues employ external scientific review.Reviews are - by design -- transparent collegial reviews, not anonymous peerreviews. All issues may be cited in formal scientific communications.
Essential Fish Habitat Source Document:
Little Skate, Leucoraja erinacea,
Life History and Habitat Characteristics
David B. Packer, Christine A. Zetlin, and Joseph J. Vitaliano
National Marine Fisheries Serv., James J. Howard Marine Sciences Lab., 74 Magruder Rd., Highlands, NJ 07732
U. S. DEPARTMENT OF COMMERCEDonald L. Evans, Secretary
National Oceanic and Atmospheric AdministrationVice Admiral Conrad C. Lautenbacher, Jr., USN (ret.), Administrator
National Marine Fisheries ServiceWilliam T. Hogarth, Assistant Administrator for Fisheries
Northeast RegionNortheast Fisheries Science Center
Woods Hole, Massachusetts
March 2003

Editorial Notes on Issues 122-152, 163, and 173-179in the
NOAA Technical Memorandum NMFS-NE Series
Editorial Production
For Issues 122-152, 163, and 173-179, staffofthe Northeast Fisheries Science Center's (NEFSC's) Ecosystems ProcessesDivision have largely assumed the role of staff of the NEFSC's Editorial Office for technical and copy editing, typecomposition, and page layout. Other than the four covers (inside and outside, front and back) and first two preliminarypages, all preprinting editorial production has been performed by, and all credit for such production rightfully belongsto, the staff of the Ecosystems Processes Division.
Internet Availability
Issues 122-152, 163, and 173-179 have been copublished, i.e., both as paper copies and as Web postings. All Web postingsare available at: www.nefsc.noaa.gov/nefsc/habitat/e/h7. Also, all Web postings are in "PDF" format.
Information Updating
By federal regulation, all information specific to Issues 122-152, 163, and 173-179 must be updated at least every five years.All official updates will appear in the Web postings. Paper copies will be reissued only when and if new informationassociated with Issues 122-152, 163, and 173-179 is significant enough to warrant a reprinting of a given issue. All updatedand/or reprinted issues will retain the original issue number, but bear a "Revised (Month Year)" label.
Species Names
The NMFS Northeast Region's policy on the use of species names in all technical communications is generally to followthe American Fisheries Society's lists of scientific and common names for fishes (i.e., Robins et al. 19911), mollusks (i.e.,Turgeon et al. 199 81), and decapod crustaceans (i.e., Williams et al. 19891), and to follow the Society for MarineMarmnmalogy's guidance on scientific and common names for marine mammals (i.e., Rice 19 9 8d). Exceptions to this policyoccur when there are subsequent compelling revisions in the classifications of species, resulting in changes in the namesof species (e.g., Cooper and Chapleau 19981; McEachran and Dunn 1998).
"Robins, C.R. (chair); Bailey, R.M.; Bond, C.E.; Brooker, J.R.; Lachner, E.A.; Lea, R.N.; Scott, W.B. 1991. Common and scientific namesof fishes from the United States and Canada. 5th ed, Amer. Fish. Soc. Spec. IPubl. 20; 183 p.
'Turgeon, D.D. (chair); Quinn. J.F., Jr.; Bogan, A.E.: Coan, E.V.: Hochberg, F.G.; Lyons, W.G.: Mikkelsen, P.M.; Neves, R.J.; Roper, C.F.E.;Rosenberg, G.: Roth, B.; Scheltema, A.; Thompson, F.G.; Vecchione, M.; Williams, J.D. 1998. Common and scientific names of aquaticinvertebrates from the United States and Canada: mollusks. 2nd ed. Amer. Fish. Soc. Spec. Puhi. 26; 526 p.
'Williams, A.B. (chair); Abele, L.G.; Felder, D.L.; Hobbs, H,H., Jr.; Manning, RB.; McLaughlin, P.A.; PIrez Farfante, 1. 1989. Commonand scientific names of aquatic invertebrates friom the United States and Canada: decapod crustaceans, Amer. Fish, Soc. Spec, Pu1L17; 77 p.
"Rice. I).W. 1998. Marine mammals of the world: systematics and distribution. Soc. Mar. Mammal. Spec. PtuhI. 4; 231 p.'Cooper. J.A.; Chapleau, F. 1998. Monophyly and interrelationships of the family Pleuronectidae (Pleuronectiformes), with a revised
classification. Fish. Bull. (U.S.) 96:686-726.rMctachran, ,.D.; l)unn, KA. 1998. Phylogenetic analysis of skates, a morphologically conservative clade of elasmobranchs
(Chondrichthyes: Rajidae). Copeia 1998(2):271-290.

Page iii
FOREWORD
One of the greatest long-term threats to the viability ofcommercial and recreational fisheries is the continuingloss of marine, estuarine, and other aquatic habitats.
Magnuson-Stevens Fishery Conservation andManagement Act (October 11, 1996)
The long-term viability of living marine resourcesdepends on protection of their habitat.
NMFS Strategic Plan for FisheriesResearch (February 1998)
The Magnuson-Stevens Fishery Conservation andManagement Act (MSFCMA), which was reauthorizedand amended by the Sustainable Fisheries Act (1996),requires the eight regional fishery management councilsto describe and identify essential fish habitat (EFH) intheir respective regions, to specify actions to conserveand enhance that EFH, and to minimize the adverseeffects of fishing on EFH. Congress defined EFH as"those waters and substrate necessary to fish forspawning, breeding, feeding or growth to maturity." TheMSFCMA requires NMFS to assist the regional fisherymanagement councils in the implementation of EFH intheir respective fishery management plans.
NMFS has taken a broad view of habitat as the areaused by fish throughout their life cycle. Fish use habitatfor spawning, feeding, nursery, migration, and shelter, butmost habitats provide only a subset of these functions.Fish may change habitats with changes in life historystage, seasonal and geographic distributions, abundance,and interactions with other species. The type of habitat,as well as its attributes and functions, are important forsustaining the production of managed species.
The Northeast Fisheries Science Center compiled theavailable information on the distribution, abundance, andhabitat requirements for each of the species managed bythe New England and Mid-Atlantic Fishery ManagementCouncils. That information is presented in this series of38 EFH species reports (plus one consolidated methodsreport). The EFH species reports are a survey of theimportant literature as well as original analyses of fishery-
JAMES J. HOWARD MARINE SCIENCES LABORATORYHIGHLANDS, NEW JERSEYSEPTEMBER 1999
independent data sets from NMFS and several coastalstates. The species reports are also the source for thecurrent EFH designations by the New England and Mid-Atlantic Fishery Management Councils, andunderstandably have begun to be referred to as the "EFHsource documents."
NMFS provided guidance to the regional fisherymanagement councils for identifying and describing EFHof their managed species. Consistent with this guidance,the species reports present information on current andhistoric stock sizes, geographic range, and the period andlocation of major life history stages. The habitats ofmanaged species are described by the physical, chemical,and biological components of the ecosystem where thespecies occur. Information on the habitat requirements isprovided for each life history stage, and it includes, whereavailable, habitat and environmental variables that controlor limit distribution, abundance, growth, reproduction,mortality, and productivity.
Identifying and describing EFH are the first steps inthe process of protecting, conserving, and enhancingessential habitats of the managed species. Ultimately,NMFS, the regional fishery management councils, fishingparticipants, Federal and state agencies, and otherorganizations will have to cooperate to achieve the habitatgoals established by the MSFCMA.
A historical note: the EFH species reports effectivelyrecommence a series of reports published by the NMFSSandy Hook (New Jersey) Laboratory (now formallyknown as the James J. Howard Marine SciencesLaboratory) from 1977 to 1982. These reports, whichwere formally labeled as Sandy Hook LaboratoryTechnical Series Reports, but informally known as"Sandy Hook Bluebooks," summarized biological andfisheries data for 18 economically important species. Thefact that the bluebooks continue to be used two decadesafter their publication persuaded us to make theirsuccessors - the 38 EFH source documents - available tothe public through publication in the NOAA TechnicalMemorandum NMFS-NE series.
JEFFREY N. CROSS, (FORMER) CHIEF
ECOSYSTEMS PROCESSES DIVISIONNORTHEAST FISHERIES SCIENCE CENTER

Page iv

Page v
Contents
In tro d u c tio n ......................................................................................................................................................................................nL ife H isto ry ......................................................................... : ............................................ : .............................................................. IG eog rap h ical D istrib u tio n ................................................................................................................................................................. 6H ab itat C h ara cteristics ...................................................................................................................................................................... 8S ta tu s o f th e S to c k s ......................................................................................................................................................................... IR e se a rc h N e e d s ... ............................................................................................................................................................................ 12
A c k n o w led g m en ts ............................................................................................................................... ........................................... 12R e fe re n c e s C ite d ............................................................................................................................................................................. 12
Tables
Table I. Summary of habitat parameters for little skate, based on the pertinent literature .............................................. 15Table 2. Summary of habitat parameters for little skate, based on the most recent NEFSC and state surveys ..................... 17
Figures
Figure 1. The little skate, Leucoraja erinacea (Mitchill 1825) .............................................................................................. 19
F ig ure 2 . E gg case o f little skate .................................................................................................................................................. 2 0Figure 3. Abundance (% occurrence) of the major prey items of little skate collected during NEFSC bottom trawl surveys ..... 21Figure 4. Distribution of juvenile little skate collected during winter NEFSC bottom trawl surveys .................................... 23
Figure 5. Distribution and abundance of juvenile little skate collected during spring NEFSC bottom trawl surveys ................. 24Figure 6. Distribution of juvenile little skate collected during summer NEFSC bottom trawl surveys .................................. 25Figure 7. Distribution and abundance of juvenile little skate collected during fall NEFSC bottom trawl surveys ................. 26
Figure 8. Distribution and abundance of juvenile little skate in Massachusetts coastal waters .............................................. 27Figure 9. Distribution and abundance of juvenile and adult little skate collected in Long Island Sound ................................ 29Figure 10. Monthly log,, length frequencies of juvenile and adult little skate collected in Long Island Sound ........................ 30
Figure 11. Relative abundance catch/tow and percent occurrence for juvenile and adult little skate in Long Island Sound ......... 31
Figure 12. Seasonal distribution and abundance ofjuvenile little skate in the Hudson-Raritan estuary .................................. 32Figure 13. Seasonal distribution and abundance of juvenile and adult little skate in Delaware Bay ........................................ 34Figure 14. Distribution of adult little skate collected during winter NEFSC bottom trawl surveys ......................................... 38
Figure 15. Distribution and abundance of adult little skate collected during spring NEFSC bottom trawl surveys .................. 39
Figure 16. Distribution of adult little skate collected during summer NEFSC bottom trawl surveys ...................................... 40Figure 17. Distribution and abundance of adult little skate collected during fall NEFSC bottom trawl surveys ...................... 41
Figure 18. Distribution and abundance of adult little skate in Massachusetts coastal waters ..................................................... 42Figure 19. Seasonal distribution and abundance of adult little skate in the Hudson-Raritan estuary ....................................... 44
Figure 20. Spring/fall distributions of juveniles relative to bottom temperature, depth, and salinity based on NEFSC surveys ... 46
Figure 21. Distributions of juveniles relative to bottom temperature and depth based on Massachusetts inshore surveys ............ 48Figure 22. Seasonal distributions of juveniles relative to temperature, depth, salinity, and DO in the Hudson-Raritan estuary ... 50Figure 23. Seasonal distributions of juveniles and adults relative to temperature, depth, salinity, and DO in Delaware Bay ....... 54
Figure 24. Spring/fall distributions of adults relative to bottom temperature, depth, and salinity based on NEFSC surveys ........ 58
Figure 25. Distributions of adults relative to bottom temperature and depth based on Massachusetts inshore surveys ............ 60Figure 26. Seasonal distributions of adults relative to temperature, depth, salinity, and DO in the Hudson-Raritan estuary ........ 62
Figure 27. NEFSC spring survey index of little skate biomass and commercial landings of the seven species skate complex ..... 66

Page 1
INTRODUCTION
The little skate [Leucoraja erinacea (Mitchill 1825);formerly Raja erinacea, see McEachran and Dunn(1998); Figure 1] occurs from Nova Scotia to CapeHatteras and is one of the dominant members of thedemersal fish community of the northwest Atlantic(Bigelow and Schroeder 1953; Richards et al. 1963;McEachran and Musick 1975; Michalopoulos 1990). Itscenter of abundance is in the northern section of the Mid-Atlantic Bight and on Georges Bank, where it is foundyear-round over almost the entire range of temperaturesrecorded for those areas (McEachran and Musick 1975).Little skate make no extensive migrations, althoughwhere it occurs inshore the species moves onshore andoffshore with seasonal temperature changes (Bigelow andSchroeder 1953; Merriman et al. 1953; Fitz and Daiber1963; Richards 1963; Richards et al. 1963; Schaefer1967; Tyler 1971 a, b). It also moves north and south withseasonal temperature changes along the southern fringe ofits range (McEachran and Musick 1975).
Smaller little skate are often confused with itssympatric species, winter skate (Leucoraja ocellata); thedistinctions are size-dependent (McEachran and Musick1973; McEachran 2002). Number of tooth rows, length atmaturity, and location of pelvic denticles are thecharacters most commonly used to differentiate the twospecies (Michalopoulos 1990).
LIFE HISTORY
EGGS
The single fertilized egg is encapsulated in a leathery,greenish-brown case or capsule known as a "mermaid'spurse" which is deposited on the bottom and often washesup on beaches. The egg cases are laid in pairs. They arerectangular in shape, 44-63 mm long and 30-45 mm wide,with a hollow curved horn at each comer (Figure 2;Vladykov .1936; Fitz and Daiber 1963). The anteriorhorns are curved inward and are about half the length ofthe case while the posterior horns are more or less straightor slightly curved outwardly and are about as long as thecase [McEachran (2002); see also Johnson (1979) for acomprehensive description of the egg case]. Walls of thecase are smooth but have longitudinal striations. Thecases have sticky filaments that allow them to adhere tothe bottom substrates.
External gills appear from the walls of the gill slits25-30 days to 90-95 days after spawning but thesedisappear before hatching (Pelster and Bemis 1992).Gestation is at least six months or more. Aquariumstudies mentioned by Bigelow and Schroeder (1953)showed that eggs laid in May-July hatched between theend of. November and beginning of January, about 5-6months. Richards et al. (1963) also determined that eggsspawned in the late spring and early summer required five
to six months to hatch. Since the water temperature of theaquarium in which the eggs were kept was slightly abovethat of the natural environment, it is possible that theincubation time was underestimated. Perkins (1965) in astudy conducted at Boothbay Harbor, Maine, found underaquarium conditions where the water temperature closelyapproximated that of the inshore waters, eggs deposited inNovember and December hatched after twelve months ofincubation. Johnson (1979) performed flow-throughseawater system studies using ambient temperaturesresembling those of the inshore waters of Block IslandSound at 20 m. The incubation period ranged from 112-366 d and was dependent on month of deposition. Eggsdeposited in September 1975 hatched after an average of360 d. Incubation time decreased progressively fromSeptember, and eggs deposited in July 1977 developedand hatched in an average of 122 d. The rate ofembryonic growth appeared to be directly related totemperature. In Perkins (1965) study, incubation of eggsdeposited in November and December showed the firstembryonic activity in March when the water temperaturehad risen to 7°C.
JUVENILES
The young are 93-102 mm TL at hatching (Richardset al. 1963; McEachran 2002) and are fully developed,resembling the adult in both shape and coloration.
ADULTS
Bigelow and Schroeder (1953) reported adult littleskate to have an average size of 41-51 cm TL, with amaximum length of 53 cm TL. Waring (1984) calculatedthe maximum size to be 53 cm TL; McEachran (2002)reports the maximum size as 54 cm TL. Johnsoncalculated the maximum size for little skate from BlockIsland Sound to be 60 cm TL for males and 62 cm TL forfemales. Maximum size and size at maturity increasestoward the northern end of their range (Richards et al.1963; McEachran and Martin 1977).
AGE AND GROWTH
Age and growth of little skate have been estimatedfrom length frequency plots and by counting rings onvertebral centra (Richards et al. 1963; Johnson 1979;Waring 1984). Johnson (1979) reported mean length atage for male little skate from Block Island Sound was20.0 cm TL at age 1, 30.3 cm TL at age 2, 38.7 cm TL atage 3, 45.1 cm TL at age 4, and 48.8 cm TL at age 5. Forfemales the mean length at age was 21.0 cm TL at age 1,31.3 cm TL at age 2, 38.3 cm TL at age 3, 45.8 cm TL atage 4, and 48.3 cm TL at age 5. Little skate from GeorgesBank to Delaware Bay averaged 21.5 cm TL at age 1,

Page 2
29.3 cm TL at age 2, 36.4 cm TL at age 3, 42.0 cm TL atage 4, 46.1 cm TL at age 5, 47.2 cm TL at age 6, 47.5 cmTL at age 7, and 48.1 cm TL at age 8 (Waring 1984).Bigelow and Schroeder (1953) originally reported thatskate 20 cm long may be 1-1.5 yrs old, 30 cm long maybe 2-3 yrs old, 40 cm long may be 3-4 yrs old, and 50 cmlong may be 6-8 yrs old.
Richards et al. (1963), who examined skates fromLong Island and Block Island Sounds, determined thatthey grow approximately 10 cm/yr for the first threeyears; between the third and fourth years,. growthdecreases to around 5 cm/yr [Merriman et al. (1953)generally concurs]. Richards et, al. (1963) also noted thatdifferences in size between the sexes were unnoticeableuntil skates reached adolescence. Then the males fromboth Sounds became longer and heavier than the females.Adult nmales were also larger than females and themajority of those > 50 cm TL were males.
Natanson (1990) performed age and growthexperiments on skate from. Narragansett Bay, RhodeIsland that were held in an experimental tank with a meantemperature of 18'C and a control tank with temperaturesthat fluctuated with the seasons (range from 1-23'C). Thefish in the experimental tank were 41.0-44.7 cm TL andthe fish in the control tank were 34.0-47.7 cm TL. Thegrowth rates of skates from the experimental tank rangedfrom 1.3-3.4 cm TL/yr and rates in the control tankranged from 1.0-4.9 cm TL/yr. Growth of individualsfrom both tanks was considered slow compared to fieldestimates for little skate by Johnson (1979), but similar toestimates by Waring (1984). Waring's (1984) studyshowed skates of this size growing from 2.30-4.65 cmTL/yr and Johnson's (1979) study showed faster growthof 4.22-8.26 cm TL/yr. The size at age in the Natanson(1990) study was also lower than in Johnson (1979) andWaring's (1984) studies. The size at age from theNatanson (1990) study supported the growth ratesobserved in her laboratory. Data from the Natanson(1990) study also indicates that growth would be slowover the life of the individual as compared to growth ratesin Johnson's (1979) or Waring's (1984) studies. Thedifference is probably related to differences in vertebraepreparation and criteria for an annual band (Natanson1990).
SIZE AT MATURITY
Bigelow and Schroeder (1953) reported that femalesmature when 32-43 cm TL, and males at 36-45 cmTL,based on information supplied by others, whileMcEachran (2002) states that maturity is reached between35-50 cm TL. McEachran (1973) studied skates collectedfrom Nova Scotia and the Gulf of Maine to Cape Hatterasbetween 1967-1970 and found that about a third of thelittle skate between 42-44 cm TL as well as all those > 50cm TL were mature; the smallest mature little skate was amale 41 cm TL. Richards el al. (1963) reported the
average total length at maturity for male and female littleskate in Block Island Sound was 46.3 cm TL and 45.9 cmTL, respectively. Johnson (1979) used females > 47 cmTL in his, laboratory studies because that was the lengththat the largest percentage of females had reachedmaturity.
Based on the predictive equations from Frisk et al.(2001) and the Northeast Fisheries Science Center(NEFSC) survey maximum observed length of 62 cm TL,Lmat is estimated at 50 cm TL and Amat is estimated at 4years (Northeast Fisheries Science Center 2000b).
REPRODUCTION
Mating in little skate may take place at any timethroughout the year and frequently (Bigelow andSchroeder 1953; Richards et al. 1963; Johnson 1979).Egg cases are also found partially to fully developed inmature females year-round but several authors report thatthey are most frequently encountered from late October-January and from June-July (Fitz and Daiber 1963;Richards et al. 1963; Scott and Scott 1988); Bigelow andSchroeder (1953) also mention that eggs are taken offsouthern New England mostly from July to September.
In Block Island Sound, Johnson (1979) also reportedpregnant little skate were present during all months of theyear, but again the seasonal percentages of pregnantfemales varied. Periods of relatively high pregnancy-frequency were October-December and April-May, whilelow periods occurred in August-September and February-March. Peaks in egg production were in November andMay when 34% and 44% of the females examined werepregnant, respectively. The lowest levels of productioncame in September and March when approximately 1% ofthe females were pregnant.
Johnson (1979) found the mean number of matureand maturing eggs per fish increased significantly prior toand during the spawning peaks, reaching maxima inOctober and May. The average number of mature andmaturing eggs decreased significantly between whatappears to -be two spawning seasons with minima inAugust and January. The greatest ovarian productionoccurred in the spring. In Delaware Bay, Fitz and Daiber(1963) also showed that the greatest ovarian productionoccurred in the spring, while the size and number of eggswas at a minimum in February and March.
Johnson (1979) reported that ovarian weight alsoincreased significantly during two spawning seasons.Comparison of the female gonad weight expressed as apercentage of total body weight demonstrated twoseasonal peaks with maxima occurring in October andMay; these seasonal peaks represented and increase inovarian production. After the height of spawning, thefemale gonad weight dropped off significantly, reaching aminima in January and August.
Rate of egg laying in Johnson's (1979) study variedfrom 0.20-0.67 eggs/d, with an average rate. of 0.39

Page 3
eggs/d. Johnson (1979) suggests that an average femalelittle skate which spawns twice annually (once during falland spring) produces approximately 30 eggs/yr. Bigelowand Schroeder (1953) observed that eggs in aquaria werelaid at intervals of from five days to several weeks, andwere partially buried in sand.
FOOD HABITS
Generally, invertebrates such as decapod crustaceansand amphipods are the most important prey items,followed by polychaetes (Bigelow and Schroeder 1953;Tyler 1972; McEachran 1973; McEachran et al. 1976;Bowman and Michaels 1984; Nelson 1993; Bowman etal. 2000; Garrison 2000; Garrison and Link 2000a, b;Scharf et al. 2000). isopods, bivalves, and fishes are ofminor importance. Bigelow and Schroeder (1953)reported hermit and other crabs, shrimps, polychaetes,amphipods, ascidians, bivalves, squid, fishes, and evencopepods. Little skate from the Woods Hole regioncontained mostly crabs, followed by shrimp (Crangonseptemspinosa), and squid. The fishes that were eatenincluded sand lance, alewives, herring, cunners,silversides, tomcod, and silver hake. Hydroids are alsoingested (Avent et al. 2001).
McEachran (1973) studied skates collected fromNova Scotia to Cape Hatteras during 1967-1970; thefollowing diet descriptions are from him and McEachranet al. (1976).
Crangon septemspinosa, Pagurus acadianus, Cancerirroratus, and Dichelopandalus leptocerus were the mostfrequently eaten decapods in the Mid-Atlantic Bight andon Georges Bank. C. septemspinosa was the mostnumerous decapod in the stomachs while P. acadianusand C. irroratus accounted for most of the stomachvolume. In the Gulf of Maine and on the Nova Scotianshelf Pagurus pubescens, C. septemspinosa, Hyas sp.,and Eualus pusiolus were the most frequently eatendecapods.
The most frequently consumed amphipods in theMid-Atlantic Bight and on Georges Bank wereMonoculoides sp., Unciola sp., Leptocheirus pinguis,ampeliscids, haustoriids, and Dulichia (= Dyopedos)monacantha. L. pinguis predominated in the Mid-AtlanticBight and Monoculodes sp. and Unciola predominated inlittle skate from Georges Bank. Haustoriid amphipodswere abundant only in the little skate from Georges Bankand contributed significantly to the stomach contents onlyduring the autumn survey. Pleustes panoplus, L. pinguis,Hippomedon serratus, Monoculodes sp., and Unciola sp.were the most frequently eaten amphipods in the Gulf ofMaine and on the Nova Scotian shelf.
Eunice pennata and Nereis spp. were the mostnumerous polychaetes, with E. pennata abundant only onthe Nova Scotian shelf and Nereis spp. numerous only inthe Mid-Atlantic Bight. Other major polychaetesconsumed in the Mid-Atlantic Bight and on Georges
Bank were Nepthys spp., Lumbrineris fragilis, Aphroditehastata, maldanids, (mostly Clymenella torquata),Glycera spp., and Pherusa affinis. A. hastata contributedmost to the stomach volume. The polychaetes Opheliadenticulata, Nothria conchylega, and Pectinaria sp.predominated in stomachs from the Gulf of Maine and theNova Scotian shelf.
Among the minor prey items consumed included theisopods Cirolana (= Politolana?) polita and Chiridoteatuftsi. The former species accounted for almost the entirevolume of isopods. Most of the bivalves eaten were in thefamily Solenidae, with Ensis directus the only species ofthis family identified. Solemya sp. was the only otherbivalve recognized. The most numerous fishes that wereeaten included yellowtail flounder and longhorn sculpin.
Nelson (1993) studied the diet of little skate at twostations on Georges Bank, his results were similar toMcEachran (1973) and McEachran et al. (1976) in termsof the major phyla consumed in that area. Amphipodsdominated the diets numerically and decapods dominatedthe diets by weight, followed by (depending on site)polychaetes, bivalves, fish, isopods, and cnidarians.
In Sheepscot Bay, Maine, little skate ate a variety ofprey, but seemed to focus most on crustaceans (Packerand Langton, unpublished manuscript) and Atlanticherring, at least on a percent weight basis (Langton andWatling 1990). C. septemspinosa, the jonah crab Cancerborealis, the amphipods L. pinguis and U. inermis, andseveral other varieties of crustaceans were important inthe diet, followed by polycheates such as Nephtys spp.(Packer and Langton, unpublished manuscript). In JohnsBay, Maine, little skate fed primarily on the decapodcrustaceans C. septemspinosa and C. irroratus, followedby the amphipods L. pinguis, Unciola spp. andMonoculodes spp. (Hacunda 1981). Polychaetes were thenext major prey group.
Smith (1950) conducted diet studies on little skatefrom Block Island Sound; the diet was similar to that oflittle skate in the McEachran (1973) and McEachran et al.(1976) studies. L. pinguis was most abundant in the diet,followed by C. irroratus, C. septemspinosa, Upogebiaaffinis (a mud shrimp), Glycera dibranchiata, Byblisserrata (an amphipod), Unciola irrorata, Nephtys incisa,and E. directus.
Carlson (1991) found that decapods made up 76% ofthe diet by weight in New Haven Harbor. C.septemspinosa and C. irroratus were the most importantprey items, followed by mantis shrimp, Squilla empusa.Other crustacean groups did not constitute a majorportion of the diet. Fish were the next major group, butonly made up 10% of the diet by weight and only 4% bynumber. There was a high diet overlap with otherpredators including striped searobin, tautog, andwindowpane because of their similar dependence oncrustaceans.
Fitz and Daiber (1963) conducted diet studies onlittle skate in Delaware Bay. C. septemspinosa made up >70% of the diet, followed by E. directus and Euceramus

Page 4
praelongus (a burrowing crab). In the fall, the latter twoprey items, along with the polychaete Nereis limbata ( =Neanthes succinea), were more prominent in the skates'diet than in the spring.
In -the inshore diet studies mentioned above, theskates generally depended more on a few major preyspecies than skates from the McEachran (1973) andMcEachran et al. (1976) studies. This may be attributableto the benthic faunal composition in these inshore areas;these areas have a less diverse fauna than the wide regionsampled as part of the McEachran (1973) and McEachranet al. (1976) studies. But it is clear that the food habits oflittle skate are fairly generalized, and it is an opportunisticpredator (McEachran 1973; McEachran et al. 1976;Nelson 1993; Packer and Langton, unpublishedmanuscript).
McEachran (1973) and McEachran et al. (1976)showed that the diet of little skate is size-dependent.Skate < 41 cm TL consumed considerably fewerdecapods and more amphipods than those that were > 41cm TL. Most decapods eaten by skates < 30 cm TL wereC. septemspinosa. Haustoriid amphipods were almostnever found in skates >ý 30 cm TL. Cumaceans andcopepods were also limited to the smaller skates. All sizesfed on fishes, ýbut the frequency of occurrence increasedwith the size of the skate. Polychaetes were eaten by allsizes.
The 1973-1990 NEFSC food habits database for littleskate [Figure 3; see Reid et al. (1999) for details]generally confirms the McEachran (1973) and McEachranet al. (1976) studies. Crustaceans dominated the dietoverall, but declined in importance with increasing skatesize while the percent occurrence of polychaetesincreased with increasing skate size. Amphipods occurredmore frequently than decapods until the skates were > 41cm TL. C. septemspinosa was the major decapod prey forall sizes of skate. The following is a description of thediet from the NEFSC food habits database broken downby little skate size class (Figure 3).
For little skate 1-10 cm TL, 97% of the diet consistedof crustaceans, with 42% of the diet consisting ofidentifiable amphipods. The most abundant amphipodspecies included B. serrata, U. irrorata, Monoculodesintermedius, Synchelidium sp., as well as severalunidentifiable Gammaridea. Identifiable cumaceans madeup 27% of the diet, notable species included Cyclaspisvarians and Diastylis spp. Identifiable decapods made uponly 8% of the diet, all of which were either C.septemspinosa or classified as unidentifiableCrangonidae.
For skate 11-20 cm TL, 90% of the diet consisted ofcrustaceans, and at least half of the diet consisted ofidentifiable amphipods. Major amphipod species includedB. serrata, U. irrorata, L. pinguis, Ericthoniusrubricornis, and several unidentifiable gammarids,ampeliscids, oedicerotids, and caprellids. Identifiabledecapods made up 18-20% of the diet, most of which
were C. septemspinosa; other important decapodsincluded pagurid and Cancer crabs.
The percentage of crustaceans in the diet of littleskate 21-30 cm TL dropped to 83%, although almost halfof the diet still consisted of identifiable amphipods. Themajor amphipod prey species were similar to the 11-20cm TL size class, with the addition of M edwardsi.Identifiable decapods again made up 18-20% of the diet,the majority of which were again C. septemspinosa alongwith Cancer and pagurid crabs. Identifiable polychaetesmade up only 10-1.1% of the diet, most of which wereterebellids.
The percent occurrence of crustaceans in the diet oflittle skate 31-40 cm TL dropped further, down to 73-78%, with identifiable amphipods making up only 32-36% of the overall diet. The usual amphipods weredominant; in order of abundance they were U. irrorata, L.pinguis, unidentifiable gammarids, B. serrata,unidentifiable ampeliscids, M edwardsi, andunidentifiable caprellids, haustoriids, and oedicerotids.Identifiable decapods made up 25-28% of the diet; C.septemspinosa was again the dominant decapod prey,followed by Cancer and pagurid crabs, andDichelopandalus leptocerus. Identifiable polychaetesmade up only 14-15% of the diet; the majority wereterebellids and maldanids.
The percent occurrence of crustaceans in the dietcontinued to decline for little skate 41-50 cm TL: down to66-71%, with identifiable amphipods making up only 22-28% of the diet, while identifiable decapods made up 29-32%. The usual amphipods were dominant, especially L.pinguis and U. irrorata, followed by the others previouslymentioned. C. septemspinosa continued to be thedominant decapod prey, followed by Cancer and paguridcrabs. Identifiable polychaetes made up 17-18% of thediet, with the dominant family being the Terebellidae.Other abundant families included the Nephtyidae,Maldanidae, Aphroditidae, and the Flabelligeridae.
Finally, the percent occurrence of crustaceans in thediet declined to 64-69% for skate 51-60 cm TL, withidentifiable amphipods making up only 19-22% of thediet, while identifiable decapods 29-34%. L. pinguis wasthe dominant amphipod; C. septemspinosa, Cancer, andpagurid crabs were the dominant decapods. Identifiablepolychaetes made up 19-20% of the diet, with thedominant family being the Terebellidae.
Other authors also show similar size-dependenttrends in the diet of little skate. Bowman and Michaels(1984) and Bowman et al. (1987) reported that whilecrustaceans were the dominant prey of all sizes of littleskate, skate < 35 cm TL preyed mostly on amphipods(including Unciola) and those > 35 cm TL ate largequantities of decapods (including C. septemspinosa).Polychaetes, mollusks, and fish were found primarily inlittle skate > 20 cm TL. Again, using NEFSC data from1977-1980, Bowman et al. (2000) also found that in termsof percent weight, crustaceans were important for all sizeclasses of skate. Skate < 15-30 cm TL fed mostly on

Page 5
amphipods, including L. pinguis, Unciola spp, Gammarusannulatus, and Oedicerotidae. Skate 36 to > 51 cm TL fedmostly on decapods, including C. irroratus, C. borealis,P. acadianus, and C. septemspinosa [although, as in theMcEachran (1973) and McEachran et al. (1976) studies,C. septemspinosa was eaten mostly by skates < 30 cmTL]. On Georges Bank, Nelson (1993) discovered thatcolonial amphipods and small, epibenthic decapodsdominated the diets of little skate < 39 cm TL at both ofhis study sites, but species composition was site and sizedependent. At one site, Ericthonius fasciatus and U.inermis comprised the largest portions of the diet ofskates < 39 cm TL. As skate length increased, E~fasciatusdeclined while U. inermis became increasingly importantin the diets. For skates > 40 cm TL, the epibenthicdecapods C. septemspinosa and young-of-the-year C.irroratus and the isopod C. polita were large componentsof the diet. The polychaete Glycera dibranchiata andyoung-of-the-year hakes (eaten mostly in summer) alsoincreased in the diet. At a second site, the dominant preyitems for skate < 39 cm TL was C. septemspinosa,followed by (except for skates 10-19. cm TL) theamphipod Protohaustorius wigleyi. Other notableamphipods were Monoculodes edwardsi, Rhepoxyniushudsoni, Pontogeneia inermis, and Aeginina longicornis;C. polita and C. irroratus were the most importantepibenthic arthropods. For skates > 40 cm TL, M.edwardsi, C. septemspinosa, C. polita, and P. inermis
were dominant; the cnidarian Cerianthus spp. dominatedin terms of weight.
In Sheepscot Bay, a study by Packer and Langton(unpublished manuscript) again indicated that thepercentage of crustacean prey in the diet decreased as theskate size increased. This was due to decreases inamphipods, cumaceans, and C. septemspinosa.Polychaetes (including Nephtys spp.) were a small butimportant part of the diet for skate > 20 cm TL. Atlanticherring occurred only in the stomachs of fish > 40 cm TL,but were only prominent in terms of percent weight.Richards (1963) found that amphipods and C.septemspinosa were more important to smaller skates.Tyler (1972) also noted that smaller skates (< 44 cm TL)ate mysids and amphipods and larger skate consumeddecapods, euphausids, and polychaetes.
Nelson (1993) calculated the predation impact oflittle skate on their Georges Bank prey. Annual estimatesof consumption for little skate increased as they grew'larger. Consumption ranged from 0.085. kg/fish/year forskate 10-19 cm TL to 0.860 kg/fish/year for skate 50-59cm TL. The percentage of benthic production consumedby little skate from 1969-1990 ranged from 5-15%.Nelson (1993) suggests that in relation to the totalmacrofauna production on Georges Bank, little skate(along with winter skate) consume < 0.02% of the total.These results indicate that only a small to moderateproportion of benthic biomass vulnerable to skate.predation is consumed by both little and winter skate, and
their consumptive impact will be dependent on the levelsof invertebrate biomass and/or production.
PREDATORS AND SPECIESASSOCIATIONS
Eggs of little skate in the Gulf of Maine can bepreyed upon by sea. urchins (Strongylocentrotusdrobachiensis), and whelks (Buccinum undatum) (Coxand Koob 1991, 1993). Juveniles and adults are preyedupon by sharks, other skates (including winter skates),teleost fishes (including cod, goosefish, sea raven,longhorn sculpin, bluefish, summer flounder), gray seals,and rock crabs (Cancer' irroratus) (McEachran et al.1976; Reilly and Saila 1978; Scott and Scott 1988;Rountree 2001).
McEachran and Musick (1975) state that little andwinter skate co-occurred significantly in surveys fromNova Scotia to Cape Hatteras between 1967-1970; littleskate was also associated with barndoor skate (Dipturuslaevis). Although little and winter skate are sympatricspecies with similar habitat requirements,, there does notappear to be a high degree of competitive interactionbetween them because they are positively correlated byabundance and where the two species are most abundant(Georges Bank) they have the most similar diets andhighest diversity of assemblages of prey species(McEachran 1973; McEachran and Musick 1975;McEachran et al. 1976).
Also, even though the two species do consume thesame large taxonomic groups of benthic fauna(amphipods, decapods, and polychaetes), little skate feedslargely on epifauna, while winter skate predominatelyselects infaunal organisms (McEachran 1973; McEachranet al. 1976). McEachran (1973) and McEachran et al.(1976) show that epifaunal decapods were eaten morefrequently by little skate and large burrowing polychaetesand bivalves were consumed more frequently by winterskate. Little skate consumed more surface dwellingamphipods such as Unciola sp., D. monacantha,ampeliscids and caprellids while winter skate ate moreburrowing amphipods, especially haustoriids andTrichophoxus epistomus. The division of food resourcesbetween the skates is not complete because someindividuals of little skate consumed large numbers ofinfauna and some winter skate ate large numbers ofepifauna. Both species ate considerable numbers of L.pinguis and C. septemspinosa. Little skate occasionallyfed on haustoriids, and deep burrowing polychaetes(Nereis spp., Nephtys spp. and Glycera spp.) were regularprey items. The infaunal and epifaunal preferences of thetwo skates may be more distinct in areas where they maycoexist than in areas where they occur separately becausein Delaware Bay (Fitz and Daiber 1963) little skateconsumed relatively more infauna than it did in the areassampled in Smith's (1950) study or the McEachran(1973) and McEachran et al. (1976) studies. Winter skate

Page 6
does not regularly occur in Delaware Bay (Fitz andDaiber 1963).
In addition, differences in the shape and size of themouth and the number of tooth rows between the twospecies were used as evidence by McEachran and Martin(1977) to suggest that the sympatric populations of littleand winter skate underwent character displacement inorder to avoid direct competition for food resources. Insympatric populations, winter skate has a greater numberof tooth rows in the upper jaw and a wider and lessarched mouth, thus allowing them to feed more efficientlyand deeper in the bottom than little skate. Little skate hasa relatively smaller and more arched mouth with fewertooth rows in the upper jaw.
Using 1973-1997 NEFSC data from Nova Scotia toCape Hatteras, as well as the same NEFSC food habitsdatabase discussed above, Garrison and Link (2000a)investigated the dietary guild structure of the fishcommunity. Both small (10-30 cm TL) and medium (31-60 cm TL) sized little skate belonged to the"Amphipod/shrimp eaters" group, along with winter skateand cusk eel; prey included .amphipods, polychaetes,shrimp, and zooplankton.
The resilience of demersal fish assemblages onGeorges Bank was investigated by Overholtz and Tyler(1985) using seasonal NEFSC trawl survey data from1963-1978. Of the five assemblage species groups orassociations present on Georges Bank in spring and fallthroughout the survey period, little skate belonged to the"Intermediate" and "Shallow" assemblage groups. In theShallow assemblage the other major species presentbesides little skate included Atlantic cod, winter skate,longhorn sculpin, yellowtail flounder, and haddock; in theIntermediate assemblage, winter skate, red and silverhake, Atlantic cod, and haddock were some of the othermajor species. Overholtz and Tyler (1985) consideredlittle skate to be a "resident" species, since they were onlypresent in two out of the five assemblages in abundance.The Shallow assemblage covered most of Georges Bankin the spring and was slightly smaller in the fall. TheIntermediate assemblage occurred mostly south of theShallow assemblage and inside the southern edge ofGeorges Bank; it was somewhat larger in the fall,suggesting a migration of the species in this area toshallower water as the year progressed. The assemblagesin the spring appeared to follow depth contours.
Garrison (2000) and Garrison and Link (2000b) havealso investigated spatial assemblages and trophic groupsfrom the Georges Bank region. Using 1963-1997 NEFSCtrawl survey data from Georges Bank, as well as the sameNEFSC food habits database discussed above [Garrisonand Link (2000b) used 1973-1997 data while Garrison(2000) used 1991-1997 data], they found that the majorpredator groups were consistent across decades, with theboundaries of the assemblages similar to Overholtz andTyler (1985). Garrison (2000) investigated the spatialassemblages during spring and autumn. He found thatduring autumn, 31-60 cm TL little skate was in the
assemblage found in the deep habitats on southernGeorges Bank, which also included spiny dogfish,butterfish, 'red hake, fourspot flounder, yellowtailflounder, and winter skate. The main shallow portion ofGeorges Bank assemblage included 31-60 cm TL littleskate, winter skate, spiny dogfish, Atlantic cod,windowpane, winter flounder, and sea raven. In spring,the assemblage from southern New England included 31-60 cm TL little skate, spiny dogfish, and Atlantic herring.In terms of dietary guilds or trophic groups, the twostudies had slightly different viewpoints, but the diets oflittle skate in both studies are similar to what waspreviously discussed in the Food Habits section above. Inthe Garrison and Link (2000b) study, little skate fell intothe "Bentho-pelagic" group, which included 10 cm to >30 cm TL little skate, winter skate, longhorn sculpin, andAtlantic cod. The diets of these species included shrimpsuch as pandalids and C. septemspinosa, and benthicinvertebrates including polychaetes, gammaridamphipods, and bivalves. Garrison (2000) had slightlydifferent trophic groups. In autumn, 31-60 cm TL littleskate was in the "Shrimp predators" group, whichincluded fourspot flounder, hakes, longhorn sculpin, andAtlantic cod. Prey included pandalids and C.septemspinosa, and benthic invertebrates includingCancer crabs and gammarid amphipods. Small little skate(10-30 cm TL) was also in the "Demersal predators"group, along with flatfish, haddocks, winter skate, andthorny skate (Amblyraja radiata). Prey includedgammarid amphipods, polychaetes, isopods, and Cancercrabs, as well as C. septemspinosa. During spring, 10-60cm TL little skate was in the "Shrimp/amphipodpredators" group, along with hakes, longhorn sculpin,Atlantic cod, fourspot flounder, winter skate, and thornyskate. Prey included gammarid amphipods, pandalids andC. septemspinosa, polychaetes, and Cancer crabs.
On the Scotian Shelf and in the Bay of Fundy,however, Scott (1989), using research trawl survey datafrom roughly 1970-1984 determined that little skate waslocally abundant but did not associate closely with anyother species.
GEOGRAPHICAL DISTRIBUTION
In Canada, little skate occurs around Nova Scotia,but contrary to Bigelow and Schroeder (1953), McKenzie(1959), Templeman (1965), and Leim and Scott (1966), israre north of La Have Bank and probably does not occurin the Gulf of St. Lawrence [McEachran 1973;McEachran and Musick 1975; McEachran and Martin1977; Scott and Scott 1988; see also Strong and Hanke(1995) ,for the 1970-1993 distribution of little skate in theScotia-Fundy region]. They are considered to be veryabundant on both sides of the Bay of Fundy, and are themost common skate inshore in the Gulf of Maine(Bigelow and Schroeder 1953; McEachran and Musick1975). Previous authors also report them to be very

Page 7
abundant along the entire coastline of the Gulf of Maineand Massachusetts and on Georges Bank, althoughMcEachran and Musick (1975) state that they are rarelytaken in the western Gulf of Maine. Bigelow andSchroeder (1953) remark that they are not found in thedeeper basins and troughs of the Gulf, however,McEachran and Musick (1975) caught them there atdepths > 183 m during surveys from 1967-1970. Littleskate are common on the southwestern part of GeorgesBank and off Nantucket; Bigelow and Schroeder (1953)state they are far less common on the northeastern part ofGeorges Bank, but the NEFSC trawl surveys show littleskate to be fairly well distributed throughout GeorgesBank (see below). Little skate are considered common orabundant in Sheepscot Bay, Maine, the New Hampshirecoast, Massachusetts Bay, and in New Haven Harbor(Nelson et al. 1983;- Collette and Hartel 1988; Carlson1991; Packer and Langton, unpublished manuscript).Their range extends from southern New England anddown the Mid-Atlantic Bight to Cape Hatteras.
Along the inshore edge of its, range, little skatemoves onshore and offshore seasonally. They generallymove into shallow water during spring, and move intodeeper water in winter (Bigelow and Schroeder, 1953;McEachran 2002). In Passamaquoddy Bay, Macdonald etal. (1984) determined them to be both a regular andoccasional resident, and fairly abundant, with thejuveniles often occurring at beach sites during summer.Tyler (1971a) found little skate in deeper waters (37-55m) of Passamaquoddy Bay from November to April witha few remaining until May or June, while during theremainder of the year, Tyler (1971b) found them inshallower water. Hacunda (1981) considered little skateto be a summer periodic in Johns Bay, Maine, while inSheepscot Bay, Maine they were found mostly in the falland early winter (Packer and Langton, unpublishedmanuscript). Merriman et al. (1953) noted a 3-5 mile ormore seasonal onshore-offshore migration in Block IslandSound. Little skate moved inshore during spring, offshorein mid- to late summer, inshore in autumn, and offshorein midwinter. In Johnson's (1979) study, however, littleskate did not make extensive migrations from this region;the movement of the tagged population was limited toLong Island Sound, and seasonal onshore and offshoremigrations were not evident. Richards (1963) noted achange in little skate seasonal abundance at two stationsin Long Island Sound. They were absent from a sandbottom station during midwinter and midsummer andwere absent from a mud bottom station duringmidsummer. Schaefer (1967) collected little skate in thesurf waters of Long Island during the spring and summer;peak abundances were in May and June. Recent surveysof Long Island Sound [1984-1994; Gottschall et al.(2000)] show that little skate were most abundant inspring and fall on transitional and sand bottoms;abundances were lowest in July, August, and September(see the discussion in the Habitat Characteristics section,below). Fitz and Daiber (1963) reported that little skate
occurs in Delaware Bay when temperatures are < 15°C(late October-May); the 1966-1999 Delaware Division ofFish and Wildlife bottom trawl surveys (see below)generally confirm this (except in summer, when the fewthat were caught were found between 16-24'C). In theChesapeake Bight they are most abundant during thewinter; those that remain in the Chesapeake Bight duringthe summer move into deeper water (McEachran andMusick 1975). Massman (1962) and Hildebrand andSchroeder (1928) reported little skate in lowerChesapeake Bay in December and in March, respectively,while Geer (2002) found them mostly around the Baymouth in high salinity waters during April and May.
JUVENILES
McEachran and Musick (1975) seldom caughtsmaller specimens (they do not delineate what "smaller"means) in surveys of the northwest Atlantic from 1967-1970. They suggested the young might lie outside theirsampling region or may be less vulnerable to the gearused; also, small specimens of little and winter skates aredifficult to distinguish (McEachran and Musick 1973).Richards et al. (1963) also noted the absence of younglittle skate on the fishing grounds of Block Island andLong Island sounds where the larger individuals wereabundant.
NEFSC bottom trawl surveys [see Reid et al. (1999)for details] captured juvenile (< 49 cm TL) little skateyear-round and show some of the seasonalonshore/offshore movements mentioned above. (Note thatwinter and summer distributions are presented aspresence/absence data, precluding a discussion ofabundances.) In winter, juveniles were found fromGeorges Bank to Cape Hatteras, out to the 200 m depthcontour (Figure 4); they were almost entirely absent fromthe Gulf of Maine. In spring they were also found fromGeorges Bank to Cape Hatteras, but were also heavilyconcentrated nearshore throughout the Mid-Atlantic Bightand southern New England as well as in Cape Cod andMassachusetts Bays (Figure 5). Smaller numbers werealso found along the coast of Maine and southwest NovaScotia and near Browns Bank and the Northeast Channel.Juveniles showed a more limited distribution in thesummer, with small concentrations along Long Island(Figure 6). Juveniles were more widely distributed in thefall (Figure 7), and were collected from Georges Bank tothe Delmarva Peninsula and, as in the spring, were againconcentrated along Long Island, southern New England,and in Cape Cod and Massachusetts Bays. Small numberswere again found along the coast of Maine and nearBrowns Bank and the Northeast Channel.
Both the spring and fall 1978-2002 Massachusettsinshore trawl surveys [see Reid et al. (1999) for details]show nearly identical abundances and distributions ofjuveniles around Nantucket and in Nantucket Sound, inCape Cod Bay, along the Massachusetts coast and Broad

Page 8
Sound, and north of Cape Ann, with higherconcentrations west and south of Martha's Vineyard(Figure 8).
The distributions and abundances of both juvenilesand adults in Long Island Sound (Figures 9-11) asdescribed by Gottschall et al. (2000) will be discussed inthe Habitat Characteristics section.
Occurrence of juveniles in the Hudson-Raritanestuary appears to have the same seasonal pattern thatFitz and Daiber (1963) noted for little skate in DelawareBay and McEachran and Musick (1975) noted for littleskate in the Chesapeake Bight; i.e., they're generallyabsent from the estuary during the summer months.Juveniles were fairly well distributed throughout theHudson-Raritan estuary in winter and spring (Figure 12).In summer the few that were left were mostly confined tothe deeper and warmer waters of the Ambrose Channel(see Figure 22 for temperature and depth distributions). Inthe fall, the juveniles were again fairly well distributedthroughout the Hudson-Raritan estuary (Figure 12).
The 1966-1999 Delaware Bay trawl surveys (adultsand juveniles combined; Figure 13) again confirm theseasonal trends noted previously for little skate. Few werecaught in summer, while the greatest numbers were foundin the winter. The skate were more abundant in the centerof lower Delaware Bay, near the mouth (Figure 13).
ADULTS
NEFSC bottom trawl surveys [see Reid et al. (1999)for details] captured adult little skate (> 49 cm TL) duringall seasons. The numbers of adults in spring and fall weremuch lower than for juveniles of the same two seasons(winter and summer distributions are presented aspresence/absence data, precluding a discussion ofabundances), but again showed some of the, seasonalonshore/offshore movements mentioned above. In winter,they were caught from Georges Bank to the NorthCarolina; very few occurred in the Gulf of Maine (Figure14). In spring they were also found from Georges Bank toNorth Carolina and, as with the juveniles, were alsodistributed nearshore throughout the Mid-Atlantic Bightand along Long Island as well as in Cape Cod andMassachusetts Bays (Figure 15). Small numbers werealso found along the coast of Maine and southwest NovaScotia and near Browns Bank and the NortheastChannel.They had a limited distribution in the summer, beingfound mostly in southern New England, Georges' Bank,Cape Cod Bay, in the Gulf of Maine near Penobscot Bay,and near Browns Bank and the Northeast Channel (Figure16). Distributions in the fall were similar to those in thespring, but few little skate were found in the Mid-AtlanticBight south of the Hudson Canyon (Figure 17).
The distributions of adult little skate from both thespring and fall Massachusetts inshore trawl surveys weresimilar to that of the juveniles, but with fewer numbers
collected in all areas (including west and south ofMartha's Vineyard) (Figure 18).
Very few adults were caught in the Hudson-Raritanestuary, particularly in spring and summer (Figure 19).Most of that were caught in winter were in the middle ofthe estuary while in the fall they were a little more widelydistributed throughout the estuary.
The seasonal distribution and abundance of bothadults and juveniles in Delaware Bay were discussedpreviously (Figure 13).
HABITAT CHARACTERISTICS
Information on the habitat requirements andpreferences of little skate (based on both the pertinentliterature and the most recent NEFSC and state surveys)are presented here and summarized in Tables I and 2.
Little skate are generally found on sandy or gravellybottoms, but also occur on mud (Bigelow and Schroeder1953; McEachran and Musick 1975; Langton et al. 1995;Packer and Langton, unpublished manuscript). Insouthern New England, at a depth of 55 m, little skatewas associated with particular microhabitat features onthe surface of the sediment during the day, includingbiogenic depressions and flat sand, but were randomlydistributed at night (Auster et al. 1995). Skates are knownto remain buried in depressions during the day and aremore active at night (Michalopoulos 1990). This isprobably not due to diel foraging, since McEachran et al.(1976) observed no diel periodicity in feeding intensityby little skate and suggested that they may feed at anytime during a 24 hour period.
Bigelow and Schroeder (1953) found most little skate< 73-91 m deep, with an overall depth range of 0-137 mand down to 146 m off southern New England.McEachran and Musick (1975) generally found them atdepths < Ill m, but they were occasionally taken atdepths > 183 m, especially in the northern section of theMid-Atlantic Bight and on Georges Bank where theyoccurred as deep as 329 m. On the Scotian Shelf, Scott(1982) reported the depth preference of little skate to bebetween 37-108 m. Merriman and Warfel (1948) foundlittle skate to be a permanent resident off southern NewEngland at depths between 15-46 m, with greatestabundances occurring in August. Edwards et al. (1962)captured little skate as deep as 384 m off New Jersey. The1963-2002 NEFSC trawl surveys from the Gulf of Maineto Cape Hatteras (see below) indicated that during springand fall most juveniles occurred at depths < 70 m,although a few occurred as deep as 400 m (Figure 20),while most adults were found < 120 m and a few werealso as deep as 400 m (Figure 24).
Their temperature range is generally 1-21 'C,although most are found between' 2-15°C (Bigelow andSchroeder 1953; Tyler 1971a; McEachran and Musick1975). It was usually caught at 5-10'C on the ScotianShelf during the summers of 1970-1979 (Scott 1982).

Page 9
McEachran and Musick (1975), in surveys in the Gulf ofMaine and Georges Bank from 1967-1970, found littleskate at temperatures between 3-12'C during the winter,6-14'C during the summer, and 7-14'C in the autumn.Edwards et al. (1962) captured little skate during thewinter from Nantucket Shoals to Cape May, New Jerseyat 6-12'C. The 1963-2002 spring and fall NEFSC trawlsurveys from the Gulf of Maine to Cape Hatteras (seebelow) collected juvenile little skate over a temperaturesrange of 2-22°C, with most found between 4-6°C in thespring and about 8-16'C in the fall (Figure 20). Adultswere also found over a temperature range of 2-21 'C, withmost found between 4-6°C in the spring and about 9-15'C in the fall (Figure 24). As stated previously, Fitzand Daiber (1963) reported that little skate occurs inDelaware Bay when temperatures are < 15'C (lateOctober-May), which generally agrees with the DelawareDivision of Fish and Wildlife bottom trawl surveys (seebelow). In the Hudson-Raritan estuary, they're generallyfound in waters < 16-18'C, (Figures 22 and 26).McEachran and Musick (1975) also note that in thesouthern section of the Mid-Atlantic Bight little skate wasusually caught in the lower part of the area's temperaturerange, and on the Nova Scotian shelf in the upper part ofthe temperature range. In the southern periphery of theirrange they move southward during the colder months ofthe year and offshore and northward during the warmermonths of the year.
Scott (1982) mentions that on the Scotian Shelfduring the summers of 1970-1979, little skate was foundat preferred salinities of 31-34 ppt. In Delaware Bay, Fitzand Daiber (1963) collected little skate at salinities as lowas 20 ppt, the Delaware Division of Fish and Wildlifebottom trawl surveys (see below) even collected a few aslow as 15 ppt.
EGGS
Bigelow and Schroeder (1953) mention studies thatsuggest little skate deposit eggs in water not deeper than27 m on sandy bottoms.
The rate of embryonic growth appears to be directlyrelated to temperature. In the Perkins (1965) study,incubation of eggs deposited in November and Decembershowed the first embryonic activity in March when thewater temperature had risen to 7°C. Johnson (1979), asstated previously, performed flow-through seawatersystem studies using ambient temperatures resemblingthose of the inshore waters of Block Island Sound at 20m. Johnson's (1979) laboratory study supports thefindings of both Perkins (1965) and Richards et al.(1963). Eggs deposited in the late fall and winter, whenwater temperatures in Johnson's (1979) lab were < 8°Cdid not show signs of development until temperatureswere greater than that in the middle of April. When eggswere deposited in water > 8°C, embryonic developmentwas evident shortly thereafter. For eggs deposited in
September-October 1976 when temperatures were > 8°C,embryonic growth was obvious but slowed withdecreasing temperatures. Growth resumed in the earlyspring when the water temperature increased.
Johnson (1979) therefore concludes that embryonicgrowth takes place when temperatures are > 7-8°C andincreases with increasing temperature. For those eggs thatwere laid when the water temperature was increasing, theincubation time became progressively shorter as thetemperature of deposition rose. April spawned eggshatched after an average incubation of 181 d,- whereasJuly deposited eggs took only an average of 122 days todevelop and hatch. Eggs spawned in the falloverwintered, hatching the following fall. Eggs depositedin the summer took about a third of the maximum time todevelop, hatching out during the fall of the same year.Thus Johnson (1979) concludes that although watertemperature may be lower at greater depths, it appearsthat the eggs of little skate may hatch out in autumnregardless of the month of deposition. However, Steves etal. (1999) found that in the New York Bight during 1996-1997 little skate hatched on the continental shelf startingin mid-winter.
JUVENILES
Steves et al. (1999) surveyed the New York Bightduring 1996-1997 and collected juvenile little skate(mean size of 11.8 cm SL) mostly on the inner continentalshelf at mean depths of < 40-45 m. They were alsocollected at a mean temperature of 8.5°C and a meansalinity of 32 ppt.
The spring and fall distributions of juvenile littleskate relative to bottom water temperature, depth, andsalinity based on 1963-2002 NEFSC bottom trawlsurveys from the Gulf of Maine to Cape Hatteras areshown in Figure 20. In spring, they were found in watersbetween 2-13 °C, with the majority at about 4-6°C. Theirdepth range during that season was between 1-300 m,with most spread between about 11-70 m and the majorityof those between 11-30 m. They were found at salinitiesof between 26-36 ppt, with > 60 between 32-33 ppt.During the fall, juvenile little skate were caught over atemperature range of about 5-22°C, with most foundbetween roughly 8-16'C. They were found over a depthrange of 1-400 m, although most were caught at depthsbetween 11-70 m. They were found at salinities ofbetween 30-36 ppt, with the majority at 32-33 ppt.
The spring and autumn distributions of juveniles inMassachusetts coastal waters relative to bottom watertemperature and depth based on 1978-2002Massachusetts inshore trawl surveys are shown in Figure21.. In the spring they were found in waters ranging from3-16'C, with the greatest percentages spread betweenabout 8-12'C. Their depth range was from 6-65 m, withthe majority between 6-25 m. During the autumn theywere found in waters ranging from 5-220C, with the

Page 10
highest percentages found between about 16-18°C. Theirdepth range was from 1-65 m, with the majority foundbetween 6-25 m.
The distributions and abundances of both juvenileand adult little skate in Long Island Sound from April toNovember 1984-1994, based on the Connecticut FisheriesDivision bottom trawl surveys, are shown in Figures 9-11. The following description of their distributionsrelative to depth and bottom type is taken verbatim fromGottschall et al. (2000).
Little skate taken in the survey ranged from 8-51 cm(Figure 10). When abundance was high during the springperiod (Figure I I A), little skate were most abundant ontransitional and sand bottom (Figure 1iB) in the EasternBasin and along the Mattituck Sill between Guilford,Connecticut and Mattituck, New York (Figure 9).Abundance decreased west of the Mattituck Sill wheremud bottom is more common. However, little skate wereabundant in some areas in the Central Basin wheretransitional and sand bottom exists, such as an area southof New Haven, and along the Long Island shore nearShoreham, New York. In April, little skate abundancewas highest in depths < 9 m and low in depths > 27 m(Figure I IC). During June the reverse occurred -abundance was highest in depths > 27 m and low indepths < 9 m. During the summer, a period of lowabundance, little skate still occurred in the same areas asin the spring, but the largest catches occurred in theEastern Basin. Abundance increased during the fallmonths and. November. When abundance peaked inNovember, skate were again concentrated on transitionalbottom in depths between 9-27 m near Mattituck, and indepths < 18 m near Guilford. In contrast with spring,large catches were not recorded over the large sand lobethat extends from the Eastern Basin onto the MattituckSill (Gottschall et al. 2000).
The seasonal distributions of juveniles in theHudson-Raritan estuary relative to -bottom watertemperature, depth, salinity, and dissolved oxygen basedon 1992-1997 Hudson-Raritan trawl surveys are shown inFigure 22. The surveys show that during the winterjuveniles were found mostly between 0-7°C, with themajority at 4-5°C. Their depth range during that seasonwas between 4-24 m, with most caught between 5-8 m.Their salinities ranged between about 20-35 ppt, mostwere found roughly between 25-26 ppt and between 30-32 ppt. They were found over a range of dissolvedoxygen levels of between 9-14 ppm; most were foundbetween 10-12 ppm with a peak at 12 ppm. In spring,little skate were found over a wider temperature range ofbetween 2-18'C, with bimodal peaks betweenapproximately 6-90 C and 15-17'C. The bimodality maybe a function of the greater number of trawls done withinthose temperature intervals. Their depth range wasbetween 4-22 m, with most found between 6-8 m. Theirsalinities ranged between 15-33 ppt, the majority werefound between 25-28 ppt. They were found over a rangeof dissolved oxygen levels of between 6-13 ppm; most
were found between 10-11 ppm. In summer, when thejuveniles were mostly found around the AmbroseChannel (Figure 12), their temperature distribution wasbetween 14-22°C, with peaks at 16' and 18'C. Theywere found between 7-22 m deep, with peaks at 10 m andat 20 m. Their salinities ranged between 23-32 ppt; mostwere between about 29-32 ppt with a slight peak at 29ppt. They were found over a lower range of dissolvedoxygen levels of between 5-9 ppm;"most were foundbetween 6-8 ppm. In the fall they were found between 5-17'C, with most concentrated around 7-13'C. Theirdepth range during the fall was between 4-21 m, with themajority at 5-8 m. Their salinities ranged between 17-33ppt, with peaks between 27-29 ppt. They were found overa range of dissolved oxygen levels of between about 6-12ppm, with peaks at 8-9 ppm.
The seasonal distributions of both juveniles andadults in Delaware Bay relative to. bottom watertemperature, depth, salinity, and dissolved oxygen basedon 1966-1999 Delaware Division of Fish and Wildlifebottom trawl surveys are shown in Figure 23. During thewinter they were found between 3-12'C, with themajority between 7-8°C. Their depth range during winterwas between 7-18 m, with bimodal peaks betweenapproximately 8-10 m and 14-15 m. Their salinitiesranged between about 18-30 ppt and 34-35 ppt, mostwere found between 25-30 ppt. They were found over arange of dissolved oxygen levels of between 9-12 ppm;most were found between 9-10 ppm. In spring, they werefound over a wider temperature range of between 4-17'C,with peaks scattered throughout the range (e.g., 7°C and13'C). Their depth range was between about 4-21 m,again with peaks scattered throughout (e.g., 8 m and 13m). Their salinities ranged between 21-33 ppt, with a fewat 15 ppt and 19 ppt. There was a peak, in terms of catch,of close to 30% at 30 ppt. They were found over a rangeof dissolved oxygen levels of between 6-14 ppm, mostwere found between 9-10 ppm. In summer, the juvenilesand adults were found over a temperature range of about16-24°C, with a peak at 22°C. They were found at depthsof between 13-18 m, with a few at 9 m; most were at 13m and 15 m. Their salinities ranged between 24-32 ppt,with a peak at 31 ppt. They were found over a lower andnarrower range of dissolved oxygen levels than in spring:5-8 ppm. During the fall they were found between 8-21 'C, with a peak at 10°C. Their depth range during thatseason was between 7-19 m, with a few at 24 m; mostwere between 7-9 m and 13-14 m. Their salinities rangedbetween about 20-32 ppt, with a few at 16 ppt and a peakat 28 ppt. They were found over a range of dissolvedoxygen levels of between 6-10 ppm, the majority werebetween 8-9 ppm.
ADULTS
The spring and fall distributions of adult little skaterelative to bottom water temperature, depth, and salinity

Page 11
based on 1963-2002 NEFSC bottom trawl surveys fromthe Gulf of Maine to Cape Hatteras are shown in Figure24. In spring, adult little skate were caught attemperatures between 2-13'C, with most between 4-6°Cand close to 40% of the total caught in 5 C waters.During that period they were found at a depth range of I -300 m, with the majority spread between II m to about101-120 m. They were found at a salinity range ofbetween 29-35 ppt, with the majority found at 33 ppt.During the fall, they were found over a temperature rangeof 5-21 'C, with most caught between about 9-14'C.They were found over a depth range of 1-400 m, withmost caught at depths between about 41-80 m. They werefound at a salinity range of between 31-36 ppt, with themajority found at 32-33 ppt.
The spring and autumn distributions of adults inMassachusetts coastal waters relative to bottom watertemperature and depth are shown in Figure 25. In thespring they were found in waters ranging from 3-16'C;the majority were found between approximately 5-12'C.During that same season the adults were found fromabout 6-75 m, with most found between 6-30 m. Inautumn they were found between 5-21°C. Thedistribution was somewhat bimodal, with peaks at 10°Cand 16'C. The depth range of the adults during autumnwas between about 1-65 m, with most found between 6-25 m.
The distributions and abundances of both juvenileand adult little skate in Long Island Sound relative todepth and bottom type were discussed previously (Figures9-11; Gottschall et al. [2000]).
Few adults were caught during the 1992-1997Hudson-Raritan estuary trawl surveys, their seasonaldistributions relative to bottom water temperature, depth,salinity, and dissolved oxygen are shown in Figure 26.During the winter they were found in a narrow range oftemperatures: 1-5°C with the majority at 3-4°C. Theywere found in a depth range of about 5-16 m, with most at7 m. Their salinities ranged between 20-34 ppt, most werefound roughly between 25-27 ppt, between 29-30 ppt,and at 34 ppt. They were found over a range of dissolvedoxygen levels of between 10-13 ppm, with most foundbetween 10-12 ppm. In spring, they were found over awider range of temperatures from about 7-11 'C andbetween 14-16'C, with a peak at 9VC* They were caught-at depths between 7-8 m and between 14-15 m with themajority at 8 m. Their salinities ranged between 25-26 pptand 28-29 ppt, with peaks at 25 ppt and 29 ppt. Theywere found over a range of dissolved oxygen levels ofbetween 8-9 ppm and 11-12 ppm, with most foundbetween 11-12 ppm. Only two adult little skate werecaught in the summer, at 17-18'C and at a depth of 7 mand 10 m. They were found at salinities of 28-29 ppt, andat dissolved oxygen levels of 6 ppm and 9 ppm. Duringthe fall they were spread over a temperature range of 5-17'C, with a peak at 12'C. Their depth range wasbetween 5-16 m, most were caught at 6 m and 9 m. Theirsalinities during that time period ranged between 18-32
ppt, with -a peak between 28-29 ppt. They were foundover a range of dissolved oxygen levels of between 7-12ppm, with most found at 8 ppm.
The seasonal distributions of both juveniles andadults in Delaware Bay relative to bottom watertemperature, depth, saliniity, and dissolved oxygen basedon Delaware Division of Fish and Wildlife bottom trawlsurveys were discussed previously (Figure 23).
STATUS OF THE STOCKS
The following section is based on Northeast FisheriesScience Center (2000a, b). "'
The principal commercial fishing method used tocatch all seven species of skates [little, barndoor, winter,thorny, clearnose (Raja eglanteria), rosette (Leucorajagarmani), smooth (Malacoraja senta)] is otter trawling.Skates are frequently taken as bycatch during groundfishtrawling and scallop dredge operations and discardedrecreational and foreign landings are currentlyinsignificant, at < 1% of the total fishery landings.
Skates have been reported in New England fisherylandings since the late 1800s. However, commercialfishery landings, primarily from off Rhode Island, neverexceeded several hundred metric tons until the advent ofdistant-water fleets during the 1960s. Landings are notreported by species, with over 99% of the landingsreported as "unclassified skates." Skate landings reached9,500 mt in 1969, but declined quickly during the 1970s,falling to 800 mt in 1981 (Figure 27). Landings havesince increased substantially, partially in response toincreased demand for lobster bait, and more significantly,to the increased export market for skate wings. Wings aretaken from winter and thorny skates, the two speciescurrently used for human consumption. Bait landings arepresumed to be primarily from little skate, based on areasfished and known species distribution patterns. Landingsfor all skates increased to 12,900 mt in 1993 and thendeclined somewhat to 7,200 mt in 1995. Landings haveincreased again since 1995, and the 1998 reportedcommercial landings of 17,000 mt were the highest onrecord (Figure 27). In terms of total recreational landingsfor little skate, they varied between < 1000 and 56,000fish, equivalent to < I to 15 mt, during 1981-1998.
The biomass for the seven skate species is at amedium level of abundance. For the aggregate complex,the NEFSC spring survey index of biomass was relativelyconstant from 1968-1980, then increased significantly topeak levels in the mid- to late 1980s. The index of skatecomplex biomass then declined steadily until 1994, buthas recently increased again. The large increase in skatebiomass in the mid- to late 1980s was dominated by littleand winter skate. The recent increase in aggregate skatebiomass has been due to an increase in small sized skates(< 100 cm max. length: little, clearnose, rosette, andsmooth) - primarily little skate, which, in 1999, was at itshighest abundance (Figure 27). Little skate is not

Page 12
considered to be overfished (Northeast Fisheries ScienceCenter 2000a, b).
RESEARCH NEEDS
Imprecise reporting of fishery statistics where severalskate species are lumped together under one category(e.g., "unclassified skates" or "skates spp.") can maskbasic changes in community structure and profoundreduction in populations of larger, slower growing species(Dulvy et al. 2000; Musick et al. 2000). Thus, it isimportant to have fishery-independent data on skateswhere the individual species are reported; it is alsonecessary to work out any identification problemsbetween little and winter skate.
Northeast Fisheries Science Center (2000b) alsosuggests the following research needs:* More life history studies (including studies on age,
growth, maturity, and fecundity) are necessary.• Studies of stock structure are needed to identify unit
stocks." Explore possible stock-recruit relationships by
examination of NEFSC survey data.* Investigate trophic interactions between skate species
in the complex, and between skates and othergroundfish.
" Investigate the influence of annual changes in watertemperature or other environmental factors on shiftsin the range and distribution of the species in theskate complex, and establish the bathymetricdistribution of the species in the complex in thenorthwest Atlantic.
* Investigate historical NEFSC survey data from theR/V Albatross III during 1948-1962 when -theybecome available, as they may provide valuablehistorical context for long-term trends in skatebiomass.
ACKNOWLEDGMENTS
The authors thank Barry Shafer, John McCarthy,Tom Finneran, Annette Kalbach, and Meredith Lock forproducing the maps and graphics. Thanks also to ClaireSteimle and Judy Berrien for literature reviews andinterlibrary loans. Frank Almeida and Kathy Sosebee ofthe NEFSC Woods Hole provided much neededinformation, input, and reviews.
REFERENCES CITED
Auster, P.J., R.J. Malatesta, and S.C. LaRosa. 1995.Patterns of microhabitat utilization by mobile.megafauna on the southern New England (USA)
continental shelf and slope. Mar. Ecol. Prog. Ser. 127:77-85.
Avent, S.R., S.M. Bollens, M. Butler, E. Horgan, and R.Rountree. 2001. Planktonic hydroids on GeorgesBank: ingestion and selection by predatory fishes.Deep-Sea Res II 48: 673-684.
Bigelow, H.B. and W.C. Schroeder. 1953. Fishes of theGulf of Maine. U.S. Fish Wildl. Serv., Fish. Bull. 53.577 p.
Bowman, R.E., T.R. Azarowitz, E.S. Howard, and B.P.Hayden. 1987. Food and distribution of juveniles ofseventeen northwest Atlantic fish species, 1973-1976. NOAA Tech. Mem. NMFS-F/NEC-45.57 p.
Bowman, R.E. and W.L. Michaels. 1984. Food ofseventeen species of northwest Atlantic fish. NOAATech. Mem. NMFS-F/NEC-28. 183 p.
Bowman, R.E., C.E. Stillwell, W.L. Michaels, and M.D.Grosslein. 2000. Food of northwest Atlantic fishes.and two species of squid. NOAA Tech. Mem. NMFS-NE-155. 138 p.
Carlson, J.K. 1991. Trophic relationships amongdemersal fishes off New Haven Harbor (New Haven,CT) with special emphasis on the winter flounder(Pseudopleuronectes americanus). M.S. thesis,Southern Conn. State Univ., New Haven, CT. 71 p.
Collette, B.B. and K.E. Hartel. 1988. Annotated list offishes of Massachusetts Bay. NOAA Tech. Mem.NMFS-F/NEC-5 1. 70 p.
Cox, D.L. and T.J. Koob. 1991. Predation on eggs of thelittle skate (Raja erinacea) in the Gulf of Maine. Bull.Mount Desert Island Biol. Lab. 30: 123-124.
Cox, D.L. and T.J. Koob. 1993. Predation onelasmobranch eggs. Environ. Biol. Fish. 38: 117-125.
Dulvy, N.K., J.D. Metcalfe, J. Glanville, M.G. Pawson,and J.D. Reynolds. 2000. Fishery stability, localextinctions, and shifts in community structure inskates. Conserv. Biol. 14: 283-293.
Edwards, R.L., R. Livingstone, Jr., and P.E. Hamer. 1962.Winter water temperatures and an annotated list offishes - Nantucket Shoals to Cape Hatteras. AlbatrossIII Cruise no. 126. U.S. Fish Wildl. Serv. Spec. Sci.Rep. Fish. 397.31 p.
Fitz, E.S., Jr. and F.C. Daiber. 1963. An introduction tothe biology of Raja eglanteria Bosc 1802 and Rajaerinacea Mitchill 1825 as they occur in DelawareBay. Bull. Bingham Oceanogr. Collect., Yale Univ.18 (3): 69-97.
Frisk, M.G., T.J. Miller, and M.J. Fogarty. 2001.Estimation and analysis of biological parameters inelasmobranch fishes: a comparative life history study.Can. J. Fish. Aquat. Sci. 58: 969-981.
Garrison, L.P. 2000. Spatial and dietary overlap in theGeorges Bank groundfish community. Can. J. Fish.Aquat. Sci. 57: 1679-1691.
Garrison, L.P. and J.S. Link. 2000a. Dietary guildstructure of the fish community in the NortheastUnited States continental shelf ecosystem. Mar. Ecol.Prog. Ser. 202: 231-240.

Page 13
Garrison, L.P. and J.S. Link. 2000b. Fishing effects onspatial distribution and trophic guild structure of thefish community in the Georges Bank region. ICES J.Mar. Sci. 57: 723-730.
Geer, P.J. 2002. Summary of essential fish habitatdescription and identification for Federally managedspecies inhabiting Virginia waters of ChesapeakeBay 1988-1999. Virginia Mar. Res. Rep. VMRR2001-03, Jan. 2001, Revised June 2002. 169 p.
Gottschall, K, M.W. Johnson, and D.G. Simpson. 2000.The distribution and size composition of finfish,American lobster, and long-finned squid in LongIsland Sound based on the Connecticut FisheriesDivision Bottom Trawl Survey, 1984-1994. NOAATech. Rep. NMFS 148. 195 p.
Hacunda, J.S. 1981. Trophic relationships amongdemersal fishes in a coastal area of the Gulf ofMaine. Fish. Bull. (U.S.) 79: 775-788.
Hildebrand, S.F. and W.C. Schroeder. 1928. Fishes ofChesapeake Bay. Bull. U.S. Bur. Fish. 43(1). 366 p.
Langton, R.W., P.J. Auster, and D.C. Schneider. 1995. Aspatial and temporal perspective on research andmanagement of groundfish in the northwest Atlantic.Rev. Fish. Sci. 3: 201-229.
Langton, R.W. and L. Watling. 1990. The fish-benthosconnection: a definition of prey groups in the Gulf ofMaine. In M. Barnes and R.N. Gibson eds. Trophicrelationships in the marine environment: Proceedings24th European Marine Biology Symposium. p. 424-438. Aberdeen Univ. Press. Aberdeen, Scotland..
Leim, A.H. and W.B. Scott. 1966. Fishes of the Atlanticcoast of Canada. Bull. Fish. Res. Board. Can. 155.485 p.
Massmann, W.H. 1962. Water temperatures, salinities,and fishes collected during trawl surveys ofChesapeake Bay and York and Pamunkey rivers,1956-1.959. Virginia Inst. Mar. Sci. Spec. Sci. Rep.27.51 p.
Macdonald, J.S., M.J. Dadswell, R.G. Appy, G.D.Melvin, and D.A. Methven. 1984. Fishes, fishassemblages, and their seasonal movements in thelower Bay of Fundy and Passamaquoddy Bay,Canada. Fish. Bull. (U.S.) 82: 121-139.
McEachran, J.D. 1973. Biology of seven species of skates(Pisces: Rajidae). Ph.D.. dissertation, Coll. Williamand Mary, Williamsburg, VA. 127 p.
McEachran, J.D. 2002. Skates. Family Rajidae. In B.B.Collette and G. Klein-MacPhee eds. Bigelow andSchroeder's fishes of the Gulf of Maine. 3 d Edition.p. 60-75. Smithsonian Institution Press, Washington,DC. 748 p.
McEachran, J.D., D.F. Boesch, and J.A. Musick. 1976.Food division within two sympatric species-pairs ofskates (Pisces: Rajidae). Mar. Biol. 35: 301-317.
McEachran, J.D. and K.A. Dunn. 1998. Phylogeneticanalysis of skates, a morphologically conservativeclade of elasmobranchs (Chondrichthyes: Rajidae).Copeia 1998 (2): 271-290.
McEachran, J.D. and C.O. Martin. 1977. Possibleoccurrence of character displacement in the sympatricskates Raja erinacea and R. ocellata (Pisces: Rajidae).Environ. Biol. Fishes 2: 121-130.
McEachran, J.D. and J.A. Musick. 1973. Characters fordistinguishing between immature specimens of thesibling species, Raja ei-inacea and Raja ocellata(Pisces: Rajidae). Copeia 1973: 238-250.
McEachran, J.D. and J.A. Musick. 1975. Distribution andrelative abundance of seven species of skates (Pisces:Rajidae) which occur between Nova Scotia and CapeHatteras. Fish. Bull. (U.S.) 73: 110-136.
McKenzie, R.A. 1959. Marine and freshwater fishes ofthe Miramichi River and Estuary, New Brunswick. J.Fish. Res. Board. Can. 16: 807-833.
Merriman, D., Y.H. Olsen, S.B. Wheatland, and L.H.Calhoun. 1953. Addendum to Raja erinacea. InFishes of the western North Atlantic. Part 2.Sawfishes,' guitarfishes, skates and rays [and]chimaeroids. H.B. Bigelow and W.C. Schroeder eds.Mem. Sears Found. Mar. Res., Yale. Univ. 1. p. 187-194.
Merriman, D. and H.E. Warfel. 1948. Studies on themarine resources of southern New England. VII.Analysis of a fish population. Bull. BinghamOceanogr. Collect., Yale Univ. 1 (4): 131-164.
Michalopoulos, C. 1990. A field study on the ecology andbehavior of the winter skate (Raja ocellata) and littleskate (Raja erinacea) off outer Cape Cod,Massachusetts. M.S. thesis, Southeastern Mass. Univ.,North Dartmouth, MA. 71 p.
Michels, S.F. and M.J. Greco. 2000. Coastal finfishassessment survey - annual report. Delaware Div.Fish Wildl., Proj. F-42-R-I 1, Dover, DE. 72 p.
Murdy, E.O., R.S. Birdsong, and J.A. Musick. 1997.Fishes of Chesapeake Bay. Smithsonian InstitutionPress, Washington, DC. 324 p.
Musick, J.A., G. Burgess, G. Cailliet, M. Camhi, and S.Fordham. 2000. Management -of sharks and theirrelatives (Elasmobranchii). Fisheries 25: 9-13.
Natanson, L.J. 1990. Relationship of vertebral banddeposition to age and growth in the dusky shark,Carcharhinus obseurus, and the little skate, Rajaerinacea. Ph.D. dissertation, Univ. Rhode Island,Kingston, RI. 153 p.
Nelson, G.A. 1993. The potential impacts of skateabundances upon the invertebrate resources andgrowth of yellowtail flounder (Pleuronectesferrugineus) on Georges Bank. Ph.D. dissertation,Univ. Mass., Amherst, MA.
Nelson, J.I., Jr., S. Perry, D. Miller, and G. Lamb. 1983.Inventory of New Hampshire's marine coastalfisheries. N.H. Fish Game Dep., Div. Inland Mar.Fish. 35 p.
Northeast Fisheries Science Center. 2000a. Report of the30th Northeast Regional Stock Assessment Workshop(30th SAW): Public Review Workshop. NortheastFish. Sci. Cent. Ref. Doc. 00-04. 53 p.

Page 14
Northeast Fisheries Science Center. 2000b. Report of the30th Northeast Regional Stock Assessment Workshop(30th SAW): Stock Assessment Review Committee(SARC) consensus summary of assessments.Northeast Fish. Sci. Cent. Ref. Doc. 00-03. 477 p.
Overholtz, W.J. and A.V. Tyler. 1985. Long-termresponses of the demersal fish assemblages ofGeorges Bank. Fish. Bull. (U.S.) 83: 507-520.
Packer, D.B. and R.W. Langton. Unpublished manuscript.Food habits of the major groundfish species ofSheepscot Bay, Maine, U.S.A. U.S. Nati. Mar. Fish.Serv., Northeast Fish Sci. Cent., James J. HowardMar. Sci. Lab., Highlands, NJ.
Pelster, B. and W.E. Bemis. 1992. Structure and functionof the external gill filaments of embryonic skates(Raja erinacea). Resp. Physiol. 89: 1-13.
Perkins, E. 1965. Incubation of fall-spawned eggs of thelittle skate Raja erinacea (Mitchill). Copeia 1965(1):114-115.
Reid, R., F. Almeida, and C. Zetlin. 1999. Essential fishhabitat source document: Fishery independentsurveys, data sources, and methods. NOAA Tech.Mem. NMFS-NE-122.40,p.
Reilly, P.N. and S.B. Saila. 1978. Biology and ecology ofthe rock crab, Cancer irroratus Say, 1817, in southernNew England waters (Decapoda, Brachyura).Crustacea 34: 121-140.
Richards, S.W. 1963. The demersal fish population" ofLong Island Sound. Bull. Bingham Oceanogr.Collect., Yale Univ. 18 (2): 5-101.
Richards, S.W., D. Merriman, and L.H. Calhoun. 1963.Studies on the marine resources of southern NewEngland. IX. The biology of the little skate Rajaerinacea Mitchill. Bull. Bingham Oceanogr. Collect.,Yale Univ. 18 (3): 5-68.
Rountree, R.A. 2001 Dec. 28. Diets of NW Atlanticfishes and squid. <http://www.fishecology.org/diets/summary.htm>. Accessed 2002 July 18.
Schaefer,- R.H. 1967. Species composition, size andseasonal abundance of fish in the surf waters of LongIsland. N.Y. Fish Game J. 14: 1-46.
Scharf, F.S., F. Juanes, R.A. Rountree. 2000. Predatorsize-prey size relationships of marine fish predators:interspecific variation and effects of ontogeny andbody size on trophic-niche breadth. Mar. Ecol. Prog.Ser, 208: 229-248.
Scott, J.S. 1982. Depth, temperature and salinitypreferences of common fishes of the Scotian Shelf. J.Northwest Atd. Fish. Sci. 3: 29-39.
Scott, J.S. 1989. Matrix analysis of co-occurrences offishes of the Scotian Shelf and Bay of Fundy. Can. J.Fish. Aquat. Sci. 46: 191-197.
Scott, W.B. and M.G. Scott. 1988. Atlantic fishes ofCanada. Can. Bull. Fish. Aquat. Sci. 219. 731 p.
Smith, F.E. 1950. The benthos of Block Island Sound.The invertebrates, and their quantities and theirrelations to the fishes. Ph.D. dissertation, Yale Univ.,New Haven, CT. 213 p.
Steves, B.P., R.K. Cowen, and M.H. Malchoff. 1999.Settlement and nursery habitats for demersal fishes onthe continental shelf of the New York Bight. Fish.Bull. (U.S.) 98: 167-188.
Strong, M. and A. Hanke. 1995. Diversity of finfishspecies in the Scotia-Fundy region. Can. Tech. Rep.Fish. Aquat. Sci. 2017. 106 p.
Templeman, W. 1965. Rare skates of the Newfoundlandand neighboring areas. J. Fish. Res. Board. Can. 22:259-279.
Tyler, A.V. 1971 a. Periodic and resident components incommunities of Atlantic fishes. J. Fish. Res. BoardCan. 28: 935-946.
Tyler, A.V. 1971b. Surges of winter flounder, Pseudo-pleuronectes americanus, into the intertidal zone. J.Fish. Res. Board Can. 28: 1727-1732.
Tyler, A.V. 1972. Food resource division amongnorthern, marine demersal fishes. J. Fish. Res: BoardCan. 29: 997-1003.
Vladykov, V.D. 1936. Capsules d'oeufs de raies del'Atlantique Canadien appartenant au. genre Raja.Natur. Can. 63:211-231.
Waring, G.T. 1984. Age, growth, and mortality of thelittle skate off the northeast coast of the United States.Trans. Am. Fish. Soc. 113: 314-321.

Page 15
Table 1. Summary of habitat parameters for little skate, based on the pertinent literature.
Life Stage Depth Substrate Salinity Temperature
Egg capsule is deposited on the Egg capsule is Rate of embryonic growth directly related toEggs bottom, perhaps in water < 27 deposited on the temperature. Incubation of eggs deposited in
m deep. bottom. In aquaria, November/December show first embryoniceggs were partially activity in March when water temperature risesburied in sand. to 7°C. Embryonic growth takes place when
temperatures are > 7-8°C and increases withincreasing temperature.
Along the inshore edge of its Sandy or gravelly In Delaware Overall temperature range is 1-21 'C, althoughJuveniles 2 range, little skate moves bottoms, but also on Bay, little skate most are found between 2-15'C. Gulf of Maine
onshore and offshore mud. Southern New were collected and Georges Bank (1967-1970): caught atseasonally. Generally move into England at 55 m: at salinities as temperatures between 3-12'C during winter, 6-shallow water during spring, little skate low as 15-20 14'C during summer, 7-14'C in autumn.deeper water in winter. May associated with ppt. Juveniles Nantucket Shoals to Cape May, New Jerseyleave some estuaries for deeper particular (mean size 11.8 during winter: 6-12'C. Juveniles (mean size 11.8water during warmer months. microhabitat cm SL) cm SL) collected in the New York Bight (1996-
features on surface collected in the 1997) at a mean temperature of 8.5°C. Occurs inGenerally caught at depths < of sediment during New York Delaware Bay when temperatures are < 15'CIll m, but occasionally at the day, including Bight (1996- (late October-May). In southern section of Mid-depths > 183 m, especially in biogenic depressions 1997) at a mean Atlantic Bight usually caught in the lower part ofnorthern section of the Mid- and flat sand, but salinity of 32 the area's temperature range, and on the NovaAtlantic Bight and on Georges randomly distributed ppt. Scotian shelf in the upper part of temperatureBank where they can be as deep at night. Skates are range.as 329 m; caught as deep as 384 known to remainm off New Jersey. Juveniles buried in Inshore they move onshore/offshore with(mean size 11.8 cm SL) depressions during seasonal temperature changes; also moves northcollected in the New York the day and are and south with seasonal temperature changesBight (1996-1997) at mean more active at night. along southern fringe of their range. May leavedepths of< 40-45 m. In Long Island some estuaries for deeper water during warmer
Sound (1984-1994) months.In Long Island Sound (1984- in spring and fall,1994) during spring, abundance most abundant onhighest in depths < 9 m, low in transitional and sanddepths > 27 m. During summer, bottoms.abundance highest in depths >27 m, low in depths < 9 m.During fall, most between 9-27m near Mattituck, and in depths< 18 m near Guilford.Same as for juveniles. Same as for Same as for Same as'for juveniles.
Adults' juveniles, juveniles.
Bigelow and Schroeder (1953); Perkins (1965); Johnson (1979).2 Bigelow and Schroeder (1953); Merriman et al. (1953); Edwards el al. (1962); Fitz and Daiber (1963); Richards (1963); Richards et
al. (1963); Schaefer (1967); Tyler 1971(a, b); Langton et al. (1995); McEachran and Musick (1975); Hacunda (1981); Michalopoulos(1990); Auster el al. (1995); Steves et al. (1999); Gottschall et al. (2000); McEachran (2002); Packer and Langton (unpublishedmanuscript); Delaware Division of Fish and Wildlife bottom trawl surveys (1966-1999).3 Bigelow and Schroeder (1953); Merriman et al. (1953); Edwards el al. (1962); Fitz and Daiber (1963); Richards (1963); Richards elal. (1963); Schaefer (1967); Tyler 1971(a, b); Langton et al. (1995); McEachran and Musick (1975); Hacunda (1981); Michalopoulos(1990); Auster et al. (1995); Gottschall et al. (2000); McEachran (2002); Packer and Langton (unpublished manuscript); DelawareDivision of Fish and Wildlife bottom trawl surveys (1966-1999).

Page 16
Table I. cont'd.
Life Stage Prey Predators/Species Associations
N/A Eggs of little skate in the Gulf of Maine can be preyed upon by sea urchinsEggs' (Strongylocentrotus drobachiensis) and whelks (Buccinum undatum).
Juveniles 2Food habits fairly generalized;little skate an opportunisticpredator although inshore skatesgenerally depend more on a fewmajor prey species. Decapodcrustaceans and amphipods arethe most important prey items,followed by polychaetes.Isopods, bivalves, hydroids, andfishes are of minor importance.Decapod prey include: Crangonseptemspinosa, Pagurus spp.,Cancer spp. Amphipods:Monoculoides spp., Unciolaspp., Leptocheirus pinguis,Byblis serrata, ampeliscids,haustoriids. Polychaetes: Eunicepennata, Nereis spp., Nepthysspp., Lumbrinerisfragilis,Aphrodite hastata, maldanids,Ophelia denticulata, terebellids.Fish: sand lance, yellowtailflounder, longhorn sculpin,Atlantic herring. Generally,skates - < 30-40 cm TLconsumed more amphipods thanlarger skates; skates - > 30-40cm TL consumed moredecapods, as well as polychaetesand fish. Depending on thestudy, C. septemspinosa was aprominent component of the dietof either large or small skates, orboth.
Predators: sharks, other skates (including winter skates), teleost fishes(including cod, goosefish, sea raven, longhorn sculpin, bluefish, summerflounder); gray seals, and rock crabs (Cancer irroratus).
Little and winter skate co-occur from Nova Scotia to Cape Hatteras; littleskate also associated with barndoor skate. Although little and winter skateare sympatric species with similar habitat requirements, there's not a highdegree of competitive interaction between them because they are positivelycorrelated by abundance. Also, little skate feeds largely on epifauna, whilewinter skate predominately selects infauna. Sympatric populations of littleand winter skate also undergo character displacement in order to avoiddirect competition for food resources. Using 1973-1997 NEFSC data fromNova Scotia to Cape Hatteras and NEFSC food habits database, both small(10-30 cm TL) and medium (31-60 cm TL) sized little skate belonged tothe "Amphipod/shrimp eaters" group, along with winter skate and cusk eel;prey included amphipods, polychaetes, shrimp, and zooplankton.
On Georges Bank, little skate belongs to assemblages that include Atlanticcod, winter skate, longhorn sculpin, yellowtail flounder, red and silverhake, haddock, spiny dogfish, fourspot flounder, butterfish, windowpane,winter flounder, sea raven, Atlantic herring. Also on Georges Bank, littleskate falls into various dietary guilds or trophic groups, depending on thestudy. Garrison and Link (2000b): "Bentho-pelagic" group included 10 cmto > 30 cm TL little skate, winter skate, longhorn sculpin, Atlantic cod.Diets of these species included shrimp such as pandalids and C.septemspinosa, and benthic invertebrates including polychaetes, gammaridamphipods, bivalves. Garrison (2000): In autumn, "Shrimp predators"group included 31-60 cm TL little skate, fourspot flounder, hakes, longhornsculpin, Atlantic cod. Prey included pandalids and C. septemspinosa, andbenthic invertebrates including Cancer crabs and gammarid amphipods."Demersal predators'" group included 10-30 cm TL little skate, flatfish,haddocks, winter skate, thorny skate. Prey included gammarid amphipods,polychaetes, isopods, Cancer crabs, C. septemspinosa. During spring,"Shrimp/amphipod predators" group included 10-60 cm TL little skate,hakes, longhorn sculpin, Atlantic cod, fourspot flounder, winter skate,thorny skate. Prey included gammarid amphipods, pandalids, C.seotemsDinosa. tolvchaetes. Cancer crabs.
Same as for juveniles; however, Same as for juveniles, but note differences between larger and smallerAdults 3 note that larger skates consume skates.
more decapods as well aspolychaetes and fish rather thanamphipods.
I Cox andKoob (1991, 1993).2 Smith (1950); Bigelow and Schroeder (1953); Fitz and Daiber (1963); Richards (1963); Tyler (1972); McEachran (1973);
McEachran and Musick (1975); McEachran et al. (1976); McEaclhran and Martin (1977); Reilly and Saila (1978); Hacunda (1981);Bowman and Michaels (1984); Overholtz and Tyler (1985); Bowman er al. (1987); Scott and Scott (1988); Langton and Watling(1990); Carlson (1991); Nelson (1993); Bowman et al. (2000); Garrison (2000); Garrison and Link (2000a, b); Scharf et al. (2000);Avent et al. (2001); Rountree (2001); Packer and Langton (unpublished manuscript); NEFSC 1973-1990 food habits database.3 Smith (1950); Bigelow and Schroeder (1953); Fitz and Daiber (1963); Richards (1963); Tyler (1972); McEachran (1973);McEachran and Musick (1975); McEachran et al. (1976); McEachran and Martin (1977); Reilly and Saila (1978); Hacunda (1981);Bowman and Michaels (1984); Overholtz and Tyler (1985); Bowman et al. (1987); Scott and Scott (1988); Langton and Watling(1990); Carlson (1991); Nelson (1993); Bowman et al. (2000); Garrison (2000); Garrison and Link (2000a, b); Scharf et al. (2000);Avent et al. (2001); Rountree (2001); Packer and Langton (unpublished manuscript); NEFSC 1973-1990 food habits database.

Page 17
Table 2. Summary of habitat parameters for little skate, based on the most recent NEFSC and state surveys mentioned inthe text.
Life StageI Survey Depth I Temperature Salinity/DO
Juveniles1963-2002 springand fall NEFSCtrawl surveys fromGulf of Maine toCape Hatteras.
Spring: range of 1-300 m, mostspread between about 11-70 mand majority of those between11-30 m.Fall: range of 1-400 m, mostbetween 11-70 m.
Spring: range of 2-13'C, withmajority at about 4-6°C.Fall: range of about 5-22°C,most between roughly 8-16°C.
Spring: range of 26-36 ppt, >60 between 32-33 ppt.Fall: range of 30-36 ppt,majority at 32-33 ppt.
1978-2002 Spring: range of 6-65 m, Spring: range of 3-16'C,'Massachusetts majority between 6-25 m. greatest percentages spreadinshore trawl Fall: range of 1-65 m, majority between about 8-12'C.surveys. between 6-25 m. Fall: range of 5-22°C, highest
percentages between about 16-18°C.
1992-1997 NEFSC Winter: range of 4-24 m, most Winter: range of 0-7°C, most Winter: range of 20-35 ppt,trawl surveys of the between 5-8 m. between 4-5°C. most between 25-26 ppt andHudson-Raritan Spring: range of 4-22 m, most Spring: range of 2-18'C, with 30-32 ppt / range of 9-14 ppm,estuary. between 6-8 m. bimodal peaks between 6-9°C most between 10-12 ppm, peak
Summer: range of 7-22 m, and 15-17.°C. at 12 ppm.peaks at 10 m and at 20 m. Summer: range of 14-22°C, Spring: range of 15-33 ppt,Fall: range of 4-21 m, most with peaks at 160 and 18'C. most between 25-28 ppt / rangebetween 5-8 m. Fall: range of 5-17'C, most of 6-13 ppm, most between 10-
concentrated around 7-13'C. 11 ppm.Summer: range of 23-32 ppt,most between about 29-32 ppt,slight peak at 29 ppt / range of5-9 ppm, most between 6-8ppm.Fall: range of 17-33 ppt, peaksbetween 27-29 ppt / range ofabout 6-12 ppm, peaks at 8-9ppm.
1966-1999Delaware Divisionof Fish and Wildlifebottom trawlsurveys ofDelaware Bay(juveniles andadults combined)
Winter: range of 7-18 m,bimodal peaks betweenapproximately 8-10 m and 14-15 m.Spring: range of about 4-21 m,peaks scattered throughout(e.g., 8 m and 13 m).Summer: range of 13-18 m, afew at 9 m; most at 13 m and15 m.Fall: range of 7-19 m, a few at24 m; most between 7-9 m and13-14 m.
Winter: range of 3-12'C,majority between 7-8 °C.Spring: range of 4-17'C, peaksscattered throughout (e.g., 7°Cand 13'C).Summer: range of about 16-24°C, peak at 22°C.Fall: range of 8-21 'C, peak atlo1C.
Winter: range of 18-30 ppt and34-35 ppt, most between 25-30ppt / range of 9-12 ppm, mostbetween 9-10 ppm.Spring: range of 21-33 ppt, afew at 15 ppt and 19 ppt; apeak, in terms of catch, of closeto 30% at 30 ppt / range of 6-14ppm, most between 9-10 ppm.Summer: range of 24-32 ppt,peak at 31 ppt / range of 5-8ppm.Fall: range of about 20-32 ppt,a few at 16 ppt, peak at 28 ppt/range of about 6-10 ppm,majority between 8-9 ppm.

Page 18
Table 2. cont'd.
Life Stage Survey Depth Temperature Salinity/DO
Adults1963-2002 springand fall NEFSCtrawl surveys fromGulf of Maine toCape Hatteras.
Spring: range of 1-300 m,majority spread between I I mto about 101-120 m.Fall: range of 1-400 m, mostbetween about 41-80 m.
Spring: range of 2-13'C, mostbetween 4-6°C and close to40% of the total caught in 5°Cwaters.Fall: range of 5-21 'C, mostbetween about 9-14'C.
Spring: range of 29-35 ppt,majority at 33 ppt.Fall: range of 31-36 ppt,majority at 32-33 ppt.
1978-2002 Spring: range of about 6-75 m, Spring: range of 3-16'C,Massachusetts most between 6-30 m. majority betweeninshore trawl Fall: range of about 1-65 m, approximately 5-12'C.surveys. most between 6-25 m. Fall: range of 5-21 'C,
distribution somewhat bimodal,with peaks at 10C and 16'C.
1992-1997 NEFSC Winter: range of about 5-16 m, Winter: range of 1-5°C, Winter: range of 20-34 ppt,trawl surveys of the most at 7 m. majority at 3-4°C. most between 25-27 ppt,Hudson-Raritan Spring: range of 7-8 m and 14- Spring: range of about 7-1 °"C between 29-30 ppt, and at 34estuary. 15 m, majority at 8 mi. and 14-16'C, peak at 9°C. ppt / range of 10-13 ppm, most
Summer: only two adults found Summer: only two adults found between 10-12 ppm.at 7 m and 10 m. at 17-18'C. Spring: range of 25-26 ppt andFall: range of 5-16 m, most at 6 Fall: range of 5-17'C, peak at 28-29 ppt, peaks at 25 ppt andm and 9 m. 12'C. 29 ppt / range of 8-9 ppm and
11-12 ppm, most between 11-12 ppm.Summer: only two adultscaught at 28-29 ppt / 6 ppm and9 ppm.Fall: range of 18-32 ppt, peak
between 28-29 ppt / range of 7-112 ppm, most at 8 ppm.
1966-1999Delaware Divisionof Fish and Wildlifebottom trawlsurveys ofDelaware Bay(juveniles andadults combined).
See juveniles. See juveniles. See juveniles.

Page 19
Figure 1. The little skate, Leucoraja erinacea (Mitchill 1825). Top: male, from Murdy et al. (1997). Bottom: female,from Scott and Scott (1988).
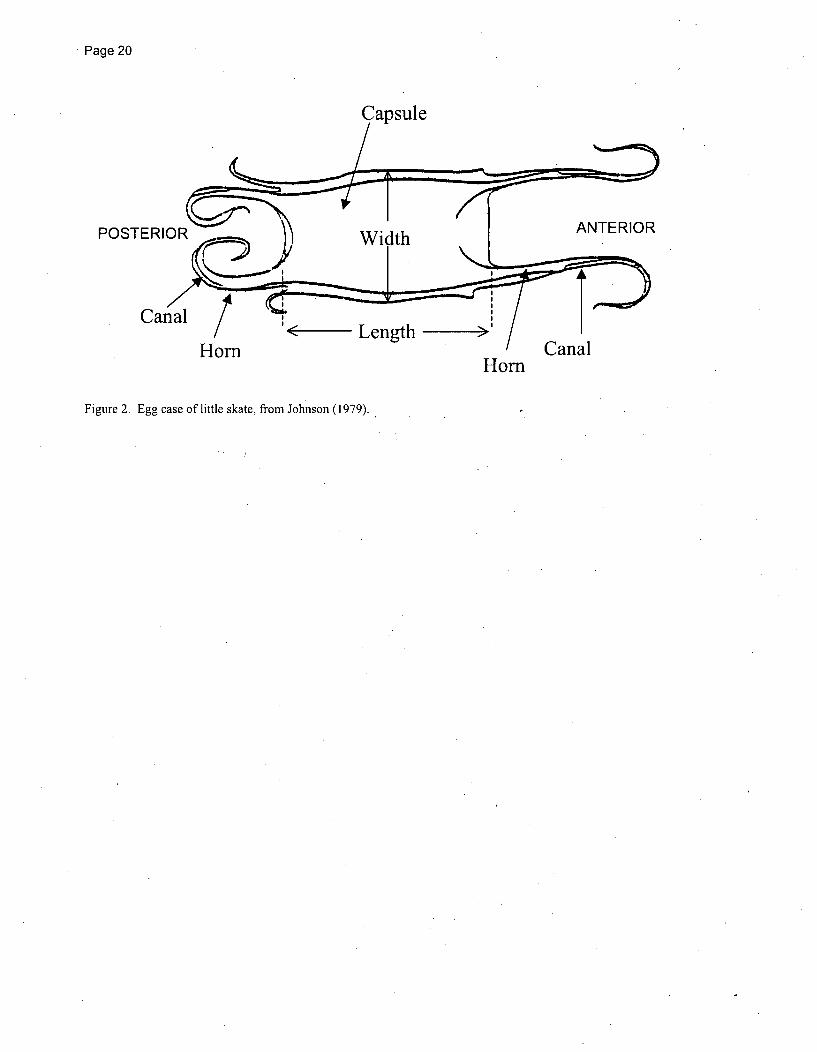
Page 20
Capsule
<- Length >Horn Canal
Horn
Figure 2. Egg case of little skate, from Johnson (1979).

Page 21
1973-1980Decapoda 8%
-Isopoda 4%
Unide
1981-1990
Cumacea 27
ntifiedacea 15%Crust•
Oth er prey phyla 2%
lychaeta 1%
Amphipoda 42%
1-10 cm, n = 46
Unidentified\Crustacea 11%
2%Other prey phyla 3%Other Crustacea 1%
KPolychaeta 7%
Decapoda 20%
11-20 cm, n = 137 11-20 cm, n = 84
Amphipoda 45%
UnidentifiedCumacea 5% Crustacea 6%
Isopoda 4% Other prey phyla 6%
poda 18% Polychaeta 11%
Other Crustacea 5%
21-30 cm, n = 109
Other prey phyla 2%
Isopoda 3%'
Decapoda 20 Oth
21-30 cm, n = 343
Figure 3. Abundance (% occurrence) of the major prey items of little skate collected during NEFSC bottom trawlsurveys from 1973-1980 and 1981-1990. Methods for sampling, processing, and analysis of samples differed betweenthe time periods [see Reid et al. (1999) for details].

Page 22
1973-1980 1981-1990
UnidentifiedCrustacea 6
Other preyFish 3%
Mnlhicrn• 9%/
Other prey phyla 1% mphipoda 32%
Crustacea shrimp 5%
UnidentifiedCrustacea 1%
phyla 3% Fish 6%
Decapoda 28%, Mollusca 6%
Other Crustacea 2%
Isopoda 50 Polychaeta 14%
31-40 cm, n = 784
"I-Polychaeta 15%Decapoda 25° D"Other Crustacea 1%
31-40 cm, n = 215
UnidentifiedCrustacea 6%
Other prey phyla 6%
41-50 cm, n = 772 41-50 cm, n = 2227
Decapoda
Unidentified
Crustacea 6%
Other prey phyla 8%
Other Crustacea 2% 1--, • • YoPolychaeta 19%
51-60cm, n = 50 51-60 cm, n = 185
Figure 3. cont'd.

Page 23
Figure 4. Distribution of juvenile little skate collected during winter NEFSC bottom trawl surveys [1964-2002, all yearscombined; see Reid et al. (1999) for details]. Survey stations where juveniles were not found are not shown.

Page 24
Figure 5. Distribution and abundance of juvenile little skate collected during spring NEFSC bottom trawl surveys [1968-2002, all years combined; see Reid et al. (1999) for details].
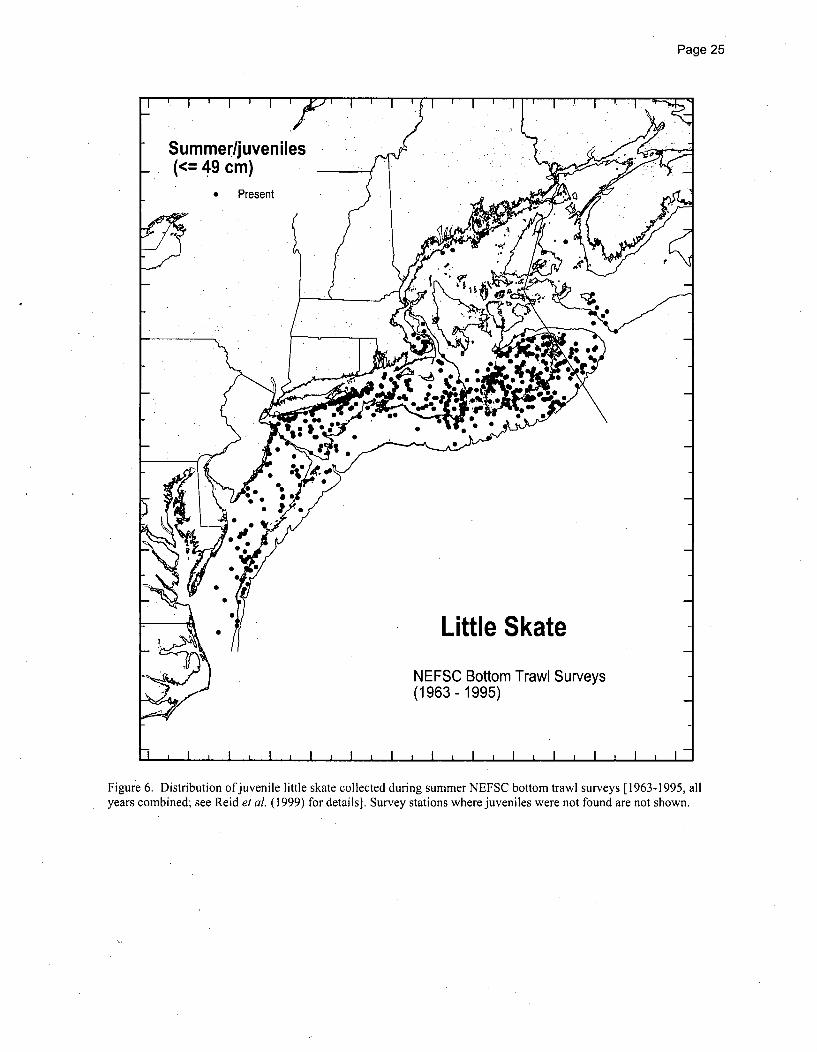
Page 25
Figure 6. Distribution of juvenile little skate collected during summer NEFSC bottom trawl surveys [1963-1995, allyears combined; see Reid et al. (1999) for details]. Survey stations where juveniles were not found are not shown.
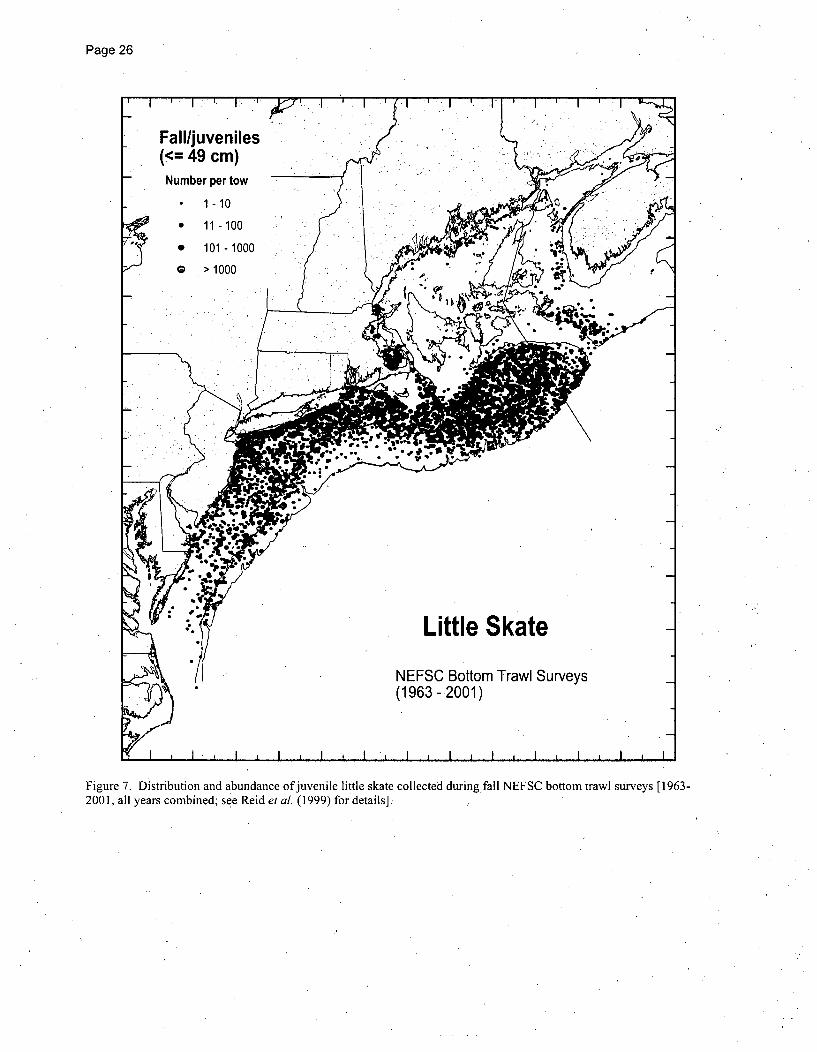
Page 26
Fall/juveniles(<= 49 cm)
Number per tow
1-10
0 11 -100
0 101 - 1000
0 > 1000
Little Skate
NEFSC Bottom Trawl Surveys(1963 - 2001)
Figure 7. Distribution and abundance ofjuvenile little skate collected during fall NEFSC bottom trawl surveys [1963-2001, all years combined; see Reid et al. (1999) for details].

Page 27
Little SkateMassachusetts InshoreTrawl Survey(1978 - 2002)
Spring/juveniles(<= 49 cm)
F"
Number per tow* 1-10
* 11-100
* 101 -500
> 500
Massachusetts
d.e-
Figure 8. Distribution and abundance ofjuvenile little skate in Massachusetts coastal waters collected during the springand autumn Massachusetts inshore trawl surveys [1978-2002, all years combined; seeReid et al. (1999) for details].
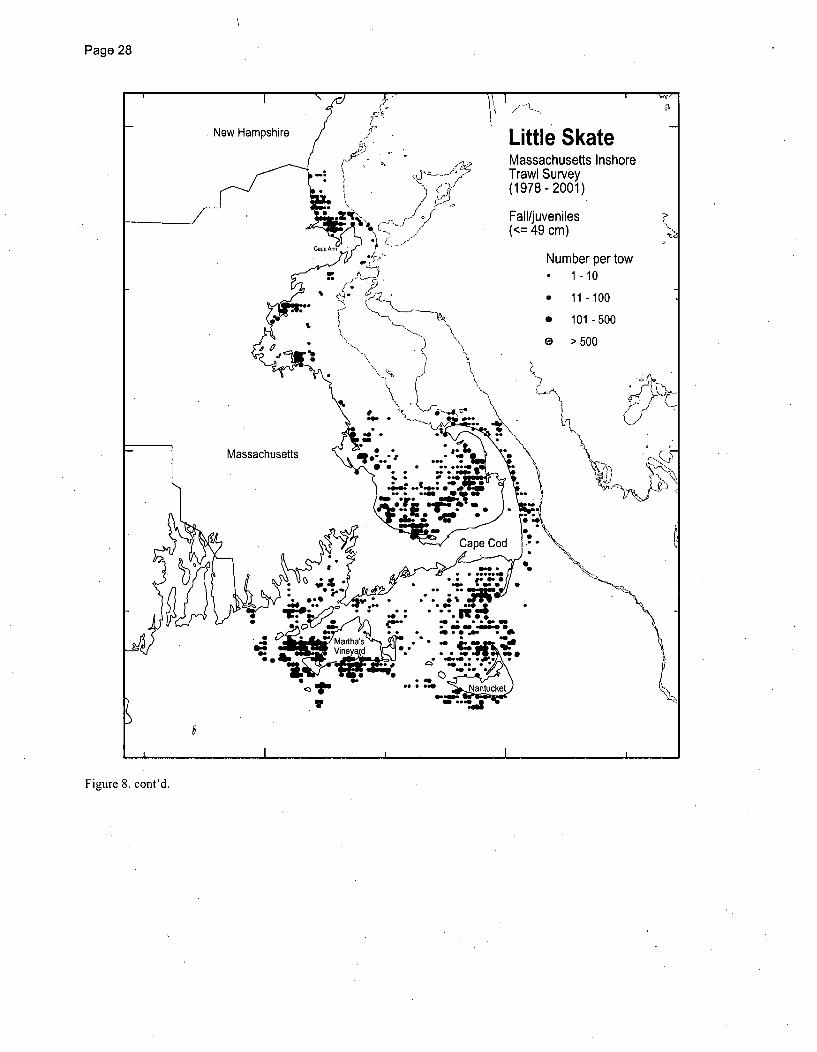
Page 28
/'I"_.
Little SkateMassachusetts InshoreTrawl Survey(1978- 2001)
Fall/juveniles(<= 49 cm)
Number per tow1-10
* 11-100
* 101-500
0 > 500
Massachusetts
.6~
*00.
Og
Figure 8. cont'd.
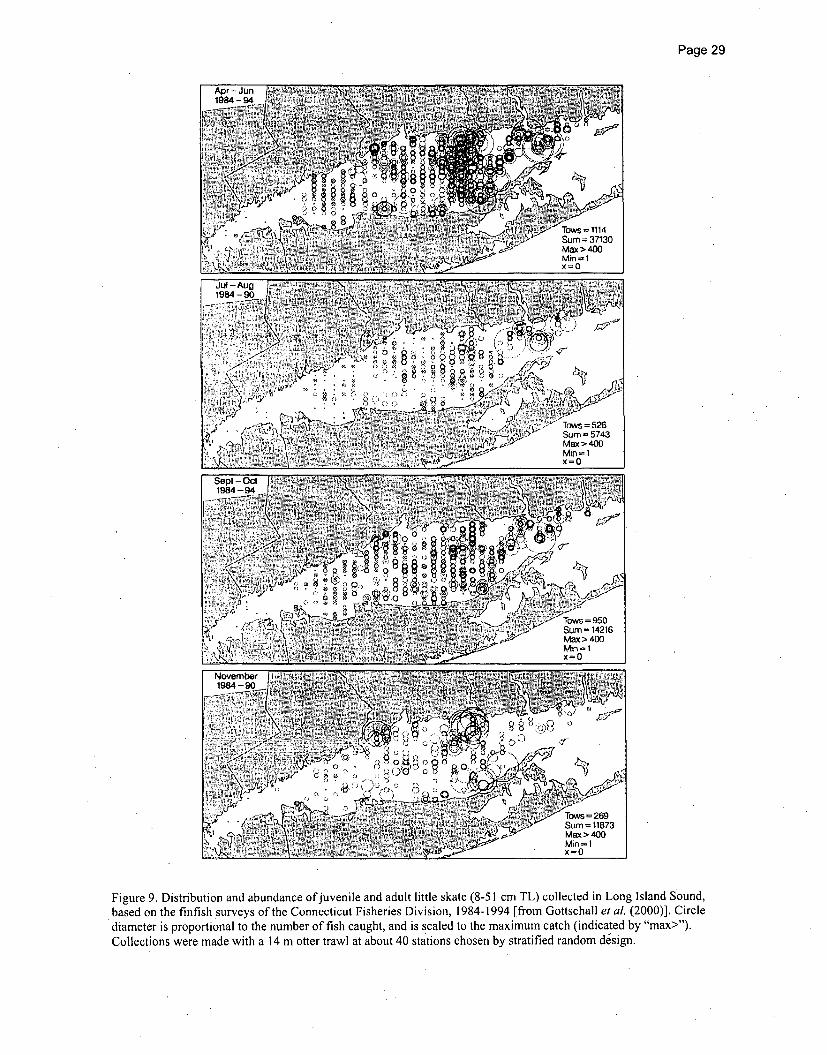
Page 29
Figure 9. Distribution and abundance of juvenile and adult little skate (8-51 cm TL) collected in Long Island Sound,based on the finfish surveys of the Connecticut Fisheries Division, 1984-1994 [from Gottschall et al. (2000)]. Circlediameter is proportional to the number of fish caught, and is scaled to the maximum catch (indicated by "max>").Collections were made with a 14 m otter trawl at about 40 stations chosen by stratified random design.

Page 30
10=
10=
1000
10
10= -
April Augustn= 642 ,n -369
Tows - 21 jTows -39
[ T.y n-0Tows-0
Junen -2,385Tows - 45
Octobern-1.077
Tow =,43
tl
n-!CT.w-
Novembern-0
TOWS MO
8 [0 12 14 ll IS 20 2'2 24 26 20 30 32 34 36 38 40 42 , 46 48 50 8 101 14 16 18 20 22 24 20 28 3D 32 34 36 38 40 42 4, 'a4850
Figure 10. Monthly logl 0 length frequencies (cm) ofjuvenile and adult little skate collected in Long Island Sound, basedon 4,473 fish taken in 148 tows between 1989-1990. From Gottschall et al. (2000).

Page 31
IKE
nC
61
!Abundance]by Month
--k'- i/
---.---•-----
r----!Bh byp~ MonthJ~ and Botto Tye:,oi
B Abundance
by Month and Bottom Type3
C f-........... . .
C. - ...
Percent Occurrenceby Month
90
60 -
705,o\
Mn IE. Percent Occurrence
[by Month and Bottom Typel
80
2C0
!Molh .. i ay J;n t .1= : u9 Sep 03 NC, --
U --- r' 82,7 • -•, --- U - ; 7, 1 911• "-
93. 68, F 72 7, ? " 91s.10o16* mud
laos16 667d
j
C. V
0 _, 7 f 53-°':.63, 600 5 543 :i4-F-Y32 2.17 .• "o •
. 7.6 3 ..: 71-...933. 1.4 , ,7-Al
Abundanceby Month and Depth Interval
Percent Occurrence
1by Month and Depth Interval1
2&
2.C
<
1,IS0W 4 D
1 • 6... . . . 815 . . .. 5J2.n I - 2. 7 A,0 I.2 s F 6 7MIonlo.. Au, ,," . ( o o -:•7,0907---I 2240B "i76.04 . . 0- 7 7 'i • 32, 6"637 "• . .....
E3.1-182m L?.!p6 1C3 6 55 1.31 12 - lOS9 460 2_:10 •.7.3m- 13 11 14i4 F0T 3 A3. 2...62' 420T27.4km 7•j- 4-i ýl0 1,43 i0i.7? 34 . 6.23"5• 0 301'
K iSO.O-1oV 60. 5 .3 . 61 3 . 1 526 1 I 72.4 i .7 06 .0210 3,27 3ili 51.3 06.0 !4,i 70.7 52.9 7- . i S.8 TY .
153?4.n 667 I 4.0 90. 761 76. I 6.7 3..4 5.3
Figure 11. Relative abundance (geometric mean catch/tow) catch/tow and percent occurrence (proportion of samples inwhich at least one individual was observed) for juvenile and adult little skate in Long Island Sound by month, month andbottom type, and month and depth interval. From Gottschall et al. (2000).
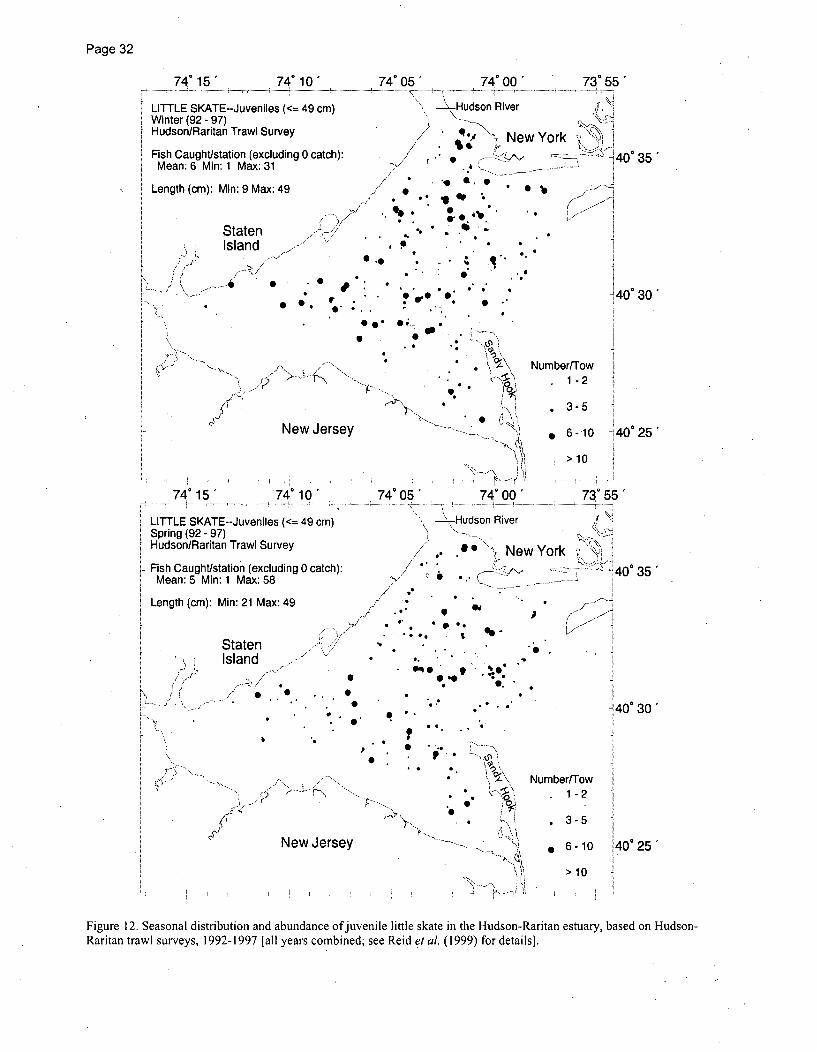
Page 32
74' 15 ' 74° 10 "
LITTLE SKATE--Juveniles (<= 49 cm)Winter (92 - 97)Hudson/Raritan Trawl Survey
Fish Caught/station (excluding 0 catch):Mean: 6 Min: 1 Max: 31
Length (cm): Min: 9 Max: 49
74" 05~ 74*0O0
\ -.Hudson River
R.~' '' New YorI
,z<Y~~
?4.
.7.
1/
StatenIsland
_4
New Jerse y
* .S. , , Numbi
k.. ..- (w• '0
74* 05" 74' 000
\, Hudson River
7 .** " New YorI/ *'
N " *.
730 55
.... 400 35
4030
1-2 1
3-5 1
6-10 ý4Q0*5~
>10
73' 55
.... ...... .. .....
' I
-40* 35
j - 3--'-I
'40• 30"74° 15 '74 10"
LITTLE SKATE--Juveniles (<= 49 cm)Spring (92 - 97)Hudson/Raritan Trawl Survey
Fish Caught/station (excluding 0 catch):Mean: 5 Min: 1 Max: 58
Length (cm): Min: 21 Max: 49
StatenIsland/ 0
. 0 -
*o* 9 A0. 0 00 0 *
'*0* ~
*00 .* 0.
0 0.
*qg ~@00
* 0** 0
* . 00 .. ** .
* 0
op
*0
S
j,/~
15 . ...'> .
New Jersey,
p..1 Number/Tow1-2
* 3-5
* 6-10
>10
1400 25i
Figure 12. Seasonal distribution and abundance ofjuvenile little skate in the Hudson-Raritan estuary, based on Hudson-Raritan trawl surveys, 1992-1997 [all years combined; see Reid et al. (1999) for details].
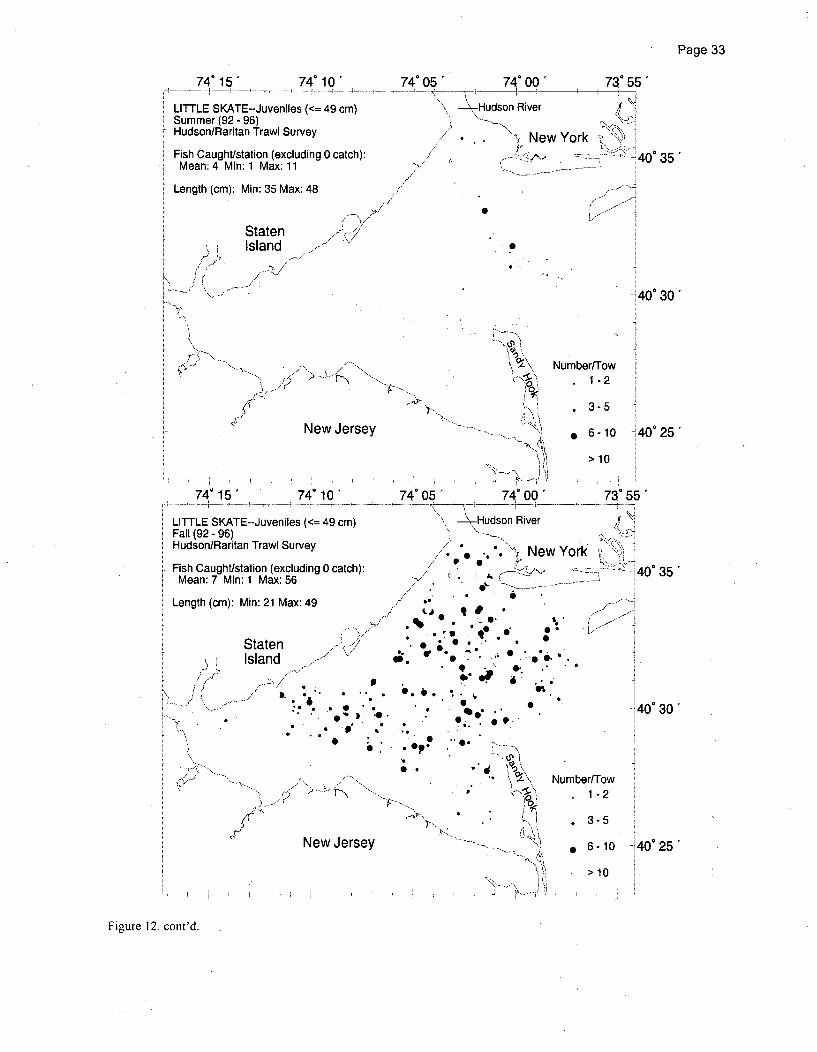
Page 33
74' 15' 74* 10"
LITTLE SKATE--Juveniles (<= 49 cm)Summer (92 - 96)Hudson/Raritan Trawl Survey
Fish Caught/station (excluding 0 catch):Mean: 4 Min: 1 Max: 11
Length (cm): Min: 35 Max: 48
74 05" 74, 00 73° 55"
\ -•-.-Hudson River /
New York I,40° 35
14Q0 30
StatenIsland
IV
-I-, '~
_ p -
New Jersey
'0
74° 05" 7°00"
ý-.-Hudson River
Number/Tow
1-2
* 3-5
* 6-10 '40°25
>10
730 5574° 15'..... .. .... . . ....... ............ 4 " " - r ¢ ...
LITTLE SKATE--JuveFall (92 - 96)Hudson/Raritan TrawlFish Caught/station (eMean: 7 Min: 1 Max
Length (cm): Min: 21
74° 10"
niles (<= 49 cm)
7- 71"
StateiIsland
/o./
Survey " •/. • .. •New Yorlxcluding 0 catch): *. . > / N Y .-.:56 . ~
/I' ' 6
Max: 49 "/- I • '- E
*0 0'In/ of
-/ I •- -we " SO "ll
. .. .
Numb ,
3 ... .. ., . *... ..* . 6 , . 5 O 0•:* . o° *" • :
o..,I......
New Jersey .N J
k '
,40 035
.2 .; er/Tow1-2
3-5
6-10
>10
40* 30
140° 25
Figure 12. cont'd.

Page 34
750 30 ' 750 20' 75° 10 ' 750 00
LITTLE SKATEAll Size Classes Combined
Winter (1966 - 1999)Delaware Bay Trawl Survey
Average Number of Fish Caught andPercent Occurrence
740 50. ..............
]390 30"
NJ0.6215%
2.5036%
jy<-I
A'
I
7390 20 "
390 10 '
0.7327%
2.3241"%
2.00100%
3.13)-<:; 47/%
00'
0.6919%
4.0638%
'12.2047%
13.1443%
2.3333%
0.000%
/L
# TimesStation Sampled
t 1_r''-'I-
" ... , 1.30 ...... 38° 50•\ ~10 -22
1% 0..0 31-40
Data Source: eo 41-50Delaware Division of Fish & Wildilfe Henlopen, * 51 -61
-- I - -- ----. _____ ___ .... ---.
Figure 13. Seasonal distribution and abundance of juvenile and adult little skate in Delaware Bay, based on DelawareDivision of Fish and Wildlife bottom trawl surveys from 1966-1999 (all years combined). Surveys were conductedmonthly at 9-14 fixed stations, using a 9.1 m otter trawl towed for 20-30 min (for methods see Michels and Greco 2000).

Page 35
750 30 " 750 20 ' 750 10 ' 750 00 ' 74 50'
1390 30"LITTLE SKATEAll Size Classes Combined
Spring (1966 - 1999)Delaware Bay Trawl Survey
Average Number of Fish Caught andPercent Occurrence
0.0000%
NJ390 20
r~2~ ~
/
0.150*7%/
0.630
22%1/
///
/
:390 10'
1.710
43%
0.84, C'- 22%
1.6733% 5.88
0
56%2.11 5.27
56% 65%
0.000%
8.4066%
5.5050%
/ '1390 00
# TimesStation Sampled
± 1-5
10-22DE
3.36 1380 50
openi.
• 31 -40
o 41-50
e 51-61Data Source:Delaware Division of Fish & Wildilfe
CapeHenh
Figure 13. cont'd.

Page 36
750 30 ' 750 20 " 750 10 ' 750 00 ' 740 50.'
LITTLE SKATEAll Size Classes Combined
Summer (1966- 1999)Delaware Bay Trawl Survey
Average Number of Fish Caught andPercent Occurrence
• NJ
1390 30,
•390 20
1390 100o%0%
o.g22%
\
0.26
0.•I2%
0.00O0/0
0.000% /
, .i39°00'
/ ape ~a
0.000%
0.500
8%/
11%
0.00
0.000%
0.000% # Times
Station Sampled
1-5
10-22DE 3850~
00/0
Data Source: Cap 7 iDelaware Division of Fish & Wildilfe Henlopen
...... .........................................................................................----------
a 31 -40
0 41-50
* 51-61
Figure 13. cont'd.
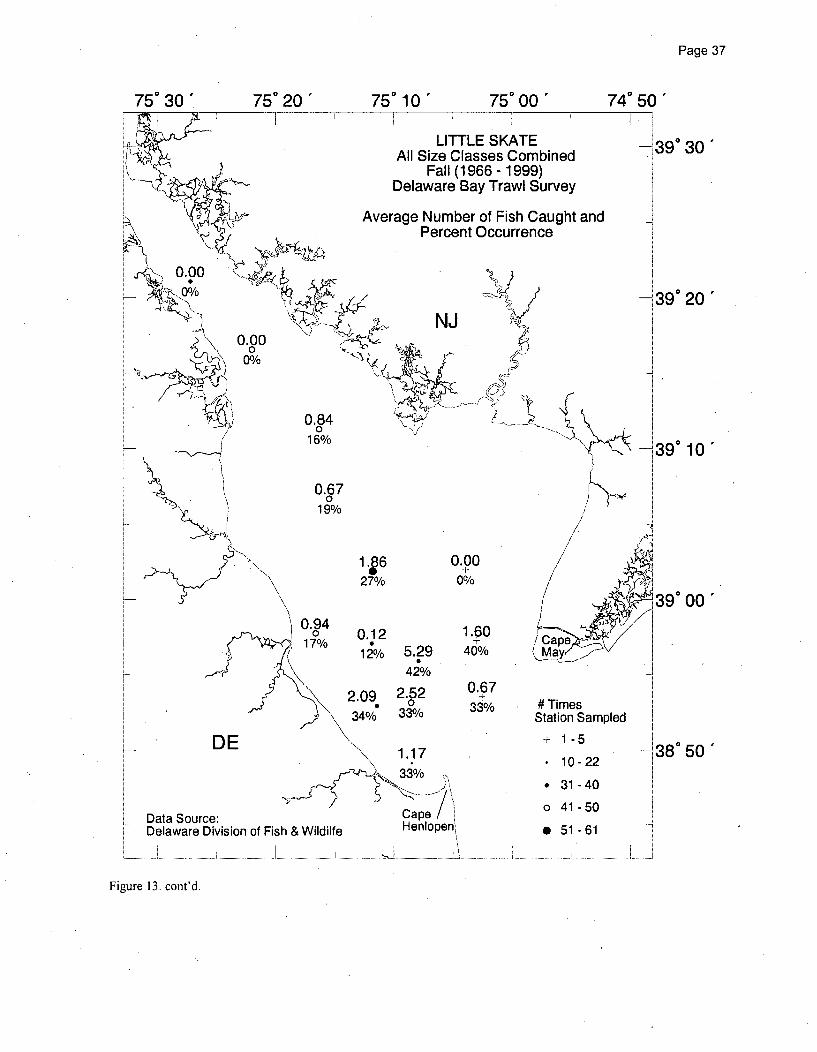
Page 37
750 30 ' 750 20 ' 750 10 ' 750 00 ' 740 50 '
LITTLE SKATEAll Size Classes Combined
Fall (1966 - 1999)Delaware Bay Trawl Survey
Average Number of Fish Caught andPercent Occurrence
NJ r,5U
0.000
0%
0.84016%
0.670
19%
N1.627%
0.120
1 2%/
0.940
17%
0.000%
1.6040%
0.6733%
J
390 30
390 20'
390 10
390 00
380 50"
5.29042%
2.520
33%2.0934%
DE1.1733%/o
# TimesStation Sampled
± 1-5
10-22
• 31-40
o 41-50
open,Data Source:Delaware Division of Fish & Wildilfe
.. .. .... .... ..... .. .. .. ..... .. .. .. ... .. .. .. .. ... .. .. .. ... .. .. .. .. ... .. .. .. .. ... .. .. I .. ... .. .. .. .. ... .. .... ..... .... .. .. ...,.. ... .. ... .. ... ... ... .. .. .....
CapeHenhl * 51-61
Figure 13. cont'd.

Page 38
Figure 14. Distribution of adult little skate collected during winter NEFSC bottom trawl surveys [1964-2002, all yearscombined; see Reid et al. (1999) for details]. Survey stations where adults were not found are not shown.

Page 39
Figure 15. Distribution and abundance of adult little skate collected during spring NEFSC bottom trawl surveys [1968-2002, all years combined; see Reid et al. (1999) for details].
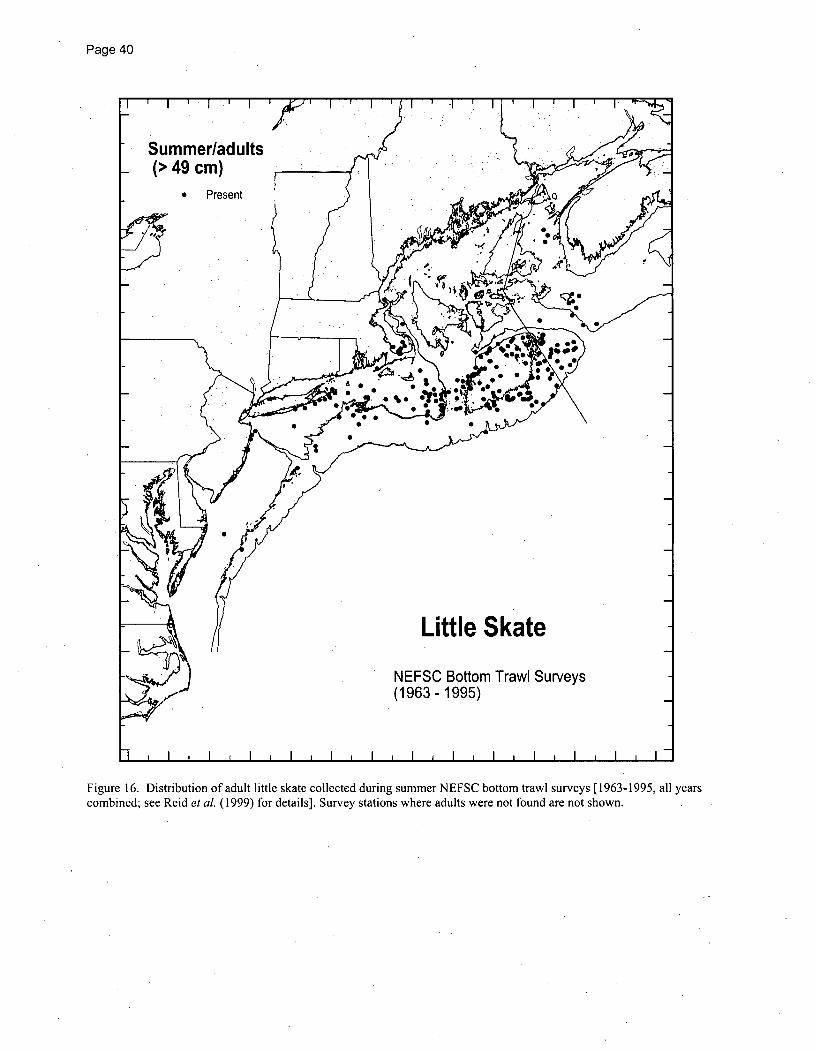
Page 40
Figure 16. Distribution of adult little skate collected during summer NEFSC bottom trawl surveys [1963-1995, all yearscombined; see Reid et al. (1999) for details]. Survey stations where adults were not found are not shown.

Page 41
Fall/adultS(> 49 cm)Number per tow
1-10
9 1.1-100
S 101 - 1000
* > 1000
Little Skate
NEFSC Bottom Trawl Surveys§3 (1963- 2001)
Figure 17. Distribution and abundance of adult little skate collected during fall NEFSC bottom trawl surveys [1963-2001, all years combined; see Reid et al. (1999) for details].

Page 42
Little SkateMassachusetts InshoreTrawl Survey(1978- 2002)
Spring/adults(> 49 cm) K
Number per tow* 1-10
* 11-100
* 101-500
G > 500
Massachusetts
N 0 ntucke
• ..... "
Figure 18. Distribution and abundance of adult little skate in Massachusetts coastal waters collected during the springand autumn Massachusetts inshore trawl surveys [1978-2002, all years combined; see Reid et al. (1999) for details].

Page 43
Figure 18. cont'd.

Page 44
740 15' 74°10'[ 4 .... ....... + ... .......{ .... ...... • .... .... .. ;..... . .-. •.... ........... .. .. ......... . ....... ...... .. ............. .. ..........+ ..
LITTLE SKATE--Adults (>= 50 cm)Winter (92 - 97)Hudson/Raritan Trawl Survey
i Fish Caught/station (excluding 0 catch):Mean: 1 Min: 1 Max:2
Length (cm): Min: 50 Max: 54
74005"'
\ -tHud
74* 00' 730 55
dson River ,•'
New York- ,--- 40° 35
//
StatenIsland
.N
...Jz40* 30'
>-
-.-p...
New Jersey
-' NN
"0
1"U> -\d'
* • 74_000
, Hudson River
',New
umber/Tow
74° 15' 74 10"
LITTLE SKATE--Adults (>= 50 cm)Spring (92- 97)Hudson/Raritan Trawl Survey
Fish Caught/station (excluding 0 catch):Mean: 1 Min: 1 Max: 2
Length (cm): Min: 50 Max: 51
74' 05
1-2 1
* 3-5 1
* 6-10 -A40 25"
>10
73q 55
York'• 40 35
StatenIsland
.'•
-40" 30"
IN
C-
(K($J
'p Number/fow
1-2
* 3-5
* 6-10
>10
New Jersey 400 25'
Figure 19. Seasonal distribution and abundance of adult little skate in the Hudson-Raritan estuary, based on Hudson-Raritan trawl surveys, 1992-1997 [all years combined; see Reid et al. (1999) for details].

Page 45
74* 15 74' 10'.• .... . ..... i .. ........ - -------.. . . ----:. . . ... . . .. . i . . . ..:. .. . . .• . . .
LITTLE SKATE--Adults (>= 50 cm)
Summer (92 - 96)Hudson/Raritan Trawl Survey
Fish Caught/station (excluding 0 catch):Mean: 1 Min: 1 Max: 1
Length (cm): Min: 50 Max: 50
74' 05 74° 00 " 73 55 "
\ .-•Hudson River
New York ,"/ 4035
^/
-y
/. /
N
StatenIsland
•140°30•
v-I
New Jersey
\L \ Numb)Oo
74' 00'
-\-,Hudson RiverN \ ..
74* 15" 74' 10".- .. .. ... . .......... .. ---- ----- ---.. • " ' • ... . .. . . . . .. ......•. .. . .. ..... .
LITTLE SKATE--Adults (>= 50 cm)Fall (92 - 96)Hudson/Raritan Trawl Survey
Fish Caught/station (excluding 0 catch):Mean: 1 Min: 1 Max:2
- Length (cm): Min: 50 Max: 59
74' 05
er/Tow1-2 i
3-5
6-10 -140° 25"
>10
730 35
•.- ..... 4Q0 35/"/
//
* • New Yor
_z7~-------
StatenIsland
A40030"
'4)
0-'~\ N
N
N'7
N----- \
mi~eriiowumber/Tow1-2
* 3-5 1
* 6-10 .400 25"
>10
New Jersey
Figure 19. cont'd.

Page 46
Little SkateNEFSC Bottom Trawl Survey
Spring/Juveniles
40
30
2 20n 10
0
[3 Trawls N=10537
* Occurrence N=4601
Eo Catch N=190907
504030
3 20100
1 2 3 4 5 6 7 8 9 10 11 12 13 14 15 16 17 18 19 20 21 22 23
Bottom Temperature (°C)
Bottom Depth (m)
[I Trawls N=12193
* Occurrence N=5293
o Catch N=225863
40
-30C2 20-
D 10
0 22
26 27 28 29 30 31 32 33 34 35 36 37
[I Trawls N=1959
* Occurrence N=971
[3 Catch N=70595
Salinity (PPT)
Figure 20. Spring and fall distributions of juvenile little skate and trawls relative to bottom water temperature, depth, andsalinity based on NEFSC bottom trawl surveys (1963-2002; all years combined). White bars give the distribution of allthe trawls, black bars give the distribution of all trawls in which little skate occurred, and gray bars represent, withineach interval, the percentage of the total number of little skate caught.

Page 47
Little SkateNEFSC Bottom Trawl Survey
Fall/Juveniles
20
152 10
2 4 6 8 10 12 14 16 18 20 22 24 26 28
Bottom Temperature (°C)
0 Trawls N=11844
0 Occurrence N=3566
O Catch N=55895
2520
a 1510S10_
50
n~rlICo 0 0 C 0 CD 0 C D 0 0 0 0 0 0 0 0 0
- C4 ~)~ o C ~ ~0) 0 C ~(0 (0 0 0 0 0 00-N C4 COY) ,O.
--- ov-- - Deph ('
Bottom Depth (in)
[I Trawls N=13543
0 Occurrence N=4036
E) Catch N=63689
[3 Trawls N=1956
0 Occurrence N=711
Eo Catch N=10517
60
E4020
¶20-27 29 30 31 32 33 34 35 36
Salinity (PPT)
37
Figure 20. cont'd.

Page 48
Little SkateMassachusetts Inshore Trawl Survey
Spring/Juveniles
30 -
25-1 20a)2 15
n) 10 -
0 '1r-i 7 -T 7 L1,1 2 3 4 5 6 7 8 9 10 11 12 13 14 15 16
Bottom Temperature (*C)
0 Trawls N=2312
* Occurrence N=1679
o Catch N=1 19534
40-
30Ca)2 20a)
CL10-
0-
[I Trawls N=2385
* Occurrence N=1 732
[3 Catch N=1 23400
C L2) 0 LO 0 oCt O O 0 M 0 L
B(oN et (m WWBottom Depth (in)
Figure 21. Spring and fall distributions of juvenile little skate and trawls relative to bottom water temperature and depthbased on Massachusetts inshore trawl surveys (1978-2002, all years combined). White bars give the distribution of allthe trawls, black bars give the distribution of all trawls in which little skate occurred, and gray bars represent, withineach interval, the percentage of the total number of little skate caught.
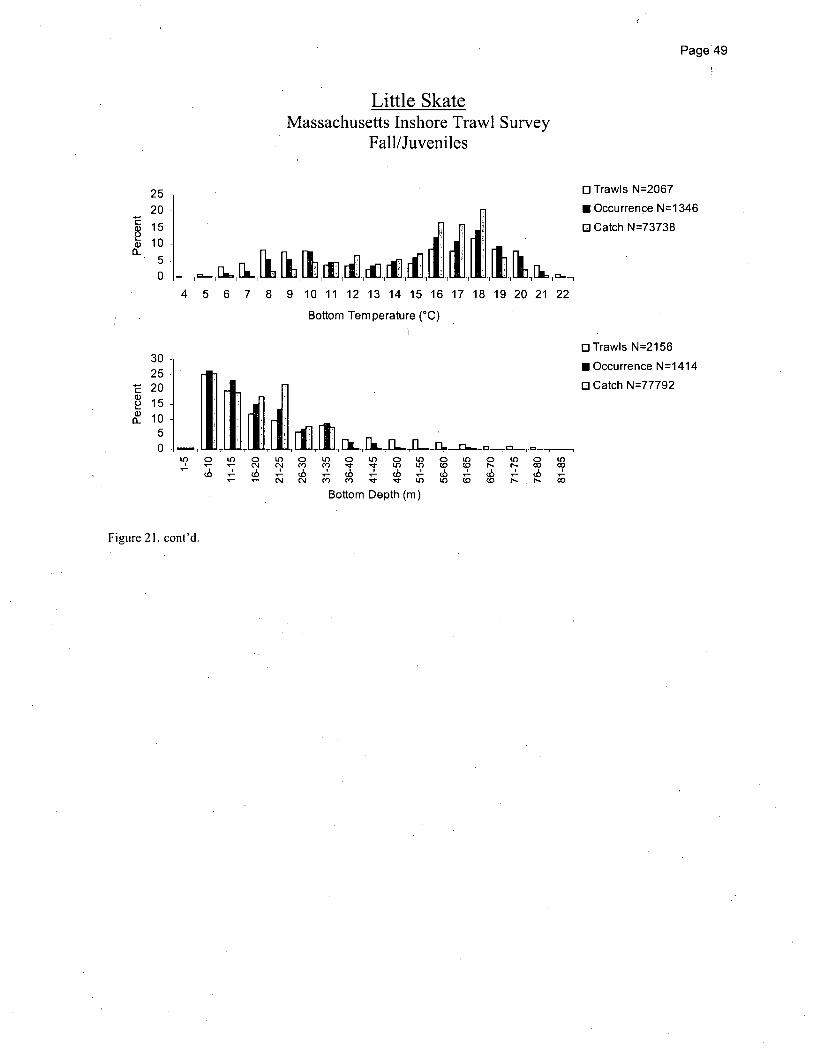
Page 49
Little SkateMassachusetts Inshore Trawl Survey
Fall/Juveniles
2520
Q 10 r
5-
4 5 6 7 8 9 10 11 12 13 14 15 16 17 18 19 20 21 22
Bottom Temperature (°C)
o Trawls N=2067
* Occurrence N=1 346
* Catch N=73738
3025
E 202 15
o~1050
0 Trawls N=2156
0 Occurrence N=1414
[] Catch N=77792
U) 0 L) a C D 0 ( 1 C U) C0 U1) U)0- N J C) C?) C? U)?
- N MN M ~ CL 'U o C
Bottom Depth (in)
Figure 21. cont'd.
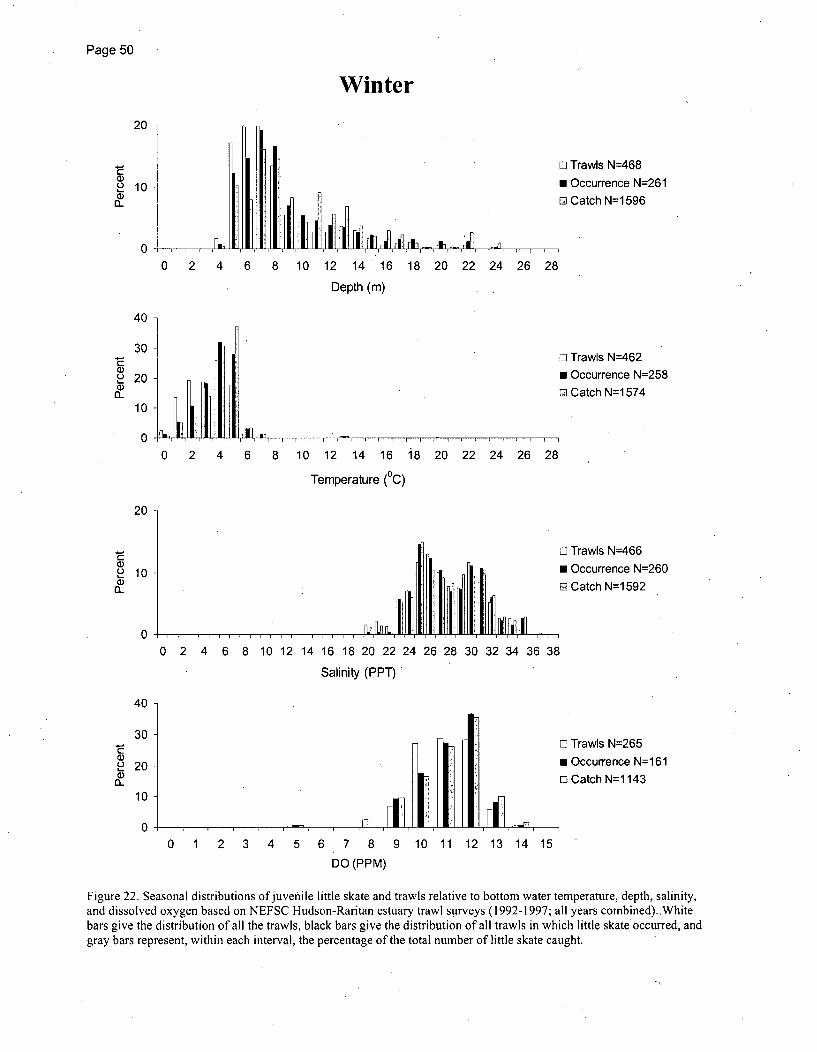
Page 50
Winter
20
]C
n)10
Ei Trawls N=468
m Occurrence N=261
13 Catch N=1 596
I ''I I ý fý i ili& - '. - I ,02 40 6 8 10 12 14 16 18 20 22 24 26 28
Depth (m)
40 -
30
S200)
10
0
* Trawls N=462
* Occurrence N=258
12 Catch N=1 574
Anl
0 2 4 6 8 10 12 14 16 i8 20 22 24 26 28
Temperature (0C)
20
a)a-)
10
i~'1iil1ld[L ,L) Trawls N=466
M Occurrence N=260
M- Catch N=1 592
0 IRI
VbrL 1ý1
0 2 4 6 8 10 12 14 16 18 20 22 24 26 28 30 32 34 36 38
Salinity (PPT)
40
30
2 20
10
0
* Trawls N=265
* Occurrence N=161
[3 Catch N=1 143
0 1 2 3 4 5 6 7 8 9 10 11 12 13 14 15
DO (PPM)
Figure 22. Seasonal distributions ofjuvenile little skate and trawls relative to bottom water temperature, depth, salinity,and dissolved oxygen based on NEFSC Hudson-Raritan estuary trawl s~urveys (1992-1997; all years combined). Whitebars give the distribution of all the trawls, black bars give the distribution of all trawls in which little skate occurred, andgray bars represent, within each interval, the percentage of the total number of little skate caught.

Page 51
Spring
C:a)
30
20
10
LI Trawls N=330m Occurrence N=21 1ia Catch N=981
00 2 4 6 8 10 12 14 16 18 20 22. 24 26 28
Depth (m)
30
E 20-a)
a)
0
D] Trawls N=326
I [1 U Occurrence N=208
~~ I Catch N=976
2 4 6 8 10 12 14 16 18 20 22 24 26 28
Temperature (°C)
0
30 -
20
n 10
0-
30
E 20
U
n 10
0-
2 4 6 8 10 12 14 16 18 20 22 24 26 28 30 32 34 36 38
Salinity (PPT)
0
-] Trawls N=326
I Occurrence N=208
.1 Catch N=976
-]Trawls N=177
0 Occurrence N=130
-1 Catch N=644
-I E
!
E
0 1 2 3 4 5 6 7 8 9 10 11 12
DO (PPM)
13 14 15
Figure 22. cont'd.

Page 52
Summer
a)U
a,a-
40
30
20
10
2 4 6 8 10 12 14 16 18 20
Depth (m)
E: Trawls N=356
* Occurrence N=17
* Catch N=75
22 24 26 28
0
0
40
30
a)2 20al)
10
0
D1 Trawls N=352
ii U Occurrence N=17
El Catch N=75
8 10 12 14 16 18 20 22 24 26 28
'Temperature (0C)
0 2 4 6
Ca){-_
30
20
10
0
40
30
0 2 4 6 8 10 12 14 16 18 20 22 24 26 28 30 32 34' 36 38
Salinity (PPT)
I 1_ ~ I]
0 1 2 3 4 5 6 7 8 9 10 11 12 13 14 15
DO (PPM)
ED Trawls N=347
* Occurrence N=16
* Catch N=67
LI Trawls N=215
0 Occurrence N=13
El Catch N=60201010
0
Figure 22. cont'd.

Page 53
Fall
30
-E 20n1
a)(L10~
0-
oi Trawls N=586
o Occurrence N=416
Ei Catch N=2750
0 2 4 6 8 10 12 14 16 18 20 22 24 26 28
Depth (m)
20
a)
a)a_
10 -
El Trawls N=5700 Occurrence N=403
iEI Catch N=2661
4 6 8 10 12 14 16 18 20 22 24 26 28
Temperature (0C)
00 2
20 -
(D0
n)10 -
11 Trawls N=532
0 Occurrence N=375
fu Catch N=2573
0 -0 2 4 6 8 10 12 14 16 18 20 22 24 26 28 30 32 34 36 38
Salinity (PPT)
30
20C.,a)
0- ~rj~ IEl Trawls N=458
0 Occurrence N=336
(3 Catch N=2449I IF01
0 1 2 3 4 5 6 7 8 9 10 11 12 13 14 15
DO (PPM)
Figure 22. cont'd.

Page 54
Winter
30
20
a)
0 h ~ I L ~1i In- Trawls N=1 66
M Occurrence N=52
El Catch N=617
~IL~i~n
-$U)0_
50
40
30
20
10
0
0 2 4 6 8 10 12 14 16 18 20 22 24 26 28
Depth (m)
1
0 2 4 6 8 10 12 14 16 18 20 22 24 26 28Temperature (OC)
11 n 1 0 nIf 12 14 161 8 20 22 24262
1 rdJn
LI Trawls N=166
m Occurrence N=52
Li Catch N=617
LI Trawls N=1 57
m Occurrence N=52
El Catch N=617
C-,.
U)_
30
20
10
0
0 2 4 6 8 10 12 14 16 18 20 22 24 26 28
Salinity (PPT)
30 32 34 36
a)U)a-)
a-
60
50
40
30
20
10
0
*i Trawls N=125
* Occurrence N=50
[E Catch N=608
0. 1 2 3 4 .5 6 7 8 9 10 11 12 13 14 15
DO (PPM)
Figure 23. Seasonal distributions of juvenile and adult little skate and trawls relative to bottom water temperature, depth,salinity, and dissolved oxygen based on Delaware Division of Fish and Wildlife trawl surveys from 1966-1999 (all yearscombined). White bars give the distribution of all the trawls, black bars give the distribution of all trawls in which littleskate occurred, and gray bars represent, within each interval, the percentage of the total number of little skate caught.

Page 55
Spring30
C
C-,U,
0)
20-
10
0
20
0 2 4 6 8 10 12 14 16 18 20 22 24 26 28
Depth (m)
- Trawls N=378
I Occurrence N=1 16
-, Catch N=737
-1 Trawls N=373
N Occurrence N=1 15
13 Catch N=733
C)
U,)C-, 10
4 6 8 10 12 14 16 18 20 22 24 26 28
Temperature (0C)
020
30 -
~20
0-10
0
40
0 2 4 6 8 10 12 14 16 18 20 22 24 26 28 30 32 34
Salinity (PPT)
El Trawls N=374
m Occurrence N=114
E- Catch N=730
36
30
2 20
10
0-IL I
* Trawls N=312
* Occurrence N=97
E3 Catch N=608rk ý Fý-F60 1 2 3 4 5 6 7 8 9 10 11 12 13 14 15
DO (PPM)
Figure 23. cont'd.
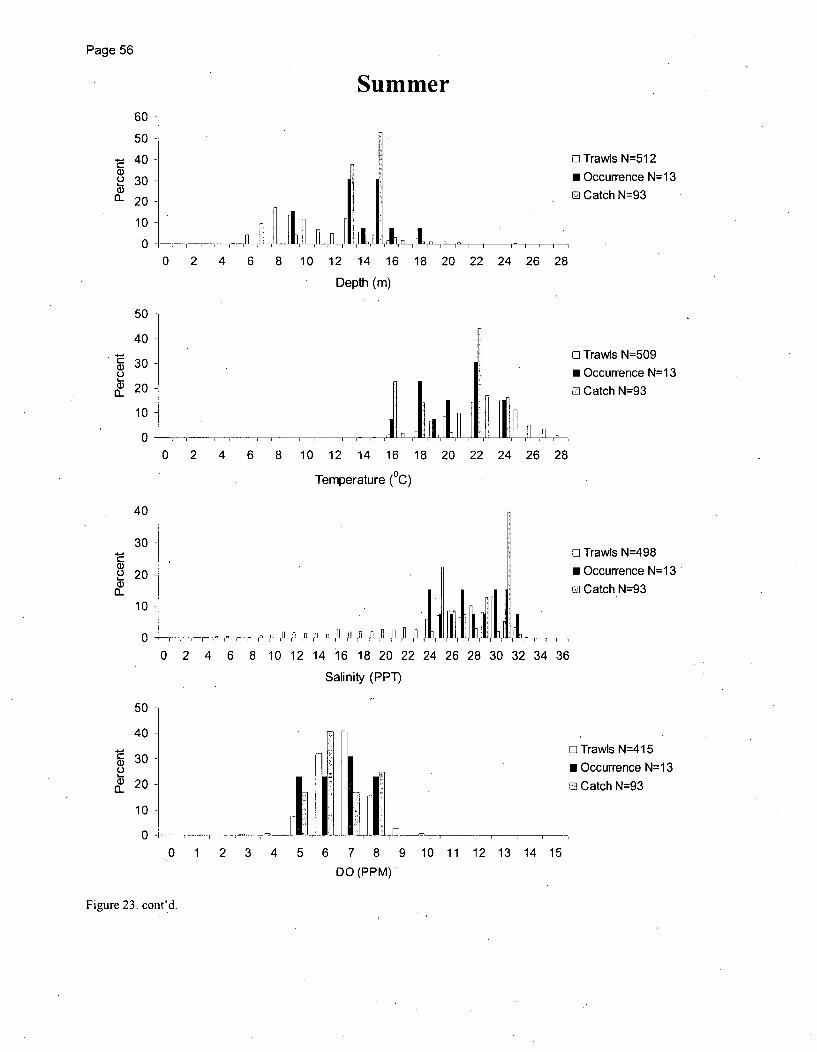
Page 56
Summer
C)03
60
50
40
30
20
10
02 4 6 8 10 12 14 16 18 20 22 24 26 28
1 Depth (m)
0
El Trawls N=512
o Occurrence N=13
D Catch N=93
11 Trawls N=509
o Occurrence N=13
D, Catch N=93C-)C)L
50
40
30
20
10
0 I, 11iFLF, IB It ý n j22 24 26 280 2 4 6 8 10 12 14 16 18 20
Temperature (0C)
40
30
2 2010
10
50
40
30
Qa 20
10
0~
11' 1ý11111,lflý
11 Trawls N=498* Occurrence N=1 3
LI Catch N=93
I[- " ' .1 1 i r, in I H
0 2 4 6 8 10 12 14 16 18 20 22 24 26 28 30 32 34 36
Salinity (PPT)
LI Trawls N=4115
* Occurrence N=1 3
*I Catch N=93
0 1 2 3 4 5 6 7 8 9 10 11 12 13 14 15
DO (PPM)
Figure 23. cont'd.

Page 57
Fall
30 -
C0)U
0)
20
10
, I11ii,11
o1 Trawls N=422
N Occurrence N=93
El Catch N=632
k 1rc IJ00 2 4 6 8 10 12 14 16 18 20 22 24 26 28
Depth (m)
40
30-
2 20
10
o Trawls N=405
* Occurrence N=93
Ol Catch N=632
8 10 12 14 16 18 20 22 24 26 28
Temperature (0C)
0 2 4 6
40
30
2 20
10
0
I o1 Trawls N=399
* Occurrence N=89
* Catch N=624
n-n M n n n 6nnri II
C
U0)0~
70
60
50
40
30
20
10
0
0 2 4 6 8 1012 14 16 18 20 22 24.26 28 30 32 34 36
Salinity (PPT)
O Trawls N=3414 : * Occurrencec N=82
O Catch N=593
0 1 2 3 4 5 6 7 8 9 10 11 12 13 14 15
DO (PPM)
Figure 23. cont'd.
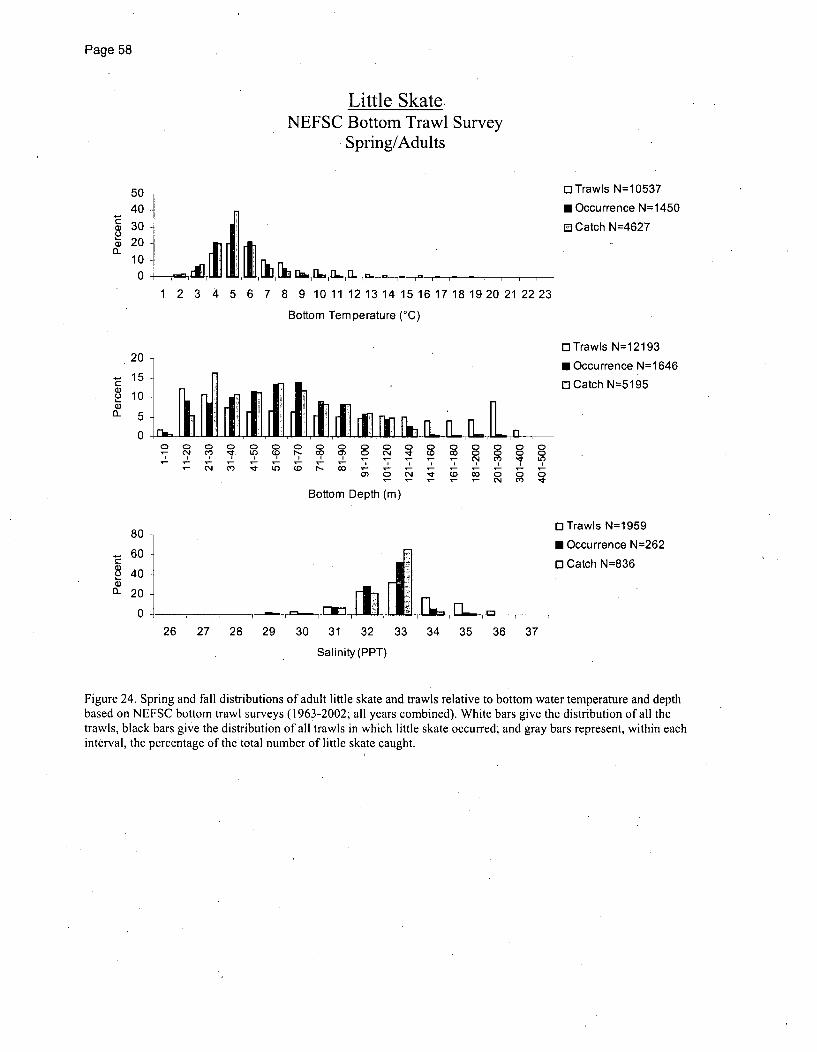
Page 58
Little Skate.NEFSC Bottom Trawl Survey
I Spring/Adults
5040
30Q 20
10
0
[:]Trawls N=1 0537
0 Occurrence N=1450
El Catch N=4627
1 2 3 4 5 6 7 8 9 10 11 12 13 14 15 16 17 18 19 20 21 22 23
Bottom Temperature (°C)
20
15CUo 10
05 L L LrI00 0 0 0a 0 0 CDc 0 0 0 0 0
1ý ~ ~ N I? L? I ý ? 1 0 CN 0 CD,~
Bot om - Dep (m)
Bottom Depth (in)
0 Trawls N=12193
M Occurrence N=1 646
0 Catch N=5195
80
60
40
20 [J-j
[I Trawls N=1959
0 Occurrence N=262
0 Catch N=836
26 27 28 29 30 31 32 33 34 35 36 37
Salinity (PPT)
Figure 24. Spring and fall distributions of adult little skate and trawls relative to bottom water temperature and depthbased on NEFSC bottom trawl surveys (1963-2002; all years combined). White bars give the distribution of all thetrawls, black bars give the distribution of all trawls in which little skate occurred, and gray bars represent, within eachinterval, the percentage of the total number of little skate caught.

Page 59
Little SkateNEFSC Bottom Trawl Survey
Fall/Adults
C
0.)t-)
2520
1510
50
[I Trawls N=11844
0 Occurrence N=1313
[3 Catch N=4095
2 4 6 8 10 12 14 16 18 20 22 24 26 28
Bottom Temperature (°C)
CLa)
.0..
20-
15-
10
5
0
* Trawls N=13543
* Occurrence N=1486
Eo Catch N=4594
n0 o 0 0 0 0 0 0 0 0 0 0 0 0 0 0 0 0 0
N ) C~) C1. ) ) : C:CD - D ) 0 N~ C D cD 0 0 0 0. C? MA ) )
- .- C-)' U- C- C'- 1
-M Depth cN C
Bottom Depth (in)
50 0] Trawls N=1 956
40 N OccurrenceN=23830 [u Catch N=802
ýB 20! I10-
27 29 30 31 32 33 34 35 36 37
Salinity (PPT)
Figure 24. cont'd.

Page 60
'Little SkateMassachusetts Inshore Trawl Survey
$pring/Adults
3025
S2010
2 50)
1 2 3 4 5 6 7 8 9 10 11 12 13 14 15 16
Bottom Temperature (°C)
3025
~20 I rL2 15
n10
50 r I I -IULLL hliFlk4 o.
u? R 2 0 LO 0 LO 0 LO 0 L" 0 O 0 LO 0 O, 0- - 6 - c o) :;, W L (0 (0 , (o
oN tN oM Dp (0 (
Bottom Depth (in)
[3 Trawls N=2312
0 Occurrence N=863
O Catch N=1 2700
o Trawls N=2385
* Occurrence N=894
[3 Catch N=1 3204
Figure 25. Spring and fall distributions of adult little skate and trawls relative to bottom water temperature and depthbased on Massachusetts inshore trawl surveys (1978-2002, all years combined). White bars give the distribution of allthe trawls, black bars give the distribution of all trawls in which little skate occurred, and gray bars represent, withineach interval, the percentage of the total number of little skate caught.

Page 61
Little SkateMassachusetts Inshore Trawl Survey
Fall/Adults
15
10
_ 5
4 5 6 7 8 9 10 11 12 13 14 15 16 17 18 19 20 21 22
Bottom Temperature (0C)
[I Trawls N=2067
N Occurrence N=709
0 Catch N=10582
30-25
E 20a)2 15
10
50
0 Trawls N=2156
E Occurrence N=739
0 Catch N=11032
U? 0O 0) 0O cý 0O C) La)O c . a VC6 -ý I? CN* IT IT L? L ?C? rý f ?
C, 04 - C CIO : II? ý'(00- C
Bottom Depth (in)
Figure 25. cont'd.

Page 62
Winter40 -
30CL2 20
1020
LI Trawls N=468
N Occurrence N=16'
0 Catch N=17
6 8 10 12 14 16 18 20 22 24 26 280 2 4
Depth (m)
At•
CDa3_
30
20
10
FL Trawls N=462
0 Occurrence N=15
El Catch N=16
00 2 4 6 8 10 12 14 16 18 20 22 24 26 28
Temperature (°C)
20
Ca)U.a, 10
0
0 24 6 8 10 12 14 16 18 20 ý2 24 26 28 30 32 34,,36 38
Salinity (PPT)
El Trawls N=466
* Occurrence n=16
LI Catch N=17
ELI Trawls N=265
* Occurrence N=8
0, Catch N=9
Ua,_
I+u
30.
20 1
10
00 1 2 3 4 5 6 7 8 9 10 11 12 13 14 15
DO (PPM)
Figure 26. Seasonal distributions of adult little skate and trawls relative to bottom water temperature, depth, salinity, anddissolved oxygen based on NEFSC Hudson-Raritan estuary trawl surveys (1992-1997; all years combined). White barsgive the distribution of all the trawls, black bars give the distribution of all trawls in which little skate occurred, and graybars represent, within each interval, the percentage of the total number of little skate caught.

Page 63
Spring
Ca,C-)a,
8070-60-50-40302010
0 -I I_ i I. i " I n -- El l II - I
6 8 10 12 14 16 18 20 22 24 26 28
Depth (m)
[] Trawls N=330
0 Occurrence N=9
El Catch N=I 1
0 2 4
40
30
o 20
a)
0-
El Trawls N=326
N Occurrence N=9
ED Catch N=1 1
lh ýit, ,ýI 110 2 4 6 8 10 12 14 16 18 20 22 24 26 28
Temperature (°C)
50 -i
40-
cý 30
20
10
0 I iý d -ý
Ej Trawls N=326N Occurrence N=911 Catch N=1 1
r[F0 2 4 6 8 10 12 14 16 18 20 22 24
Salinity (PPT)
26 28 30 32 34 36 38
40
30
20 -Wa-
El Trawls N=1 77
0 Occurrence N=6
El Catch N=7
10
0! I-,J-IIiFF0 1 2 3 4 5 6 7 8 9 10 11 12 13 14 15
DO (PPM)
Figure 26. cont'd.

Page 64
Summer
C:
a-
50
40
30
20
10
0
* Trawls N=356
* Occurrence N=2
El Catch N=2
0 2 4 *6 8 10 12 14 16 18 20 22 24 26 28
Depth (m)
Ca)C-)a)
50
40
30
20
10
I
6 8 10 12 14 16
Temperature (0C
1
18 20 22 24 26 28
D Trawls N=352
* Occurrence N=2
E Catch N=2
0
0 2 4)
C:a)a-'
50
40
30
20
10
02 4 6 8 10 12 14 16 18 20 22 24 26 28 30 32 34 36 38
Salinity (PPT)
0I-0
*J Trawls N=347* Occurrence N=2* Catch N=2
D Trawls N=215
o Occurrence N=2oi Catch N=2
C
0-
50
40
30
20
10
0
0 1 2 3 4 5 6 7 8 9 10 11 12 13 14 15
DO (PPM)
Figure 26. cont'd.

Page 65
Fall
30
20
n 10
0
40-
30
2 20
10-
0
Li Trawls N=586
n Occurrence N=19
El Catch N=21
0 2 4 6 8 10 12 14 16 18 20 22 24 26 28
Depth (m)
I Ei Trawls N=570
o Occurrence N=18
El Catch N=20
111 F i] Ii ]ý:I n ýý, ý I;I . -lq • l I l [ R • I l l v l I I . . .
0 2 4 6 8 10 12 14 16 18 20 22 24 26 28
Temperature (0C)
20
10
0 i~ ~fIliu1n
11 Trawls N=532m Occurrence N=1 8
13 Catch N=20
. . . . . . . . . . . . .. . .. .,- /. ,- .:- v -. ,- .:.-,..--.- .- v - .i- ,,.- ., ..... ,.- . . . .
0 2 4 6 8 10 12 14 16 18 20 22 24 26 28 30 32 34 36 38
Salinity (PPT)
50
40
30o
0 20
10
00 1 2 3 4 5 6 7 8 9 10 11 12 13 14 15
E) Trawls N=458
* Occurrence N=15.
Li Catch N=17
DO (PPM)
Figure 26. cont'd.

Page 66
Gulf of Maine, Georges Bank, Southern New England, Mid-Atlantic Bight
18000 10
16000 - Skate complex, commercial landings (mt) 9
14000- Survey index of little skate biomass 8 C
12000 *"
0 C0
10000
E . • 5u) 8000 ,D.
" 600"* *' ' *: =
6000 ,
4000 ., 1
20 0
o 0 ( " 't O0 0~ 04 ( " •- ( 0 (N "• (0 C 0 (N •1 CO • 0CO CO (0 (0 D (0 . I. N- N .N ',. N 0 (O (0 (O CO 0 O• 0) CO 00) 0 • C O • ~0 O• O• 0) 0) 0) 0) 0 0) 0) 0) 0 0) 0) 0 0
Year
Figure 27. NEFSC spring survey index of little skate biomass and commercial landings of the seven species skatecomplex from the Gulf of Maine to the Mid-Atlantic Bight.