live load distribution on concrete box...
TRANSCRIPT

136 TRANSPORTATION RESEARCH RECORD 1288
Live Load Distribution on Concrete Box Culverts
A. M. ABDEL-KARIM, M. K. TADROS, AND J. V. BENAK
The effects of wheel loading on concrete box culverts is discussed. Distributions o · wheel loads through pavement , embankm ··nt soil , and culvert top slab are considered epanitely. Description of fu.11-scale testing of a functional cast-in-place c ncrctc box culvert is provided . Load dispersion through soi.I is al o discussed. and the relevant AASHTO provisions are reviewed and compared wi th field mea urement · and with theoretica lly predicted value by u ing the Boussine q elasticiry solution. imilar load di tribution characteri ' tic · were bserved in the tran ver e and longitudinal directions. It was further observed that AASHTO's 1.75 distribution factor can be afely applied for fill heights below 2 ft and above 8 ft. Distribution through rigid pavements and culvert top slab are also discu .. ed, and empirical pro edurcs for incorporating their effect in rhc design are presented.
In addition to the pressures induced by soil weight on reinforced concrete box culverts (RCBC), pressures owing to the wheel loads of moving vehicles (live loads) are often an important consideration in their design. The live load contribution to the total pressure on RCBC becomes increasingly important as the depth of cover decreases. To take the live loads (LL) into account when designing RCBC, a reasonably accurate yet practical procedure is needed to predict the effect of those loads.
The problem of LL effects 011 l.Jux culverts may be divided into three separate problems: (a) the distribution of live load through fill; (b) the distribution of live load owing to the rigiuity of the roadway pavement, if any; and (c) the distribution of concentrated loads through the top slab itself.
With regard to the fir ·t problem, AASHTO currently specifies what follows for single spans:
• When the depth of fill is less than 2 ft, the wheel load shall be distributed as in exposed slabs with concentrated loads.
• When the depth of fill is 2 ft or more, concentrated loads shall be distributed over a square with sides equal to 1.75 times the depth of fill.
• When the Lleplh of fill is more than 8 ft, and exceeds the span length for single spans or exceeds the distance between the faces of end supports or abutments for multiple span culverts, the effect of hve load may be neglected.
This treatment is attractive in its simplicity. However, it can result in some inconsistencies at transition heights. For example, use of the AASHTO specification can require an RCBC covered with 8 ft of fill to have thicker walls and more
Department of Civil Engineering, University of Nebraska, Omaha, Neb. 68182.
reinforcement than one with 9 ft of fill (the latter being designed with LL fully ignored). The Nebraska Department of Roads. for this reason currently uses a slightly modified version of the AASHTO procedures.
This study deals primarily with this problem of wheel load distribution through soil and attempts to develop theoretical and experimental data for comparison with the current AASHTO specifications and to provide a smooth transition for the entire range of effective fill heights.
The second problem, pertaining to load distribution through pavement, is not explicitly taken into account by AASHTO. The third problem, pertaining to concentrated load distribution owing to the top slab influence, is considered for exposed slabs only (1). The second and third pr blcms are briefly discussed in this paper, and their significance i · examined. Final recommendations regarding those two problems require further analysis and will be reported at a later date.
BACKGROUND
Very little experimental research has been done on the subject of LL distribution through fill on RCBC structures. A major research program was performed by Texas A & M University (2). The research project included construction and instrumentation of a full-scale 8-ft by 8-ft reinforced concrete box culvert. Pressure measurements were recorded at 2-ft fill increments up to a total of 8 ft above the top slab level. A test vehicle representing the AASHTO alternate interstate design loading (two 24,000-lb axles spaced 4 ft apart) was positioned at various loading stations at each level of fill and pressure measurements recorded . A nonlinear regression analysis was later performed on the data to arrive at an empirical equation that best fit the experimental results. The authors concluded that this empirically determined function agreed well with the data up to 2 ft of fill. A modified form of the Boussinesq equation based on concentrated loads was recommended at fill heights equal to or greater than 4 ft. No specific recommendations were reported for fill heiehts he:tween 2 and 4 ft.
While the idea of curve-fitting, suggested in James and Brown (2), may be attractive from the standpoint of accuracy, the resulting nonlinear pressure distribution highly complicates the analysis and design processes. Further, increased accuracy may not be justified considering the variability of both the magnitude and the distribution of soil pressures under field conditions of mixed traffic and variable axle configuration.

Abdel-Karim et al.
THEORETICAL DISTRIBUTIONS
Theoretical distribution of wheel loads through fill is a problem that has been investigated by a number of researchers (3-5 ,8). As a result, two general solutions are available: closed form and numerical. The characteristics of each approach will be discussed briefly.
Closed-Form Solutions
Closed-form solutions treat soil as a continuum, and the solution is given anywhere in the domain of the problem in equation form. This type of solution is very difficult to obtain for all types of loading and boundary conditions without considerably simplifying the assumptions that can decrease their accuracy appreciably. Assumptions commonly made are pertinent to the stress-strain relations and directional properties of soil. Additionally, assumptions regarding the geometry of the problem domain are also required.
Usually, a closed-form solution is first determined for a single point loading. The principle of superposition is then used to extend this solution to other forms of loading, such as rectangular or circular. The effect of the form of loading on vertical soil pressures was investigated in part in this study, and it was found possible to approximate conservatively standard rectangular wheel loads as point loads whenever the distance to the point of pressure calculation exceeded 5 ft. Beyond this limit the pressures owing to both types of loading were virtually the same (7).
180
180
140
p 110 .. ...... ~ R E 100 8
.· .· .· 8 u 80 R E 80
(P8F) 40
20
0
·. ·.
137
The rigidity caused by the culvert itself in the soil medium was investigated in this study by assuming that the elastic layer, representing the soil cover, was underlain by a rigid base. The calculated pressures were based on charts and tables that account for the three-dimensional distribution effects (5 ,6) and were graphically represented in three-dimensional plots . Sections were passed through the center of the loaded area and resulted in two-dimensional plots. The pressures thus obtained were compared with those calculated by using an elastic half space [Boussinesq, a three-dimensional solution based on the chart given in Figure 3.30 of Poulous and Davis (6, pp. 57)] solution, which ignores the culvert rigidity, and with experimentally determined pressures, as indicated in the example in Figure 1. On the basis of this comparison the Boussinesq solution exhibited better agreement with the experimental data, especially at the higher fill heights. This is probably because of the deflection of the culvert top slab and the overall settlement of the structure, which rests on a granular base (yielding foundation). However , this may not be the case had the foundation been of the nonyielding type. The Boussinesq solution is used throughout this paper and is referred to hereinafter as the theoretical solution.
Numerical Solutions
A notable deficiency in closed-form solutions is their inability to account for material and boundary nonlinearities. However, it is possible to incorporate such nonlinearities into a finite-element formulation with little effort. The key issue is
~, - 4 ..c!:!: /. a:O f-
N
0 I 10 11 IO II LON81TUDINAL DISTANCE, FT
-EXPERIMEN"D'L ·····W/Rl81D •A8E -W/O Rl81D BAH
WHEEL LOAD; FILL HT.• 8.0 FT; P08. 2
FIGURE I Longitudinal pressure distribution at position 2.

138
the creation of an accurate soil model that can adequately describe the soil behavior at all levels of stress and deformation. The correctness of any particular model is best verified through comparison with measured data , and this explains the urgent need for additional full-scale testing of culverts.
DESCRIPTION OF THE EXPERIMENTAL PHASE
Culvert Construction and Instrumentation
The culvert selected for the experimental phase of this study is a double cell cast-in-place reinforced concrete box structure, located on the outskirts of Omaha in Sarpy County, Nebraska. The inside dimensions of each cell are 12 ft x 12 ft. The culvert occurs at a 35 degree skew angle with respect to the roadway. The permanent fill height is 8.5 ft over the top slab but was temporarily raised to 12 ft for testing purposes. The fill consisted of compacted silty clay (loess) with a liquid limit of about 40 and a plasticity index of about 16. Compaction water content was in the range of 21 to 25 percent. Dry densities ranged from 95 to 103 pcf. This exceeded 90 percent of the maximum dry density determined by AASHTO method T-99. Undrained triaxial compression tests of thinwall tube samples taken from the fill indicated that the undrained secant modulus of deformation (determined at one-half maximum deviator stress) was in the range of 250,000 psf to 300,000 psf.
Several types of instrumentation were used for the project including earth pressure cells, strain gauges, piezometers, settlement plates, and deflection measurements . The earthpressure cells used to measure the normal pressure on the surface of the structure were the most important instruments. Research (8) indicated that it is very difficult to obtain data from earth-pressure cell measurements, realistically :t 20 to 40 percent. A careful selection of the most suitable cell was vital to the success of this project.
The following features were identified as the selection criteria (9): (a) the readings should be environmentally stable ; (b) the cell should be very robust; (c) the hysteresis effect should be low to allow for repeated application of loading; (d) the minimum diameter-to-grain size ratio should be 50; and (e) economy, so that a large number could be used . The cell selected was a contact pressure cell manufactured by Geonor (JO) that operates on the vibrating wire principle. The reading accuracy reported by the manufacturer is 0.02 kg/cm 2
(41 psf). The layout of the top slab pressure cells is presented in Figure 2.
Live Load Tests
Eight LL test stations were selected. Five stations were established perpendicular to the longitudinal centerline of the culvert and three stations parallel to the roadway (Figure 3) . Two LL tests were performed: wheel (axle) loads and concentration loads. In the wheel load tests, the rear axle of the test truck (Figure 3) was centered over each of the positions indicated in the figure, and then the instruments were read. In the concentrated load tests, a point load was simulated by
TRANSPORTATION RESEARCH RECORD 1288
Top Slab Plan View
FIGURE 2 Layout of pressure cells.
Direction Parallel to the roadway
6' ~4
·----- -- ·- ·- ·- ·- ·- ·?
T2'
Direction perpendicular Note: to the culvert
e Denotes the position of the centerline of the rear axle
Concrete median barriers
II • •
22,800 lb 4,200 lb r-14.1' -l
Test truck Tire Layout
FIGURE 3 Live load positions and test truck.
N
N
I
6'
T
using a hydraulic jack to transfer the entire axle load through a single 1-ft2 bearing plate. Wheel load tests were performed at fill increments of about 2 ft , and concentrated load tests were run at increments of 4 ft .
A zero reading, indicating the pressures owing to soil only , was taken at all stages of backfill prior to LL testing. The socalled zero LL pressures were subtracted from pressures recorded with the LL in place. The resulting pressures are the net pressures produced by the LL and are referred to hereinafter as LL pressures.
Abdel-Karim et al.
EXPERIMENTAL RESULTS AND COMPARISONS
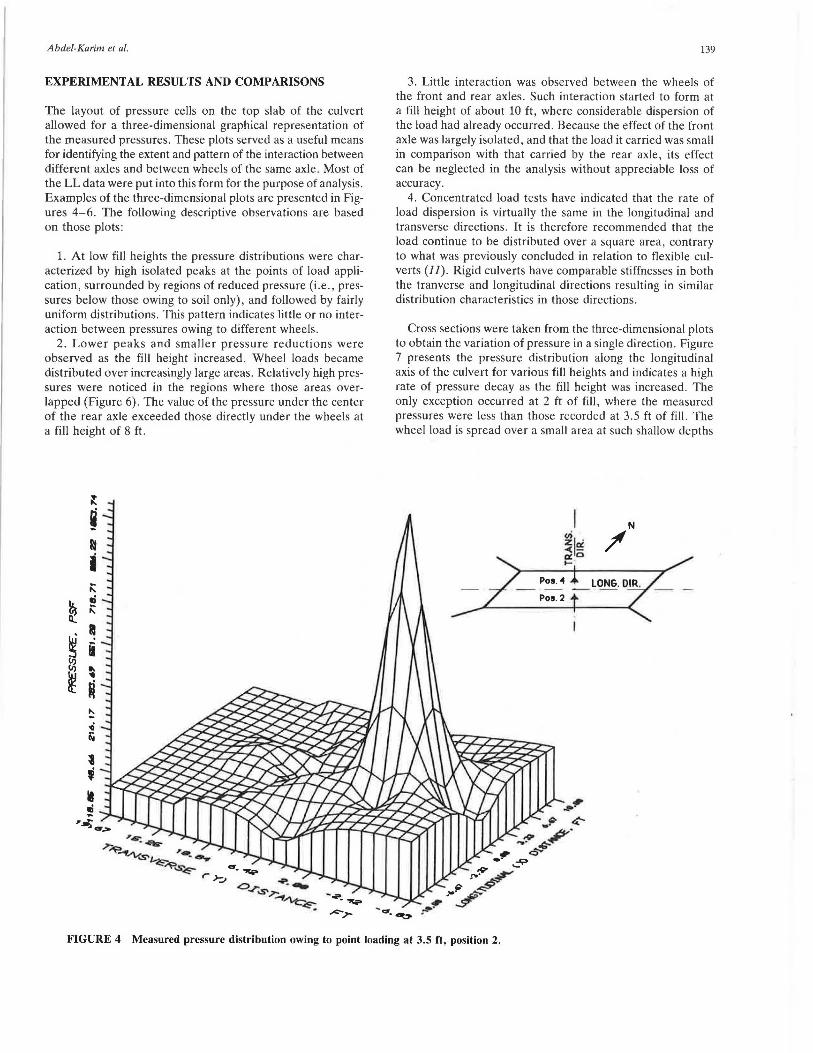
The layout of pressure cells on the top slab of the culvert allowed for a three-dimensional graphical representation of the measured pressures . These plots served as a useful means for identifying the extent and pattern of the interaction between different axles and between wheels of the same axle. Most of the LL data were put into this form for the purpose of analysis. Examples of the three-dimensional plots are presented in Figures 4-6. The following descriptive observations are based on those plots:
1. At low fill heights the pressure distributions were characterized by high isolated peaks at the points of load application, surrounded by regions of reduced pressure (i.e., pressures below those owing to soil only) , and followed by fairly uniform distributions. This pattern indicates little or no interaction between pressures owing to different wheels.
2. Lower peaks and smaller pressure reductions were observed as the fill height increased. Wheel loads became distributed over increasingly large areas . Relatively high pressures were noticed in the regions where those areas overlapped (Figure 6). The value of the pressure under the center of the rear axle exceeded those directly under the wheels at a fill height of 8 ft.
~
~ ~
It
~ ~
i i:;: ti i:;:
I ii .. .. M ~ .. ~
i
' II
139
3. Little interaction was observed between the wheels of the front and rear axles. Such interaction started to form at a fill height of about 10 ft, where considerable dispersion of the load had already occurred. Because the effect of the front axle was largely isolated , and that the load it carried was small in comparison with that carried by the rear axle, its effect can be neglected in the analysis without appreciable Joss of accuracy.
4. Concentrated load tests have indicated that the rate of load dispersion is virtually the same in the longitudinal and transverse directions. It is therefore recommended that the load continue to be distributed over a square area, contrary to what was previously concluded in relation to flexible culverts (1 I). Rigid culverts have comparable stiffnesses in both the tranverse and longitudinal directions resulting in similar distribution characteristics in those directions .
Cross sections were taken from the three-dimensional plots to obtain the variation of pressure in a single direction. Figure 7 presents the pressure distribution along the longitudinal axis of the culvert for various fill heights and indicates a high rate of pressure decay as the fill height was increased. The only exception occurred at 2 ft of fill, where the measured pressures were Jess than those recorded at 3.5 ft of fill. The wheel load is spread over a small area at such shallow depths
~, . 41 -< ~ /' a: O .....
N
FIGURE 4 Measured pressure distribution owing to point loading at 3.5 ft, position 2.

~
i Ill fi " • .
~ i
~ ; Oi
~ ~
~
FIGURE 5 Measured pressure distribution owing to axle loading at 3.5 ft, position 2.
IQ
8 ~ ~ -~
ll> t. ll..
" ~
'II
~ ~ " ~ -lli
~ ~
~ -G
~
FIGURE 6 Measured pressure distribution owing to axle loading at 8 ft, position 2.
~ , . 41 <e: /' a:C I-
~, . 41 < ~ /' a:c 1-·
N
N

Abdel-Karim et al. 141
400
~~ !!'"'
N
/
aoo
p A IOO E 8 8 u A 100 E
(P8F)
0
a • 10 11 10 .. LONQITUDINAL DISTANCE, FT
E 1.0 FT - a.• FT ····· 1.0 FT - a.o FT + 10.0 FT --11.0 FT
WHEEL LOAD; PO&. 4
FIGURE 7 Longitudinal pressure distribution at position 4.
of cover, and its effect diminishes quickly away from the center of the load. The discrepancy is likely to be caused by a slight error in positioning the rear axle of the truck over the desired station, causing considerable reduction in the measured pressures.
The amount and nature of the interaction between wheels is also a function of the fill height. A nearly uniform pressure distribution was obtained at 8 ft of fill (see Figure 7). The measured peak pressure at this height was about 8 percent of the soil pressure. Gilliland (J) suggested that the LL load pressures be neglected if their magnitudes are equal to or less than 10 percent of the corresponding values owing to soil load only.
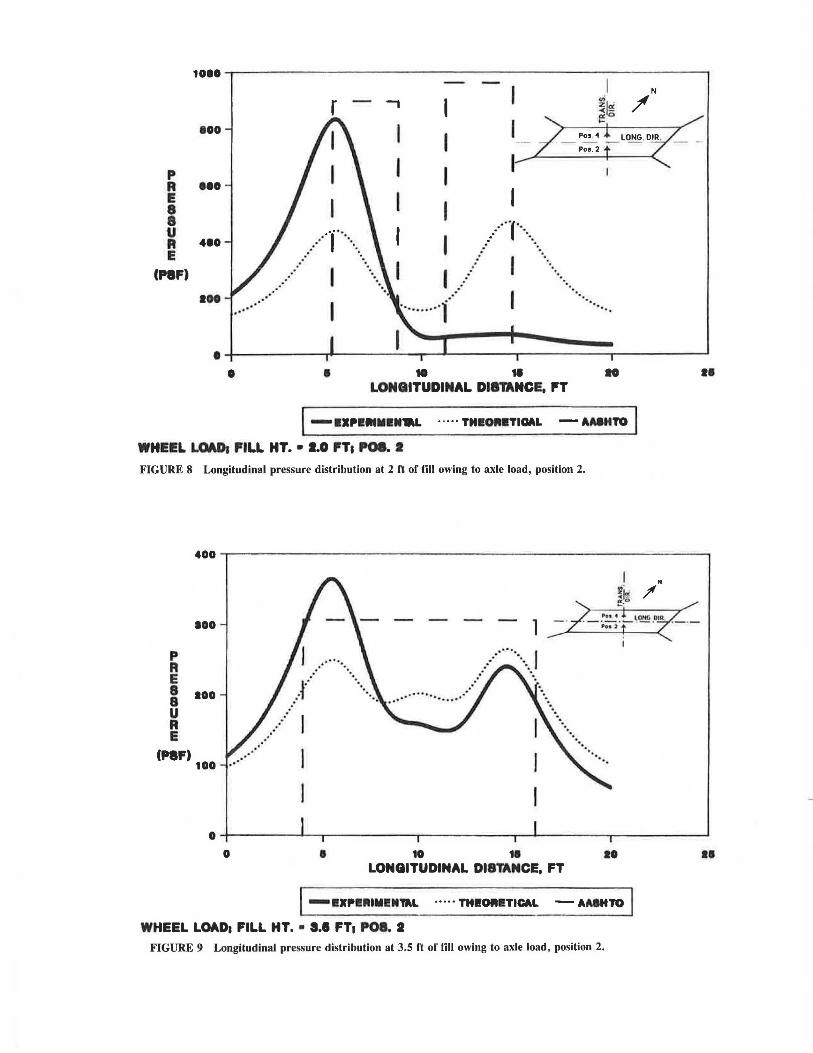
The theoretical and AASHTO pressures are compared with field measurements in Figures 8-11. The theoretical and measured pressures decrease in both horizontal directions and result in a three-dimensional bell-shaped curve for each load. Conversely, the AASHTO distribution is uniform in both directions, corresponding to a truncated pyramid shape. Thus, even though the measured pressures contain higher peaks, AASHTO pressures still conservatively correspond to a larger total load. Also, the difference between the theoretical and measured pressure distributions is within the accuracy of the pressure cells, making the theoretical distribution practically acceptable (see Figures 10 and 11).
Figures 12 and 13 present the transverse and longitudinal pressure distributions owing to point loads. Comparison of the two figures indicates similar distribution patterns in both directions. The smaller peak to the right in Figure 12 correponds to a residual pressure effect caused by a preceding concentrated load test at position 2. Figure 14 compares the
theoretical and AASHTO pressures with field measurements. Although the measured peak pressure is approximately twice as large as the AASHTO values, both distributions seem to be equal to the same total load. This observation is an indication as the validity of the field measurements.
The experimental results in this project indicated that the LL effect beyond 8 ft of fill diminished considerably. Thus, AASHTO's distinction between single- and multi-cell culverts seems to be unnecessary. More important, the data seem to indicate that the use of AASHTO's 1.75 distribution factor is valid regardless of the fill height. The cutoff limit for ignoring the LL pressures should be at a level at which the structural engineer feels that the LL effect is less than, say, 5 percent of the total load effect (shear, moment, etc.).
The measured moments owing to the effect of LL only are compared in Figures 15-18 with those obtained by three different prediction methods by using the FE program CANDE (12,13). In the first method (known as the strip or AASHTO method), the wheel loads are distributed through the soil by using AASHTO's 1.75 factor. The culvert frame is then subjected to two loading stages: the first representing soil load only and the second representing the combined effects of soil and LL. This two-stage loading is necessary owing to the nonlinearities of concrete caused by cracking and other factors. The moments owing to LL only are obtained by subtracting the moments obtained in stage 1 from those of stage 2. The second and third methods are based on an equivalent line load applied to the full mesh representing the entire soilstructure system and boundary conditions (12). In the second method an equivalent line load is found (from the Boussinesq solution) that produces a vertical pressure at the culvert sur-
1000
-, ~, . -< !! a:O
/ .....
800
I Po• 4
Poo. 2
p I I R HO E
I I 8 8 .··r u . .
I . .
A 400 .: · .... E
(P8F) . I I ·. I .
:
100 . .· I •. .. .......... 1 ··· ... ... ··
I 0
• • to • .. LONGITUDINAL Dl8~NCE, FT
I - IXPl!llHl•••L ..... TH•Oll•TIOAL - AMHTO I WHEEL LOAl>a PILL HT.• 1.0 FTs P08. I
FIGURE 8 Longitudinal pressure distribution at 2 ft of fill owing to axle load, position 2.
p A E
IOO
8 IOO 8 u A E
(P8F) 100
0 • 10 1• LONGITUDINAL DISTANCE, FT
IO
I - HPl!llHll!N'ML ..... THl!OIH!TICAL - AMHTO I WHEEL LOAD1 FILL HT.• I.I FT1 P08. I
FIGURE 9 Longitudinal pressure distribution at 3.5 rt of till owing to axle load, position 2.
N
..
II

140
111
100
p R ao E 8 8 u IO R
···· ... ·········..... 11 .. ·· ..
E (P8F) 40
I
IO
0
0 • 10 'HI 10 .. LONGITUDINAL DISTANCE, FT
- l!XPERll1H!N~L · · · · · THl!ORl!TICAL - AAIHTO
WHEEL LOAD; FILL HT .• e.o FT; POI. 2
FIGURE 10 Longitudinal pressure distribution al 8 ft or fill owing to axle load, position 2.
70 I N
eo
IO
p R 40 E .
..... ~1~ /
...... ···· ······... /. ~.. / =· .-- .:~L~~.00 ·-....... .... ·· ··............... -- -- i "'
.... ············· .···_ - - ······~·· ·~···-; ' 8 8 u R
ao E
(P8F) IO
10
0
0 • 10 18 10 .. LONGITUDINAL DISTANCE, FT
I - IXPl!Rllll!N•L ..... THl!ORl!TICAL - AMHTO
WHEEL LOADt FILL HT. • 11.0 FT1 POI. I
FIGURE 11 Longitudinal pressure distribution al 12 fl of fill owing to axle load, position 2.

:::: r -------·----- ----·---------------~
IOO
p
~ IOO 8 8 u 400 A E
(PSF) 200
•200 _,_ _ ___ _ -,-----···--.-------- .,.----.---0 I 10 11 IO 18
POINT LOAD; P08. 4
TRAN8VER8E DISTANCE, FT
i-=:--·- ·- ---·- :-:::1 ~IFT -a.OFT +1~
FIGURE 12 Transverse pressure distribution owing to point loading at position 4.
1IOO
1000
IOO
p R
100 E 8 8 u 400 A E
(P8F) IOO
0
•IOO
.....---- ------·------
0 • ---.-- - ---
10 1•
Pos ~
Pos. 2
LONGITUDINAL DISTANCE, FT
I-•·• PT -a.a PT +11.a PT]
POINT LOAD1 P08. 4
FIGURE 13 Longitudinal pressure distribution owing to axle load at position 4.
N
/
10
ao
..

Abdel-Karim et al.
1100
1000 N
/ IOO
p A
IOO E 8 8 u 400 A E
(PIF) IOO
0
-IOO
0 ' to t• 10 II TAAN8YEA8E DISTANCE, FT
- l!XPl!IHlll!M'aL · · · · · THl!OlllTICAL - AAIHTO
POINT LOAD1 FILL HT.• U FT1 Poa. 4
FIGURE 14 Transverse pressure distribution owing to point loading at position 4.
7 -----I Q. ·-~
0 -c CD E 0 ~
-7
.... .....
/
....... ....
H
.. .....
.... +-----.f-----------"--+---...,,.."""-•---- A Measured ' ....
1 II" O-METH001 ' , ' , ' . ,, ..
•-METH002 -O···METH003
-14-1-~~-.-~~--..--~~....-~~-..-~~~.---~~-r-~~-.-~~----i
-200 -100 0 100 200
Transverse Distance, In.
FIGURE 15 Measured versus predicted live load moments at 2 ft of fill, position 4.
145
ao

------I Q. .¥
-c CD E 0
:::E
Pos . 4
Pos . 2
-?+--------------- ------- - ---- & Measured o-METHOD1 1t'•METHOD2
-<>· .. METHOD 3
-14+-~~--.-~~~..-~~~~~-.-~~~..-~~--.-~~--.~~~
-200 -1 00 0 100 200
Transverse Distance, In.
FIGURE 16 Measured versus predicted live load moments at 3.5 ft of till, position 4.
14 N
Ul l . Jf z"' <( -ir e ....
Po• . 4 7
Pos . 2 ------ __ ....... -. ......... I Q. .-- .... .¥ ,; . "'"'
0 -c CD E 0
:::E & Measured -7 O-METHOD1
1t'•METHOD2
-O···METH003
-14 -200 -1 00 0 100 200
Transverse Distance, in. FIGURE 17 Measured versus predicted live load moments at 6 ft of fill , position 4.

Abdel-Karim et al. 147
N
/ 7 -------' a. ·-~ 0 -c
C» E 0
::E -7 -i-------------------------~ A Measured
-O-METHOD1
•·METH002 -0"' METHOD 3
-14-t-~~-..~~~-.--~~-.-~~~...-~~-..~~~-.-~~-.-~~---1
-200 -1 00 0 100 200
Transverse Distance, in. FIGURE 18 Measured versus predicted live load moments at 8 ft of fill, position 4.
face, directly under the load, equal to the pressure caused by the original load. In the third method (13) the line load is assumed to be equal to the wheel load divided by the axle length (independent of the depth of cover) . A comparison of the moments in the figures tends to favor the third method.
WHEEL LOAD DISTRIBUTION THROUGH PAVEMENT
Pavement, when present, can have a substantial effect on the design of RCBs. The importance attached to the pavement is attributed to its ability to distribute the traffic-induced loads. However, the method and the extent of load distribution are largely dependent on the type of pavement provided. Pavements in general can be classified as either rigid or flexible. Rigid pavements usually consist of a thin layer of high modulus of elasticity material such as portland cement concrete that distributes the load owing to the flexural rigidity of the slab . Flexible pavements consist of one or more layers of a relatively low modulus of elasticity material such as asphalt concrete with or without a stabilized granular base course that distributes the load to the subgrade.
A flexible pavement can reasonably and conservatively be considered as additional fill, ignoring the effect of its higher modulus of elasticity. A rigid pavement can cause considerable spreading of the load owing to its stiffness. Gilliland (1) introduces a simplified procedure to account for this effect. According to this method an equivalent depth of fill is determined that provides approximately the same amount of distribution as does the rigid pavement and the accompanying actual fill. This procedure takes into account the difference
in slab and fill properties by using the factor L, referred to as the radius of relative stiffness, given by
L £h3
12(1 - µ)k
where
E = modulus of elasticity of the pavement (psi), h = thickness of the pavement (in.), µ = Poisson's ratio of the pavement, and k = moqulus of subgrade reaction (pci).
(1)
An extension of the Boussinesq solution was then employed to calculate the pressures owing to a circular load of radius L. The resulting pressures are fairly sensitive to the values of E, h, and k. As a consequence the equivalent fill heights derived for a specific case should be applied only to that case.
As an example, consider a 9-in.-thick concrete pavement (E = 4,000,000 psi, µ = 0.15) overlaying a subgrade fill material (k = 300 psi). The radius of stiffness from Equation 1 is found to be approximately 30 in. The resulting pressures were plotted in Figure 19 with a solid curve for a single 16,000-lb point load and the fill height indicated . Then, by inspection, the fill height that produced a conservative but similar pressure distribution for a single 16,000-lb point load with no pavement was determined and superimposed on the figure with dashed lines. As expected, the pavement causes the pressure distribution curve to be of a relatively flat shape when compared with the bell-shaped distribution with no pavement, the latter being more conservative because it produces higher maximums.

148
0 51
HORIZONTAL SCALE: ~--~
VERTICAL SCALE: O~, ---~~pti
LEGEND•
TRANSPORTATION RESEARCH RECORD 1288
Actual Pressures Equivalent Prenures
16,000lb
*""""W1".'. · . . : .. : "i ;;:;- ,.,.;;:;:;.J·: .; .. ; .. , .. ... . ·.;;1;.-..,,.;r"" • >H >>ECJ)C J ; .. ~ >)J ># }N W W
FILL DEPTH
Z.6Zpai -------~ Z.Olpsi ~ ~
------~----""-----~---..... --........ --~---- o' 4.5'
Z.IZpei ======~:=..::.... l.80pal ~ ~
1' 5'
I. 75psi ======::;;;;;;c::..::-_ _ 1._5_e_p_si---~-=------_ __ 2_--_ ..... _~ _ _ "'_-___;;-;:..m.__ ___ ~ 2 ,
l.26psi l.IOpsi
l.08p1i 0.91psi
0.83psl 0 .66psl
0.66psi 0.48p.aj
=-==----= ---? - =
---
5.5'
6'
4' 6.5°
- 5' 7'
7' a'
9' 9 '
FIGURE 19 Equivalent fill depths for rigid pavements (I).
The distribution for pavement for this specific set of values corresponds approximately to the distribution owing to 4.5 ft of fill alone. Also, the effect of pavement is more pronounced at lower fill heights and eventually dissipates at approximately 9.0 ft of fill. An approximately linear relationship exists between 4.5 and 9.0 ft, resulting in the following relation:
ED = 4.5 + 0.5 x H ~H (2)
where ED and H are the equivalent and actual depths of fill in feet, respectively. This equation is applicable up to an actual fill depth of 9 ft.
Similar analysis can be made for other situations that involve different pavement thicknesses and material properties . The
results can be tabulated in a suitable form and be made available for design purposes. In all cases, however, judgment on the part of the designer is required to determine if the geometry of the culvert-roadway intersection is such that the distribution owing to pavement can be depended on.
BENDING MOMENTS IN SLABS OWING TO PARTIAL LOADING
In addition to the distribution of wheel loads owing to pavement and fill, the top slab of the culvert provides additional distribution owing to its flexural stiffness along the length of the culvert. The current J\.ASHTO specifications address this

Abdel-Karim et al.
type of distribution only when the culvert has less than 2 ft of cover. The top slab is designed for this situation as a concrete slab bending with the wheel load assumed to be distributed over a width E given by (14) :
E = 4 + 0.06 x S :S 7 ft (3)
where E is the effective distribution width (ft) and S is the span (ft). This equation is intended for exposed slabs subjected to wheel loads because it is independent of the area occupied by the load .
AASHTO specifications indicate that from zero to less than 2 ft of fill , the distribution owing to the slab is predominant and that the distribution owing to the fill is negligible. The same E is recommended by AASHTO for fills not greater than 2 ft. For 2 ft or more of fill the distribution of wheel loads owing to fill is predominant and the distribution owing to the slab is negligible. While those assumptions simplify the problem of determining the design moments, the transition at 2 ft of fill results in design discrepancies.
The suggested extension of AASHTO's 1. 75 factor to fill heights less than 2 ft would result in a uniformly loaded square area, or partial loading, corresponding to each wheel load on the slab. This proposal was made to aid in eliminating the design discrepancies through varying fill heights. Because equation 3 is applicable for point loads only, a similar relation for partial loads is needed if the proposed extensions are to be adopted. Figure 20 presents the top slab of a box culvert subjected to a uniformly distributed load p over a square area (b x b). Currently, for fill heights of 2 ft or more, a unit width is passed through the partial loading to calculate the design moment and is referred to as the strip method and completely ignores the distribution owing to the slab and thus overestimates the design moment . This moment , which will be referred to as M .. ,;p, is distributed through a width of b. The actual transverse moment distribution m is given and has a maximum value equal to Mmax· This is the true design moment for which the slab should be designed, provided that Mmax is obtained from the worst loading condition. Msi,;p is greater than Mmax and would result in over design . Also shown in the figure is the moment produced by spreading the load over an effective distribution width E' that produces a design moment equal to Mmax ·
Gilliland (J) used a simplified analysis procedure to determine the magnitude of the distribution owing to the top slab. Ratios of Mm • .f Mw;p were determined for several culvert sizes and boundary conditions for both positive and negative moments . The analysis was repeated for various fill heights and support conditions, and the results are plotted in Figure 21. Gilliland proposed the following relation between Mmax and Msrc;p:
C = 0.10 + 0.45 x H
c = 1.0
H < 2 ft
H 2: 2 ft (4)
where C is moment coefficient, M.,,jM,";r and His the fill height (ft). This equation is similar to Equation 3, proposed by AASHTO for point loads , but is valid for batch loading generated from dispersion through fill of point or other loads. The coefficient C can be thought of as the inverse of the
149
LOAD
( bl Tran1nne Dl1tributlan of Moment Due ta Partial Loadin9
FIGURE 20 Bending moments in slabs owing to partial loading.
equivalent width. LL moments based on the strip and suggested methods are compared with the measured values in Figure 22, for 0-ft fill height. The figure clearly indicates the advantage of using the suggested method.
CONCLUSIONS
1. The Boussinesq (three-dimensional) elasticity solution has been shown to give reasonable predictions of the measured soil pressures owing to wheel loads. While this method provides a powerful analytical tool, its use for everyday design is not convenient. A simple uniform distribution such as that suggested by AASHTO can be used without appreciable loss of accuracy.
2. The AASHTO 1.75 distribution factor can be safely used for fill heights less than 2 ft and more than 8 ft.
3. The measured LL pressures at fill heights of 8 ft or more may become exceedingly small when compared with the soilinduced pressures. However, the cutoff limit beyond which LL pressures can be safely ignored should be determined by the structural designer on the basis of the pressure contribution to the total load effects. A suggested criterion for neglecting LL effects (shear, moment, etc.) is when those effects contribute less than 5 percent of the total load effects.
4. Similar load distributions were observed in the longitudinal and transverse directions . It is therefore recommended

1.18
C • I.. U1 + I.. .45ttH , H < 2. B fl. C • 1.1 , H >- 2. B f! .
• 88
.88
• 211
1
FIU 1£IGlff CH>, fl.
FIGURE 21 Moment coefficients versus fill heights (1) .
--...... --I
2
vii . Zrc < (1. 0 I-
LEGEND. 12 f! •lllfll• epan 6 f! •tmpl• .,,..,,
8 fl ft*ld, poet!tve 6 fl ft*ld, negaltv•
Pr-OfWd
N
/f
a. 4+-~~~~_..~.,.___.,__-o-~~~~~~~~~~~~~~~--1
~
-c • E 0
:::&
-O-STFllP METHOD
-O·· · 9.D?ESTED -e+-~~-.-~~~~~~~~~--~~~~~~~~~--.-~~---1
-200 -100 0 100 2op
Transverse Distance, In.
FIGURE 22 Comparison of strip and suggested live load moments with field measurements.

Abdel-Karim et al.
that the distribution of the load over a square area be continued.
5. Two other factors, besides soil fill, aid in dispersing wheel load effects through the culvert: pavement and distribution through the two-way action of the culvert top slab itself.
6. Rigid pavements can help distribute wheel loads considerably, especially when soil fill height is relatively small. A procedure is outlined to determine equivalent fill height to pavements of certain properties.
7. AASHTO recognizes the ability of exposed slabs to distribute wheel loads by means of an equivalent width E. This study extends the equivalent width concept for slabs covered with soil to provide for a smooth transition of wheel load effects for various soil fill heights.
ACKNOWLEDGMENTS
Sponsors of the project are the FHWA, Nebraska Department of Roads (NDOR), and the University of NebraskaLincoln. Many individuals have contributed to the various phases of this project. Special thanks are due to George Schmid, Paul Koenig, Dalyce Ronnau, Wayne Horn, Tom Goodbarn, and Jerry Koloen, all of NDOR; to Ron Rystrom, Sarpy County Engineer; and to Dallas Meyer , Karen Bexten, and Say-Gunn Low.
REFERENCES
1. M. K. Gilliland, Cost-Effective Concrete Box Culvert Design. Masters thesis. University of Nebraska-Lincoln, 1986.
2. Ray W. James and Dale E. Brown. Wheel-Load-Induced Earth Pressures on Box Culverts. In Transportation Research Record
151
1129, TRB, National Research Council, Washington, D.C., 1987, pp . 55-62.
3. M. G. Spangler and R. L. Handy. Soil Engineering, 4th ed., Harper and Row, New York, 1982.
4. E. J. Yoder and M. H. Witczak . Principles of Pavement Design, John Wiley, New York, pp. 13-28.
5. D. M. Burmister. Stress and Displacement Characteristics of a Two-Layer Rigid Base Soil System: Influence Diagram and Practical Applications. HRB Proc., Vol. 35, 1956, pp. 773-813.
6. H. G. Poulos and E. H. Davis. Elastic Solutions for Soil and Rock Mechanics, John Wiley, New York, 1974.
7. M. K. Tadros and J. V. Benak. Load Distribution on Box Culverts, Research Report, Nebraska Department of Roads, Aug. 1989.
8. R. E. Davis, F. M. Semans, D. W. Spannagel, and A. E. Bacher. Rigid Pipe Proof Testing Under Excess Overfills With Varying Backfill Parameters, 1, Introduction, Historical Background, Project Discussion, and Instrumentation , California Department of Transportation, FHWA/CA/SD-78/02, FHWA, Department of Transportation, 1978.
9. D . W. Meyer. Instrumentation and Analysis of A Full-Scale Concrete Box Culvert. Masters thesis. University of NebraskaLincoln, 1987.
10. Product Literature, Geonor-USA, Clifton, N.J., 1986. 11. G. Abdel-Sayed and B. Bakht . Analysis of Live-Load Effects in
Soil-Steel Structures, Transportation Research Record 878, TRB, National Research Council, Washington, D .C., 1982, pp. 49-55.
12. M. G. Katona , and J. M. Smith , CAN DE User Manual. Report FHWA-RD-77-6, FHWA, Department of Transportation , Oct. 1976.
13. M. G. Katona et al. CANDE-1980: Box Culverts and Soil Models. Report FHWA/RD-80/172, FHWA, Department of Transportation, May 1981.
14. H. M. Westergaard, Computation of Stresses in Bridge Slabs Due to Wheel Loads. Public Roads, Vol. 2, No. 1, March 1930.
Publication of this paper sponsored by Committee on Subsurface Soi/Structure Interaction.