livelihood implications of in situ-on farm conservation ... · livelihood implications of in...
TRANSCRIPT

Livelihood implications of in situ-on farm conservationstrategies of fruit species in Uzbekistan
Elisabetta Gotor . Mauricio R. Bellon . Muhabbat Turdieva .
Karim Baymetov . Parhod Nazarov . Elena Dorohova-Shreder .
Vladislav Arzumanov . Mikhail Dzavakyants . Abduvahob Abdurasulov .
Galina Chernova . Eugeniy Butkov . Francesco Caracciolo
Received: 13 July 2015 / Accepted: 18 December 2016
� The Author(s) 2017. This article is published with open access at Springerlink.com
Abstract The aim of this paper is to analyze the
impact of a set of interventions related to on-farm/
in situ conservation and use of fruit species (cultivated
and wild) on farmers’ livelihoods and species diversity
in Central Asia. Specifically, a difference-in-differ-
ences propensity score matching is used to evaluate
the outcome of a development research program in
Uzbekistan between 2005 and 2010. Species crop
diversity maintained by farmers before and after the
project increased as a result of the interventions,
showing the efficacy of the interventions promoted by
the projects in terms of conservation. Furthermore,
innovations provided by the program increased both
household propensity of marketing and self-consump-
tion of target fruit. However, the program’s interven-
tions did not seem to impact significantly any of the
indicators related to household livelihoods. The short
time elapsed between the end of the project and the
impact assessment may be too brief to capture any
observable impact on livelihoods.
Keywords Agro-biodiversity � On-farm
conservation � Fruit species � Livelihood � Impact
assessment
Introduction
1.4 billion people depend directly on forest products
for some portion of their livelihoods and household
consumables (World Bank 2008)—and thousands of
tree species are instrumental to global diets, health,
shelter, fuel and incomes of the world’s poor (Arnold
et al. 2011). In some settings, products from forests
account for a higher proportion of livelihood and
income benefits than does agriculture (Leakey et al.
2005).
Central Asia is considered a centre of origin and
diversity for many globally-important temperate fruit
tree species. According to Vavilov (1931), Central
Asia is the richest region in specific and intraspecific
diversity and belongs to one of the five most important
E. Gotor � M. R. Bellon � M. Turdieva
Bioversity International, Rome, Italy
K. Baymetov � P. Nazarov
Uzbek Research Institute of Plant Industry, Tashkent,
Uzbekistan
E. Dorohova-Shreder � V. Arzumanov �M. Dzavakyants � A. Abdurasulov
Uzbek Research Institute of Horticulture, Viticulture and
Wine-making, Tashkent, Uzbekistan
G. Chernova � E. Butkov
Uzbek Republican Research and Production Centre of
Ornamental Gardening and Forestry, Tashkent,
Uzbekistan
F. Caracciolo (&)
Department of Agricultural Sciences, University of
Naples, Via Universita 96, 80055 Portici, Naples, Italy
e-mail: [email protected]
123
Agroforest Syst
DOI 10.1007/s10457-017-0069-6
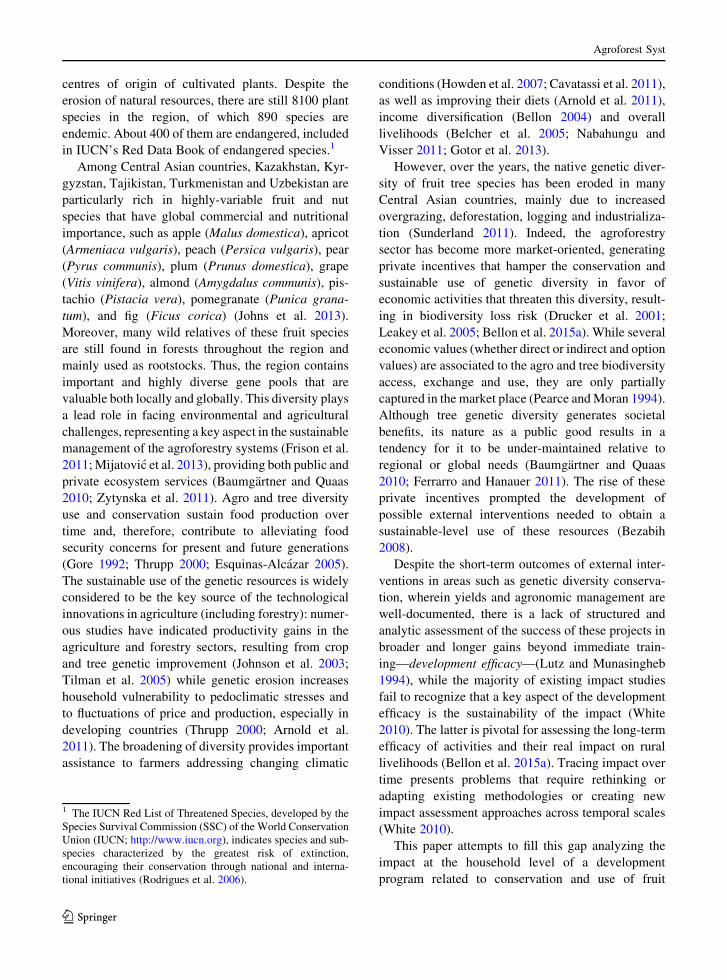
centres of origin of cultivated plants. Despite the
erosion of natural resources, there are still 8100 plant
species in the region, of which 890 species are
endemic. About 400 of them are endangered, included
in IUCN’s Red Data Book of endangered species.1
Among Central Asian countries, Kazakhstan, Kyr-
gyzstan, Tajikistan, Turkmenistan and Uzbekistan are
particularly rich in highly-variable fruit and nut
species that have global commercial and nutritional
importance, such as apple (Malus domestica), apricot
(Armeniaca vulgaris), peach (Persica vulgaris), pear
(Pyrus communis), plum (Prunus domestica), grape
(Vitis vinifera), almond (Amygdalus communis), pis-
tachio (Pistacia vera), pomegranate (Punica grana-
tum), and fig (Ficus corica) (Johns et al. 2013).
Moreover, many wild relatives of these fruit species
are still found in forests throughout the region and
mainly used as rootstocks. Thus, the region contains
important and highly diverse gene pools that are
valuable both locally and globally. This diversity plays
a lead role in facing environmental and agricultural
challenges, representing a key aspect in the sustainable
management of the agroforestry systems (Frison et al.
2011; Mijatovic et al. 2013), providing both public and
private ecosystem services (Baumgartner and Quaas
2010; Zytynska et al. 2011). Agro and tree diversity
use and conservation sustain food production over
time and, therefore, contribute to alleviating food
security concerns for present and future generations
(Gore 1992; Thrupp 2000; Esquinas-Alcazar 2005).
The sustainable use of the genetic resources is widely
considered to be the key source of the technological
innovations in agriculture (including forestry): numer-
ous studies have indicated productivity gains in the
agriculture and forestry sectors, resulting from crop
and tree genetic improvement (Johnson et al. 2003;
Tilman et al. 2005) while genetic erosion increases
household vulnerability to pedoclimatic stresses and
to fluctuations of price and production, especially in
developing countries (Thrupp 2000; Arnold et al.
2011). The broadening of diversity provides important
assistance to farmers addressing changing climatic
conditions (Howden et al. 2007; Cavatassi et al. 2011),
as well as improving their diets (Arnold et al. 2011),
income diversification (Bellon 2004) and overall
livelihoods (Belcher et al. 2005; Nabahungu and
Visser 2011; Gotor et al. 2013).
However, over the years, the native genetic diver-
sity of fruit tree species has been eroded in many
Central Asian countries, mainly due to increased
overgrazing, deforestation, logging and industrializa-
tion (Sunderland 2011). Indeed, the agroforestry
sector has become more market-oriented, generating
private incentives that hamper the conservation and
sustainable use of genetic diversity in favor of
economic activities that threaten this diversity, result-
ing in biodiversity loss risk (Drucker et al. 2001;
Leakey et al. 2005; Bellon et al. 2015a). While several
economic values (whether direct or indirect and option
values) are associated to the agro and tree biodiversity
access, exchange and use, they are only partially
captured in the market place (Pearce and Moran 1994).
Although tree genetic diversity generates societal
benefits, its nature as a public good results in a
tendency for it to be under-maintained relative to
regional or global needs (Baumgartner and Quaas
2010; Ferrarro and Hanauer 2011). The rise of these
private incentives prompted the development of
possible external interventions needed to obtain a
sustainable-level use of these resources (Bezabih
2008).
Despite the short-term outcomes of external inter-
ventions in areas such as genetic diversity conserva-
tion, wherein yields and agronomic management are
well-documented, there is a lack of structured and
analytic assessment of the success of these projects in
broader and longer gains beyond immediate train-
ing—development efficacy—(Lutz and Munasingheb
1994), while the majority of existing impact studies
fail to recognize that a key aspect of the development
efficacy is the sustainability of the impact (White
2010). The latter is pivotal for assessing the long-term
efficacy of activities and their real impact on rural
livelihoods (Bellon et al. 2015a). Tracing impact over
time presents problems that require rethinking or
adapting existing methodologies or creating new
impact assessment approaches across temporal scales
(White 2010).
This paper attempts to fill this gap analyzing the
impact at the household level of a development
program related to conservation and use of fruit
1 The IUCN Red List of Threatened Species, developed by the
Species Survival Commission (SSC) of the World Conservation
Union (IUCN; http://www.iucn.org), indicates species and sub-
species characterized by the greatest risk of extinction,
encouraging their conservation through national and interna-
tional initiatives (Rodrigues et al. 2006).
Agroforest Syst
123

species (cultivated and wild relatives) in Central Asia,
and specifically in Uzbekistan. The research-for-
development programme on in situ/on-farm conser-
vation and use of fruit species in Uzbekistan analysed
in this paper was initiated in 2005. The programme,
financially supported by UNEP-GEF, was part of a
larger framework of multi-country research projects in
Kazakhstan, Kyrgyzstan, Tajikistan, Turkmenistan,
and Uzbekistan aimed at promoting the conservation
of genetic diversity and sustainable use of horticultural
crops and fruit species.
As documented by Bellon et al. (2015a, b) an
effective development program should provide inter-
ventions with the purpose of creating private incen-
tives for farmers (through the transfer of technologies,
practices, skills etc.) to continue maintaining on-farm
diversity beyond the end of the project activities. A
well-informed and trained farmer should, in fact, can
improve his/her income and livelihood opportunities
while contributing to the conservation and improve-
ment of the resources he/she has access to (Nabahungu
and Visser 2011).
This paper thus assesses the effects of the inter-
ventions in the areas of the chain of processes for
enhancing use/consumption of fruit species (cultivated
and wild) improving their marketing value and
enhancing household food security and livelihoods.
More in detail, a difference-in-differences propensity
score matching is used to assess the impact of
household participation in development programs on
conservation and use of fruit tree species. Thus, the
robustness of the implemented statistical method may
contribute to the discussion of the utility and sound-
ness of quasi-experimental approaches in this area of
investigation, where randomized control trials are not
feasible, since self-selection, households motivation,
and capacity to participate are key elements of the
process that need to be explicitly considered (Barrett
and Carter 2010).
The remainder of the document is organized as
follows: ‘‘Program description and conceptual frame-
work’’ section illustrates program activities and the
conceptual approach followed in this study. ‘‘Method-
ology’’ section describes the data sources and the
empirical strategy used in the investigation, while
program impact estimates are discussed in ‘‘Results’’
section. ‘‘Conclusion’’ section concludes by summa-
rizing findings and discussing implications for the
conservation of fruit tree species in the future.
Program description and conceptual framework
The development program on fruit tree diversity
analyzed in this paper was implemented over a period
of five years between 2005 and 2010. The program
was a part of a larger framework of a multi-country
research UNEP-GEF project, emerging from the need
to test a comprehensive framework for sustainable
conservation and use of fruit (cultivated and wild) and
horticulture crops with a livelihoods perspective. In
order to be effective and leave a sustainable impact on
people’s livelihoods, the promotion of agricultural
biodiversity needs to be based on holistic approaches,
be highly participatory, apply gender-sensitive inter-
ventions and pursue inter-disciplinary close collabo-
rations (Padulosi et al. 2014).
The program aimed at ensuring that farmers,
institutes, and local communities were provided with
the knowledge, methodologies, and policies to con-
serve and use in situ fruit species in Central Asia.2 Key
project objectives were to: (1) provide options to
policy-makers for strengthening legal and policy
frameworks; (2) assess, document, and manage local
varieties of wild fruit species sustainably; (3) promote
broad stakeholder participation, representative deci-
sion-making, and strong partnerships among them;
and (4) strengthen the capacity to implement all
aspects of fruit species genetic diversity conservation
at local, national and regional levels. Specifically, the
program aimed to strengthen the capacity of farmers in
agronomic techniques, improving their access to
varieties through nurseries and pushing for benefit-
sharing policies. At the same time the program
facilitated the development of policy in support of
the sustainable management of fruit tree genetic
diversity (cultivated and wild), the participation of
farmers and local communities in conservation, and
the improved capacity of stakeholders to implement
legal, scientific, and social aspects of fruit species
genetic diversity conservation (Fig. 1). Thus, the
implemented program followed a holistic approach,
implementing an array of several types of activities
tailored to different stakeholders and levels of the
2 Local communities are composed by several farmers orga-
nized around an association or organization. Not all farmers
belong to a community. Program beneficiaries are primarily
smallholders’ farmers whose incomes derive mainly from agro-
forestry activities.
Agroforest Syst
123

Fig. 1 Project areas of interventions and list of activities
Agroforest Syst
123
production system. The program addressed different
aspects of the production consumption and marketing
of targeted fruit species, providing diverse pathways
for create private incentives for households to con-
tinue to preserve and use fruit diversity, and related
practices under varying conditions. Moreover, the use
of a basket of activities offers diverse alternatives to
households, some of which may be more relevant than
others, conditional on households’ specific needs.
The target sites and the selected species were
identified though a series of multi-stakeholder consul-
tations undertaken in the 2005. The target sites were
chosen on the basis of their being representative of the
beneficiary groups, as well as the socio-economic,
cultural and geographic contexts surrounding target
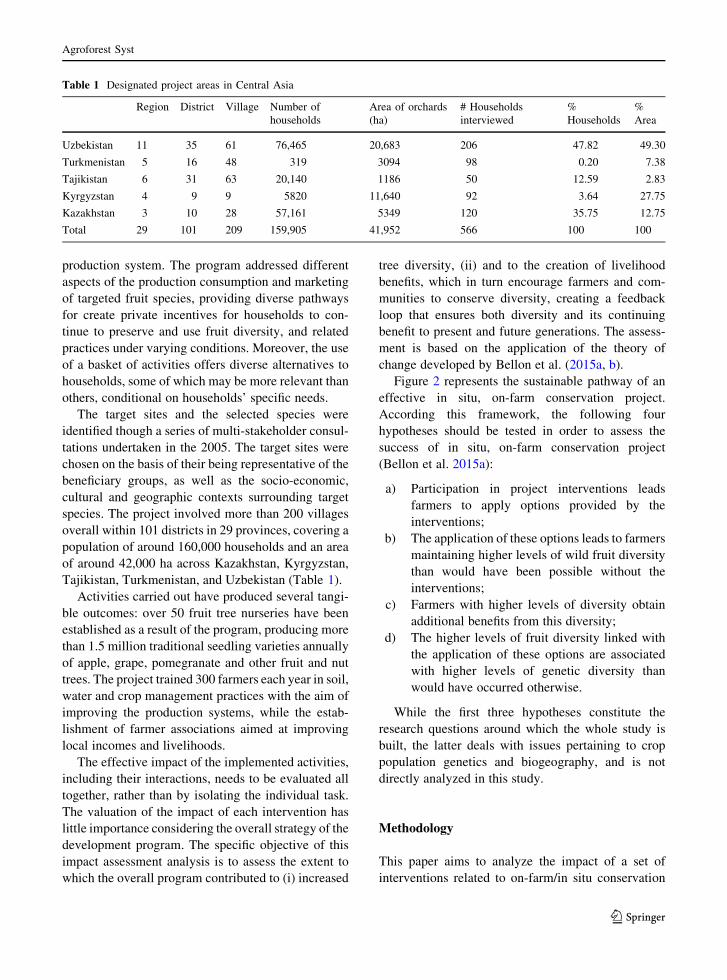
species. The project involved more than 200 villages
overall within 101 districts in 29 provinces, covering a
population of around 160,000 households and an area
of around 42,000 ha across Kazakhstan, Kyrgyzstan,
Tajikistan, Turkmenistan, and Uzbekistan (Table 1).
Activities carried out have produced several tangi-
ble outcomes: over 50 fruit tree nurseries have been
established as a result of the program, producing more
than 1.5 million traditional seedling varieties annually
of apple, grape, pomegranate and other fruit and nut
trees. The project trained 300 farmers each year in soil,
water and crop management practices with the aim of
improving the production systems, while the estab-
lishment of farmer associations aimed at improving
local incomes and livelihoods.
The effective impact of the implemented activities,
including their interactions, needs to be evaluated all
together, rather than by isolating the individual task.
The valuation of the impact of each intervention has
little importance considering the overall strategy of the
development program. The specific objective of this
impact assessment analysis is to assess the extent to
which the overall program contributed to (i) increased
tree diversity, (ii) and to the creation of livelihood
benefits, which in turn encourage farmers and com-
munities to conserve diversity, creating a feedback
loop that ensures both diversity and its continuing
benefit to present and future generations. The assess-
ment is based on the application of the theory of
change developed by Bellon et al. (2015a, b).
Figure 2 represents the sustainable pathway of an
effective in situ, on-farm conservation project.
According this framework, the following four
hypotheses should be tested in order to assess the
success of in situ, on-farm conservation project
(Bellon et al. 2015a):
a) Participation in project interventions leads
farmers to apply options provided by the
interventions;
b) The application of these options leads to farmers
maintaining higher levels of wild fruit diversity
than would have been possible without the
interventions;
c) Farmers with higher levels of diversity obtain
additional benefits from this diversity;
d) The higher levels of fruit diversity linked with
the application of these options are associated
with higher levels of genetic diversity than
would have occurred otherwise.
While the first three hypotheses constitute the
research questions around which the whole study is
built, the latter deals with issues pertaining to crop
population genetics and biogeography, and is not
directly analyzed in this study.
Methodology
This paper aims to analyze the impact of a set of
interventions related to on-farm/in situ conservation
Table 1 Designated project areas in Central Asia
Region District Village Number of
households
Area of orchards
(ha)
# Households
interviewed
%
Households
%
Area
Uzbekistan 11 35 61 76,465 20,683 206 47.82 49.30
Turkmenistan 5 16 48 319 3094 98 0.20 7.38
Tajikistan 6 31 63 20,140 1186 50 12.59 2.83
Kyrgyzstan 4 9 9 5820 11,640 92 3.64 27.75
Kazakhstan 3 10 28 57,161 5349 120 35.75 12.75
Total 29 101 209 159,905 41,952 566 100 100
Agroforest Syst
123

and use of wild fruit species on farmer livelihoods in
Central Asia, specifically in Uzbekistan. More specif-
ically, in order to appropriately answer the above-
mentioned research hypotheses, a quantitative analy-
sis is performed, aiming to provide the following two
outputs:
1) Evidence of whether the application of project
activities leads to an increase in in situ diversity;
2) Evidence of the extent to which the application
of project activities, through the conservation of
diversity in situ, contributes to the improvement
of household livelihoods.
These outcomes must take place at household level
in order to highlight the causal relations between the
participation in project activities and their measurable
impact on the individuals. Providing statistically-
significant evidence of project impact is necessary to
deal with program evaluation challenges and to
successfully assess these outcomes (Barrett and Carter
2010; Gotor et al. 2013). However, this task faces the
common quandaries of ex-post evaluation studies with
non-experimental design (Lewis et al. 2011): The
challenges regard the correct identification of the real
causal impact of a project within the context of
observational data, due to the potential presence of
endogeneity, sample selection bias and other con-
founding effects (Bellon et al. 2015b). However, many
technical options exist to address these problems
including, amongst others, propensity score matching
and difference-in-difference methodologies (Guo and
Fraser 2010) that were jointly used in this analysis.
Statistical evidence of a treatment effect will be given
by comparing outcomes (or inter-temporal changes in
outcomes) of households participating in the program
activities with a counterfactual given by a control group
drawn from households that did not participate. More in
detail, the estimation of causal effects by difference-in-
difference methods (DID) (Card and Krueger 1994) is
performed by comparing inter-temporal changes in the
outcomes from ‘‘baseline’’ to ‘‘endline’’ between house-
holds participating in project activities and those not
participating. This procedure entails the collection of data
before the start of the project (baseline, collected in 2005)
and after its completion (endline, collected in 2013).
The first step entails the definition of fruit diversity
and livelihood outcomes that project interventions
were (ex-post) expected to achieve, and developing
measurable indicators of those outcomes. These mea-
sures have to be case-specific and functionally consis-
tent with the project aim. On-farm diversity will be
measured at household level using the species richness
(R), Simpson index of diversity (D) and Equitability3
(E) (Peet 1974). In particular, they are defined as:
i) Richness (Rh), for the h-household, count of
different species of fruit;
ii) Simpson index of diversity (Dh), for the h-
household Dh ¼ 1PRh
i¼1p2hi
where phi is the land
Fig. 2 The effectiveness of an on-farm conservation project
3 Equitability identifies the relative abundance of the different
fruit species representing the richness of the household land. For
example, a farm dominated by one or two species is less diverse
than one in which many different species have a similar
frequency distribution (evenness).
Agroforest Syst
123

under cultivation for the i- fruit species for the
h-household.
iii) Equitability (Eh): for the h-household
Eh ¼ Dh � 1Rh
.
As concerns outcomes related to the household
wellbeing, livelihood indicators have been identified
from the theoretical framework developed by the
program coordinator at the beginning of the implemen-
tation of the activities, tailoring standard survey instru-
ments usually used by the practitioners and researchers to
analyze livelihood outcomes (Hong et al. 2006; Bellon
et al. 2016; Schnitzer 2016) to the socio-economic
context. Four livelihood measures were defined:
a) Self- consumption (SCh), for the h-household it
measures the share of fruit production for self-
consumption;
b) Marketing (MKh), for the h-household it indi-
cates the share of fruit production sold through
the market;
c) Livestock index (LIh): for theh-household it proxies
the ownership of different livestock species;
d) Appliance index (AIh): it proxies the presence/
availability of different appliances (i.e. tv-color,
dvd, personal computer) into the h-
household.
Once the outcomes are measured, the impact of the
program can be assessed as the variation in outcomes that
can attributed to the interventions. The DID estimator is
given by the b parameter interpreted as follows:
b ¼ YT11 � YT0
1
� �� YT1
0 � YT00
� �ð1Þ
with Y1T1 is the outcome potentially associable to the
project measured at the ‘‘endline’’, for the participants
households, Y0T1 the outcome for the households non
participants, Y1T0 and Y0
T0 are the outcomes measured
at the baseline for respectively the participants and not
participants. Parameters b can be estimated from the
following weighted least squares regression estima-
tion (WLS):
DYh ¼ a þ bWh þ eh ð2Þ
where for the h-th individual, DYh is the difference of
the outcome measured at the endline minus the initial
value of the outcome measured at the ‘‘baseline’’,
while Wh = 1 for project participants households and
Wh = 0 for non participants.
Following (Heckman et al. 1998) in this study, we
employ the conditional difference-in- differences
estimator by defining outcomes conditional on the
pre-treatment characteristics (Xh) of the households
for controlling for other confounding effects, and
using weights derived from the Kernel Propensity
Score Matching (Guo and Fraser 2010) for controlling
the source of inconsistency given by potential selec-
tion bias.
DYh ¼ a þ cXh þ bWh þ eh ð3Þ
As previously stated, the project involved overall
more 200 villages within the 101 districts in 29
provinces, covering a population of around 160,000
households and an area of around 42,000 ha across
Kazakhstan, Kyrgyzstan, Tajikistan, Turkmenistan,
Uzbekistan.
As regards the impact assessment study, Uzbek-
istan was selected not only for the country importance
in terms of households and area covered by the project
but also according the size of the data sample and the
quality of the collected information. Table 2 presents
the characteristics of the project sites selected in
Uzbekistan.
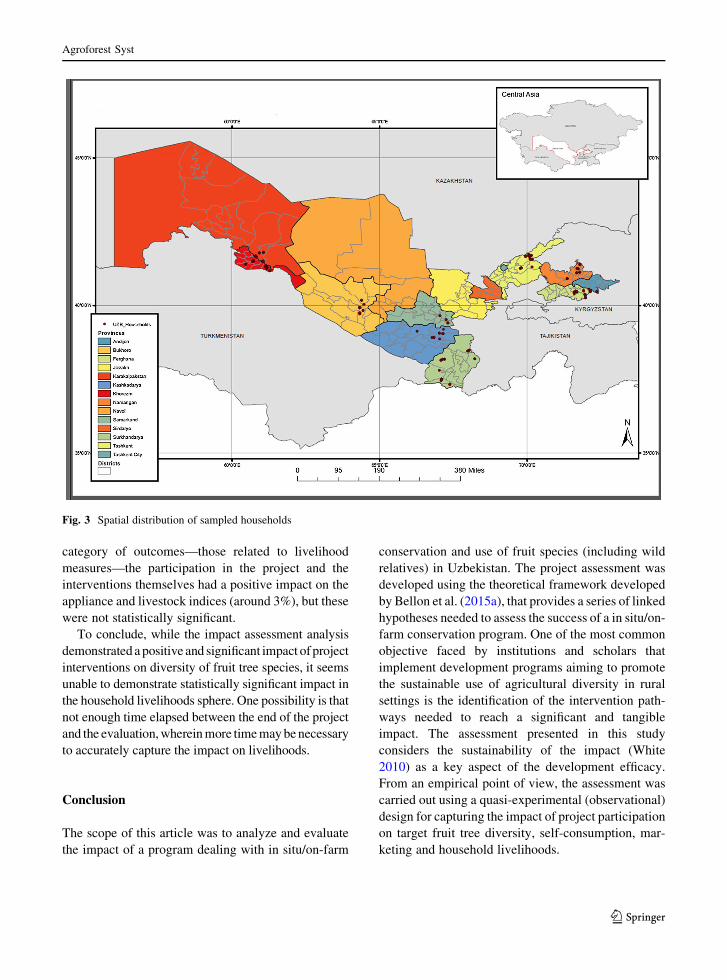
In Uzbekistan two household surveys were carried
out, one of which was a baseline survey. Trained
project staff interviewed a total of 206 households
divided by those that were randomly selected for the
upcoming participation to the program (participation
to the program was open to all households and
participation was voluntary) and those that were not.4
The second survey ended after the project comple-
tion, where the same households interviewed in the
baseline were interviewed again. However, some
slight differences in terms of the number of house-
holds interviewed in the two rounds exist due to the
fact that not all households could be interviewed
again, since they had either moved from the com-
munity or were simply unavailable. Only 141 house-
holds were in both rounds (baseline and endline).
Figure 3 shows the spatial distribution of the sampled
households.
4 This group serves as controls and it was drawn randomly from
a list of all households within the same village who did not
participate in the program.
Agroforest Syst
123

Tables 3 and 4 summarizes socio-demographic
characteristics of the two groups of households,
participants and non-participants. Generic information
on the household head (including age, sex, education),
the household (including the number of individuals,
residence and home garden ownership) and farm
characteristics (including land area, altitude, and
tractor availability) were included.
Results
A participation model was used to calculate for each h-
households the propensity scores p(Zh) or the condi-
tional probability of participated (or propensity score):
p Zhð Þ ¼ Prob Wh ¼ 1ð Þ ¼ FðZh; hÞ þ uh ð4Þ
where h is the parameters vector of the participation
model, and Wh = 1 if the h-th household participates
in the program or Wh = 0 if it does not participate.
The most frequently used functional forms for F are
the normal or logistic probability distribution func-
tions (Guo and Fraser 2010). The propensity scores is
here estimated p(Zh) using a logit model with the
dependent variable coded as 1 for participant house-
holds and 0 for non-participants.
As concerns the Zh vector, all the explanatory
variables which could be used to motivate the
household decision to participate in the program were
included. However, only variables considered statis-
tically significant (at least 10%) were kept in the
model to ensure the best model fit (Table 5).
Land areas in hectares, the availability of a tractor,
are all factors positively influencing participation,
while land ownership negatively influences project
participation. As concerns age, the model found the
existence of a non-linear (quadratic) relation Fig. ( 4).
According to the sample data collected, several
wild fruit species are cultivated and maintained by
farmers. Apricot is the most frequent fruit, and it is
cultivated by more than 40% of the interviewed
households. Other widely-cultivated fruits include
grape, pear, pomegranate, fig and alycha (with a
frequency bigger than 10%) Fig. ( 5).
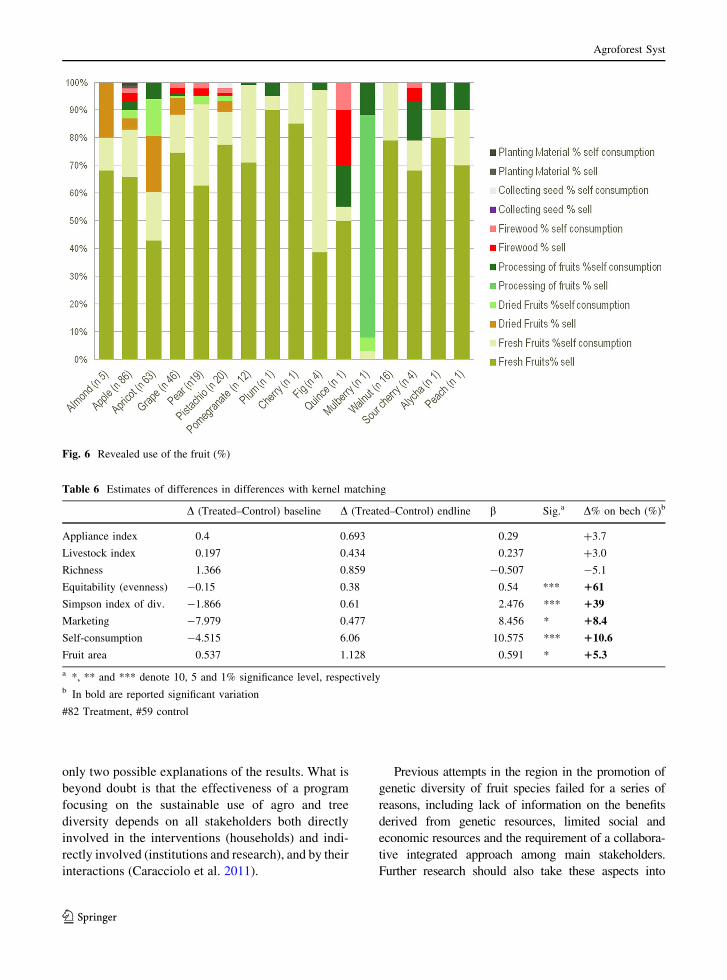
As concerns the use of the target wild fruits, fresh
fruit marketing and self-consumption are the most
frequent uses for all the cultivated species, with the
exclusion of the mulberry where the processing of the
fruits exceeds other types of valorization Fig. 6.
Table 6 reports the estimate of parameters bmeasuring the impact at household level of the project
for the different outcomes implemented (see appendix
1 for technical details): results strongly support the
hypothesis that the participation to the activities
implemented by the project had a positive and
significant effect on two of the three indices measuring
the species diversity of wild fruit. More specifically,
the results show a positive effect of the application of
interventions on Equitability (Evenness) and Simpson
Index of Diversity, increasing respectively ?61 and
?39%. The area cultivated in targeted fruits, as well as
the consumption and marketing thereof also increased,
by 5.3 and 10% respectively. As concerns the second
Table 2 Description of
UNEP-GEF project sites in
Uzbekistan
Region Number of
villages
Area of Orchard
(ha)
Number of
Households
Agro-Ecological
zone
Andijan 2 513 992 Irrigated
Bukhara 3 531 5209 Irrigated
Fergana 2 365 4496 Irrigated
Jizak 5 274 1930 Rainfed
Karakalpakstan 2 205 4015 Irrigated
Kashkadarya 1 150 447 Rainfed
Khorezm 3 523 9413 Irrigated
Namangan 3 2284 4983 Irrigated
Samarkand 10 3609 12,728 Rainfed
Surkhandarya 20 6627 18,714 Irrigated
Tashkent 11 5602 13,538 Rainfed
Agroforest Syst
123
category of outcomes—those related to livelihood
measures—the participation in the project and the
interventions themselves had a positive impact on the
appliance and livestock indices (around 3%), but these
were not statistically significant.
To conclude, while the impact assessment analysis
demonstrated a positive and significant impact of project
interventions on diversity of fruit tree species, it seems
unable to demonstrate statistically significant impact in
the household livelihoods sphere. One possibility is that
not enough time elapsed between the end of the project
and the evaluation, wherein more time may be necessary
to accurately capture the impact on livelihoods.
Conclusion
The scope of this article was to analyze and evaluate
the impact of a program dealing with in situ/on-farm
conservation and use of fruit species (including wild
relatives) in Uzbekistan. The project assessment was
developed using the theoretical framework developed
by Bellon et al. (2015a), that provides a series of linked
hypotheses needed to assess the success of a in situ/on-
farm conservation program. One of the most common
objective faced by institutions and scholars that
implement development programs aiming to promote
the sustainable use of agricultural diversity in rural
settings is the identification of the intervention path-
ways needed to reach a significant and tangible
impact. The assessment presented in this study
considers the sustainability of the impact (White
2010) as a key aspect of the development efficacy.
From an empirical point of view, the assessment was
carried out using a quasi-experimental (observational)
design for capturing the impact of project participation
on target fruit tree diversity, self-consumption, mar-
keting and household livelihoods.
Fig. 3 Spatial distribution of sampled households
Agroforest Syst
123
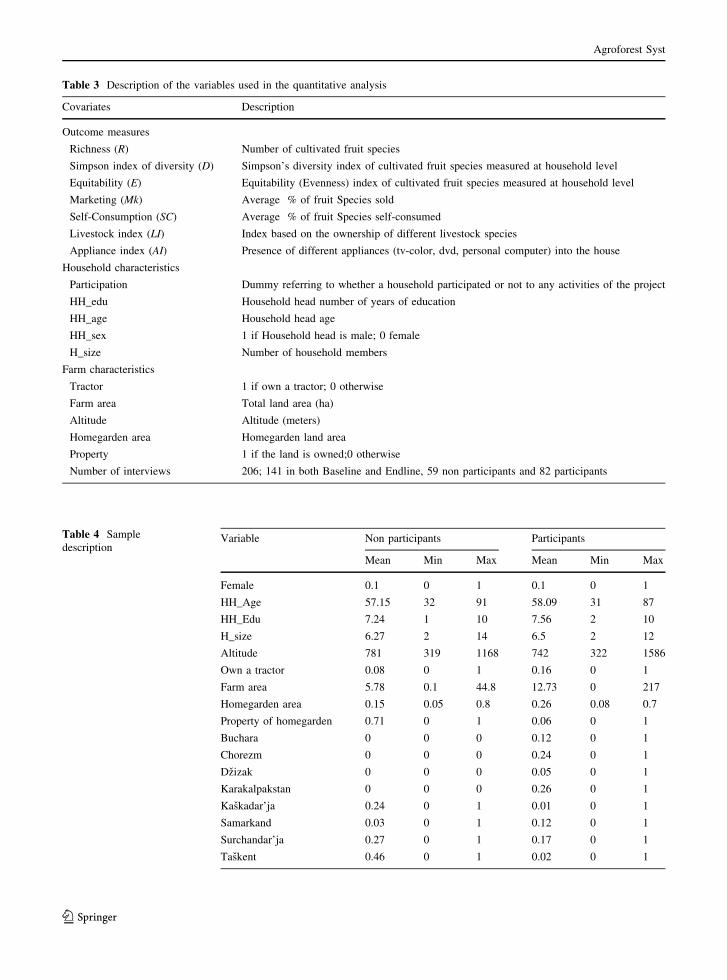
Table 3 Description of the variables used in the quantitative analysis
Covariates Description
Outcome measures
Richness (R) Number of cultivated fruit species
Simpson index of diversity (D) Simpson’s diversity index of cultivated fruit species measured at household level
Equitability (E) Equitability (Evenness) index of cultivated fruit species measured at household level
Marketing (Mk) Average % of fruit Species sold
Self-Consumption (SC) Average % of fruit Species self-consumed
Livestock index (LI) Index based on the ownership of different livestock species
Appliance index (AI) Presence of different appliances (tv-color, dvd, personal computer) into the house
Household characteristics
Participation Dummy referring to whether a household participated or not to any activities of the project
HH_edu Household head number of years of education
HH_age Household head age
HH_sex 1 if Household head is male; 0 female
H_size Number of household members
Farm characteristics
Tractor 1 if own a tractor; 0 otherwise
Farm area Total land area (ha)
Altitude Altitude (meters)
Homegarden area Homegarden land area
Property 1 if the land is owned;0 otherwise
Number of interviews 206; 141 in both Baseline and Endline, 59 non participants and 82 participants
Table 4 Sample
descriptionVariable Non participants Participants
Mean Min Max Mean Min Max
Female 0.1 0 1 0.1 0 1
HH_Age 57.15 32 91 58.09 31 87
HH_Edu 7.24 1 10 7.56 2 10
H_size 6.27 2 14 6.5 2 12
Altitude 781 319 1168 742 322 1586
Own a tractor 0.08 0 1 0.16 0 1
Farm area 5.78 0.1 44.8 12.73 0 217
Homegarden area 0.15 0.05 0.8 0.26 0.08 0.7
Property of homegarden 0.71 0 1 0.06 0 1
Buchara 0 0 0 0.12 0 1
Chorezm 0 0 0 0.24 0 1
Dzizak 0 0 0 0.05 0 1
Karakalpakstan 0 0 0 0.26 0 1
Kaskadar’ja 0.24 0 1 0.01 0 1
Samarkand 0.03 0 1 0.12 0 1
Surchandar’ja 0.27 0 1 0.17 0 1
Taskent 0.46 0 1 0.02 0 1
Agroforest Syst
123

Based on the quantitative results of this study, the
following conclusions can be summarized: species
crop diversity maintained by farmers before and after
the project increased as a result of the interventions.
An increase in the Simpson index of diversity (?39%)
and Equitability index (?61%) were demonstrated, a
clear sign of the value of the intervention promoted by
the projects. These results are not unexpected, as the
program under investigation was specifically designed
to promote the conservation and use of wild fruit
diversity. However, an understanding of the extent of
this impact, and its statistical validation is important.
Moreover, this outcome can be considered in order to
provide useful insights about the effectiveness of
different interventions to policymakers. As discussed
by Bellon et al. (2015b) an effective and sustainable
program for supporting farmers to maintain in situ/on-
farm diversity on-farm has to generate positive
livelihood outcomes as well. Estimates show that
participation in the UNEP-GEF program increased
both household propensity of marketing (?8%) and
self-consumption of target wild fruit (?11%). While
higher and more reliable levels of consumption and/or
marketing of these fruits are relevant prerequisites to
generating benefits from the wild fruit diversity for
farmers, no significant impact was observed in broader
livelihood outcomes. Indeed, in terms of outcomes
related to livelihood measures, participation in the
program showed only a small positive impact on the
appliance of asset-based indicators of wealth and
livestock (?3%). But this observable impact was not
statistically significant. Two possible explanations of
this lack of observable evidence of program impact is
the short time elapsed between the end of the project
and the impact assessment, likely too brief to capture
the impact on livelihoods and the sample size too
small to evaluate the outcome. However, these are
Table 5 Project participation model
Z Coef. (h) Sig
HH_age 0.271 ***
HH_Age2 -0.002 ***
Samarkand 1.336 **
Surchandar’ja -1.431 ***
Tractor 0.374 **
Farm area 0.015 *
Property -3.175 ***
_cons -6.519 ***
*, ** and *** denote 10, 5 and 1% significance level,
respectively
0.2
.4.6
.8
Hou
seho
ld p
roba
bilit
y to
join
to th
e Pr
ojec
t
20 40 60 80 100Age
.5.6
.7.8
.91
Hou
seho
ld P
roba
bilit
y to
Join
the
Proj
ect
0 20 40 60 80 100Farm size (hectares)
Fig. 4 Estimated relationship between age, farm size and household probability to participate in the project
Fig. 5 Relative frequency of fruit presence among the inter-
viewed households
Agroforest Syst
123
only two possible explanations of the results. What is
beyond doubt is that the effectiveness of a program
focusing on the sustainable use of agro and tree
diversity depends on all stakeholders both directly
involved in the interventions (households) and indi-
rectly involved (institutions and research), and by their
interactions (Caracciolo et al. 2011).
Previous attempts in the region in the promotion of
genetic diversity of fruit species failed for a series of
reasons, including lack of information on the benefits
derived from genetic resources, limited social and
economic resources and the requirement of a collabora-
tive integrated approach among main stakeholders.
Further research should also take these aspects into
Fig. 6 Revealed use of the fruit (%)
Table 6 Estimates of differences in differences with kernel matching
D (Treated–Control) baseline D (Treated–Control) endline b Sig.a D% on bech (%)b
Appliance index 0.4 0.693 0.29 ?3.7
Livestock index 0.197 0.434 0.237 ?3.0
Richness 1.366 0.859 -0.507 -5.1
Equitability (evenness) -0.15 0.38 0.54 *** 161
Simpson index of div. -1.866 0.61 2.476 *** 139
Marketing -7.979 0.477 8.456 * 18.4
Self-consumption -4.515 6.06 10.575 *** 110.6
Fruit area 0.537 1.128 0.591 * 15.3
a *, ** and *** denote 10, 5 and 1% significance level, respectivelyb In bold are reported significant variation
#82 Treatment, #59 control
Agroforest Syst
123

account. Finally, recommendations can be made on the
applicability and generalizability (external validity) of
these findings. Generalizability cannot be addressed
trying to apply the same interventions and associated
activities over many villages and households, but rather
needs a critical re-organization and contextualization of
the interventions in which diverse activities are assem-
bled and targeted to fit different contexts, letting house-
holds select which ones fit best under their own situations.
This also means that self-selection, households motiva-
tion, and capacity to participate are key elements of the
process that need to be explicitly considered.
Author contributions Conceptualization: E.G., M.R.B.,
M.T., F,C; Survey development: E.G., M.R.B., M.T., K.B.,
P.N., E.D., V.A., M.D., A.A., G.C., E.B.; Data collection M.T.,
K.B., P.N., E.D., V.A., M.D., A.A., G.C., E.B.; Methodology:
E.G., M.R.B., F.C. Analysis & Interpretation of data: F.C., E.G.;
Writing—original draft: E.G.. F.C.; Writing— review &
editing: E.G., F.C.
Open Access This article is distributed under the terms of the
Creative Commons Attribution 4.0 International License (http://
creativecommons.org/licenses/by/4.0/), which permits unre-
stricted use, distribution, and reproduction in any medium,
provided you give appropriate credit to the original
author(s) and the source, provide a link to the Creative Com-
mons license, and indicate if changes were made.
Appendix 1
Given two groups treated, and control, respectively of
T and C households the statistics reported in Table 6
refer to: (D Treated-Control) Richness:
XT
h¼1
Rh2TT
�XC
h¼1
Rh2CC
(D Treated-Control) Simpson index of diversity
XT
h¼1
Dh2TT
�XC
h¼1
Dh2CC
(D Treated-Control) Equitability
XT
h¼1
Eh2TT
�XC
h¼1
Eh2CC
References
Arnold M, Powell B, Shanley P, Sunderland TCH (2011) Edi-
torial: forests, biodiversity and food security. Int For Rev
13(3):259–264
Barrett C, Carter MR (2010) The power and pitfalls of experi-
ments in development economics: some non-random
reflections. Appl Econ Perspect Policy 32(4):515–548
Baumgartner S, Quaas MF (2010) Managing increasing envi-
ronmental risks through agrobiodiversity and agrienvi-
ronmental policies. Agric Econ 41(5):483–496
Belcher B, Ruiz-Perez M, Achdiawan R (2005) Global patterns
and trends in the use and management of commercial
NTFPs: implications for livelihoods and conservation.
World Dev 33:1435–1452
Bellon MR (2004) Conceptualizing interventions to support on-
farm genetic resource conservation. World Dev
32(1):159–172
Bellon M, Gotor E, Caracciolo F (2015a) Conserving landraces
and improving livelihoods: how to assess the success of on-
farm conservation projects? Int j Agric Sustain
13(2):167–182
Bellon M, Gotor E, Caracciolo F (2015b) Assessing the effec-
tiveness of projects supporting on-farm conservation of
native crops: evidence from the high andes of South
America. World Dev 70:162–176
Bellon M, Ntandou-Bouzitou G, Caracciolo F (2016) On-Farm
diversity and market participation are positively associated
with dietary diversity of rural mothers in Southern Benin,
West Africa. PLoS ONE 11(9):e0162535
Bezabih M (2008) Agrobiodiversity conservation under an
imperfect seed system: the role of community seed banking
schemes. Agric Econ 38(1):77–87
Caracciolo F, Gorgitano MT, Lombardi P, Sannino G, Verneau
F (2011) Responsibility and sustainability in a food chain: a
priority matrix analysis. Int J Food Syst Dyn 2(3):292–304
Card D, Krueger A (1994) Minimum wages and employment: a
case study of the fast-food industry in New Jersey and
Pennsylvania. Am Econ Rev 84(4):772–793
Cavatassi R, Lipper L, Narloch U (2011) Modern variety
adoption and risk management in drought prone areas:
insights from the sorghum farmers of eastern Ethiopia.
Agric Econ 42:279–292
Drucker AG, Gomez V, Anderson S (2001) The economic
valuation of farm animal genetic resources: a survey of
available methods. Ecol Econ 36:1–18
Esquinas-Alcazar J (2005) Protecting crop genetic diversity for
food security: political, ethical and technical challenges.
Nat Rev Genet 6(12):946–953
Ferrarro PJ, Hanauer MM (2011) Protecting ecosystems and
alleviating poverty with parks and reserves: ‘‘win-win’’ or
tradeoffs? Environ Resour Econ 48:269–286
Frison E, Cherfas J, Hodgkin T (2011) Agricultural biodiversity
is essential for a sustainable improvement in food and
nutrition security. Sustainability 3(1):238–253
Gore A (1992) Earth in the balance: ecology and the human
spirit. Houghton Mifflin, Boston
Gotor E, Caracciolo F, Canto GMB, Al Nusairi M (2013)
Improving rural livelihoods through the conservation and
use of underutilized species: evidence from a community
research project in Yemen. Int J Agri Sustain
11(4):347–362
Guo S, Fraser MW (2010) Propensity score analysis: statistical
methods and applications. SAGE Publications, Thousands
Oaks. ISBN 978-1-4129-5356-6
Agroforest Syst
123

Heckman JJ, Ichimura H, Todd P (1998) Matching as an
econometric evaluation estimator. Rev Econ Stud
65(2):261–294
Hong R, Banta JE, Betancourt JA (2006) Relationship between
household wealth inequality and chronic childhood under-
nutrition in Bangladesh. Int J Equity Health 5(1):1
Howden SM, Soussana JF, Tubiello FN, Chhetri N, Dunlop M,
Meinke H (2007) Adapting agriculture to climate change.
Proc Natl Acad Sci USA 104:19691–19696
Johns T, Powell B, Maundu P, Eyzaguirre PB (2013) Agricul-
tural biodiversity as a link between traditional food systems
and contemporary development, social integrity and eco-
logical health. J Sci Food Agric 93(14):3433–3442
Johnson NL, Pachico D, Voysest O (2003) The distribution of
benefits from public international germplasm banks: the
case of beans in Latin America. Agric Econ 29:277–286
Leakey RR, Tchoundjeu Z, Schreckenberg K, Shackleton SE,
Shackleton CM (2005) Agroforestry tree products
(AFTPs): targeting poverty reduction and enhanced
livelihoods. Int J Agric Sustain 3(1):1–23
Lewis D, Bell SD, Fay J, Bothi KL, Gatere L, Kabila M,
Mukamba M, Matokwani E, Mushimbalume M, Moraru
CI, Lehmann J, Lassoie J, Wolfe D, Lee DR, Buck L,
Travis AJ (2011) Community markets for conservation
(COMACO) links biodiversity conservation with sustain-
able improvements in livelihoods and food production.
Proc Nat Acad Sci 108 (34):13957–13962
Lutz E, Munasingheb M (1994) Integration of environmental
concerns into economic analyses of projects and policies in
an operational context. Ecol Econ 10:37–46
Mijatovic D, Van Oudenhoven F, Eyzaguirre P, Hodgkin T
(2013) The role of agricultural biodiversity in strengthen-
ing resilience to climate change: towards an analytical
framework. Int J Agric Sustain 12(2):95–107
Nabahungu NL, Visser SM (2011) Contribution of wetland
agriculture to farmers’ livelihood in Rwanda. Ecol Econ
71:4–12
Padulosi S, Amaya K, Jager M, Gotor E, Rojas W, Valdivia R
(2014) A holistic approach to enhance the use of neglected
and underutilized species: the case of Andean grains in
Bolivia and Peru. Sustainability 6(3):1283–1312
Pearce D, Moran D (1994) The economic value of biodiversity.
IUCN, London
Peet RK (1974) The measurement of species diversity. Annu
Rev Ecol Syst 5:285–307
Rodrigues ASL, Pilgrim JD, Lamoreux JF, Hoffmann M,
Brooks TM (2006) The value of the IUCN Red List for
conservation. Trends Ecol Evol 21(2):71–76
Schnitzer P (2016) How to target households in adaptive social
protection systems?: Relative efficiency of proxy means
test and household economy analysis in Niger. Social
Protection and Labor Discussion Paper, No. 1612. World
Bank, Washington, DC
Sunderland TCH (2011) Food security: why is biodiversity
important? Int For Rev 13(3):265–274
Thrupp LA (2000) Linking agricultural biodiversity and food
security: the valuable role of agrobiodiversity for sustain-
able agriculture. Int Aff 76:283–297
Tilman D, Polasky S, Lehman C (2005) Diversity, productivity
and temporal stability in the economies of humans and
nature. J Environ Econ Manag 49:405–426
Vavilov NI (1931) The role of Central Asia in the origin of
cultivated plants. Bull Appl Bot 26(3):3–44
White H (2010) A contribution to current debates in impact
evaluation. Evaluation 16(2):153–164
World Bank, 2008. Forests sourcebook: practical guidance for
sustaining forests in development cooperation. Washing-
ton, DC. https://openknowledge.worldbank.org/handle/
10986/6455
Zytynska SE, Fay MF, Penney D, Preziosi RF (2011) Genetic
variation in a tropical tree species influences the associated
epiphytic plant and invertebrate communities in a complex
forest ecosystem. Philos Transact R Soc B
366(1569):1329–1336
Agroforest Syst
123