liver stiffness measurement ( fibroscan ® ) principles - indications - results - limitations
DESCRIPTION
Liver stiffness measurement ( Fibroscan ® ) Principles - indications - results - limitations . Samir Haffar M.D. Assistant Professor of Gastroenterology. Clinical Examination. Blood markers. Biological work-up. Fibrose. FibroScan ®. Hepatic biopsy. Imaging (US, MRI, endoscopy). - PowerPoint PPT PresentationTRANSCRIPT
Liver stiffness measurement (Fibroscan®)Principles - indications - results - limitations
Samir Haffar M.D.Assistant Professor of Gastroenterology
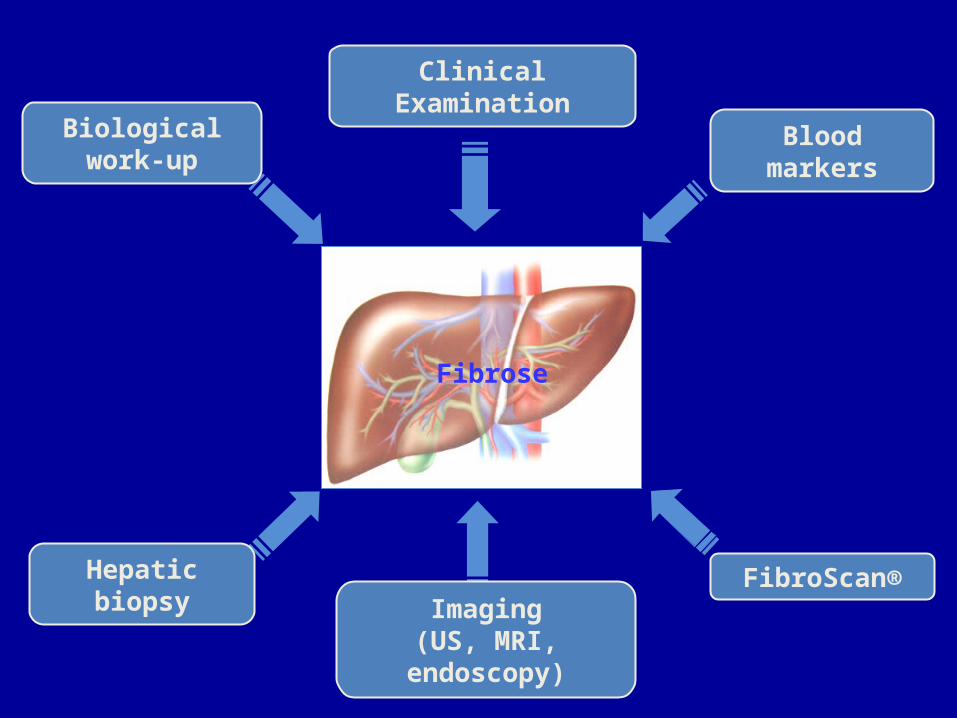
Fibrose
Blood markers
FibroScan®
Imaging(US, MRI, endoscopy)
Hepatic biopsy
Biological work-up
Clinical Examination
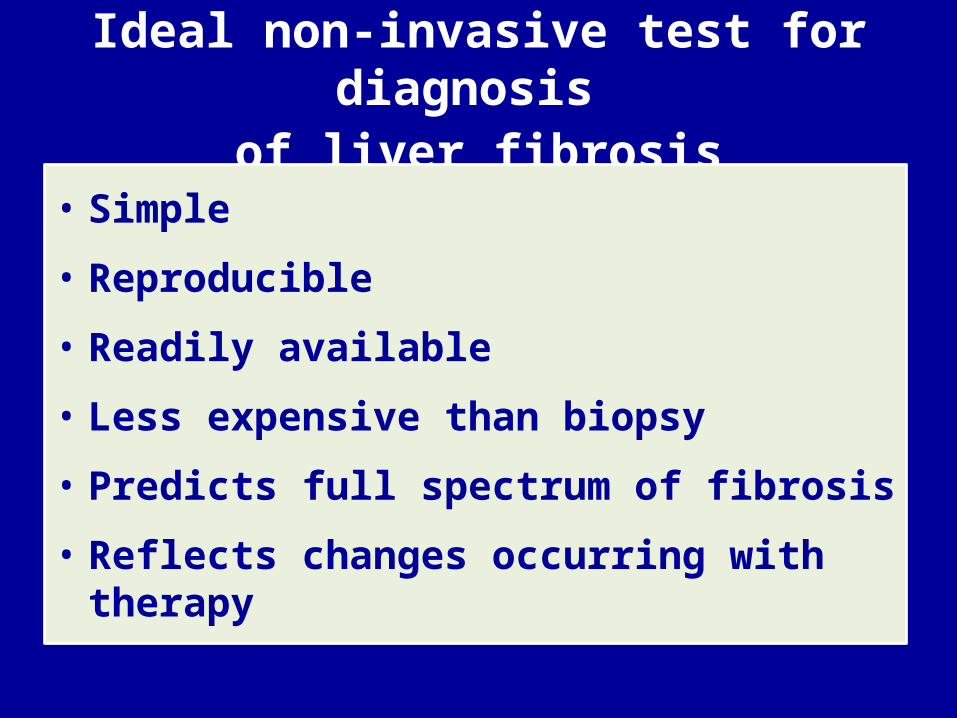
Ideal non-invasive test for diagnosis of liver fibrosis
• Simple
• Reproducible
• Readily available
• Less expensive than biopsy
• Predicts full spectrum of fibrosis
• Reflects changes occurring with therapy
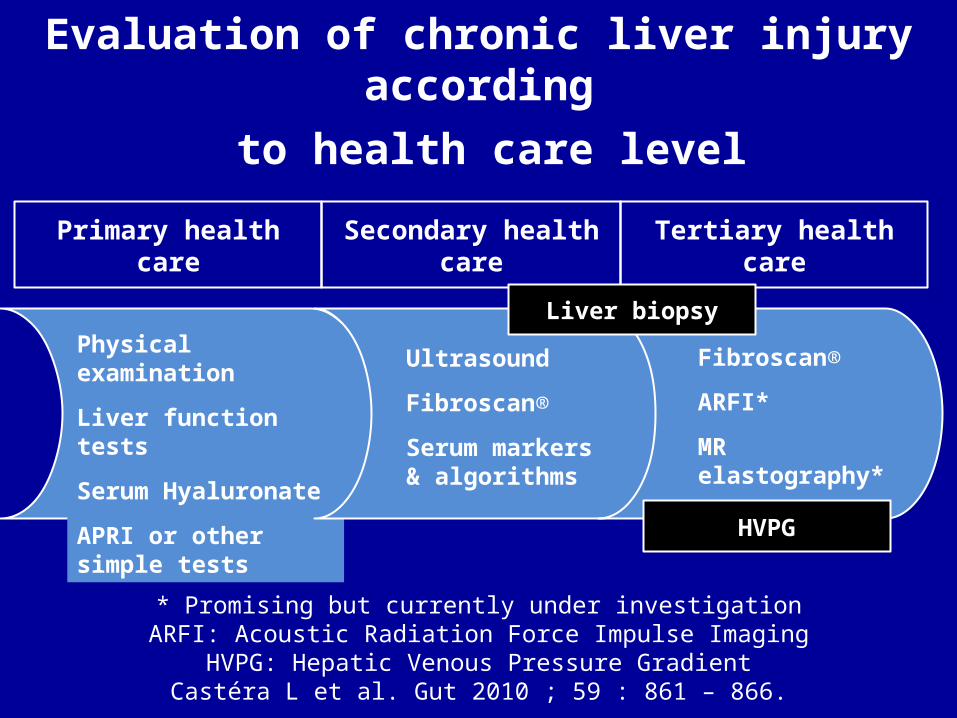
Evaluation of chronic liver injury according to health care level
Physical examination
Liver function tests
Serum Hyaluronate
APRI or other simple tests
Primary health care
Ultrasound
Fibroscan®
Serum markers & algorithms
Secondary health care
Fibroscan®
ARFI*
MR elastography*
Tertiary health care
Liver biopsy
HVPG
* Promising but currently under investigationARFI: Acoustic Radiation Force Impulse Imaging
HVPG: Hepatic Venous Pressure GradientCastéra L et al. Gut 2010 ; 59 : 861 – 866.
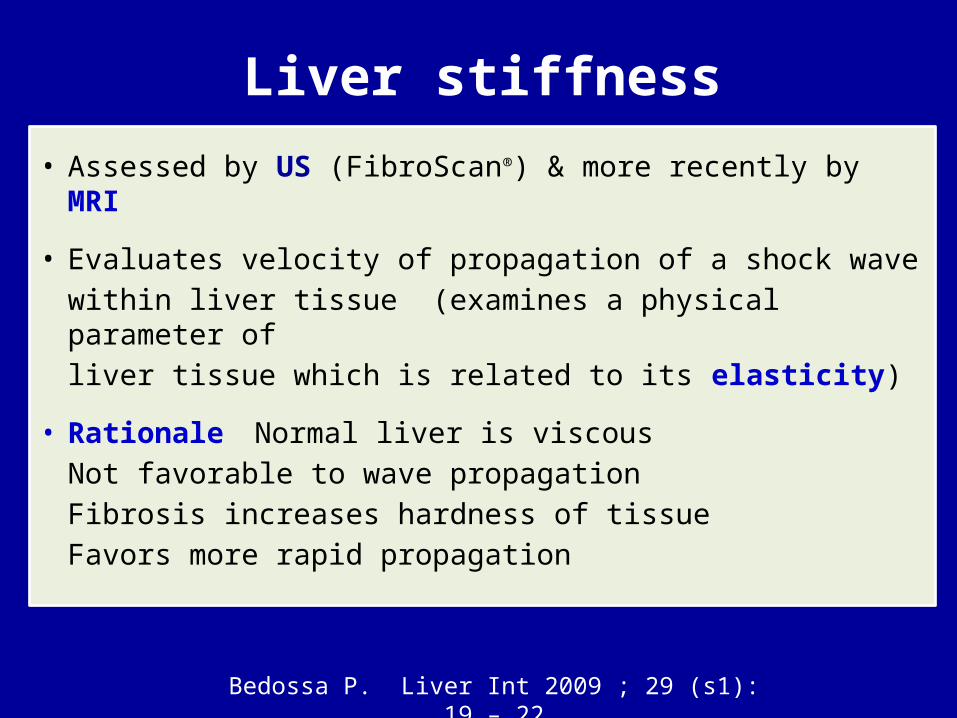
Liver stiffness
• Assessed by US (FibroScan®) & more recently by MRI
• Evaluates velocity of propagation of a shock wavewithin liver tissue (examines a physical parameter ofliver tissue which is related to its elasticity)
• Rationale Normal liver is viscousNot favorable to wave propagation Fibrosis increases hardness of tissueFavors more rapid propagation
Bedossa P. Liver Int 2009 ; 29 (s1): 19 – 22.
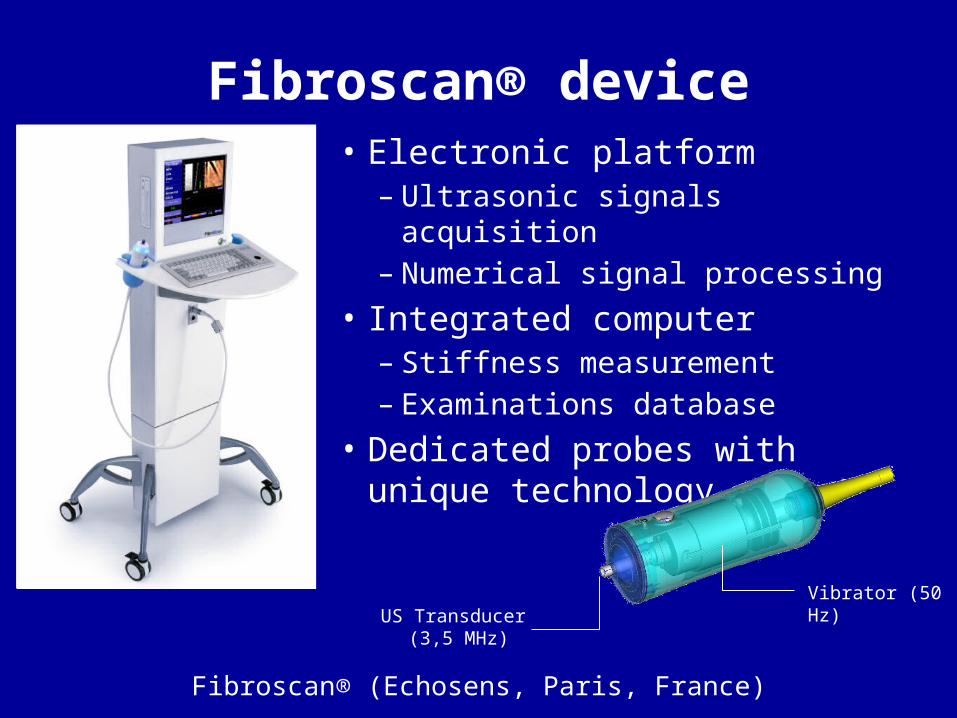
Fibroscan® device• Electronic platform
– Ultrasonic signals acquisition– Numerical signal processing
• Integrated computer– Stiffness measurement– Examinations database
• Dedicated probes with unique technology
Vibrator (50 Hz)US Transducer
(3,5 MHz)
Fibroscan® (Echosens, Paris, France)
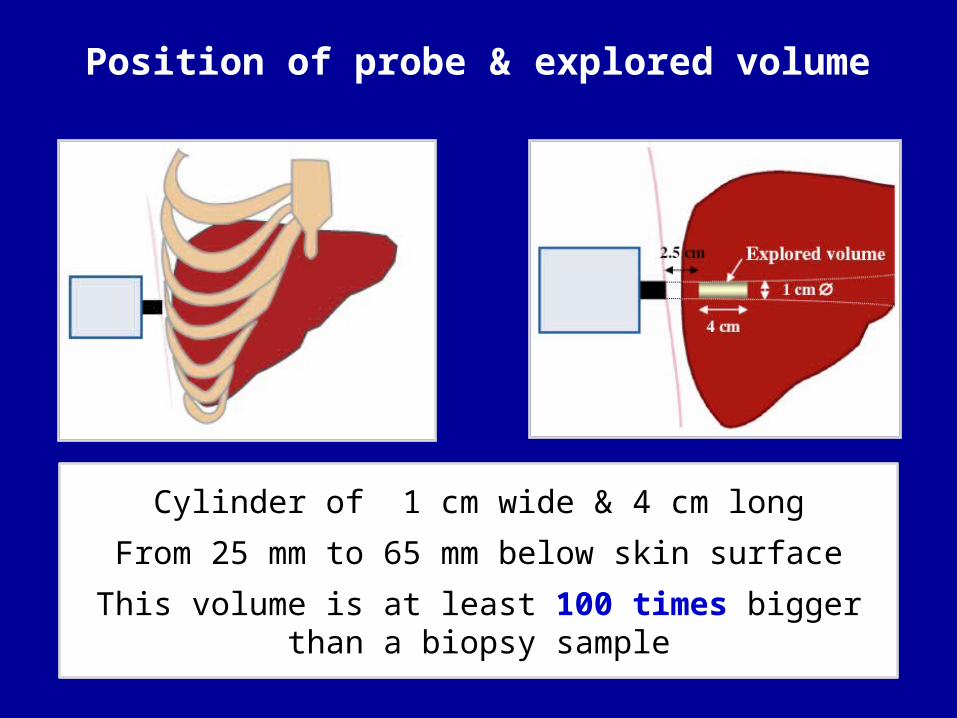
Position of probe & explored volume
Cylinder of 1 cm wide & 4 cm longFrom 25 mm to 65 mm below skin surface
This volume is at least 100 times bigger than a biopsy sample
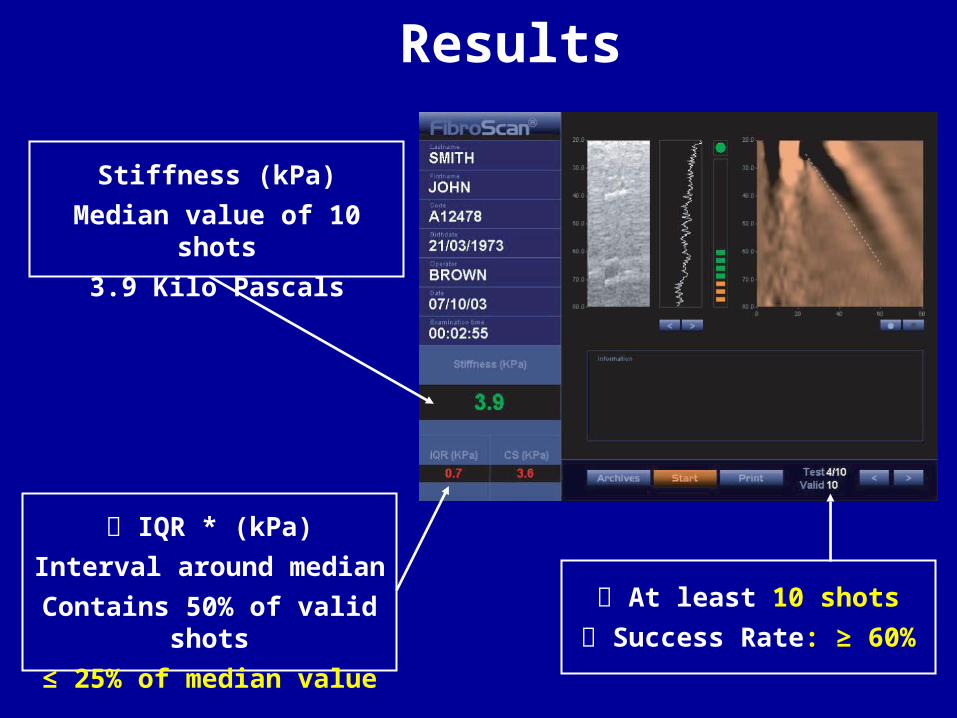
Results
Stiffness (kPa)Median value of 10 shots
3.9 Kilo Pascals
At least 10 shots Success Rate: ≥ 60%
IQR * (kPa)Interval around median
Contains 50% of valid shots≤ 25% of median value
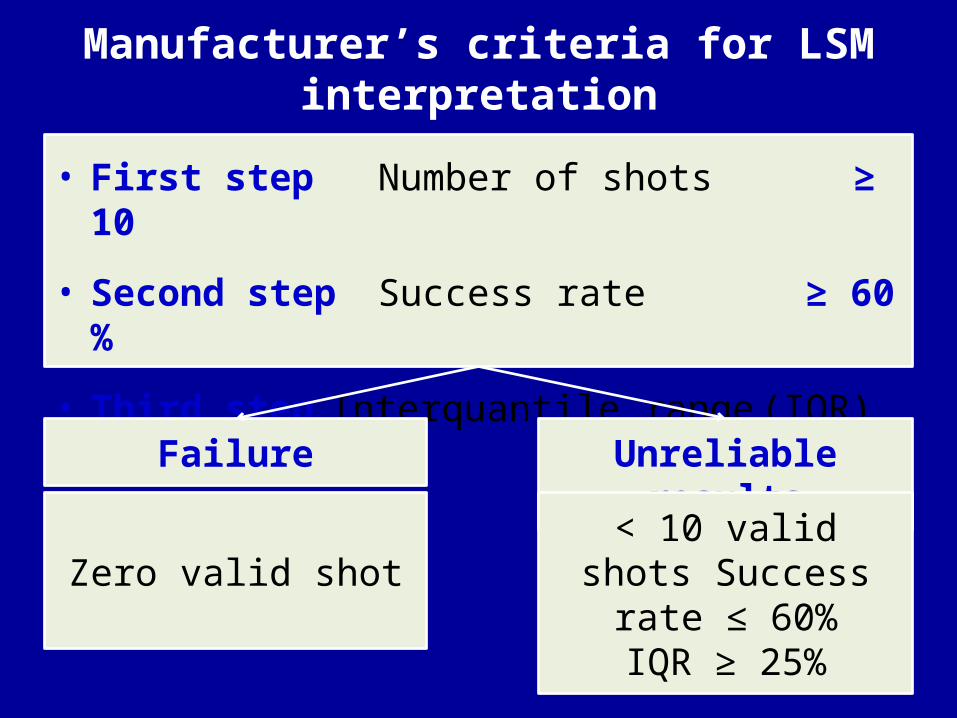
Manufacturer’s criteria for LSM interpretation
• First step Number of shots ≥ 10
• Second stepSuccess rate ≥ 60 %
• Third step Interquantile range (IQR) ≤ 25%
Failure
Zero valid shot
Unreliable results
< 10 valid shots Success rate ≤ 60%
IQR ≥ 25%
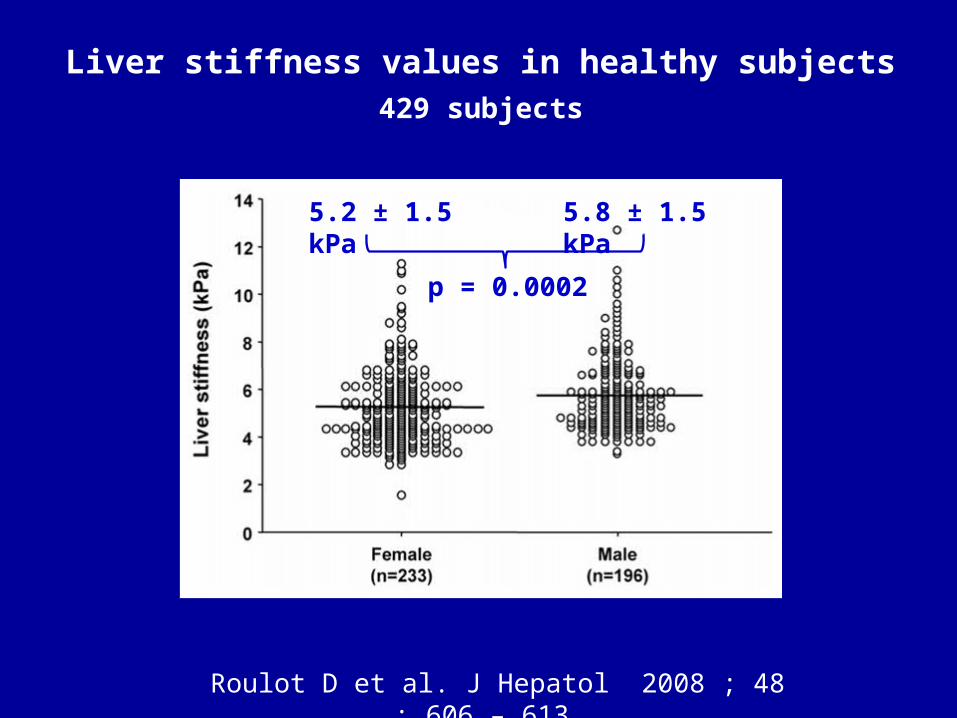
Liver stiffness values in healthy subjects
429 subjects
Roulot D et al. J Hepatol 2008 ; 48 : 606 – 613.
5.2 ± 1.5 kPa 5.8 ± 1.5 kPa
p = 0.0002
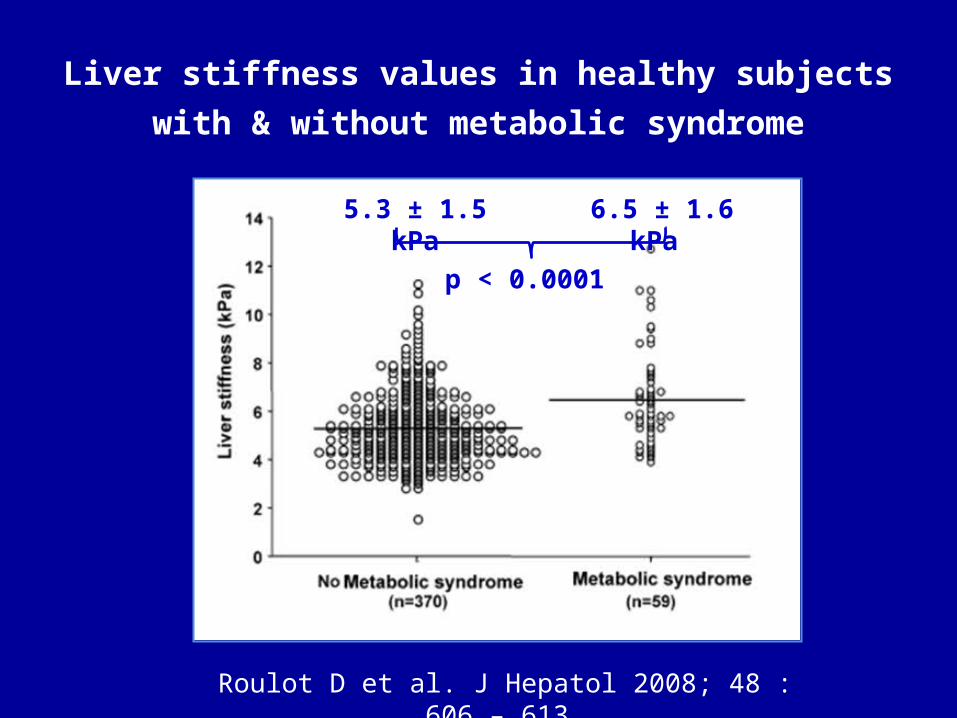
Liver stiffness values in healthy subjectswith & without metabolic syndrome
Roulot D et al. J Hepatol 2008; 48 : 606 – 613.
5.3 ± 1.5 kPa 6.5 ± 1.6 kPa
p < 0.0001
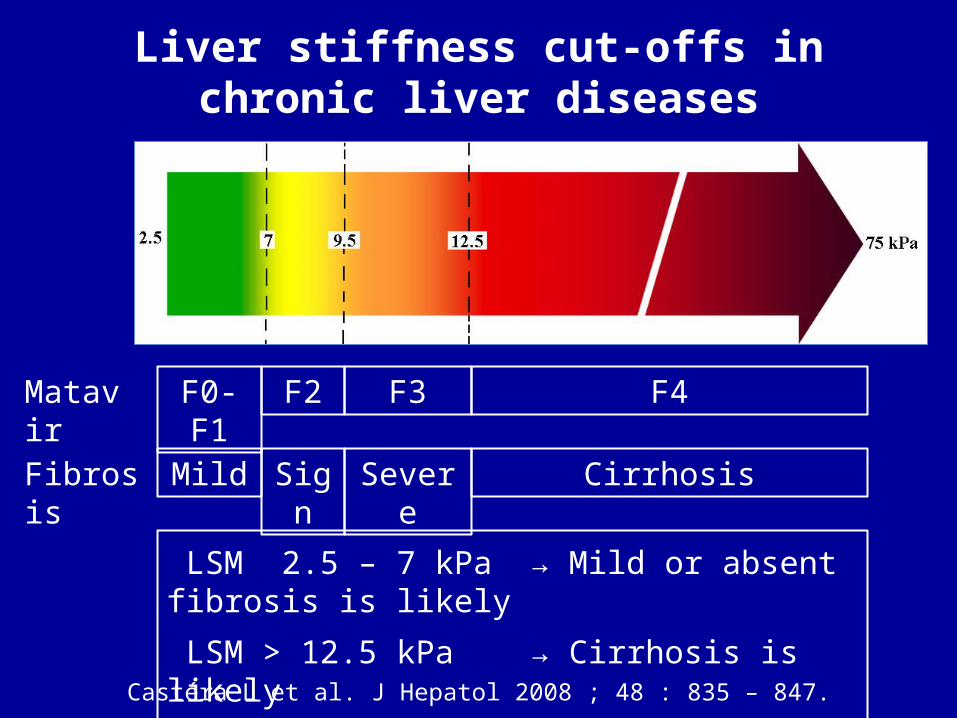
Liver stiffness cut-offs in chronic liver diseases
F2
Sign
F3
Severe
F4
Cirrhosis
Matavir F0-F1
MildFibrosis
Castéra L et al. J Hepatol 2008 ; 48 : 835 – 847.
LSM 2.5 – 7 kPa → Mild or absent fibrosis is likely LSM > 12.5 kPa → Cirrhosis is likely
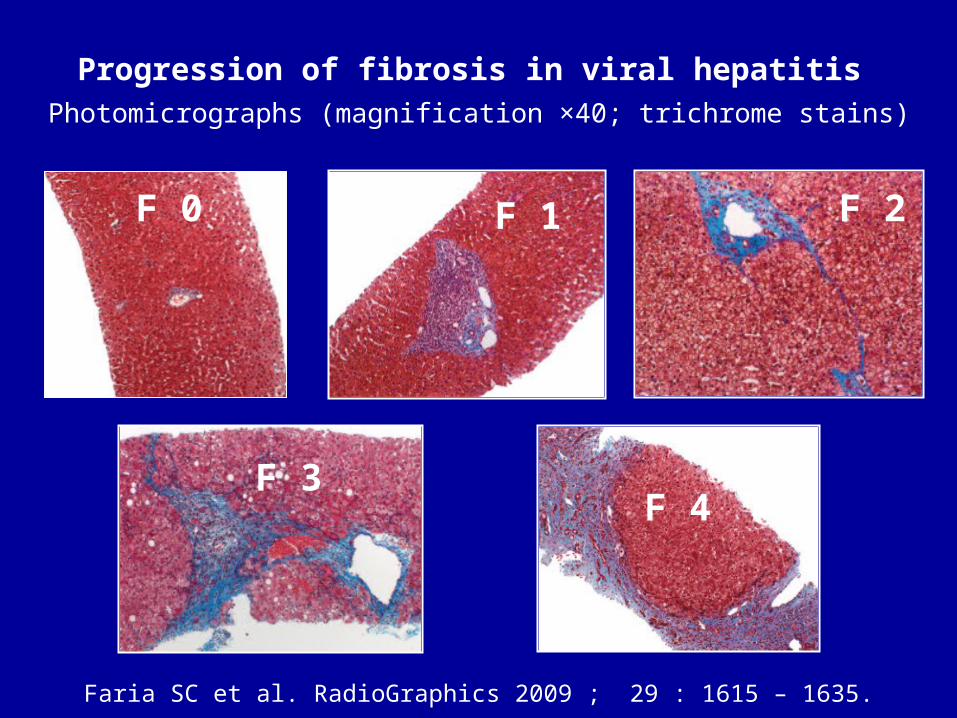
Progression of fibrosis in viral hepatitis Photomicrographs (magnification ×40; trichrome stains)
Faria SC et al. RadioGraphics 2009 ; 29 : 1615 – 1635.
F 0 F 1 F 2
F 3F 4
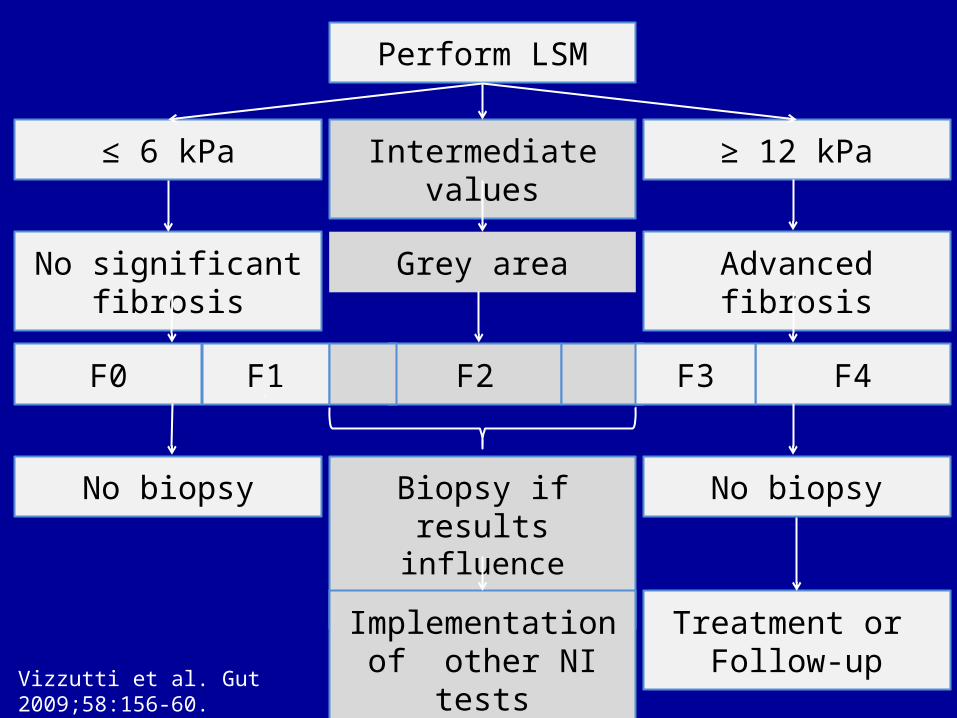
Perform LSM
≤ 6 kPa
No significant fibrosis
No biopsy
F0 F1F
Intermediate values
Grey area
Biopsy if resultsinfluence management
F2
Implementation of other NI tests
≥ 12 kPa
Advanced fibrosis
No biopsy
F4
Treatment or Follow-up
F3
Vizzutti et al. Gut 2009;58:156-60.
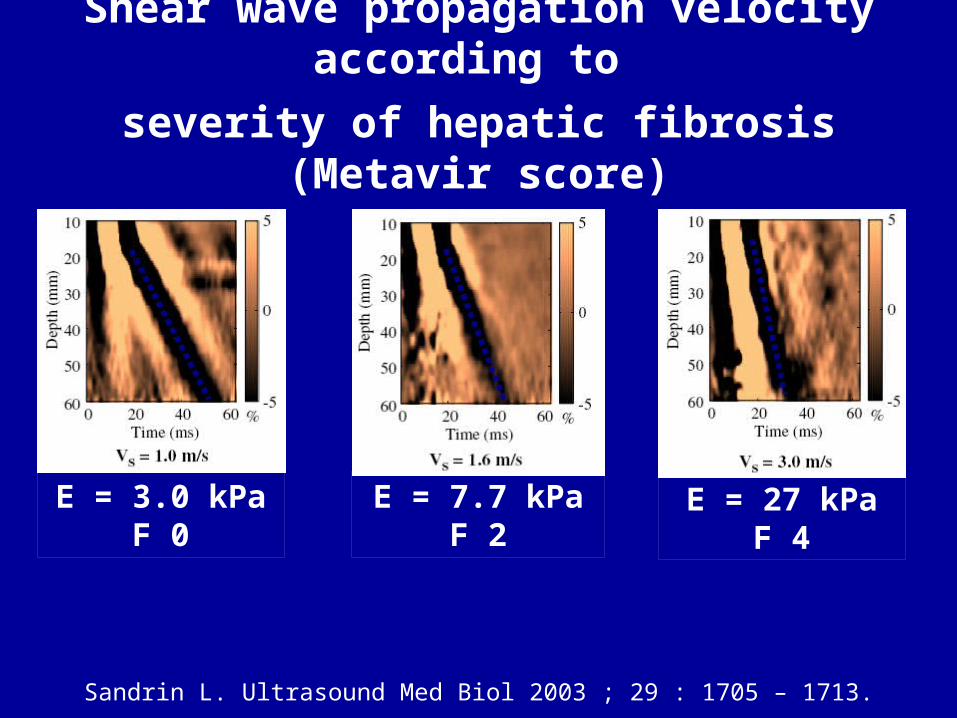
Shear wave propagation velocity according to severity of hepatic fibrosis (Metavir score)
Sandrin L. Ultrasound Med Biol 2003 ; 29 : 1705 – 1713.
E = 3.0 kPaF 0
E = 7.7 kPaF 2
E = 27 kPaF 4
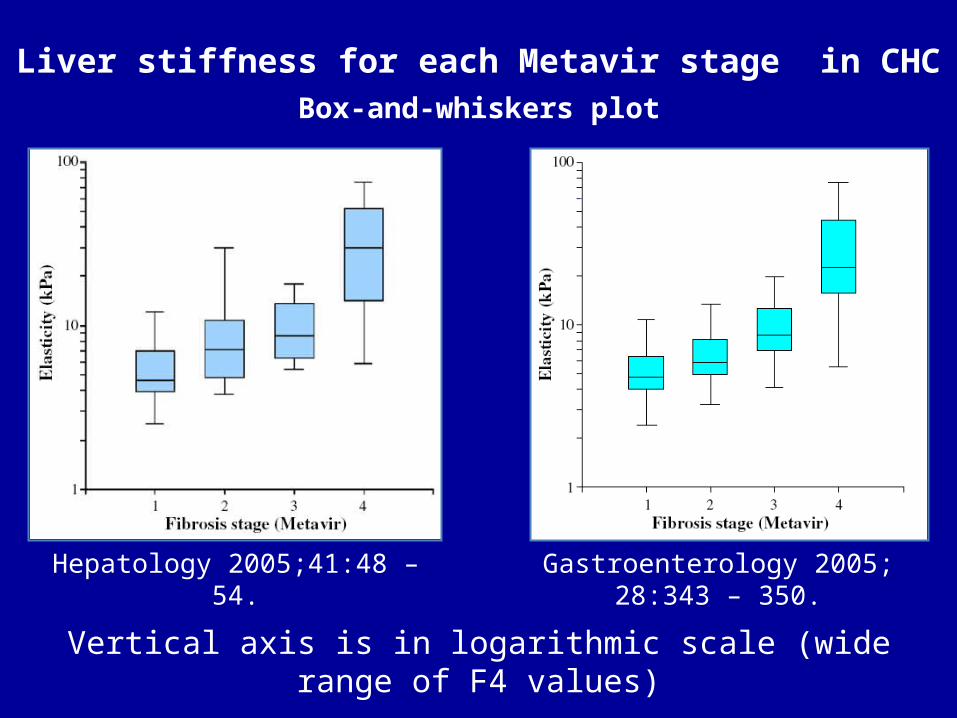
Liver stiffness for each Metavir stage in CHC
Box-and-whiskers plot
Vertical axis is in logarithmic scale (wide range of F4 values)
Gastroenterology 2005; 28:343 – 350.Hepatology 2005;41:48 – 54.
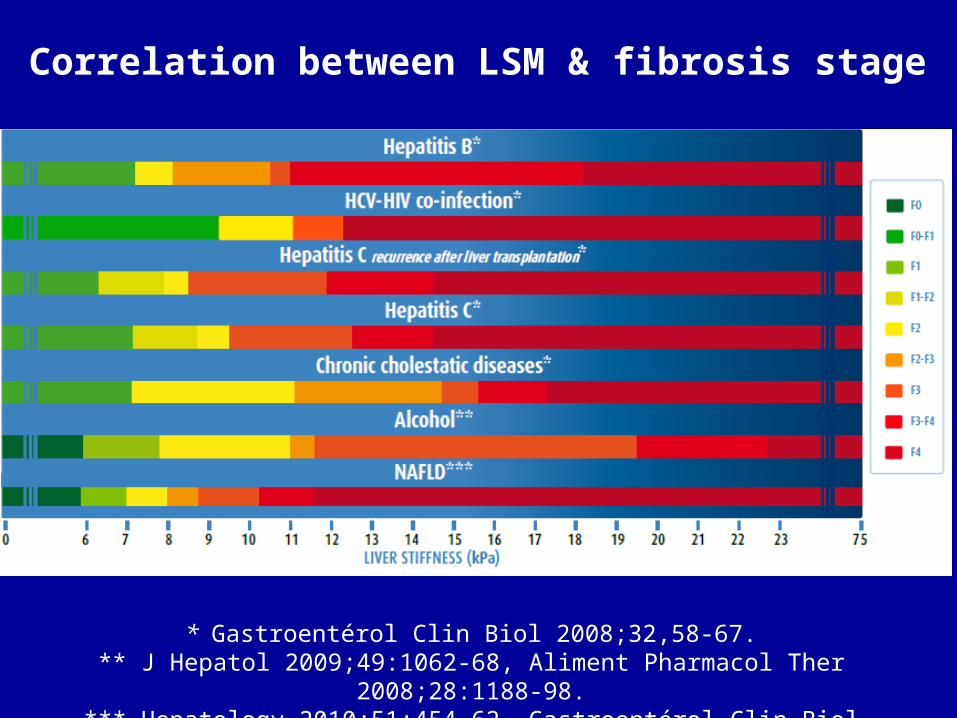
Correlation between LSM & fibrosis stage
* Gastroentérol Clin Biol 2008;32,58-67.** J Hepatol 2009;49:1062-68, Aliment Pharmacol Ther 2008;28:1188-98.*** Hepatology 2010;51:454-62. Gastroentérol Clin Biol 2008;32:58-67.
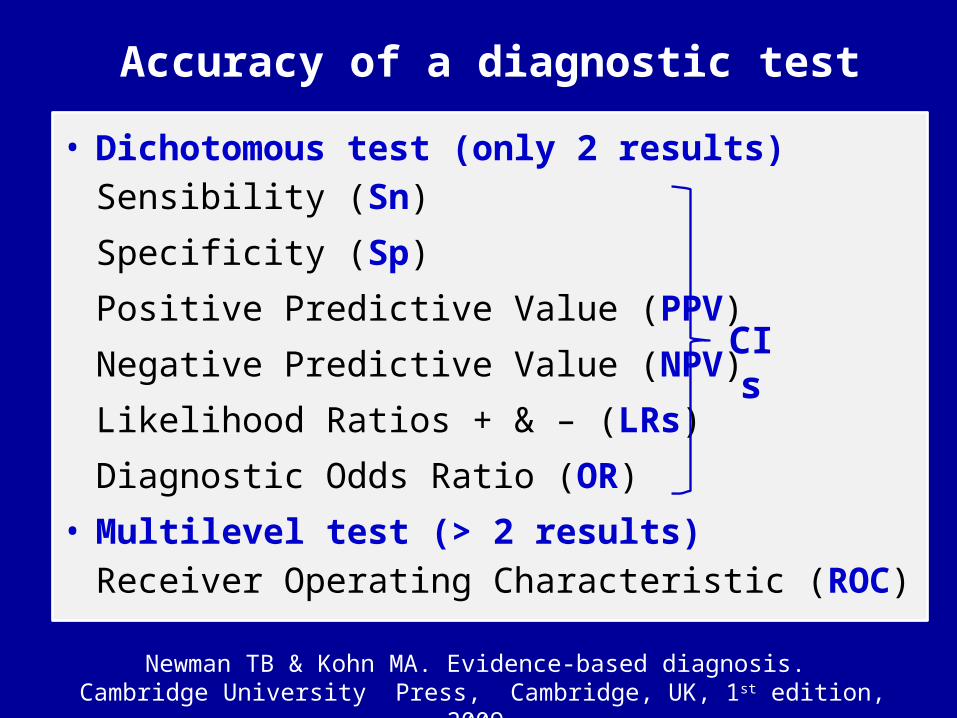
Accuracy of a diagnostic test
• Dichotomous test (only 2 results)Sensibility (Sn)Specificity (Sp)Positive Predictive Value (PPV)Negative Predictive Value (NPV)Likelihood Ratios + & – (LRs) Diagnostic Odds Ratio (OR)
• Multilevel test (> 2 results)Receiver Operating Characteristic (ROC)
Newman TB & Kohn MA. Evidence-based diagnosis. Cambridge University Press, Cambridge, UK, 1st edition, 2009.
CIs
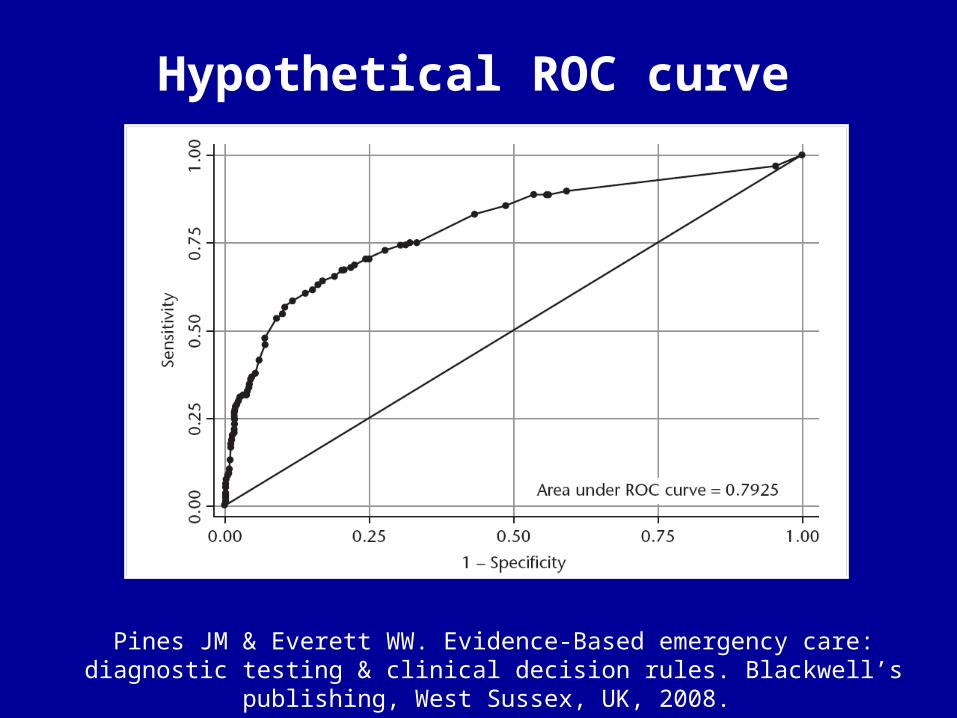
Hypothetical ROC curve
Pines JM & Everett WW. Evidence-Based emergency care: diagnostic testing & clinical decision rules. Blackwell’s publishing, West Sussex, UK, 2008.
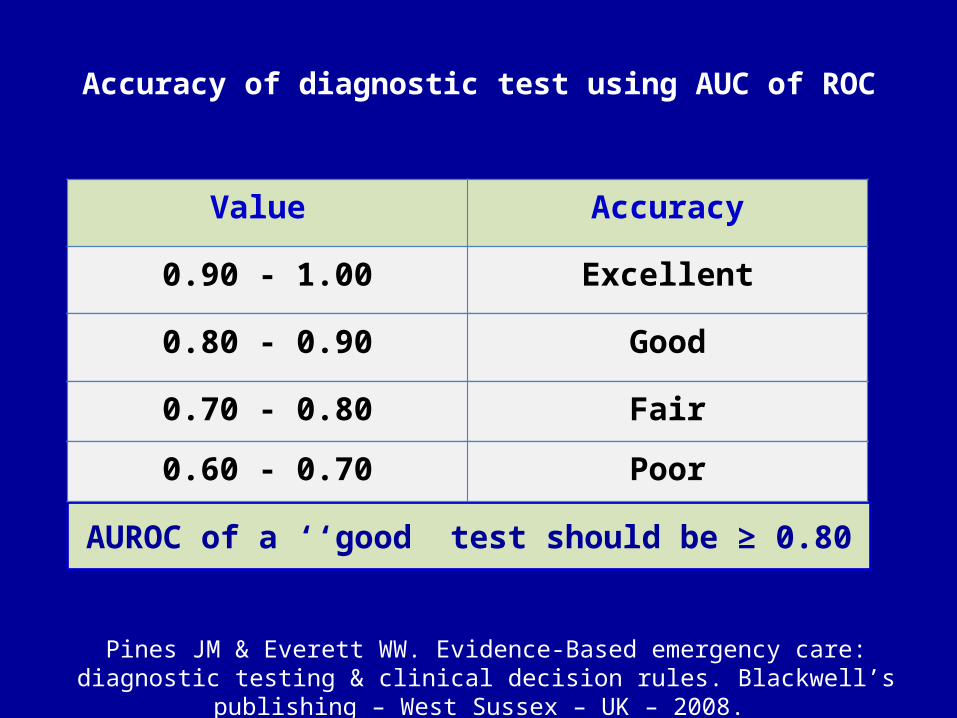
Accuracy of diagnostic test using AUC of ROC
Value Accuracy
0.90 - 1.00 Excellent
Pines JM & Everett WW. Evidence-Based emergency care: diagnostic testing & clinical decision rules. Blackwell’s publishing – West Sussex – UK – 2008.
AUROC of a ‘‘good” test should be ≥ 0.80
0.80 - 0.90 Good
0.70 - 0.80 Fair
0.60 - 0.70 Poor
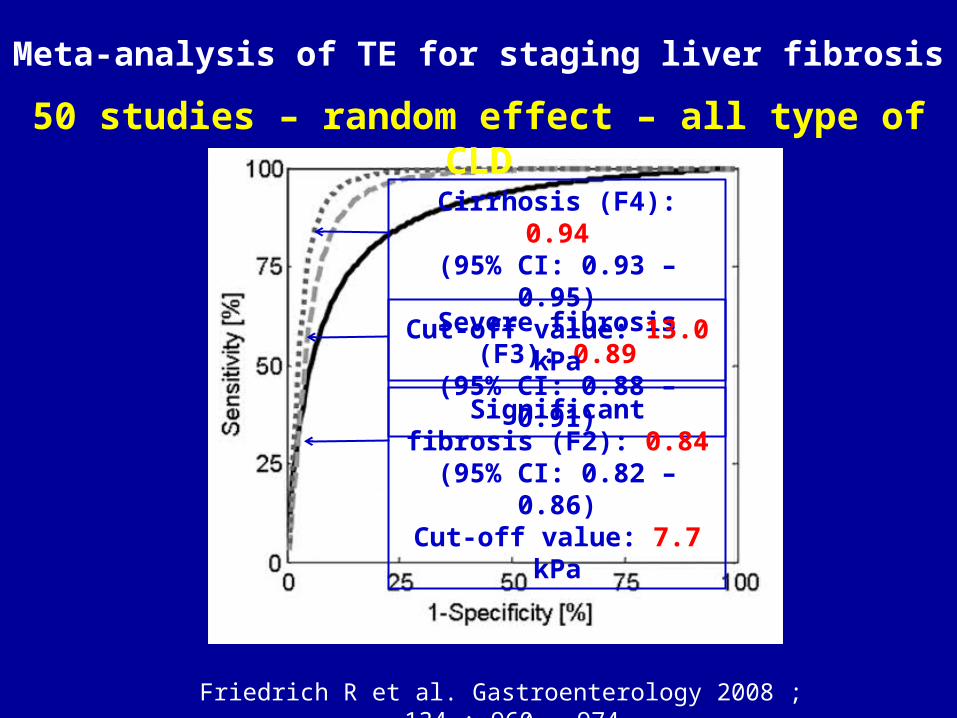
Meta-analysis of TE for staging liver fibrosis
Severe fibrosis (F3): 0.89(95% CI: 0.88 – 0.91)
Friedrich R et al. Gastroenterology 2008 ; 134 : 960 – 974.
Cirrhosis (F4): 0.94(95% CI: 0.93 – 0.95)
Cut-off value: 13.0 kPa
Significant fibrosis (F2): 0.84(95% CI: 0.82 – 0.86)Cut-off value: 7.7 kPa
50 studies – random effect – all type of CLD
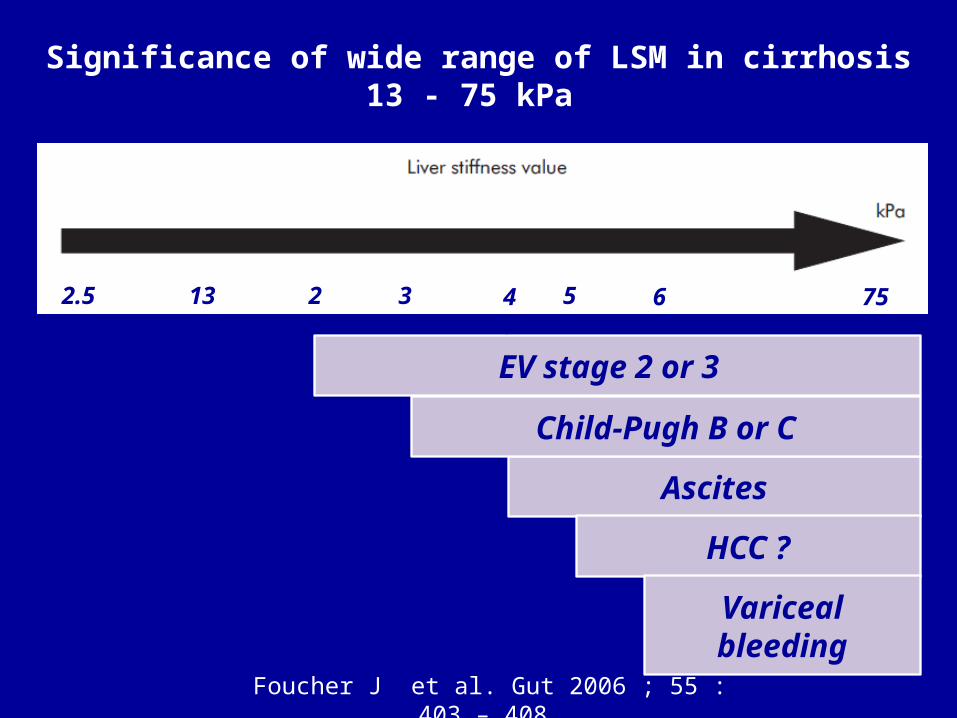
Significance of wide range of LSM in cirrhosis13 - 75 kPa
Ascites
HCC ?
Variceal bleeding
Foucher J et al. Gut 2006 ; 55 : 403 – 408.
EV stage 2 or 3
26
Child-Pugh B or C
36 49 53 622.5 7513
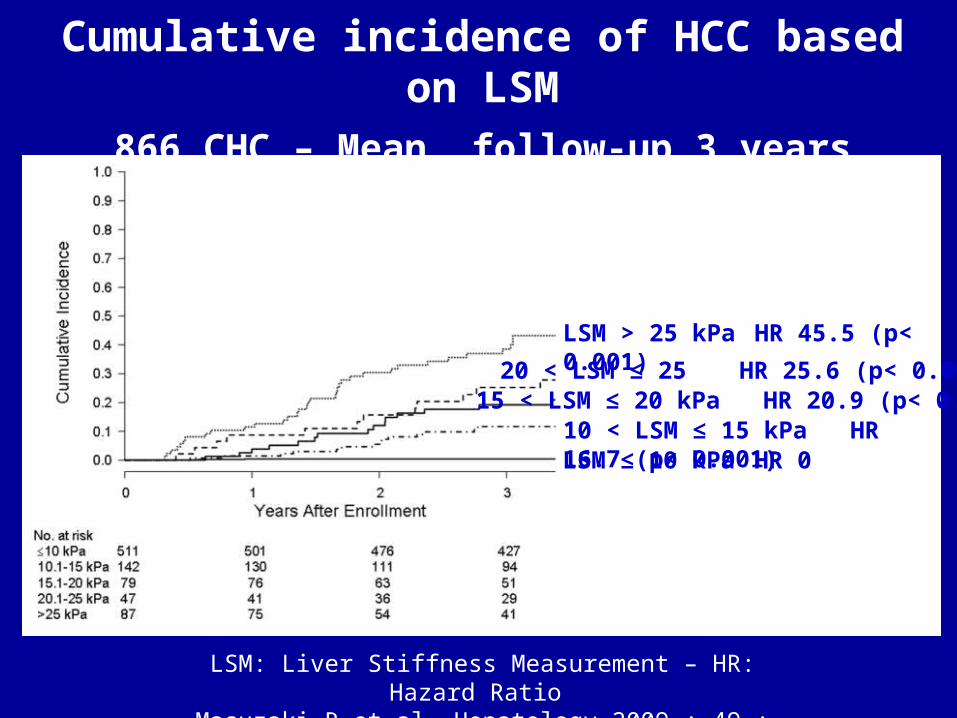
Cumulative incidence of HCC based on LSM866 CHC – Mean follow-up 3 years
LSM: Liver Stiffness Measurement – HR: Hazard Ratio Masuzaki R et al. Hepatology 2009 ; 49 : 1954 – 1961.
LSM > 25 kPa HR 45.5 (p< 0.001)
LSM ≤ 10 kPa HR 010 < LSM ≤ 15 kPa HR 16.7 (p< 0.001) 15 < LSM ≤ 20 kPa HR 20.9 (p< 0.001) 20 < LSM ≤ 25 HR 25.6 (p< 0.001)
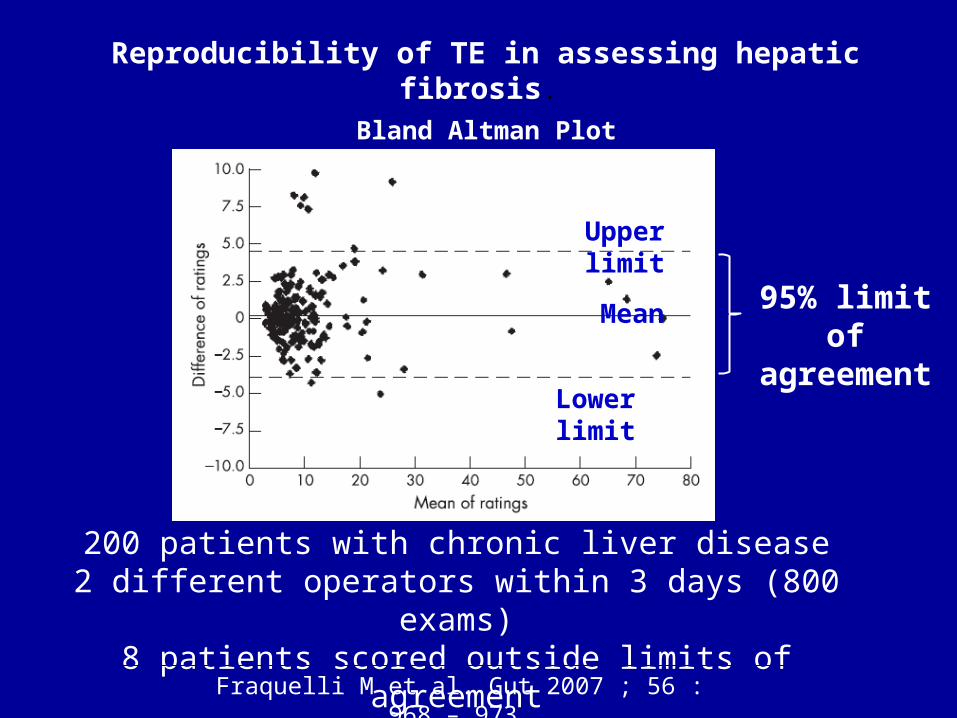
Reproducibility of TE in assessing hepatic fibrosis. Bland Altman Plot
Fraquelli M et al. Gut 2007 ; 56 : 968 – 973.
200 patients with chronic liver disease2 different operators within 3 days (800 exams)
8 patients scored outside limits of agreement
Upper limit
Lower limit
Mean 95% limit of agreement
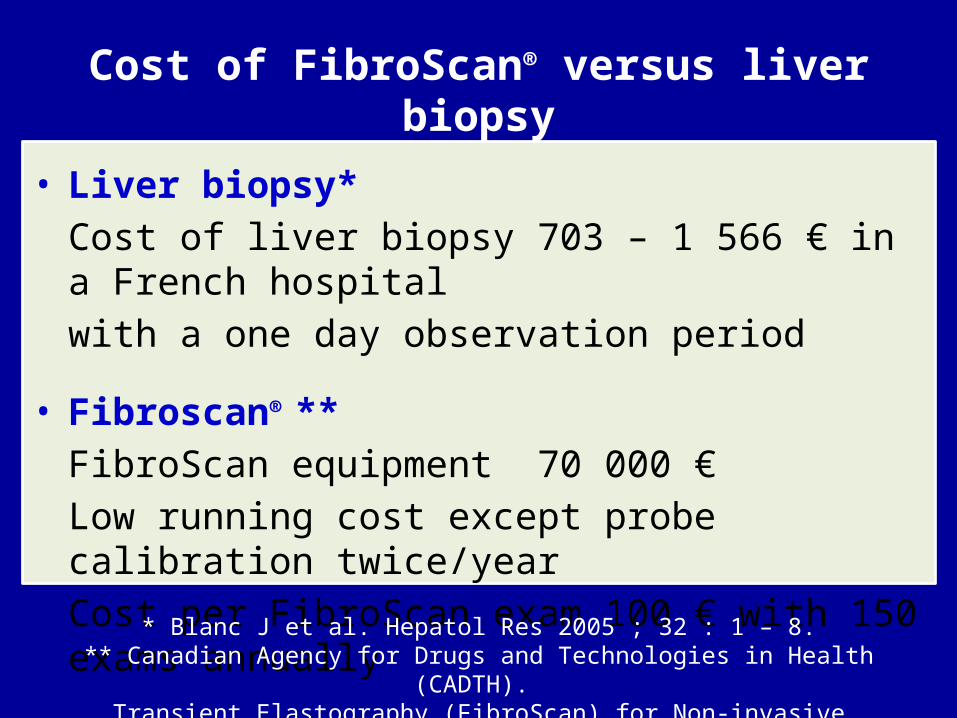
Cost of FibroScan® versus liver biopsy
• Liver biopsy*Cost of liver biopsy 703 – 1 566 € in a French hospitalwith a one day observation period
• Fibroscan® ** FibroScan equipment 70 000 € Low running cost except probe calibration twice/year Cost per FibroScan exam 100 € with 150 exams annually
* Blanc J et al. Hepatol Res 2005 ; 32 : 1 – 8.** Canadian Agency for Drugs and Technologies in Health (CADTH).
Transient Elastography (FibroScan) for Non-invasive Assessment of Liver Fibrosis; 2006.
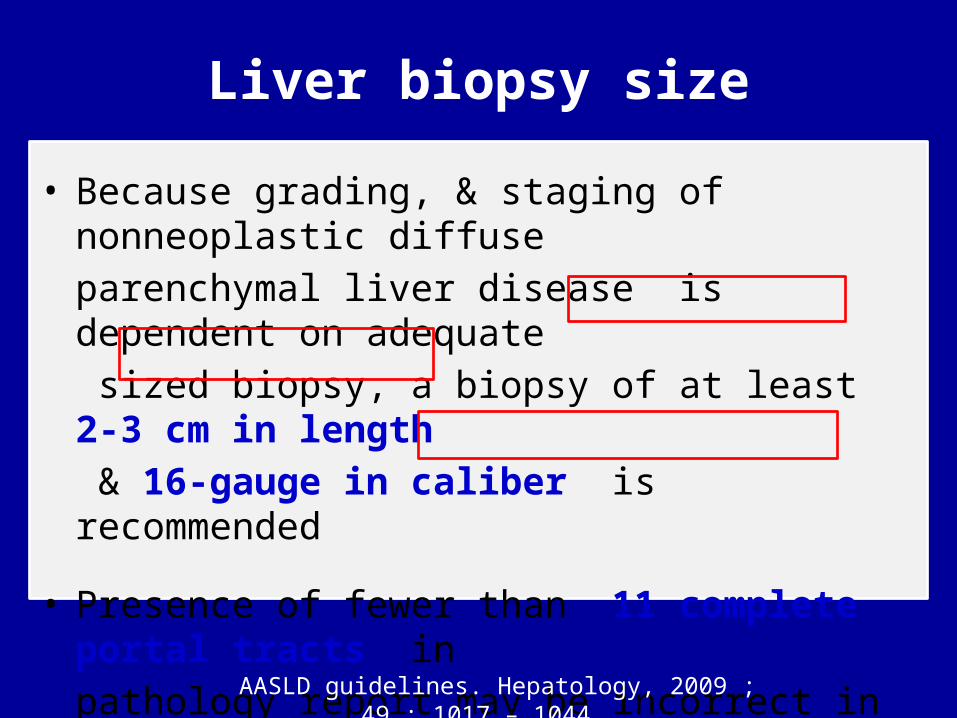
Liver biopsy size
• Because grading, & staging of nonneoplastic diffuseparenchymal liver disease is dependent on adequate sized biopsy, a biopsy of at least 2-3 cm in length & 16-gauge in caliber is recommended
• Presence of fewer than 11 complete portal tracts in pathology report may be incorrect in recognition of grading, & staging due to insufficient sample size
AASLD guidelines. Hepatology, 2009 ; 49 : 1017 – 1044.
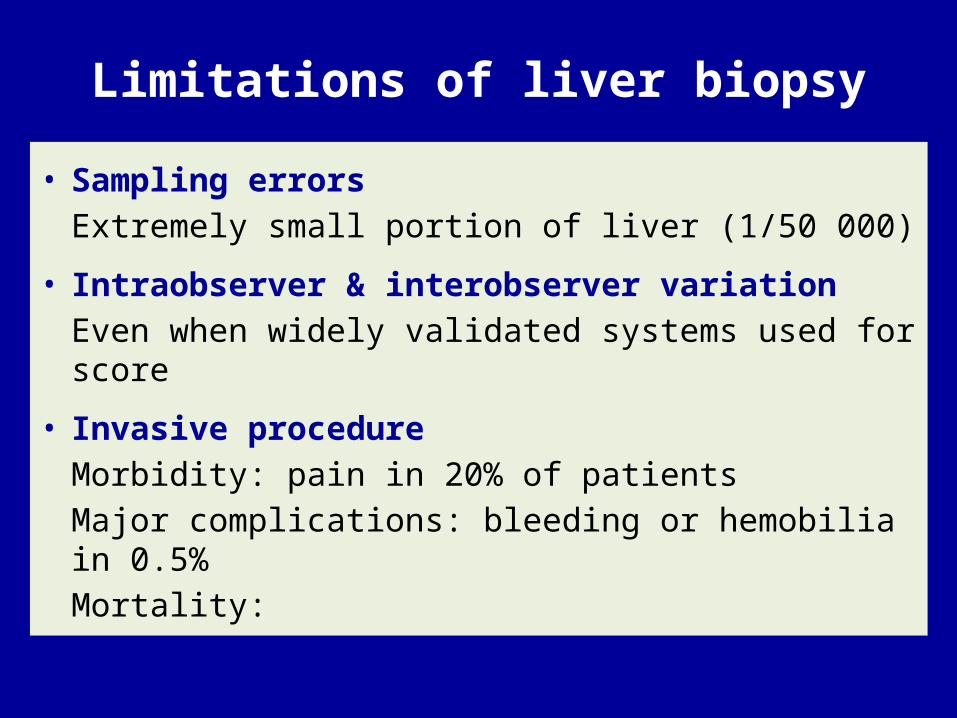
Limitations of liver biopsy
• Sampling errorsExtremely small portion of liver (1/50 000)
• Intraobserver & interobserver variationEven when widely validated systems used for score
• Invasive procedureMorbidity: pain in 20% of patientsMajor complications: bleeding or hemobilia in 0.5%Mortality:
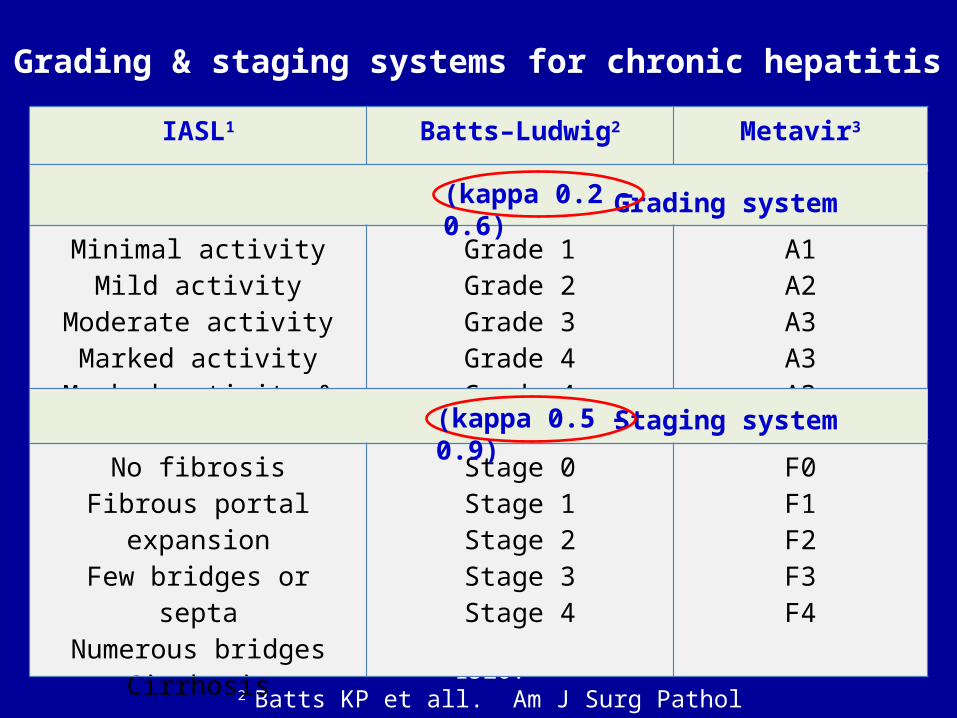
Grading & staging systems for chronic hepatitisIASL1 Batts–Ludwig2 Metavir3
1 Desmet VJ et all. Hepatology 1994;19:1513-1520.2 Batts KP et all. Am J Surg Pathol 1995;19:1409-1417.
3 Bedossa P et all. Hepatology 1996;24:289-293.
Grading system
Minimal activityMild activity
Moderate activityMarked activity
Marked activity & bridging
Grade 1Grade 2Grade 3Grade 4Grade 4
A1A2A3A3A3
Staging system
No fibrosisFibrous portal expansion
Few bridges or septaNumerous bridges
Cirrhosis
Stage 0Stage 1Stage 2Stage 3Stage 4
F0F1F2F3F4
(kappa 0.2 – 0.6)
(kappa 0.5 – 0.9)
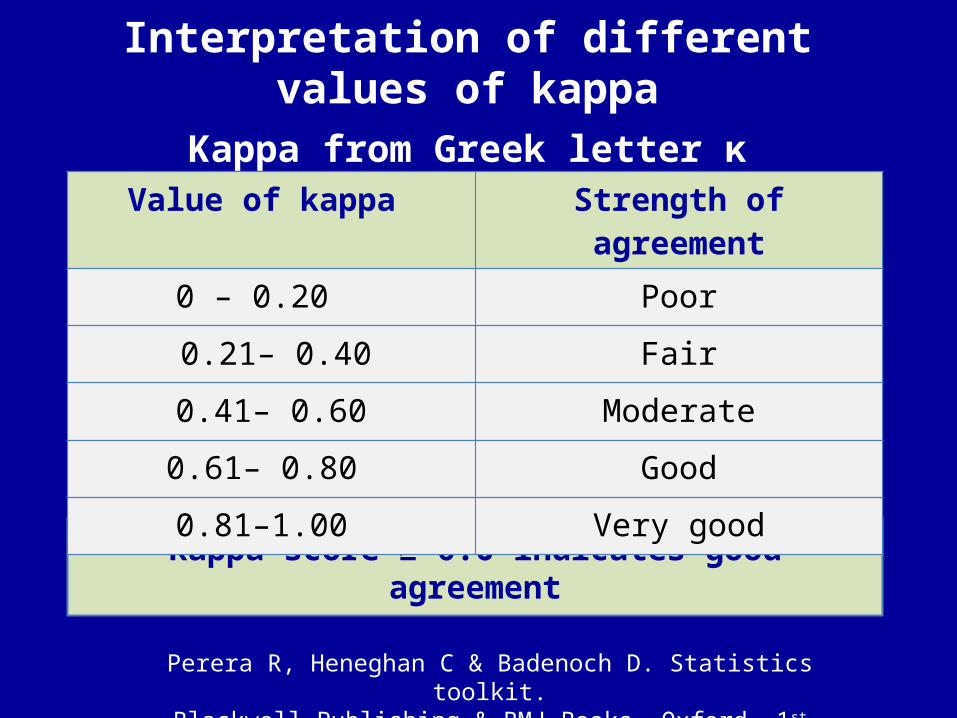
kappa score ≥ 0.6 indicates good agreement
Interpretation of different values of kappa
Kappa from Greek letter κ
Value of kappa Strength of agreement
0 – 0.20 Poor
0.21– 0.40 Fair
0.41– 0.60 Moderate
0.61– 0.80 Good
0.81–1.00 Very good
Perera R, Heneghan C & Badenoch D. Statistics toolkit.Blackwell Publishing & BMJ Books, Oxford, 1st edition, 2008.
Liver biopsy is not the “gold standard”
but is the “best available gold standard”
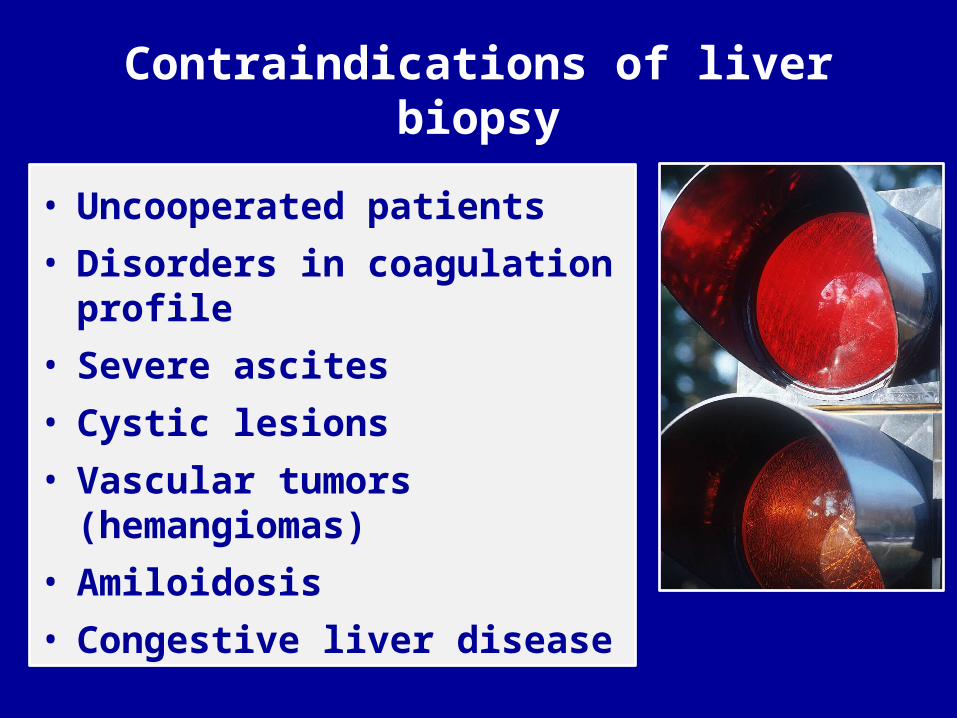
Contraindications of liver biopsy
• Uncooperated patients • Disorders in coagulation profile• Severe ascites• Cystic lesions• Vascular tumors (hemangiomas)• Amiloidosis• Congestive liver disease
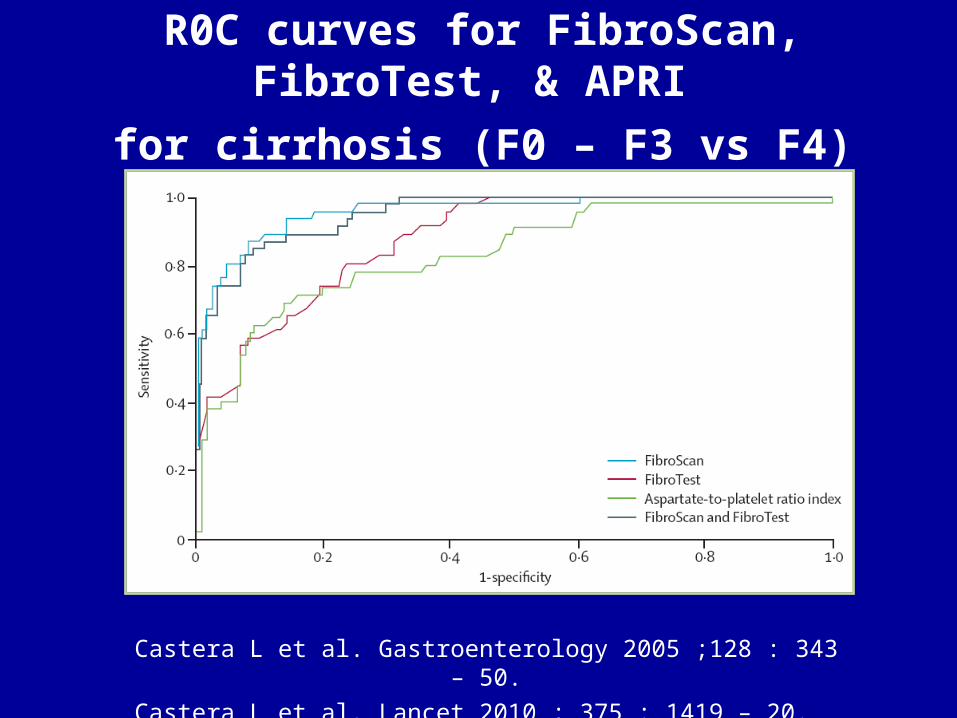
R0C curves for FibroScan, FibroTest, & APRI for cirrhosis (F0 – F3 vs F4)
Castera L et al. Gastroenterology 2005 ;128 : 343 – 50.Castera L et al. Lancet 2010 ; 375 : 1419 – 20.
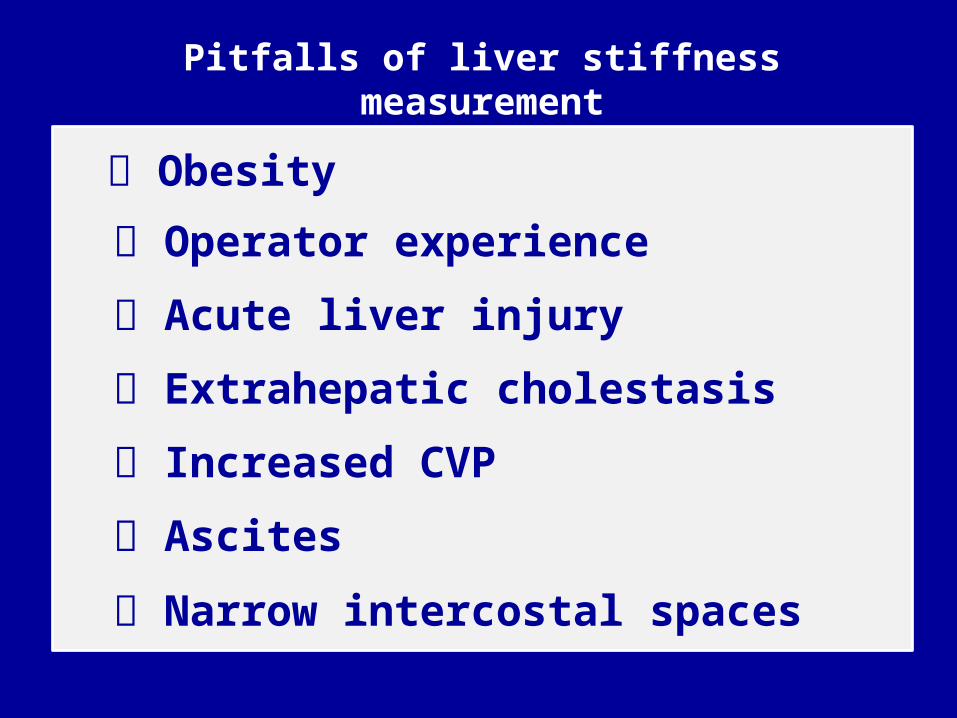
Pitfalls of liver stiffness measurement
Obesity
Operator experience
Acute liver injury
Extrahepatic cholestasis
Increased CVP
Ascites
Narrow intercostal spaces

Obesity & operator experience
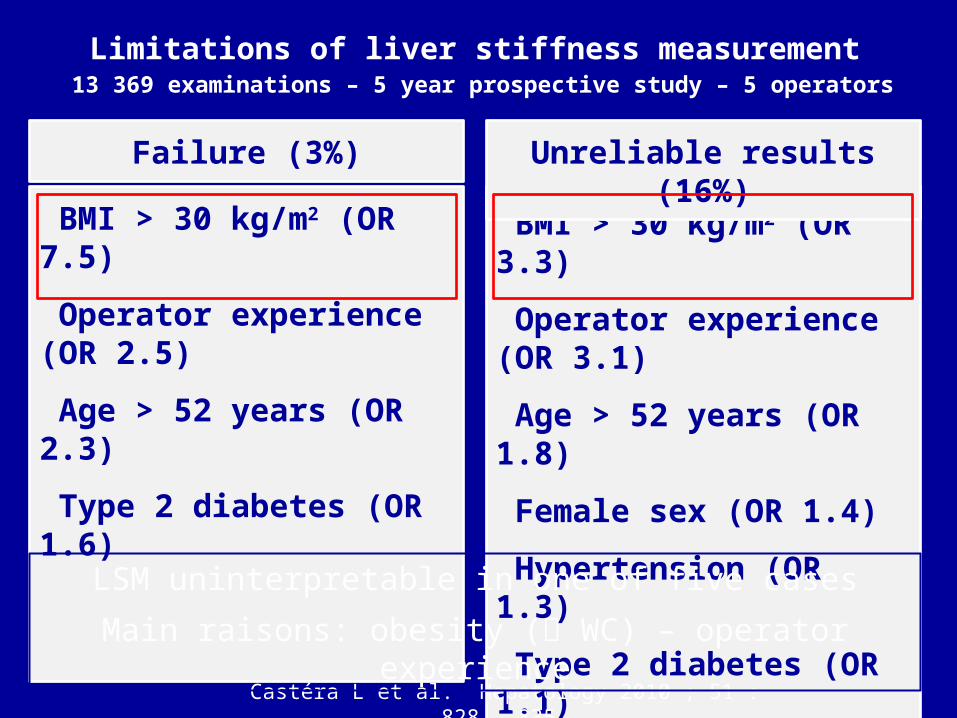
Limitations of liver stiffness measurement 13 369 examinations – 5 year prospective study – 5 operators
BMI > 30 kg/m2 (OR 7.5)
Operator experience (OR 2.5)
Age > 52 years (OR 2.3)
Type 2 diabetes (OR 1.6)
Failure (3%)
BMI > 30 kg/m2 (OR 3.3)
Operator experience (OR 3.1)
Age > 52 years (OR 1.8)
Female sex (OR 1.4)
Hypertension (OR 1.3)
Type 2 diabetes (OR 1.1)
Unreliable results (16%)
Castéra L et al. Hepatology 2010 ; 51 : 828 – 835.
LSM uninterpretable in one of five casesMain raisons: obesity ( WC) – operator experience
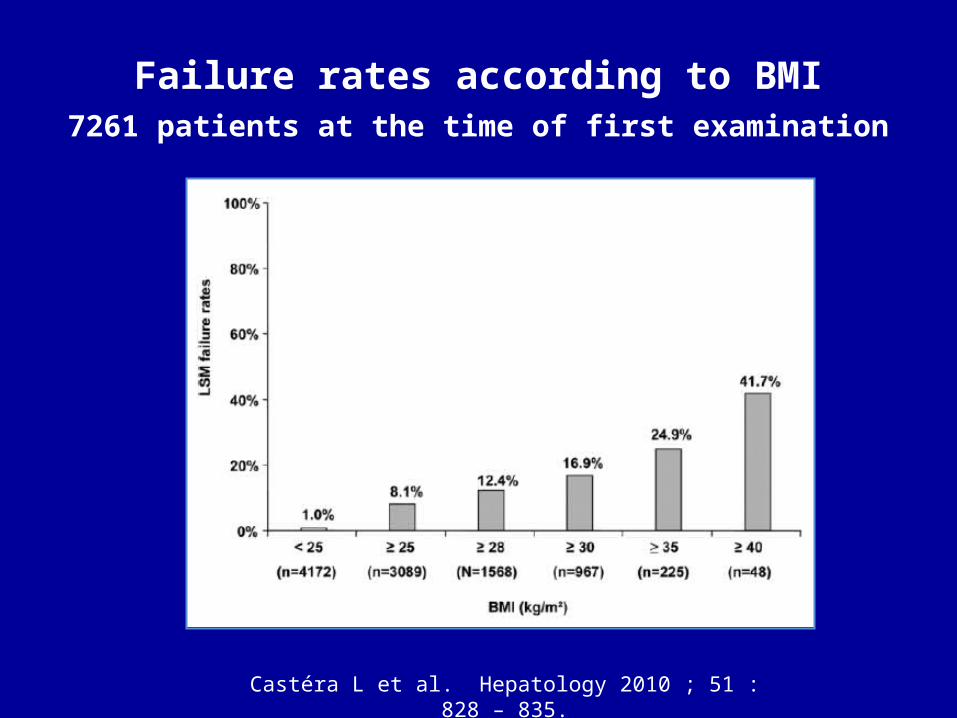
Failure rates according to BMI7261 patients at the time of first examination
Castéra L et al. Hepatology 2010 ; 51 : 828 – 835.
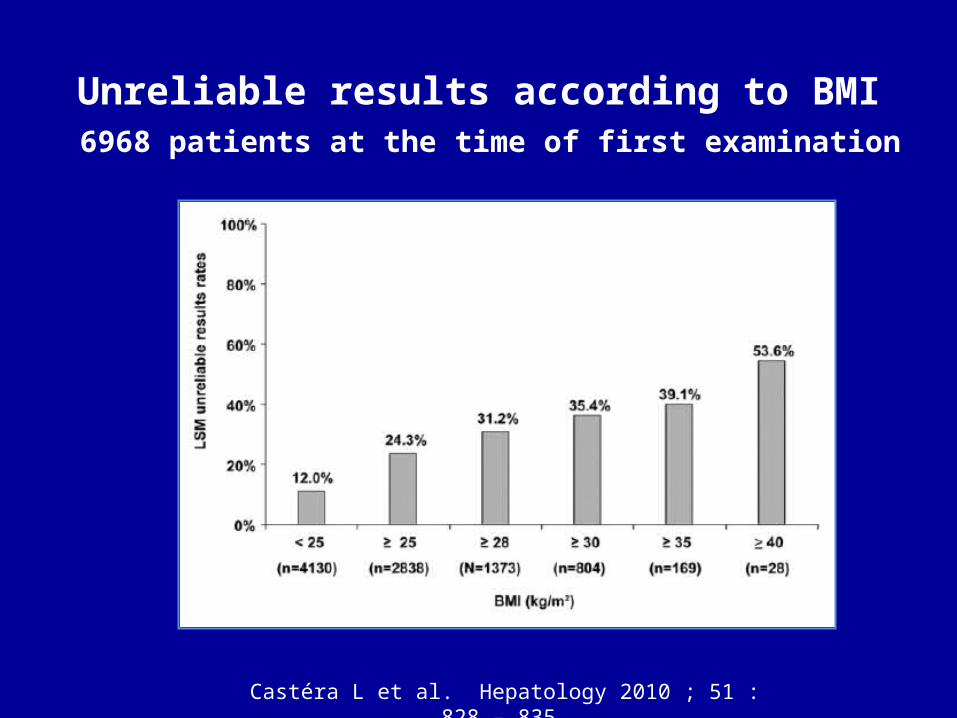
Unreliable results according to BMI 6968 patients at the time of first examination
Castéra L et al. Hepatology 2010 ; 51 : 828 – 835.
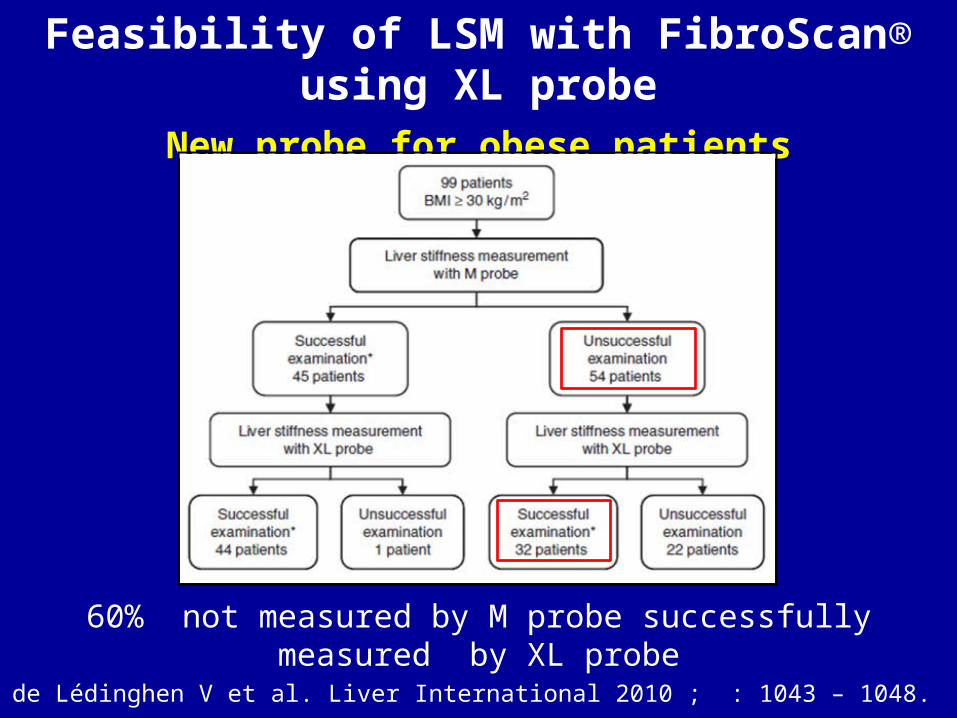
Feasibility of LSM with FibroScan® using XL probeNew probe for obese patients
de Lédinghen V et al. Liver International 2010 ; : 1043 – 1048.
60% not measured by M probe successfully measured by XL probe
Acute liver injury
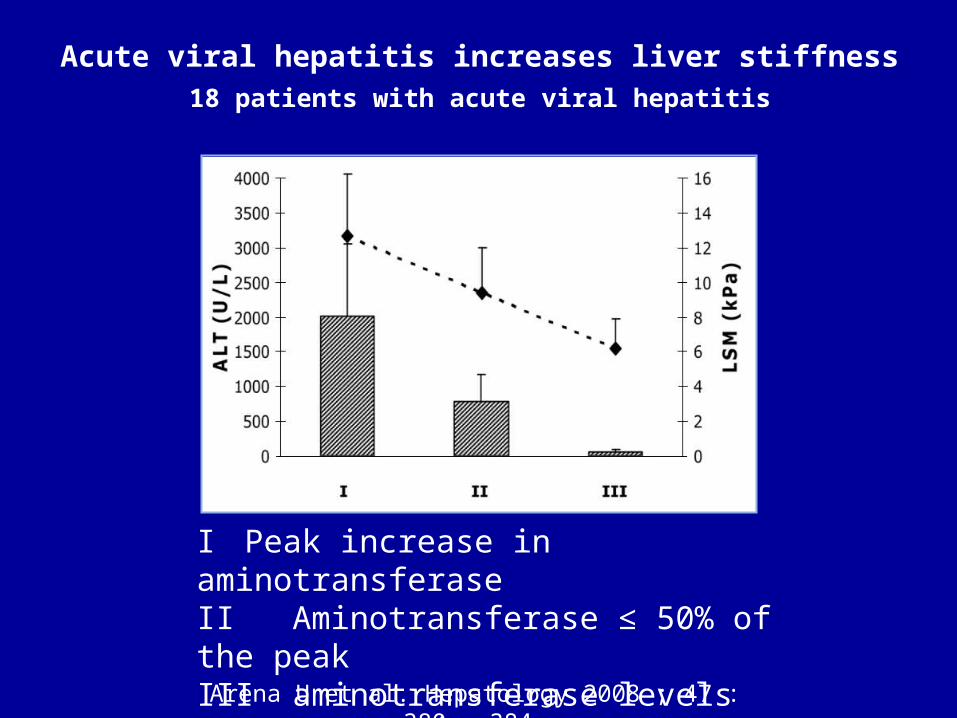
Acute viral hepatitis increases liver stiffness
18 patients with acute viral hepatitis
I Peak increase in aminotransferaseII Aminotransferase ≤ 50% of the peakIII aminotransferase levels ≤ 2 ULN
Arena U et al. Hepatology 2008 ; 47 : 380 – 384.
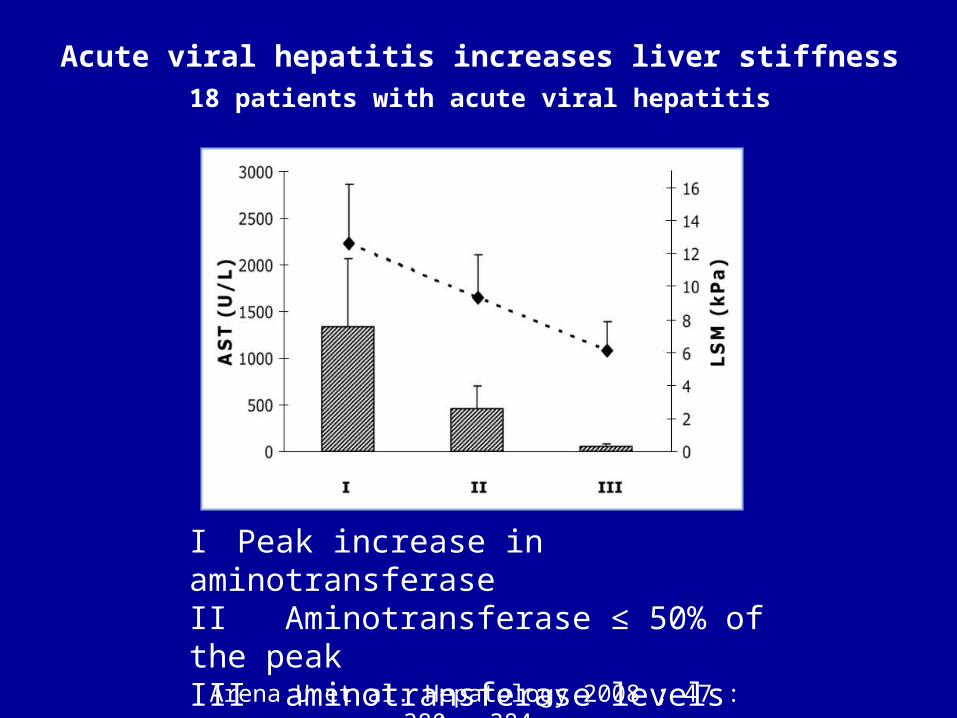
Acute viral hepatitis increases liver stiffness
18 patients with acute viral hepatitis
I Peak increase in aminotransferaseII Aminotransferase ≤ 50% of the peakIII aminotransferase levels ≤ 2 ULN
Arena U et al. Hepatology 2008 ; 47 : 380 – 384.
Extrahepatic cholestasis
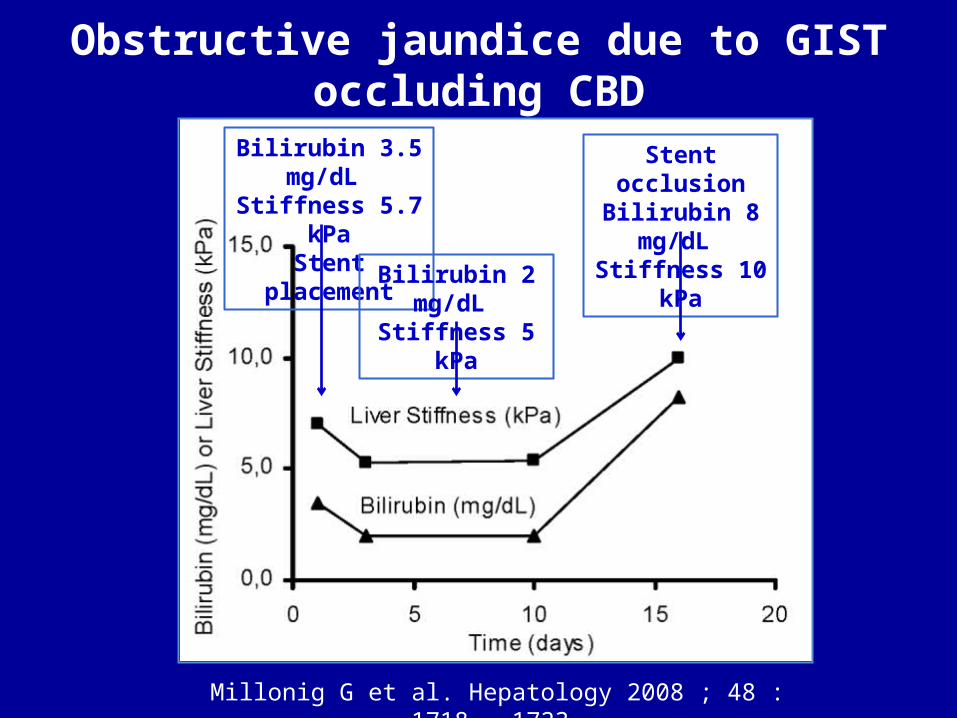
Obstructive jaundice due to GIST occluding CBD
Millonig G et al. Hepatology 2008 ; 48 : 1718 – 1723.
Stent occlusionBilirubin 8 mg/dL Stiffness 10 kPa
Bilirubin 3.5 mg/dL Stiffness 5.7 kPaStent placement
Bilirubin 2 mg/dL Stiffness 5 kPa
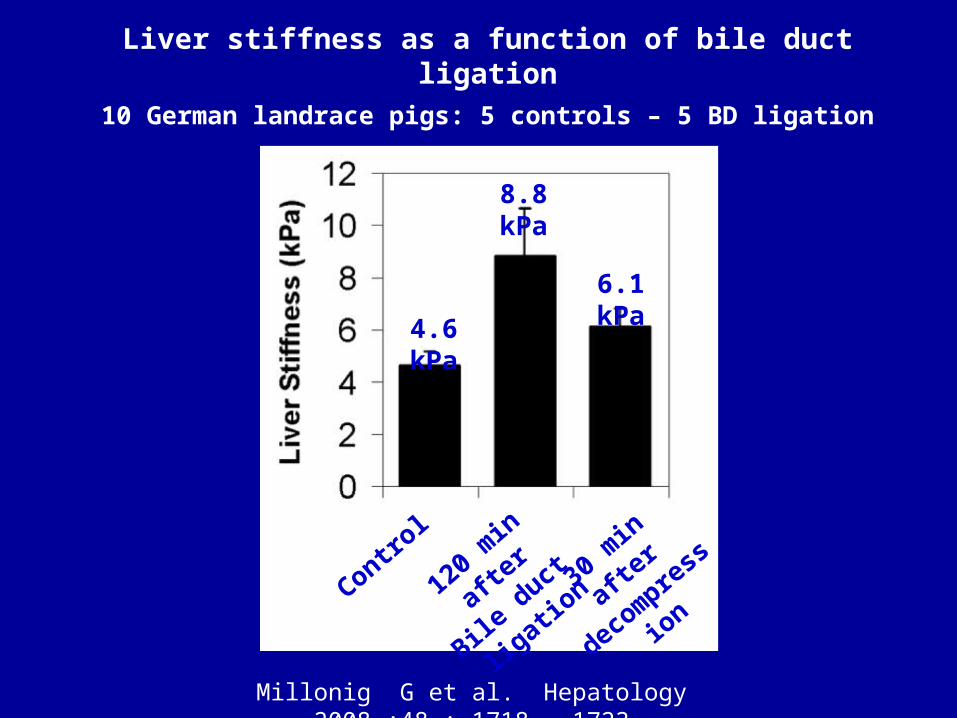
Liver stiffness as a function of bile duct ligation10 German landrace pigs: 5 controls – 5 BD ligation
Millonig G et al. Hepatology 2008 ;48 : 1718 – 1723.
Control
4.6 kPa
120 min after
Bile duct
ligation
8.8 kPa
30 min after
decompression
6.1 kPa

Increased CVP
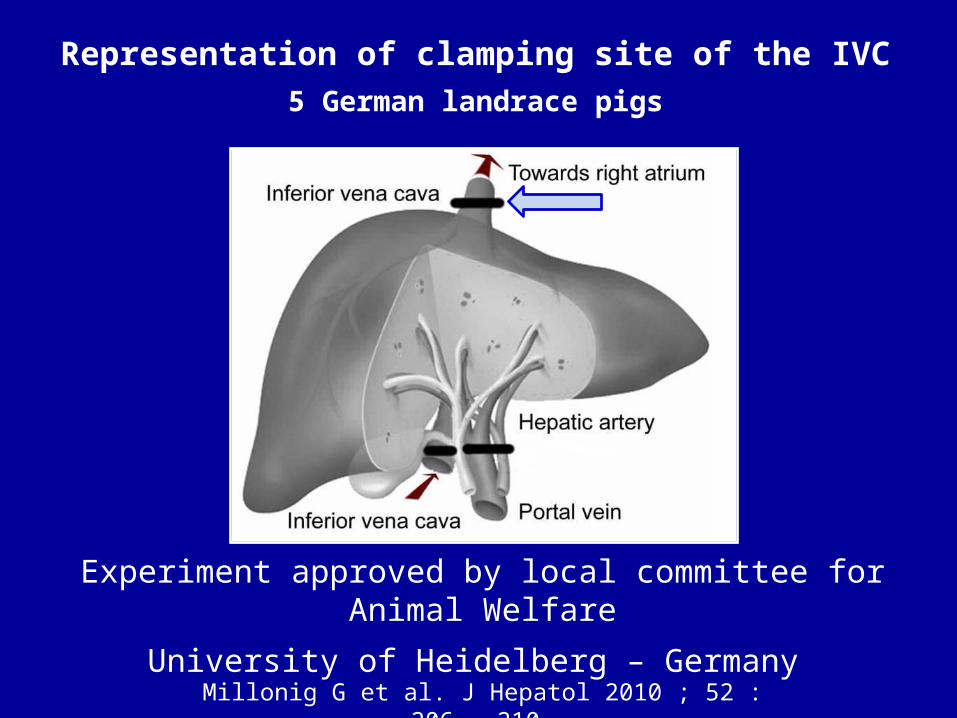
Representation of clamping site of the IVC5 German landrace pigs
Millonig G et al. J Hepatol 2010 ; 52 : 206 – 210.
Experiment approved by local committee for Animal WelfareUniversity of Heidelberg – Germany
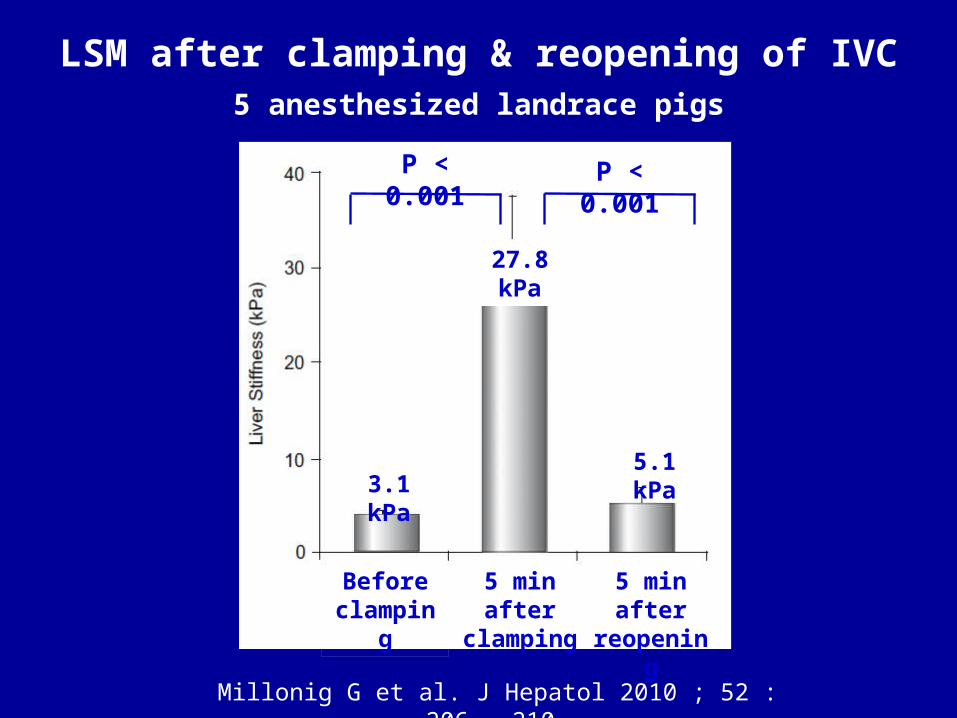
LSM after clamping & reopening of IVC5 anesthesized landrace pigs
Millonig G et al. J Hepatol 2010 ; 52 : 206 – 210.
P < 0.001 P < 0.001
Before clamping
3.1 kPa
5 min after reopening
5.1 kPa
27.8 kPa
5 min after clamping
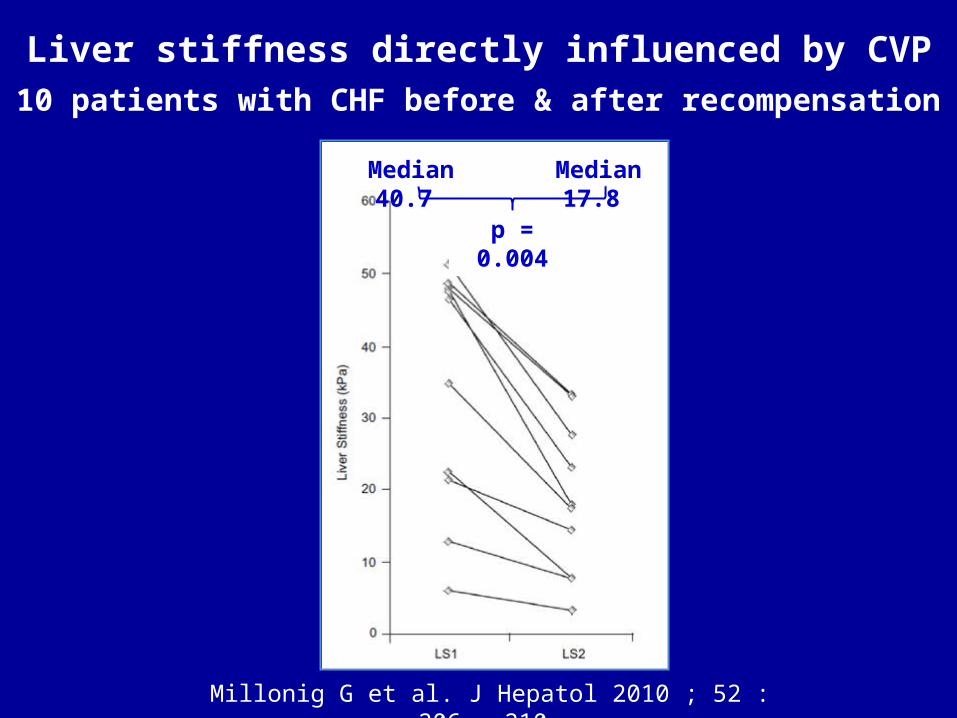
Liver stiffness directly influenced by CVP
10 patients with CHF before & after recompensation
Millonig G et al. J Hepatol 2010 ; 52 : 206 – 210.
Median 40.7 Median 17.8
p = 0.004

Ascites
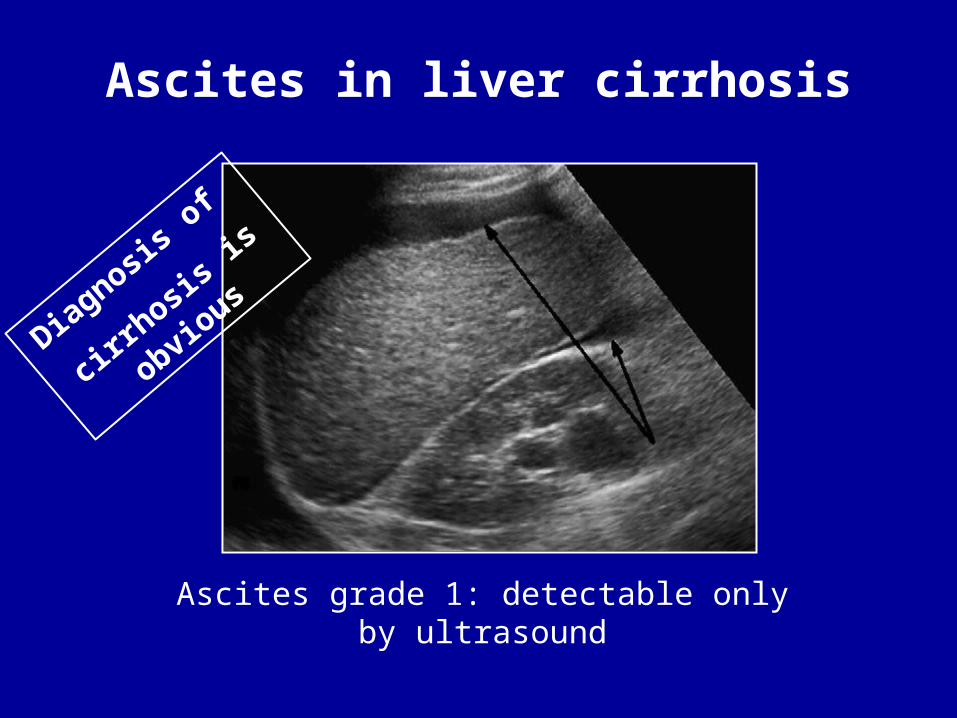
Ascites in liver cirrhosis
Ascites grade 1: detectable only by ultrasound
Diagnosis of
cirrhosis
is obvious

Narrow intercostal spaces
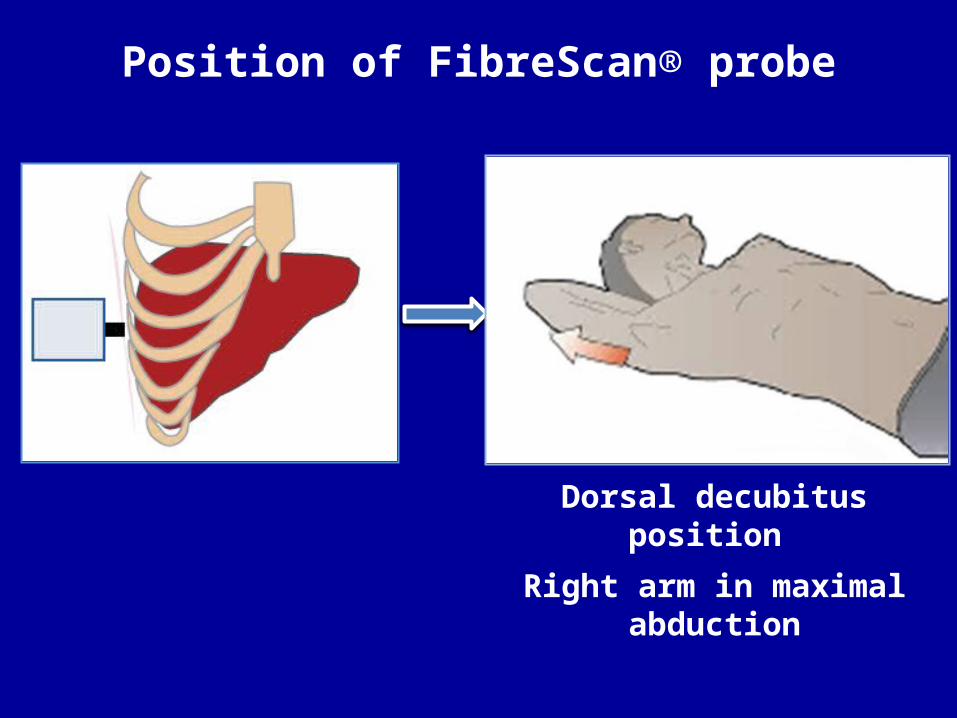
Position of FibreScan® probe
Dorsal decubitus position Right arm in maximal abduction
Interpretation of the results of LSM should
always be done by expert clinicians according
to clinical context
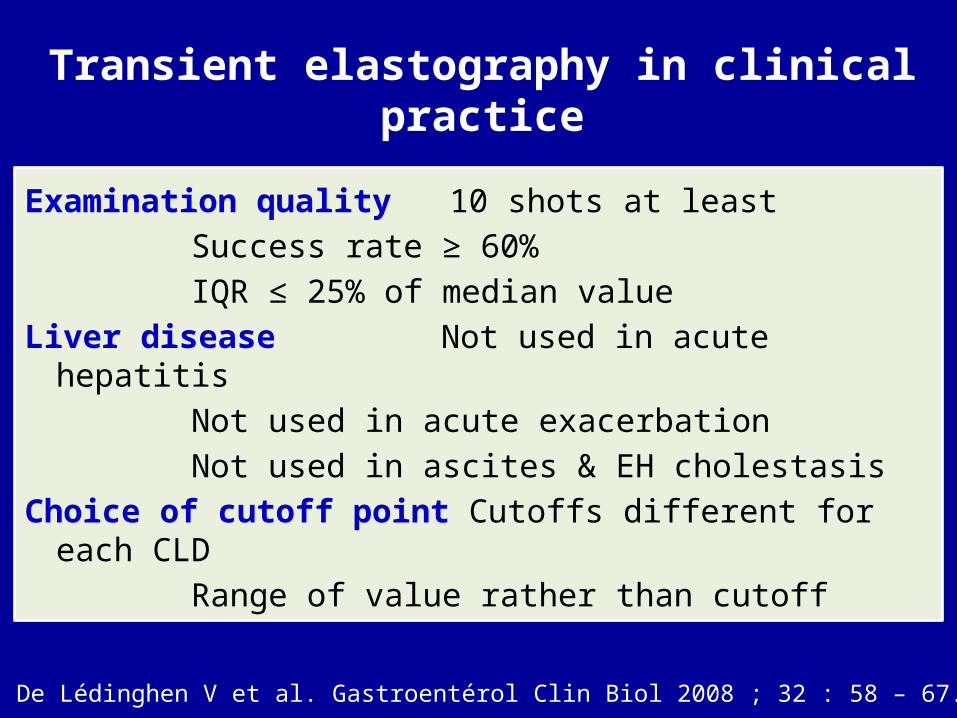
Transient elastography in clinical practice
Examination quality 10 shots at least Success rate ≥ 60% IQR ≤ 25% of median value
Liver disease Not used in acute hepatitis Not used in acute exacerbation Not used in ascites & EH cholestasis
Choice of cutoff point Cutoffs different for each CLD Range of value rather than cutoff
De Lédinghen V et al. Gastroentérol Clin Biol 2008 ; 32 : 58 – 67.

Questions

Thank You