living shorelines progress report and presentation 2013
TRANSCRIPT
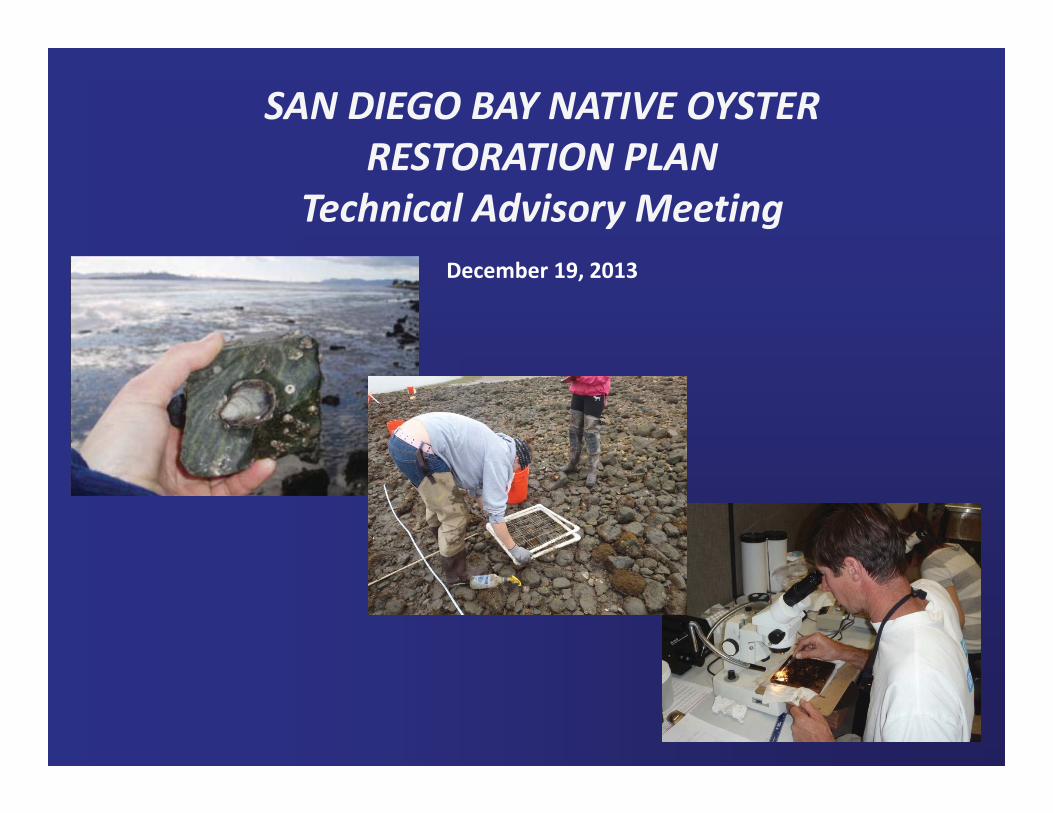
SAN DIEGO BAY NATIVE OYSTERRESTORATION PLAN
Technical Advisory MeetingDecember 19, 2013

Meeting Agenda
• 9:30 – 9:45 Project Introduction• 9:45 10:15 Existing Data – PhysicalConditions and Oyster Presence and Distribution
• 10:15 10:45 Oyster Settlement and Growth• 10:45 – 11:15 Oyster Distribution• 11:15 – 11:30 Physical Data Wave Energy• 11:30 – 12:30 Identify Preferred Potential Sites
and Additional Data Needs• 12:30 – 12:45 Wrap up
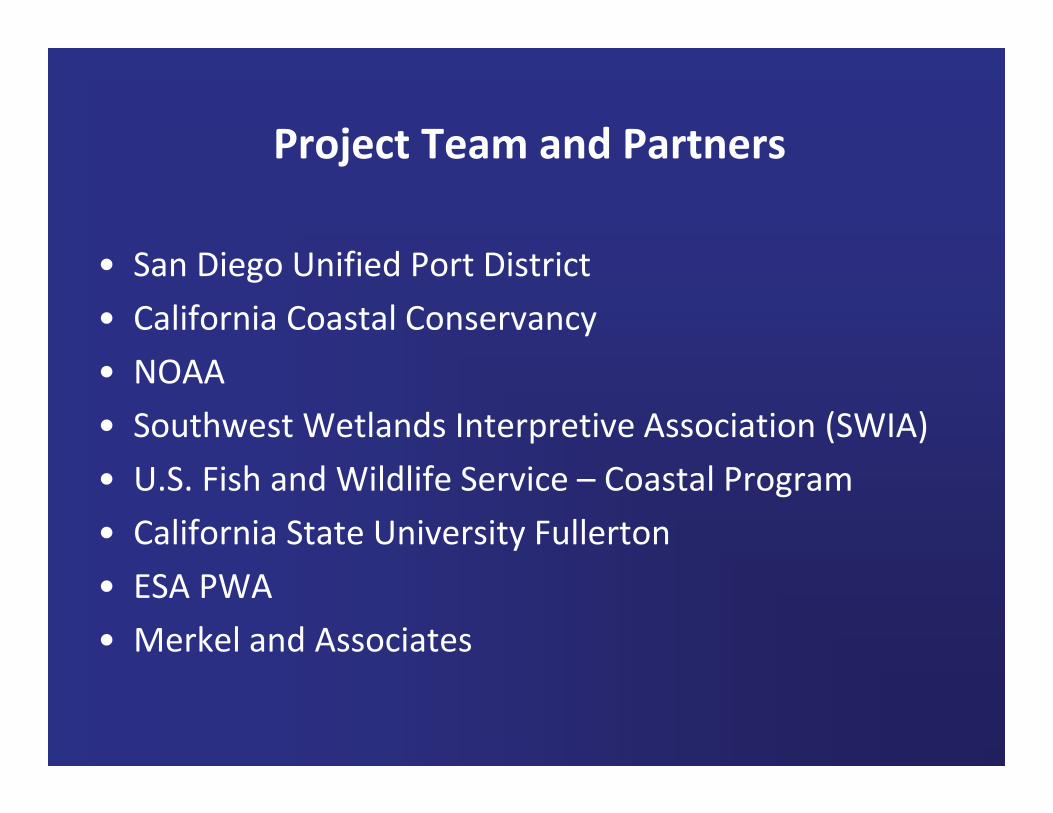
Project Team and Partners
• San Diego Unified Port District• California Coastal Conservancy• NOAA• Southwest Wetlands Interpretive Association (SWIA)• U.S. Fish and Wildlife Service – Coastal Program• California State University Fullerton• ESA PWA• Merkel and Associates

Project Goal
• Create a biologically rich native oyster bed in San DiegoBay as part of a complete marsh system, which restoresan ecological niche that was historically present, isecologically functional and resilient to changingenvironmental conditions, and also protects baytidelands and shoreline.

Project Objectives1. Evaluate existing and historical distribution of oysters in the Bay.2. Determine suitable locations for oyster bed restoration, using
existing and new data.3. Identify appropriate energy environments and sites in the Bay that
could most benefit (in terms of erosion control and ecologicalfunction) from oyster bed creation.
4. Use a pilot scale approach to establish demonstration oyster beds.5. Determine the extent to which oyster reefs enhance habitat for
invertebrates, fish, and birds, relative to areas lacking structure andrelative to pre restoration conditions.
6. Evaluate the potential for oyster beds to reduce water flowvelocities, attenuate waves, reduce erosion, and promote sedimentcapture.

Task Task Title Estimated Completion Dates1 Preliminary Studies
1. Literature Review2. Oyster Studies3. Physical Studies
1. December 31, 20132. November 31, 20133. August 16, 2013
2 Conceptual Design1. Identify potential restoration sites2. Investigate potential restoration sites3. Select restoration sites4. Draft Conceptual design
1. October 1, 20132. February 1, 20143. March 1, 20144. May 1, 2014
3 Project Plan1. Draft Project Plan2. Final Project Plan
1. May 1, 20142. July 1, 2014
4 Meetings and Presentations Monthly or as needed5 Project Management At least quarterly
Schedule

Data Collection Approach
• What information have we collected?
– Existing physical data (bathymetry, shoreline substrate)
– Habitat types
– Occurrence of native and non native oysters
– Oyster settlement and growth
– Wave energies

Physical Studies – EXISTING DATA
• Collect existing GIS data for San Diego Bay– Bathymetry– Habitats– Shoreline Structures– Ownership and Management Entities– Sediment– Water quality– Wind and wind waves
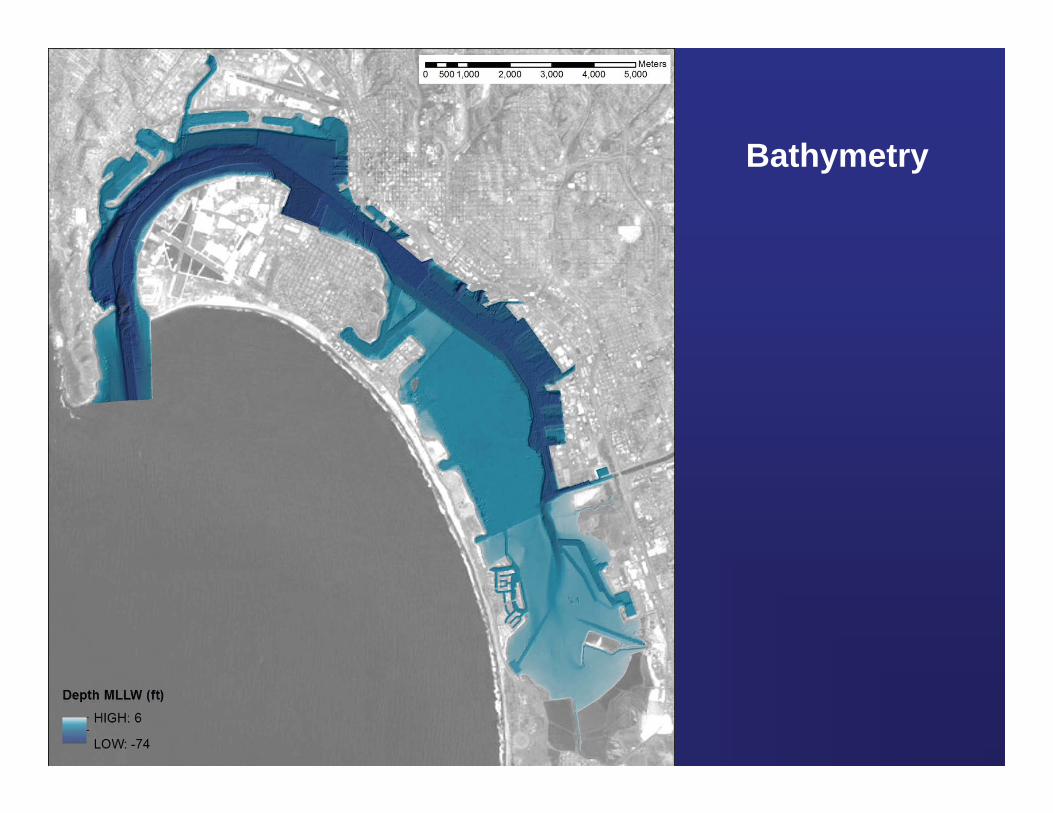
Bathymetry
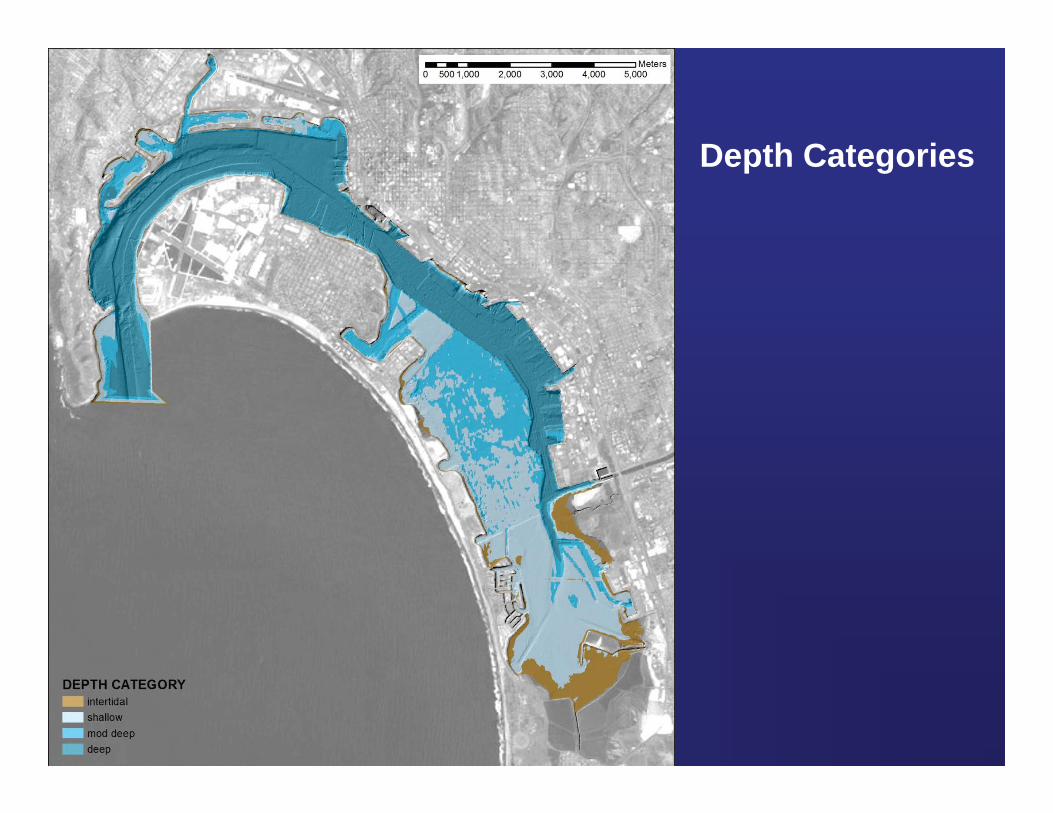
Depth Categories

Eelgrass and Depth Categories

Habitats

ShorelineSubstrate

Sea Level Rise Risk

ManagementEntities and
Stakeholders

Oyster Distribution Studies
• What is known about historic presence of oysters in San Diego Bay?
• What is the current distribution of oysters in San Diego Bay?
• What is the distributional relationship between native and non-native oysters?

Oyster Distribution Studies METHODS
• Literature Review
• Qualitative: Bay-wide oyster presence survey– Oysters of both species classified as high, medium or low
density

Historic presence in San Diego Bay
• SDMNH has extensive “Ostrea lurida”collections from San Diego Bay at leastas far back as Pleistocene
• Pliocene collections include otheroyster species collected in San Diegobut whose current distributions are inthe Sea of Cortez
• Difficult to find quantitative data oreven mention of “beds” but presencenoted in multiple published documentsfrom Ingersoll (1881) onward
• Example: Ingersoll mentions that at LaPunta on the south side, there aresufficient numbers of oysters ofsufficient size to have commercialimportance (but coppery flavor noted)

Historic Presence
Pleistocene (11,000 2.5mya)
2000
1881
2005 2007

OysterDistributionStudiesRESULTS
• Qualitative• Densities are
relative to each other
• Native and non-native oysters co-occur at most locations
• Species display zonation
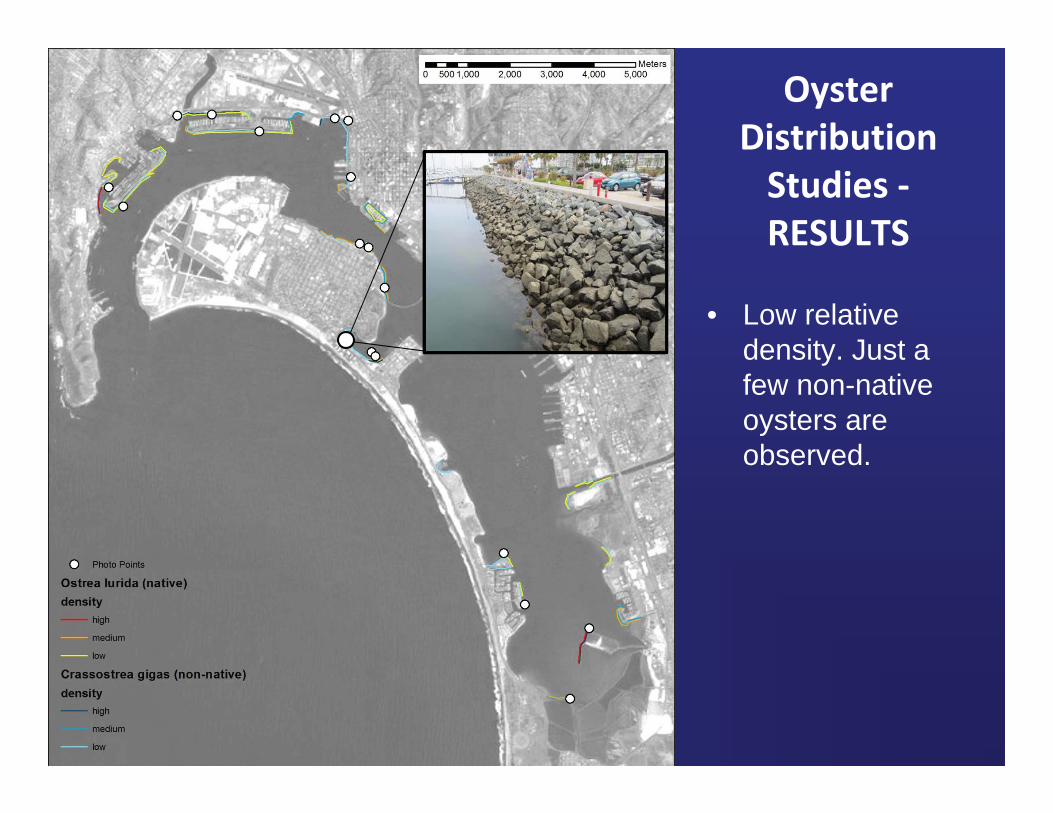
OysterDistributionStudiesRESULTS
• Low relative density. Just a few non-native oysters are observed.

OysterDistributionStudiesRESULTS
• Medium relative densities
• Zonation apparent

OysterDistributionStudiesRESULTS
• High relative densities of non-native oysters

Oyster Zonation – San Diego Bay

Oyster Zonation – Alamitos Bay and Huntington Harbor

Oyster Zonation – Alamitos Bay and Huntington Harbor
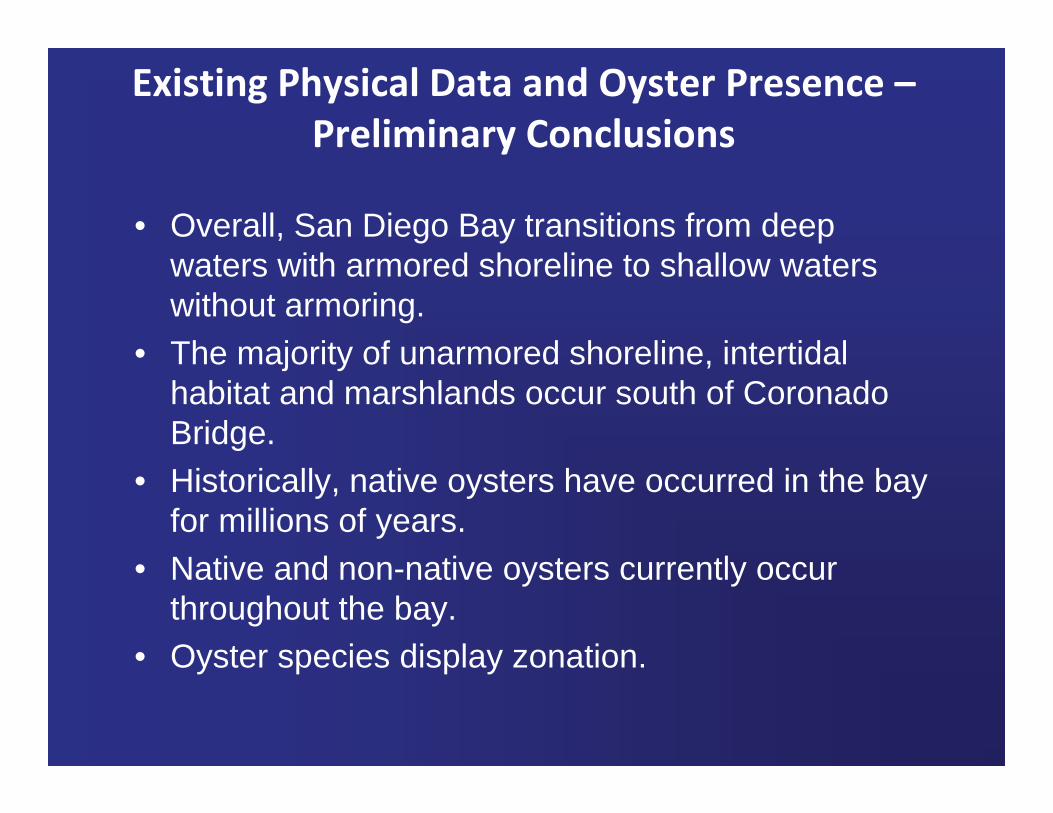
Existing Physical Data and Oyster Presence –Preliminary Conclusions
• Overall, San Diego Bay transitions from deep waters with armored shoreline to shallow waters without armoring.
• The majority of unarmored shoreline, intertidal habitat and marshlands occur south of Coronado Bridge.
• Historically, native oysters have occurred in the bay for millions of years.
• Native and non-native oysters currently occur throughout the bay.
• Oyster species display zonation.

Oyster Settlement and Growth Studies• Do native oysters settle onto and grow on
new substrate in San Diego Bay?
• What is the peak season/time for settlement?
• At what rate does settlement occur?
• What is the growth rate of settled oysters?
• Do non-native oysters and other non-native species also settle onto new substrate?
• How do results compare to another southern California wetland?

D Street
Signature Park
J Street
Chula Vista
Pond 11
Grand Caribe

D Street

Signature Park

J Street

Chula Vista

Pond 11
NORTH
SOUTH

Grand Caribe

• Study dates: May – October 2013• Four PVC Ts with ceramic tiles placed at each site• All Ts placed at same tidal elevation• Tiles collected biweekly• All settled oysters counted in lab• New/clean tiles returned to the field
Oyster Settlement METHODS

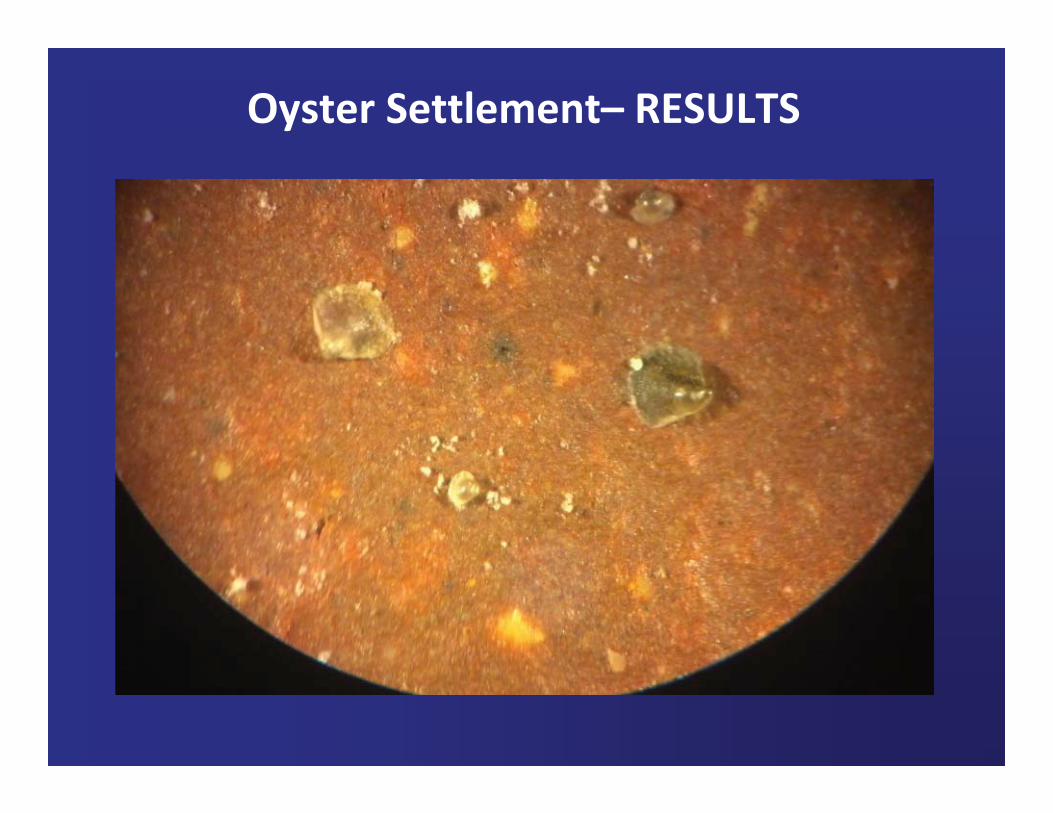
Oyster Settlement – RESULTS
Error Bars = ±1SE

Oyster Settlement– RESULTS
Error Bars = ±1SE

Oyster Settlement– RESULTS

Oyster Settlement– RESULTS
Oyster Settlement– RESULTS

Oyster Settlement– RESULTS

Oyster Settlement in Newport Bay
Error Bars = ±1SE

Oyster Settlement in Newport Bay
Error Bars = ±1SE
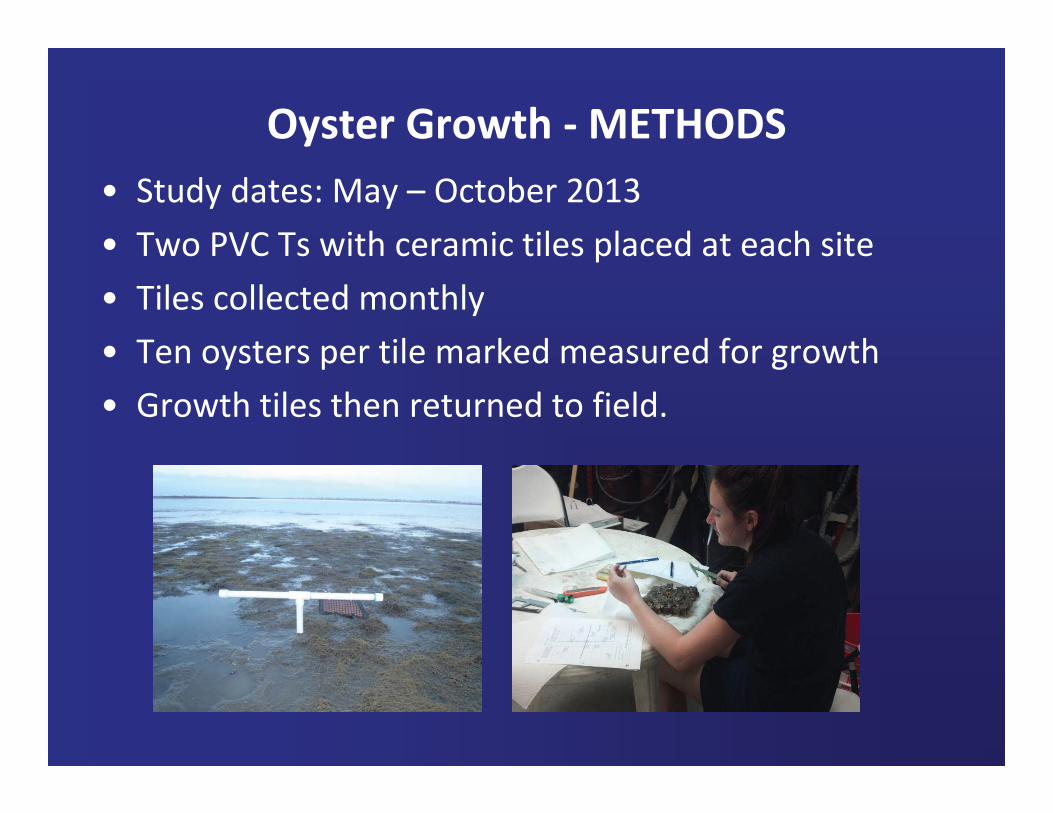
• Study dates: May – October 2013• Two PVC Ts with ceramic tiles placed at each site• Tiles collected monthly• Ten oysters per tile marked measured for growth• Growth tiles then returned to field.
Oyster Growth METHODS

Oyster Growth – RESULTS
Error Bars = ±1SE

Oyster Growth – RESULTS

Oyster Growth – RESULTS

Oyster Growth – RESULTS
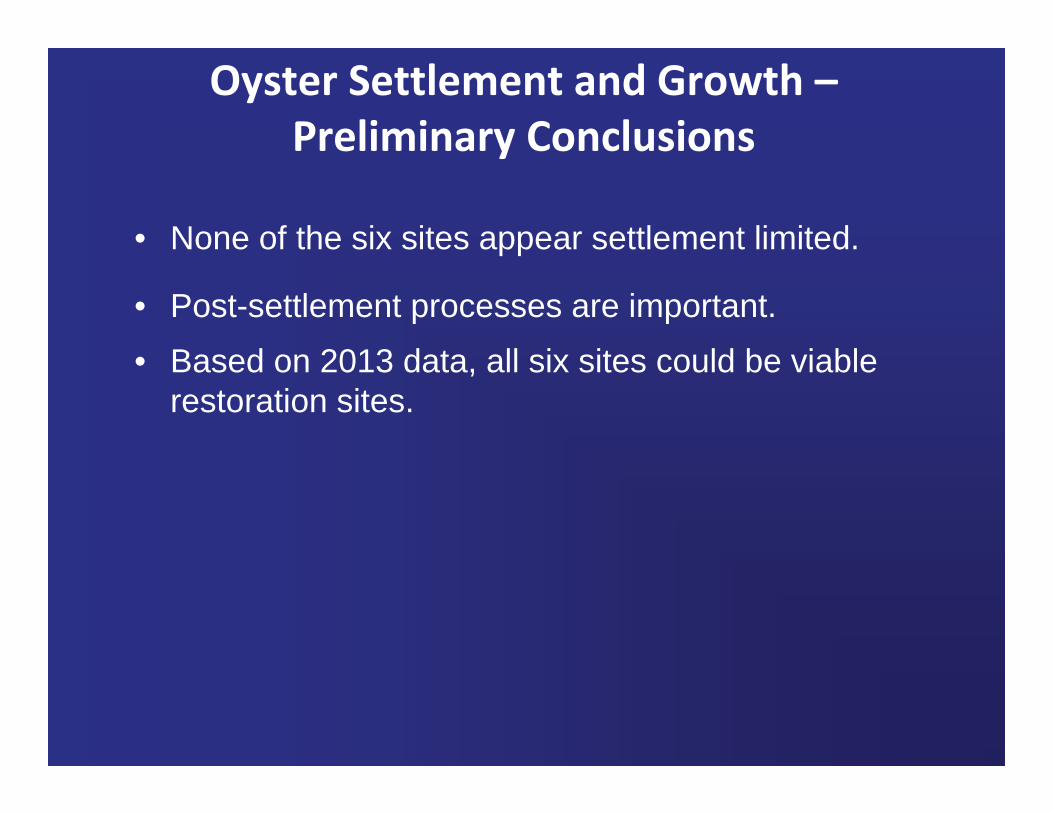
Oyster Settlement and Growth –Preliminary Conclusions
• None of the six sites appear settlement limited.
• Post-settlement processes are important.• Based on 2013 data, all six sites could be viable
restoration sites.

Oyster Distribution Studies METHODS
• Quantitative: Density and habitat % cover at six study sites– Laid out 50 m X 2 m transect at + 1.0 MLLW– Randomly placed 30 quadrats for point-contact and
density counts of native and non-native oysters

Oyster Distribution Studies RESULTS
0
10
20
30
40
50
60
70
80
90
100
ChulaVista
D Street GrandCaribe
J Street Pond 11N
Pond 11S
SignaturePark
%Ha
rdSubstrata
• At +1.0 MLLW, very different amounts of hard substrata available
• % Hard substrate varied widely across sites at the tidal height surveyed

Oyster Distribution Studies RESULTS
Error Bars = ±1SE
• At +1.0 ft. MLLW, more natives than non natives• Both species of oysters were present at all sites• Habitat differences – Chula Vista was cobble, D street was mud, etc.• Some sampling biases and an error
0
50
100
150
200
250
300
Chula Vista D StreetMarsh
GrandCaribe Isle
J StreetMarina
Pond 11North
Pond 11South
SignaturePark
Oysters/m
2 O. lurida
C. gigas

R² = 0.9044
R² = 0.0468
-50
0
50
100
150
200
250
0 20 40 60 80 100
Oys
ters
/m2
% Hard Substrata
O. lurida
C. gigas
Oyster Distribution Studies RESULTS

Oyster Distribution Studies – NewportBay (2010 2012)
Error Bars = ±1SE
0
10
20
30
40
50
60
70
80
90
15th Street Coney Island Hwy 1 Rocky Point
Oys
ters
/m2
O. lurida
C. gigas
• Native oyster density in San Diego Bay is comparable toNewport Bay, non natives are more abundant in San Diego Baythan in Newport Bay
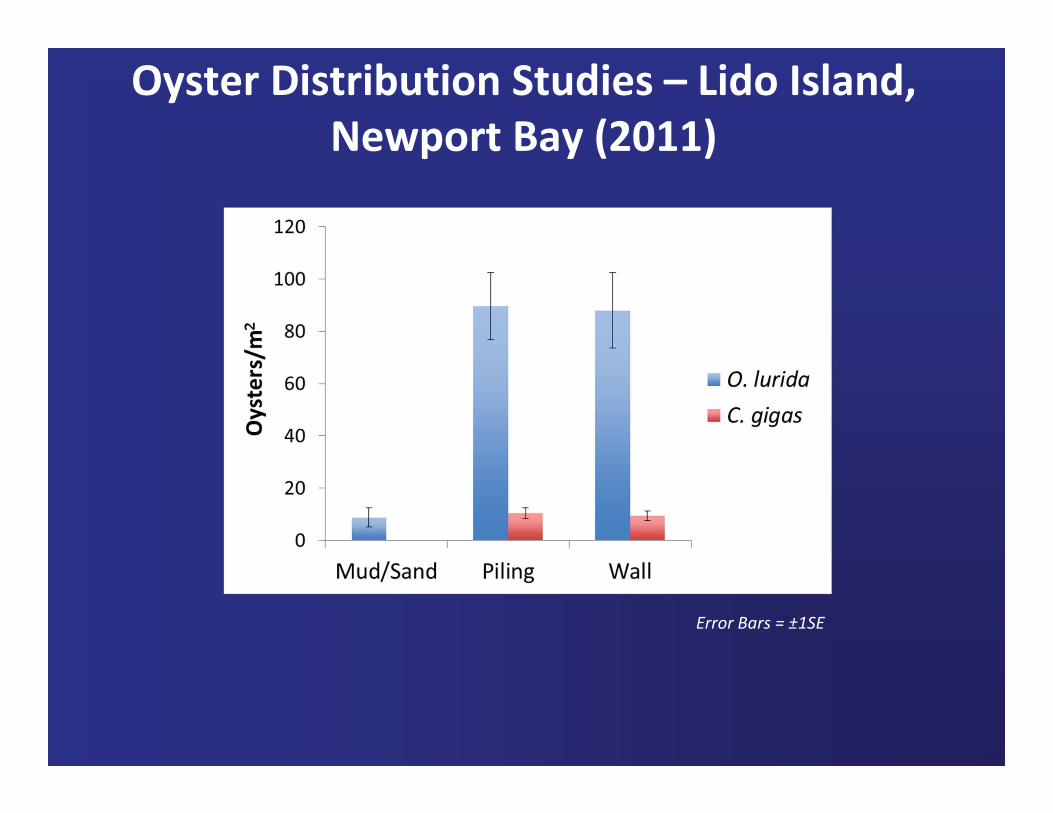
Oyster Distribution Studies – Lido Island,Newport Bay (2011)
Error Bars = ±1SE

• Both native and non native oysters arepresent at nearly all locations surveyedthroughout the bay
• Densities of native oysters are comparable toNewport Bay, non natives are more abundantin San Diego Bay than in Newport Bay
• Native oyster density is correlated with % hardsubstrata, non native oyster density is not
Oyster Distribution Studies –Preliminary Conclusions

Project Objectives1. Evaluate existing and historical distribution of oysters in the Bay.2. Determine suitable locations for oyster bed restoration, using
existing and new data.3. Identify appropriate energy environments and sites in the Bay that
could most benefit (in terms of erosion control and ecologicalfunction) from oyster bed creation.
4. Use a pilot scale approach to establish demonstration oyster beds.5. Determine the extent to which oyster reefs enhance habitat for
invertebrates, fish, and birds, relative to areas lacking structure andrelative to pre restoration conditions.
6. Evaluate the potential for oyster beds to reduce water flowvelocities, attenuate waves, reduce erosion, and promote sedimentcapture.

Physical Studies QUESTION
• Where are wave energies highest and lowest in the Bay?

Physical Studies – WIND WAVES
• Complete preliminary modeling of wave energies using existing data– The Hasselmann Method from the Shore Protection
Manual calculates shallow water wave power from water depth, wind speed, and fetch length
• The water depth was calculated as the difference between MHHW and the bathymetry (as a simplifying assumption)
• Fetch length was calculated as the distance to a point above MHHW
• Wind speed was from CIMIS station #184
– Instantaneous wave power was calculated at each point in a grid for each wind speed and each direction
– The wave power was weighted by the % occurrence of each wind speed and direction

PhysicalStudiesRESULTS
• High wave power along the southeasternshore
• Low wave power in the north and along the west shore
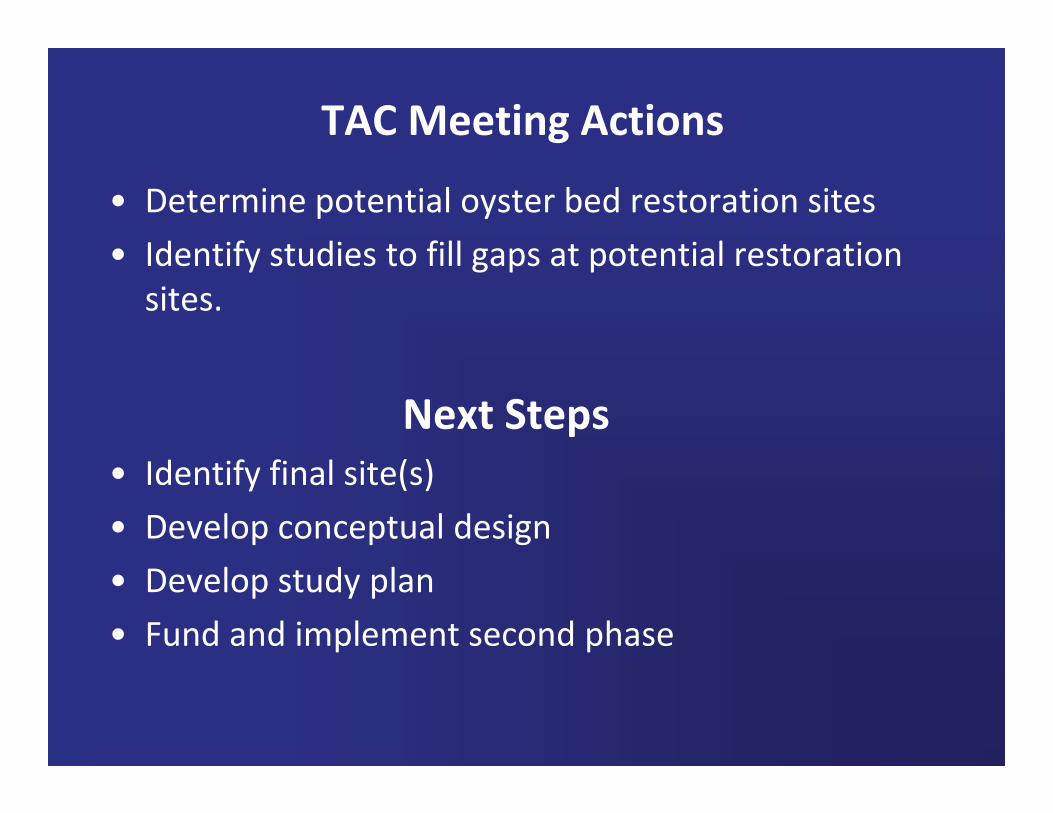
TAC Meeting Actions
• Determine potential oyster bed restoration sites• Identify studies to fill gaps at potential restorationsites.
Next Steps• Identify final site(s)• Develop conceptual design• Develop study plan• Fund and implement second phase

Criteria for Potential Restoration Sites• TIER I: Criteria for all possible restoration sites:
– Bathymetry– Physiological parameters– salinity, turbidity, DO, temperature,
water quality, nutrients, sediment type– Hydrologic regime (Energy environment, inundation/tidal
elevation)
• TIER II: Criteria for all sites that would help us learnsomething about effects of oyster bed restoration onwave energy:– Not armored– Erosive sites– High wave energy– Offshore of marshes that we want to protect
• TIER III: Criteria for sites that are feasible:– Property ownership– Access

PotentialRestoration
Sites

Data Gaps• Physical Environment Data Needs
– Wave Energy and Shoreline Erosion– Sedimentation– Sediment Type at Restoration Site(s)– Water Quality
• Biological Data Needs– Settlement and growth for other species– Better growth data for native oysters– Causes of observed oyster species zonation

PhysicalStudiesWIND
• Wind data from CIMIS station #184 had the longest data set closest to the bay

PhysicalStudiesWIND
• Wind data from CIMIS station #184, located at Balboa Park, was used to generate a % occurrence table

PhysicalStudies –WATERDEPTH
• Water depths were calculated at each point using the Merkel bathymetry

PhysicalStudies –
WIND FETCH
• Fetch length was calculated from each point to the nearest point above MHHW in each direction
• Wave height, period, and power was calculated for each direction and a range of wind speeds

PhysicalStudies –WAVEPOWER
• Wave power for each direction and wind speed is weighted by % occurrence and summed to give a total average annual wave power index

Field Studies
• GIS data collection (bathymetry, tides, shorelineownership, etc.)
• Weather station and wave gauges• Water quality (temperature, salinity, turbidity,etc.)
• Modeling

Physical Studies –DATA COLLECTION
PLANGoal:• Confirm Bay wind
and waves• Establish erosion
thresholdsPlan:• Wind gage• Directional wave
gage (ADCP)• Shoreline wave
gages (pressure sensors)– Two eroding sites– Two stable sites


Physical DataSEDIMENT
• Sampling locations for Merkel 2000 study

Physical Studies – Sediment Grain Size• Grain Size Analysis (Merkel 2000)

Physical Studies – Sediment Deposition• Sediment Deposition (Merkel 2000)
(Eelgrass present initially)
(Eelgrass not present initially)

Physical Studies – Sediment Deposition• Sediment Deposition (Merkel 2000)

Physical Studies Salinity• Salinity (Merkel 2000)
(Eelgrass present initially)
(Eelgrass not present initially)

Physical Studies DATA• Salinity (Tierra Data 2012)

Physical Studies DATA• Salinity (Tierra Data 2012)

Percent Recovery

Merkel & Associates, Inc. 5434 Ruffin Road, San Diego, CA 92123 Tel: 858/560-5465 Fax: 858/560-7779 e-mail: [email protected]
Environmental Shoreline Erosion Protection
Demonstration Project Contract 55724 Quarterly Progress Report No. 12
Quarter ending August 31, 2012
DESCRIPTION OF WORK COMPLETED
Final edits to Year 1 monitoring report CUMULATIVE DOLLAR COSTS INCURRED
$106,964.49 (before 25% matching funds deduction. $80,223.36 of project budget) ANTICIPATED WORK FOR NEXT QUARTER
No additional work will occur until after the end of the tern breeding season (September 15). PERCENTAGE OF WORK COMPLETE
41%
EXPECTED COMPLETION DATE FOR REMAINING WORK
All work, including Project Final Report, will be completed on or before August 31, 2014
PROBLEM AREAS/ISSUES THAT MAY AFFECT PROJECT COST AND/OR SCHEDULE No issues thus far.
Keith W. Merkel Principal Consultant

Merkel & Associates, Inc. 5434 Ruffin Road, San Diego, CA 92123 Tel: 858/560-5465 Fax: 858/560-7779 e-mail: [email protected]
Environmental Shoreline Erosion Protection
Demonstration Project Contract 55724 Quarterly Progress Report No. 13
Quarter ending November 30, 2012
DESCRIPTION OF WORK COMPLETED
No work conducted during this quarter CUMULATIVE DOLLAR COSTS INCURRED
$106,964.48 (before 25% matching funds deduction. $80,223.36 of project budget) ANTICIPATED WORK FOR NEXT QUARTER
PERCENTAGE OF WORK COMPLETE
41%
EXPECTED COMPLETION DATE FOR REMAINING WORK
All work, including Project Final Report, will be completed on or before August 31, 2014
PROBLEM AREAS/ISSUES THAT MAY AFFECT PROJECT COST AND/OR SCHEDULE No issues thus far.
Keith W. Merkel Principal Consultant

Merkel & Associates, Inc. 5434 Ruffin Road, San Diego, CA 92123 Tel: 858/560-5465 Fax: 858/560-7779 e-mail: [email protected]
Environmental Shoreline Erosion Protection
Demonstration Project Contract 55724 Quarterly Progress Report No. 14
Quarter ending February 28, 2013
DESCRIPTION OF WORK COMPLETED
Preparation for March monitoring work CUMULATIVE DOLLAR COSTS INCURRED
$107,071.49 (before 25% matching funds deduction. $80,303.61 of project budget) ANTICIPATED WORK FOR NEXT QUARTER
Monitoring/assessment of treatments and plantings. PERCENTAGE OF WORK COMPLETE
41%
EXPECTED COMPLETION DATE FOR REMAINING WORK
All work, including Project Final Report, will be completed on or before August 31, 2014
PROBLEM AREAS/ISSUES THAT MAY AFFECT PROJECT COST AND/OR SCHEDULE No issues thus far.
Keith W. Merkel Principal Consultant

Merkel & Associates, Inc. 5434 Ruffin Road, San Diego, CA 92123 Tel: 858/560-5465 Fax: 858/560-7779 e-mail: [email protected]
Environmental Shoreline Erosion Protection
Demonstration Project Contract 55724 Quarterly Progress Report No. 15
Quarter ending May 31, 2012
DESCRIPTION OF WORK COMPLETED
Monitoring/assessment of treatments and plantings
CUMULATIVE DOLLAR COSTS INCURRED
$112,172.24 (before 25% matching funds deduction. $84,129.18 of project budget) ANTICIPATED WORK FOR NEXT QUARTER
Preparation of Year 2 monitoring report PERCENTAGE OF WORK COMPLETE
44%
EXPECTED COMPLETION DATE FOR REMAINING WORK
All work, including Project Final Report, will be completed on or before August 31, 2014
PROBLEM AREAS/ISSUES THAT MAY AFFECT PROJECT COST AND/OR SCHEDULE No issues thus far.
Keith W. Merkel Principal Consultant

Merkel & Associates, Inc. 5434 Ruffin Road, San Diego, CA 92123 Tel: 858/560-5465 Fax: 858/560-7779 e-mail: [email protected]
Environmental Shoreline Erosion Protection
Demonstration Project Contract 55724 Quarterly Progress Report No. 16
Quarter ending August 31, 2013
DESCRIPTION OF WORK COMPLETED
Preparation of Year 2 monitoring report Scope of contract changed to focus on living shoreline oyster reef Contract end date extended to August 31, 2015 Oyster settlement, growth, and distribution sites implemented at six sites in South San Diego Bay Collection and analysis of historic oyster data for San Diego Bay
CUMULATIVE DOLLAR COSTS INCURRED
$142,320.65 (before 25% matching funds deduction. $106,740.49 of project budget) ANTICIPATED WORK FOR NEXT QUARTER
Address any comments to Year 2 monitoring report Analyze field data collected in oyster settlement, growth, and distribution studies Prepare 2-D model to predict wave energies in San Diego Bay
PERCENTAGE OF WORK COMPLETE
55%
EXPECTED COMPLETION DATE FOR REMAINING WORK
All work, including Project Final Report, will be completed on or before August 31, 2015
PROBLEM AREAS/ISSUES THAT MAY AFFECT PROJECT COST AND/OR SCHEDULE No issues thus far.
Keith W. Merkel Principal Consultant

Merkel & Associates, Inc. 5434 Ruffin Road, San Diego, CA 92123 Tel: 858/560-5465 Fax: 858/560-7779 e-mail: [email protected]
Environmental Shoreline Erosion Protection
Demonstration Project Contract 55724 Quarterly Progress Report No. 17
Quarter ending November 30, 2013
DESCRIPTION OF WORK COMPLETED
Analyzed field data collected in oyster settlement, growth, and distribution studies Prepared 2-D model to predict wave energies in San Diego Bay
CUMULATIVE DOLLAR COSTS INCURRED
$133,280.73 of project budget ANTICIPATED WORK FOR NEXT QUARTER
Prepare for and conduct first Technical Advisory Committee (TAC) meeting. Data presented to include preliminary results from oyster settlement, growth, and distribution studies, as well as 2-D wave energy model and presentation of historic oyster distribution data
Select potential oyster reef restoration sites Deploy wave gauges at potential restoration sites
PERCENTAGE OF WORK COMPLETE
69%
EXPECTED COMPLETION DATE FOR REMAINING WORK
All work, including Project Final Report, will be completed on or before August 31, 2015
PROBLEM AREAS/ISSUES THAT MAY AFFECT PROJECT COST AND/OR SCHEDULE No issues thus far.
Keith W. Merkel Principal Consultant