livingston parish louisiana home sales april 2013 vs april 2014
TRANSCRIPT

Apr-2014150,555
Apr-2013158,900
%-5
Change-8,345
Apr-2013 vs Apr-2014: The median sold price is down -5%Median Sold Price by Month
Accurate Valuations Group
Apr-2013 vs. Apr-2014
William Cobb
Clarus MarketMetrics® 05/19/2014Information not guaranteed. © 2014 - 2015 Terradatum and its suppliers and licensors (www.terradatum.com/about/licensors.td).
1/2
MLS: GBRAR Bedrooms:AllAll
Construction Type:All1 Year Monthly SqFt:
Bathrooms: Lot Size:All All Square FootagePeriod:All
County:Property Types: : Residential
LivingstonPrice:

Median Sold Price by MonthApr-2013 vs Apr-2014: The median sold price is down -5%
Accurate Valuations GroupWilliam Cobb
Sold Median Price Units Avg DOMTime Period
Apr-14 150,555 150 104
Mar-14 155,000 124 122
Feb-14 153,250 102 102
Jan-14 142,700 85 89
Dec-13 158,500 108 80
Nov-13 150,524 124 91
Oct-13 145,000 109 101
Sep-13 153,464 140 84
Aug-13 149,450 160 94
Jul-13 156,000 137 77
Jun-13 156,000 125 90
May-13 141,250 132 93
Apr-13 158,900 137 74
Clarus MarketMetrics® 05/19/2014Information not guaranteed. © 2014 - 2015 Terradatum and its suppliers and licensors (www.terradatum.com/about/licensors.td).
22/

Apr-2013 vs Apr-2014: The median price of for sale properties is up 2% and the median price of sold properties is down -5%
Accurate Valuations Group
Apr-2013 vs. Apr-2014
159,250 2
William Cobb
162,000Apr-2014
Median For Sale vs Median Sold
ChangeApr-2013 %2,750
Apr-2013 Apr-2014 %158,900 -5
Apr-2013 vs. Apr-2014
150,555Change-8,345
Clarus MarketMetrics® 05/19/2014Information not guaranteed. © 2014 - 2015 Terradatum and its suppliers and licensors (www.terradatum.com/about/licensors.td).
1/2
MLS: GBRAR Bedrooms:AllAll
Construction Type:All1 Year Monthly SqFt:
Bathrooms: Lot Size:All All Square FootagePeriod:All
County:Property Types: : Residential
LivingstonPrice:

Median For Sale vs Median SoldApr-2013 vs Apr-2014: The median price of for sale properties is up 2% and the median price of sold properties is down -5%
Accurate Valuations GroupWilliam Cobb
For SaleMedian SoldMedianFor Sale # Properties # PropertiesSold Price Difference
Time Period
Apr-14 943 150162,000 150,555 -11,445Mar-14 947 124160,000 155,000 -5,000Feb-14 904 102159,900 153,250 -6,650Jan-14 889 85155,000 142,700 -12,300Dec-13 910 108155,265 158,500 3,235Nov-13 985 124157,900 150,524 -7,376Oct-13 1,045 109159,000 145,000 -14,000Sep-13 1,014 140159,000 153,464 -5,536Aug-13 1,012 160155,950 149,450 -6,500Jul-13 987 137156,500 156,000 -500Jun-13 964 125156,450 156,000 -450May-13 925 132157,900 141,250 -16,650Apr-13 920 137159,250 158,900 -350
Clarus MarketMetrics®Information not guaranteed. © 2014 - 2015 Terradatum and its suppliers and licensors (www.terradatum.com/about/licensors.td).
05/19/201422/

Apr-2014150
Apr-2013137
%9
Change13
Apr-2013 vs Apr-2014: The number of Sold properties is up 9%Sold Properties by Month
Accurate Valuations Group
Apr-2013 vs. Apr-2014
William Cobb
Clarus MarketMetrics® 05/19/2014Information not guaranteed. © 2014 - 2015 Terradatum and its suppliers and licensors (www.terradatum.com/about/licensors.td).
1/2
MLS: GBRAR Bedrooms:AllAll
Construction Type:All1 Year Monthly SqFt:
Bathrooms: Lot Size:All All Square FootagePeriod:All
County:Property Types: : Residential
LivingstonPrice:

Sold Properties by MonthApr-2013 vs Apr-2014: The number of Sold properties is up 9%
Accurate Valuations GroupWilliam Cobb
Time Period Units Median Price Avg DOM
Apr-14 150,555150 104Mar-14 155,000124 122Feb-14 153,250102 102Jan-14 142,70085 89Dec-13 158,500108 80Nov-13 150,524124 91Oct-13 145,000109 101Sep-13 153,464140 84Aug-13 149,450160 94Jul-13 156,000137 77Jun-13 156,000125 90May-13 141,250132 93Apr-13 158,900137 74
Clarus MarketMetrics® 05/19/2014Information not guaranteed. © 2014 - 2015 Terradatum and its suppliers and licensors (www.terradatum.com/about/licensors.td).
22/

Apr-2014200
Apr-2013141
%42
Change59
Apr-2013 vs Apr-2014: The number of Under Contract properties is up 42%Under Contract Properties by Month
Accurate Valuations Group
Apr-2013 vs. Apr-2014
William Cobb
Clarus MarketMetrics® 05/19/2014Information not guaranteed. © 2014 - 2015 Terradatum and its suppliers and licensors (www.terradatum.com/about/licensors.td).
1/2
AllBathrooms: SqFt:All
: Residential
All Square FootageConstruction Type: Lot Size:GBRAR
Livingston
Period: 1 Year MonthlyPrice:MLS:
All AllAll
Property Types:
Bedrooms:
County:

Under Contract Properties by MonthApr-2013 vs Apr-2014: The number of Under Contract properties is up 42%
Accurate Valuations GroupWilliam Cobb
Units Avg DOMMedian PriceTime PeriodApr-14 164,900200 96Mar-14 159,900172 90Feb-14 149,100113 121Jan-14 155,265113 118Dec-13 156,50087 98Nov-13 161,225112 77Oct-13 158,500124 94Sep-13 150,950108 102Aug-13 154,900145 75Jul-13 149,150126 80Jun-13 164,950126 93May-13 157,000121 89Apr-13 154,900141 89
Clarus MarketMetrics® 05/19/2014Information not guaranteed. © 2014 - 2015 Terradatum and its suppliers and licensors (www.terradatum.com/about/licensors.td).
22/

Apr-2014226
Apr-2013244
%-7
Change-18
Apr-2013 vs Apr-2014: The number of New properties is down -7%New Properties by Month
Accurate Valuations Group
Apr-2013 vs. Apr-2014
William Cobb
Clarus MarketMetrics® 05/19/2014Information not guaranteed. © 2014 - 2015 Terradatum and its suppliers and licensors (www.terradatum.com/about/licensors.td).
1/2
MLS: GBRAR Bedrooms:AllAll
Construction Type:All1 Year Monthly SqFt:
Bathrooms: Lot Size:All All Square FootagePeriod:All
County:Property Types: : Residential
LivingstonPrice:
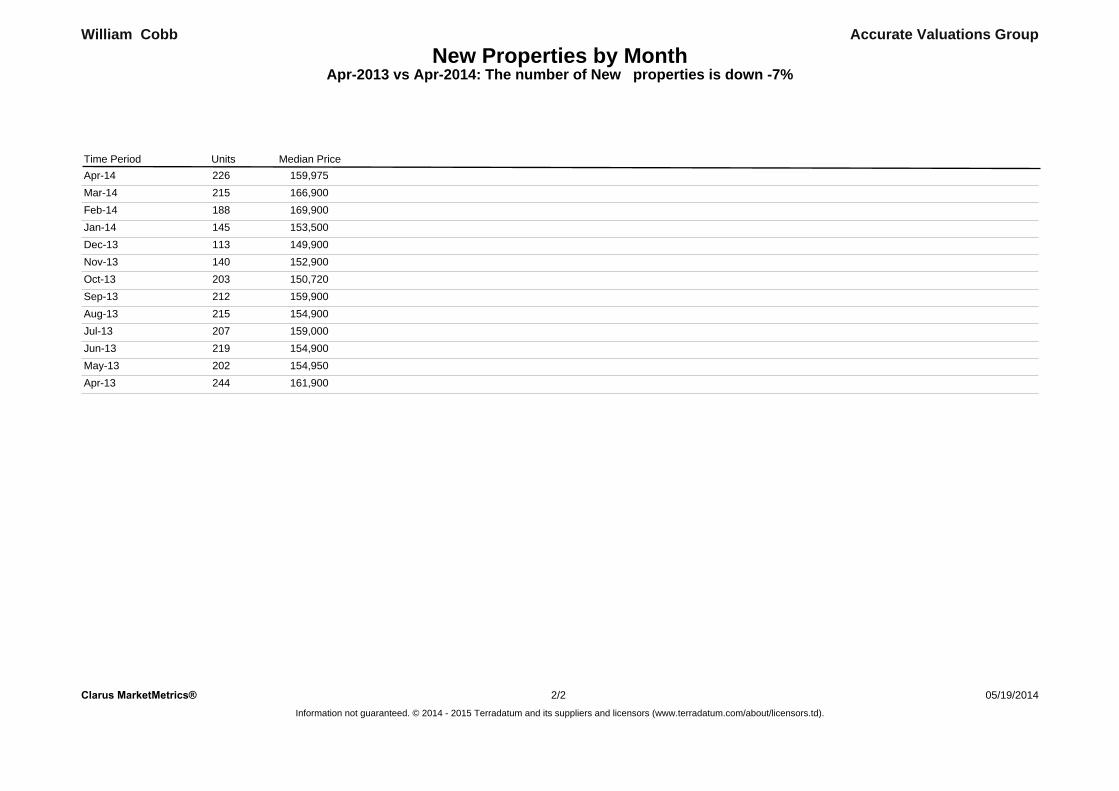
New Properties by MonthApr-2013 vs Apr-2014: The number of New properties is down -7%
Accurate Valuations GroupWilliam Cobb
Units Median PriceTime PeriodApr-14 159,975226Mar-14 166,900215Feb-14 169,900188Jan-14 153,500145Dec-13 149,900113Nov-13 152,900140Oct-13 150,720203Sep-13 159,900212Aug-13 154,900215Jul-13 159,000207Jun-13 154,900219May-13 154,950202Apr-13 161,900244
Clarus MarketMetrics® 05/19/2014Information not guaranteed. © 2014 - 2015 Terradatum and its suppliers and licensors (www.terradatum.com/about/licensors.td).
22/

Apr-2014943
Apr-2013920
%3
Change23
Apr-2013 vs Apr-2014: The number of For Sale properties is up 3%For Sale Properties by Month
Accurate Valuations Group
Apr-2013 vs. Apr-2014
William Cobb
Clarus MarketMetrics® 05/19/2014Information not guaranteed. © 2014 - 2015 Terradatum and its suppliers and licensors (www.terradatum.com/about/licensors.td).
1/2
MLS: GBRAR Bedrooms:AllAll
Construction Type:All1 Year Monthly SqFt:
Bathrooms: Lot Size:All All Square FootagePeriod:All
County:Property Types: : Residential
LivingstonPrice:

For Sale Properties by MonthApr-2013 vs Apr-2014: The number of For Sale properties is up 3%
Accurate Valuations GroupWilliam Cobb
Units Avg DOMMedian PriceTime Period
Apr-14 162,000943 132Mar-14 160,000947 137Feb-14 159,900904 146Jan-14 155,000889 154Dec-13 155,265910 150Nov-13 157,900985 136Oct-13 159,0001,045 127Sep-13 159,0001,014 127Aug-13 155,9501,012 124Jul-13 156,500987 125Jun-13 156,450964 125May-13 157,900925 127Apr-13 159,250920 126
Clarus MarketMetrics® 05/19/2014Information not guaranteed. © 2014 - 2015 Terradatum and its suppliers and licensors (www.terradatum.com/about/licensors.td).
22/

Apr-201462
Apr-201356
%11
Change6
Apr-2013 vs Apr-2014: The number of Expired properties is up 11%Expired Properties by Month
Accurate Valuations Group
Apr-2013 vs. Apr-2014
William Cobb
05/19/2014Clarus MarketMetrics® 1/2
MLS: GBRAR Bedrooms:AllAll
Construction Type:All1 Year Monthly SqFt:
Bathrooms: Lot Size:All All Square FootagePeriod:All
County:Property Types: : Residential
LivingstonPrice:

Expired Properties by MonthApr-2013 vs Apr-2014: The number of Expired properties is up 11%
Accurate Valuations GroupWilliam Cobb
Avg DOMUnits Median PriceApr-14 159,95062 270Mar-14 158,40058 173Feb-14 164,90059 194Jan-14 167,95060 196Dec-13 150,00079 177Nov-13 153,25076 178Oct-13 174,94976 157Sep-13 154,45064 173Aug-13 144,90065 167Jul-13 166,40064 201Jun-13 164,00058 168May-13 157,90059 159Apr-13 186,25056 153
Clarus MarketMetrics® 05/19/2014Information not guaranteed. © 2014 - 2015 Terradatum and its suppliers and licensors (www.terradatum.com/about/licensors.td).
22/
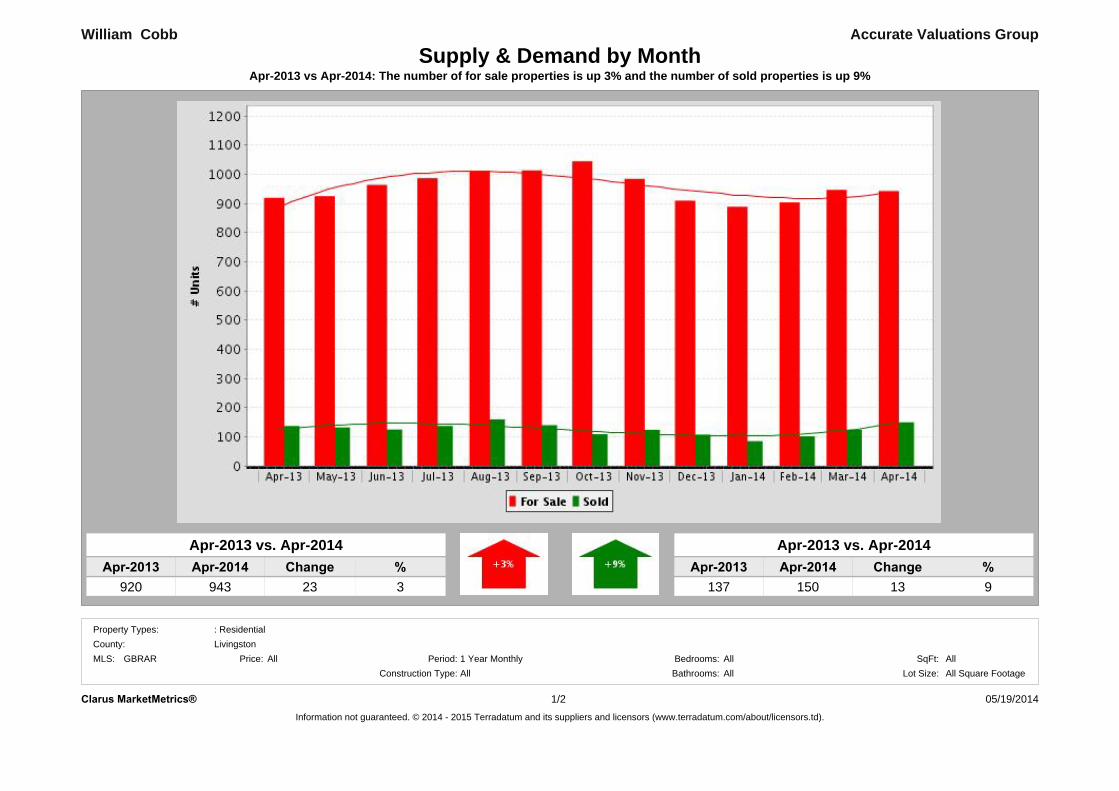
Apr-2013 vs Apr-2014: The number of for sale properties is up 3% and the number of sold properties is up 9%
Accurate Valuations Group
Apr-2013 vs. Apr-2014
920 3
William Cobb
943Apr-2014
Supply & Demand by Month
ChangeApr-2013 %23
Apr-2013 Apr-2014 %137 9
Apr-2013 vs. Apr-2014
150Change
13
Clarus MarketMetrics® 05/19/2014Information not guaranteed. © 2014 - 2015 Terradatum and its suppliers and licensors (www.terradatum.com/about/licensors.td).
1/2
MLS: GBRAR Bedrooms:AllAll
Construction Type:All1 Year Monthly SqFt:
Bathrooms: Lot Size:All All Square FootagePeriod:All
County:Property Types: : Residential
LivingstonPrice:

Supply & Demand by MonthApr-2013 vs Apr-2014: The number of for sale properties is up 3% and the number of sold properties is up 9%
William Cobb Accurate Valuations Group
For Sale Sold# Properties
Avg DOM Avg DOM# Properties
Time Period
Apr-14 132 104943 150Mar-14 137 122947 124Feb-14 146 102904 102Jan-14 154 89889 85Dec-13 150 80910 108Nov-13 136 91985 124Oct-13 127 1011,045 109Sep-13 127 841,014 140Aug-13 124 941,012 160Jul-13 125 77987 137Jun-13 125 90964 125May-13 127 93925 132Apr-13 126 74920 137
Clarus MarketMetrics® 05/19/2014Information not guaranteed. © 2014 - 2015 Terradatum and its suppliers and licensors (www.terradatum.com/about/licensors.td).
22/

Apr-201496
Apr-201389
%8
Change7
Apr-2013 vs Apr-2014: The average days on market is up 8%The Average Days on Market by Month
Accurate Valuations Group
Apr-2013 vs. Apr-2014
William Cobb
LivingstonAll 1 Year Monthly
County:Period:Price:
Property Types: : Residential
05/19/20141/2Clarus MarketMetrics®
All Square FootageBedrooms: All AllSqFt:
All Lot Size:Bathrooms:AllConstruction Type:MLS: GBRAR

The Average Days on Market by MonthApr-2013 vs Apr-2014: The average days on market is up 8%
Accurate Valuations GroupWilliam Cobb
# UC UnitsAvg DOMTime PeriodApr-14 20096Mar-14 17290Feb-14 113121Jan-14 113118Dec-13 8798Nov-13 11277Oct-13 12494Sep-13 108102Aug-13 14575Jul-13 12680Jun-13 12693May-13 12189Apr-13 14189
Clarus MarketMetrics® 2/2 05/19/2014Information not guaranteed. © 2014 - 2015 Terradatum and its suppliers and licensors (www.terradatum.com/about/licensors.td).
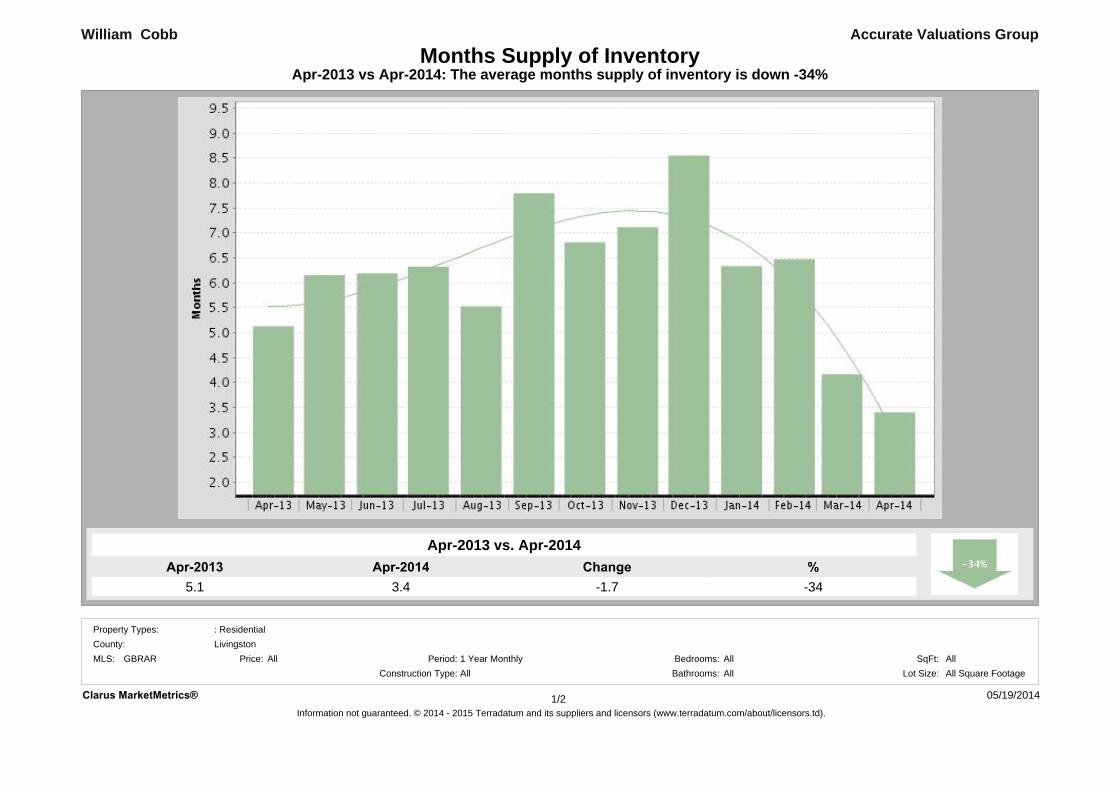
Apr-2013 vs Apr-2014: The average months supply of inventory is down -34%
Accurate Valuations Group
Apr-2013 vs. Apr-2014
5.1 -34
William Cobb
3.4Apr-2014
Months Supply of Inventory
ChangeApr-2013 %-1.7
Clarus MarketMetrics® 05/19/2014Information not guaranteed. © 2014 - 2015 Terradatum and its suppliers and licensors (www.terradatum.com/about/licensors.td).
1/2
MLS: GBRAR Bedrooms:AllAll
Construction Type:All1 Year Monthly SqFt:
Bathrooms: Lot Size:All All Square FootagePeriod:All
County:Property Types: : Residential
LivingstonPrice:

Months Supply of InventoryApr-2013 vs Apr-2014: The average months supply of inventory is down -34%
William Cobb Accurate Valuations Group
During MonthLast Day of Month MSI# Units For Sale # UC Units
UC Avg DOMTime Period
Apr-14 200 96681 3.4Mar-14 172 90717 4.2Feb-14 113 121732 6.5Jan-14 113 118716 6.3Dec-13 87 98744 8.6Nov-13 112 77797 7.1Oct-13 124 94845 6.8Sep-13 108 102842 7.8Aug-13 145 75802 5.5Jul-13 126 80797 6.3Jun-13 126 93780 6.2May-13 121 89745 6.2Apr-13 141 89723 5.1
Clarus MarketMetrics® 05/19/2014Information not guaranteed. © 2014 - 2015 Terradatum and its suppliers and licensors (www.terradatum.com/about/licensors.td).
22/