ljmu research onlineresearchonline.ljmu.ac.uk/4849/1/aa25036-14.pdf · 2 inaf – osservatorio...
TRANSCRIPT

Lardo, C, Pancino, E, Bellazzini, M, Bragaglia, A, Donati, P, Gilmore, G, Randich, S, Feltzing, S, Jeffries, RD, Vallenari, A, Alfaro, EJ, Allende Prieto, C, Flaccomio, E, Koposov, SE, Recio-Blanco, A, Bergemann, M, Carraro, G, Costado, MT, Damiani, F, Hourihane, A, Jofre, P, de Laverny, P, Marconi, G, Masseron, T, Morbidelli, L, Sacco, GG and Worley, CC
The Gaia-ESO Survey: Kinematics of seven Galactic globular clusters
http://researchonline.ljmu.ac.uk/id/eprint/4849/
Article
LJMU has developed LJMU Research Online for users to access the research output of the University more effectively. Copyright © and Moral Rights for the papers on this site are retained by the individual authors and/or other copyright owners. Users may download and/or print one copy of any article(s) in LJMU Research Online to facilitate their private study or for non-commercial research. You may not engage in further distribution of the material or use it for any profit-making activities or any commercial gain.
The version presented here may differ from the published version or from the version of the record. Please see the repository URL above for details on accessing the published version and note that access may require a subscription.
For more information please contact [email protected]
http://researchonline.ljmu.ac.uk/
Citation (please note it is advisable to refer to the publisher’s version if you intend to cite from this work)
Lardo, C, Pancino, E, Bellazzini, M, Bragaglia, A, Donati, P, Gilmore, G, Randich, S, Feltzing, S, Jeffries, RD, Vallenari, A, Alfaro, EJ, Allende Prieto, C, Flaccomio, E, Koposov, SE, Recio-Blanco, A, Bergemann, M, Carraro, G, Costado, MT, Damiani, F, Hourihane, A, Jofre, P, de Laverny, P, Marconi, G,
LJMU Research Online

http://researchonline.ljmu.ac.uk/
A&A 573, A115 (2015)DOI: 10.1051/0004-6361/201425036© ESO 2015
Astronomy&
Astrophysics
The Gaia-ESO Survey: Kinematics of seven Galacticglobular clusters?,??
C. Lardo1,2, E. Pancino2,3, M. Bellazzini2, A. Bragaglia2, P. Donati2, G. Gilmore4, S. Randich5, S. Feltzing6,R. D. Jeffries7, A. Vallenari8, E. J. Alfaro9, C. Allende Prieto10,11, E. Flaccomio12, S. E. Koposov4,13,
A. Recio-Blanco14, M. Bergemann4, G. Carraro15, M. T. Costado9, F. Damiani12, A. Hourihane4, P. Jofré4,P. de Laverny14, G. Marconi15, T. Masseron4, L. Morbidelli5, G. G. Sacco5, and C. C. Worley4
1 Astrophysics Research Institute, Liverpool John Moores University, 146 Brownlow Hill, Liverpool L3 5RF, UKe-mail: [email protected]
2 INAF – Osservatorio Astronomico di Bologna, via Ranzani 1, 40127 Bologna, Italy3 ASI Science Data Center, Via del Politecnico SNC, 00133 Roma, Italy4 Institute of Astronomy, University of Cambridge, Madingley Road, Cambridge CB3 0HA, UK5 INAF – Osservatorio Astrofisico di Arcetri, Largo E. Fermi 5, 50125 Florence, Italy6 Lund Observatory, Department of Astronomy and Theoretical Physics, Box 43, 221 00 Lund, Sweden7 Astrophysics Group, Research Institute for the Environment, Physical Sciences and Applied Mathematics, Keele University, Keele,
Staffordshire ST5 5BG, UK8 INAF – Padova Observatory, Vicolo dell’Osservatorio 5, 35122 Padova, Italy9 Instituto de Astrofísica de Andalucía-CSIC, Apdo. 3004, 18080 Granada, Spain
10 Instituto de Astrofísica de Canarias, 38205 La Laguna, Tenerife, Spain11 Universidad de La Laguna, Dept. Astrofísica, 38206 La Laguna, Tenerife, Spain12 INAF – Osservatorio Astronomico di Palermo, Piazza del Parlamento 1, 90134 Palermo, Italy13 Moscow MV Lomonosov State University, Sternberg Astronomical Institute, 119992 Moscow, Russia14 Laboratoire Lagrange (UMR 7293), Université de Nice Sophia Antipolis, CNRS, Observatoire de la Côte d’Azur, CS 34229,
06304 Nice Cedex 4, France15 European Southern Observatory, Alonso de Cordova 3107, Vitacura, Casilla 19001 Santiago de Chile, Chile
Received 20 September 2014 / Accepted 14 November 2014
ABSTRACT
The Gaia-ESO survey is a large public spectroscopic survey aimed at investigating the origin and formation history of our Galaxyby collecting spectroscopy of representative samples (about 105 Milky Way stars) of all Galactic stellar populations, in the fieldand in clusters. The survey uses globular clusters as intra- and inter-survey calibrators, deriving stellar atmospheric parameters andabundances of a significant number of stars in clusters, along with radial velocity determinations. We used precise radial velocitiesof a large number of stars in seven globular clusters (NGC 1851, NGC 2808, NGC 4372, NGC 4833, NGC 5927, NGC 6752, andNGC 7078) to validate pipeline results and to preliminarily investigate the cluster internal kinematics. Radial velocity measurementswere extracted from FLAMES/GIRAFFE spectra processed by the survey pipeline as part of the second internal data release ofdata products to ESO. We complemented our sample with ESO archival data obtained with different instrument configurations.Reliable radial velocity measurements for 1513 bona fide cluster star members were obtained in total. We measured systemic rotation,estimated central velocity dispersions, and present velocity dispersion profiles of all the selected clusters, providing the first velocitydispersion curve and the first estimate of the central velocity dispersion for the cluster NGC 5927. Finally, we explore the possiblelink between cluster kinematics and other physical parameters. The analysis we present here demonstrates that Gaia-ESO survey dataare sufficiently accurate to be used in studies of kinematics of stellar systems and stellar populations in the Milky Way.
Key words. globular clusters: general
? Full Table 3 is only available at the CDSvia anonymous ftp to cdsarc.u-strasbg.fr (130.79.128.5) or viahttp://cdsarc.u-strasbg.fr/viz-bin/qcat?J/A+A/573/A115?? Based on data products from observations made with ESOtelescopes at the La Silla Paranal Observatory under programme188.B-3002 (the public Gaia-ESO spectroscopic survey, PIsGilmore & Randich) and on the archive data of the programmes62.N-0236, 63.L-0439, 65.L-0561, 68.D-0212, 68.D-0265, 69.D-0582,064.L-0255, 065.L-0463, 071.D-0205, 073.D-0211, 073.D-0695,075.D-0492, 077.D-0246, 077.D-0652, 079.D-0645, 080.B-0489,080.D-0106, 081.D-0253, 082.B-0386, 083.B-0083, 083.D-0208,083.D-0798, 085.D-0205, 086.D-0141, 088.A-9012, 088.B-0403,
1. IntroductionGlobular clusters (GCs) have always been regarded as uniquelaboratories to explore many aspects of stellar dynamics(Meylan & Heggie 1997). In a first approximation, theycan be considered spherically symmetric, non-rotating, andisotropic; but, as improved observations and new theoreti-cal studies have become available, it became clear that theyare complex (see Zocchi et al. 2012; Bianchini et al. 2013;and Kacharov et al. 2014 for a discussion). In particular,
088.B-0492, 088.D-0026, 088.D-0519, 089.D-0038, 164.O-0561,386.D-0086.
Article published by EDP Sciences A115, page 1 of 13

A&A 573, A115 (2015)
radial anisotropy (Ibata et al. 2013), deviations from sphericity(White & Shawl 1987; Chen & Chen 2010), mass segregation(Da Costa 1982), signatures of core-collapse (Djorgovski &King 1984), and velocity dispersion inflated by unresolved bi-nary stars (Bradford et al. 2011) have been observed and need tobe explained in the framework of a dynamical scenario.
Different physical mechanisms may determine these de-viations from the perfect sphere: velocity anisotropies, tidalstresses, and internal rotation (Goodwin 1997; Gnedin et al.1999; van den Bergh 2008; Bianchini et al. 2013; Kacharov et al.2014). The idea that internal rotation plays a fundamental partin determining the morphology of GCs was formulated some50 years ago (King 1961). Internal rotation has been detected ina growing number of GCs from line-of-sight velocity measure-ments (see, e.g., Bellazzini et al. 2012, hereafter B12) and, in afew cases, from proper motion measurements (e.g., van Leeuwenet al. 2000; Anderson & King 2003). The interest in the GC in-ternal rotation is manifold. Analytical (Longaretti & Lagoute1997), Fokker-Planck (Spurzem & Einsel 1999), and N-bodymodels (Ernst et al. 2007) demonstrated that an overall (differ-ential) rotation has a noticeable influence on stellar systems thatevolve by two-body relaxation. In particular, it accelerates thecore-collapse time scales (Ernst et al. 2007)1. Internal rotationmay also play an indirect role in the open question of whetherthere are intermediate-mass black holes (IMBH) in some GCs.In fact, the detection of strong gradients in the velocity disper-sion profile toward the cluster core is often interpreted as a hintof the presence of an IMBH (Baumgardt et al. 2005), but the ev-idence gathered so far in support of the existence of IMBHs isinconclusive and controversial, and none of the published stud-ies (van der Marel & Anderson 2010; Lützgendorf et al. 2011;Lanzoni et al. 2013) did consider differential rotation, which,together with anisotropy, can yield gradients in the velocity dis-persion profiles (Varri & Bertin 2012; Bianchini et al. 2013).Finally, recent investigations indicate that rotation could be akey ingredient in the formation of multiple generations of starsin GCs (Bekki 2010; Mastrobuono-Battisti & Perets 2013).
In this science verification paper, we make use of the Gaia-ESO survey radial velocity determination to perform a kine-matic analysis for seven Galactic GCs (NGC 1851, NGC 2808,NGC 4372, NGC 4833, NGC 5927, NGC 6752, and M 15), fol-lowing the same scheme as B12. The samples we analyse werecollected for a completely different scientific purpose, thereforethey present intrinsic limitations for the characterisation of thecluster kinematics. The most recent dedicated studies used upto several hundred radial velocity determinations (see e.g., Laneet al. 2009, 2010a,b), in some cases complemented with propermotions (van de Ven et al. 2006; van den Bosch et al. 2006;McLaughlin et al. 2006; Watkins et al. 2013), while we have Vrdeterminations for fewer than 100 stars for some clusters (i.e.,NGC 2808, NGC 4833, NGC 5927). Furthermore, the clustermembers are unevenly distributed with radius within each clus-ter, with the large majority of the stars lying at distances greaterthan the half-light radius, because it is difficult to allocate fibersin the very crowded central regions.
Still, our analysis (a) provides a validation of the Gaia-ESOsurvey radial velocities in a controlled sample; (b) provides (andmakes publicly available) additional observational material tostudy the kinematics of the considered clusters; and (c) at leastin one case, NGC 5927, provides the first insight into the clusterkinematics.
1 This effect seems to vanish for isolated two-mass N-body models(Ernst et al. 2007).
This paper is structured as follows: We begin by describ-ing the data and the membership selection for each cluster inSect. 2. We compute systemic velocities and velocity dispersionsin Sect. 3, as well as rotations (in Sect. 4). In Sect. 5 we in-vestigate the links between kinematics and cluster parameters.Finally, our concluding remarks are presented in Sect. 6.
2. Sample and radial velocity measurements
2.1. Data sets
The Gaia-ESO Survey is a public spectroscopic survey thatuses the FLAMES multi-object spectrograph on the VLT UT-2(Kueyen) telescope to obtain high-quality, uniformly calibratedspectroscopy of 100 000 stars in the Milky Way (Gilmore et al.2012; Randich et al. 2013). The survey targets stars in the halo,bulge, thick and thin discs, and in star-forming regions and openclusters to characterize the chemistry and kinematics of thesepopulations. When combined with precise astrometry from therecently launched Gaia satellite (Perryman et al. 2001), the enor-mous dataset will provide three-dimensional spatial distributionand kinematics, stellar parameters, and chemical abundances fora significant number of stars in the Galaxy.
In addition to the main targets, the Gaia-ESO survey is ob-serving GCs as intra- and inter-survey astrophysical calibrators,deriving stellar atmospheric parameters, abundances, and radialvelocities (Vr) for typically a hundred red giant branch (RGB)stars in each cluster. GCs were selected among those used byother surveys as RAVE (Steinmetz et al. 2006; Zwitter et al.2008; Siebert et al. 2011; Lane et al. 2011), GALAH (Zuckeret al. 2013), and APOGEE (Frinchaboy et al. 2012, 2013a,b;Mészáros et al. 2013) where possible. The photometric cata-logues for the selected clusters are generally based on UBVIarchival images, collected at the Wide-Field Imager (WFI) at the2.2 m ESO-MPI telescope. The WFI covers a total field of viewof 34′ × 33′, consisting of 8, 2048 × 4096 EEV-CCDs with apixel size of 0.238′′. These images were pre-reduced using theIRAF package MSCRED (Valdes 1998), while the stellar pho-tometry was derived by using the DAOPHOT II and ALLSTARprograms (Stetson 1987, 1992). Details on the preproduction,calibration, and full photometric catalogues will be publishedelsewhere. We thus created the initial sample that includes asmany clusters as possible from the other surveys, and filled inthe gaps in [Fe/H] with clusters visible from the South that havepublic photometry data. To select the targets within each clus-ter, we generally observed RGB stars and performed a surveyof FLAMES data in the ESO archive and in the literature (whenavailable) to select probable members. To maximise our chancesof obtaining reliable parameters for GC, we gave highest prior-ity to GIRAFFE targets that already had archival observationsin different setups and avoided repeating stars that already hadUVES observations in the Gaia-ESO survey setups. Additionaldetails of the cluster selection criteria and observational strategywill be given in a forthcoming paper (Pancino et al., in prep.).
Our sample consists of seven Galactic GCs observed by theGaia-ESO survey. The observations were performed betweenDecember 2011 and September 2013 and consist of one point-ing for each GC, using the two FLAMES-GIRAFFE2 setupsthat are used to observe the main field targets of the survey(Gilmore et al. 2012; Randich et al. 2013): the high-resolutionsetups HR 10 (centred on 5488 Å, with a spectral resolution
2 We considered only stars observed with GIRAFFE to preservehomogeneity.
A115, page 2 of 13
C. Lardo et al.: The Gaia-ESO Survey: Kinematics of seven Galactic globular clusters
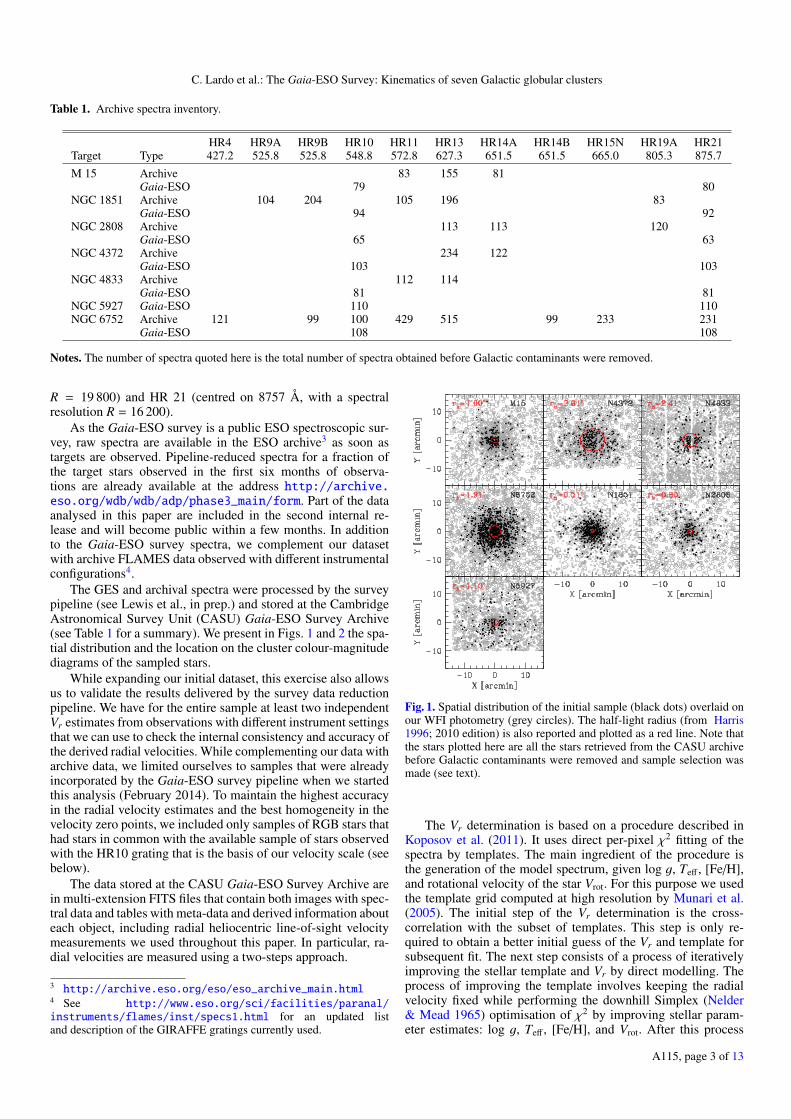
Table 1. Archive spectra inventory.
HR4 HR9A HR9B HR10 HR11 HR13 HR14A HR14B HR15N HR19A HR21Target Type 427.2 525.8 525.8 548.8 572.8 627.3 651.5 651.5 665.0 805.3 875.7M 15 Archive 83 155 81
Gaia-ESO 79 80NGC 1851 Archive 104 204 105 196 83
Gaia-ESO 94 92NGC 2808 Archive 113 113 120
Gaia-ESO 65 63NGC 4372 Archive 234 122
Gaia-ESO 103 103NGC 4833 Archive 112 114
Gaia-ESO 81 81NGC 5927 Gaia-ESO 110 110NGC 6752 Archive 121 99 100 429 515 99 233 231
Gaia-ESO 108 108
Notes. The number of spectra quoted here is the total number of spectra obtained before Galactic contaminants were removed.
R = 19 800) and HR 21 (centred on 8757 Å, with a spectralresolution R = 16 200).
As the Gaia-ESO survey is a public ESO spectroscopic sur-vey, raw spectra are available in the ESO archive3 as soon astargets are observed. Pipeline-reduced spectra for a fraction ofthe target stars observed in the first six months of observa-tions are already available at the address http://archive.eso.org/wdb/wdb/adp/phase3_main/form. Part of the dataanalysed in this paper are included in the second internal re-lease and will become public within a few months. In additionto the Gaia-ESO survey spectra, we complement our datasetwith archive FLAMES data observed with different instrumentalconfigurations4.
The GES and archival spectra were processed by the surveypipeline (see Lewis et al., in prep.) and stored at the CambridgeAstronomical Survey Unit (CASU) Gaia-ESO Survey Archive(see Table 1 for a summary). We present in Figs. 1 and 2 the spa-tial distribution and the location on the cluster colour-magnitudediagrams of the sampled stars.
While expanding our initial dataset, this exercise also allowsus to validate the results delivered by the survey data reductionpipeline. We have for the entire sample at least two independentVr estimates from observations with different instrument settingsthat we can use to check the internal consistency and accuracy ofthe derived radial velocities. While complementing our data witharchive data, we limited ourselves to samples that were alreadyincorporated by the Gaia-ESO survey pipeline when we startedthis analysis (February 2014). To maintain the highest accuracyin the radial velocity estimates and the best homogeneity in thevelocity zero points, we included only samples of RGB stars thathad stars in common with the available sample of stars observedwith the HR10 grating that is the basis of our velocity scale (seebelow).
The data stored at the CASU Gaia-ESO Survey Archive arein multi-extension FITS files that contain both images with spec-tral data and tables with meta-data and derived information abouteach object, including radial heliocentric line-of-sight velocitymeasurements we used throughout this paper. In particular, ra-dial velocities are measured using a two-steps approach.
3 http://archive.eso.org/eso/eso_archive_main.html4 See http://www.eso.org/sci/facilities/paranal/instruments/flames/inst/specs1.html for an updated listand description of the GIRAFFE gratings currently used.
Fig. 1. Spatial distribution of the initial sample (black dots) overlaid onour WFI photometry (grey circles). The half-light radius (from Harris1996; 2010 edition) is also reported and plotted as a red line. Note thatthe stars plotted here are all the stars retrieved from the CASU archivebefore Galactic contaminants were removed and sample selection wasmade (see text).
The Vr determination is based on a procedure described inKoposov et al. (2011). It uses direct per-pixel χ2 fitting of thespectra by templates. The main ingredient of the procedure isthe generation of the model spectrum, given log g, Teff , [Fe/H],and rotational velocity of the star Vrot. For this purpose we usedthe template grid computed at high resolution by Munari et al.(2005). The initial step of the Vr determination is the cross-correlation with the subset of templates. This step is only re-quired to obtain a better initial guess of the Vr and template forsubsequent fit. The next step consists of a process of iterativelyimproving the stellar template and Vr by direct modelling. Theprocess of improving the template involves keeping the radialvelocity fixed while performing the downhill Simplex (Nelder& Mead 1965) optimisation of χ2 by improving stellar param-eter estimates: log g, Teff , [Fe/H], and Vrot. After this process
A115, page 3 of 13

A&A 573, A115 (2015)
Fig. 2. Gaia-ESO survey targets (blue squares) andGIRAFFE/FLAMES archival data (red crosses) overplotted onour WFI photometry (black dots).
has converged, we perform the Vr optimisation by evaluating thetemplate on a grid of radial velocities and computing the χ2 asa function of radial velocity. Then the stellar parameter step andRV steps are repeated a few times until convergence. The cal-culation of the χ2 for each log g, Teff , [Fe/H], Vrot and Vr alsoinvolves simultaneous continuum determination (Koposov et al.2011), where the observed spectrum is assumed to be the mul-tiplication of the template and a fixed-degree polynomial of thewavelength. As a result of the procedure, we derive χ2 as a func-tion of Vr for the best-fit template, from which the pipeline deter-mines the Vr estimate and its uncertainty (see also Jeffries et al.2014).
2.2. Vr estimates from repeated measurements
As there are several stars in common between the observationaldatasets with different setups, we can check the internal consis-tency of the radial velocities delivered by the survey pipeline.The mean (median) uncertainty value on individual pipeline Vrestimates is of 0.17 (0.15) and 0.38 (0.37) km s−1 (rms = 0.07and 0.05, stars = 731 and 830) for the two Gaia-ESO setups HR10 and HR 21, respectively (see Fig. 3). The vast majority of thespectra ('92%) have uncertainties on Vr ≤ 1.0 km s−1, '84%≤0.5 km s−1, small enough to not affect the measurement of theinternal kinematics of the clusters. We decided to adopt a con-servative threshold (uncertainty on Vr ≤ 1 km s−1) to select thestars in the following analysis.
The comparison between the Vr estimates obtained fromHR 10 and the other GIRAFFE setups for stars with uncertaintyon Vr ≤ 1.0 km s−1 is shown in Fig. 4 for all clusters. Velocitiesfrom HR 10 were chosen as a reference because this setup isused, together with HR 21, to observe all the stars targeted byGaia-ESO survey, and their associated uncertainties are typi-cally smaller than those of HR 21. The mean difference and thestandard deviation of the difference between the two sets of es-timates with different setups are reported in Table 2. The tablealso lists the number of stars in common between HR 10 and a
Fig. 3. Distribution of velocity pipeline internal uncertainties associatedwith each Vr measurement, grey histogram, for all the considered set-tings, of HR 10, green histogram shaded at 0 degrees, and for HR 21,yellow histogram, shaded at 45 degrees. The vertical line is the adoptedthreshold for rejecting objects (see text).
given setup. Although the consistency among the different setsof measures is good (i.e., ∆Vr ≤ 1.0 km s−1), we note that thereare differences in the Vr zero point (see also Donati et al. 2014).This might be due to the fact that Gaia-ESO survey HR 10 obser-vations are generally interleaved with a short exposure in whichfive dedicated fibres were illuminated by a bright (compared tothe stellar spectra) thorium-argon (ThAr) lamp (see also Jeffrieset al. 2014). These short exposures (simcal observations), com-bined with much longer day-time ThAr lamp exposures that il-luminated all the instrument fibres, are used to adjust both thelocalisation and the wavelength solution, resulting in a higherprecision in radial velocity determinations. However, the differ-ences in the zero-point between the ten Vr sets are not a reasonfor concern in the present analysis. In some cases, the compari-son is based on only a handful of stars (see Fig. 2), but becausewe did not detect trends and/or large spreads in the ∆Vr, we de-cided to include these setups in the following analysis as well.The typical precision, as measured from the rms of each set of∆Vr computed after recursive clipping of the very few 3σ out-liers is ≤1.6 km s−1, but typically much lower than this, about0.3 km s−1, which is more than satisfying for our purpose here.The actual uncertainty on the single measure should be smallerthan the rms of ∆Vr because the latter includes the uncertaintiesof both estimates, added in quadrature.
As a final step, we transformed all radial velocities into theHR 10 system by applying the shifts listed in Table 2 and weight-ing them by their uncertainty to derive the final Vr. In the caseof a single Vr determination we assigned the corrected Vr valueto the star along with the formal uncertainty associated with thesingle measure.
As an additional validation of our final Vr, we comparedour determinations with those in the existing literature forNGC 6752, NGC 1851, and NGC 5927. For NGC 6752, wefound 159 stars in common with the sample presented by
A115, page 4 of 13
C. Lardo et al.: The Gaia-ESO Survey: Kinematics of seven Galactic globular clusters
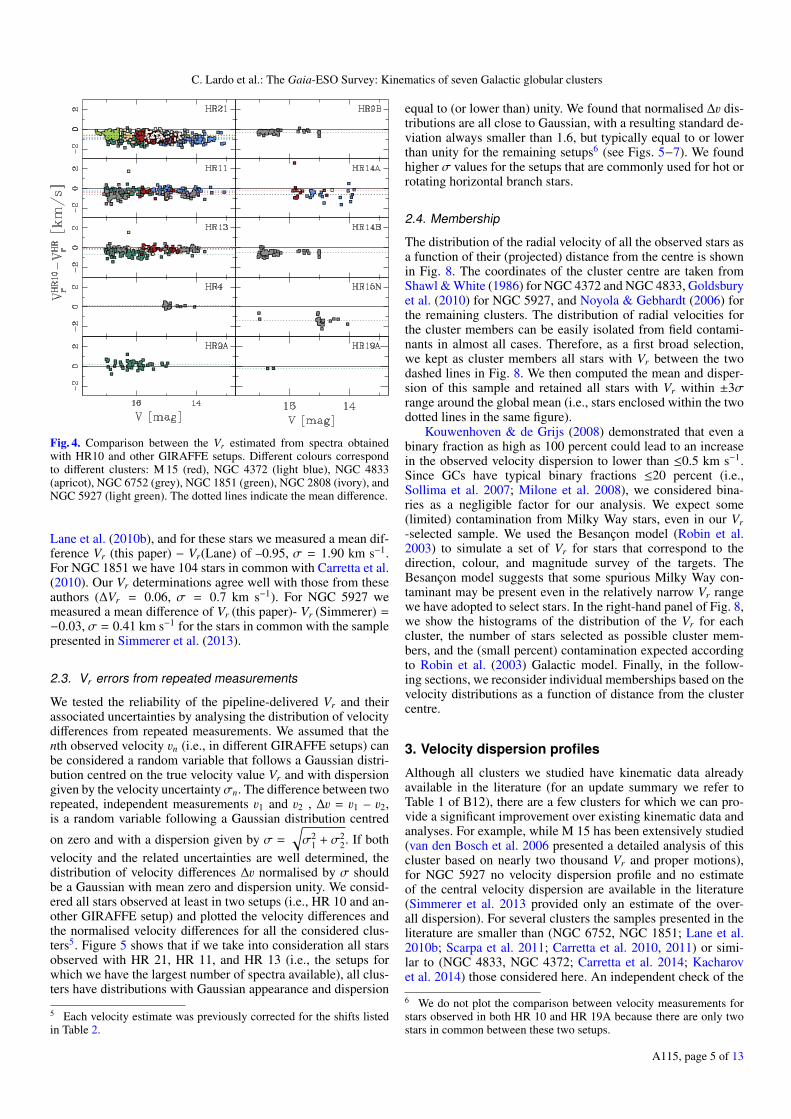
Fig. 4. Comparison between the Vr estimated from spectra obtainedwith HR10 and other GIRAFFE setups. Different colours correspondto different clusters: M 15 (red), NGC 4372 (light blue), NGC 4833(apricot), NGC 6752 (grey), NGC 1851 (green), NGC 2808 (ivory), andNGC 5927 (light green). The dotted lines indicate the mean difference.
Lane et al. (2010b), and for these stars we measured a mean dif-ference Vr (this paper) − Vr(Lane) of –0.95, σ = 1.90 km s−1.For NGC 1851 we have 104 stars in common with Carretta et al.(2010). Our Vr determinations agree well with those from theseauthors (∆Vr = 0.06, σ = 0.7 km s−1). For NGC 5927 wemeasured a mean difference of Vr (this paper)- Vr (Simmerer) =−0.03, σ = 0.41 km s−1 for the stars in common with the samplepresented in Simmerer et al. (2013).
2.3. Vr errors from repeated measurements
We tested the reliability of the pipeline-delivered Vr and theirassociated uncertainties by analysing the distribution of velocitydifferences from repeated measurements. We assumed that thenth observed velocity vn (i.e., in different GIRAFFE setups) canbe considered a random variable that follows a Gaussian distri-bution centred on the true velocity value Vr and with dispersiongiven by the velocity uncertaintyσn. The difference between tworepeated, independent measurements v1 and v2 , ∆v = v1 – v2,is a random variable following a Gaussian distribution centred
on zero and with a dispersion given by σ =
√σ2
1 + σ22. If both
velocity and the related uncertainties are well determined, thedistribution of velocity differences ∆v normalised by σ shouldbe a Gaussian with mean zero and dispersion unity. We consid-ered all stars observed at least in two setups (i.e., HR 10 and an-other GIRAFFE setup) and plotted the velocity differences andthe normalised velocity differences for all the considered clus-ters5. Figure 5 shows that if we take into consideration all starsobserved with HR 21, HR 11, and HR 13 (i.e., the setups forwhich we have the largest number of spectra available), all clus-ters have distributions with Gaussian appearance and dispersion
5 Each velocity estimate was previously corrected for the shifts listedin Table 2.
equal to (or lower than) unity. We found that normalised ∆v dis-tributions are all close to Gaussian, with a resulting standard de-viation always smaller than 1.6, but typically equal to or lowerthan unity for the remaining setups6 (see Figs. 5−7). We foundhigher σ values for the setups that are commonly used for hot orrotating horizontal branch stars.
2.4. Membership
The distribution of the radial velocity of all the observed stars asa function of their (projected) distance from the centre is shownin Fig. 8. The coordinates of the cluster centre are taken fromShawl & White (1986) for NGC 4372 and NGC 4833, Goldsburyet al. (2010) for NGC 5927, and Noyola & Gebhardt (2006) forthe remaining clusters. The distribution of radial velocities forthe cluster members can be easily isolated from field contami-nants in almost all cases. Therefore, as a first broad selection,we kept as cluster members all stars with Vr between the twodashed lines in Fig. 8. We then computed the mean and disper-sion of this sample and retained all stars with Vr within ±3σrange around the global mean (i.e., stars enclosed within the twodotted lines in the same figure).
Kouwenhoven & de Grijs (2008) demonstrated that even abinary fraction as high as 100 percent could lead to an increasein the observed velocity dispersion to lower than ≤0.5 km s−1.Since GCs have typical binary fractions ≤20 percent (i.e.,Sollima et al. 2007; Milone et al. 2008), we considered bina-ries as a negligible factor for our analysis. We expect some(limited) contamination from Milky Way stars, even in our Vr-selected sample. We used the Besançon model (Robin et al.2003) to simulate a set of Vr for stars that correspond to thedirection, colour, and magnitude survey of the targets. TheBesançon model suggests that some spurious Milky Way con-taminant may be present even in the relatively narrow Vr rangewe have adopted to select stars. In the right-hand panel of Fig. 8,we show the histograms of the distribution of the Vr for eachcluster, the number of stars selected as possible cluster mem-bers, and the (small percent) contamination expected accordingto Robin et al. (2003) Galactic model. Finally, in the follow-ing sections, we reconsider individual memberships based on thevelocity distributions as a function of distance from the clustercentre.
3. Velocity dispersion profiles
Although all clusters we studied have kinematic data alreadyavailable in the literature (for an update summary we refer toTable 1 of B12), there are a few clusters for which we can pro-vide a significant improvement over existing kinematic data andanalyses. For example, while M 15 has been extensively studied(van den Bosch et al. 2006 presented a detailed analysis of thiscluster based on nearly two thousand Vr and proper motions),for NGC 5927 no velocity dispersion profile and no estimateof the central velocity dispersion are available in the literature(Simmerer et al. 2013 provided only an estimate of the over-all dispersion). For several clusters the samples presented in theliterature are smaller than (NGC 6752, NGC 1851; Lane et al.2010b; Scarpa et al. 2011; Carretta et al. 2010, 2011) or simi-lar to (NGC 4833, NGC 4372; Carretta et al. 2014; Kacharovet al. 2014) those considered here. An independent check of the
6 We do not plot the comparison between velocity measurements forstars observed in both HR 10 and HR 19A because there are only twostars in common between these two setups.
A115, page 5 of 13

A&A 573, A115 (2015)
Table 2. The sample and its internal Vr accuracy.
Cluster 〈∆Vr〉HR10−HR21 〈∆Vr〉
HR10−HR11 〈∆Vr〉HR10−HR13 〈∆Vr〉
HR10−HR4 〈∆Vr〉HR10−HR9A
(km s−1) (km s−1) (km s−1) (km s−1) (km s−1)M 15 –0.83 (σ = 0.27, 78) –0.36 (σ = 0.30, 12) –0.10 (σ = 0.24, 26)NGC 4372 –0.99 (σ = 0.32, 100) –0.19 (σ = 0.24, 42)NGC 4833 –0.69 (σ = 0.37, 77) 0.29 (σ = 1.61, 8) –0.02 (σ = 0.66, 8)NGC 6752 –1.00 (σ = 0.33, 108) –0.58 (σ = 0.34, 148) –0.20 (σ = 0.22, 105) 0.118 (σ = 0.190, 23)NGC 1851 –0.94 (σ = 0.39, 91) –0.30 (σ = 0.25, 51) –0.67 (σ = 0.31, 56) 0.15 (σ = 0.35, 52)NGC 2808 –0.63 (σ = 0.32, 58) 0.07 (σ = 0.02, 2)NGC 5927 –0.56 (σ = 0.21, 108)
Cluster 〈∆Vr〉HR10−HR9B 〈∆Vr〉
HR10−HR14A 〈∆Vr〉HR10−HR14B 〈∆Vr〉
HR10−HR15N 〈∆Vr〉HR10−HR19A
(km s−1) (km s−1) (km s−1) (km s−1) (km s−1)M 15 –0.25 (σ = 0.95, 12)NGC 4372 –0.62 (σ = 0.48, 22)NGC 4833NGC 6752 –0.29 (σ = 0.15, 51) –0.54 (σ = 0.23, 54) –1.39 (σ = 0.37, 25)NGC 1851 –0.232 (σ = 0.005, 2)NGC 2808 –0.175 (σ = 0.01, 2)NGC 5927
Fig. 5. Comparison between velocity measurements for stars observedin two Giraffe setups. Upper panels: we show the distribution of ve-locity differences with respect to the velocity measured with HR 10for all the stars observed (from left to right, with HR 21, HR 11 andHR 13) and estimated uncertainties on Vr ≤ 1 km s−1 for each mea-surement. The mean difference and the rms dispersion are also shown.Bottom panels: as above, but now the velocity difference is normalisedby the predicted uncertainty. It can be appreciated that the measureduncertainty in the velocity distribution is very close to the unit varianceGaussian (standard deviation =0.88, 1.59, and 0.97 for HR 21, HR 11,and HR 13, respectively).
results from previous analyses is provided. In the following webriefly discuss the properties of the Vr distributions and derivenew estimates of the central velocity dispersion (σ0) in all theselected clusters.
We used radial velocities of member stars to produce veloc-ity dispersion (σ) curves for all the considered clusters as de-scribed in Bellazzini et al. (2008), using jackknife resampling(Lupton 1993) to compute uncertainties. In the upper panel ofFigs. 9 to 15 we show the Vr distribution as a function of R(distance from the centre). We divided the whole sample into
Fig. 6. Same as Fig. 5, but for HR 4, HR 9A, and HR 9B.
several independent radial bins of different size, manually cho-sen as a compromise between maintaining the highest degreeof spatial resolution while considering a statistically significantnumber ('15) of stars. In each bin we computed the averageVr − 〈Vsys〉 and velocity dispersion σ, with their uncertainties.An iterative 3σ clipping algorithm was applied bin by bin. Anystar rejected by the clipping algorithm was then rejected from thefollowing analysis. The rejected stars are indicated in the plotsas crosses. The Vr estimates for all the stars judged to be mem-bers are reported in Table 3, together with other stellar parame-ters. In Table 4 we report the measured average velocity for eachcluster. From this table we note an excellent agreement betweenthe cluster average velocity derived here and those reported inliterature.
The derived velocity dispersion profile is reported in thelower panel of the figures and listed in Table 5. The profiles arecomplemented with the central estimate obtained from the liter-ature (large empty pentagon in the same figures).
A115, page 6 of 13

C. Lardo et al.: The Gaia-ESO Survey: Kinematics of seven Galactic globular clusters
Fig. 7. Same as Fig. 5, but for HR 14A, HR 14B, and HR 15N.
Fig. 8. Radial velocity of program stars as a function of distance fromthe center (left-hand panel) for all the considered clusters, and radial ve-locity distribution (right-hand panel). The long-dashed lines mark therange we adopted for the first selection of candidate cluster members.The dotted lines enclose the (global) ±3σ range from the mean of theselected samples of candidates (continuous line), their number size isalso indicated in the right-hand panel, along with the percentage of ex-pected contaminants from the Besançon models (see text).
Fig. 9. Velocity dispersion profile of M 15 stars. The upper panel showsthe Vr distribution as a function of distance from the cluster centre forindividual stars of the sample. Only stars plotted as dots are retainedto compute σ in the various radial bins: crosses are stars rejected onlybecause they are local 3σ outliers of the bins. The mean Vr − 〈Vsys〉 ismarked by the continuous horizontal line. Comparison of the observedvelocity dispersion profile of M 15 with the King model with a coreradius rC = 0.07′and a concentration C = 2.5, from Trager et al. (1993)and normalised to σ0 = 13.2 km s−1 (continuous line; our estimate) andσ0 = 14.5 km s−1 (dotted line; by McNamara et al. 2003). The largefilled pentagons are the dispersions estimated in the corresponding binsdisplayed in the upper panel, with their bootstrapped errors. The numberof stars per bin is also reported above the points. The open pentagon isthe value of σ at the centre of M 15 from McNamara et al. (2003).
We fitted the resulting velocity dispersion profile in a least-squares sense with the predictions of the (King 1966; hereafterK66) model that best fits the surface brightness profile (accord-ing to Trager et al. 1993), leaving the central velocity dispersionσ0as the free parameter to be determined. It is important to notethat our σ0 estimates are extrapolations to r = 0 of the isotropicsingle-mass K66 model that best fits the observed velocity dis-persion profile. Hence they are model-dependent and based onmodels that are known not to be perfectly adequate to describereal clusters, which, for instance, are populated by stars of dif-ferent masses. The reliability of each estimate of σ0 depends onthe radial coverage of the velocity dispersion profile and on thecluster surface brightness profile; it can be judged relatively eas-ily from inspecting Figs. 7−13 below.
In general, our Vsysr and the σ0 estimates agree well with
those found in previous studies (see Table 4), except for twocases.
For NGC 6752 we estimated a velocity dispersion toward thecentre of σ0 = 8.2 km s−1, which is higher than that found byLane et al. (2010b) (σ0 = 5.7 ± 0.7 km s−1)7. This can be par-tially due to the fact that they estimated σ0 by extrapolating froma different class of models than we did here, that is, Plummer(1911) instead of K66. Our observed velocity dispersion profileis fully compatible with that by Lane et al. (2010b) in the widerange where the two profiles overlaps. The inspection of the two
7 For reference Dubath et al. (1997) obtained σ0 = 4.9 ± 2.4 km s−1
from integrated-light spectra.
A115, page 7 of 13

A&A 573, A115 (2015)
Table 3. Radial velocities for the stars.
NGC ID RA Dec V Vr eVr(deg) (deg) (mag) km s−1 km s−1
7078 1 322.4817397 12.1793098 12.8 −118.90 0.647078 2 322.5093355 12.1893088 12.8 −98.25 0.247078 3 322.5037366 12.1491900 12.9 −114.20 0.387078 4 322.5013943 12.1808019 13.0 −116.60 0.417078 5 322.4908124 12.1577422 13.2 −95.12 0.247078 6 322.4993224 12.1571307 13.3 −112.00 0.11
Notes. A portion of the table is shown for guidance about its content,the complete table is available in electronic format through the CDSservice.
curves suggests that the true value of σ0 can be in between thetwo estimates. On the other hand, the two estimates based on ra-dial velocities are significantly lower than the one consistentlyderived from the two components of the proper motions in theplane of the sky by Drukier et al. (2003) (σ0 = 12.4±0.5 km s−1;see Fig. 10). This large discrepancy with the Drukier et al. (2003)measured value can be due to the adoption of a cluster distancethat overestimates the true value, to a significantly different meanmass of the adopted tracers (e.g., giants vs. subgiants+dwarfs),or to a significant amount of orbital anisotropy (see Drukier et al.2003). In any case, our data provide the final proof that the dis-crepancy between the dispersion from radial velocity and fromproper motions, already noted by Drukier et al. (2003) is real andrequires further investigation.
For NGC 2808, the sparse dispersion profile we obtainedprovides only weak constraints on σ0, hence the difference be-tween our extrapolated value and the value listed in Pryor &Meylan (1993) cannot be considered significant. We recall thatthe latter is from an integrated spectrum taken at the clus-ter centre, and it fully agrees with the recent measurement byLützgendorf et al. (2012).
For NGC 5927 we present for the first time a velocity dis-persion profile in Fig. 15. We also provide the first estimate ofσ0, but we note that the constraint on this parameter provided byour profile is relatively weak, hence the associated uncertainty isquite large (of about 2 km s−1).
4. Rotation
We used our sample to search for a rotation signal in all theconsidered clusters. To do this, we used the same method asadopted by Cote et al. (1995), Pancino et al. (2007), Lane et al.(2009, 2010a,b), and B12. Rotations were measured by halvingthe cluster by position angle (PA)8 and calculating the mean ra-dial velocity of each half. This was performed in steps of 20-35◦depending on the number of the observed stars in the consideredcluster to avoid aliasing effects. The two mean velocities werethen subtracted, and the difference in the mean Vr for each PA ofthe dividing line is plotted in Fig. 16 as a function of the PA andthe best-fitting sine function
∆〈Vr〉 = Arot sin(PA + Φ),
where Φ = 270◦ – PA0, PA0 is the position angle of the divid-ing line corresponding to the maximum rotation amplitude (de-grees), and Arot is twice the actual mean amplitude (in km s−1;see Lane et al. 2010a and B12). Arot/2 should be considered as
8 In the adopted approach PA is defined to increase anti-clockwise inthe plane of the sky from north (PA = 0◦) toward east (PA = 90◦).
Fig. 10. Same as in Fig. 9, but for NGC 6752. Core radius (rC = 0.17′)and concentration (C = 2.5) are from Trager et al. (1993) and K66 mod-els are normalised to σ0 = 8.2 km s−1 (continuous line; our estimate)and σ0 = 5.7 and 12.4 km s−1 (dotted lines; by Lane et al. 2010b (L10)and Drukier et al. 2003 (D03)). The large open pentagons are the valuesof σ at the centre from L10 and D03.
an underestimate of the maximum projected rotational ampli-tude because the 〈Vr〉 difference is actually averaged over thefull range of radial distances covered by the targeted stars, andthe amplitude does vary with distance from the cluster centre(Sollima et al. 2009). But even if the derived Arot are only es-timates of the amplitude of the projected rotation pattern, wecan consider Arot as a proxy for the true amplitude, in a sta-tistical sense (see Appendix A in B12). The estimates of Arotshould be considered as quite robust. We measured a typical 1σuncertainty ranging from 0.15 km s−1 in the case of M 15, to0.8 km s−1 for NGC 5927. On the contrary, PA0 is more sen-sitive to the spatial distribution of the adopted sample, with anassociated uncertainty at the ±30◦ level in the best cases.
The considered clusters span a wide range of rotation ampli-tude, from no rotation within the uncertainties (NGC 6752) to anamplitude of more than 3.5 km s−1 (NGC 2808 and M 15). Wenote that the two clusters with clear rotation pattern, NGC 2808and M 15, are among the most peculiar clusters in terms of mul-tiple populations, with an extended horizontal branch morphol-ogy (see for a recent review Gratton et al. 2012 and referencestherein). For the six clusters already considered in previous stud-ies (i.e., all the sample clusters but NGC 5927), we confirm theresults reported in the literature, while we were able to detect forthe first time a significant amplitude of rotation for the metal-richcluster9 NGC 5927, Arot = 2.6 km s−1.
In Fig. 17 we show the rotation curves for M 15, NGC 1851,NGC 2808, and NGC 5927; these are the four clusters for whichsignificant rotation was detected. In the right-hand panels, theVr distribution of stars lying on opposite sides with respect tothe rotation axis are compared. If the clusters were non-rotating,
9 The value tabulated in the Harris 1996 catalogue for NGC 5927 is[Fe/H] = –0.49 dex; it was obtained by averaging the [Fe/H] derived byArmandroff & Zinn (1988); Francois (1991); Carretta et al. (2009a).
A115, page 8 of 13
C. Lardo et al.: The Gaia-ESO Survey: Kinematics of seven Galactic globular clusters
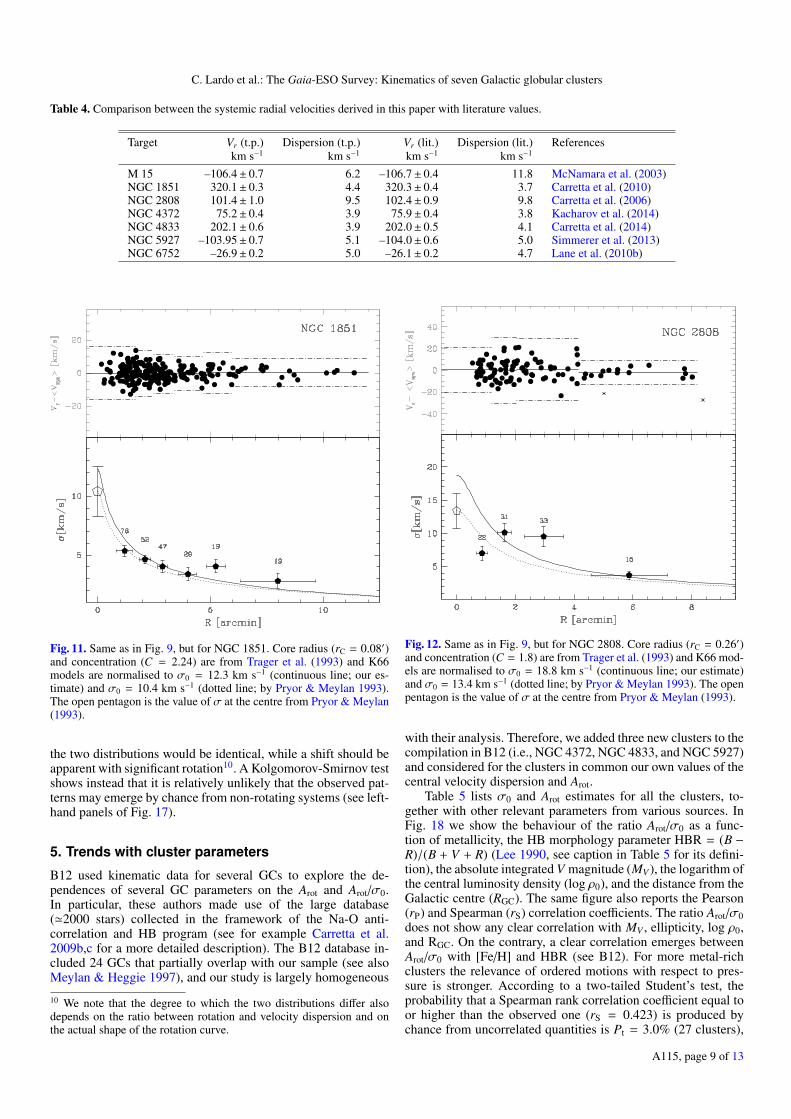
Table 4. Comparison between the systemic radial velocities derived in this paper with literature values.
Target Vr (t.p.) Dispersion (t.p.) Vr (lit.) Dispersion (lit.) Referenceskm s−1 km s−1 km s−1 km s−1
M 15 –106.4± 0.7 6.2 –106.7± 0.4 11.8 McNamara et al. (2003)NGC 1851 320.1± 0.3 4.4 320.3± 0.4 3.7 Carretta et al. (2010)NGC 2808 101.4± 1.0 9.5 102.4± 0.9 9.8 Carretta et al. (2006)NGC 4372 75.2± 0.4 3.9 75.9± 0.4 3.8 Kacharov et al. (2014)NGC 4833 202.1± 0.6 3.9 202.0± 0.5 4.1 Carretta et al. (2014)NGC 5927 –103.95± 0.7 5.1 –104.0± 0.6 5.0 Simmerer et al. (2013)NGC 6752 –26.9± 0.2 5.0 –26.1± 0.2 4.7 Lane et al. (2010b)
Fig. 11. Same as in Fig. 9, but for NGC 1851. Core radius (rC = 0.08′)and concentration (C = 2.24) are from Trager et al. (1993) and K66models are normalised to σ0 = 12.3 km s−1 (continuous line; our es-timate) and σ0 = 10.4 km s−1 (dotted line; by Pryor & Meylan 1993).The open pentagon is the value of σ at the centre from Pryor & Meylan(1993).
the two distributions would be identical, while a shift should beapparent with significant rotation10. A Kolgomorov-Smirnov testshows instead that it is relatively unlikely that the observed pat-terns may emerge by chance from non-rotating systems (see left-hand panels of Fig. 17).
5. Trends with cluster parameters
B12 used kinematic data for several GCs to explore the de-pendences of several GC parameters on the Arot and Arot/σ0.In particular, these authors made use of the large database('2000 stars) collected in the framework of the Na-O anti-correlation and HB program (see for example Carretta et al.2009b,c for a more detailed description). The B12 database in-cluded 24 GCs that partially overlap with our sample (see alsoMeylan & Heggie 1997), and our study is largely homogeneous
10 We note that the degree to which the two distributions differ alsodepends on the ratio between rotation and velocity dispersion and onthe actual shape of the rotation curve.
Fig. 12. Same as in Fig. 9, but for NGC 2808. Core radius (rC = 0.26′)and concentration (C = 1.8) are from Trager et al. (1993) and K66 mod-els are normalised to σ0 = 18.8 km s−1 (continuous line; our estimate)and σ0 = 13.4 km s−1 (dotted line; by Pryor & Meylan 1993). The openpentagon is the value of σ at the centre from Pryor & Meylan (1993).
with their analysis. Therefore, we added three new clusters to thecompilation in B12 (i.e., NGC 4372, NGC 4833, and NGC 5927)and considered for the clusters in common our own values of thecentral velocity dispersion and Arot.
Table 5 lists σ0 and Arot estimates for all the clusters, to-gether with other relevant parameters from various sources. InFig. 18 we show the behaviour of the ratio Arot/σ0 as a func-tion of metallicity, the HB morphology parameter HBR = (B −R)/(B + V + R) (Lee 1990, see caption in Table 5 for its defini-tion), the absolute integrated V magnitude (MV ), the logarithm ofthe central luminosity density (log ρ0), and the distance from theGalactic centre (RGC). The same figure also reports the Pearson(rP) and Spearman (rS) correlation coefficients. The ratio Arot/σ0does not show any clear correlation with MV , ellipticity, log ρ0,and RGC. On the contrary, a clear correlation emerges betweenArot/σ0 with [Fe/H] and HBR (see B12). For more metal-richclusters the relevance of ordered motions with respect to pres-sure is stronger. According to a two-tailed Student’s test, theprobability that a Spearman rank correlation coefficient equal toor higher than the observed one (rS = 0.423) is produced bychance from uncorrelated quantities is Pt = 3.0% (27 clusters),
A115, page 9 of 13

A&A 573, A115 (2015)
Table 5. Cluster parameters.
Cluster σ0 εσ Arot εA [Fe/H] HBR MV ell log ρ0 RG
km s−1 km s−1 km s−1 km s−1 dex L� pc−3 kpc
NGC 104 9.6 0.6 4.4 0.4 −0.76 −0.99 −9.42 0.09 4.88 7.4NGC 288 2.7 0.8 0.5 0.3 −1.32 0.98 −6.75 0.00 1.78 12.0NGC 1851 12.3a 1.5 1.6a 0.5 −1.16 −0.32 −8.33 0.05 5.09 16.6NGC 1904 5.3 0.4 0.6 0.5 −1.58 0.89 −7.86 0.01 4.08 18.8NGC 2808 18.8a 4.0 4.7a 0.2 −1.18 −0.49 −9.39 0.12 4.66 11.1NGC 3201 4.5 0.5 1.2 0.3 −1.51 0.08 −7.45 0.12 2.71 8.8NGC 4372 4.9a 1.2 1.0a 0.5 −2.17b 1.00c −7.77c 0.15c 2.06b 7.1c
NGC 4590 2.4 0.9 1.2 0.4 −2.27 0.17 −7.37 0.05 2.57 10.2NGC 4833 5.5a 1.5 1.2a 0.4 −1.85b 0.93c −8.16c 0.07c 3.00b 7.0c
NGC 5024 4.4 0.9 0.0 0.5 −2.06 0.81 −8.71 0.01 3.07 18.4NGC 5139 19.0 1.0 6.0 1.0 −1.64 − −10.26 0.17 3.15 6.4NGC 5904 7.5 1.0 2.6 0.5 −1.33 0.31 −8.81 0.14 3.88 6.2NGC 5927 11.0a 2.0 2.6a 0.8 −0.49b −1.00c −7.80c 0.04c 4.09b 7.3c
NGC 6121 3.9 0.7 1.8 0.2 −1.18 −0.06 −7.19 0.00 3.64 5.9NGC 6171 4.1 0.3 2.9 1.0 −1.03 −0.73 −7.12 0.02 3.08 3.3NGC 6218 4.7 0.9 0.3 0.2 −1.33 0.97 −7.31 0.04 3.23 4.5NGC 6254 6.6 0.8 0.4 0.5 −1.57 0.98 −7.48 0.00 3.54 4.6NGC 6388 18.9 0.8 3.9 1.0 −0.45 −0.65 −9.41 0.01 5.37 3.1NGC 6397 4.5 0.6 0.2 0.5 −1.99 0.98 −6.64 0.07 5.76 6.0NGC 6441 18.0 0.2 12.9 2.0 −0.44 −0.76 −9.63 0.02 5.26 3.9NGC 6656 6.8 0.6 1.5 0.4 −1.70 0.91 −8.50 0.14 3.63 4.9NGC 6715 16.4 0.4 2.0 0.5 −1.56 0.54 −9.98 0.06 4.69 18.9NGC 6752 8.2a 0.6 0.7a 0.2 −1.55 1.00 −7.73 0.04 5.04 5.2NGC 6809 2.7 0.5 0.5 0.2 −1.93 0.87 −7.57 0.02 2.22 3.9NGC 6838 2.3 0.2 1.3 0.5 −0.82 −1.00 -5.61 0.00 2.83 6.7NGC 7078 13.2a 1.5 3.6a 0.1 −2.33 0.67 −9.19 0.05 5.05 10.4NGC 7099 5.0 0.9 0.0 0.0 −2.33 0.89 −7.45 0.01 5.01 7.1
Notes. All parameters are reported from Bellazzini et al. (2012) except: (a) this work . (b) Harris 1996 (2010 ed.) . (c) Mackey & van den Bergh(2005). Meaning of columns: (1) Cluster name; (2) central radial velocity dispersion; (3) error on σ0; (4) projected rotation amplitude; (5) erroron Arot; (6) mean iron abundance ratio; (7) HB morphology, where HBR = (B − R)/(B + V + R), where B is the number of stars bluer than theinstability strip, R redder, and V the number of variables in the strip; (8) the integrated V magnitude; (9) the isophotal ellipticity ε = 1− (b/a); (10)central luminosity density; (11) distance from the Galactic centre (kpc).
so the correlation can be considered as statistically significant. Inaddition, the Arot/σ0 ratio appears to be significantly correlatedwith the HB morphology (Pt = 1 × 10⁻⁴) in the sense that clus-ters with redder HB have greater fractions of ordered motionswith respect to pressure support.
Additionally, Fig. 19 shows that Arot has statistically signifi-cant correlation with HBR (Pt = 1 × 10⁻⁵), MV (Pt = 5 × 10⁻⁴),σ0(Pt = 2 × 10⁻⁴), and [Fe/H] (Pt = 4 × 10⁻³)11. All the aboveresults agree well with those reported by B12.
6. Summary and conclusions
We used the radial velocity estimates obtained from the sec-ond internal data release of data products to ESO of the Gaia-ESO survey to study the kinematics of seven Galactic GCs. Weconfirm the central velocity estimates reported in the literaturefor NGC 1851, M 15, NGC 4372, and NGC 4833, while wefound that there is a real discrepancy between the central dis-persion from radial velocities and that from proper motions for11 We caution, however, that the statistics quoted for Pt could be slightlymisleading because a correlation may emerge even in a random dataset,whereas there are enough parameters and enough correlation plots.
NGC 6752. For NGC 2808, our sample is too sparse to draw use-ful conclusions about σ0. Finally, we provided for the first time avelocity dispersion profile and a central velocity dispersion esti-mate for NGC 5927, albeit uncertain (see Sect. 3). We searchedfor systemic rotation in all the studied clusters and found sig-nificant rotation patterns (Arot ≥ 2.5 km s−1) in NGC 2808,NGC 5927, and M 15 and a marginal detection for NGC 1851(see Sect. 4).
We demonstrated that the radial velocities delivered from theGaia-ESO survey pipeline have sufficient quality to be used ina profitable way in a kinematic study and made public a largedatabase of radial velocities of GCs members for future research.For example, we verified that the uncertainties on individual ra-dial velocity estimates from the survey pipeline are fully reliablebecause they match the errors on the mean derived from multipleindependent measures.
When all the archival data will be incorporated into theGaia-ESO survey and abundances will be available for all theanalysed stars, the final large dataset will permit insightful anal-yses of the internal motions of the clusters. For example, itwill allow us to correlate the presence and amplitude of ro-tation with the cluster parameters, different chemistry and/or
A115, page 10 of 13
C. Lardo et al.: The Gaia-ESO Survey: Kinematics of seven Galactic globular clusters
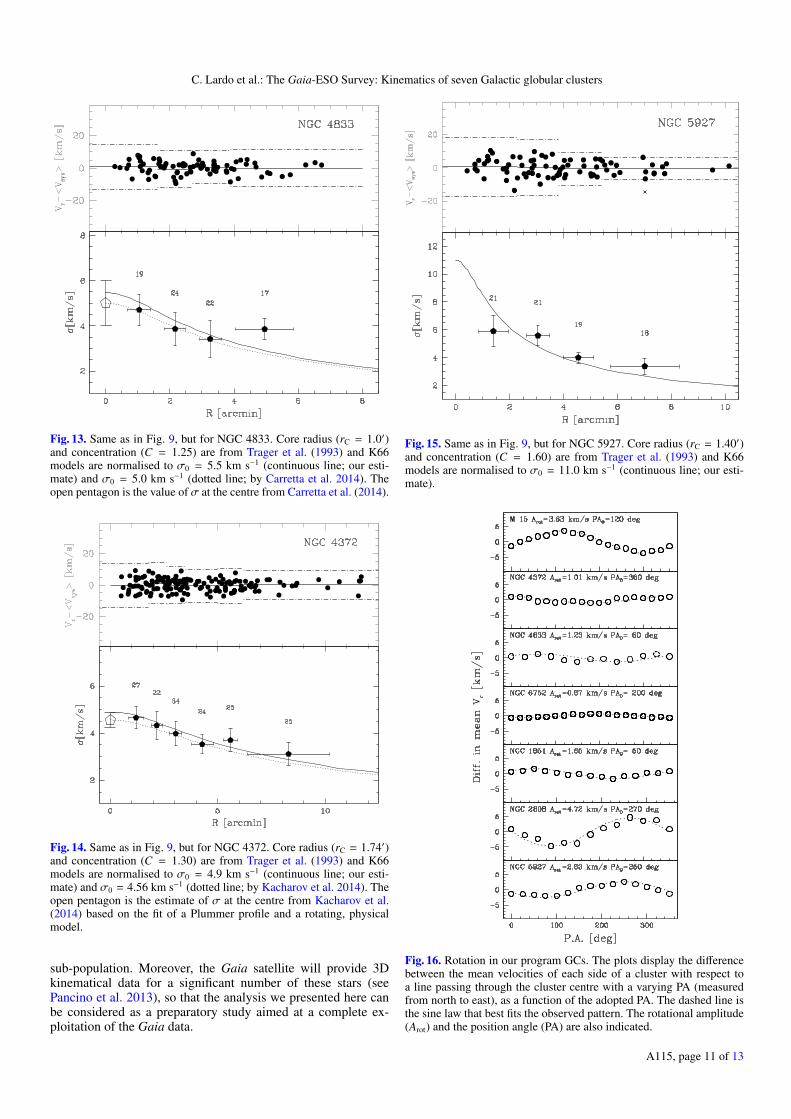
Fig. 13. Same as in Fig. 9, but for NGC 4833. Core radius (rC = 1.0′)and concentration (C = 1.25) are from Trager et al. (1993) and K66models are normalised to σ0 = 5.5 km s−1 (continuous line; our esti-mate) and σ0 = 5.0 km s−1 (dotted line; by Carretta et al. 2014). Theopen pentagon is the value of σ at the centre from Carretta et al. (2014).
Fig. 14. Same as in Fig. 9, but for NGC 4372. Core radius (rC = 1.74′)and concentration (C = 1.30) are from Trager et al. (1993) and K66models are normalised to σ0 = 4.9 km s−1 (continuous line; our esti-mate) and σ0 = 4.56 km s−1 (dotted line; by Kacharov et al. 2014). Theopen pentagon is the estimate of σ at the centre from Kacharov et al.(2014) based on the fit of a Plummer profile and a rotating, physicalmodel.
sub-population. Moreover, the Gaia satellite will provide 3Dkinematical data for a significant number of these stars (seePancino et al. 2013), so that the analysis we presented here canbe considered as a preparatory study aimed at a complete ex-ploitation of the Gaia data.
Fig. 15. Same as in Fig. 9, but for NGC 5927. Core radius (rC = 1.40′)and concentration (C = 1.60) are from Trager et al. (1993) and K66models are normalised to σ0 = 11.0 km s−1 (continuous line; our esti-mate).
Fig. 16. Rotation in our program GCs. The plots display the differencebetween the mean velocities of each side of a cluster with respect toa line passing through the cluster centre with a varying PA (measuredfrom north to east), as a function of the adopted PA. The dashed line isthe sine law that best fits the observed pattern. The rotational amplitude(Arot) and the position angle (PA) are also indicated.
A115, page 11 of 13
A&A 573, A115 (2015)
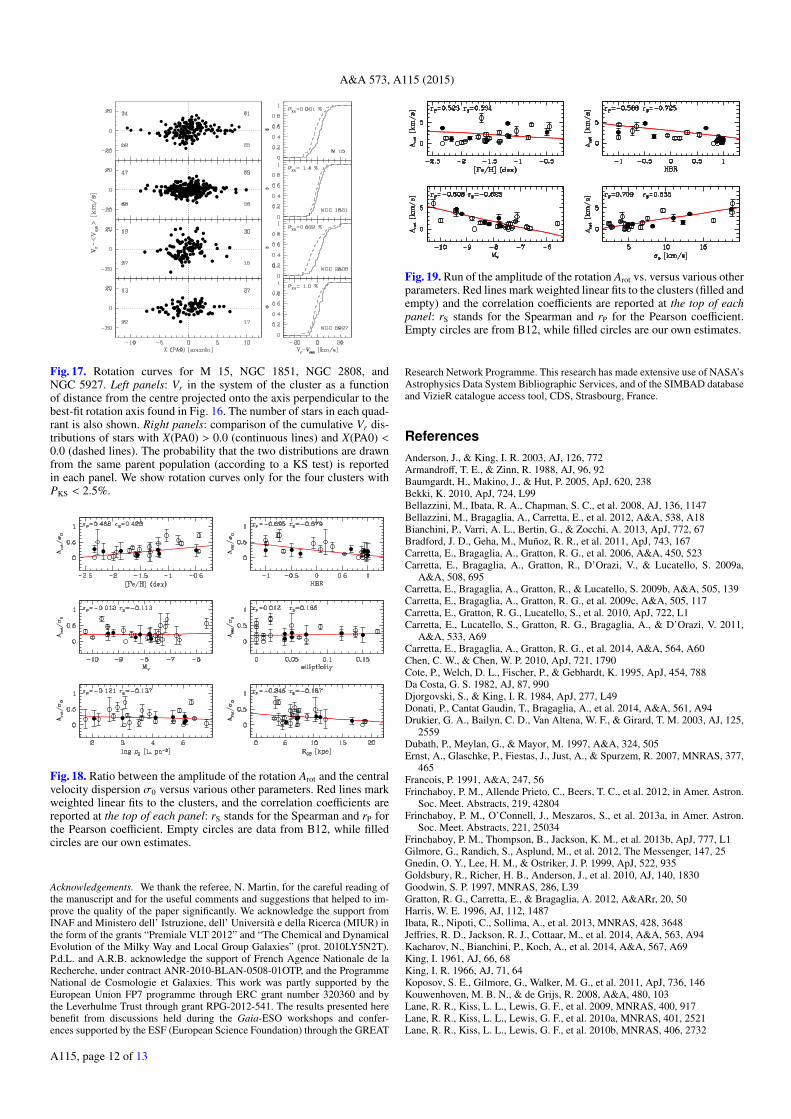
Fig. 17. Rotation curves for M 15, NGC 1851, NGC 2808, andNGC 5927. Left panels: Vr in the system of the cluster as a functionof distance from the centre projected onto the axis perpendicular to thebest-fit rotation axis found in Fig. 16. The number of stars in each quad-rant is also shown. Right panels: comparison of the cumulative Vr dis-tributions of stars with X(PA0) > 0.0 (continuous lines) and X(PA0) <0.0 (dashed lines). The probability that the two distributions are drawnfrom the same parent population (according to a KS test) is reportedin each panel. We show rotation curves only for the four clusters withPKS < 2.5%.
Fig. 18. Ratio between the amplitude of the rotation Arot and the centralvelocity dispersion σ0 versus various other parameters. Red lines markweighted linear fits to the clusters, and the correlation coefficients arereported at the top of each panel: rS stands for the Spearman and rP forthe Pearson coefficient. Empty circles are data from B12, while filledcircles are our own estimates.
Acknowledgements. We thank the referee, N. Martin, for the careful reading ofthe manuscript and for the useful comments and suggestions that helped to im-prove the quality of the paper significantly. We acknowledge the support fromINAF and Ministero dell’ Istruzione, dell’ Università e della Ricerca (MIUR) inthe form of the grants “Premiale VLT 2012” and “The Chemical and DynamicalEvolution of the Milky Way and Local Group Galaxies” (prot. 2010LY5N2T).P.d.L. and A.R.B. acknowledge the support of French Agence Nationale de laRecherche, under contract ANR-2010-BLAN-0508-01OTP, and the ProgrammeNational de Cosmologie et Galaxies. This work was partly supported by theEuropean Union FP7 programme through ERC grant number 320360 and bythe Leverhulme Trust through grant RPG-2012-541. The results presented herebenefit from discussions held during the Gaia-ESO workshops and confer-ences supported by the ESF (European Science Foundation) through the GREAT
Fig. 19. Run of the amplitude of the rotation Arot vs. versus various otherparameters. Red lines mark weighted linear fits to the clusters (filled andempty) and the correlation coefficients are reported at the top of eachpanel: rS stands for the Spearman and rP for the Pearson coefficient.Empty circles are from B12, while filled circles are our own estimates.
Research Network Programme. This research has made extensive use of NASA’sAstrophysics Data System Bibliographic Services, and of the SIMBAD databaseand VizieR catalogue access tool, CDS, Strasbourg, France.
ReferencesAnderson, J., & King, I. R. 2003, AJ, 126, 772Armandroff, T. E., & Zinn, R. 1988, AJ, 96, 92Baumgardt, H., Makino, J., & Hut, P. 2005, ApJ, 620, 238Bekki, K. 2010, ApJ, 724, L99Bellazzini, M., Ibata, R. A., Chapman, S. C., et al. 2008, AJ, 136, 1147Bellazzini, M., Bragaglia, A., Carretta, E., et al. 2012, A&A, 538, A18Bianchini, P., Varri, A. L., Bertin, G., & Zocchi, A. 2013, ApJ, 772, 67Bradford, J. D., Geha, M., Muñoz, R. R., et al. 2011, ApJ, 743, 167Carretta, E., Bragaglia, A., Gratton, R. G., et al. 2006, A&A, 450, 523Carretta, E., Bragaglia, A., Gratton, R., D’Orazi, V., & Lucatello, S. 2009a,
A&A, 508, 695Carretta, E., Bragaglia, A., Gratton, R., & Lucatello, S. 2009b, A&A, 505, 139Carretta, E., Bragaglia, A., Gratton, R. G., et al. 2009c, A&A, 505, 117Carretta, E., Gratton, R. G., Lucatello, S., et al. 2010, ApJ, 722, L1Carretta, E., Lucatello, S., Gratton, R. G., Bragaglia, A., & D’Orazi, V. 2011,
A&A, 533, A69Carretta, E., Bragaglia, A., Gratton, R. G., et al. 2014, A&A, 564, A60Chen, C. W., & Chen, W. P. 2010, ApJ, 721, 1790Cote, P., Welch, D. L., Fischer, P., & Gebhardt, K. 1995, ApJ, 454, 788Da Costa, G. S. 1982, AJ, 87, 990Djorgovski, S., & King, I. R. 1984, ApJ, 277, L49Donati, P., Cantat Gaudin, T., Bragaglia, A., et al. 2014, A&A, 561, A94Drukier, G. A., Bailyn, C. D., Van Altena, W. F., & Girard, T. M. 2003, AJ, 125,
2559Dubath, P., Meylan, G., & Mayor, M. 1997, A&A, 324, 505Ernst, A., Glaschke, P., Fiestas, J., Just, A., & Spurzem, R. 2007, MNRAS, 377,
465Francois, P. 1991, A&A, 247, 56Frinchaboy, P. M., Allende Prieto, C., Beers, T. C., et al. 2012, in Amer. Astron.
Soc. Meet. Abstracts, 219, 42804Frinchaboy, P. M., O’Connell, J., Meszaros, S., et al. 2013a, in Amer. Astron.
Soc. Meet. Abstracts, 221, 25034Frinchaboy, P. M., Thompson, B., Jackson, K. M., et al. 2013b, ApJ, 777, L1Gilmore, G., Randich, S., Asplund, M., et al. 2012, The Messenger, 147, 25Gnedin, O. Y., Lee, H. M., & Ostriker, J. P. 1999, ApJ, 522, 935Goldsbury, R., Richer, H. B., Anderson, J., et al. 2010, AJ, 140, 1830Goodwin, S. P. 1997, MNRAS, 286, L39Gratton, R. G., Carretta, E., & Bragaglia, A. 2012, A&ARr, 20, 50Harris, W. E. 1996, AJ, 112, 1487Ibata, R., Nipoti, C., Sollima, A., et al. 2013, MNRAS, 428, 3648Jeffries, R. D., Jackson, R. J., Cottaar, M., et al. 2014, A&A, 563, A94Kacharov, N., Bianchini, P., Koch, A., et al. 2014, A&A, 567, A69King, I. 1961, AJ, 66, 68King, I. R. 1966, AJ, 71, 64Koposov, S. E., Gilmore, G., Walker, M. G., et al. 2011, ApJ, 736, 146Kouwenhoven, M. B. N., & de Grijs, R. 2008, A&A, 480, 103Lane, R. R., Kiss, L. L., Lewis, G. F., et al. 2009, MNRAS, 400, 917Lane, R. R., Kiss, L. L., Lewis, G. F., et al. 2010a, MNRAS, 401, 2521Lane, R. R., Kiss, L. L., Lewis, G. F., et al. 2010b, MNRAS, 406, 2732
A115, page 12 of 13
C. Lardo et al.: The Gaia-ESO Survey: Kinematics of seven Galactic globular clusters
Lane, R. R., Kiss, L. L., Lewis, G. F., et al. 2011, A&A, 530, A31Lanzoni, B., Mucciarelli, A., Origlia, L., et al. 2013, ApJ, 769, 107Lee, Y.-W. 1990, ApJ, 363, 159Longaretti, P.-Y., & Lagoute, C. 1997, A&A, 319, 839Lupton, R. 1993, Statistics in theory and practice (Princeton: Princeton
University Press)Lützgendorf, N., Kissler-Patig, M., Noyola, E., et al. 2011, A&A, 533, A36Lützgendorf, N., Kissler-Patig, M., Gebhardt, K., et al. 2012, A&A, 542, A129Mackey, A. D., & van den Bergh, S. 2005, MNRAS, 360, 631Mastrobuono-Battisti, A., & Perets, H. B. 2013, ApJ, 779, 85McLaughlin, D. E., Anderson, J., Meylan, G., et al. 2006, ApJS, 166, 249McNamara, B. J., Harrison, T. E., & Anderson, J. 2003, ApJ, 595, 187Mészáros, S., Holtzman, J., García Pérez, A. E., et al. 2013, AJ, 146, 133Meylan, G., & Heggie, D. C. 1997, A&A Rev., 8, 1Milone, A. P., Piotto, G., Bedin, L. R., & Sarajedini, A. 2008, Mem. Soc. Astron.
It., 79, 623Munari, U., Sordo, R., Castelli, F., & Zwitter, T. 2005, A&A, 442, 1127Nelder, J. A., & Mead, R. 1965, Computer Journal, 7, 308Noyola, E., & Gebhardt, K. 2006, AJ, 132, 447Pancino, E., Galfo, A., Ferraro, F. R., & Bellazzini, M. 2007, ApJ, 661, L155Pancino, E., Bellazzini, M., & Marinoni, S. 2013, Mem. Soc. Astron. It., 84, 83Perryman, M. A. C., de Boer, K. S., Gilmore, G., et al. 2001, A&A, 369, 339Plummer, H. C. 1911, MNRAS, 71, 460Pryor, C., & Meylan, G. 1993, in Structure and Dynamics of Globular Clusters,
eds. S. G. Djorgovski, & G. Meylan, ASP Conf. Ser., 50, 357Randich, S., Gilmore, G., & Gaia-ESO Consortium. 2013, The Messenger, 154,
47Robin, A. C., Reylé, C., Derrière, S., & Picaud, S. 2003, A&A, 409, 523Scarpa, R., Marconi, G., Carraro, G., Falomo, R., & Villanova, S. 2011, A&A,
525, A148Shawl, S. J., & White, R. E. 1986, AJ, 91, 312Siebert, A., Williams, M. E. K., Siviero, A., et al. 2011, AJ, 141, 187
Simmerer, J., Feltzing, S., & Primas, F. 2013, A&A, 556, A58Sollima, A., Beccari, G., Ferraro, F. R., Fusi Pecci, F., & Sarajedini, A. 2007,
MNRAS, 380, 781Sollima, A., Bellazzini, M., Smart, R. L., et al. 2009, MNRAS, 396, 2183Spurzem, R., & Einsel, C. 1999, in Galaxy Dynamics – A Rutgers Symposium,
eds. D. R. Merritt, M. Valluri, & J. A. Sellwood, ASP Conf. Ser., 182, 105Steinmetz, M., Zwitter, T., Siebert, A., et al. 2006, AJ, 132, 1645Stetson, P. B. 1987, PASP, 99, 191Stetson, P. B. 1992, in Astronomical Data Analysis Software and Systems I, eds.
D. M. Worrall, C. Biemesderfer, & J. Barnes, ASP Conf. Ser., 25, 297Trager, S. C., Djorgovski, S., & King, I. R. 1993, in Structure and Dynamics of
Globular Clusters, eds. S. G. Djorgovski, & G. Meylan, ASP Conf. Ser., 50,347
Valdes, F. G. 1998, in Vol. 145, Astronomical Data Analysis Software andSystems VII, eds. R. Albrecht, R. N. Hook, & H. A. Bushouse, ASP Conf.Ser., 53
van de Ven, G., van den Bosch, R. C. E., Verolme, E. K., & de Zeeuw, P. T. 2006,A&A, 445, 513
van den Bergh, S. 2008, AJ, 135, 1731van den Bosch, R., de Zeeuw, T., Gebhardt, K., Noyola, E., & van de Ven, G.
2006, ApJ, 641, 852van der Marel, R. P., & Anderson, J. 2010, ApJ, 710, 1063van Leeuwen, F., Le Poole, R. S., Reijns, R. A., Freeman, K. C., & de Zeeuw,
P. T. 2000, A&A, 360, 472Varri, A. L., & Bertin, G. 2012, A&A, 540, A94Watkins, L. L., van de Ven, G., den Brok, M., & van den Bosch, R. C. E. 2013,
MNRAS, 436, 2598White, R. E., & Shawl, S. J. 1987, ApJ, 317, 246Zocchi, A., Bertin, G., & Varri, A. L. 2012, A&A, 539, A65Zucker, D. B., De Silva, G., Freeman, K. C., Bland-Hawthorn, J., & HERMES
Team. 2013, in Amer. Astron. Soc. Meet. Abstracts, 221, 23406Zwitter, T., Siebert, A., Munari, U., et al. 2008, AJ, 136, 421
A115, page 13 of 13